the Creative Commons Attribution 4.0 License.
the Creative Commons Attribution 4.0 License.
 | 06 Mar 2025
Critical soil moisture detection and water–energy limit shift attribution using satellite-based water and carbon fluxes over China
Jingfeng Xiao
Yue Li
Critical soil moisture (CSM), a tipping point of soil moisture (SM) at which surface fluxes shift from the energy-limited regime to the water-limited regime, is essential for the vegetation state and the corresponding land–atmosphere coupling. However, detecting CSM and attributing water–energy limit shifts to climate and ecosystem variables are challenging as in situ observations of water, carbon fluxes, and soil moisture (SM) are sparse. In this study, CSM was assessed over China using two satellite-based methods: (i) the difference between the correlation between SM and evapotranspiration (ET) and the correlation between vapor pressure deficit (VPD) and ET and (ii) the covariance between VPD and gross primary production (GPP). ET and GPP products were based on the Penman–Monteith–Leuning (PML) ET and GPP, Global LAnd Surface Satellite (GLASS) ET and GPP, Collocation-Analyzed Multi-source Ensembled Land Evapotranspiration (CAMELE) ET, Surface Energy Balance Algorithm for Land (SEBAL) ET, two-leaf light use efficiency (TL-LUE) GPP, and solar-induced chlorophyll fluorescence (SIF)-based (GOSIF) GPP. At flux sites, ET and GPP products were evaluated by eddy-covariance-based measurements; CSM values using two satellite-based methods were assessed using the soil moisture–evaporative fraction method. Their consistency at site scales demonstrated reliable results and applicability to regional scales. Through intercomparison, the spatial pattern of CSM from multi-source ET and GPP datasets was consistent and robust in eastern and southern China. Generally, CSM decreased from south to north. The Pearl River basin and Southeastern River basin displayed a relatively high CSM for clay-rich soils (e.g., 0.39 m3 m−3 using PML ET and 10 cm depth SM) and forests (e.g., 0.35 m3 m−3 using PML ET and 10 cm depth SM). Since CSM values were higher than the average SM at four soil layers, grassland and clay were water-limited. Thus, with increased water demand, western grasslands were more susceptible to water stress. These findings highlight the variability in CSM and the primary determinants of water–energy limit shifts, offering valuable insights into the potential water limitations on ecosystems under comparable SM circumstances.
- Article
(12946 KB) - Full-text XML
- BibTeX
- EndNote


Critical soil moisture (CSM) serves as an indicator of shifts in the relationship between water and energy availability (Schwingshackl et al., 2017; Denissen et al., 2020) and is essential in shaping regional climates. Plants adjust their stomatal resistance in response to changes in soil moisture (SM) and vapor pressure deficit (VPD) (Grossiord et al., 2020; F. Li et al., 2023). Above CSM, there is no alteration in water stress with SM increases (Rodriguez-Iturbe, 2000; Seneviratne et al., 2010; Akbar et al., 2018); plants are primarily controlled by VPD. Warm and dry air above the canopy (Grossiord et al., 2020; X. Li et al., 2023) leads to a decrease in both the transpiration process as the largest part of evapotranspiration (ET) (Good et al., 2015) and gross primary production (GPP) coupled with the ET process via plant leaf stomata (Gentine et al., 2019; Liu et al., 2020). A decrease in ET, in turn, results in elevated surface temperature and VPD (Gentine et al., 2019) and leads to increased atmospheric aridity on a large spatial scale, thereby intensifying SM depletion. Below CSM, surface fluxes are primarily influenced by SM availabilities in conditions of restricted water supply. During this period, a decrease in SM results in a reduction in latent heat flux (LE) and an increase in sensible heat flux (H) (Rodriguez-Iturbe, 2000); SM and leaf conductance follow a positive linear relationship (Laio et al., 2001; Porporato et al., 2002). Previous studies have examined land–atmosphere feedbacks using different metrics and both observation and simulation data (Seneviratne et al., 2006; Koster et al., 2009; Teuling et al., 2009). They found that water and energy limit shifts may be further strengthened by the interaction between the land and atmosphere, particularly with positive feedback mechanisms, known as the “dry-gets-dryer” effect (Seneviratne et al., 2010; Gentine et al., 2019). Over extended temporal periods, this phenomenon may lead to the persistence of arid and high-temperature conditions (Zhang et al., 2020). Consequently, it is necessary to quantify the CSM characteristics and the influencing environmental factors of water and energy limit shifts.
Traditionally, under the framework based on the ratio of LE to the total of LE and H (Haghighi et al., 2018; Fu et al., 2022a), sparse eddy covariance observations (Feldman et al., 2019; Fu et al., 2022b) pose challenges in adequately capturing comprehensive regional- or continental-scale CSM and its variations (Dong et al., 2023; Hsu and Dirmeyer, 2023a). In recent years, the feasibility of conducting large-scale analyses has been enhanced by the growing accessibility of multi-source remotely sensed datasets (Liu et al., 2012). Globally, some studies used the ratio of LE to net radiation (Seneviratne et al., 2010; Schwingshackl et al., 2017), surface temperature diurnal amplitude (Feldman et al., 2019; Fu et al., 2024), and LE (Hsu and Dirmeyer, 2023b; Duan et al., 2023). In addition, the advancement of global remote sensing technology has facilitated the generation of reliable GPP products (Yuan et al., 2014; Li and Xiao, 2019; Zhang et al., 2019; Bi et al., 2022; He et al., 2022; F. Li et al., 2023) and ET products (Yao et al., 2013; Yao et al., 2014; Zhang et al., 2019; Cheng et al., 2021; He et al., 2022; C. Li et al., 2022; F. Li et al., 2023) for CSM detection. Denissen et al. (2020) proposed a new tipping-point metric, the difference between the correlation between SM and ET and the correlation between VPD and ET, to directly determine CSM at continental scales. Fu et al. (2022b) first demonstrated that the covariance between GPP and VPD indirectly quantifies CSM. The point at which the covariance between GPP and VPD transitions from positive to negative during a period of soil drying is denoted as CSM. However, a source of considerable uncertainty when considering only a single data source and estimation approach exists at a large spatial scale. There are significant differences among satellite-based ET and GPP datasets, and CSM varies with different methods, leading to uncertainty as to whether the CSM of carbon flux is the same as that of water flux.
Chinese land surfaces frequently experience water and energy limit shifts (Xiao, 2014; Zhu et al., 2023). Diagnosing large-scale CSM helps to understand water- and energy-limited regimes determined by distinct flora and soil types (Homaee et al., 2002; Hsu and Dirmeyer, 2023b). The association between water, energy, and flux helps to define water and energy limit shifts. As such, this study uses two innovative metrics and eight satellite-based products to diagnose CSM and water and energy limit shifts across China. The goal of this study is to (1) assess the consistency of different methods in calculating CSM at flux sites; (2) examine CSM variations across land cover types, soil textures, and water resource subregions; and (3) investigate dominant factors from hydrological, meteorological, and ecological variables that influence water and energy limit shifts.
2.1 Data
Eddy covariance flux datasets were compared with eight satellite-based ET and GPP datasets in Sect. 3.1. Then, CSM derived from the relationship between SM and evaporative fraction (EF) was used to evaluate the performance of CSM derived from the covariance and correlation difference methods in Sect. 3.2. Layer-wise SM and satellite-based ET and GPP were used for the large-scale detection of CSM. Land cover types, soil textures, and water resource subregions were used to examine CSM variations in Sect. 3.3. SM, ET, GPP, and meteorological data were used to investigate dominant factors influencing water and energy limit shifts in Sect. 3.4. All energy, vegetation, and water variables were resampled or combined to 0.1°-8 d resolution. The period, limited by the temporal availability of data sources, covered 2001–2018.
2.1.1 Evapotranspiration and gross primary production
Figure 1 illustrates the locations of 21 flux sites, and Table 1 shows the detailed information on flux sites. Eddy-covariance-derived measurements were applied to evaluate the performance of satellite-based ET and GPP. Given the fact that Huazhaizi, Dashalong, Luodi, Arou, Guantao, Huailai, Miyun, and Daxing did not have GPP data, the REddyProc website (https://www.bgc-jena.mpg.de/5622399/REddyProc/, last access: 16 July 2023) was used to calculate GPP. REddyProc imported half-hourly net ecosystem exchange, LE, H, and meteorological measurements to partition net ecosystem exchange into GPP and ecosystem respiration.

Figure 1(a) Flux site locations, land cover types (2020), and water resource subregions of China. Distributions of (b) clay, (c) silt, and (d) sand content (1995). ZGE: Zhungaer basin, PR: Pearl River basin, YTR: Yangtze River basin, SWR: Southwestern River basin, TR: Tarim basin, SR: Songhua River basin, CT: Changthang region, NM: Inner Mongolian Plateau region, LR: Liaohe River basin, YR: Yellow River basin, HR: Huaihe River basin, HC: Hexi Corridor region, HAR: Haihe River basin, SER: Southeastern River basin, QB: Qaidam basin.
Table 1Flux site information used in this study.
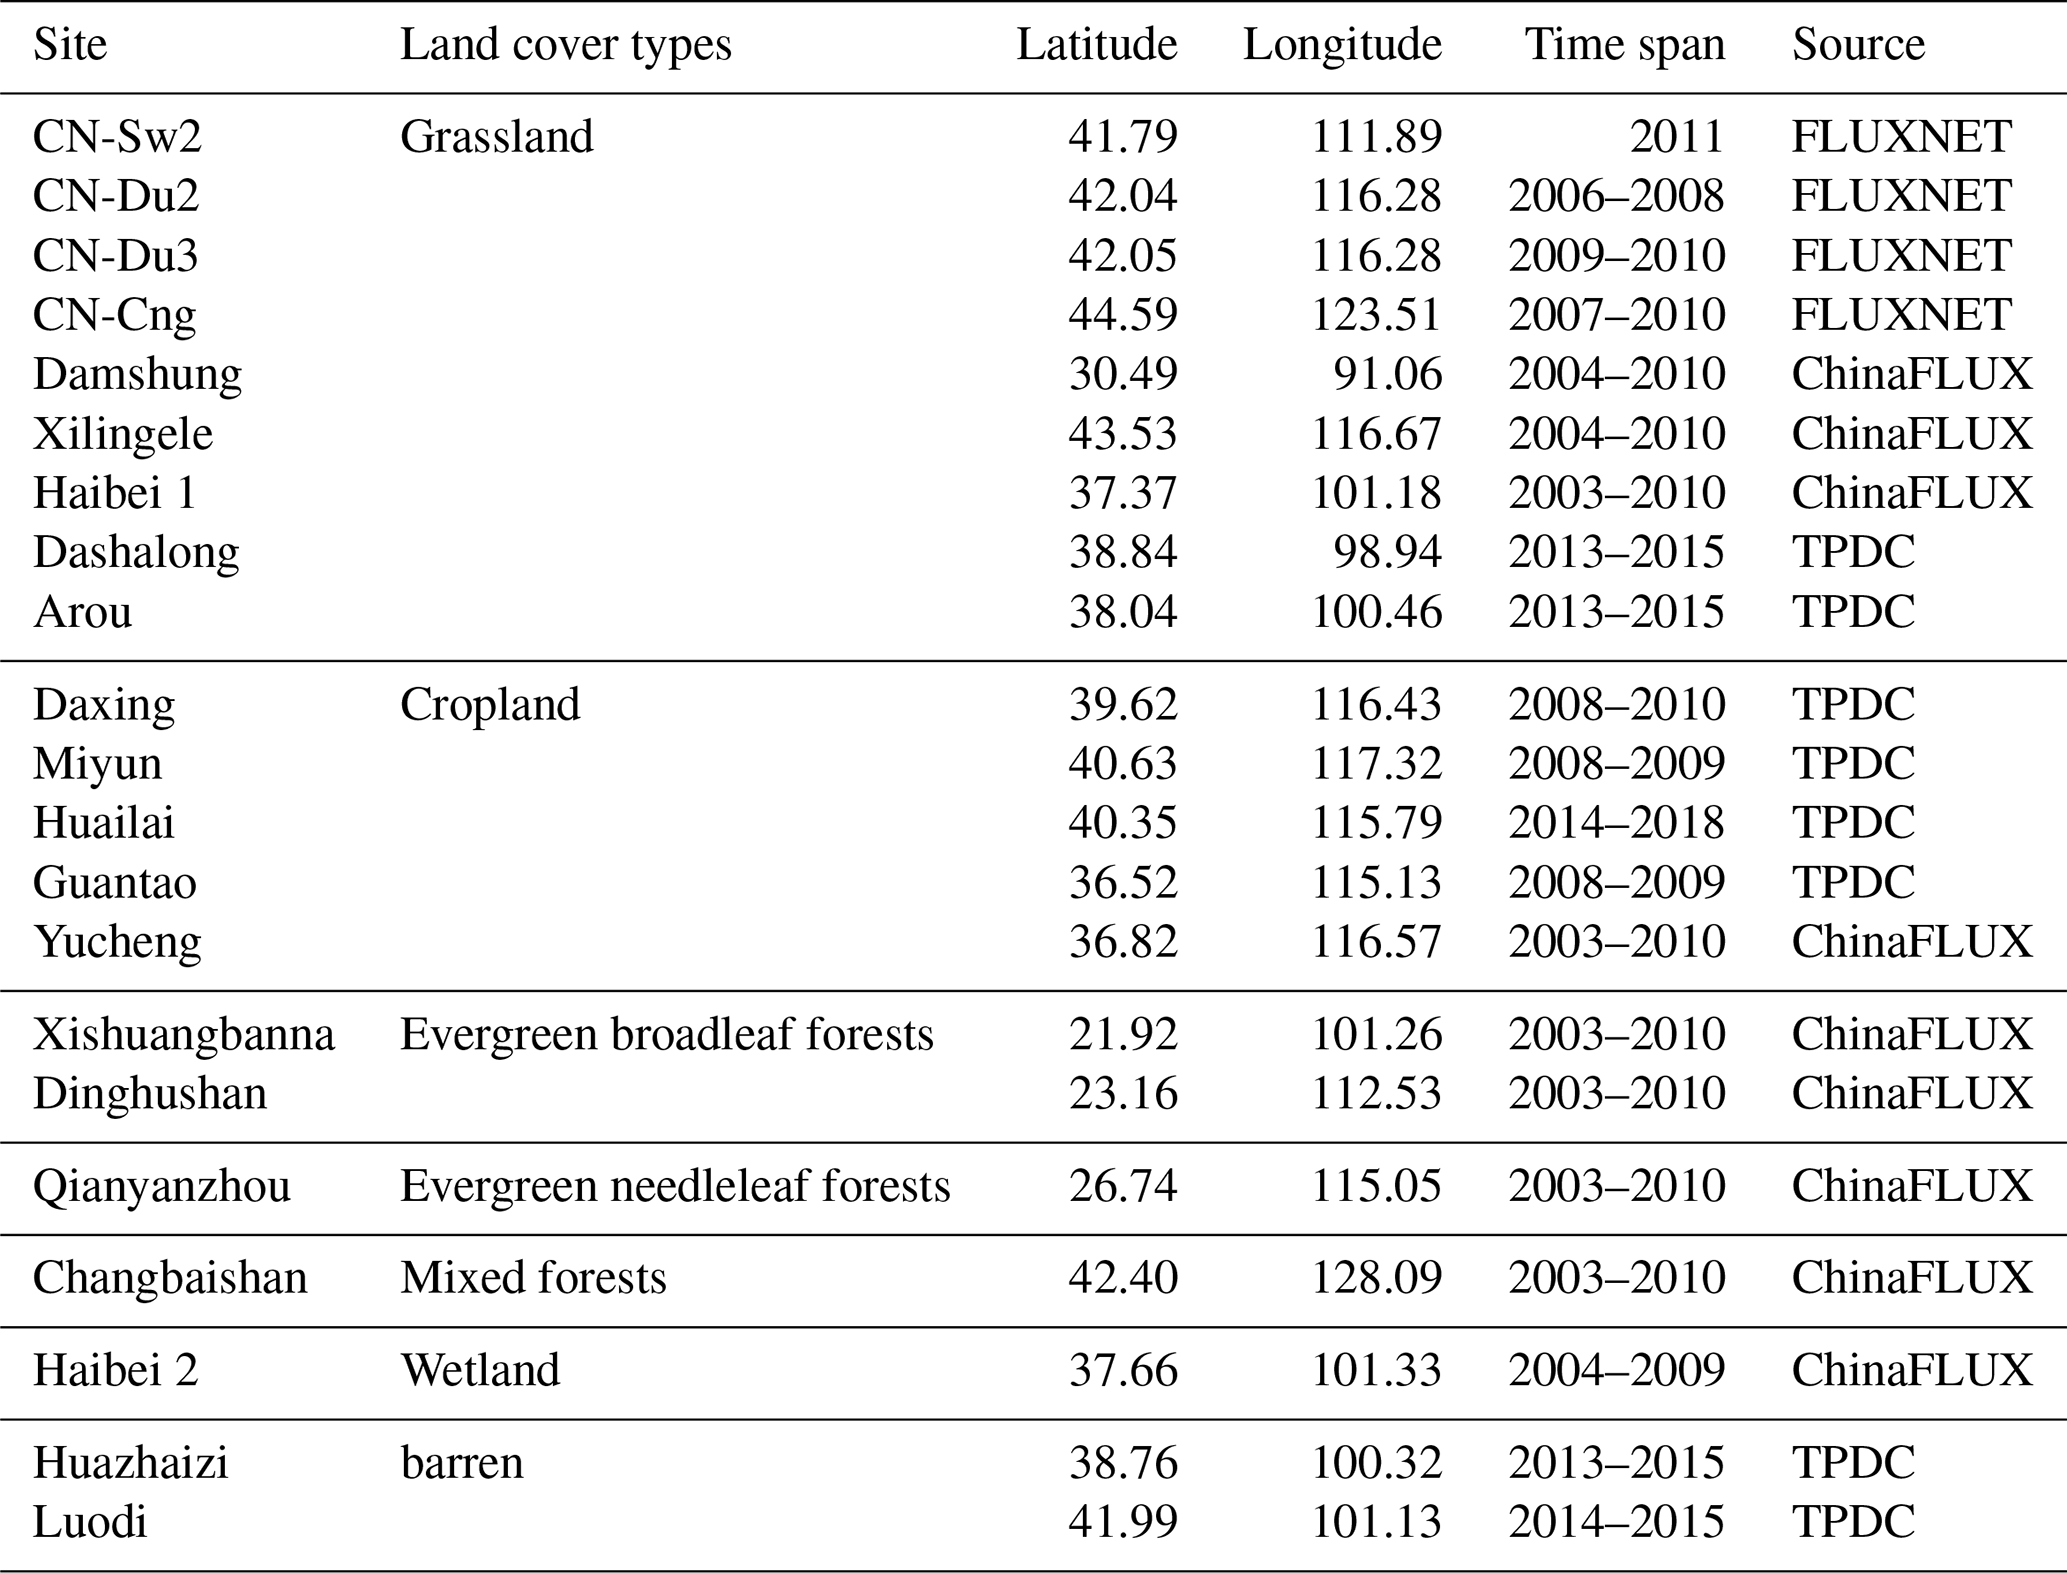
TPDC: National Tibetan Plateau Data Center.
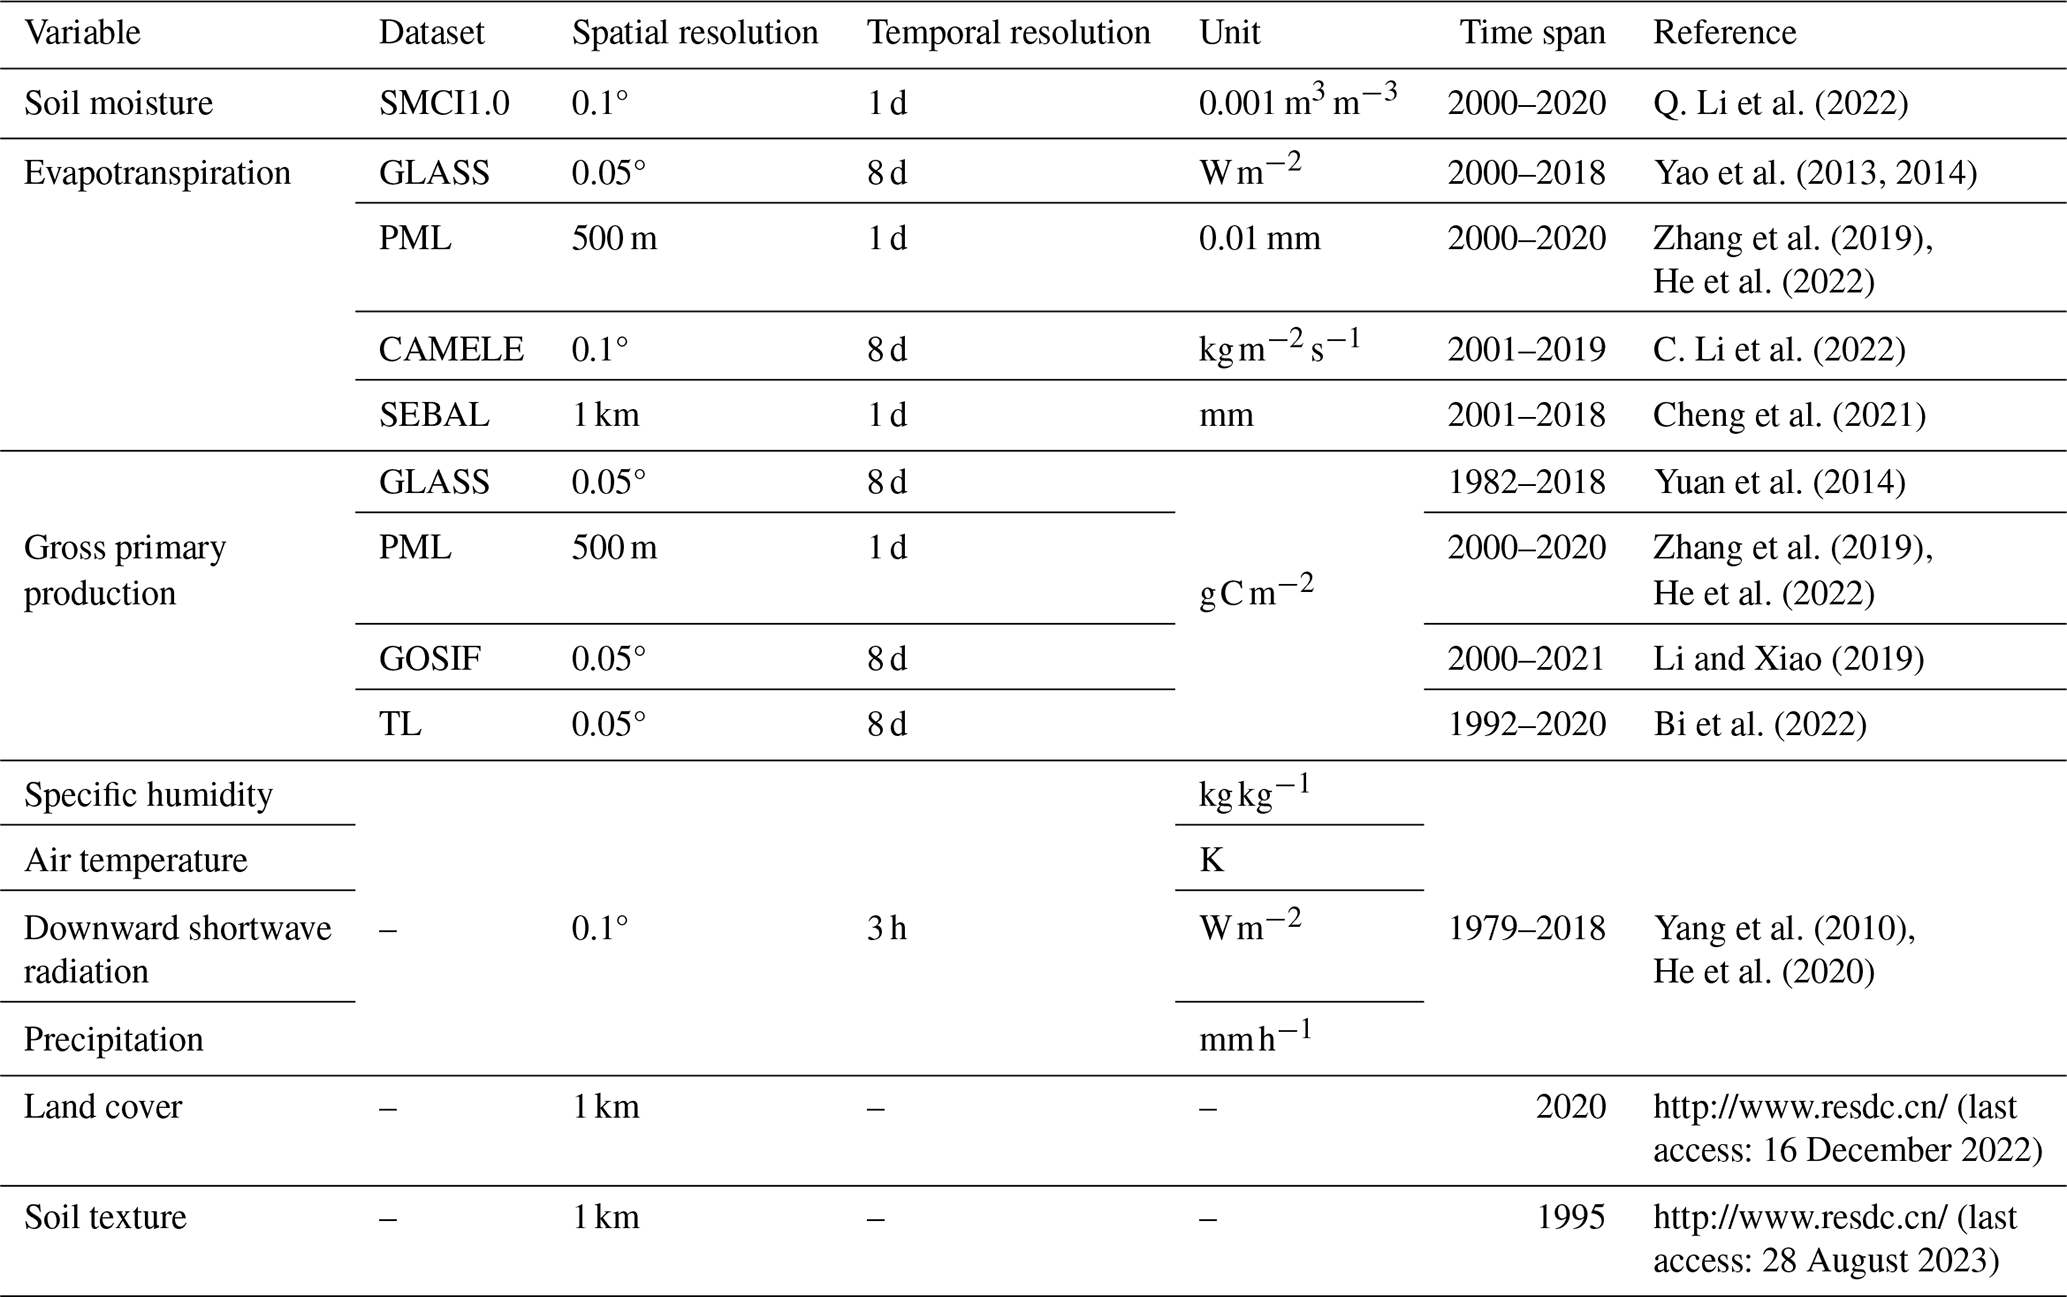
Table 2 contains a list of all spatial datasets used in this study. Eight satellite-based ET and GPP products are included. The Penman–Monteith–Leuning (PML) product integrates the stomatal conductance theory to relate ET and GPP processes (Zhang et al., 2019; He et al., 2022) and applies daily meteorological data, land surface temperature from ERA5, enhanced Whittaker-filtered MODIS leaf area index (LAI), albedo, and emissivity. The interdependency and mutual restrictions between GPP and ET considerably improve the simulation accuracy. The Global LAnd Surface Satellite (GLASS) ET integrates the MOD16, a revised remote-sensing-based Penman–Monteith product; the Priestley–Taylor Jet Propulsion Laboratory, a modified satellite-based Priestley–Taylor product; and the Semi-Empirical Algorithm of the University of Maryland using the Bayesian model averaging approach (Yao et al., 2013, 2014). The GLASS GPP algorithm incorporates the effects of atmospheric carbon dioxide content, radiation components, and VPD based on the eddy covariance–light use efficiency model introduced by Yuan et al. (2007). It is founded on two underlying assumptions: the fraction of absorbed photosynthetically active radiation has a linear relationship with the normalized difference vegetation index, and constant light use efficiency is governed by either air temperature or soil moisture, depending on which component imposes the greatest limitation.
In addition, Collocation-Analyzed Multi-source Ensembled Land Evapotranspiration (CAMELE) provides long-term (1981–2020) ET, employing ERA5, FLUXCOM, PML, GLDAS, and GLEAM (C. Li et al., 2022), at 0.1° 8 d and 0.25° daily resolutions. Surface Energy Balance Algorithm for Land (SEBAL) ET focuses on 1 km daily resolution during 2001–2018. This product integrates GMAO's meteorological data and NASA's MOD43A1 daily surface albedo, the MOD11A1 daily surface temperature, and the MOD13 vegetation index (Cheng et al., 2021). Two-leaf light use efficiency (TL-LUE) GPP offers comprehensive worldwide GPP, shaded GPP, and sunlit GPP covering the period from 1992 to 2020. This model applies recent data inputs such as the GLOBMAP LAI, CRUJRA meteorological data, and ESA-CCI land cover information (Bi et al., 2022). Global Orbiting Carbon Observatory-2 SIF (GOSIF) GPP spans from 2000 to 2020. A total of eight SIF–GPP relationships, including both universal and biome-specific formulations, are used to estimate GPP from SIF on a per-pixel basis and are examined with and without intercept terms to account for the uncertainty in converting SIF into GPP estimates (Li and Xiao, 2019).
2.1.2 Layer-wise soil moisture and meteorological data
Given the recent availability of state-of-the-art gridded SM in China as released by Q. Li et al. (2022), CSM can now be investigated in the context of the SM state. Gridded SM reaches 100 cm soil depth with 10 cm intervals at 1 km daily resolution during 2000–2020. It is trained by predictors of ERA5-Land time series, leaf area index (LAI), land cover type, topography, and in situ observed soil attributes at 1789 stations throughout China using the robust random forest machine learning technique. Based on the findings of Q. Li et al. (2022), the product demonstrates notable benefits over both ERA5-Land and SMAP-L4 datasets, especially in terms of a superior quality level compared to the SoMo.ml dataset at soil depths of 10, 20, 80, and 100 cm. Thus, this study utilized the SM of these layers.
Yang et al. (2010) and He et al. (2020) put forth a comprehensive dataset for Chinese regional surface meteorological forcing. This dataset encompasses air temperature, air pressure, specific humidity, wind speed, downward shortwave radiation, downward longwave radiation, and precipitation. It is presented in NetCDF format with a spatiotemporal resolution of 0.1° and 3 h during 1979–2018. The primary input includes Princeton University's global land surface model data, GLDAS, GEWEX-SRB radiation, TRMM precipitation, and China Meteorological Administration observations. Data quality control techniques include the elimination of physically implausible values and statistical interpolation using ANU-Spline. This dataset demonstrates precision levels that lie between those of site-based observation and satellite-based estimation and, therefore, exceed the accuracy of current international reanalysis datasets. In this study, VPD was computed based on specific humidity and air temperature; VPD, air temperature, precipitation, and downward shortwave radiation were employed in water–energy limit shift attribution.
2.1.3 Land cover types, soil textures, and water resource subregions
Land cover types, soil textures, and water resource subregions influence CSM. Land cover types (2020) are created by human visual interpretation relying on Landsat satellite remote sensing images. The categorization scheme includes cropland, forests, grassland, water, ice, urban, and barren. Soil textures, expressed as sand, silt, and clay content within each grid cell, are compiled from the 1:1 000 000 soil type map and the Second National Soil Survey. Water resource subregions are divided according to the China Geological Survey, including the Zhungaer basin, Pearl River basin, Yangtze River basin, Southwestern River basin, Tarim basin, Songhua River basin, Changthang region, Inner Mongolian Plateau region, Liaohe River basin, Yellow River basin, Huaihe River basin, Hexi Corridor region, Haihe River basin, Southeastern River basin, and Qaidam basin. Water resource subregions are based on the principles of groundwater systems and water cycles and are focused on the inherent features of groundwater resources within distinct natural units.
2.2 Determination of CSM
CSM derived by the SM and EF method was used to assess the CSM using ET and GPP at the flux site. There must be both positive and negative metrics from the covariance and correlation difference methods. For each grid cell and the entire period per year, negative metrics are displayed when SM is less than CSM, and positive metrics are shown when SM is greater than CSM. The data are taken into account only when the temperature surpasses 10 °C (Denissen et al., 2020) to avoid the influence of ice and snow, and the covariance between VPD and GPP must exhibit a minimum of seven covariance values within 9 d moving windows, with a minimum of 15 data points (Fu et al., 2022b). Hence, we concentrated on the warm season, June–September, which includes 16 data points each year, with eight covariance values within 9 d moving windows. CSM was considered in each grid cell using satellite-based ET and GPP over the period 2001–2018.
2.2.1 Soil moisture–evaporative fraction method
Investigating the relationship between SM and EF in the dry period can isolate the transition from energy limitation to water limitation (Feldman et al., 2019). CSM captures the interconnectedness between SM and EF. If SM is greater than or less than CSM, the relationship between SM and EF appears as a flat line or a positive slope line. A linear-plus-plateau model characterizes the relationship precisely (Seneviratne et al., 2010; Schwingshackl et al., 2017):
where EF is the evaporative fraction, defined as LE (LE+H); EFmax represents the maximum EF in the energy-limited stage; and S is the gradient in the water-limited stage. Here, specific estimated CSM was simultaneously estimated by the Monte Carlo method. For a set of optimal parameters, a Nash–Sutcliffe efficiency (Nash and Sutcliffe, 1970) above 0.5 was considered to be satisfactory (Herman et al., 2018). Thus, only eight sites, including Xilingele in 2004, Damshung in 2004, CN-Sw2 in 2011, CN-Du2 in 2007, CN-Cng in 2010, Miyun in 2009, Huailai in 2015, and Qianyanzhou in 2010, were chosen for CSM detection. In addition, the Bayesian information criterion (BIC) (Schwarz, 1978) was used to select the best fit among three segmented regression candidates (the flat line, the positive slope line, and the linear-plus-plateau). If the flat-line regression or the positive-slope regression outperformed the linear-plus-plateau regression, CSM was considered to be unidentified.
2.2.2 Covariance method
The covariance method presents a novel method for assessing ecosystem water stress in direct correlation with GPP, as illustrated by Fu et al. (2022b). It serves to quantify CSM over large areas. Positive covariances between VPD and GPP indicate that energy limits GPP. Negative covariances indicate that water limitation has a larger impact on GPP. VPD is determined by the disparity between the saturation vapor pressure (es) and the actual vapor pressure (ea). Bolton (1980) posits that the calculation of ea involves specific humidity (SH) and surface pressure (Pr):
2.2.3 Correlation difference method
Another novel correlation difference metric, proposed by Denissen et al. (2020), evaluates water-limited conditions versus energy-limited conditions using the detrended anomaly of VPD, ET, and SM:
MATLAB's corr tool calculates this metric, which uses Kendall's rank correlation (corr) rather than assuming linear correlations between variables (van Doorn et al., 2018). If Δcorr > 0 then the grid cell is under an energy-limited regime, and vegetation anomalies (i.e., ET) correlate more strongly with energy anomalies (i.e., VPD) than with water anomalies (i.e., SM). In contrast, if Δcorr < 0 then the grid cell is under a water-limited regime. When Δcorr ≈ 0, SM is labeled as CSM, indicating that water- and energy-limited regimes are transitioning.
2.3 Evaluation criteria
The correlation coefficient was applied to evaluate the performance of satellite-based ET from CAMELE, GLASS, PML, and SEBAL and GPP from GOSIF, GLASS, PML, and TL compared to the eddy-covariance-observed in situ ET and GPP. A point-to-pixel evaluation was carried out to evaluate the overestimation or underestimation of ET and GPP for each land cover type from all 21 flux sites. We summed 8 d ET and GPP in grassland, evergreen broadleaf forests, evergreen needleleaf forests, mixed forests, cropland, wetland, and barren land.
The alignment of CSM obtained by different methods was determined using the chi-square test (McHugh, 2013; Hsu and Dirmeyer, 2023a). CROSSTAB in MATLAB was used to perform the chi-square test. SM values were divided into two groups, below and above CSM. In this case, categorical data were tagged as a binary variable of 0 for drier than CSM and 1 for wetter than CSM. If there were significant differences with a 95 % confidence level, CSM was different.
2.4 Partial least square regression
Partial least square regression has been widely acknowledged as a viable approach for mitigating collinearity issues among independent variables (Karthikeyan et al., 2020) and has been used extensively in quantifying interannual impacts of climate and plant growth variations on water and energy dynamics. Here, performances of the partial least square regression model were assessed by 5-fold cross-validation using the mean absolute percentage error. The dominant factor (precipitation, temperature, incoming shortwave radiation, VPD, ET, GPP, or SM) of Δcorr was identified by the largest variable importance in projection scores.
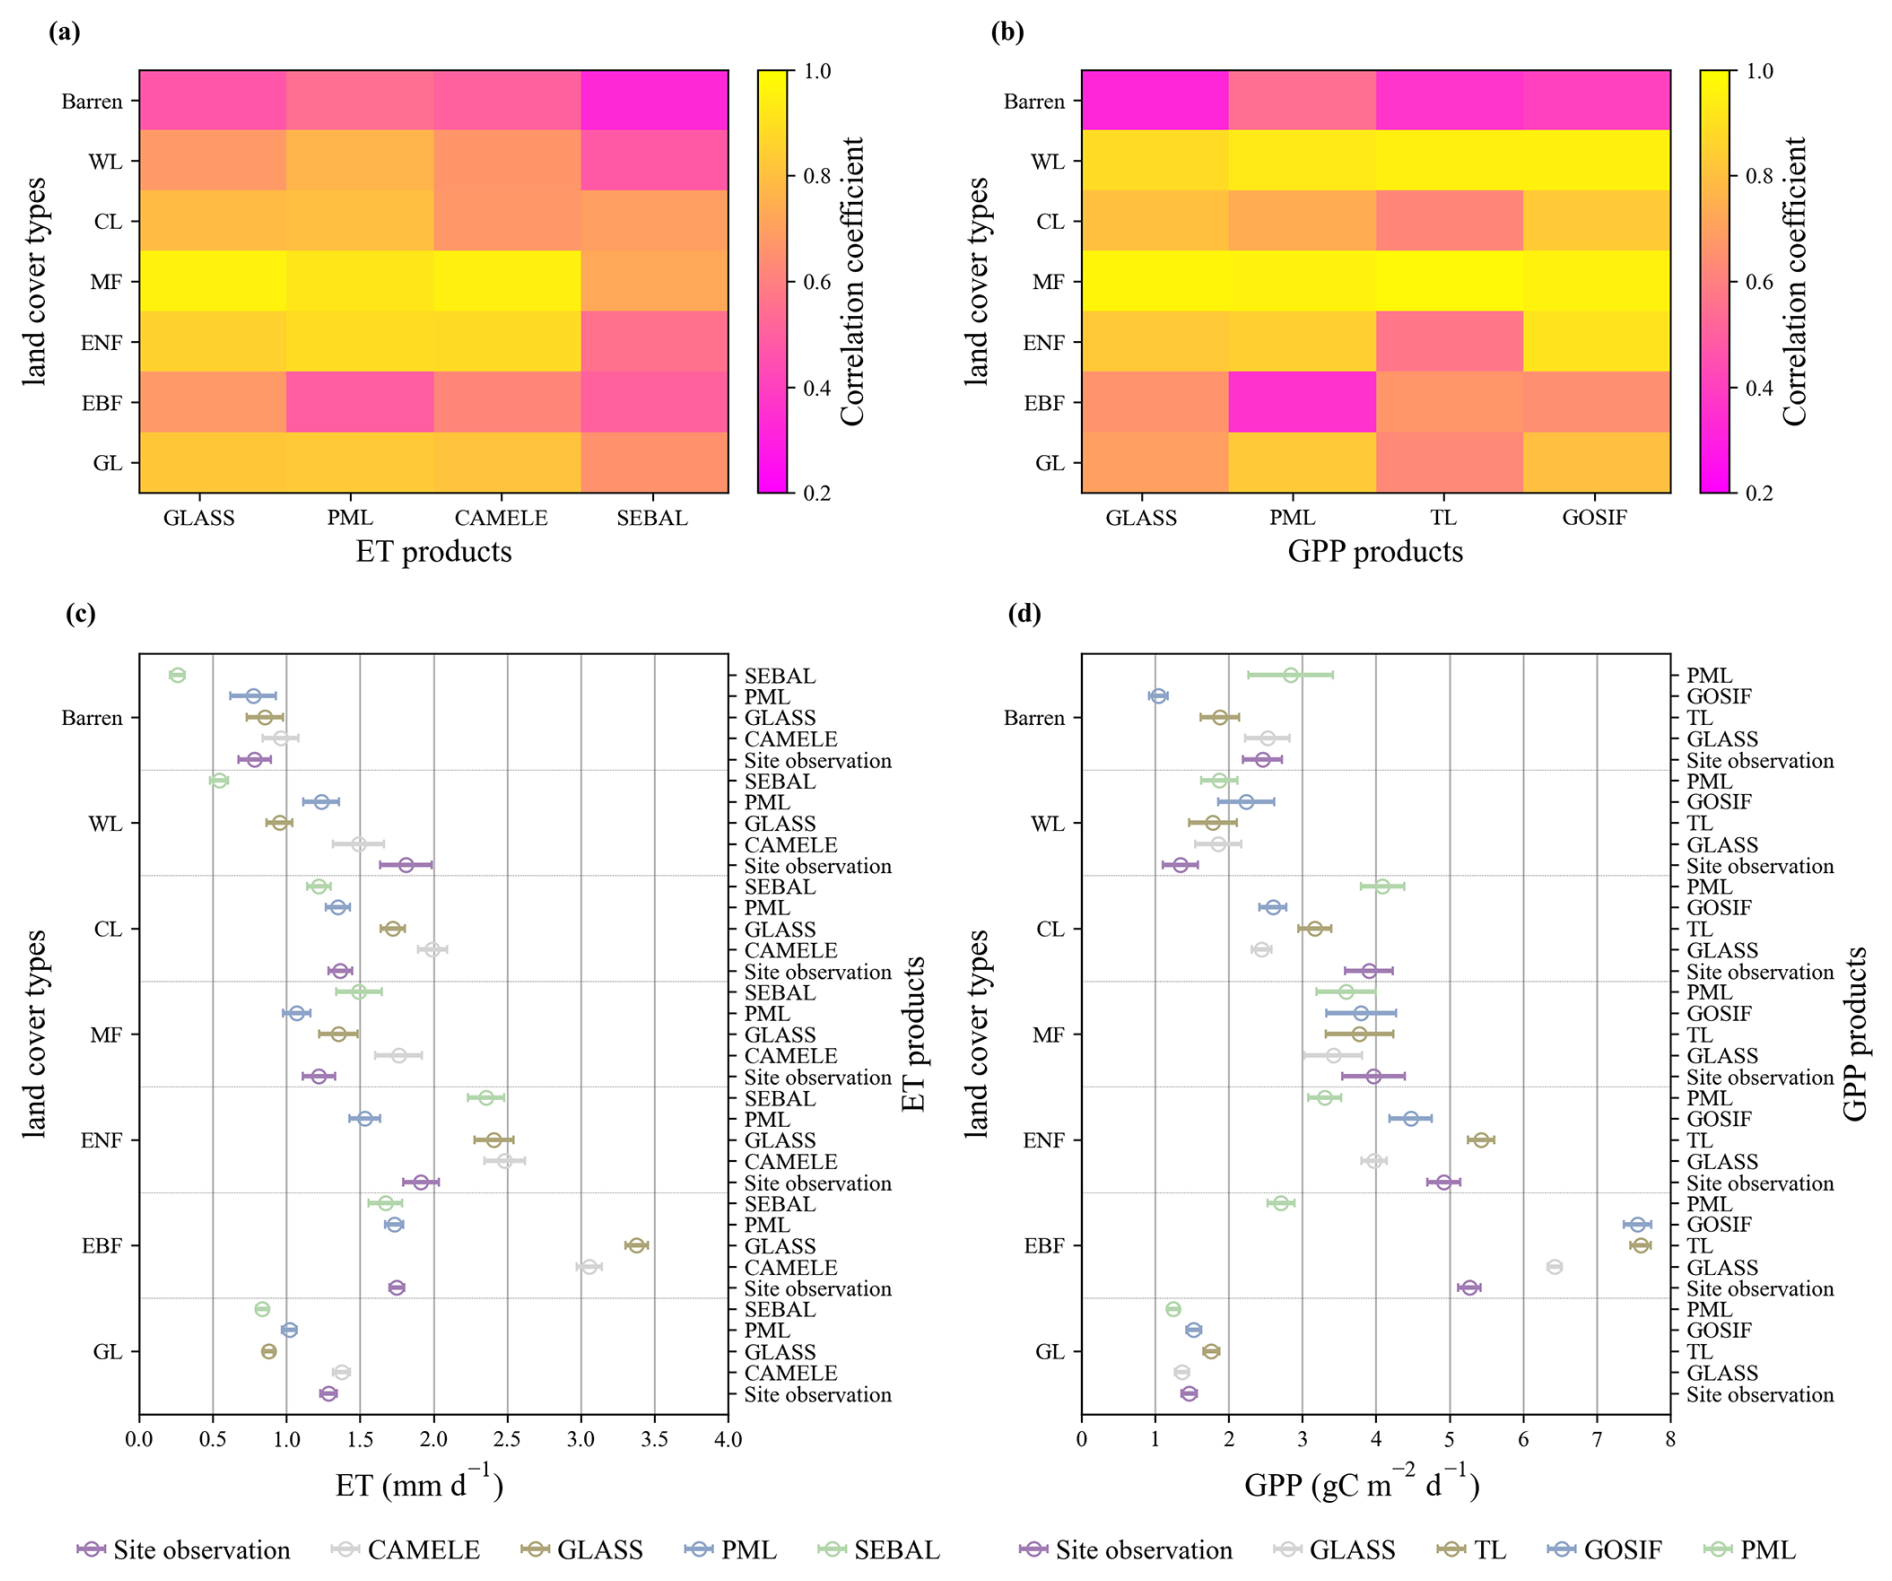
Figure 2Correlation coefficients between daily eddy covariance observations and satellite-based (a) ET and (b) GPP products and average (c) ET and (d) GPP across land cover types. The bars show 95 % confidence intervals. GL: grassland, EBF: evergreen broadleaf forests, ENF: evergreen needleleaf forests, MF: mixed forests, CL: cropland, WL: wetland.
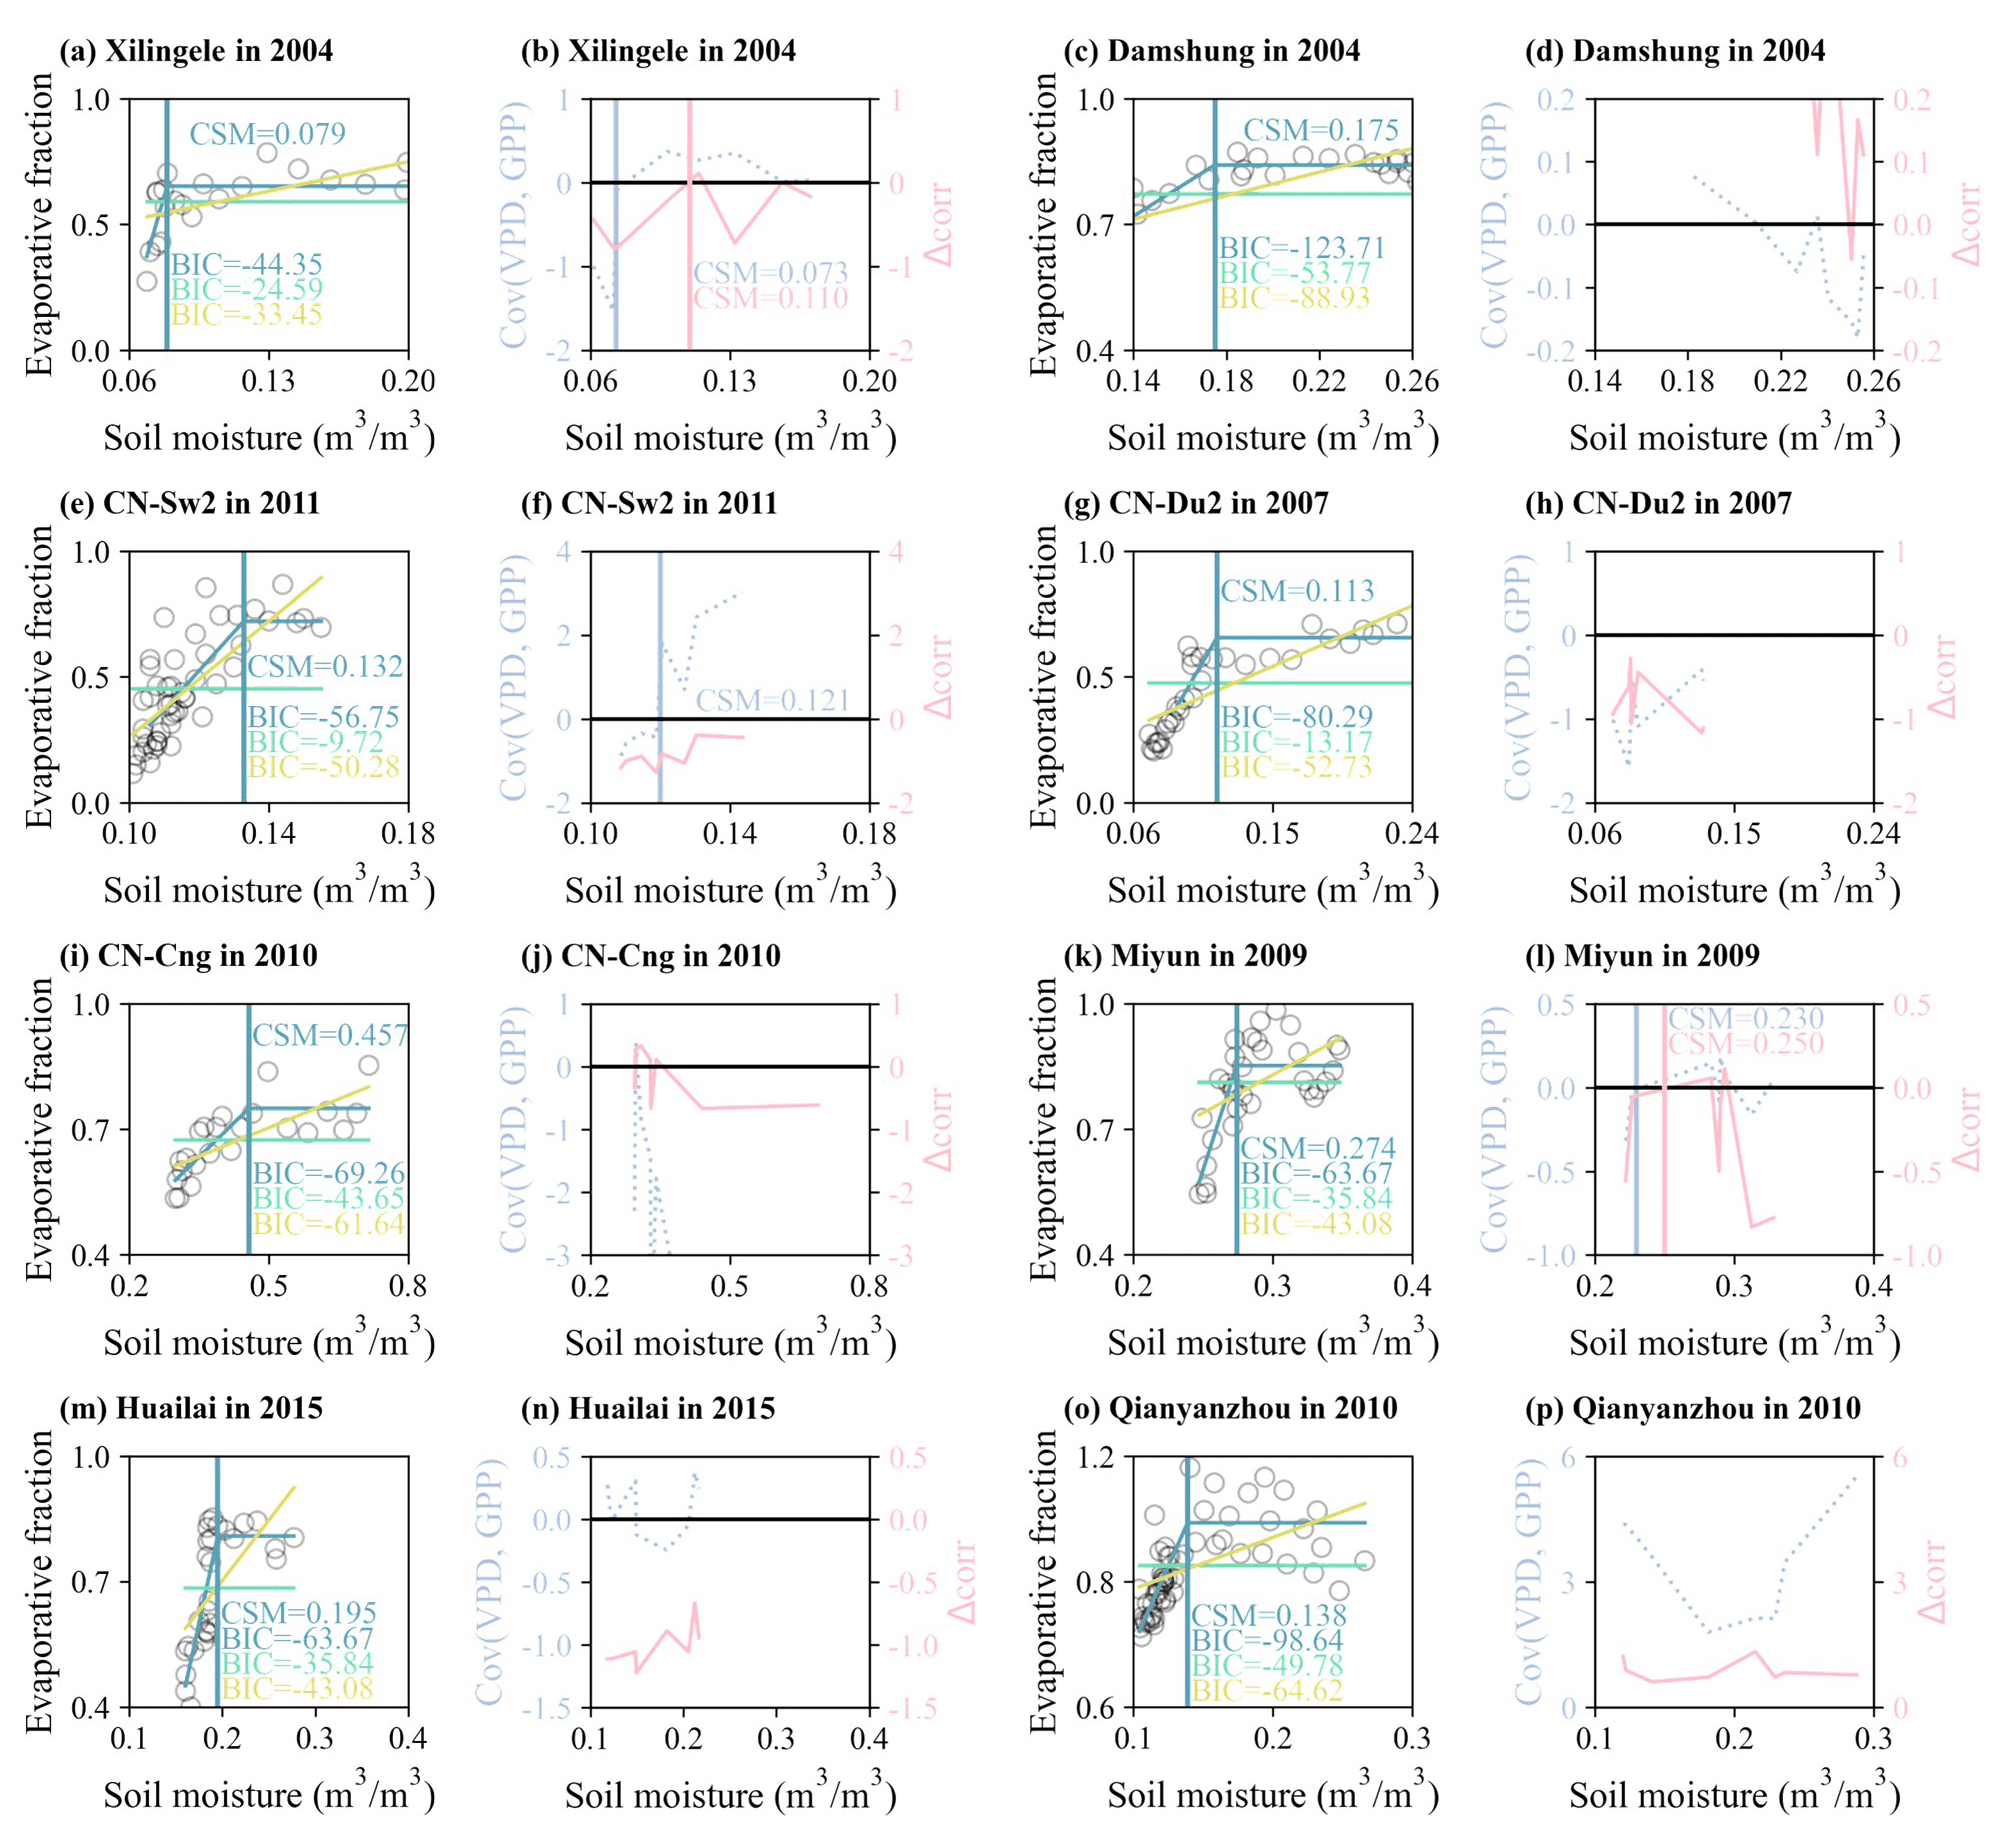
Figure 3Variations in soil moisture and evaporative fraction at (a) Xilingele in 2004, (c) Damshung in 2004, (e) CN-Sw2 in 2011, (g) CN-Du2 in 2007, (i) CN-Cng in 2010, (k) Miyun in 2009, (m) Huailai in 2015, (o) Qianyanzhou in 2010. Variations in covariance (referred to as Cov) between vapor pressure deficit (VPD) and gross primary production (GPP) and correlation difference metric (referred to as Δcorr) at (b) Xilingele in 2004, (d) Damshung in 2004, (f) CN-Sw2 in 2011, (h) CN-Du2 in 2007, (j) CN-Cng in 2010, (l) Miyun in 2009, (n) Huailai in 2015, (p) Qianyanzhou in 2010.
3.1 Consistency of ET and GPP
Figure 2a and b show good agreement between daily satellite-based products and site observations in most land cover types. Across all sites, correlation coefficients obtained from CAMELE, GLASS, PML, and SEBAL ET were 0.74, 0.65, 0.78, and 0.59, respectively; correlation coefficients obtained from GLASS, TL, GOSIF, and PML GPP were 0.75, 0.71, 0.77, and 0.74, respectively. For ET, the highest correlation coefficient occurred between GLASS and eddy covariance observations in mixed forests (0.96), while the lowest value was between SEBAL and site observations in barren land (0.47). For GPP, the highest correlation coefficient was found between TL and site measurements in mixed forests (0.97), while the lowest value was between GLASS and site-based data in barren land (0.32). In general, no single product consistently outperformed others over all land cover types. As shown in Fig. 2c and d, ET had the highest value in evergreen needleleaf forests and was the lowest in barren land, while GPP peaked in evergreen broadleaf forests and was the lowest in wetland. In these land cover types, ET and GPP derived from satellite-based products were also substantially different and varied quite a bit between different products. Especially in evergreen broadleaf forests, ET derived from GLASS (3.37 mm) and CAMELE (3.05 mm) and GPP derived from GOSIF (7.55 ) and TL (7.59 ) were higher than site observations of 1.74 mm and 5.26 , respectively. If satellite-based ET and GPP were around ± 10 % of site-observed values, they were termed as satisfactory; otherwise, they were either overestimated or underestimated. CAMELE, GLASS, PML, and SEBAL ET and GLASS, TL, GOSIF, and PML GPP met satisfactory values in one, one, three, and one and two, one, three, and two land cover types, respectively. PML ET provided the most satisfactory estimates in evergreen broadleaf forests, cropland, and barren land, with an average bias of 1.05 %, 1.13 %, and 1.34 %, respectively; GOSIF GPP provided the most satisfactory estimates in grassland, evergreen needleleaf forests, and mixed forests, with an average bias of 4.31 %, 9.14 %, and 4.29 %, respectively. Although discrepancies existed among multi-source remotely sensed products across flux sites, they offered an opportunity to quantify characteristics of large-scale CSM and to examine uncertainties from single-source data.
3.2 Consistency of CSM
Variations in SM and EF were depicted in Fig. 3 for eight sites. Fitted lines represented controlling mechanisms in various evaporative regimes. Overall, the linear-plus-plateau regression with the lowest BIC outperformed the flat line and the positive-slope line in the study period. Specifically, the CN-Du2 and Qianyanzhou sites showed a great slope at low SM values, with BIC values of −80.29 and −98.64, respectively. We also found that grassland CSM in different regions varied greatly. For example, grassland at Xilingele had the lowest CSM of 0.079 m3 m−3, with SM ranging from 0.06 to 0.20 m3 m−3; CSM at Damshung in southwestern China was 0.175 m3 m−3, with SM ranging from 0.14 to 0.26 m3 m−3; CSM at CN-Cng in northeastern China was 0.457 m3 m−3, with high SM ranging from 0.30 to 0.70 m3 m−3. Ranges of SM determined CSM value. Moreover, vertical lines of different colors represented CSM derived from Δcorr using the correlation difference method and covariance between VPD and GPP. To explore the performance of both methods at different sites and whether they can be used on a large scale, the data applied to both methods were averaged for 8 d, consistently with gridded data. For the CN-Du2 and Qianyanzhou sites, only positive or negative VPD–GPP covariance and Δcorr were found. For the Damshung, CN-Cng, and Huailai sites, we found more than one SM value where VPD–GPP covariance or Δcorr was zero. Along with surface soil wetting, there was a change in VPD–GPP covariance and Δcorr from positive to negative at these sites, inconsistently with the transition from water to energy limitation, indicating that CSM was not identifiable. Differently from the above, VPD–GPP covariance had the optimal CSM value that agreed best with the EF–SM-derived CSM at the Xilingele and CN-Sw2 sites. Through another technique, Δcorr was better than VPD–GPP covariance at the Miyun site. At these sites, VPD–GPP covariance and Δcorr changed from negative (water limit) to positive (energy limit). Therefore, VPD–GPP covariance and Δcorr had the potential to obtain large-scale CSM.
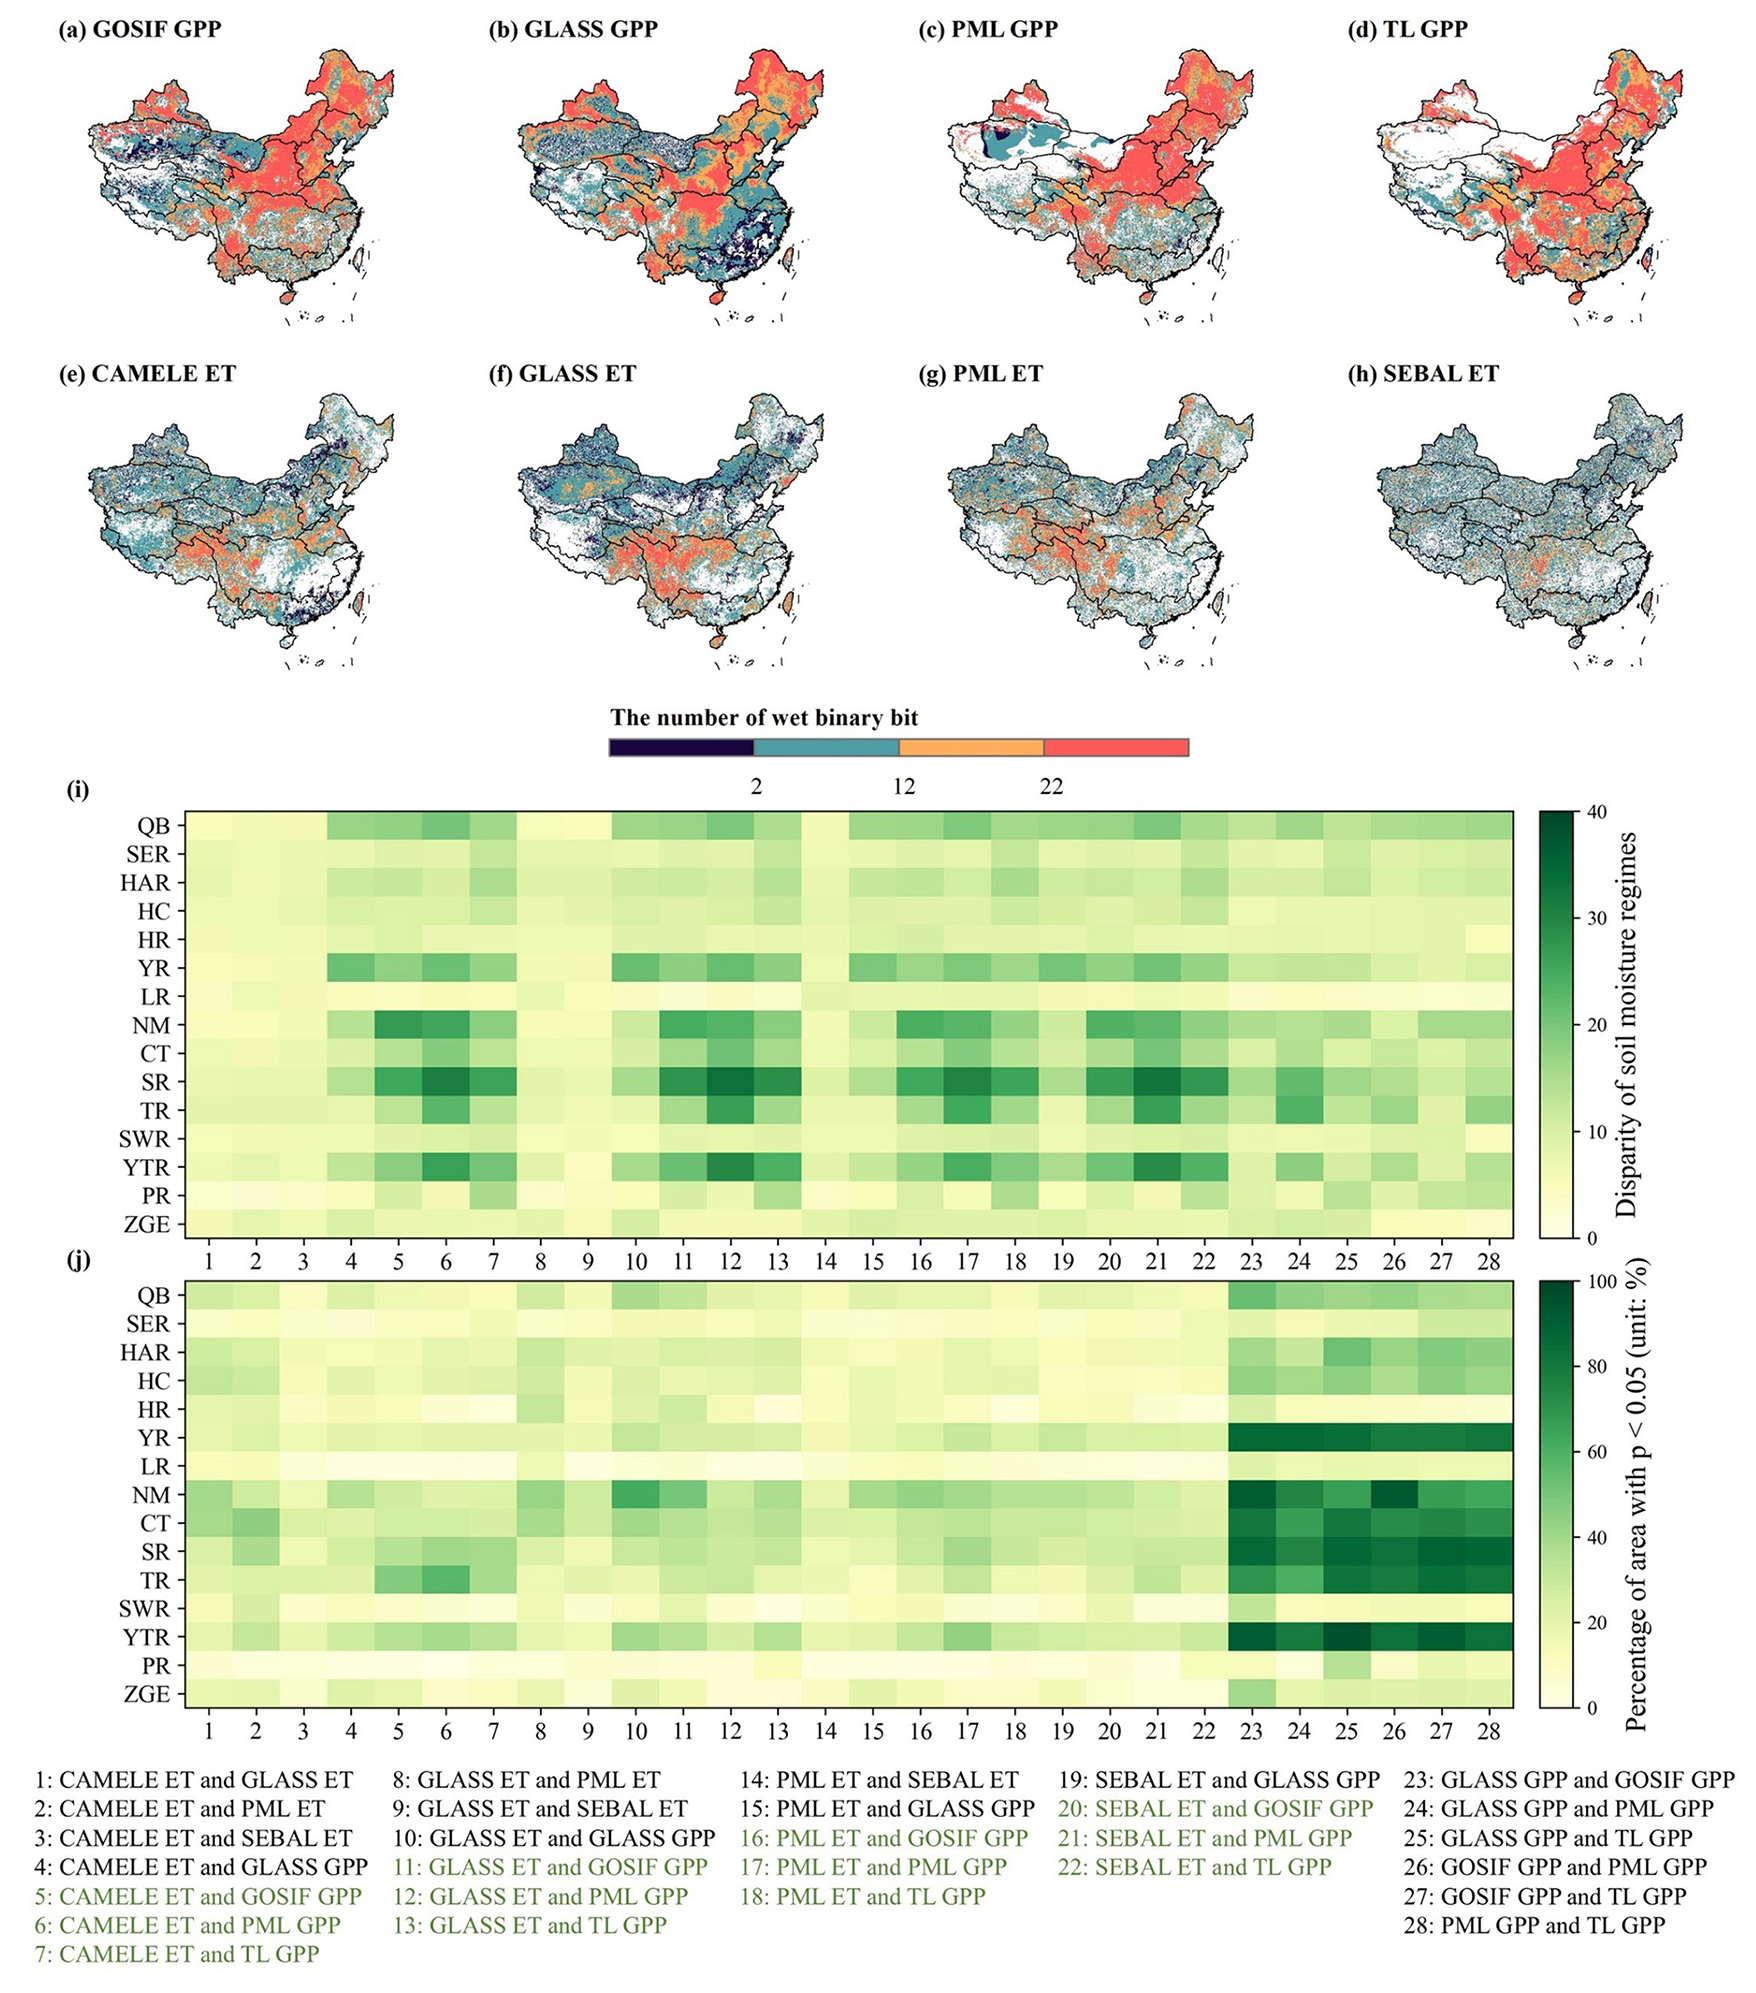
Figure 4Spatial pattern of wet binary bit number at 10 cm depth using covariance between vapor pressure deficit (VPD) and gross primary production (GPP) from (a) GOSIF, (b) GLASS, (c) PML, and (d) TL. Spatial pattern of wet binary bit number at 10 cm depth using correlation difference metric with Kendall's rank correlation between the detrended anomaly of soil moisture (SM) and evapotranspiration (ET) from (e) CAMELE, (f) GLASS, (g) PML, and (h) SEBAL and the correlation between the detrended anomaly of VPD and those ET products. (i) Disparity of soil moisture regimes among all methods and (j) percentage of area with p < 0.05. ZGE: Zhungaer basin, PR: Pearl River basin, YTR: Yangtze River basin, SWR: Southwestern River basin, TR: Tarim basin, SR: Songhua River basin, CT: Changthang region, NM: Inner Mongolian Plateau region, LR: Liaohe River basin, YR: Yellow River basin, HR: Huaihe River basin, HC: Hexi Corridor region, HAR: Haihe River basin, SER: Southeastern River basin, QB: Qaidam basin.
3.3 Spatial pattern of CSM
The number of wet binary bits was used to quantify the agreement among eight ET- and GPP-based models at 10 cm soil depth. If CSM was identified, SM wetter than CSM was represented as 1, and 0 was used for others. If CSM was not identified within a year, digits of the mode were treated as 0. If CSM was not detected for all 18 years, it was displayed as empty. The intercomparison provided helpful insights to examine consistency and discrepancies between multi-source ET and GPP products in depicting the spatial distribution of CSM. Figure 4 shows strong disparities in northern and central China, especially in the Inner Mongolian Plateau region, Songhua River basin, Yangtze River basin, and Yellow River basin. In these regions, the chi-square test showed significant differences among GPP-based models due to their large number of wet binary bits. In addition, TL GPP displayed no CSM value in northwestern China. Note that the SM wetter than CSM showed agreement in eastern and southern basins, such as the Huaihe River basin, Liaohe River basin, Southeastern River basin, and Pearl River basin, indicating that ET- and GPP-based models were consistent in these basins.
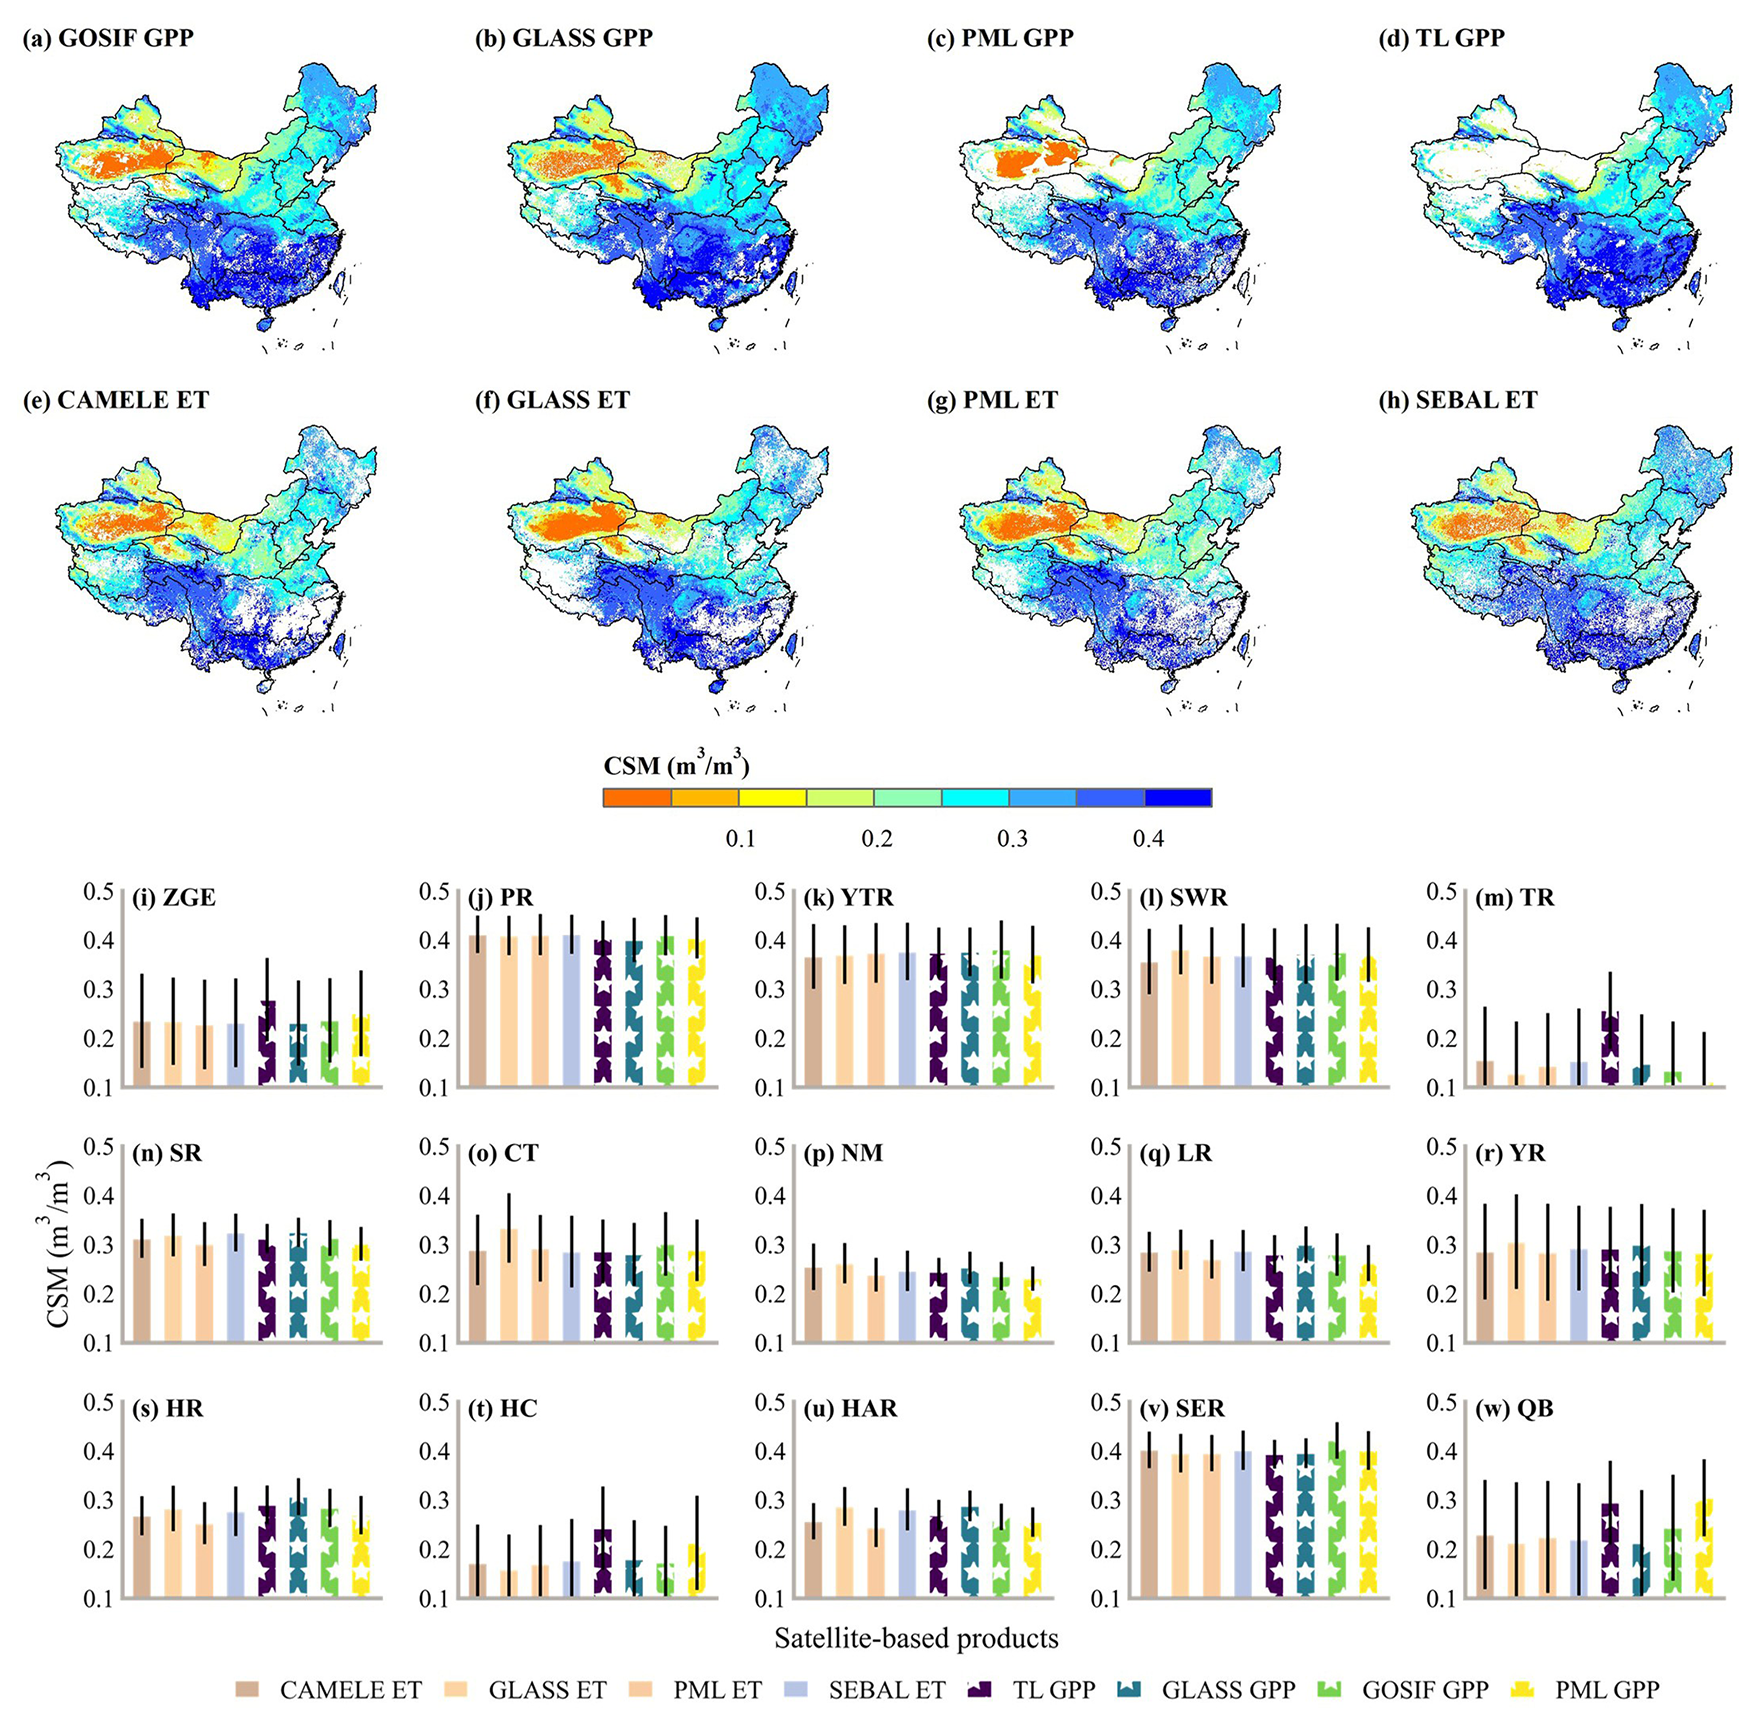
Figure 5Spatial pattern of critical soil moisture (CSM) at 10 cm depth using covariance between vapor pressure deficit (VPD) and gross primary production (GPP) from (a) GOSIF, (b) GLASS, (c) PML, and (d) TL and CSM using correlation difference metric with Kendall's rank correlation between the detrended anomaly soil moisture (SM) and evapotranspiration (ET) from (e) CAMELE, (f) GLASS, (g) PML, and (h) SEBAL and the correlation between the detrended anomaly VPD and those ET products. (i–w) The basin-average values. ZGE: Zhungaer basin, PR: Pearl River basin, YTR: Yangtze River Basin, SWR: Southwestern River Basin, TR: Tarim Basin, SR: Songhua River basin, CT: Changthang region, NM: Inner Mongolian Plateau region, LR: Liaohe River basin, YR: Yellow River basin, HR: Huaihe River basin, HC: Hexi Corridor region, HAR: Haihe River basin, SER: Southeastern River basin, QB: Qaidam basin.
Table 3Site-based CSM from EF–SM and grid-based CSM using satellite-based ET and GPP and 10 cm depth SM.
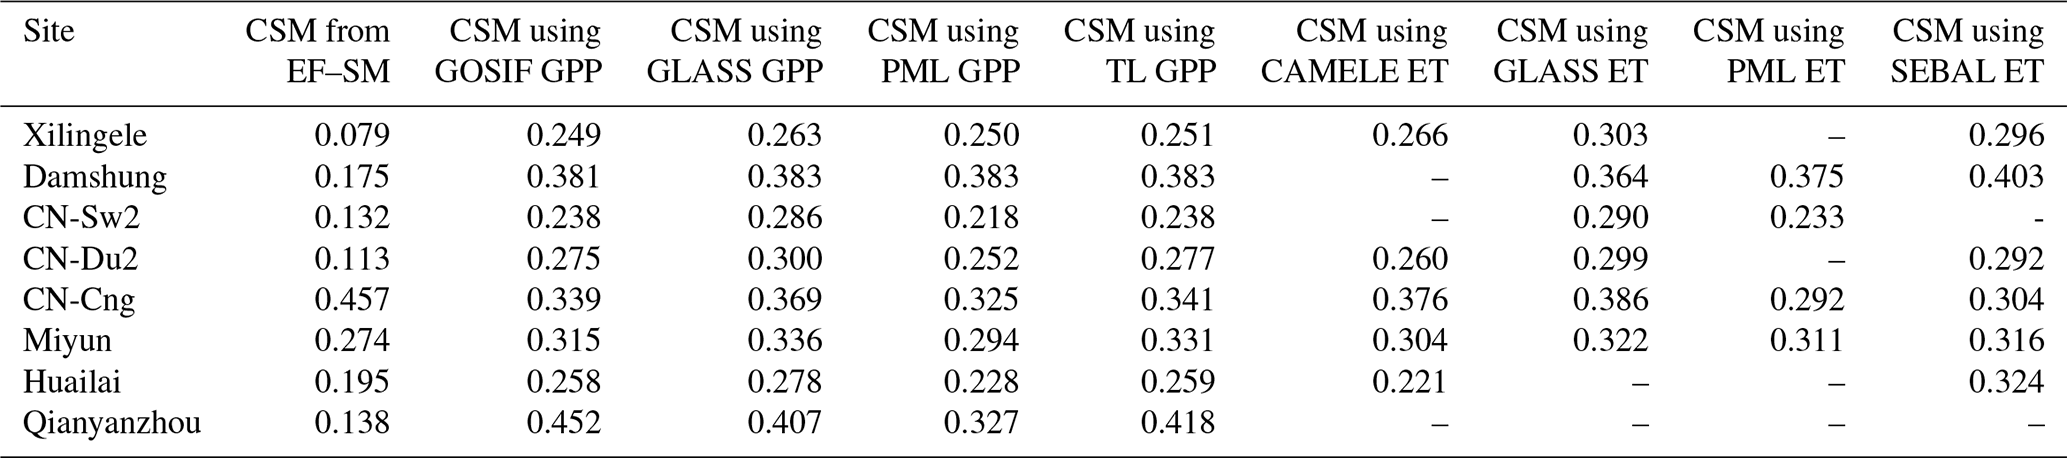
Figure 5 shows the spatial distribution of CSM obtained from the covariance between VPD and GOSIF, GLASS, PML, and TL GPP; the correlation difference metric with Kendall's rank correlation between the detrended anomaly of CAMELE, GLASS, PML, and SEBAL ET; and 10 cm soil depth SM and the correlation between the detrended anomaly of ET and VPD. Geographically, these spanned large swaths of land through water-scarce desert regions and lush, rainy forests. Overall, spatial patterns of CSM obtained through four ET products were consistent with those from four GPP products, showing a decreasing variation from south to north. Specifically for water resource subregions, CSM in the semi-humid Huaihe River basin, Haihe River basin, and Yellow River basin was about 0.3 m3 m−3 and increased to approximately 0.4 m3 m−3 in the Southeastern River basin and Pearl River basin. In addition, Table 3 shows the comparison of site-based CSM from EF–SM-based and grid-based CSM. It was found that gridded CSM values at the CN-Cng, Miyun, and Huailai sites were generally consistent with site-based values. Gridded data had spatial continuity, while site observations showed significant differences in CSM, even between adjacent sites (e.g., CN-Du2 value of 0.113 m3 m−3 and Miyun value of 0.274 m3 m−3), resulting in inconsistent CSM between satellite- and site-based values.

Figure 6Soil moisture (SM) at 10, 20, 80, and 100 cm soil depths and critical soil moisture (CSM) derived from CAMELE, GLASS, PML, and SEBAL ET at corresponding soil depths for (a) cropland; (b) forests; (c) grassland; (d) water; (e) ice; (f) urban; and (g) barren soils with a majority of (h) clay, (i) silt, and sand and with contents (j) less than 60, (k) between 60 % and 70 %, (l) between 70 % and 80 %, (m) between 80 % and 90 %, and (n) higher than 90 %.
Furthermore, large-scale CSM depended on roots pulling water out of the unsaturated soil matrix (Feldman et al., 2019) and varied across vegetation types and soil textures at four soil layers (Fig. 6). With shorter root systems and less vegetation, barren areas showed low CSM. Forest regions displayed a relatively high CSM (e.g., 0.18 m3 m−3 using PML ET and 10 cm depth SM). As for soil textures, sand covering the large area was further divided into contents of less than 60 %, 60 %–70 %, 70 %–80 %, 80 %–90 %, and higher than 90 %. Soil with a majority of clay had a wetter CSM than others (e.g., 0.38 m3 m−3 using PML ET and 10 cm depth SM); this was to be expected given the fact that clay had a larger negative matric potential compared to coarse soil textures dominated by sand and silt. In summary, fine soils and luxuriant vegetation had wetter CSM. Additionally, a layer-wise CSM analysis was conducted to highlight variations in SM properties for different soil layers. It was evident that there were variations in the CSM behavior across layers with higher SM and CSM at 20 cm soil depth. We also found that CSM for grassland and clay was higher than average SM at all four layers, which led to the identification of a large range of SM within water-limited regimes. However, for cropland and forests, differences existed in CSM among four ET-based methods, with higher CSM from GLASS and SEBAL than from others.
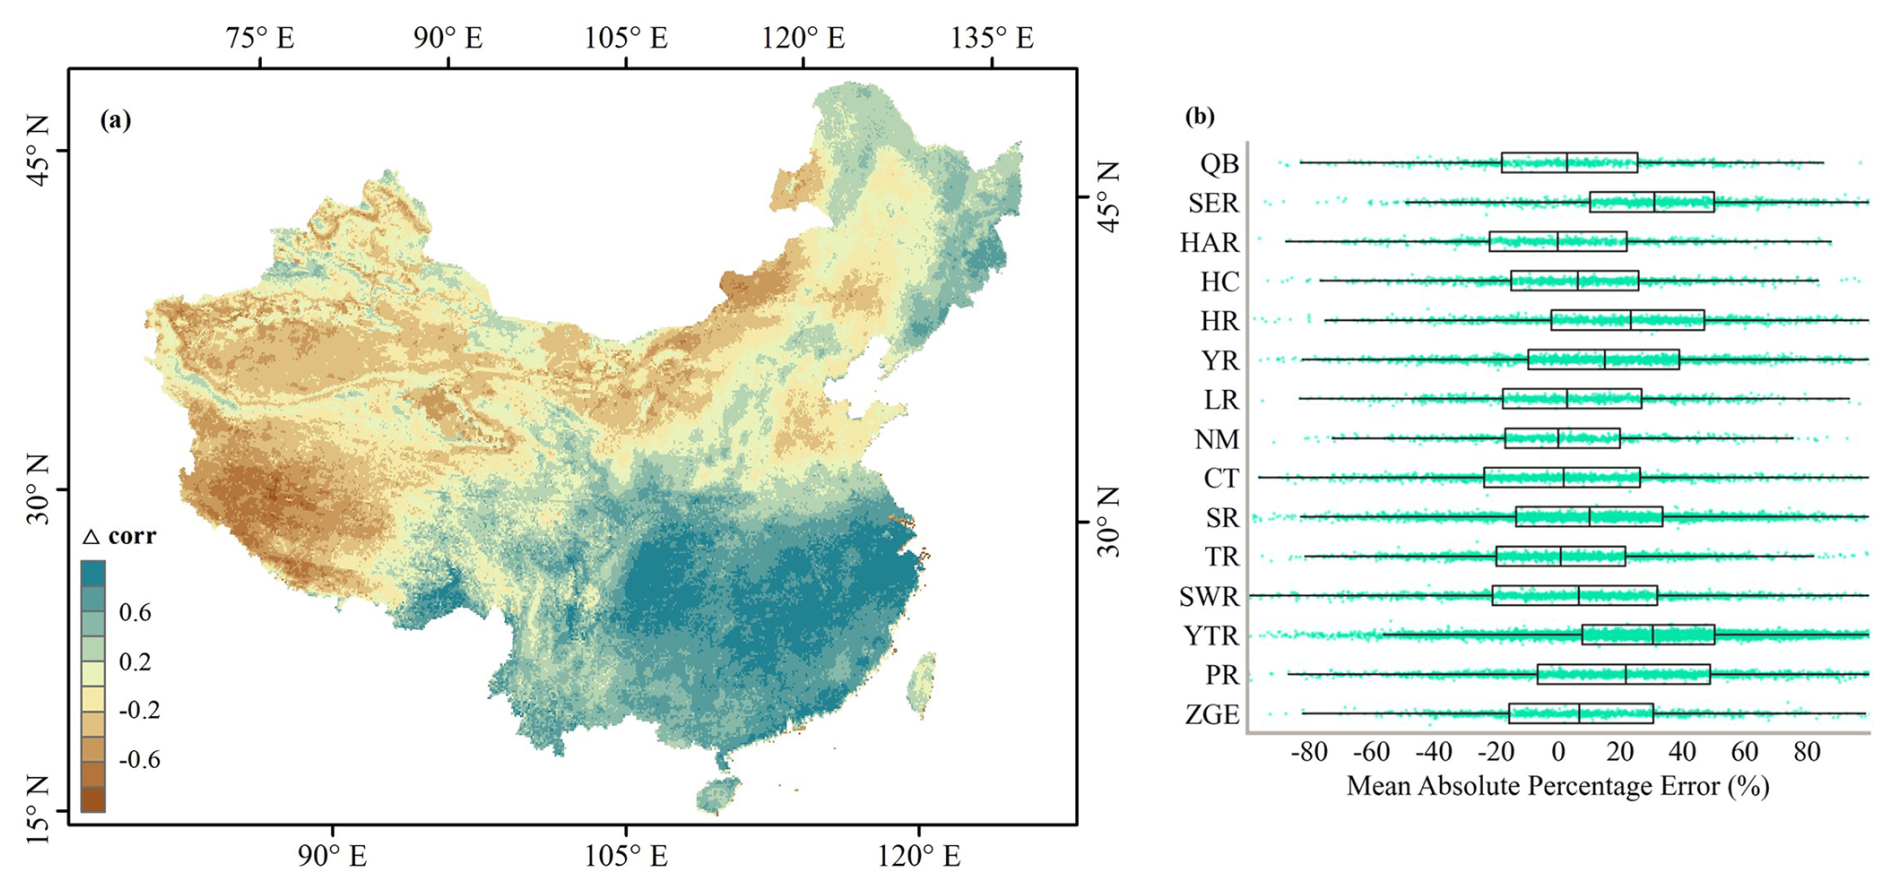
Figure 7Spatial pattern of (a) Δcorr derived from PML ET and 10 cm soil depth soil moisture and (b) the mean absolute percentage error based on partial least square regression for Δcorr estimations. ZGE: Zhungaer basin, PR: Pearl River basin, YTR: Yangtze River basin, SWR: Southwestern River basin, TR: Tarim basin, SR: Songhua River basin, CT: Changthang region, NM: Inner Mongolian Plateau region, LR: Liaohe River basin, YR: Yellow River basin, HR: Huaihe River basin, HC: Hexi Corridor region, HAR: Haihe River basin, SER: Southeastern River basin, QB: Qaidam basin.
3.4 Attribution of water and energy limit shifts
We assessed the spatial pattern of multi-annual average Δcorr at 10 cm soil depth over the period 2001–2018. PML ET was used for Δcorr given the fact that it had the best performance (Sect. 3.1). As shown in Fig. 7a, water-limited regimes were most common in dry and semi-arid areas. Western and northern regions were generally water-limited, while southern regions were energy-limited. The cross-validation using partial least square regression shows that the variance in Δcorr was explained by precipitation, temperature, incoming shortwave radiation, VPD, ET, GPP, and SM, ranging from 73.34 % in the Yangtze River basin to 99.95 % in the Haihe River basin (Fig. 7b).
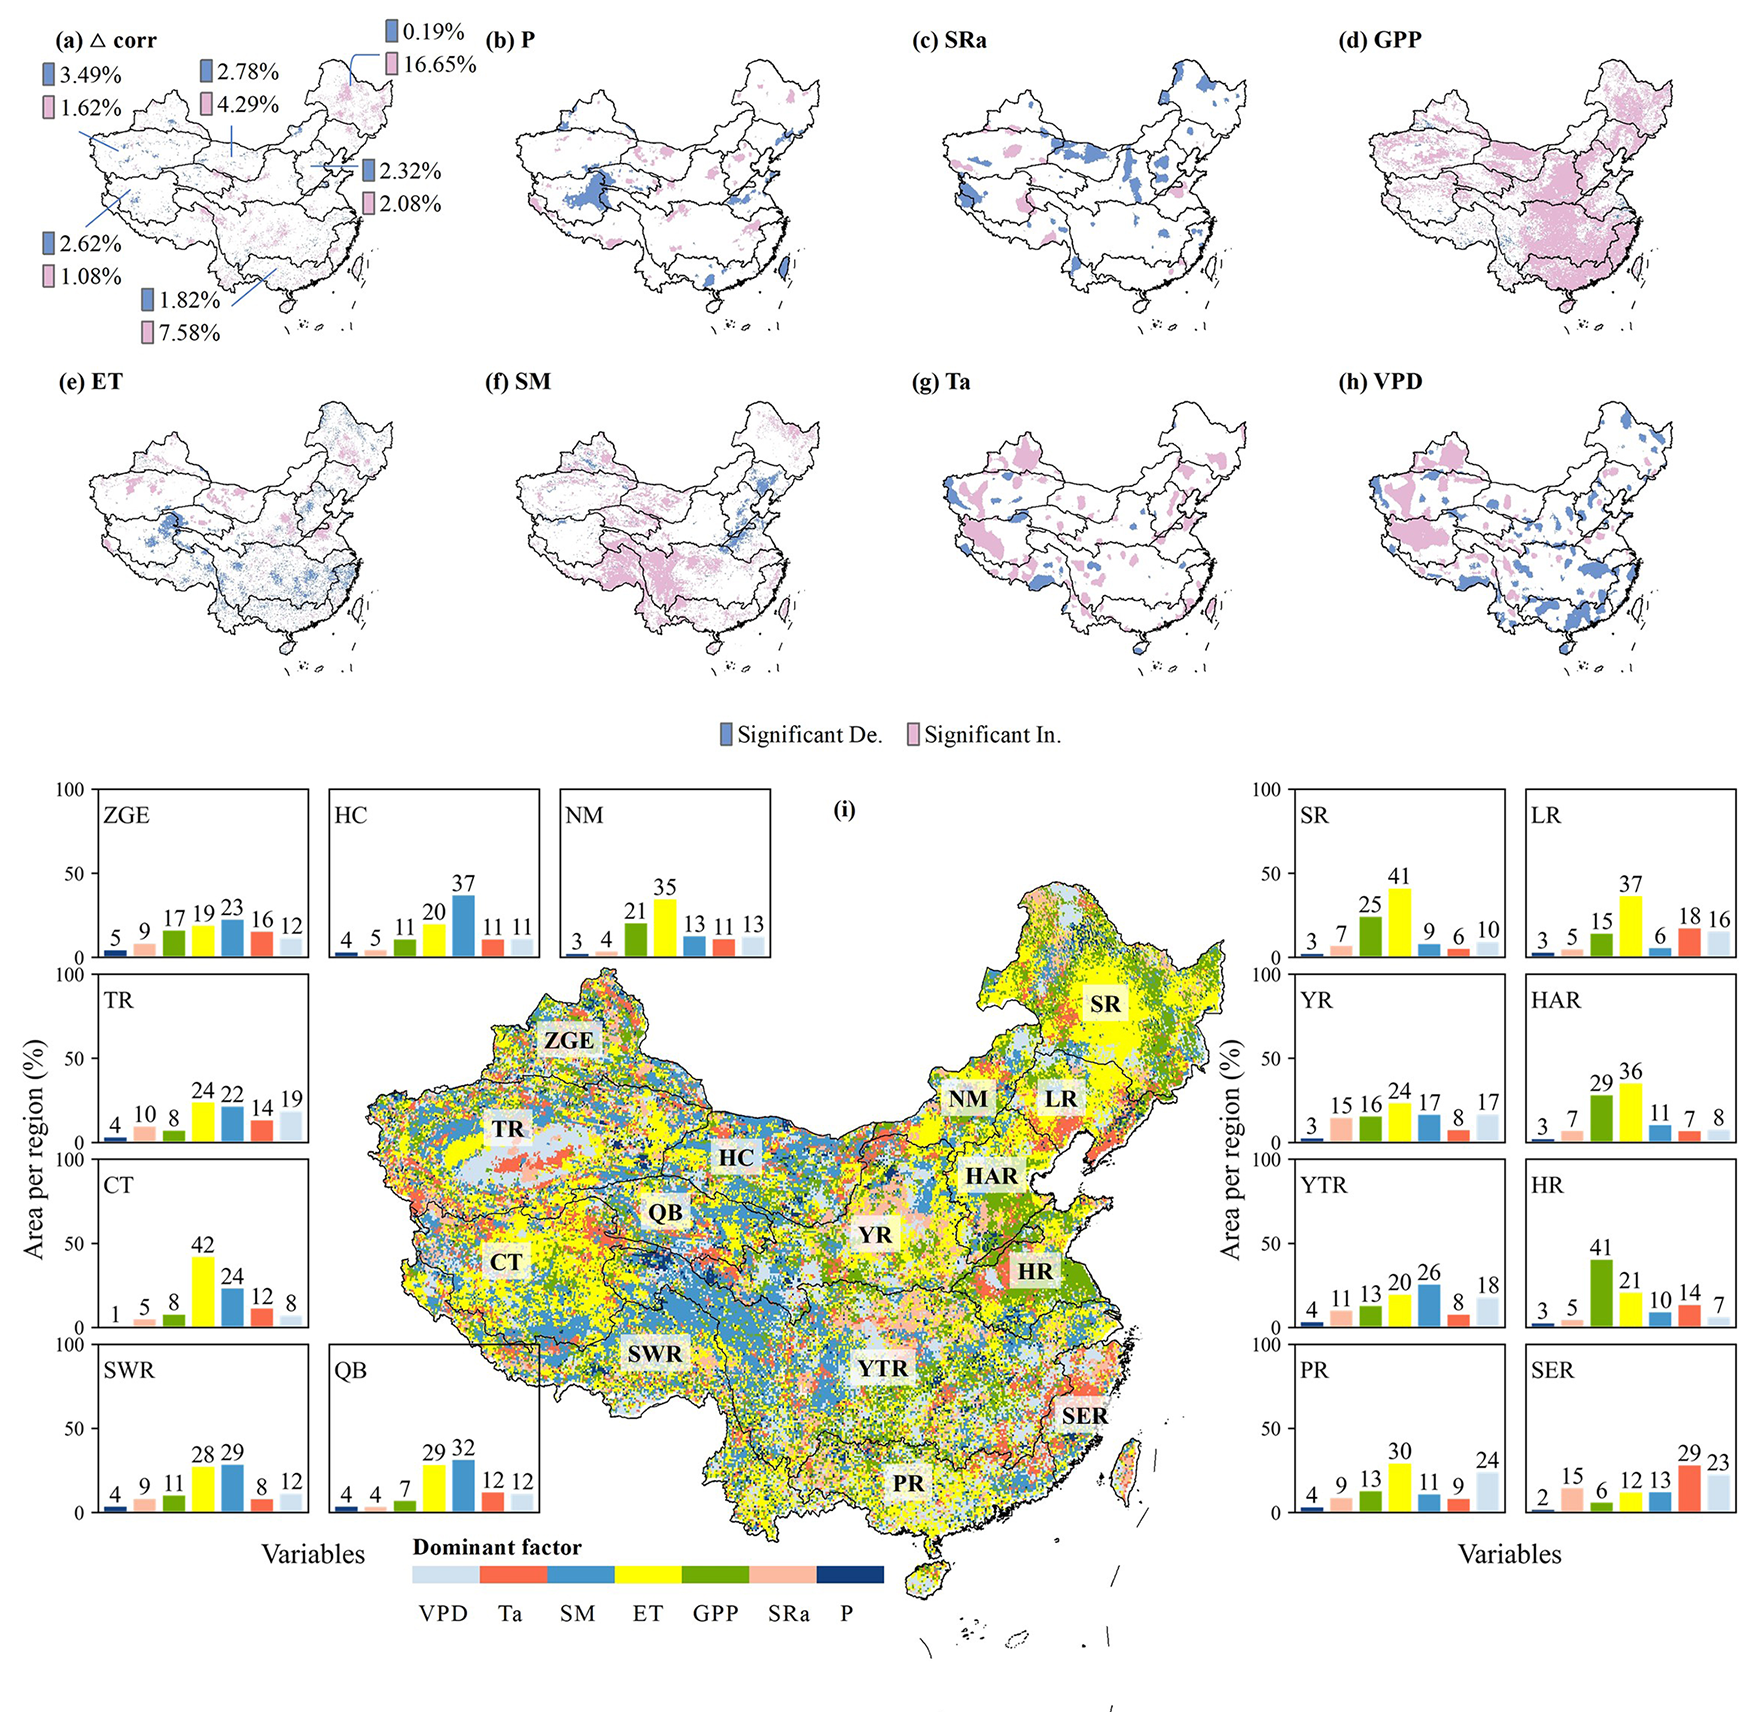
Figure 8Spatial pattern of significance (p < 0.05) of (a) Δcorr, (b) precipitation (P), (c) incoming shortwave radiation (SRa), (d) GOSIF gross primary production (GPP), (e) PML evapotranspiration (ET), (f) soil moisture (SM), (g) temperature (Ta), and (h) vapor pressure deficit (VPD) during the period of Δcorr detection using the Mann–Kendall test (Mann, 1945; Kendall, 1948). “De.” means “decreasing” and “In.” means “increasing”. (i) Attribution of Δcorr variations. Colors indicate the variable that best predicts Δcorr dynamics. ZGE: Zhungaer basin, PR: Pearl River basin, YTR: Yangtze River basin, SWR: Southwestern River basin, TR: Tarim basin, SR: Songhua River basin, CT: Changthang region, NM: Inner Mongolian Plateau region, LR: Liaohe River basin, YR: Yellow River basin, HR: Huaihe River basin, HC: Hexi Corridor region, HAR: Haihe River basin, SER: Southeastern River basin, QB: Qaidam basin.
Variations in dominant factors underlined the relevance of hydrological, meteorological, and ecological variables in inducing interannual changes in Δcorr. As shown in Fig. 8, blue pixels represented the significant decrease in Δcorr, indicating increased water stress and correlation between ET and SM. Several typical regions had relatively large areas of significant decreases in Δcorr, such as the Changthang region (2.62 %) and the Tarim basin (3.49 %). ET was the most important predictor across 42 % of the Changthang region and 24 % of the Tarim basin, which confirmed that increasing ET pushed increased water stress in these regions. In addition, a significant increase in VPD in the west might cause drought, especially in the Tarim basin, where VPD was the most important predictor across 19 % of the area. For the Haihe River basin, decreasing SM contributed to increased water limitation. On the contrary, 4.29 % of the Hexi Corridor region showed significant increases in Δcorr; increasing SM contributed to decreased water stress. A total of 16.65 % of the Songhua River basin showed significant increases in Δcorr; decreased water limitation was associated with increasing GPP (greening) in these regions. Moreover, ET and VPD played the most important role in 30 % and 24 % of the Pearl River basin, respectively; the significant decrease in VPD mitigated drought in these regions.
Analysis of the spatial patterns of CSM using multi-source satellite-based water and carbon fluxes (Fig. 2) derived from different methods (Fig. 3) further enables us to effectively reflect variations from energy to water limitation in spatiotemporally continuous grid cells. To address the question of how soil textures and plant features define constraints imposed by water supply and energy availability, there has been a growing focus on CSM from site to continental scales. For instance, northern California exhibits CSM of 0.15 m3 m−3 in semi-arid grassland at the site scale (Baldocchi et al., 2004); CSM using satellite-based surface temperature diurnal amplitude in the semi-arid grassland of Africa has been reported to be 0.12 m3 m−3 at the continental scale (Feldman et al., 2019). For specific plants, CSM is around 0.238 m3 m−3 using PML ET in the Inner Mongolian Plateau region (Fig. 5), where grass is abundant. This is in line with the grassland CSM of 0.214 m3 m−3 from the covariance approach across 195 global sites from the Integrated Carbon Observation System, AmeriFlux, and FLUXNET2015 (Fu et al., 2022a). Another study based on the correlation difference method using SM from the European Space Agency Climate Change Initiative program and ET from FLUXCOM reported large-scale CSM of around 0.21 m3 m−3 throughout Europe across all grid cells (Denissen et al., 2020). Researchers also found that plants exhibit a great vertical water uptake range to alleviate the impact of water stress (Gallego-Elvira et al., 2016), with water uptake extending to below 50 cm (Case et al., 2020) or 1–2 m (Tumber-Davila et al., 2022). Low CSM may be attributed to shorter rooting systems in water-limited environments (Konings and Gentine, 2017), while locations with high humidity, such as tropical West Africa and the southern part of the Congo Basin (Feldman et al., 2022), exhibit high CSM. Deep-rooted forests can better regulate their response to drought with high CSM among soil layers, which means that root systems of plants play a key part in determining water- and energy-limited regimes and may help us understand regional- or continental-scale water- and energy-limited regimes that arise from different vegetation and soil conditions. To comprehend the underlying factors driving CSM, it is necessary to do a more comprehensive analysis of climate and ecosystem conditions: CSM detection shows that grassland had a large range of SM within water-limited regimes (Fig. 6), where CSM was higher than average SM, probably because of shallow root systems affected by moisture; therefore, facing decreased Δcorr (Fig. 8), the grassland located in the northwestern arid region was more vulnerable. Further, water-limited regions exhibit great sensitivity in hydrologic cycles to variations in vegetation functioning, climate variability, and catchment physical conditions. Consequently, water-limited vegetation exhibits a higher degree of sensitivity to surface disturbances compared to locations with higher levels of precipitation. In this scenario, the effect of ET is more pronounced, resulting in a decline in energy limitation, such as in the Tarim basin. However, this study focusing on a specific time of year may not be enough to explain the critical value that may be shown throughout the rest of the year. Since CSM values in some grids are not detected by the eight products considered here, further research is needed for the CSM that may appear throughout the rest of the year in different regions. In addition, to compare the performance of multi-source remotely sensed water and carbon fluxes, all data are unified into the 8 d resolution. Therefore, a more refined timescale, such as a 1 d scale study, is also needed.
Multiple factors contribute to inherent constraints in identifying different regimes associated with the utilization of multi-source satellite-based ET and GPP. For example, ET and GPP exhibit great uncertainties (Liu et al., 2021) in areas with barren land, as indicated in Sect. 3.1. In eastern and southern regions, where satellite-based methods were more reliable, the eight considered satellite-based SM regimes were in good agreement (Fig. 4). Since the CAMELE ET was combined with PML ET, they showed consistency in cropland and forests, with a lower CSM than GLASS and SEBAL (Sect. 3.3). By considering variations in energy and water limitations in terrestrial ecosystems (Sect. 3.4), there is potential to improve the water and carbon flux estimation in turn. In addition, SM from ground samplings and gridded sources (Koster et al., 2009) contributes to the uncertainty in characterizing CSM, as discussed in Sect. 3.3. For gridded SM, surface climate shows a significant effect on the upper-soil-layer SM modeling, while the background aridity leads to low variability in the deeper-layer SM (Q. Li et al., 2022). Besides, external forcings seem to be responsible for a shift towards enhanced land–atmosphere coupling (Zhang et al., 2020). It should be noted that the South–North Water Transfer Project and the Pinglu Canal Project in China will result in significant modifications to SM characteristics, which are fundamental components of the concept known as CSM. Water management measures may reduce water stress in grasslands affected by climate change and make southern coastal clay areas more resistant to possible disturbances. Overall, our research can inform large-scale water conservancy projects for better water resource allocation from the perspective of the critical effect of SM.
Our main accomplishment is observing and identifying water and energy limit shifts using multi-source satellite-based water and carbon fluxes over China. These shifts show which areas are more likely to be affected by climate change. To do this, we first examined the consistency of ET and GPP derived from the site- and satellite-based grid observations and the consistency of CSM derived from the EF–SM, covariance, and correlation difference methods. CSM detected by the covariance between VPD and GPP and CSM using the correlation difference metric using VPD, ET, and SM matched well with CSM using the EF–SM method at the site scale, suggesting that these methods could detect large-scale CSM. According to satellite-based CSM from four ET products, four GPP products, and the latest SM dataset, surface water- and energy-limited regimes varied among land cover types, soil textures, and water resource subregions; soil textures of clay and land cover types of grassland had a large range of SM within water-limited regimes. Based on the spatial pattern of CSM, we further identified the dominant factor of Δcorr and discovered that VPD was the most important predictor across 24 % of the Pearl River basin and 19 % of the Tarim basin. However, unlike the declining VPD in the Pearl River basin, the increasing VPD aggravated the water stress in the Tarim basin, especially for the more fragile grassland in these areas. As environmental change and extreme disturbances affect CSM, future research directions will aim to consider the impact of hydraulic projects such as inter-basin water transfers on CSM, the impact of extreme disturbances such as tropical cyclones and wildfires on CSM, and possible changes in CSM.
This study used multi-source satellite-based water and carbon fluxes and different methods to detect CSM, and more efforts were put into the evaluation and validation of CSM. Datasets covering 18 years, as used for CSM, were quite typical of the long-term climatology of continental wetness. Since CSM, an emerging property, is generated by multiple processes occurring on the land surface, in the atmosphere, and at the interface between them, uncertainties in ET and GPP from the algorithm, uncertainties in SM from ground sampling, and enhanced land–atmosphere coupling due to external forcing all contribute to CSM uncertainties. We emphasize that SM behavior below and above CSM determines ET and GPP and that water-limited regimes of the SM range depend on CSM. Water and carbon fluxes are vulnerable to the sensitivity of Δcorr to hydrological, meteorological, and ecological predictors. Accordingly, the water and carbon algorithm should consider water–energy limit shifts to improve the simulation accuracy. Thus, applying our new understanding of Δcorr and CSM under changing land–atmosphere conditions will provide a more complete perspective of the evolution of regional terrestrial ecosystems over extended periods.
PML ET and GPP data can be found on the TPDC website. GLASS ET and GPP data are provided by Yunjun Yao (Beijing Normal University) and Wenping Yuan (Peking University). CAMELE ET data are available on Zenodo at https://doi.org/10.5281/zenodo.6283239 (Li et al., 2021). SEBAL ET data are publicly accessible from the Zenodo repository at https://doi.org/10.5281/zenodo.10803216 (Cheng, 2024a) and https://doi.org/10.5281/zenodo.10803553 (Cheng, 2024b). TL GPP data are available at https://doi.org/10.5061/dryad.dfn2z352k (Bi and Zhou, 2022). GOSIF GPP data are obtainable at http://globalecology.unh.edu/data/GOSIF-GPP.html (Global Ecology Group Data Repository, 2025). Gridded soil moisture and meteorological data are available from TPDC.
Flux data, land cover types, and soil textures from this study can be obtained from the authors upon request.
YiL: investigation, methodology, formal analysis, conceptualization, writing (original draft and review and editing); JX: supervision, writing (review and editing); XL: writing (review and editing); YuL: writing (review and editing).
The contact author has declared that none of the authors has any competing interests.
Publisher's note: Copernicus Publications remains neutral with regard to jurisdictional claims made in the text, published maps, institutional affiliations, or any other geographical representation in this paper. While Copernicus Publications makes every effort to include appropriate place names, the final responsibility lies with the authors. Regarding the maps used in this paper, please note that Figs. 1, 4, 5, 7, and 8 contain disputed territories.
Yi Liu was supported by the Guangxi Natural Science Foundation under grant no. 2024GXNSFBA010180. Jingfeng Xiao was supported by the Iola Hubbard Climate Change Endowment managed by Earth Systems Research Center, University of New Hampshire.
This paper was edited by Adriaan J. (Ryan) Teuling and reviewed by Hsin Hsu and Jingwei Zhou.
Akbar, R., Gianotti, D. J. S., McColl, K. A., Haghighi, E. ̧ Salvucci, G. D., and Entekhabi, D.: Estimation of Landscape Soil Water Losses from Satellite Observations of Soil Moisture, J. Hydrometeorol., 19, 871–889, https://doi.org/10.1175/JHM-D-17-0200.1, 2018.
Baldocchi, D. D., Xu, L. K., and Kiang, N.: How plant functional-type, weather, seasonal drought, and soil physical properties alter water and energy fluxes of an oak-grass savanna and an annual grassland, Agr. Forest Meteorol., 123, 13–39, https://doi.org/10.1016/j.agrformet.2003.11.006, 2004.
Bi, W. and Zhou, Y.: A global 0.05° dataset for gross primary production of sunlit and shaded vegetation canopies (1992–2020), Dryad [data set], https://doi.org/10.5061/dryad.dfn2z352k, 2022.
Bi, W., He, W., Zhou, Y., Ju, W., Liu, Y., Liu, Y., Zhang, X., Wei, X., and Cheng, N.: A global 0.05 degrees dataset for gross primary production of sunlit and shaded vegetation canopies from 1992 to 2020, Scientific Data, 9, 213 https://doi.org/10.1038/s41597-022-01309-2, 2022.
Bolton, D.: The computation of equivalent potential temperature, Mon. Weather Rev., 108, 1046–1053, https://doi.org/10.1175/2008MWR2593.1, 1980.
Case, M. F., Nippert, J. B., Holdo, R. M., and Staver, A. C.: Root-niche separation between savanna trees and grasses is greater on sandier soils, J. Ecol., 108, 2298–2308, https://doi.org/10.1111/1365-2745.13475, 2020.
Cheng, M.: Long time series (2001-2018) of daily evapotranspiration in China generated based on SEBAL: Part 1, Version v3, Zenodo [data set], https://doi.org/10.5281/zenodo.10803216, 2024a.
Cheng, M.: Long time series (2001-2018) of daily evapotranspiration in China generated based on SEBAL: Part 2, Version v2, Zenodo [data set], https://doi.org/10.5281/zenodo.10803553, 2024b.
Cheng, M., Jiao, X., Li, B., Yu, X., Shao, M., and Jin, X.: Long time series of daily evapotranspiration in China based on the SEBAL model and multisource images and validation, Earth Syst. Sci. Data, 13, 3995–4017, https://doi.org/10.5194/essd-13-3995-2021, 2021.
Denissen, J. M. C., Teuling, A. J., Reichstein, M., and Orth, R.: Critical Soil Moisture Derived from Satellite Observations Over Europe, J. Geophys. Res.-Atmos., 125, e2019JD031672, https://doi.org/10.1029/2019JD031672, 2020.
Dong, J., Akbar, R., Feldman, A. F., Gianotti, D. S., and Entekhabi, D.: Land Surfaces at the Tipping-Point for Water and Energy Balance Coupling, Water Resour. Res., 59, e2022WR032472, https://doi.org/10.1029/2022wr032472, 2023.
Duan, S. Q., Findell, K. I., and Fueglistaler, S. A.: Coherent Mechanistic Patterns of Tropical Land Hydroclimate Changes, Geophys. Res. Lett., 50, e2022GL102285, https://doi.org/10.1029/2022gl102285, 2023.
Feldman, A. F., Gianotti, D. J. S., Trigo, I. F., Salvucci, G. D., and Entekhabi, D.: Satellite-Based Assessment of Land Surface Energy Partitioning-Soil Moisture Relationships and Effects of Confounding Variables, Water Resour. Res., 55, 10657–10677, https://doi.org/10.1029/2019WR025874, 2019.
Feldman, A. F., Short Gianotti, D. J., Trigo, I. F., Salvucci, G. D., and Entekhabi, D.: Observed Landscape Responsiveness to Climate Forcing, Water Resour. Res., 58, e2021WR030316, https://doi.org/10.1029/2021WR030316, 2022.
Fu, Z., Ciais, P., Feldman, A. F., Gentine, P., Makowski, D., Prentice, I. C., Stoy, P. C., Bastos, A., and Wigneron, J.-P.: Critical soil moisture thresholds of plant water stress in terrestrial ecosystems, Science Advances, 8, eabq7827, https://doi.org/10.1126/sciadv.abq7827, 2022a.
Fu, Z., Ciais, P., Makowski, D., Bastos, A., Stoy, P. C., Ibrom, A., Knohl, A., Migliavacca, M., Cuntz, M., Sigut, L., Peichl, M., Loustau, D., El-Madany, T. S., Buchmann, N., Gharun, M., Janssens, I., Markwitz, C., Gruenwald, T., Rebmann, C., Molder, M., Varlagin, A., Mammarella, I., Kolari, P., Bernhofer, C., Heliasz, M., Vincke, C., Pitacco, A., Cremonese, E., Foltynova, L., and Wigneron, J.-P.: Uncovering the critical soil moisture thresholds of plant water stress for European ecosystems, Glob. Change Biol., 28, 2111–2123, https://doi.org/10.1111/gcb.16050, 2022b.
Fu, Z., Ciais, P., Wigneron, J. P., Gentine, P., Feldman, A. F., Makowski, D., Viovy, N., Kemanian, A. R., Goll, D. S., Stoy, P. C., Prentice, I. C., Yakir, D., Liu, L., Ma, H., Li, X., Huang, Y., Yu, K., Zhu, P., Li, X., Zhu, Z., Lian, J., and Smith, W. K.: Global critical soil moisture thresholds of plant water stress, Nat. Commun., 15, 4826–4826, https://doi.org/10.1038/s41467-024-49244-7, 2024.
Gallego-Elvira, B., Taylor, C. M., Harris, P. P., Ghent, D., Veal, K. L., and Folwell, S. S.: Global observational diagnosis of soil moisture control on the land surface energy balance, Geophys. Res. Lett., 43, 2623–2631, https://doi.org/10.1002/2016GL068178, 2016.
Gentine, P., Green, J. K., Guerin, M., Humphrey, V., Seneviratne, S. I., Zhang, Y., and Zhou, S.: Coupling between the terrestrial carbon and water cycles-a review, Environ. Res. Lett., 14, 083003, https://doi.org/10.1088/1748-9326/ab22d6, 2019.
Global Ecology Group Data Repository: http://globalecology.unh.edu/data/GOSIF-GPP.html, last access: 27 February 2025.
Good, S. P., Noone, D., and Bowen, G.: Hydrologic connectivity constrains partitioning of global terrestrial water fluxes, Science, 349, 175–177, https://doi.org/10.1126/science.aaa5931, 2015.
Grossiord, C., Buckley, T. N., Cernusak, L. A., Novick, K. A., Poulter, B., Siegwolf, R. T. W., Sperry, J. S., and McDowell, N. G.: Plant responses to rising vapor pressure deficit, New Phytol., 226, 1550–1566, https://doi.org/10.1111/nph.16485, 2020.
Haghighi, E., Gianotti, D. J. S., Akbar, R., Salvucci, G. D., and Entekhabi, D.: Soil and Atmospheric Controls on the Land Surface Energy Balance: A Generalized Framework for Distinguishing Moisture-Limited and Energy-Limited Evaporation Regimes, Water Resour. Res., 54, 1831–1851, https://doi.org/10.1002/2017WR021729, 2018.
He, J., Yang, K., Tang, W., Lu, H., Qin, J., Chen, Y., and Li, X.: The first high-resolution meteorological forcing dataset for land process studies over China, Scientific Data, 7, 25, https://doi.org/10.1038/s41597-020-0369-y, 2020.
He, S., Zhang, Y., Ma, N., Tian, J., Kong, D., and Liu, C.: A daily and 500 m coupled evapotranspiration and gross primary production product across China during 2000–2020, Earth Syst. Sci. Data, 14, 5463–5488, https://doi.org/10.5194/essd-14-5463-2022, 2022.
Herman, M. R., Nejadhashemi, A. P., Abouali, M., Hernandez-Suarez, J. S., Daneshvar, F., Zhang, Z., Anderson, M. C., Sadeghi, A. M., Hain, C. R., and Sharifi, A.: Evaluating the role of evapotranspiration remote sensing data in improving hydrological modeling predictability, J. Hydrol., 556, 39–49, https://doi.org/10.1016/j.jhydrol.2017.11.009, 2018.
Homaee, A., Feddes, R. A., and Dirksen, C.: Simulation of root water uptake II. Non-uniform transient water stress using different reduction functions, Agr. Water Manage., 57, 111–126, https://doi.org/10.1016/S0378-3774(02)00071-9, 2002.
Hsu, H. and Dirmeyer, P. A.: Soil moisture-evaporation coupling shifts into new gears under increasing CO2, Nat. Commun., 14, 1162, https://doi.org/10.1038/s41467-023-36794-5, 2023a.
Hsu, H. and Dirmeyer, P. A.: Uncertainty in Projected Critical Soil Moisture Values in CMIP6 Affects the Interpretation of a More Moisture-Limited World, Earths Future, 11, e2023EF003511, https://doi.org/10.1029/2023ef003511, 2023b.
Karthikeyan, L., Chawla, I., Mishra, A. K.: A review of remote sensing applications in agriculture for food security: Crop growth and yield, irrigation, and crop losses, J. Hydrol., 586: 124905, https://doi.org/10.1016/j.jhydrol.2020.124905, 2020.
Kendall, M. G.: Rank Correlation Methods, Hafner, https://doi.org/10.1017/S0020268100013019, 160 pp., 1948.
Konings, A. G. and Gentine, P.: Global variations in ecosystem-scale isohydricity, Glob. Change Biol., 23, 891–905, https://doi.org/10.1111/gcb.13389, 2017.
Koster, R. D., Guo, Z., Yang, R., Dirmeyer, P. A., Mitchell, K., and Puma, M. J.: On the Nature of Soil Moisture in Land Surface Models, J. Climate, 22, 4322–4335, https://doi.org/10.1175/2009JCLI2832.1, 2009.
Laio, F., Porporato, A., Ridolfi, L., and Rodriguez-Iturbe, I.: Plants in water-controlled ecosystems: active role in hydrologic processes and response to water stress – II. Probabilistic soil moisture dynamics, Adv. Water Resour., 24, 707–723, https://doi.org/10.1016/S0309-1708(01)00005-7, 2001.
Li, C., Yang, H., Yang, W., Liu, Z., Jia, Y., Li, S., and Yang, D.: CAMELE: Collocation-Analyzed Multi-source Ensembled Land Evapotranspiration Data, Version 4.0, Zenodo, https://doi.org/10.5281/zenodo.6283239, 2021.
Li, C., Yang, H., Yang, W., Liu, Z., Jia, Y., Li, S., and Yang, D.: CAMELE: Collocation-Analyzed Multi-source Ensembled Land Evapotranspiration Data, Earth Syst. Sci. Data Discuss. [preprint], https://doi.org/10.5194/essd-2021-456, 2022.
Li, F., Xiao, J., Chen, J., Ballantyne, A., Jin, K., Li, B., Abraha, M., and John, R.: Global water use efficiency saturation due to increased vapor pressure deficit, Science, 381, 672–677, https://doi.org/10.1126/science.adf5041, 2023.
Li, Q., Shi, G., Shangguan, W., Nourani, V., Li, J., Li, L., Huang, F., Zhang, Y., Wang, C., Wang, D., Qiu, J., Lu, X., and Dai, Y.: A 1 km daily soil moisture dataset over China using in situ measurement and machine learning, Earth Syst. Sci. Data, 14, 5267–5286, https://doi.org/10.5194/essd-14-5267-2022, 2022.
Li, X. and Xiao, J.: Mapping Photosynthesis Solely from Solar-Induced Chlorophyll Fluorescence: A Global, Fine-Resolution Dataset of Gross Primary Production Derived from OCO-2, Remote Sens.-Basel, 11, 2563, https://doi.org/10.3390/rs11212563, 2019.
Li, X., Ryu, Y., Xiao, J., Dechant, B., Liu, J., Li, B., Jeong, S., and Gentine, P.: New-generation geostationary satellite reveals widespread midday depression in dryland photosynthesis during 2020 western US heatwave, Science Advances, 9, eadi0775, https://doi.org/10.1126/sciadv.adi0775, 2023.
Liu, W., Mo, X., Liu, S., Lin, Z., and Lv, C.: Attributing the changes of grass growth, water consumed and water use efficiency over the Tibetan Plateau, J. Hydrol., 598, 126464, https://doi.org/10.1016/j.jhydrol.2021.126464, 2021.
Liu, Y., Mo, X., Hu, S., Chen, X., and Liu, S.: Attribution analyses of evapotranspiration and gross primary productivity changes in Ziya-Daqing basins, China during 2001–2015, Theor. Appl. Climatol., 139, 1175–1189, https://doi.org/10.1007/s00704-019-03004-6, 2020.
Liu, Y. Y., Dorigo, W. A., Parinussa, R. M., de Jeu, R. A. M., Wagner, W., McCabe, M. F., Evans, J. P., and van Dijk, A. I. J. M.: Trend-preserving blending of passive and active microwave soil moisture retrievals, Remote Sens. Environ., 123, 280–297, https://doi.org/10.1016/j.rse.2012.03.014, 2012.
Mann, H. B.: Non-parametric test against trend, Econometrica, 13, 245–259, https://doi.org/10.2307/1907187, 1945.
McHugh, M. L.: The Chi-square test of independence, Biochem. Medica, 23, 143–149, https://doi.org/10.11613/bm.2013.018, 2013.
Nash, J. E., Sutcliffe, J. V.: River flow forecasting through conceptual models part I – a discussion of principles, J. Hydrol., 10, 282–290, https://doi.org/10.1016/0022-1694(70)90255-6, 1970.
Porporato, A., D'Odorico, P., Laio, F., Ridolfi, L., and Rodriguez-Iturbe, I.: Ecohydrology of water-controlled ecosystems, Adv. Water Resour., 25, 1335–1348, https://doi.org/10.1016/S0309-1708(02)00058-1, 2002.
Rodriguez-Iturbe, I.: Ecohydrology: A hydrologic perspective of climate-soil-vegetation dynamics, Water Resour. Res., 36, 3–9, https://doi.org/10.1029/1999WR900210, 2000.
Schwarz, G.: Estimating the Dimension of a Model, Ann. Stat., 6, 461–464, https://doi.org/10.1214/aos/1176344136, 1978.
Schwingshackl, C., Hirschi, M., and Seneviratne, S. I.: Quantifying Spatiotemporal Variations of Soil Moisture Control on Surface Energy Balance and Near-Surface Air Temperature, J. Climate, 30, 7105–7124, https://doi.org/10.1175/JCLI-D-16-0727.1, 2017.
Seneviratne, S. I., Luethi, D., Litschi, M., and Schaer, C.: Land–atmosphere coupling and climate change in Europe, Nature, 443, 205–209, https://doi.org/10.1038/nature05095, 2006.
Seneviratne, S. I., Corti, T., Davin, E. L., Hirschi, M., Jaeger, E. B., Lehner, I., Orlowsky, B., and Teuling, A. J.: Investigating soil moisture-climate interactions in a changing climate: A review, Earth-Sci. Rev., 99, 125–161, https://doi.org/10.1016/j.earscirev.2010.02.004, 2010.
Teuling, A. J., Uijlenhoet, R., van den Hurk, B., and Seneviratne, S. I.: Parameter Sensitivity in LSMs: An Analysis Using Stochastic Soil Moisture Models and ELDAS Soil Parameters, J. Hydrometeorol., 10, 751–765, https://doi.org/10.1175/2008JHM1033.1, 2009.
Tumber-Davila, S. J., Schenk, H. J., Du, E., and Jackson, R. B.: Plant sizes and shapes above and belowground and their interactions with climate, New Phytol., 235, 1032–1056, https://doi.org/10.1111/nph.18031, 2022.
van Doorn, J., Ly, A., Marsman, M., and Wagenmakers, E.-J.: Bayesian Inference for Kendall's Rank Correlation Coefficient, Am. Stat., 72, 303–308, https://doi.org/10.1080/00031305.2016.1264998, 2018.
Xiao, J.: Satellite evidence for significant biophysical consequences of the “Grain for Green” Program on the Loess Plateau in China, J. Geophys. Res.-Biogeo., 119, 2261–2275, https://doi.org/10.1002/2014JG002820, 2014.
Yang, K., He, J., Tang, W., Qin, J., and Cheng, C. C. K.: On downward shortwave and longwave radiations over high altitude regions: Observation and modeling in the Tibetan Plateau, Agr. Forest Meteorol., 150, 38–46, https://doi.org/10.1016/j.agrformet.2009.08.004, 2010.
Yao, Y., Liang, S., Cheng, J., Liu, S., Fisher, J. B., Zhang, X., Jia, K., Zhao, X., Qing, Q., Zhao, B., Han, S., Zhou, G., Zhou, G., Li, Y., and Zhao, S.: MODIS-driven estimation of terrestrial latent heat flux in China based on a modified Priestley–Taylor algorithm, Agr. Forest Meteorol., 171, 187–202, https://doi.org/10.1016/j.agrformet.2012.11.016, 2013.
Yao, Y., Liang, S., Li, X., Hong, Y., Fisher, J. B., Zhang, N., Chen, J., Cheng, J., Zhao, S., Zhang, X., Jiang, B., Sun, L., Jia, K., Wang, K., Chen, Y., Mu, Q., and Feng, F.: Bayesian multimodel estimation of global terrestrial latent heat flux from eddy covariance, meteorological, and satellite observations, J. Geophys. Res.-Atmos., 119, 4521–4545, https://doi.org/10.1002/2013JD020864, 2014.
Yuan, W., Liu, S., Zhou, G., Zhou, G., Tieszen, L. L., Baldocchi, D., Bernhofer, C., Gholz, H., Goldstein, A. H., Goulden, M. L., Hollinger, D. Y., Hu, Y., Law, B. E., Stoy, P. C., Vesala, T., Wofsy, S. C., and AmeriFlux, C.: Deriving a light use efficiency model from eddy covariance flux data for predicting daily gross primary production across biomes, Agr. Forest Meteorol., 143, 189–207, https://doi.org/10.1016/j.agrformet.2006.12.001, 2007.
Yuan, W., Cai, W., Xia, J., Chen, J., Liu, S., Dong, W., Merbold, L., Law, B., Arain, A., Beringer, J., Bernhofer, C., Black, A., Blanken, P. D., Cescatti, A., Chen, Y., Francois, L., Gianelle, D., Janssens, I. A., Jung, M., Kato, T., Kiely, G., Liu, D., Marcolla, B., Montagnani, L., Raschi, A., Roupsard, O., Varlagin, A., and Wohlfahrt, G.: Global comparison of light use efficiency models for simulating terrestrial vegetation gross primary production based on the La Thuile database, Agr. Forest Meteorol., 192, 108–120, https://doi.org/10.1016/j.agrformet.2014.03.007, 2014.
Zhang, P., Jeong, J.-H., Yoon, J.-H., Kim, H., Wang, S. Y. S., Linderholm, H. W., Fang, K., Wu, X., and Chen, D.: Abrupt shift to hotter and drier climate over inner East Asia beyond the tipping point, Science, 370, 1095–1099, https://doi.org/10.1126/science.abb3368, 2020.
Zhang, Y., Kong, D., Gan, R., Chiew, F. H. S., McVicar, T. R., Zhang, Q., and Yang, Y.: Coupled estimation of 500 m and 8-day resolution global evapotranspiration and gross primary production in 2002–2017, Remote Sens. Environ., 222, 165–182, https://doi.org/10.1016/j.rse.2018.12.031, 2019.
Zhu, W., Wang, Y., and Jia, S.: A remote sensing-based method for daily evapotranspiration mapping and partitioning in a poorly gauged basin with arid ecosystems in the Qinghai-Tibet Plateau, J. Hydrol., 616, 128807, https://doi.org/10.1016/j.jhydrol.2022.128807, 2023.