the Creative Commons Attribution 4.0 License.
the Creative Commons Attribution 4.0 License.
 | 04 Mar 2025
Impact of runoff schemes on global flow discharge: a comprehensive analysis using the Noah-MP and CaMa-Flood models
Mohamed Hamitouche
Giorgia Fosser
Alessandro Anav
Cenlin He
Tzu-Shun Lin
Accurate estimation of flow discharge is crucial for hydrological modelling, water resources planning, and flood prediction. This study examines seven common runoff schemes within the widely used Noah-Multi-parameterisation (Noah-MP) land surface model (LSM) and evaluates their performance using ERA5-Land runoff data as a benchmark for assessing runoff and in situ streamflow observations for evaluating discharge across the globe. Then, to assess the sensitivity of global river discharge to runoff, we simulate the discharge using the Catchment-based Macro-scale Floodplain (CaMa-Flood) model across various climatic regions. The results indicate significant variability in the accuracy of the runoff schemes, with model experiments that use TOPMODEL-based runoff schemes, which are based on topography, underestimating runoff across many regions, particularly in the Northern Hemisphere, while experiments using the other runoff schemes, including default Schaake free-drainage scheme from Noah, BATS (Biosphere–Atmosphere Transfer Scheme), Variable Infiltration Capacity (VIC) scheme, and Xinanjiang scheme (XAJ), showed improved performance. Dynamic VIC consistently overestimated runoff globally. Seasonal analysis reveals substantial regional and seasonal variability. ERA5-Land and several Noah-MP schemes successfully replicated general discharge patterns of in situ observations, with ERA5-Land and Noah-MP Schaake scheme simulations closely aligning with observed data. The Noah-MP simulations demonstrated robust versatility across various land covers, soil types, basin sizes, and topographies, indicating its broad applicability. Despite overall good performance, significant biases in high-flow extremes highlight the need for continued model improvement or calibration. These findings are critical for improving global hydrological models, which are essential for developing more reliable water resources management strategies and adapting to the growing challenges posed by climate change, such as shifts in water availability and extreme flood events.
- Article
(2764 KB) - Full-text XML
-
Supplement
(1406 KB) - BibTeX
- EndNote


Accurate estimation of flow discharge, a fundamental component of the global hydrological cycle and a critical water flux from land to ocean (Stephens et al., 2020), is crucial for effective hydrological modelling, water resources planning, flood prediction, and sustainable water management practices. It is essential for flood prediction, aiding in alerts, evacuation plans, and response strategies (Nguyen et al., 2022). Water supply planning relies on it for equitable allocation across domestic, agricultural, and industrial needs, ensuring sustainability. Ecosystem health benefits from maintaining proper water levels in habitats, safeguarding biodiversity and stability. Infrastructure design and maintenance use accurate estimates for resilient structures against varying conditions. Hydropower generation optimisation and cost management depend on it. Water quality management relies on precise estimation to guide monitoring and pollution control (Zhang et al., 2011). In the context of climate change, it is essential for understanding shifting hydrological patterns and for adapting strategies. Therefore, policies and regulations centred on discharge data necessitate accurate estimation for compliance, equitable allocation, and resource distribution.
On the other hand, runoff and groundwater dynamics are among the most influential physical processes for land surface hydrological simulations, as demonstrated by various on-site and regional simulations (Gan et al., 2019; Li et al., 2020; Zhang et al., 2016, 2021a, b; Zheng et al., 2019). Past research has acknowledged the intricate interconnection between runoff and flow discharge, highlighting the propagation of uncertainty from runoff to discharge (David et al., 2019). Recognising their pivotal role, runoff schemes serve as vital components of land surface and hydrological models (Sheng et al., 2017). These models represent the processes governing the conversion of precipitation into runoff. This understanding underscores the significant influence that the selection of a particular runoff scheme can have on flow discharge patterns, yielding profound implications for water resources availability and management. Consequently, there is a pressing demand to conduct a comprehensive quantification of the diverse impacts that various runoff schemes can have on flow discharge.
Runoff schemes, each grounded in distinct hydrological theories and assumptions, can exert diverse influences on flow discharge dynamics. These effects can stem from variations in representation of hydrological processes such as surface runoff, subsurface flow, infiltration, root water uptake, groundwater dynamics, and stream–aquifer interactions (Clark et al., 2015). For instance, schemes that emphasise surface runoff may lead to altered flow pathways and timing of peak flows, impacting downstream water availability. Conversely, schemes incorporating subsurface processes may enhance groundwater recharge, potentially modifying baseflow contributions and seasonal streamflow patterns.
Moreover, the intricate interactions between runoff schemes, climatic conditions, land cover types, and soil properties further accentuate their potential impacts on flow discharge (Zipper et al., 2018). Different runoff schemes may exhibit varying sensitivities to climatic variability, resulting in disparate responses to changing precipitation patterns, temperature shifts, and extreme events. Two mechanisms, saturation excess and infiltration excess, jointly contribute to the generation of runoff (Yang et al., 2015). Runoff schemes based on the saturated excess assumption are valid in humid and pervious areas; however, this assumption has limitations in dry and impervious areas, where overland flow dominates due to excess infiltration (Ren-Jun, 1992). This underscores the importance of scrutinising runoff scheme behaviour under diverse climate conditions to unravel the complexities of their effects on flow discharge.
Despite prior research contributing valuable insights into runoff scheme impacts on flow discharge, limitations still persist. Many studies have focused on individual runoff schemes (e.g. Li et al., 2022) and confined their investigations to specific hydroclimatic contexts (e.g. Hagemann and Stacke, 2023; Liang et al., 2019) or catchments (e.g. Rummler et al., 2022; Zheng et al., 2017) that overlook potential interactions and synergies of the diverse runoff schemes when operating globally. A singular focus can limit insights into how runoff schemes collectively shape flow discharge dynamics. Additionally, the generalisation and extrapolation of findings to broader global contexts can be challenging due to geographical and climatic variability and differences in hydrological regimes, land cover, soil types, and other factors.
Given the abovementioned limitations, this paper aims to elucidate, on a global scale, the impact of different runoff schemes on river discharge estimation. To that purpose, we firstly evaluate the performances of seven distinct runoff schemes within the Noah-Multi-parameterisation (Noah-MP) land surface model (LSM), then we simulate flow discharge with the Catchment-based Macro-scale Floodplain (CaMa-Flood) river routing model to assess how different runoff schemes affect flow discharge magnitude and dynamics. Our study transcends the boundaries of individual schemes and specific regions, highlighting the need for a holistic assessment that contributes to improved hydrological modelling and management practices.
2.1 Noah-MP land surface model
In this study, the Noah-MP LSM was applied to simulate global-scale runoff. The Noah-MP LSM is a spatially distributed 1-D model specifically designed to address the vertical routing of surface and subsurface water flow in response to atmospheric forcing, all within individual grid cells. This versatile model incorporates four soil layers, extending to a maximum depth of 2 m, each with default thicknesses of 0.1, 0.3, 0.6, and 1 m. It solves Richard's equation to compute the dynamics of soil water content (Chen et al., 1996). In addition to soil water dynamics, Noah-MP computes various surface energy flux components, accounts for gravitational drainage at the lowest soil layer, and handles the partitioning of surface water into infiltration and surface runoff. These computations are facilitated through a range of parameterisation approaches (for detailed information, refer to He et al., 2023b).
Noah-MP is designed to operate in both uncoupled and coupled modes, seamlessly integrating with atmospheric and/or hydrological models at sub-daily timescales and high spatial resolutions, including point-scale, regional, and global simulations. This versatility enables its use in a variety of hydrological, weather, and climate models, offering adaptability across a wide range of spatial and temporal scales while ensuring proper integration in both time and space (He et al., 2023a).
Moreover, Noah-MP offers a multi-parameterisation framework that encompasses over 4608 combinations of more than 10 physical processes (Niu et al., 2011) that govern interactions at the land–atmosphere interface. These processes include modules for vegetation dynamics, soil moisture, snowpack accumulation and melt, energy balance, and more. The incorporation of multiple physics-based processes within Noah-MP allows for a comprehensive representation of real-world conditions and facilitates ensemble experiments with the multi-physics model for uncertainty assessment and testing competing hypotheses (Li et al., 2020; Zhang et al., 2016).
2.1.1 Noah-MP parameterisation and runoff scheme overview
The community Noah-Multi-parameterisation land surface model (Noah-MP LSM) (Niu et al., 2011; Yang et al., 2011) evolved from the Noah LSM (Chen et al., 1996, 1997; Chen and Dudhia, 2001; Ek et al., 2003), incorporating enhanced physical representations and treatments for dynamic vegetation, canopy interactions, radiative transfer, multi-layer snowpack physics, and soil-hydrological processes. In this study, the latest modernised version of Noah-MP (v5.0) with enhanced modularity, interoperability, and applicability (He et al., 2023a) was utilised.
As our main focus is on runoff, this study was conducted using the default parameterisation scheme combination outlined in the Noah-MP v5.0 public release code in uncoupled mode. The main default options include the Noah type (Ek et al., 2003) for soil moisture factor, stomatal resistance, and evapotranspiration; Monin–Obukhov (M–O) similarity theory (MOST) (Monin and Obukhov, 1954) for the surface layer exchange coefficient, canopy gaps calculated from the vegetated fraction (gap VegFrac) (Dickinson, 1983; Sellers, 1985), and canopy radiation transfer; the Ball–Berry scheme (Ball et al., 1987; Bonan, 1996) for canopy stomate resistance; Sakaguchi and Zeng's scheme (Sakaguchi and Zeng, 2009) for ground resistance to evaporation/sublimation; the Canadian land surface scheme (CLASS) type (Verseghy, 1991) for ground snow surface albedo and hydraulic properties calculated from total soil water and ice (Niu and Yang, 2006) for frozen soil permeability; general form of the freezing-point depression equation (Niu and Yang, 2006) for soil supercooled liquid water; and the dynamic vegetation model (Dickinson et al., 1998), turned off but using maximum vegetation fraction and a lookup table for the leaf area index.
In this study, we conducted seven simulations with different runoff and groundwater schemes. Each experiment (henceforth EXP) is numbered according to the Noah-MP runoff options as follows:
- 1.
TOPMODEL with groundwater (Niu et al., 2007),
- 2.
TOPMODEL with an equilibrium water table (Niu et al., 2005),
- 3.
Original Noah free drainage or Schaake's runoff (Schaake et al., 1996),
- 4.
BATS surface and subsurface runoff (Yang and Dickinson, 1996),
- 6.
Variable Infiltration Capacity (VIC) model surface runoff scheme (Liang et al., 1994),
- 7.
Xinanjiang infiltration and surface runoff scheme (XAJ; Jayawardena and Zhou, 2000),
- 8.
Dynamic VIC surface runoff scheme (Liang and Xie, 2003).
The Miguez-Macho–Fan groundwater scheme (Fan et al., 2007; Miguez-Macho et al., 2007; Noah-MP runoff option 5) was not included in this analysis due to the unavailability of global riverbed data and other essential inputs.
Infiltration excess and saturation excess runoff generation processes are the key factors leading to the difference among the selected options. This distinction has a direct impact on the velocity of surface runoff and bottom drainage fluxes, leading to the removal of water mass and shifts in liquid soil water content (Chang et al., 2020).
TOPMODEL with groundwater approach (EXP1) utilises a simplified groundwater modelling method outlined by Niu et al. (2007). In this method, vertical recharge to an unconfined aquifer is estimated through a parameterisation of Darcy's law. Groundwater storage calculations are then employed to determine the grid-scale water table depth (dwt), which is subsequently converted into the saturated surface fractional area (fsat), given as
where Fdecay is the runoff decay factor and is the maximum saturated fraction of soil surface (assigned a fixed, unitless value of 0.38). Surface runoff is calculated using a saturation excess runoff generation process, where fsat is multiplied by the precipitation that falls on the soil surface. Subsurface runoff is assumed to be proportional to exp[−Fdecay(dwt)].
TOPMODEL with equilibrium runoff (EXP2) calculations are similar to the previous scheme, with the key difference being that dwt is determined using an equilibrium water table calculation rather than a dynamic groundwater balance (Niu et al., 2005, 2011).
Unlike TOPMODEL-based schemes, the Schaake and BATS parameterisations do not account for water table dynamics but use a gravitational free-drainage baseflow approach as the bottom boundary condition. These two approaches differ in their treatment of surface runoff. The Schaake approach (EXP3) employs the infiltration excess surface runoff method described by Schaake et al. (1996), which is based on an adaptation of the Soil Conservation Service curve number method. In this approach, the surface runoff prediction is notably sensitive to the Noah-MP parameter REFKDT (Niu and Yang, 2011), which controls the influence of pre-storm surface soil moisture conditions and is linearly related to the Kdt parameter described by Schaake et al. (1996). The BATS physics scheme (EXP4), following Yang and Dickinson (1996), parameterises the fraction of incident precipitation converted into runoff as the fourth power of the degree of saturation in the top 2 m of the soil column. The gravitational drainage is parameterised in Schaake as the product of the soil drainage slope index (Sdrain) and the soil hydraulic conductivity (DK) and in BATS as , where fimp,max is the maximum soil impermeability fraction throughout the soil column.
The VIC scheme (EXP6) calculates the saturation excess surface runoff in surface soil layers (two first layers) based on a variable infiltration capacity (i) function given by
where imax is the maximum infiltration capacity, A is the fraction of saturated soil in a grid, and b is a curve shape parameter.
The surface runoff (Rs) estimated by VIC runoff scheme is given following Eqs. (12), (13), and (14) in Table 1.
The XAJ infiltration and surface runoff scheme (EXP7) introduces a distinctive approach to hydrological modelling. It addresses the saturation excess runoff generation by incorporating the concept of variable contributing area and using a double parabolic curve to represent the spatial distribution of tension water capacity (maximum soil water deficit, i.e. the difference between field capacity and wilting point), which is considered the essence of the XAJ model (Fang et al., 2017). In the selected Noah-MP version, the runoff generation process within the Xinanjiang scheme acts on the two first soil layers, resulting in the separation of runoff into two components: surface and subsurface runoff, distinguishing between impervious and pervious surfaces (He et al., 2023b). Surface runoff generated from impervious area (Rimp) is determined by the product of the fraction of imperviousness due to frozen soil (Aimp) and the effective precipitation (Pe) (i.e. mean water input on the soil surface). Surface runoff from permeable soil (Rp) is given by Eq. (3):
where R is runoff filled from tension water areas and expressed as
with Pi being the fraction of effective precipitation falling on pervious area (1−Aimp). W and Wmax are, respectively, the current and maximum tension water storage. S and Smax are, respectively, the current and maximum free water storage. Ex, a, and b are shape parameters.
Liang and Xie (2001, 2003) extended the VIC model to include the infiltration excess runoff generation process (EXP8). The new parameterisation (Dynamic VIC) dynamically represents both Hortonian and Dunnian runoff generation processes by considering effects of sub-grid spatial heterogeneity of soil properties. The saturation excess runoff (Rse) is calculated for the saturated area fraction (As) following the concept used in VIC, while the infiltration excess runoff (Rie) is computed for the 1−As area fraction following Eq. (16) in Table 1.
The subsurface runoff in VIC, Dynamic VIC, and XAJ models is drainage-dependent and calculated as per the Schaake scheme.
The seven experiments, the runoff scheme used for each experiment, and their corresponding surface and subsurface runoff equations are summarised in Table 1.
Table 1Summary of the experiments (EXPs), runoff schemes, and corresponding equations.
fimp(i): the i soil layer impermeable fraction, Qinfil,max: the maximum soil infiltration rate, wsoil,tot: the sum of the maximum holdable soil water content in the unit of depth, Kdt: a coefficient for computing maximum soil infiltration rate, P: the amount of precipitation over a time step Δt, fmm: the average potential infiltration rate over the 1-As area estimated based on the Philip infiltration scheme (Liang and Xie, 2003), fm: the maximum potential infiltration rate, y: vertical depth, i0: the point soil moisture capacity corresponding to the initial soil moisture, im: the maximum point soil moisture capacity, Cbaseflow: a baseflow coefficient, Itopo: the grid cell mean topographic index.
2.1.2 Input data
ERA5-Land (Muñoz-Sabater et al., 2021), at 0.1° resolution, represents the inaugural operational land product in the European reanalysis (ERA) series. It was derived from high-resolution global numerical simulations conducted by the European Centre for Medium-Range Weather Forecasts (ECMWF). These simulations were driven by downscaled meteorological data sourced from the ERA5 climate reanalysis, which includes adjustments for elevation to enhance the accuracy of near-surface thermodynamic conditions. As a result, ERA5-Land offers a consistent depiction of water and energy cycles across the Earth's land surface (Li et al., 2022).
In this study, meteorological variables, including 10 m wind speed, 2 m air temperature, air humidity, surface pressure, longwave and shortwave downward radiation, and total precipitation were extracted from the ERA5-Land hourly dataset. Subsequently, these variables were regridded to a spatial resolution of 0.2° to provide forcing data for the Noah-MP LSM. The soil water content simulations were performed over four distinct soil layers with depths corresponding to ECMWF model specifications: 0–7, 7–28, 28–100, and 100–289 cm.
Land cover data were defined using the Modified International Geosphere–Biosphere Programme (IGBP) Moderate Resolution Imaging Spectroradiometer (MODIS) 20-category vegetation dataset, which covers the entire globe with 500 m (15 s) grid intervals, while soil types were mainly determined by the State Soil Geographic (STATSGO)–Food and Agriculture Organization (FAO) soil texture data (Miller and White, 1998).
ERA5-Land runoff was also used as a reference dataset for evaluating the Noah-MP simulated runoff. It is generated using the Tiled ECMWF Scheme for Surface Exchanges over Land incorporating land surface hydrology (H-TESSEL) and represents the total water volume accumulated over the forecast period divided into surface and subsurface components (Liu et al., 2024). Surface runoff is generated when the maximum infiltration rate is exceeded, as described by the Arno scheme (Dümenil and Todini, 1992), while subsurface water fluxes are governed by Darcy's law, assuming free drainage at the bottom boundary condition (Balsamo et al., 2009; Wipfler et al., 2011).
A recent study by Dutta and Markonis (2024) evaluated the performance of ERA5-Land runoff and found that it performs well in specific regions like central Europe, India, and southern North America, with a generally accurate representation of global runoff patterns. However, the study highlights significant inaccuracies in arid regions and similar climates. Additionally, ERA5-Land struggles with extreme events, often failing to generate high runoff following intense precipitation. Although it has these limitations that should be considered when using ERA5-Land for terrestrial hydrological studies, ERA5-Land has the big advantage of being able to provide atmosphere-coherent runoff at hourly resolution and high spatial resolution, allowing for the validation of Noah-MP.
Prior to conducting runoff evaluation simulations, a 15-year spin-up of the Noah-MP LSM was performed for each model runoff experiment. This involved repeating the 1980–1984 interval three times to reach model stability and enhance accuracy in simulating runoff and related hydrological processes. Following the spin-up phase, model simulations forced by hourly ERA5-Land data were carried out for the period from 1985–2023.
2.2 CaMa-Flood river routing model
As the Noah-MP LSM does not account for horizontal water exchanges, it necessitates supplementation with lateral flow algorithms to achieve accurate simulations of the river discharge. We used the Catchment-based Macro-scale Floodplain model, CaMa-Flood (Yamazaki et al., 2011), due to its ability to simulate global temporal variations and discharge peaks. CaMa-Flood was proven to realistically simulate river water levels and the hydrodynamics of floodplain inundation (Hirabayashi et al., 2013).
Functioning as a global-scale distributed river model, CaMa-Flood relies on runoff input from a land surface model to simulate water storage and river discharge across a predefined river network map, available at different spatial resolutions: 0.25, 0.1, 0.0833, 0.05, and 0.0166°. The model discretises river basins into unit catchments, each delineated by sub-grid river and floodplain topography parameters, providing a nuanced representation of floodplain inundation at a sub-grid scale (Yamazaki et al., 2014). River discharge is calculated using the local inertial equation, accounting for the backwater effect and ensuring a more accurate portrayal of river dynamics (Bates et al., 2010; Yamazaki et al., 2013).
In its calculations, CaMa-Flood employs Manning's friction coefficient for main river channels set to 0.03. The model dynamically adjusts the calculation time step to meet the Courant–Friedrichs–Lewy condition, ensuring computational stability (Bates et al., 2010; Yamazaki et al., 2013). Additionally, a channel bifurcation flow scheme enhances the model's capability to simulate intricate flow dynamics, particularly in mega deltas. This scheme automatically incorporates bifurcation channels into the global river network map, extracting information from the HydroSHEDS flow direction map and the SRTM3 DEM (Yamazaki et al., 2014).
In this study, the CaMa-Flood model at a 0.0833° spatial resolution was used. To ensure model stability, CaMa-Flood underwent a dedicated spin-up phase, synchronised with the third iteration of the Noah-MP spin-up, spanning a single 5-year interval, from 1980 to 1984. Subsequently, daily runoff data simulated by the seven Noah-MP experiments were interpolated to match the resolution of the CaMa-Flood model, as in the spin-up phase, and used to drive river discharge simulations spanning from 1985 to 2023.
Both Noah-MP and CaMa-Flood models were set up over a global domain covering the land areas between 180° W and 180° E and between 60° S and 90° N.
Additionally, ERA5-Land daily runoff was also used to simulate the daily river discharge. This assessment followed a similar procedure, including data interpolation, with a 5-year spin-up period, from 1980 to 1984, after which CaMa-Flood discharge simulations were conducted from 1985 to 2023.
2.3 Model evaluation
To quantify the performance of the different runoff schemes, the mean annual runoff bias was analysed, calculated as
where EXP represents the runoff values for each Noah-MP runoff scheme. To avoid incorrect values due to scarce or null runoff or very high bias resulting from low ERA5-Land runoff values, total annual ERA5-Land runoff values below 5 mm yr−1 were masked. This mask was then applied to the corresponding values in all experimental datasets, ensuring consistency with ERA5-Land.
For the evaluation of the impact of the different runoff schemes on discharge simulated by CaMa-Flood, the model outputs were compared with observed discharge data obtained from the Global Runoff Data Centre (GRDC) and the simulated runoff. The evaluation began with visualising the temporal dynamics of runoff and discharge through mean seasonal cycle plots. Next, we analysed the runoff bias as calculated using Eq. (18) and compared it with the corresponding discharge bias. Finally, a comprehensive assessment of the model performance for each runoff scheme in terms of daily discharge was conducted using several statistical metrics, including the correlation coefficient (R), standard deviation (SD), mean absolute error (MAE), root mean squared error (RMSE), and Kling–Gupta efficiency (KGE). The KGE metric (Gupta et al., 2009) is an aggregated measure of the agreement in timing, magnitude, and variability between simulations and observations. It ranges from −∞ to 1, the latter representing the perfect score. The Taylor diagram (Taylor, 2001), which allows for simultaneous evaluation of the temporal correlation and standard deviations, was also used to visually summarise the performance over different climatic regions.
The comparative analysis was conducted over 43 global river basins, where discharge observations are available, spanning four climatic zones classified according to the Köppen climate classification (Kottek et al., 2006), which are cold, warm temperate, equatorial, and arid regions (Fig. 1). The drainage area of the selected basins, based on the discharge gauge stations, ranges from 16 920 km2 for the smallest to 4 671 462 km2 for the largest. This ensures that the evaluation of both Noah-MP and CaMa-Flood simulations accounts for a wide range of hydrological and climatic conditions, enhancing the robustness and generalisability of the findings. Other details regarding the dominant soil textures, land cover types, and slope characteristics across the basins are provided in the Supplement (Table S1 and Sect. S1).
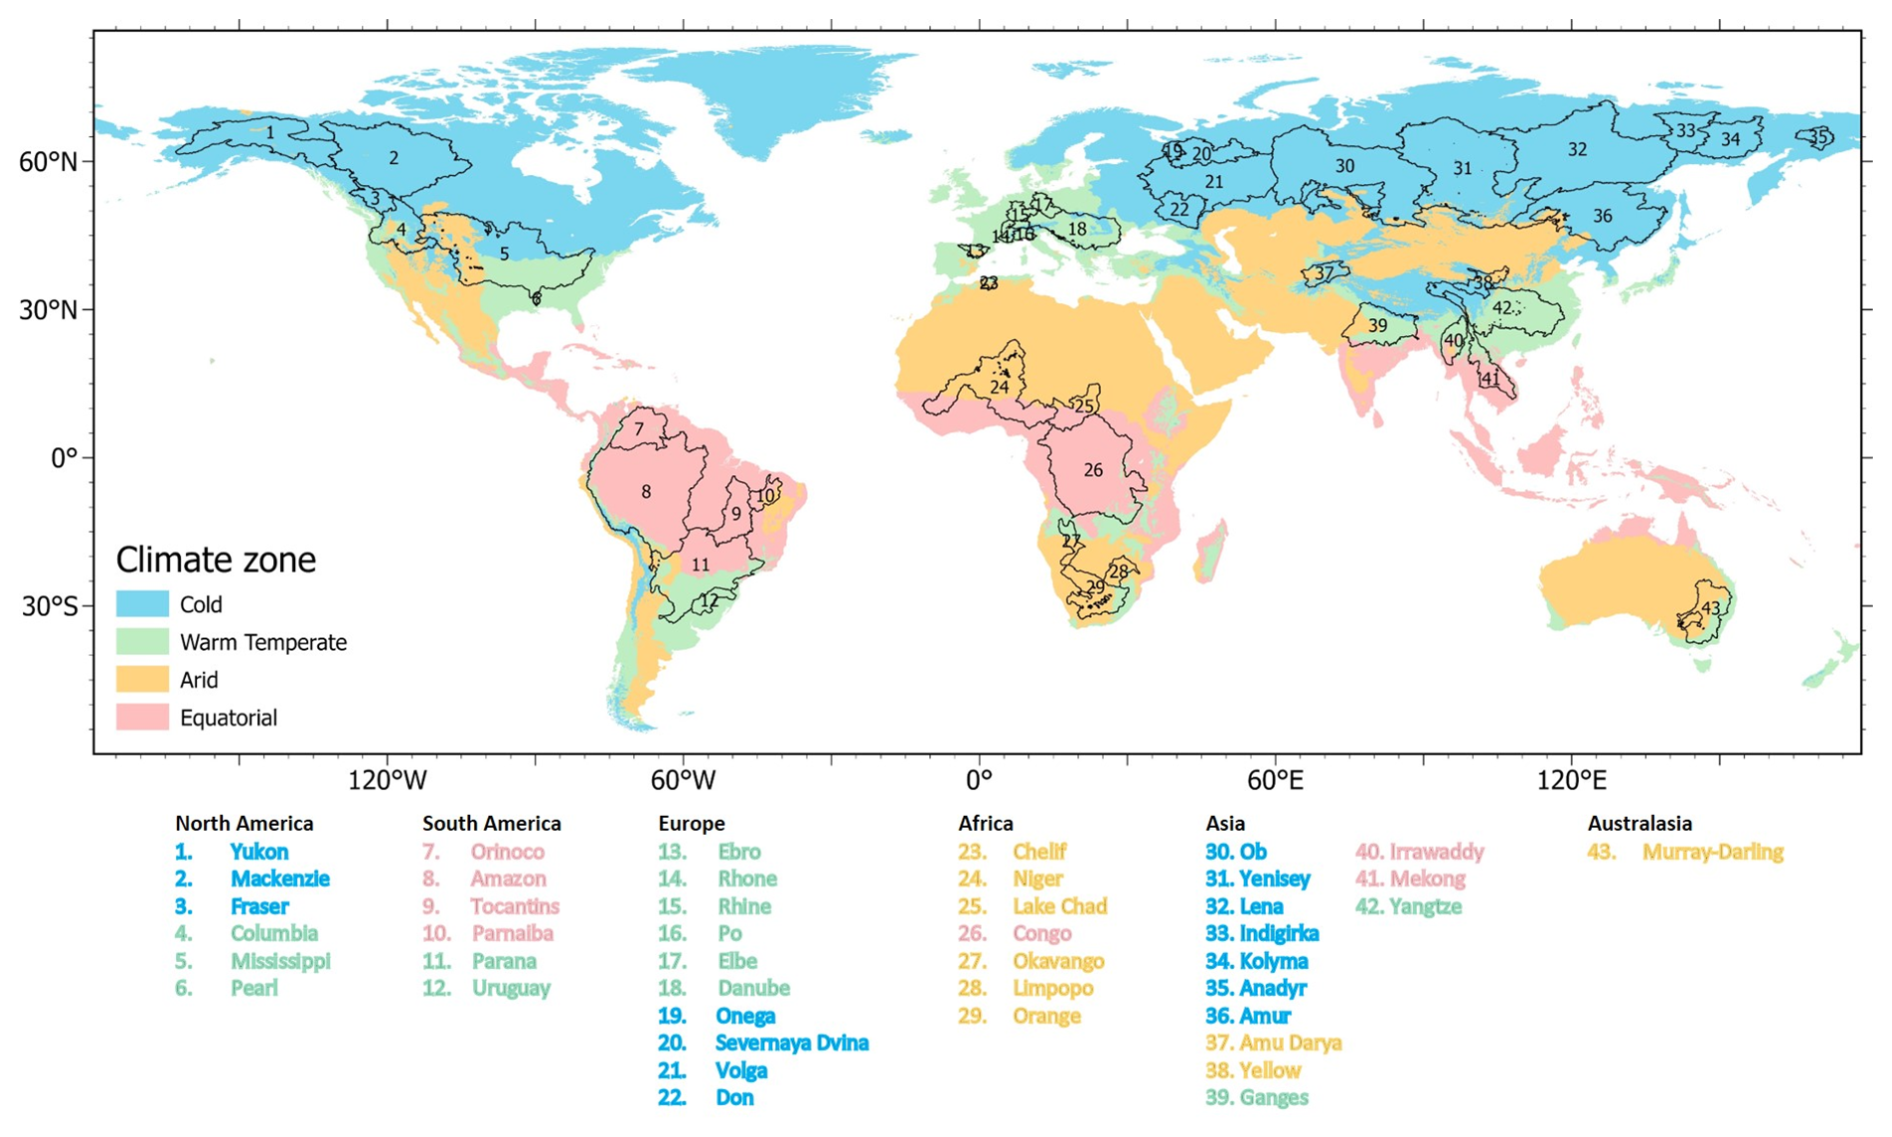
Figure 1Geographical locations and names of global river basins used in this study, over four climate zones, based on the Köppen–Geiger climate classification world map (Kottek et al., 2006). The names of the basins are colour-coded based on their respective climate zones (cold, warm temperate, arid, and equatorial). Basins spanning multiple climate zones are assigned to the zone covering the largest area.
3.1 Runoff bias
Figure 2 illustrates the spatial pattern of the annual (1985–2003) mean runoff biases of various Noah-MP runoff schemes compared to ERA5-Land runoff data, expressed in percentages. The biases are calculated as in Eq. (18), where positive values indicate overestimation and negative values indicate underestimation of runoff by the Noah-MP experiments relative to ERA5-Land.
In addition, the ERA5-Land runoff map serves as a reference, showing the total annual runoff in millimetres per year. It clearly distinguishes dry areas with runoff of less than around 140 mm yr−1, mostly corresponding to arid regions, from humid and very humid areas. In equatorial regions, annual runoff can exceed 1000 mm, as seen in the Amazon Basin and parts of southeastern Asia.
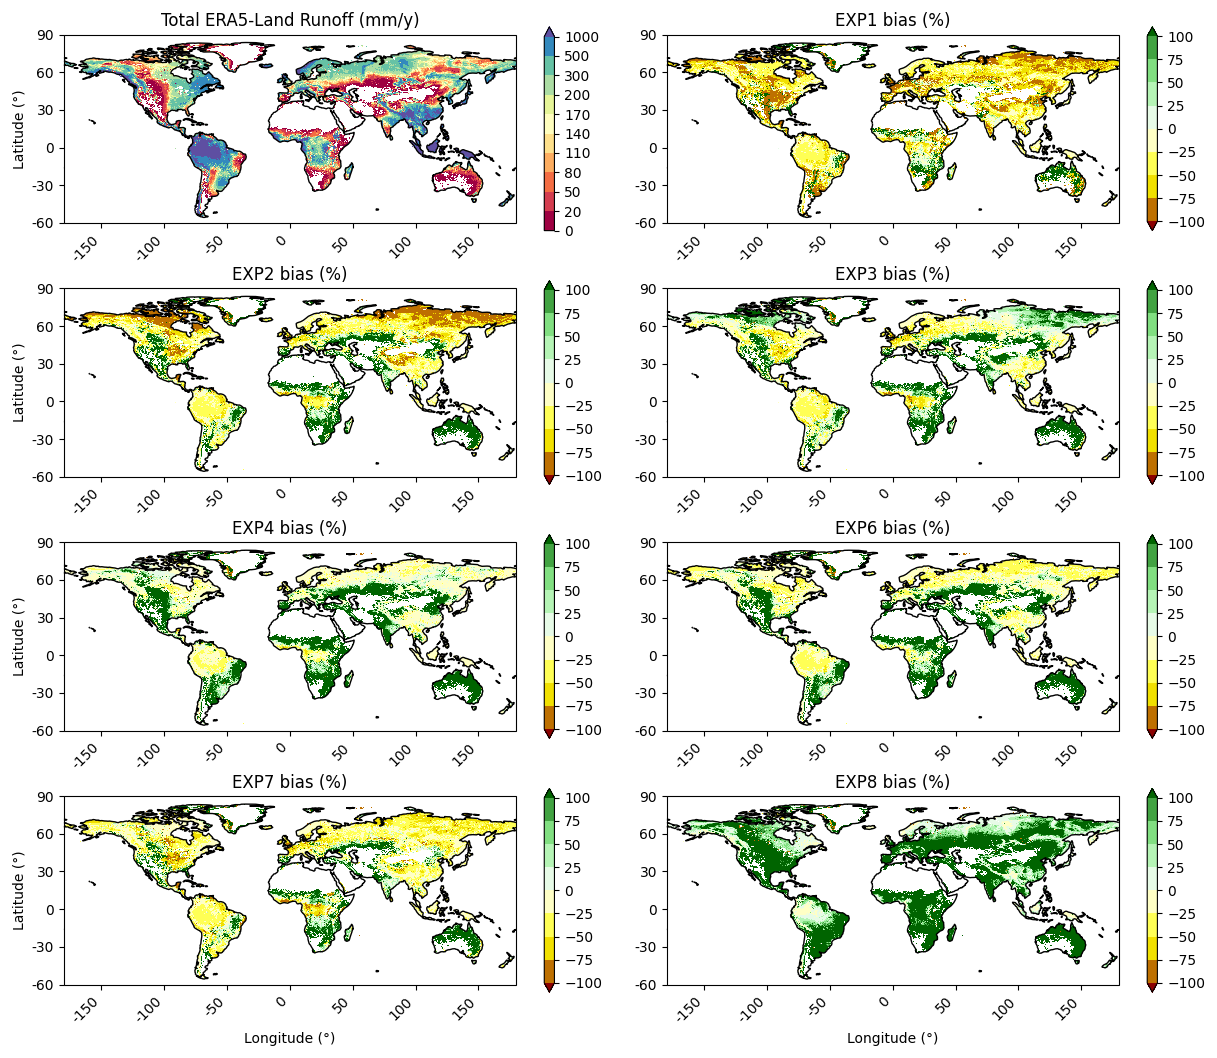
Figure 2Multi-year (1985–2023) mean annual runoff bias (%) of Noah-MP runoff schemes driven by ERA5-Land climate forcing compared to ERA5-Land runoff data.
Across the different experiments, the biases in runoff exhibit substantial spatial variability. In particular, EXP1 generally underestimates runoff compared to ERA5-Land in almost every region, except in central and south Africa and some limited areas in eastern South America and western Australasia. This underestimation is particularly significant in the Northern Hemisphere, especially in cold and warm temperate regions, where the bias often exceeds 50 %, reaching up to 100 % (∼300 mm yr−1). This indicates that EXP1 struggles considerably with capturing runoff dynamics in these areas.
EXP2 exhibits a more balanced bias distribution: while negative biases are still present in the Northern Hemisphere, particularly in Canada and northern Asia, the magnitude is reduced compared to EXP1. There are also slightly more areas with positive bias reaching up to 400 % (∼ 50 mm yr−1) in Africa, Australia, and north and eastern South America, while negative biases, exceeding 20 % (∼ 300 mm yr−1), are observed in the Amazon basin and southeast Asia.
EXP3 demonstrates reduced biases overall compared to EXP1 and EXP2. In the Southern Hemisphere, its performance is close to EXP2. In the Northern Hemisphere, positive biases, lower than 100 % (∼ 150 mm yr−1), are observed in polar and cold regions. Negative biases are still present but are less intense. This suggests improved handling of runoff dynamics in these regions.
EXP4 exhibits a similar pattern of bias to EXP3, with a generally lower magnitude of bias compared to the earlier experiments. However, there are still regions with significant positive bias reaching up to around 1500 % (∼ 500 mm yr−1), particularly in the equatorial and subequatorial zones.
EXP6 shows a mix of positive and negative biases but with a generally lower magnitude compared to the earlier experiments. Negative biases, mostly below 50 % (equivalent to less than 150 mm yr−1), are particularly evident in the Northern Hemisphere, especially in cold and warm temperate regions, and can reach from 200 to 400 mm yr−1 in equatorial regions like the Amazon River basin and parts of central Asia. Positive biases are also observed in equatorial and subequatorial zones, ranging from 1 % to around 300 % (∼ 50 to 200 mm yr−1). However, the extent and intensity of these biases are reduced compared to EXP1 and EXP2, suggesting an improved performance in handling runoff, though not as well as EXP3 and EXP4 in some regions.
EXP7 displays a similar pattern to EXP6, with reduced biases compared to EXP1 and EXP2. Negative biases dominate in the Northern Hemisphere, particularly in high-latitude and warm temperate regions. Positive biases are less widespread but are still present in some equatorial and subequatorial regions, including parts of south America and Africa, central Asia, and Australasia. The overall bias magnitudes are lower than those observed in EXP1 and EXP2, indicating a better performance though still showing room for improvement in specific regions.
EXP8 displays the most pronounced positive biases, exceeding 100 % across nearly all regions (over 300 mm in cold regions and up to 500 mm in other basins). This indicates a substantial overestimation of runoff by this scheme on a global scale. In Dynamic VIC (EXP8), the saturation excess runoff is conceptualised similarly to VIC (EXP6), which performs relatively well compared to ERA5-Land runoff. This suggests that the overestimation is primarily due to the parameterisation of the infiltration-excess runoff within Dynamic VIC. With the Dynamic VIC scheme, Noah-MP uses three infiltration measurement methods: Philip (Philip, 1987), Green–Ampt (Heber Green and Ampt, 1911), and Smith–Parlange (Smith and Parlange, 1978) infiltration schemes, with the Philip scheme being used in this study. Improving runoff simulation performance with the Dynamic VIC scheme could be achieved by selecting the most appropriate infiltration scheme and optimising its parameterisation.
In summary, the progression from EXP1 through EXP7 shows a trend of decreasing bias magnitudes and improved performance in simulating runoff dynamics. While EXP1 and EXP2 exhibit significant underestimation in many regions, particularly in the Northern Hemisphere, the other experiments like EXP3, EXP4, EXP6, and EXP7 demonstrate progressively better performance with reduced biases. Nonetheless, challenges remain, particularly in accurately capturing runoff in equatorial and subequatorial areas as well as in certain high-latitude regions. This analysis underscores the need for ongoing model refinement and calibration to enhance the predictive accuracy of runoff simulations across diverse climatic regions.
3.2 Seasonal cycle of runoff and river discharge
The seasonal cycle of both runoff and discharge, as simulated by the Noah-MP experiments and the CaMa-Flood model, reveals significant variability across different climatic zones, highlighting the diverse hydrological processes within each region (Fig. 3). The inclusion of discharge data alongside each corresponding runoff plot emphasises the connection between these two variables and underscores the crucial role of runoff in shaping the discharge patterns observed in various basins.
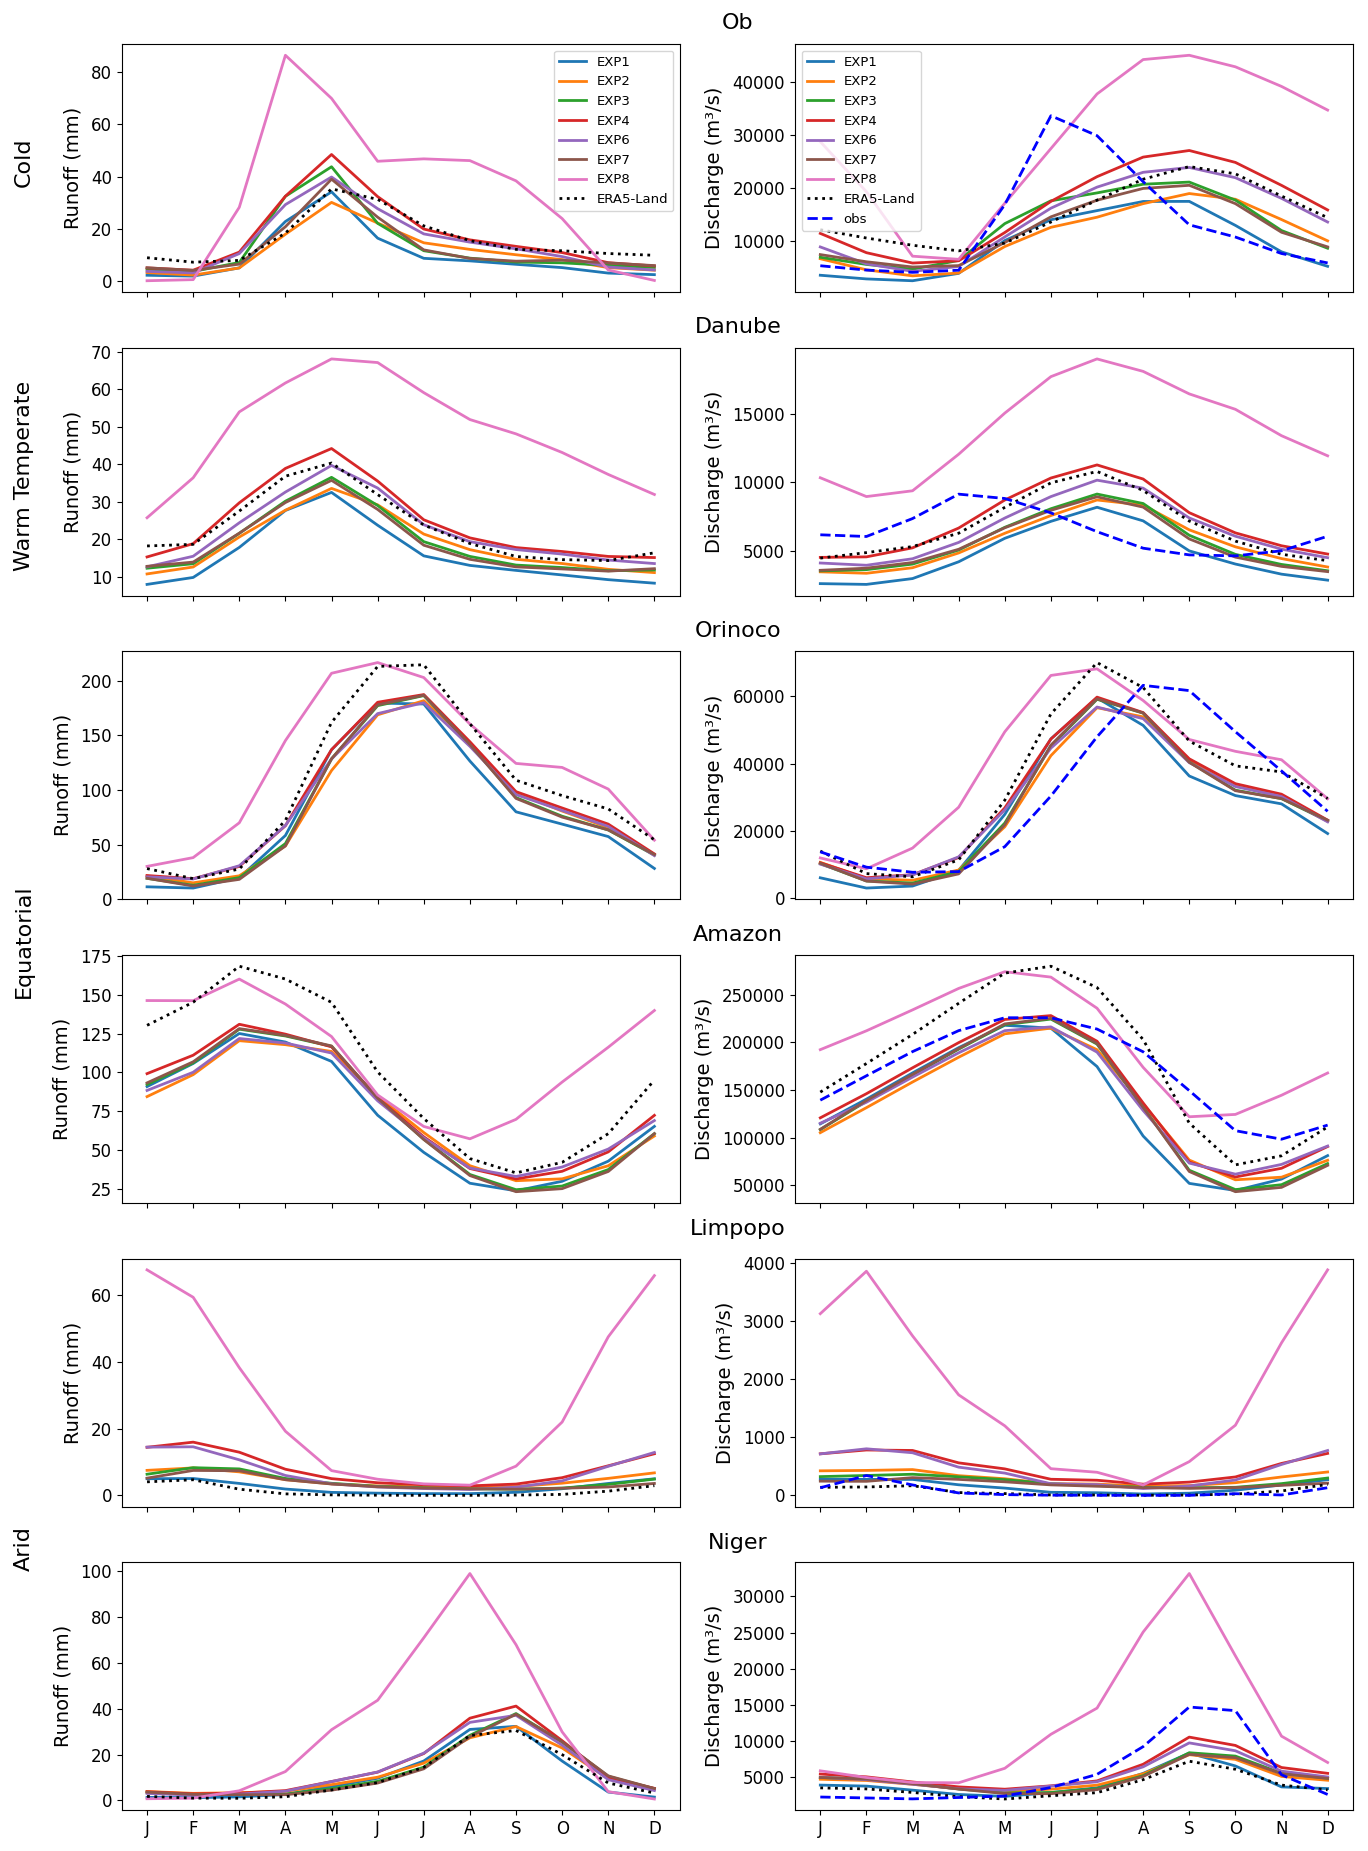
Figure 3Mean seasonal cycle of runoff (mm) and river discharge (m3 s−1) simulated by the different Noah-MP runoff schemes and CaMa-Flood for six selected river basins representing four climate regions (cold, warm temperate, equatorial, and arid). Discharge data include simulated and observed values (obs) for the period from 1985–2023. Observation years contributing to the monthly mean vary depending on their availability, with a minimum of 5 years per catchment.
In equatorial regions, such as the Amazon and Orinoco basins, the seasonal cycle of runoff exhibits pronounced peaks during wet seasons, directly translating into high discharge values. These peaks are expected due to intense rainfall and the vast drainage areas characteristic of these regions. The ability of the models to replicate these extreme events is essential for understanding and managing water resources in areas prone to significant seasonal variations.
In contrast, arid regions, including the Niger and Limpopo basins, display more subdued seasonal cycles of both runoff and discharge. This pattern reflects the typically low and irregular rainfall in these regions, leading to lower and less variable runoff and, consequently, discharge. The consistency between runoff and discharge patterns in these regions illustrates the sensitivity of the models to regional climatic conditions.
Across many basins, the seasonal cycles of runoff and discharge generally agree. However, a noticeable lag often exists between the peak runoff and peak discharge, especially in large river basins like the Amazon. This lag, which can extend to up to 3 months (Liang et al., 2020; Sorribas et al., 2020), is due to the natural routing process within the river network. This process involves the time it takes for water to travel through the system and the storage effects within river channels depending on basin characteristics, such as size, shape, drainage density, river length, and slope. In some cases, this lag could also reflect limitations in the CaMa-Flood routing model, particularly for large-scale river basins, where routing dynamics are complex. A detailed sensitivity analysis of the routing parameterisation (such as river velocity, roughness coefficients, or floodplain dynamics) could offer valuable insights into how model-specific limitations impact the timing of peak discharge. This could be an important direction for future research, with the potential to enhance model performance in accurately simulating discharge timing.
In certain cases, such as the Ob and Danube river basins, the delay in capturing the peak discharge by comparison to observed peaks seems to stem from limitations in specific parameterisations and subsurface runoff scheme within CaMa-Flood. These limitations hinder the model's ability to accurately predict the timing of maximum discharge, which is critical for applications such as flood forecasting and water resources management. Supporting this, another river routing model, WRF-Hydro (Gochis et al., 2020), was tested using the same inputs (land surface model, schemes, forcing, resolution, and topography) for the Danube River basin. Unlike CaMa-Flood, WRF-Hydro was able to capture the peak discharge timing accurately (not shown), confirming that the delay observed in CaMa-Flood simulations is due to the model's inherent limitations and thus not linked to the Noah-MP representation of runoff.
Both ERA5-Land and Noah-MP runoff-driven discharge values successfully replicate the general patterns of the mean seasonal discharge cycle across most basins and climatic regions. This indicates a robust performance of the models in capturing the overall seasonal dynamics of river discharge. This capability is advantageous for conducting trend and frequency analysis under climate change projections and scenarios, aiding in the development of water management strategies and climate actions. Additionally, these models can be used in conjunction with a set of climate models to build an ensemble model, effectively addressing the uncertainty in future projections.
Conversely, a significant positive bias is observed in EXP8, which tends to overestimate the seasonal cycle of discharge in the majority of the basins globally. This overestimation is evident when compared to ERA5-Land runoff-driven discharge as well as to the other seven experimental setups. The consistent overestimation by EXP8 confirms the systematic issue within this particular runoff scheme. On the other side, EXP1 and EXP2 slightly underestimate discharge when compared to ERA5-Land in cold, warm temperate, and equatorial regions. However, these schemes slightly overestimate discharge in arid regions. This differential performance indicates region-specific biases in these runoff schemes that might be attributed to how they handle surface and subsurface runoff processes. The noticeable bias highlighted with these experiments reflects clearly the translation of the aforementioned bias in runoff to a bias in discharge. This shows the significant influence that the selection of a particular runoff scheme can have on flow discharge.
Finally, we highlight that all experimental setups and ERA5-Land sometimes tend to overestimate the discharge when compared to GRDC observations (Fig. S1 in the Supplement). This overestimation can be attributed to various factors, including basin regulation and human activities, observation accuracy, and forcing accuracy and resolution. These elements introduce complexities that affect the ability of models to match observed discharge precisely.
3.3 Runoff bias propagation to discharge bias
After demonstrating the significant impact that the selection of a particular runoff scheme can have on flow discharge patterns, we now explore the relationship between runoff bias and discharge bias. According to the water balance equation, within a defined area over a specific period, the total inflows (such as precipitation) must equal the total outflows (including runoff and evapotranspiration) plus any change in storage (such as changes in soil moisture, groundwater, or surface water reservoirs). When considering periods longer than 1 year, the changes in water storage are generally assumed to be negligible (ΔS=0) (Oda et al., 2024). Under this assumption, the total runoff (including both surface and subsurface components) is nearly equal to the total discharge observed at the basin outlet. As a result, one would expect a strong correlation between runoff bias and discharge bias.
Figure 4 corroborates this expectation, illustrating the correlation between runoff and discharge biases when compared to ERA5-Land runoff and simulated discharge across various climate zones and globally.
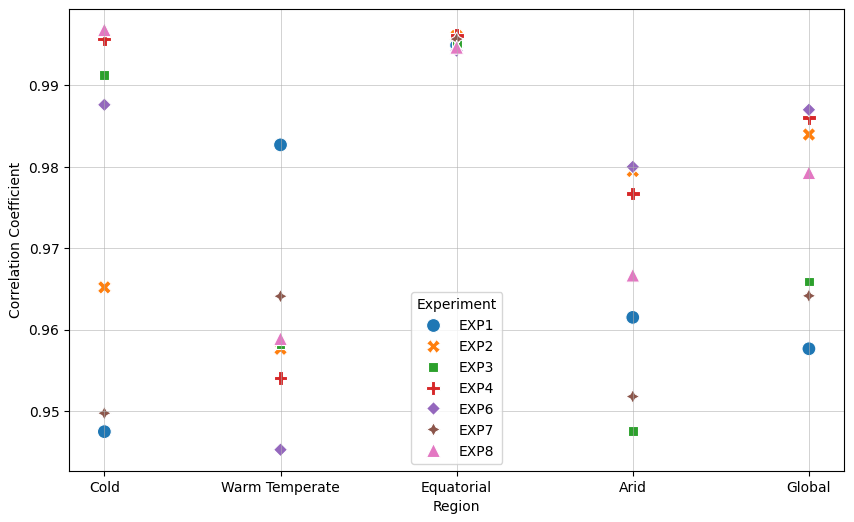
Figure 4Scatterplots of Pearson correlation coefficients between runoff and discharge biases across climate regions and globally.
The correlation coefficients, ranging from 0.945 to 0.997, indicate an almost perfect agreement between the biases, highlighting the direct propagation of uncertainty from runoff to discharge estimation. This analytical finding aligns with the results of David et al. (2019), further emphasising the critical influence that the choice of runoff scheme has on discharge bias.
3.4 Discharge performance metrics
Tables 2 and 3 and Fig. 5 compare the performance statistical metrics, i.e. the Kling-Gupta efficiency (KGE), root mean square error (RMSE), mean absolute error (MAE), temporal correlation coefficient (R), and standard deviation (SD) of the different Noah-MP experiments on the global scale and across the four climate regions with the observational dataset GRDC (detailed values regarding some of these metrics are provided for each river basin in the Tables S2, S3, and S4). These metrics provide a comprehensive evaluation of each model's performance in capturing daily discharge, highlighting the strengths and limitations of each experimental setup globally and in diverse climatic conditions.
Table 2Global performance metrics – KGE, R, SD (m3 s−1), RMSE (m3 s−1), and MAE (m3 s−1) – of Noah-MP runoff models in terms of daily discharge.
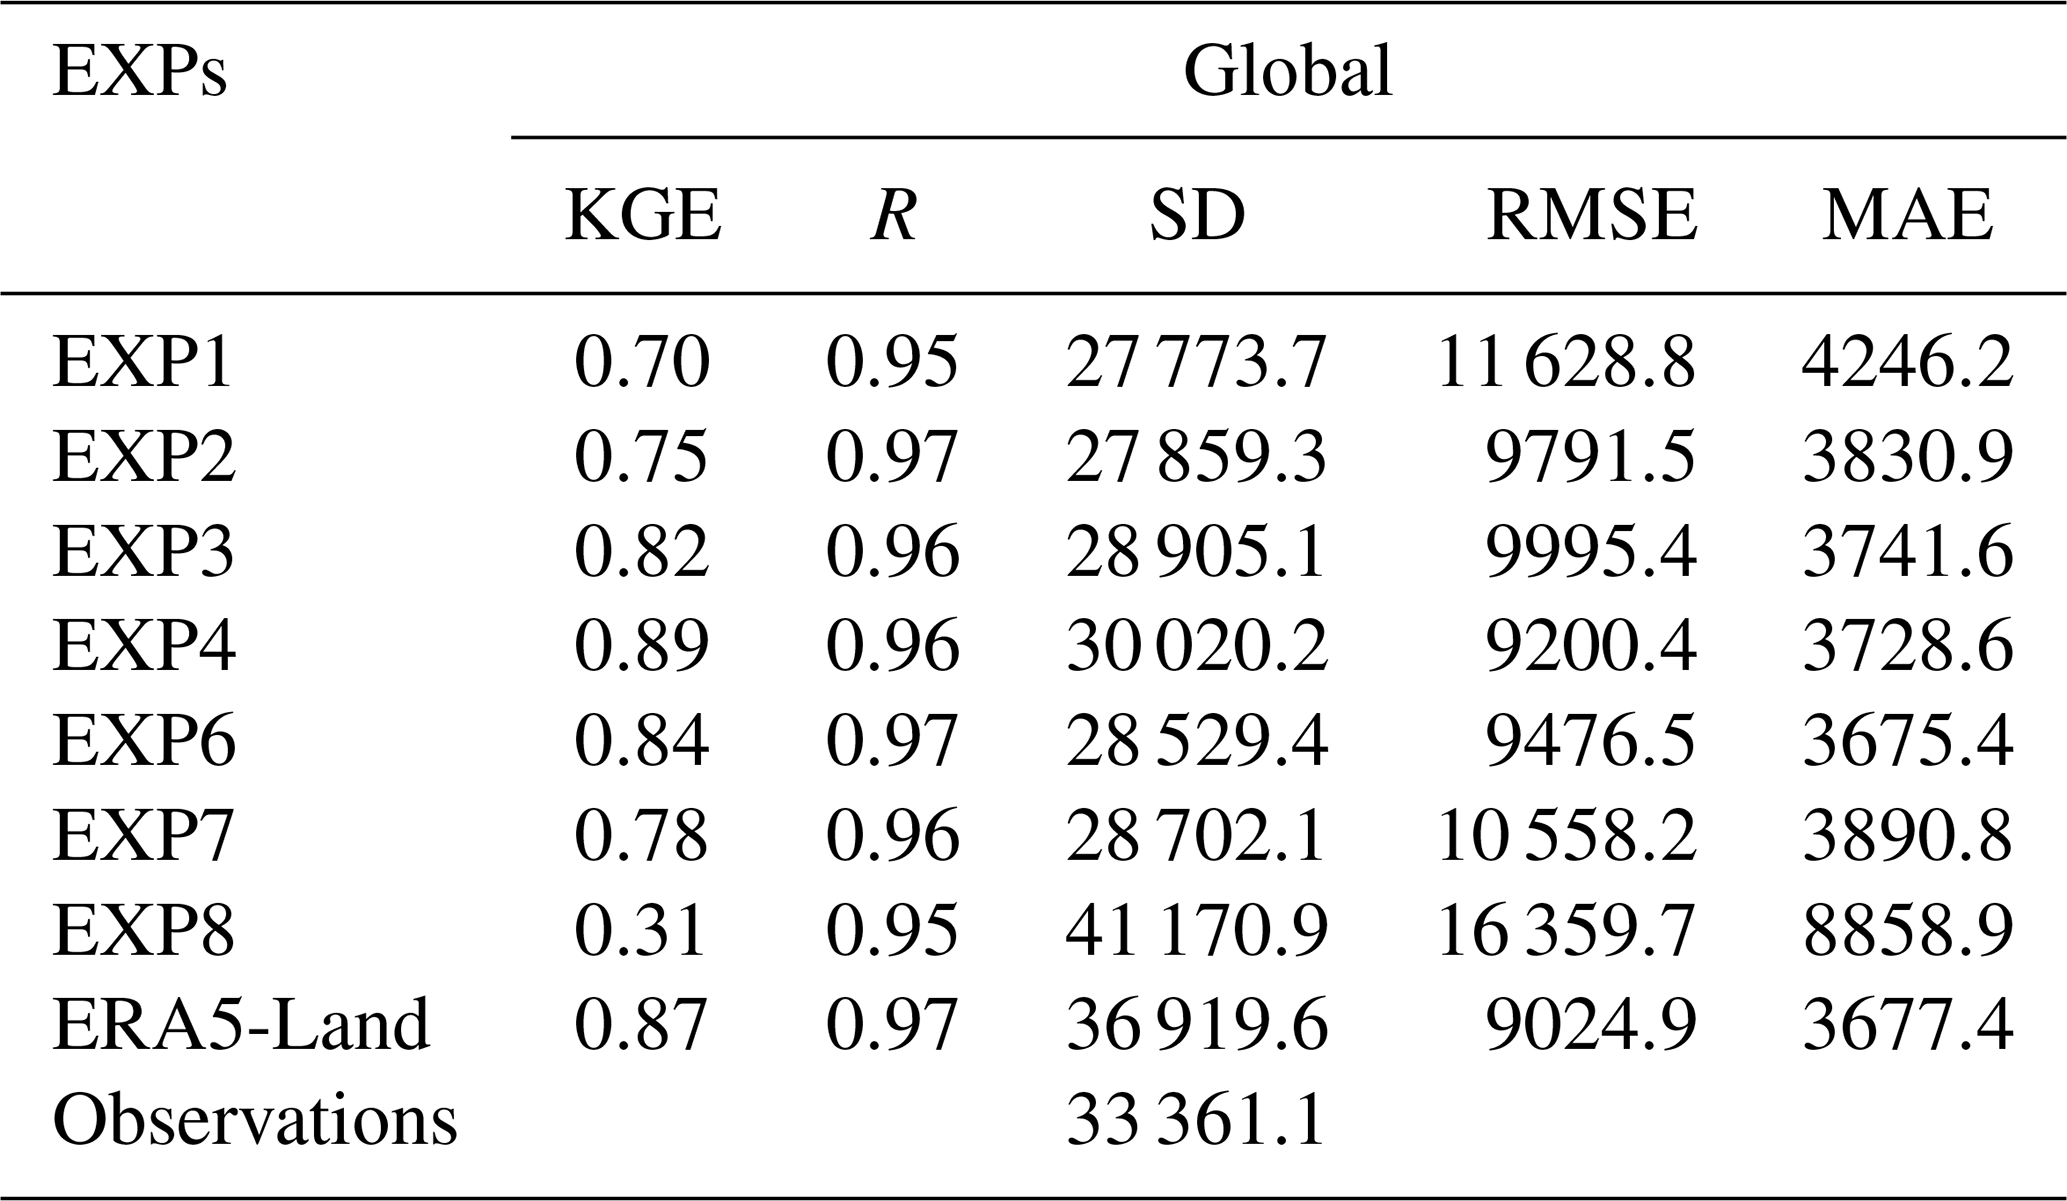
Considering the Noah-MP performances in discharge simulation, on the global scale (Table 2), EXP4 shows the best performance with a KGE of 0.89, a high correlation (0.96), and reasonable error metrics. ERA5-Land also performs well with a high KGE (0.87) and moderate error metrics. EXP3 and EXP6 show strong performance, with KGEs of 0.82 and 0.84, respectively, and moderate error metrics. EXP2 and EXP1 demonstrate balanced performance with KGEs of 0.75 and 0.70, respectively. EXP7 performs moderately with a KGE of 0.78. EXP8, however, performs poorly, with the lowest global KGE (0.31) and the highest SD, RMSE, and MAE, indicating significant overestimation.
Table 3Performance metrics – KGE, RMSE (m3 s−1), and MAE (m3 s−1) – of Noah-MP runoff models in terms of daily discharge across climate regions.
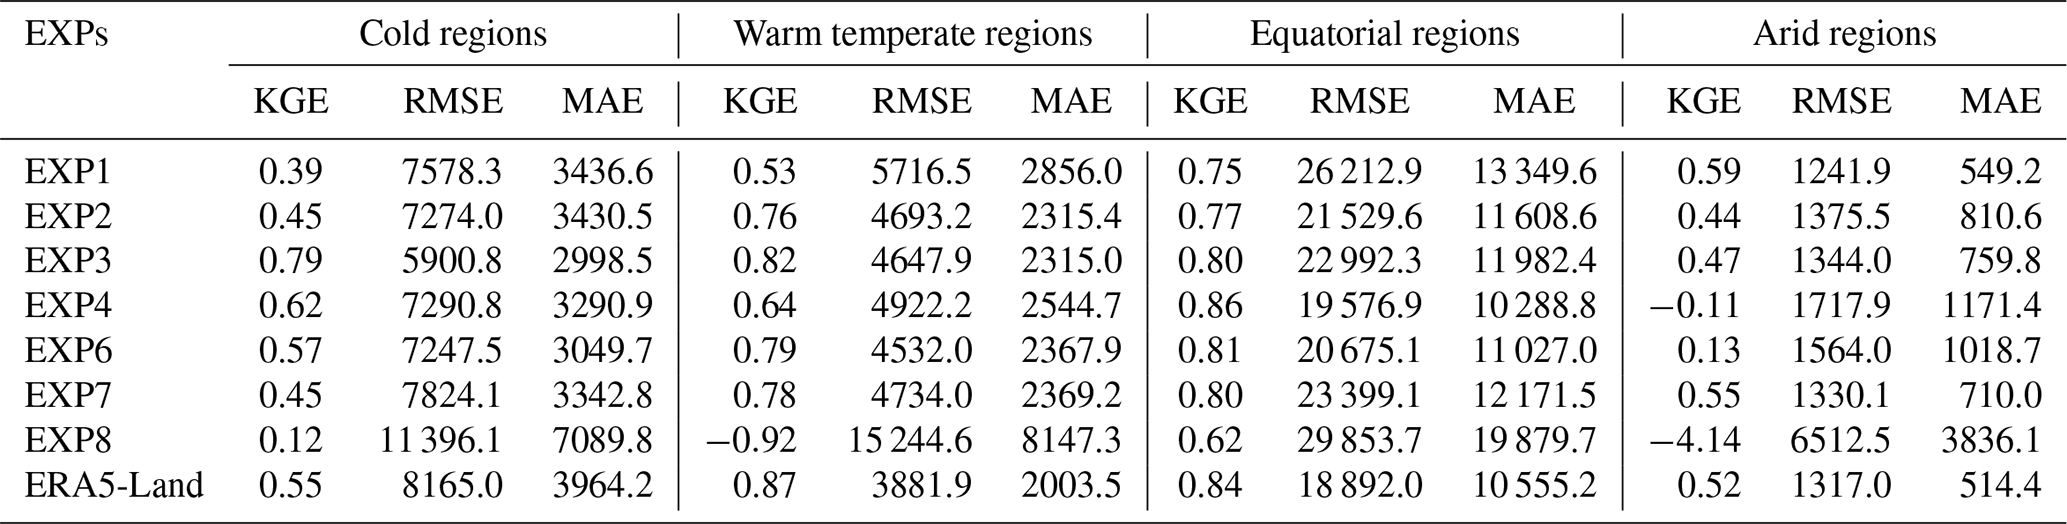
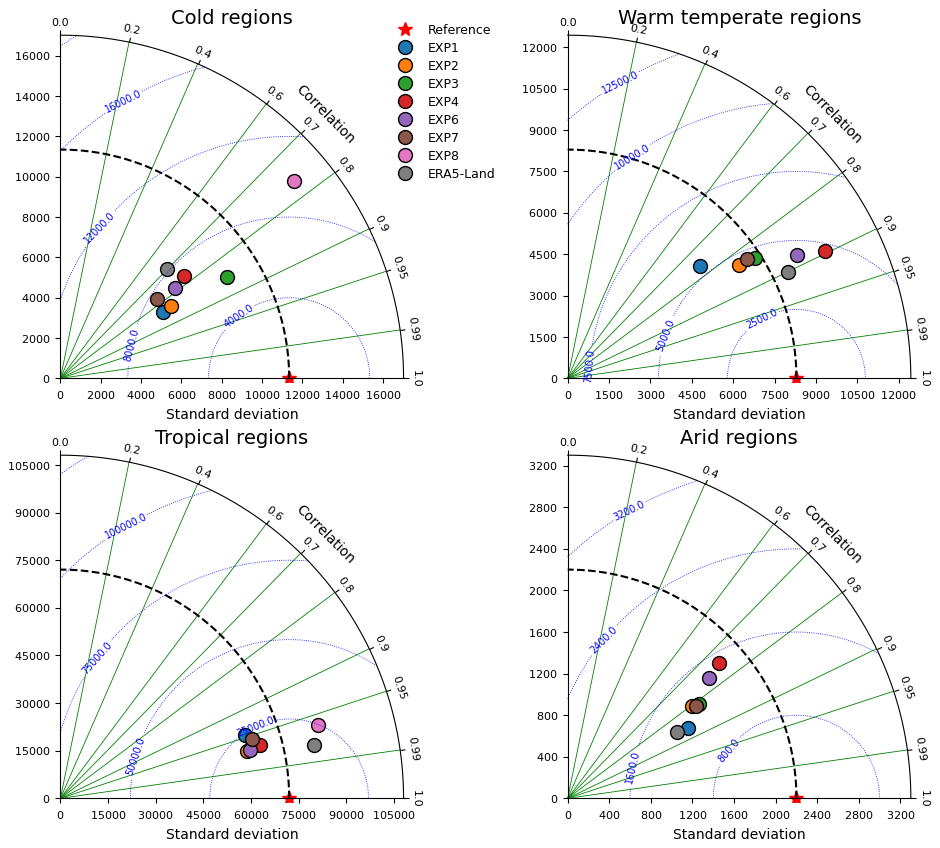
Figure 5Taylor diagram showing the performances of Noah-MP runoff models in terms of daily discharge within four climate regions.
In the cold regions, EXP3 exhibits the highest KGE (0.79) and a high correlation coefficient (0.86), closely matching the observed standard deviation (SD). This model also has the lowest RMSE (5900.8 m3 s−1) and MAE (2998.5 m3 s−1), indicating strong performance. EXP4 and EXP6, as well as ERA5-Land, also perform well, with KGEs of 0.62, 0.57, and 0.55, respectively, and reasonable error metrics. EXP1 and EXP2 perform moderately, with EXP1 showing a lower SD compared to observations, indicating an underestimation of discharge variability. EXP8 performs poorly, with the lowest KGE (0.12) and the highest SD, RMSE, and MAE, indicating significant overestimation.
In warm temperate regions, ERA5-Land achieves the best performance, with the highest KGE (0.87) and correlation coefficient (0.90), closely matching the observed SD and having the lowest RMSE (3881.9 m3 s−1) and MAE (2003.5 m3 s−1). EXP3 also performs well, with a KGE of 0.82 and low error metrics, followed by EXP6 and EXP7, both demonstrating strong performance. EXP2 shows balanced performance, with a KGE of 0.76 and moderate error metrics. EXP1 performs moderately, with a KGE of 0.53. EXP4, despite having a high correlation (0.90), shows overestimation with a higher SD and moderate errors. EXP8 again performs poorly with the lowest KGE (−0.92) and significantly high SD, RMSE, and MAE. Due to its exceptionally high standard deviation, which is 2.4 times higher than the observed SD, EXP8 is considered an outlier in the Taylor diagram and does not appear in Fig. 5. For reference, its correlation coefficient is 0.88.
In equatorial regions, EXP4 and ERA5-Land show the highest performance, with KGEs of 0.86 and 0.84 and a high correlation (0.97 and 0.98), respectively. These models closely align with the observed SD and exhibit the lowest RMSE (19 576.9 and 18 892.0 m3 s−1) and MAE (10 288.8 and 10 555.2 m3 s−1). EXP2, EXP3, EXP6, and EXP7 also perform well, with KGEs of 0.77, 0.80, 0.81, and 0.80, respectively, and present moderate error metrics. EXP1 shows moderate performance, while EXP8 performs poorly with the highest SD, RMSE, and MAE.
In arid regions, ERA5-Land again shows good performance with a KGE of 0.52 and a high correlation (0.85), closely matching the observed SD. EXP1 and EXP7 also perform reasonably well, with KGEs of 0.59 and 0.55, respectively. EXP2 and EXP3 show a balanced performance with moderate KGEs. EXP6 shows lower performance, with a KGE of 0.13 and higher error metrics. EXP4 and EXP8 perform poorly, with EXP8 having the lowest KGE (−4.14) and the highest error metrics, indicating significant overestimation. The high standard deviation of EXP8, which is almost 3 times higher than the observed SD, makes it an outlier in the Taylor diagram; hence, it is not plotted. However, its correlation coefficient is 0.58.
Overall, ERA5-Land and the Schaake approach (EXP3) consistently exhibit strong performance across different climate regions, closely aligning with observed data and demonstrating low error metrics. Other models, such as VIC and BATS (EXP 6 and 4), also perform well in specific regions, while Dynamic VIC (EXP8) consistently underperforms, showing substantial overestimation and high error metrics due to the strong overestimation in runoff.
The results presented are not surprising and are, in fact, reasonable given the characteristics of the different runoff schemes and the regions they are applied to. Schaake, an infiltration-excess runoff scheme (EXP3), performs the best in the northern mid- and high-latitude basins as stated in Decharme (2007), here corresponding to cold regions, i.e. areas dominated by snow and glaciers, which make the frozen soils less permeable. Additionally, the intensity of precipitation in these regions often exceeds the infiltration rate, thereby generating runoff through the infiltration-excess mechanism.
EXP3 also performs exceptionally well in warm temperate regions, which dominate the CONUS (continental United States) domain. This superior performance likely justifies its status as the default option in WRF-Hydro/US National Water Model.
Schaake, along with BATS, VIC, and XAJ (i.e. respectively, EXP3, 4, 6, and 7), shows strong performance in warm temperate and equatorial regions. This aligns with the existing literature indicating that these schemes were developed and tested primarily in humid and sub-humid regions (Hao et al., 2015; Hou et al., 2023).
In arid regions, TOPMODEL with a groundwater (EXP1) stands out, likely due to its incorporation of subsurface and groundwater processes, which enhance groundwater recharge and baseflow contributions – factors that are crucial in arid environments. The same reason could be behind its underestimation of runoff in humid and sub-humid regions. A study by Gan et al. (2019) demonstrated that TOPMODEL with groundwater scheme produces the wettest soil and the greatest evapotranspiration across 10 hydrologic regions of China in contrast to the BATS scheme, which yields the driest soil and the smallest evapotranspiration.
ERA5-Land demonstrates very good performance on both global and regional scales, serving as an excellent reference dataset for runoff benchmarking.
The hydrological basins were also grouped based on dominant soil texture and land cover types to analyse the performance of the Noah-MP model. Additionally, the experiments' performance was correlated with the mean slope as well as the basin size (Fig. S2 and Sect. S2). No significant correlations were found overall, indicating that the Noah-MP model operates effectively regardless of land cover type, soil type, basin size, or topography. This lack of correlation suggests a robust versatility in the model's application, highlighting its capacity to provide reliable simulations across diverse environmental conditions and varied landscape features. The findings reinforce the model's utility in different hydrological contexts, supporting its use in global and regional hydrological studies without the need for extensive customisation based on specific basin characteristics.
Although in general, except for Dynamic VIC, the experiments demonstrated good performance in capturing the overall patterns of river discharge, there remains a considerable bias when applied to more detailed studies, particularly those focusing on high-flow extremes. This bias affects the accuracy in capturing the magnitude, timing, and extent of these events, indicating that further improvements are necessary.
The differences in biases between the runoff schemes are driven by how each scheme handles critical hydrological processes, particularly the partitioning of precipitation into surface and subsurface runoff, as well as the treatment of soil moisture dynamics. Although the formulas for some runoff schemes (Table 1) appear similar, the variations in specific parameters and their physical representations cause distinct biases to emerge.
For example, in the TOPMODEL-based schemes, while the surface runoff follows the same formula across both experiments, subsurface runoff differs in the way it is computed. In EXP1, subsurface runoff is influenced by the soil hydraulic conductivity of the first unsaturated layer above the water table, while in EXP2, subsurface runoff is controlled by a fixed base flow coefficient and a fixed runoff decay factor. These differences lead to distinct sensitivities in how each scheme responds to variations in soil properties and terrain. The water table depth also plays a pivotal role in the calculation of subsurface flow in these schemes, introducing differences in regions with shallow or deep groundwater. These variations affect the magnitude and timing of runoff, which ultimately manifests as bias in the discharge simulation.
The surface runoff in the TOPMODEL-based schemes and BATS also shares the same formula; however, the differences lie in how the saturated area fraction (fsat) is calculated. In the TOPMODEL-based schemes, fsat depends on the water table depth and a runoff decay factor, which differs between the two schemes, while in BATS, it is computed as the fourth power of the degree of saturation in the top 2 m of soil. This distinction between the two approaches introduces variability in how surface runoff is generated across regions with differing soil moisture profiles and saturation conditions. The BATS scheme also handles subsurface runoff differently using a free-drainage approach, where it is calculated as the product of soil hydraulic conductivity and . This method leads to a distinct response to soil permeability and introduces varying biases depending on the frozen or compacted soil conditions.
For the other free-drainage schemes, including Schaake, VIC, XAJ, and Dynamic VIC, the calculation of subsurface runoff follows a similar approach. However, the key differences between these schemes lie in how surface runoff is generated. In the Schaake scheme, surface runoff is governed by an infiltration-excess mechanism, which depends on the total maximum holdable soil water content and the rate at which the soil can infiltrate water. This mechanism tends to produce lower biases in regions where infiltration-excess processes dominate, such as cold regions (Decharme, 2007).
The VIC scheme, on the other hand, calculates surface runoff based on the infiltration and maximum infiltration capacity of the soil, which introduces a different partitioning of rainfall into surface and subsurface components. The scheme's reliance on current soil moisture conditions, particularly in the tension water storage in the top layers of the soil, leads to varying biases depending on whether the region is experiencing wet or dry conditions. Similarly, XAJ introduces a unique approach using a shape parameter to calculate surface runoff, which adjusts runoff generation based on the catchment's topographic and moisture characteristics. This leads to differences in performance depending on the terrain and hydrological profile of the region.
Dynamic VIC incorporates both infiltration-excess and saturation-excess runoff, further complicating the balance between surface and subsurface flow. The detailed soil moisture capacity parameters used in this scheme not only contribute to its dynamic nature but also make it more sensitive to inaccuracies in modelling infiltration and saturation, leading to large biases in discharge performance. The different ways each scheme handles these physical processes – be it through the treatment of soil moisture, the representation of surface and subsurface interactions, or the response to topographic and climatic variability – accounts for the differences in bias observed across the experiments. Understanding these physical distinctions is essential for improving the accuracy of runoff and discharge simulations, especially in regions with complex hydrological behaviour.
Each runoff scheme, with its unique conceptual framework, involves a set of tuneable variables and parameters, such as soil depth, maximum surface saturated fraction (), saturated value of soil moisture, and others summarised in Table S5. An area for improvement would involve calibrating these parameters, particularly at finer resolutions, to more precisely simulate runoff behaviour across diverse regions. For example, is often set as a global mean, but recent studies, such as Zhang et al. (2022), illustrate that using spatially variable values informed by remote sensing data (e.g. GIEMS-2) could yield more accurate regional simulations. Similarly, the fixed soil depth used in each scheme could be improved through further spatial variable parameterisation within Noah-MP, which may help modulate runoff according to regional soil profiles and enhance the model's representation of subsurface flow dynamics. By exploring such refinements, future applications of these models could achieve better performance, especially when simulating high-flow events critical for flood risk assessments and water resources management.
We would like to underline that the obtained results and this study are biased and constrained by the availability of high-quality discharge observations within the considered study period. This limitation, along with the need for a consistent evaluation period and the focus on less regulated basins, conditions the number of basins selected and their distribution within each climate region.
3.5 Implications for global discharge simulation
This study provides a comprehensive analysis of how distinct Noah-MP runoff schemes impact discharge simulation in a global hydrological context, paving the way for enhanced modelling accuracy across different climate zones. By revealing the performance variability of different runoff schemes – such as Schaake, BATS, VIC, and XAJ – across cold, warm temperate, tropical, and arid regions, this research suggests that tailored scheme selection could improve discharge simulations for specific hydrological conditions. For instance, Schaake, BATS, and VIC exhibited reduced biases in warm temperate and tropical regions, while TOPMODEL-based schemes with groundwater performed notably better in arid areas, underscoring the need for strategic scheme selection based on regional climate and hydrological characteristics. This targeted approach to scheme selection can minimise bias and enhance model reliability in both regional and global discharge simulations, improving the accuracy of water resources management.
This study also addresses a crucial challenge in hydrological modelling: the significant biases in high-flow extremes of certain schemes. Given that accurate high-flow discharge predictions are essential for flood forecasting and disaster management, this finding suggests an urgent need for refining high-flow calibration. This enhancement is particularly relevant for global flood risk management as it enables more reliable flood predictions that are vital for preparing for extreme weather events. By identifying critical parameters and proposing spatially variable adjustments, such as using data from sources like remote sensing products, this study sets a practical foundation for developing global calibration strategies that could yield more accurate discharge predictions (Beck et al., 2017). These strategies could be applied universally across a range of climates, creating a more adaptable global model without extensive customisation.
This research further advances current hydrological modelling by demonstrating the value of multi-model comparisons, which allow for a holistic approach to discharge simulation. Rather than depending on a single runoff scheme and potentially inheriting its limitations (Diks and Vrugt, 2010; Shoaib et al., 2018), a multi-scheme approach enables researchers to capture river discharge dynamics more comprehensively (Georgakakos et al., 2004; Huo et al., 2019). This approach aligns with a broader hydrological perspective that considers the interactions between multiple runoff dynamics, offering a pathway for more nuanced simulations that acknowledge the strengths and limitations of each scheme.
For coupled ocean–atmosphere regional models lacking complete river and discharge representations, integrating findings from this study could significantly improve their hydrological modules, particularly in complex regions like the Mediterranean, where the freshwater flux from rivers remarkably affects the salinity near the coast close to river mouths (e.g. Reale et al., 2020). These refinements are expected to enhance the overall representation of the global water cycle within climate models, providing more realistic freshwater flux predictions and supporting more accurate climate projections.
Additionally, this study's analysis of seasonal and regional discharge cycles reveals new insights into the variability in discharge patterns across climates. This detailed understanding could facilitate the development of models better suited to capture seasonal dynamics in tropical and temperate regions, where runoff schemes like Schaake and ERA5-Land-driven simulations performed particularly well. By capturing the discharge seasonality more accurately, our findings have direct applications for both short- and long-term forecasting and water resources planning (Pires and Martins, 2024), especially in regions facing pronounced seasonal changes in water availability.
Furthermore, the findings related to groundwater interactions underscore the importance of accurate groundwater dynamics in discharge simulation, especially in arid regions. The effectiveness of TOPMODEL-based schemes with groundwater dynamics in these areas suggests that future modelling efforts should prioritise improving groundwater parameterisations, particularly where groundwater plays a critical role in maintaining streamflow. This refinement could improve discharge simulations (Decharme and Colin, 2024), especially in water-scarce areas, supporting more efficient resource allocation and resilience against drought.
Finally, the implications of these findings extend to climate adaptation strategies, where reliable hydrological models are critical for anticipating shifts in water availability under changing climates. By advancing the accuracy of discharge simulations, particularly in high-flow and seasonal scenarios, this research provides a basis for better-informed adaptation planning, enabling decision-makers to prepare for anticipated changes in river flow and water availability. This study not only enhances current global hydrological modelling but also lays a foundation for more resilient water resources management, which is increasingly critical as climate variability challenges water availability worldwide.
This study evaluated the performance of seven different Noah-MP runoff schemes in discharge simulations, as simulated using the CaMa-Flood river routing model. Using ERA5-Land runoff data as a benchmark for runoff evaluation and streamflow observations for discharge evaluation across various climatic regions, key findings from the analysis reveal significant differences in how each scheme handles runoff dynamics. These findings have important implications for global hydrological modelling and water resources management.
The progression from TOPMODEL-based schemes through Schaake, BATS, and other saturation-excess schemes showed a trend of decreasing bias magnitudes and improved performance in simulating global runoff dynamics. TOPMODEL with groundwater and TOPMODEL with an equilibrium water table significantly underestimated runoff in many regions, particularly in the Northern Hemisphere, while runoff schemes like Schaake, BATS, VIC, and XAJ demonstrated progressively better performance with relatively lower biases. Dynamic VIC consistently overestimated runoff across nearly all regions.
Seasonal cycle analysis using CaMa-Flood driven by different Noah-MP runoff schemes highlighted considerable regional and seasonal variability in discharge patterns. ERA5-Land runoff-driven discharge and several Noah-MP experiments successfully replicated the general patterns of mean seasonal discharge cycles across diverse river basins. However, Dynamic VIC showed a significant positive bias, indicating a tendency to overestimate discharge globally due to the strong runoff overestimation.
Globally, our findings reveal that EXP4 offers the best performance in discharge simulation, achieving the highest KGE, strong temporal correlation, and balanced error metrics. This indicates its robust applicability for capturing the daily discharge dynamics on a global scale. ERA5-Land and other models such as Schaake and VIC also demonstrate solid performance, particularly in regions with distinct hydrological characteristics.
Regionally, ERA5-Land and the Schaake scheme consistently exhibited strong performance across different climate regions, closely aligning with observed data and demonstrating low error metrics. In contrast, TOPMODEL and Dynamic VIC showed higher error metrics, with more significant biases for Dynamic VIC, indicating the need for further refinement, although TOPMODEL with groundwater stands out as the most effective in arid regions.
The Noah-MP model demonstrated robust versatility, performing effectively regardless of land cover type, soil type, basin size, or topography. This suggests that the model can provide reliable simulations across diverse environmental conditions without extensive customisation.
While the experiments generally captured the overall patterns of river discharge, significant biases remained, particularly in high-flow extremes. This underscores the need for ongoing calibration of tuneable variables and parameters, especially at finer resolutions, to enhance the accuracy and reliability of hydrological simulations.
In conclusion, this study transcends the limitations of individual schemes and specific regions, providing a holistic assessment of runoff dynamics on a global scale. The analysis underscores the significant impact that the selection of a particular runoff scheme can have on discharge patterns and bias, emphasising the necessity for careful scheme selection based on specific hydrological contexts. Enhanced calibration and refinement efforts are essential for achieving more accurate hydrological predictions, which are vital for effective water resources management and climate adaptation strategies across diverse global environments.
GRDC discharge observations can be obtained from https://grdc.bafg.de/data/data_portal/ (GRDC, 2024). ERA5-Land data, provided by the European Centre for Medium-Range Weather Forecast (ECMWF), can be freely downloaded from the Copernicus Data Store (https://doi.org/10.24381/cds.e2161bac (Muñoz Sabater, 2019)). Noah-MP and CaMa-Flood models can be downloaded from https://github.com/NCAR/noahmp (NSF NCAR, 2023) and https://github.com/global-hydrodynamics/CaMa-Flood_v4 (Global Hydrodynamics Lab, 2023), respectively. Enquiries about output data availability should be directed to the authors.
The supplement related to this article is available online at https://doi.org/10.5194/hess-29-1221-2025-supplement.
MH, GF, AA, and CH: conceptualisation and methodology; MH: formal analysis, funding acquisition, investigation, visualisation, and writing (original draft preparation); MH and AA: data collection, curation, and simulations; GF and AA: supervision; GF, AA, CH, and TSL: validation and writing (review and editing). All authors have read and agreed to the published version of the paper.
The contact author has declared that none of the authors has any competing interests.
Publisher's note: Copernicus Publications remains neutral with regard to jurisdictional claims made in the text, published maps, institutional affiliations, or any other geographical representation in this paper. While Copernicus Publications makes every effort to include appropriate place names, the final responsibility lies with the authors.
We would like to thank Stefan Hagemann and Stephen Birkinshaw for providing us with some discharge observation data and Day Yamazaki for his valuable help in setting up the CaMa-Flood model.
This paper and related research have been conducted during and with the support of the Italian PhD course in Sustainable Development and Climate change (https://www.phd-sdc.it, last access: 10 June 2024) at the University School for Advanced Studies IUSS, developed within the framework of the project “Dipartimento di Eccellenza 2023–2027”, with financial support from the ICSC Italian Research Center on High-Performance Computing, Big Data and Quantum Computing and funding from the European Union Next-GenerationEU (National Recovery and Resilience Plan-NRRP, Mission 4, Component 2, Investment 1.4-D.D: 3138 16/12/2021, CN00000013). This research has also been supported by the CIHEAM Prize for the Best MSc Thesis 2022.
This paper was edited by Alexander Gruber and reviewed by Ehsan Sharifi and one anonymous referee.
Ball, J. T., Woodrow, I. E., and Berry, J. A.: A Model Predicting Stomatal Conductance and its Contribution to the Control of Photosynthesis under Different Environmental Conditions, in: Progress in Photosynthesis Research: Volume 4 Proceedings of the VIIth International Congress on Photosynthesis Providence, edited by: Biggins, J., Rhode Island, USA, 10–15 August 1986, Springer Netherlands, Dordrecht, 221–224, https://doi.org/10.1007/978-94-017-0519-6_48, 1987.
Balsamo, G., Beljaars, A., Scipal, K., Viterbo, P., van den Hurk, B., Hirschi, M., and Betts, A. K.: A Revised Hydrology for the ECMWF Model: Verification from Field Site to Terrestrial Water Storage and Impact in the Integrated Forecast System, J. Hydrometeorol., 10, 623–643, https://doi.org/10.1175/2008JHM1068.1, 2009.
Bates, P. D., Horritt, M. S., and Fewtrell, T. J.: A simple inertial formulation of the shallow water equations for efficient two-dimensional flood inundation modelling, J. Hydrol., 387, 33–45, https://doi.org/10.1016/j.jhydrol.2010.03.027, 2010.
Beck, H. E., van Dijk, A. I. J. M., de Roo, A., Dutra, E., Fink, G., Orth, R., and Schellekens, J.: Global evaluation of runoff from 10 state-of-the-art hydrological models, Hydrol. Earth Syst. Sci., 21, 2881–2903, https://doi.org/10.5194/hess-21-2881-2017, 2017.
Bonan, G. B.: Land surface model (LSM version 1.0) for ecological, hydrological, and atmospheric studies: Technical description and users guide, Technical note, National Center for Atmospheric Research, Boulder, CO United States, https://doi.org/10.5065/D6DF6P5X, 1996.
Chang, M., Liao, W., Wang, X., Zhang, Q., Chen, W., Wu, Z., and Hu, Z.: An optimal ensemble of the Noah-MP land surface model for simulating surface heat fluxes over a typical subtropical forest in South China, Agr. Forest Meteorol., 281, 107815, https://doi.org/10.1016/j.agrformet.2019.107815, 2020.
Chen, F. and Dudhia, J.: Coupling an Advanced Land Surface–Hydrology Model with the Penn State–NCAR MM5 Modeling System. Part I: Model Implementation and Sensitivity, Mon. Weather Rev., 129, 569–585, https://doi.org/10.1175/1520-0493(2001)129<0569:CAALSH>2.0.CO;2, 2001.
Chen, F., Mitchell, K., Schaake, J., Xue, Y., Pan, H.-L., Koren, V., Duan, Q. Y., Ek, M., and Betts, A.: Modeling of land surface evaporation by four schemes and comparison with FIFE observations, J. Geophys. Res.-Atmos., 101, 7251–7268, https://doi.org/10.1029/95JD02165, 1996.
Chen, F., Janjić, Z., and Mitchell, K.: Impact of Atmospheric Surface-layer Parameterizations in the new Land-surface Scheme of the NCEP Mesoscale Eta Model, Bound. Lay. Meteorol., 85, 391–421, https://doi.org/10.1023/A:1000531001463, 1997.
Clark, M. P., Fan, Y., Lawrence, D. M., Adam, J. C., Bolster, D., Gochis, D. J., Hooper, R. P., Kumar, M., Leung, L. R., Mackay, D. S., Maxwell, R. M., Shen, C., Swenson, S. C., and Zeng, X.: Improving the representation of hydrologic processes in Earth System Models, Water Resour. Res., 51, 5929–5956, https://doi.org/10.1002/2015WR017096, 2015.
David, C. H., Hobbs, J. M., Turmon, M. J., Emery, C. M., Reager, J. T., and Famiglietti, J. S.: Analytical Propagation of Runoff Uncertainty Into Discharge Uncertainty Through a Large River Network, Geophys. Res. Lett., 46, 8102–8113, https://doi.org/10.1029/2019GL083342, 2019.
Decharme, B.: Influence of runoff parameterization on continental hydrology: Comparison between the Noah and the ISBA land surface models, J. Geophys. Res.-Atmos., 112, D19108, https://doi.org/10.1029/2007JD008463, 2007.
Decharme, B. and Colin, J.: Influence of Floodplains and Groundwater Dynamics on the Present-Day Climate simulated by the CNRM Model, EGUsphere [preprint], https://doi.org/10.5194/egusphere-2024-3091, 2024.
Dickinson, R. E.: Land Surface Processes and Climate–Surface Albedos and Energy Balance, in: Advances in Geophysics, 25, edited by: Saltzman, B., Elsevier, 305–353, https://doi.org/10.1016/S0065-2687(08)60176-4, 1983.
Dickinson, R. E., Shaikh, M., Bryant, R., and Graumlich, L.: Interactive Canopies for a Climate Model, J. Climate, 11, 2823–2836, https://doi.org/10.1175/1520-0442(1998)011<2823:ICFACM>2.0.CO;2, 1998.
Diks, C. G. H. and Vrugt, J. A.: Comparison of point forecast accuracy of model averaging methods in hydrologic applications, Stoch. Env. Res. Risk A., 24, 809–820, https://doi.org/10.1007/s00477-010-0378-z, 2010.
Dümenil, L. and Todini, E.: A rainfall–runoff scheme for use in the Hamburg climate model, in: Advances in Theoretical Hydrology, Chapter 9, edited by: O'Kane, J. P., Elsevier, Amsterdam, 129–157, https://doi.org/10.1016/B978-0-444-89831-9.50016-8, 1992.
Dutta, R. and Markonis, Y.: Does ERA5-land capture the changes in the terrestrial hydrological cycle across the globe?, Environ. Res. Lett., 19, 024054, https://doi.org/10.1088/1748-9326/ad1d3a, 2024.
Ek, M. B., Mitchell, K. E., Lin, Y., Rogers, E., Grunmann, P., Koren, V., Gayno, G., and Tarpley, J. D.: Implementation of Noah land surface model advances in the National Centers for Environmental Prediction operational mesoscale Eta model, J. Geophys. Res.-Atmos., 108, 8851, https://doi.org/10.1029/2002JD003296, 2003.
Fan, Y., Miguez-Macho, G., Weaver, C. P., Walko, R., and Robock, A.: Incorporating water table dynamics in climate modeling: 1. Water table observations and equilibrium water table simulations, J. Geophys. Res.-Atmos., 112, D10125, https://doi.org/10.1029/2006JD008111, 2007.
Fang, Y.-H., Zhang, X., Corbari, C., Mancini, M., Niu, G.-Y., and Zeng, W.: Improving the Xin'anjiang hydrological model based on mass–energy balance, Hydrol. Earth Syst. Sci., 21, 3359–3375, https://doi.org/10.5194/hess-21-3359-2017, 2017.
Gan, Y., Liang, X.-Z., Duan, Q., Chen, F., Li, J., and Zhang, Y.: Assessment and Reduction of the Physical Parameterization Uncertainty for Noah-MP Land Surface Model, Water Resour. Res., 55, 5518–5538, https://doi.org/10.1029/2019WR024814, 2019.
Georgakakos, K. P., Seo, D.-J., Gupta, H., Schaake, J., and Butts, M. B.: Towards the characterization of streamflow simulation uncertainty through multimodel ensembles, J. Hydrol., 298, 222–241, https://doi.org/10.1016/j.jhydrol.2004.03.037, 2004.
Gochis, D. J., Barlage, M., Cabell, R., Casali, M., Dugger, A., Fitzgerald, K., Karsten, L., Mcallister, M., McCreight, J., Rafieeinasab, A., Read, L., Sampson, K., Yates, D., and Zhang, Y.: The WRF-Hydro Modeling System Technical Description, (Version 5.1.1), NCAR Technical Note, 108 pp., https://ral.ucar.edu/sites/default/files/docs/water/wrf-hydro-v511-technical-description.pdf (last access: 27 February 2025), 2020.
Global Hydrodynamics Lab: CaMa-Flood v4, GitHub [code], https://github.com/global-hydrodynamics/CaMa-Flood_v4 (last access: 11 December 2023), 2023.
GRDC: Data Portal, https://grdc.bafg.de/data/data_portal/ (last access: 28 April 2024), 2024.
Gupta, H. V, Kling, H., Yilmaz, K. K., and Martinez, G. F.: Decomposition of the mean squared error and NSE performance criteria: Implications for improving hydrological modelling, J. Hydrol., 377, 80–91, https://doi.org/10.1016/j.jhydrol.2009.08.003, 2009.
Hagemann, S. and Stacke, T.: Complementing ERA5 and E-OBS with high-resolution river discharge over Europe, Oceanologia, 65, 230–248, https://doi.org/10.1016/j.oceano.2022.07.003, 2023.
Hao, F., Sun, M., Geng, X., Huang, W., and Ouyang, W.: Coupling the Xinanjiang model with geomorphologic instantaneous unit hydrograph for flood forecasting in northeast China, Int. Soil Water Conserv. Research, 3, 66–76, https://doi.org/10.1016/j.iswcr.2015.03.004, 2015.
He, C., Valayamkunnath, P., Barlage, M., Chen, F., Gochis, D., Cabell, R., Schneider, T., Rasmussen, R., Niu, G.-Y., Yang, Z.-L., Niyogi, D., and Ek, M.: Modernizing the open-source community Noah with multi-parameterization options (Noah-MP) land surface model (version 5.0) with enhanced modularity, interoperability, and applicability, Geosci. Model Dev., 16, 5131–5151, https://doi.org/10.5194/gmd-16-5131-2023, 2023a.
He, C., Valayamkunnath, P., Barlage, M., Gochis, D., Cabell, R., Schneider, T., Rasmussen, R., Niu, G.-Y., Yang, Z.-L., Niyogi, D., and Ek, M.: The Community Noah-MP Land Surface Modeling System Technical Description Version 5.0, NCAR Tech. Note, No. NCAR/TN-575+STR, https://doi.org/10.5065/ew8g-yr95, 2023b.
Heber Green, W. and Ampt, G. A.: Studies on Soil Phyics, J. Agr. Sci., 4, 1–24, https://doi.org/10.1017/S0021859600001441, 1911.
Hirabayashi, Y., Mahendran, R., Koirala, S., Konoshima, L., Yamazaki, D., Watanabe, S., Kim, H., and Kanae, S.: Global flood risk under climate change, Nat. Clim. Change, 3, 816–821, https://doi.org/10.1038/nclimate1911, 2013.
Hou, Y., Guo, H., Yang, Y., and Liu, W.: Global Evaluation of Runoff Simulation From Climate, Hydrological and Land Surface Models, Water Resour. Res., 59, e2021WR031817, https://doi.org/10.1029/2021WR031817, 2023.
Huo, W., Li, Z., Wang, J., Yao, C., Zhang, K., and Huang, Y.: Multiple hydrological models comparison and an improved Bayesian model averaging approach for ensemble prediction over semi-humid regions, Stoch. Env. Res. Risk A., 33, 217–238, https://doi.org/10.1007/s00477-018-1600-7, 2019.
Jayawardena, A. W. and Zhou, M. C.: A modified spatial soil moisture storage capacity distribution curve for the Xinanjiang model, J. Hydrol., 227, 93–113, https://doi.org/10.1016/S0022-1694(99)00173-0, 2000.
Kottek, M., Grieser, J., Beck, C., Rudolf, B., and Rubel, F.: World Map of the Köppen-Geiger climate classification updated, Meteorol. Z., 15, 259263, https://doi.org/10.1127/0941-2948/2006/0130, 2006.
Li, J., Chen, F., Lu, X., Gong, W., Zhang, G., and Gan, Y.: Quantifying Contributions of Uncertainties in Physical Parameterization Schemes and Model Parameters to Overall Errors in Noah-MP Dynamic Vegetation Modeling, J. Adv. Model. Earth Sy., 12, e2019MS001914, https://doi.org/10.1029/2019MS001914, 2020.
Li, J., Miao, C., Zhang, G., Fang, Y.-H., Shangguan, W., and Niu, G.-Y.: Global Evaluation of the Noah-MP Land Surface Model and Suggestions for Selecting Parameterization Schemes, J. Geophys. Res.-Atmos., 127, e2021JD035753, https://doi.org/10.1029/2021JD035753, 2022.
Liang, J., Yang, Z., and Lin, P.: Systematic Hydrological Evaluation of the Noah-MP Land Surface Model over China, Adv. Atmos. Sci., 36, 1171–1187, https://doi.org/10.1007/s00376-019-9016-y, 2019.
Liang, X. and Xie, Z.: A new surface runoff parameterization with subgrid-scale soil heterogeneity for land surface models, Adv. Water Resour., 24, 1173–1193, https://doi.org/10.1016/S0309-1708(01)00032-X, 2001.
Liang, X. and Xie, Z.: Important factors in land–atmosphere interactions: surface runoff generations and interactions between surface and groundwater, Global Planet. Change, 38, 101–114, https://doi.org/10.1016/S0921-8181(03)00012-2, 2003.
Liang, X., Lettenmaier, D. P., Wood, E. F., and Burges, S. J.: A simple hydrologically based model of land surface water and energy fluxes for general circulation models, J. Geophys. Res.-Atmos., 99, 14415–14428, https://doi.org/10.1029/94JD00483, 1994.
Liang, Y.-C., Lo, M.-H., Lan, C.-W., Seo, H., Ummenhofer, C. C., Yeager, S., Wu, R.-J., and Steffen, J. D.: Amplified seasonal cycle in hydroclimate over the Amazon river basin and its plume region, Nat. Commun., 11, 4390, https://doi.org/10.1038/s41467-020-18187-0, 2020.
Liu, L., Yi, Y., Jiang, H., Ran, Y., and Chen, D.: ERA5-Land overestimates runoff coefficient but underestimates runoff recession rate in the central Tibetan permafrost region, J. Hydrol. Reg. Stud., 53, 101792, https://doi.org/10.1016/j.ejrh.2024.101792, 2024.
Miguez-Macho, G., Fan, Y., Weaver, C. P., Walko, R., and Robock, A.: Incorporating water table dynamics in climate modeling: 2. Formulation, validation, and soil moisture simulation, J. Geophys. Res.-Atmos., 112, D13108, https://doi.org/10.1029/2006JD008112, 2007.
Miller, D. A. and White, R. A.: A Conterminous United States Multilayer Soil Characteristics Dataset for Regional Climate and Hydrology Modeling, Earth Interact., 2, 1–26, https://doi.org/10.1175/1087-3562(1998)002<0001:ACUSMS>2.3.CO;2, 1998.
Monin, A. S. and Obukhov, A. M.: Basic laws of turbulent mixing in the atmosphere near the ground, vol. 24, Tr. Akad. Nauk. SSSR Geofiz. Inst., 163–187, 1954.
Muñoz Sabater, J.: ERA5-Land hourly data from 1950 to present, Copernicus Climate Change Service (C3S) Climate Data Store (CDS) [data set], https://doi.org/10.24381/cds.e2161bac, 2019.
Muñoz-Sabater, J., Dutra, E., Agustí-Panareda, A., Albergel, C., Arduini, G., Balsamo, G., Boussetta, S., Choulga, M., Harrigan, S., Hersbach, H., Martens, B., Miralles, D. G., Piles, M., Rodríguez-Fernández, N. J., Zsoter, E., Buontempo, C., and Thépaut, J.-N.: ERA5-Land: a state-of-the-art global reanalysis dataset for land applications, Earth Syst. Sci. Data, 13, 4349–4383, https://doi.org/10.5194/essd-13-4349-2021, 2021.
Nguyen, A. D., Le Nguyen, P., Vu, V. H., Pham, Q. V., Nguyen, V. H., Nguyen, M. H., Nguyen, T. H., and Nguyen, K.: Accurate discharge and water level forecasting using ensemble learning with genetic algorithm and singular spectrum analysis-based denoising, Sci. Rep., 12, 19870, https://doi.org/10.1038/s41598-022-22057-8, 2022.
Niu, G. Y. and Yang, Z.: The Community Noah Land Surface Model (LSM) with Multi-Physics Options, User's Guide, Center for Integrated Earth System Science, The University of Texas at Austin, Austin, TX, USA, https://www.jsg.utexas.edu/noah-mp/users-guide/ (last access: 27 February 2025), 2011.
Niu, G.-Y. and Yang, Z.-L.: Effects of Frozen Soil on Snowmelt Runoff and Soil Water Storage at a Continental Scale, J. Hydrometeorol., 7, 937–952, https://doi.org/10.1175/JHM538.1, 2006.
Niu, G.-Y., Yang, Z.-L., Dickinson, R. E., and Gulden, L. E.: A simple TOPMODEL-based runoff parameterization (SIMTOP) for use in global climate models, J. Geophys. Res.-Atmos., 110, D21106, https://doi.org/10.1029/2005JD006111, 2005.
Niu, G.-Y., Yang, Z.-L., Dickinson, R. E., Gulden, L. E., and Su, H.: Development of a simple groundwater model for use in climate models and evaluation with Gravity Recovery and Climate Experiment data, J. Geophys. Res.-Atmos., 112, D07103, https://doi.org/10.1029/2006JD007522, 2007.
Niu, G.-Y., Yang, Z.-L., Mitchell, K. E., Chen, F., Ek, M. B., Barlage, M., Kumar, A., Manning, K., Niyogi, D., Rosero, E., Tewari, M., and Xia, Y.: The community Noah land surface model with multiparameterization options (Noah-MP): 1. Model description and evaluation with local-scale measurements, J. Geophys. Res.-Atmos., 116, D12109, https://doi.org/10.1029/2010JD015139, 2011.
NSF National Center for Atmospheric Research (NSF NCAR): Noah-MP Land Surface Model, version 5.0.0., GitHub [code], https://github.com/NCAR/noahmp (last access: 5 June 2023), 2023.
Oda, T., Iwasaki, K., Egusa, T., Kubota, T., Iwagami, S., Iida, S., Momiyama, H., and Shimizu, T.: Scale-Dependent Inter-Catchment Groundwater Flow in Forested Catchments: Analysis of Multi-Catchment Water Balance Observations in Japan, Water Resour. Res., 60, e2024WR037161, https://doi.org/10.1029/2024WR037161, 2024.
Philip, J. R.: The infiltration joining problem, Water Resour. Res., 23, 2239–2245, https://doi.org/10.1029/WR023i012p02239, 1987.
Pires, C. and Martins, M. V: Enhancing Water Management: A Comparative Analysis of Time Series Prediction Models for Distributed Water Flow in Supply Networks, Water, 16, 1827, https://doi.org/10.3390/w16131827, 2024.
Reale, M., Giorgi, F., Solidoro, C., Di Biagio, V., Di Sante, F., Mariotti, L., Farneti, R., and Sannino, G.: The Regional Earth System Model RegCM-ES: Evaluation of the Mediterranean Climate and Marine Biogeochemistry, J. Adv. Model. Earth Sy., 12, e2019MS001812, https://doi.org/10.1029/2019MS001812, 2020.
Ren-Jun, Z.: The Xinanjiang model applied in China, J. Hydrol., 135, 371–381, https://doi.org/10.1016/0022-1694(92)90096-E, 1992.
Rummler, T., Wagner, A., Arnault, J., and Kunstmann, H.: Lateral terrestrial water fluxes in the LSM of WRF-Hydro: Benefits of a 2D groundwater representation, Hydrol. Process., 36, e14510, https://doi.org/10.1002/hyp.14510, 2022.
Sakaguchi, K. and Zeng, X.: Effects of soil wetness, plant litter, and under-canopy atmospheric stability on ground evaporation in the Community Land Model (CLM3.5), J. Geophys. Res.-Atmos., 114, D01107, https://doi.org/10.1029/2008JD010834, 2009.
Schaake, J. C., Koren, V. I., Duan, Q.-Y., Mitchell, K., and Chen, F.: Simple water balance model for estimating runoff at different spatial and temporal scales, J. Geophys. Res.-Atmos., 101, 7461–7475, /https://doi.org/10.1029/95JD02892, 1996.
Sellers, P. J.: Canopy reflectance, photosynthesis and transpiration, Int. J. Remote Sens., 6, 1335–1372, https://doi.org/10.1080/01431168508948283, 1985.
Sheng, M., Lei, H., Jiao, Y., and Yang, D.: Evaluation of the Runoff and River Routing Schemes in the Community Land Model of the Yellow River Basin, J. Adv. Model. Earth Sy., 9, 2993–3018, https://doi.org/10.1002/2017MS001026, 2017.
Shoaib, M., Shamseldin, A. Y., Khan, S., Khan, M. M., Khan, Z. M., and Melville, B. W.: A wavelet based approach for combining the outputs of different rainfall–runoff models, Stoch. Env. Res. Risk A., 32, 155–168, https://doi.org/10.1007/s00477-016-1364-x, 2018.
Smith, R. E. and Parlange, J.-Y.: A parameter-efficient hydrologic infiltration model, Water Resour. Res., 14, 533–538, https://doi.org/10.1029/WR014i003p00533, 1978.
Sorribas, M. V., de Paiva, R. C. D., Fleischmann, A. S., and Collischonn, W.: Hydrological Tracking Model for Amazon Surface Waters, Water Resour. Res., 56, e2019WR024721, https://doi.org/10.1029/2019WR024721, 2020.
Stephens, G. L., Slingo, J. M., Rignot, E., Reager, J. T., Hakuba, M. Z., Durack, P. J., Worden, J., and Rocca, R.: Earth's water reservoirs in a changing climate, P. Roy. Soc. A, 476, 20190458, https://doi.org/10.1098/rspa.2019.0458, 2020.
Taylor, K. E.: Summarizing multiple aspects of model performance in a single diagram, J. Geophys. Res.-Atmos., 106, 7183–7192, https://doi.org/10.1029/2000JD900719, 2001.
Verseghy, D. L.: Class–A Canadian land surface scheme for GCMS, I. Soil model, Int. J. Climatol., 11, 111–133, https://doi.org/10.1002/joc.3370110202, 1991.
Wipfler, E. L., Metselaar, K., van Dam, J. C., Feddes, R. A., van Meijgaard, E., van Ulft, L. H., van den Hurk, B., Zwart, S. J., and Bastiaanssen, W. G. M.: Seasonal evaluation of the land surface scheme HTESSEL against remote sensing derived energy fluxes of the Transdanubian region in Hungary, Hydrol. Earth Syst. Sci., 15, 1257–1271, https://doi.org/10.5194/hess-15-1257-2011, 2011.
Yamazaki, D., Kanae, S., Kim, H., and Oki, T.: A physically based description of floodplain inundation dynamics in a global river routing model, Water Resour. Res., 47, W04501, https://doi.org/10.1029/2010WR009726, 2011.
Yamazaki, D., de Almeida, G. A. M., and Bates, P. D.: Improving computational efficiency in global river models by implementing the local inertial flow equation and a vector-based river network map, Water Resour. Res., 49, 7221–7235, https://doi.org/10.1002/wrcr.20552, 2013.
Yamazaki, D., Sato, T., Kanae, S., Hirabayashi, Y., and Bates, P. D.: Regional flood dynamics in a bifurcating mega delta simulated in a global river model, Geophys. Res. Lett., 41, 3127–3135, https://doi.org/10.1002/2014GL059744, 2014.
Yang, W.-Y., Li, D., Sun, T., and Ni, G.-H.: Saturation-excess and infiltration-excess runoff on green roofs, Ecol. Eng., 74, 327–336, https://doi.org/10.1016/j.ecoleng.2014.10.023, 2015.
Yang, Z.-L. and Dickinson, R. E.: Description of the Biosphere-Atmosphere Transfer Scheme (BATS) for the Soil Moisture Workshop and evaluation of its performance, Glob. Planet. Change, 13, 117–134, https://doi.org/10.1016/0921-8181(95)00041-0, 1996.
Yang, Z.-L., Niu, G.-Y., Mitchell, K. E., Chen, F., Ek, M. B., Barlage, M., Longuevergne, L., Manning, K., Niyogi, D., Tewari, M., and Xia, Y.: The community Noah land surface model with multiparameterization options (Noah-MP): 2. Evaluation over global river basins, J. Geophys. Res.-Atmos., 116, D12110, https://doi.org/10.1029/2010JD015140, 2011.
Zhang, G., Chen, F., and Gan, Y.: Assessing uncertainties in the Noah-MP ensemble simulations of a cropland site during the Tibet Joint International Cooperation program field campaign, J. Geophys. Res.-Atmos., 121, 9576–9596, https://doi.org/10.1002/2016JD024928, 2016.
Zhang, G., Li, J., Zhou, G., Cai, X., Gao, W., Peng, X., and Chen, Y.: Effects of Mosaic Representation of Land Use/Land Cover on Skin Temperature and Energy Fluxes in Noah-MP Land Surface Model Over China, J. Geophys. Res.-Atmos., 126, e2021JD034542, https://doi.org/10.1029/2021JD034542, 2021a.
Zhang, Q., Wang, B.-D., He, B., Peng, Y., and Ren, M.-L.: Singular Spectrum Analysis and ARIMA Hybrid Model for Annual Runoff Forecasting, Water Resour. Manage., 25, 2683–2703, https://doi.org/10.1007/s11269-011-9833-y, 2011.
Zhang, X., Chen, L., Ma, Z., and Gao, Y.: Assessment of surface exchange coefficients in the Noah-MP land surface model for different land-cover types in China, Int. J. Climatol., 41, 2638–2659, https://doi.org/10.1002/joc.6981, 2021b.
Zhang, Z., Chen, F., Barlage, M., Bortolotti, L. E., Famiglietti, J., Li, Z., Ma, X., and Li, Y.: Cooling Effects Revealed by Modeling of Wetlands and Land-Atmosphere Interactions, Water Resour. Res., 58, e2021WR030573, https://doi.org/10.1029/2021WR030573, 2022.
Zheng, D., Van Der Velde, R., Su, Z., Wen, J., and Wang, X.: Assessment of Noah land surface model with various runoff parameterizations over a Tibetan river, J. Geophys. Res.-Atmos., 122, 1488–1504, https://doi.org/10.1002/2016JD025572, 2017.
Zheng, H., Yang, Z.-L., Lin, P., Wei, J., Wu, W.-Y., Li, L., Zhao, L., and Wang, S.: On the Sensitivity of the Precipitation Partitioning Into Evapotranspiration and Runoff in Land Surface Parameterizations, Water Resour. Res., 55, 95–111, https://doi.org/10.1029/2017WR022236, 2019.
Zipper, S. C., Motew, M., Booth, E. G., Chen, X., Qiu, J., Kucharik, C. J., Carpenter, S. R., and Loheide II, S. P.: Continuous separation of land use and climate effects on the past and future water balance, J. Hydrol., 565, 106–122, https://doi.org/10.1016/j.jhydrol.2018.08.022, 2018.