the Creative Commons Attribution 4.0 License.
the Creative Commons Attribution 4.0 License.
 | 28 Feb 2025
Evaluating an Earth system model from a water manager perspective
Ming Ge
Jadwiga H. Richter
Ethan D. Gutmann
Allyson Rugg
Cindy L. Bruyère
Sue Ellen Haupt
Flavio Lehner
Rachel McCrary
Andrew J. Newman
Andy Wood
The large spatial scale of global Earth system models (ESMs) is often cited as an obstacle to using the output by water resource managers in localized decisions. Recent advances in computing have improved the fidelity of hydrological responses in ESMs through increased connectivity between model components. However, the models are seldom evaluated for their ability to reproduce metrics that are important for and resonate with practitioners or that allow practitioners to situate higher-resolution model outputs within a cascade of uncertainty stemming from different models and scenarios. We draw on the combined experience of the author team and water manager workshop participants to identify salient water management metrics and evaluate whether they are credibly reproduced over the conterminous USA by the Community Earth System Model v2 (CESM2) Large Ensemble. We find that, while the exact values may not match the observations, aspects such as interannual variability can be reproduced by CESM2 for the mean wet day precipitation and length of dry spells. CESM2 also captures the proportion of total annual precipitation that derives from the heaviest rain days in watersheds that are not snow-dominated. Aggregating the 7 d mean daily runoff to two-digit Hydrological Unit Code (HUC2) watersheds also shows that rain-dominated regions capture the timing and interannual variability of annual maximum and minimum flows. We conclude that there is potential for far greater use of large-ensemble ESMs, such as CESM2, in long-range water management decisions to supplement high-resolution regional projections.
- Article
(7964 KB) - Full-text XML
-
Supplement
(3877 KB) - BibTeX
- EndNote


Water availability and water quality for human consumption, ecosystems, and agriculture are fundamental requirements, making pertinent assessments of future change crucial for adaptation planning (IPCC, 2022). Climate-related changes in the hydrological cycle will affect substantial portions of the world's population, most directly through changes in water availability at or near the surface (Mankin et al., 2020; Sedláček and Knutti, 2014). The information required by water managers for decision-making is not readily available in a relevant format or at sufficient spatial or temporal resolutions from global Earth system models (ESMs; e.g., Ekström et al., 2018). We explore how the Community Earth System Model (CESM) represents the climatology of water availability, focusing on metrics that are familiar to decision-makers in planning investment-scale decisions.
The inability of ESMs to explicitly resolve subgrid-scale (∼ 100 km) processes is often cited as the limitation preventing direct model use in decision-making. The literature from large organizations making infrastructure decisions (e.g., Brekke, 2011; Brekke et al., 2009; Reclamation, 2016, 2014; Lukas et al., 2020) emphasizes downscaling of climate model data closer to the scale of the watersheds they manage. These additional modeling steps add complexity and may increase statistical errors (Clark et al., 2015; Ekström et al., 2018). Extracting useful and robust information directly from ESMs would reduce such errors if metrics most important to decision-makers, such as the timing of peak flow, are known to be robustly represented.
There are many comprehensive examples of metrics used to evaluate climate and hydrological models (e.g., Ekström et al., 2018; Mizukami et al., 2019; Wagener et al., 2022), communicate the impacts of climate change (e.g., Reed et al., 2022), or identify decision-relevant metrics (e.g., Bremer et al., 2020; Mach et al., 2020; Underwood et al., 2018; Vano et al., 2014). However, very few have examined whether user-defined metrics can be reproduced reliably by ESMs (Mankin et al., 2020) and whether further model development and scale reduction are warranted instead of improved communication (Pacchetti et al., 2021). Better communication may also reduce the temptation of some users to calculate “standard hydroclimate metrics” that are not supported by the climate model data (Ekström et al., 2018).
In contrast, climate model output can be rejected unnecessarily when simulated annual minima from freely running simulations do not “match” the sequence of observed low flows (Ekström et al., 2018; Moise et al., 2015). Similarly, the benefits of a range of projected outcomes from different climate models are not widely appreciated beyond the climate model community (Tebaldi and Knutti, 2007). Large ensembles from a single climate model initialized with a range of atmospheric and ocean conditions, such as the CESM v2 (CESM2) Large Ensemble (LENS2; Rodgers et al., 2021), help to bound the uncertainty that derives from a naturally chaotic system. Averaged over the full ensemble, they give a better estimate of the model's response to internal and external forcing (Deser et al., 2012) and enable assessments of the rarity of projected extremes. The additional analysis for identifying structural (i.e., model formulation) and internal variability within regional climate models means that there are fewer large ensembles at a high resolution (Deser et al., 2020).
Since different decision-makers have different priorities and timescales of interest, Shepherd et al. (2018) recommended the development of climate storylines to communicate with those using climate data to make decisions. Informed by previous surveys of water managers (e.g., Brekke, 2011; Brekke et al., 2009; Cantor et al., 2018; Raff et al., 2013; Wood et al., 2021), Fig. 1 aims to map the different types of water decisions (e.g., Raff et al., 2013; Fig. 3) to the different scales of model resolution (Meehl et al., 2009; Fig. 2). Water managers make daily operational decisions (e.g., to control instantaneous river flow) with the aid of fine-scale weather and flood models (< 4 km) that reliably represent convective and local weather processes, even though their predictability is relatively short-lived (Yuan et al., 2019; far left of Fig. 1). Larger watershed operations (such as reservoir management or groundwater recharge; Regional Water Authority, 2019) depend on seasonal outlooks (center left of Fig. 1). Smaller adaptation and mitigation projects take place at the typical policy or decadal prediction scale (i.e., 4–10 years; center right of Fig. 1). Finally, major public investments and interbasin agreements are made at the same timescales as climate projections (30–100 years; far right of Fig. 1), where persistent and relatively predictable synoptic and planetary-scale processes are represented well in lower-resolution (∼ 100 km) climate models (Phillips et al., 2020). While forecasts (seasonal or decadal) are re-initialized from specific atmosphere, ocean, or land states at regular time intervals, climate projections are run freely from a variety of atmospheric and oceanic conditions that take several decades to converge to a mean climatology. In considering the utility and usability of information directly from ESMs, we focus on decisions made over decadal to climate scales at larger spatial scales.
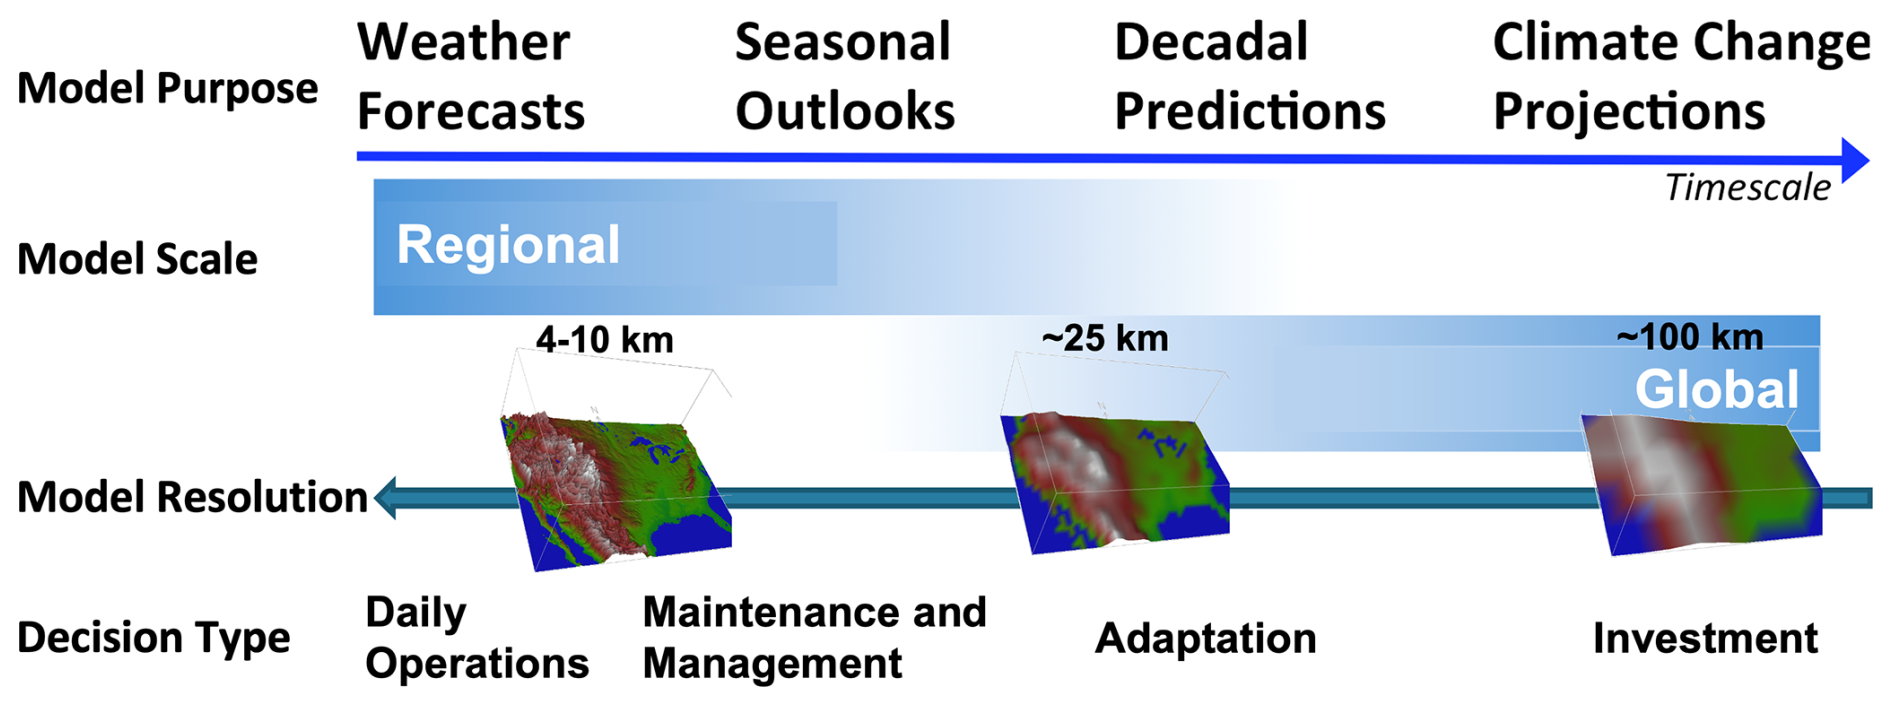
Figure 1Mapping the temporal and spatial scales of models to the time frames for water management decisions.
Given that ESMs have advanced immeasurably in the last decade, it is time to re-evaluate whether their direct output can support decision-makers. Such an evaluation needs to focus on how well the models can reproduce metrics used by decision-makers and whether the results are credible (Briley et al., 2020; Jagannathan et al., 2021). Here we evaluate the credibility of one ESM in generating metrics known to be salient for water management decisions, specifically decisions for water management infrastructure project investments.
The motivation for this paper is to identify
-
a set of water availability metrics that resonates with decision-makers and supports their investment-scale decisions;
-
how well CESM2 represents the climatology and recently observed behaviors of those metrics; and
-
the range of CESM2 structural uncertainty and internal variability for these metrics.
This paper builds off a decade of collaboration between scientists at the National Center for Atmospheric Research (NCAR) and US water agencies that led to a virtual workshop (Tye, 2023), and it presents a test case for improved communication with water management decision-makers. The focus is on the conterminous United States (CONUS) in order to match the interests of workshop participants.
Information needs vary greatly, from 5 min rainfall totals at a point (ASCE, 2006) to basin-wide measures of annual minimum and maximum total runoff. Water management decision metrics can be grouped into similar types such as timing, frequency, magnitude, extreme values, variability, and duration of events (Ekström et al., 2018). While some aspects of timing, magnitude, or variability can be reproduced reliably by ESMs (e.g., Deser et al., 2020; Tebaldi and Knutti, 2007), others such as short-duration extremes are less reliable.
Methods of evaluation and data use also differ. For instance, Clifford et al. (2020) reported that predicting general changes in the frequency of extreme precipitation events is more useful for future planning than precise prediction of mean values evaluated by model developers. Lehner et al. (2019) emphasized that models need to be evaluated for their ability to reproduce sensitivities (e.g., streamflow changes in response to temperature and precipitation changes), in addition to mean states. However, metrics that are meaningful for evaluating a model's capabilities (e.g., the ratio of precipitation to runoff) are less valuable for management decisions (Lehner et al., 2019; McMillan, 2021; Mizukami et al., 2019). When reporting results, water managers are more familiar with the water year than the calendar year when capturing the full annual hydrological cycle (Ekström et al., 2018). While the use of water years is a nuance that does not add substantial value to climate model assessments, communication with decision-makers is improved by presenting data in a familiar format (Briley et al., 2020).
There is a need for information at the local scale that is unlikely to be met directly by raw outputs from the current generation of ESMs. However, better communication of the variability in future daily precipitation and the associated runoff can add value to the detailed models by bringing in the added statistical context and perspective of the large ensembles. Thus, we believe that ESMs can produce useful information about hydrometeorological extremes when presented at different spatial or temporal scales and offer the benefits of large climate model ensembles to constrain future impact uncertainty.
Appendix A summarizes potential hydrological metrics used in water management decisions (Jagannathan et al., 2021), statistical assessments of extremes (Zhang et al., 2011), and model evaluations (Phillips et al., 2020). The metrics in bold are presented in this paper. We only considered a simplistic measure of meteorological drought (absence of rain) in the current work, as drought is sensitive to the definition (Bachmair et al., 2016) and local conditions (Mukherjee et al., 2018) and so is not suited to a generalized assessment. Similarly, snow measures are not included in this assessment, due in part to the limited availability of high-quality, long-duration, quality-controlled, and observational data (McCrary et al., 2017) and the biases in snow distribution arising from the smoothed topography in ESMs (McCrary et al., 2022).
3.1 Climate model data
CESM2 (Danabasoglu et al., 2020) is a fully coupled global model that simulates Earth's climate system through interactive models for the atmosphere, ocean, land, sea ice, river runoff, and land ice. The variables considered in this project are taken from the Community Atmosphere Model version 6 (CAM6) and the Community Land Model version 5.0 (CLM5; Lawrence et al., 2019) and are part of the default model outputs. A schematic of the model components is included in Appendix B. This project uses daily to annual values (e.g., annual maximum daily precipitation) on a grid with ∼ 1° resolution. Data were extracted over the CONUS from 10 ensemble members of LENS2 (Rodgers et al., 2021) for model validation in the current era (1981–2010).
3.2 Observations
Gridded daily observations of precipitation at ° horizontal resolution (∼ 6 km) were obtained from the Livneh et al. (2013) dataset covering the CONUS and southern Canada for the control period (1981–2010), hereafter referred to as “Livneh”. Pierce et al. (2021) provided an update to the Livneh dataset to address time adjustments that result in an underestimation of the most extreme daily precipitation totals and the resultant runoff and flood potential (Pierce et al., 2021). However, as we are also interested in other measures of precipitation and in runoff minima, we did not employ the updated gridded observations.
Livneh daily temperature maxima and minima as well as precipitation were used to force the Variable Infiltration Capacity Model (VIC; Liang et al., 1994) version 4.1.2 to obtain runoff estimates for the years 1980–2005 as evaluated in Livneh et al. (2013). Hereafter this model is referred to as “Livneh-VIC”.
3.3 Methods
All analyses were carried out using the North American water year (1 October to 30 September) to facilitate later communication.
3.3.1 Remapping
For ease of comparison, model outputs were regridded using a conservative second-order remapping (Jones, 1999) to place both datasets on the same grid and assess anomalies. Data were also calculated as areal averages or totals over the two-digit Hydrological Unit Code (HUC2) regions (Seaber et al., 1987). HUC2 basins represent 18 watersheds, covering areas ranging from 41 000 mi2 (∼ 105 000 km2; Tennessee) to 520 960 mi2 (1 350 000 km2; Missouri), as shown in Fig. 2. While the scale of HUC2 regions may be large for some local decision-makers, it is also a more appropriate and conservative scale for comparison with ESMs, as demonstrated by Lehner et al. (2019).
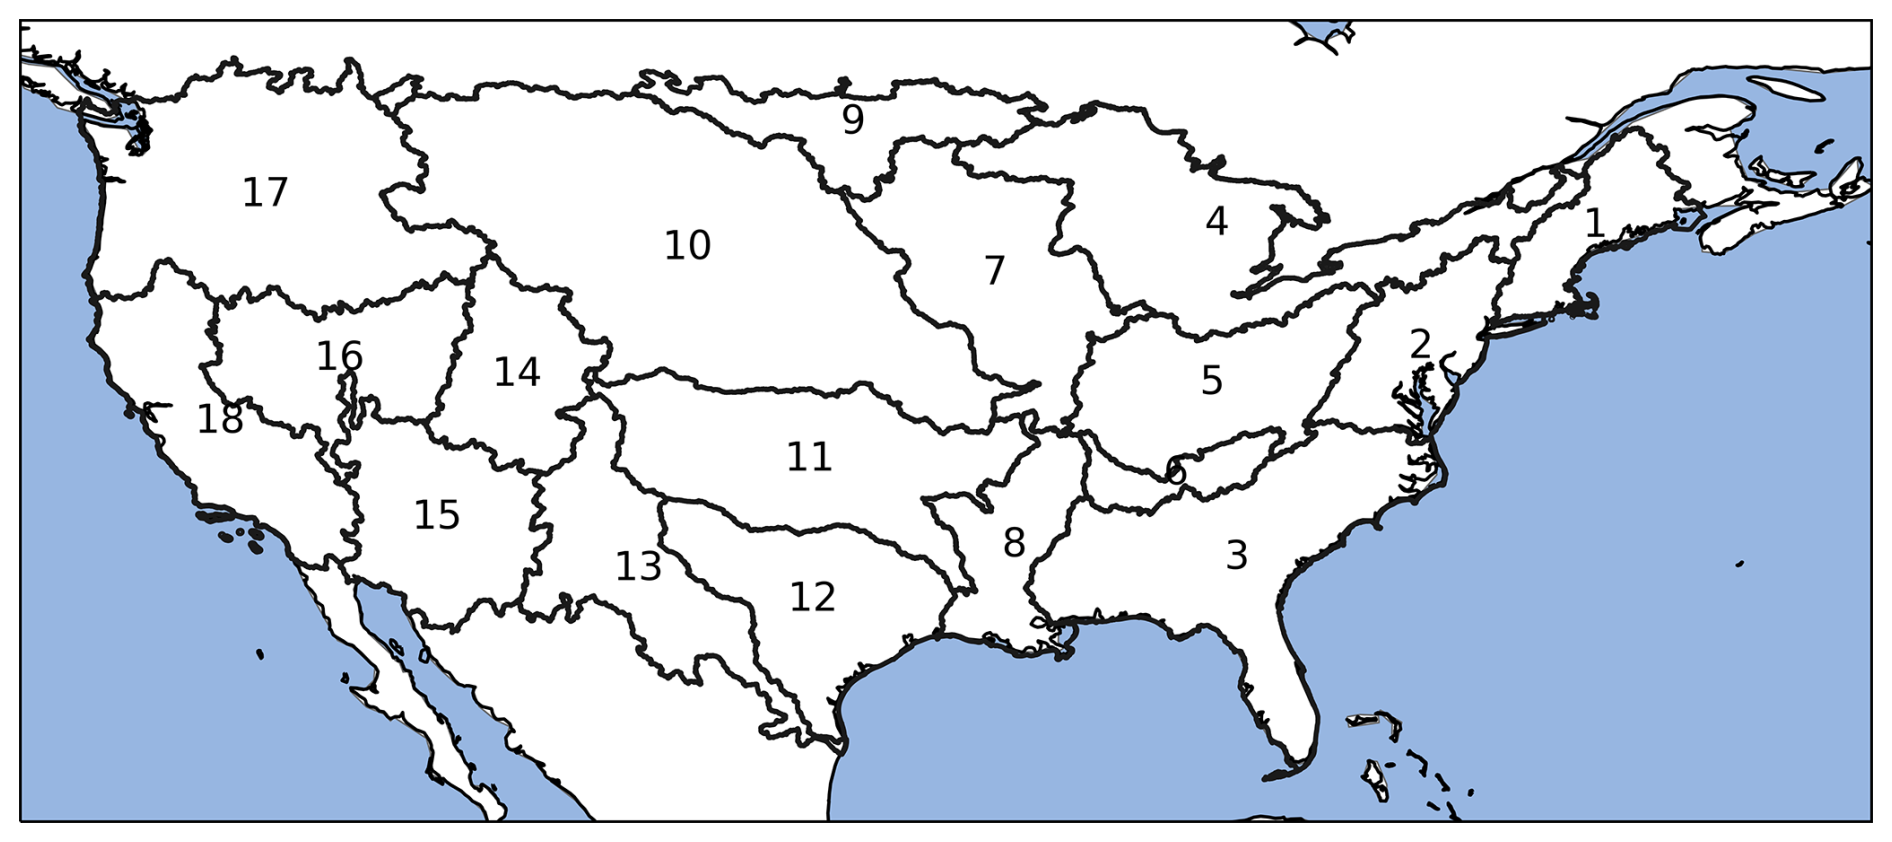
Figure 2HUC2 regions used in data validation and analysis. Regions defined by Seaber et al. (1987): Region 01 New England (NE), Region 02 Mid-Atlantic (MA), Region 03 South Atlantic-Gulf (SA), Region 04 Great Lakes (GL), Region 05 Ohio (OH), Region 06 Tennessee (TN), Region 07 Upper Mississippi (UM), Region 08 Lower Mississippi (LM), Region 09 Souris-Red-Rainy (RR), Region 10 Missouri (MR), Region 11 Arkansas-White-Red (ARK), Region 12 Texas-Gulf (GUL), Region 13 Rio Grande (RIO), Region 14 Upper Colorado (UC), Region 15 Lower Colorado (LCO), Region 16 Great Basin (GB), Region 17 Pacific Northwest (PN), and Region 18 California (CA).
3.3.2 Percentile-based thresholds
The threshold for very heavy rain days (Q95) was calculated at each individual grid cell using only days with ≥ 1 mm of rain (“wet days”). Thresholds were derived empirically for each model ensemble member, with the ensemble mean threshold (Q95) used to identify the days per year exceeding the threshold (N95) and the total annual rainfall from those days (P95).
Runoff was aggregated over each HUC2 watershed and multiplied by the respective area to generate the total volume per day. The volume per day was then converted to measurements more familiar to users, such as acre feet per day or cubic meters per second. Daily time series of total volumetric runoff had a 7 d running mean smoother applied, and then the annual maximum, minimum, and mean values were extracted. The highest and lowest 7 d average runoffs expected once per decade (7Q90 and 7Q10) were estimated empirically from the 25 ranked values of annual maxima and minima per watershed. Stationarity was assumed over the climatological period for the purposes of these analyses, acknowledging that changes may have already occurred in the frequency of these events.
The metrics used to evaluate CESM2's ability to reproduce large-scale features and physical behaviors (e.g., Danabasoglu and Lamarque, 2021, and the associated special issue) are not necessarily those employed by decision-makers. ESMs are designed to represent large-scale atmospheric processes and fluxes not specific to local responses (Gettelman and Rood, 2016), but this design assumption may not be sufficiently well communicated to decision-makers. The purpose of our evaluation is to establish whether CESM2 output is also fit for local decision purposes or whether the breadth of information from ESM ensembles remains unsuitable for immediate use in targeted water management decisions.
4.1 Rainfall metrics
While broad spatial patterns of seasonal mean daily rainfall are reproduced well (Danabasoglu et al., 2020; Feng et al., 2020; Simpson et al., 2022), CESM2 fails to capture details over high topography and overestimates summer precipitation where convective extremes dominate summer rainfall (Appendix C). The seasonal mean precipitation also fails to capture some important watershed-level processes, such as the seasonal variability in the number of days with precipitation and the associated intensity.
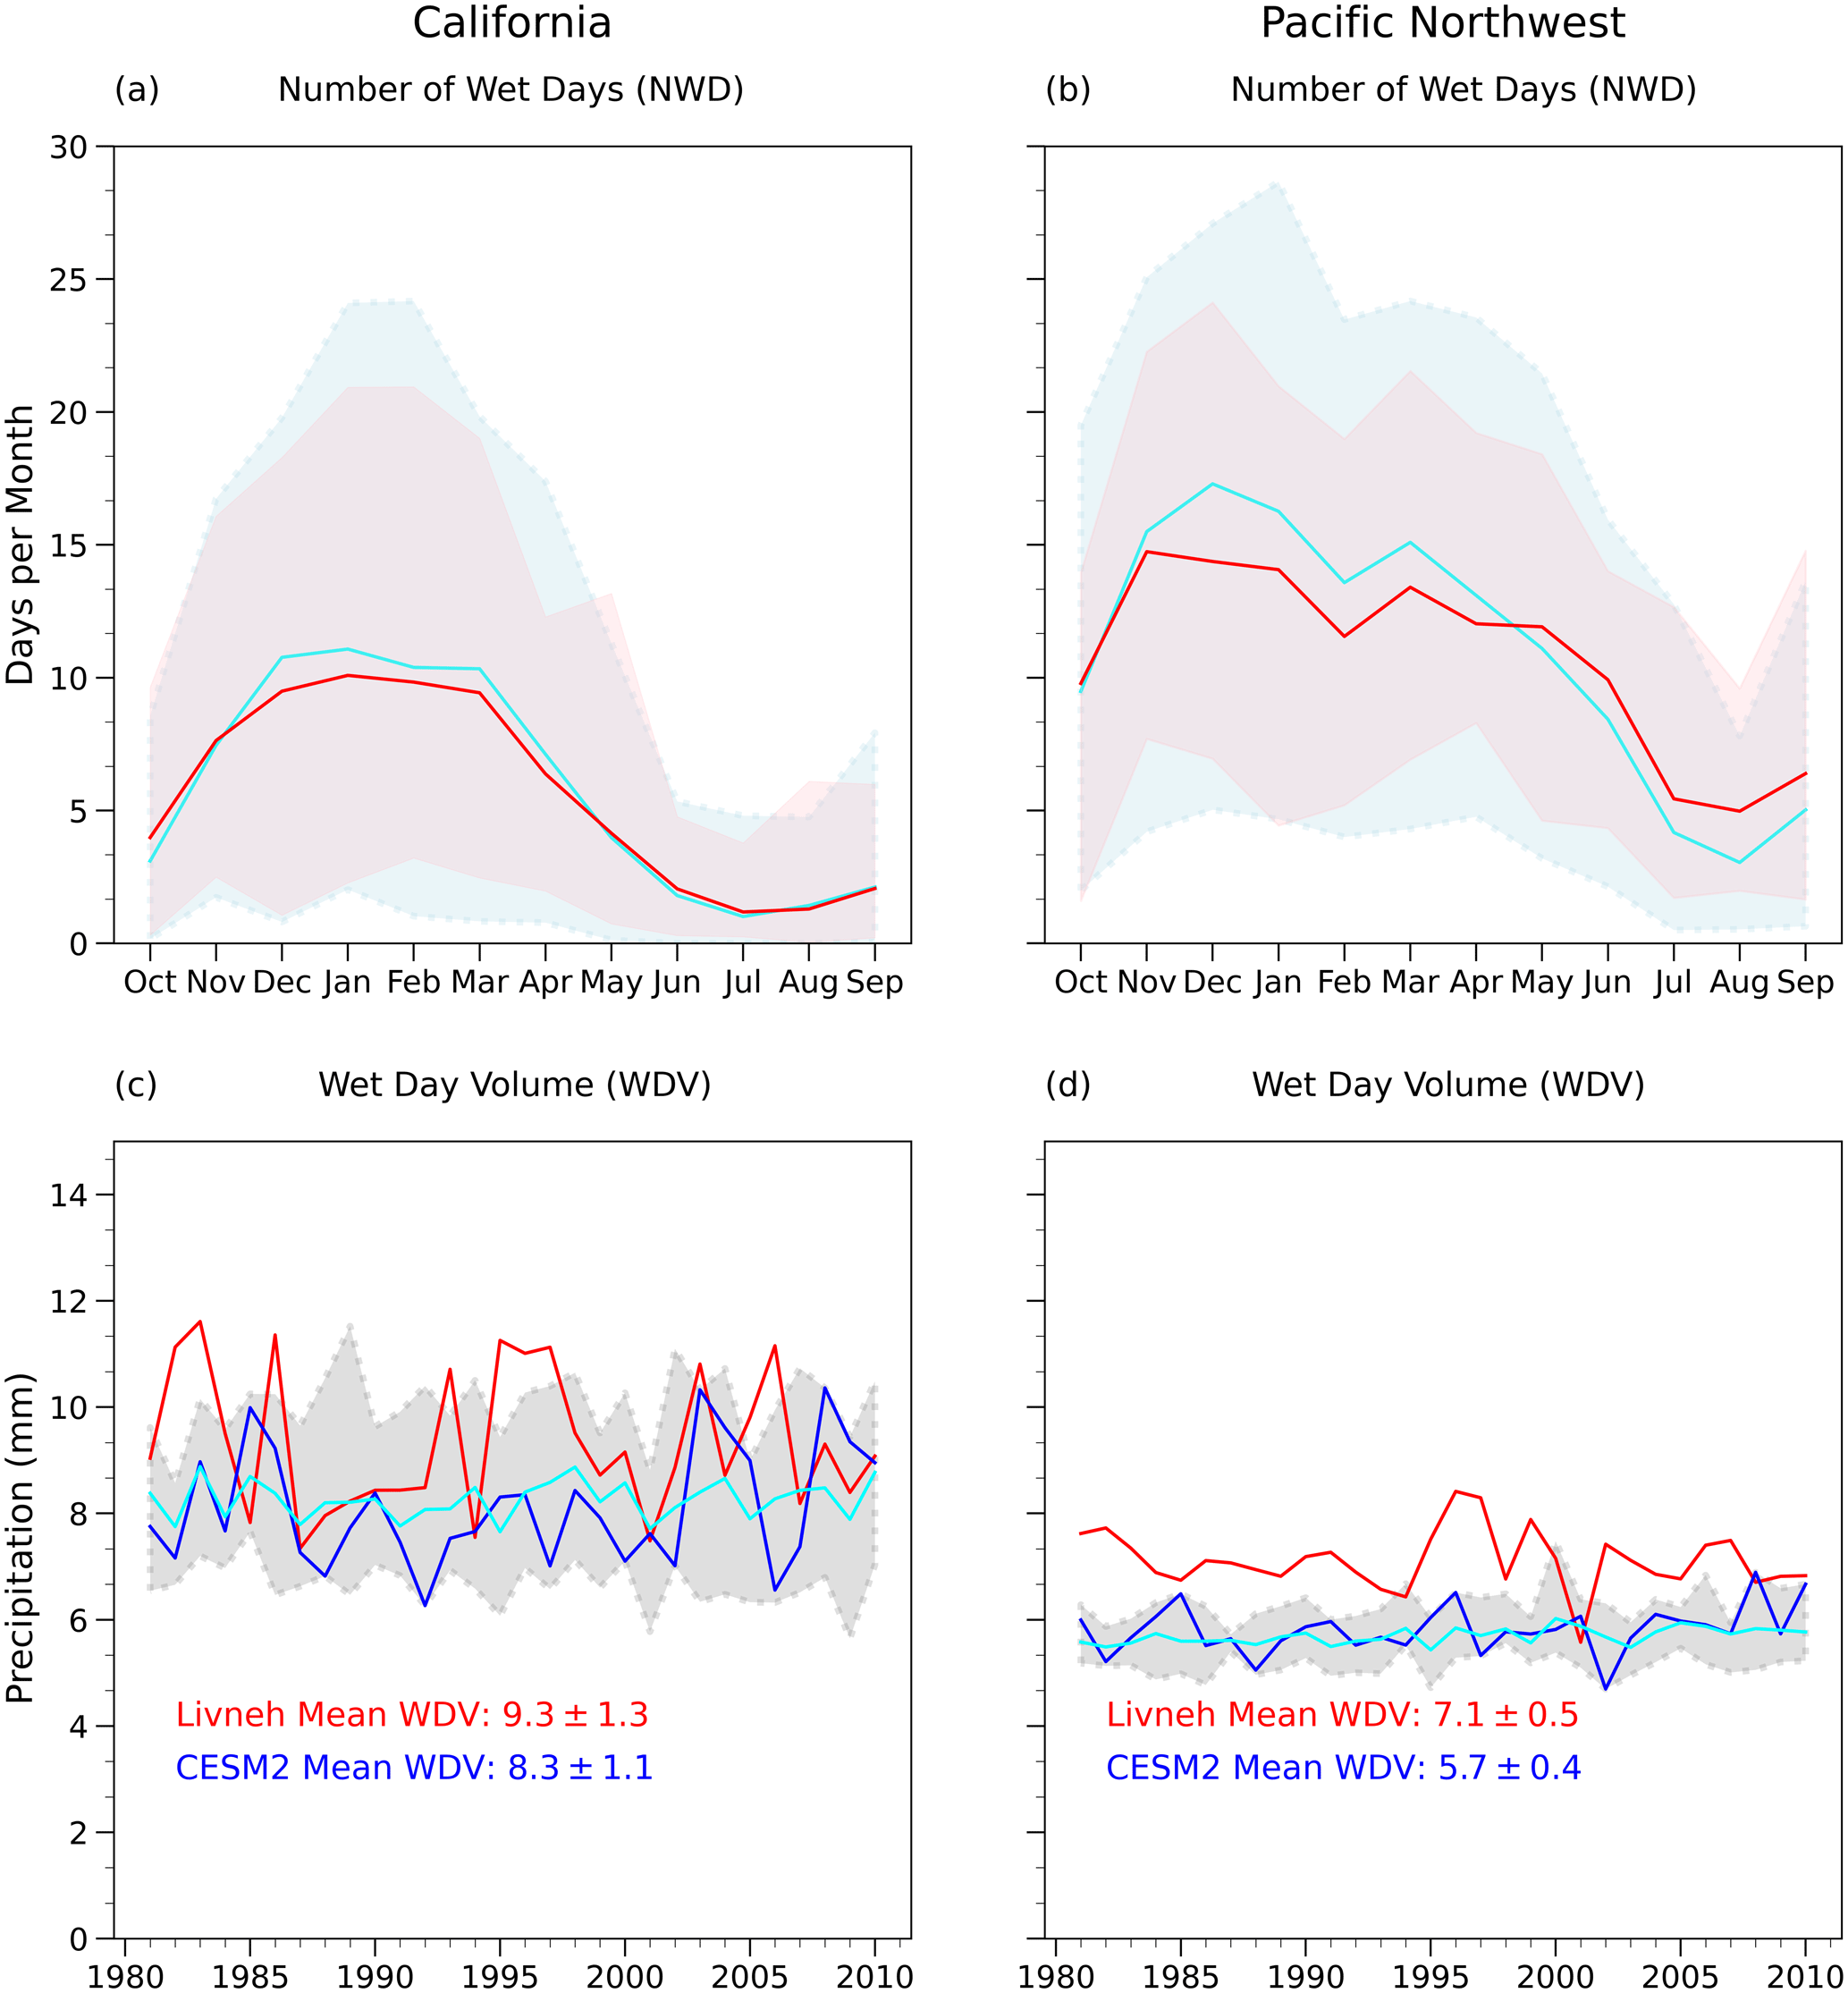
Figure 3Average number of wet days per month (a, b) and interannual variability in mean annual precipitation on wet days for the Livneh climatological mean (red) with interannual spread (pink) and the CESM2 mean (cyan) with interannual and ensemble spread (gray). (c, d) Between 1981 and 2010 for observations derived from Livneh (red), an individual CESM2 ensemble member (blue), and the ensemble spread (gray) in (a, c) CA and (b, d) PN.
Estimates of mean annual rainfall on wet days, or wet day volume, are in broad agreement with Livneh and CESM2 output. Figure 3 shows examples of the mean number of wet days per month (NWD) and the mean wet day volume (WDV) averaged over California and the Pacific Northwest. While CESM2 represents the NWD annual cycle very well in regions such as California (Fig. 3a, c) and the Pacific Northwest (Fig. 3b, d), it does not capture NWD in many central and snow-dominated regions (Figs. S1 and S2 in the Supplement). This is likely due to the smoother topography of CESM2 missing the influence of orographic uplift as well as large-spatial-scale missing subgrid-scale convective systems (e.g., over the Central Plains). The figures also highlight the scale of model (structural and internal variability) uncertainty present in the ensemble. As noted in the previous sections, water management decision-makers are aware of the potential scale of uncertainty and have expressed a desire for the full ensemble range to be presented to them instead of ensemble means.
The annual variability in WDV, both year-to-year variations and the overall range of minima and maxima, is captured well by each of the model members for the different HUC2 regions, even if the absolute values do not match (Fig. 3c, d). As expected, the specifics of which years have high or low values of WDV are not the same for each ensemble member (i.e., demonstrating internal variability). As a result, the ensemble mean value of WDV (cyan) does not reflect the same year-to-year variability as the observations for individual ensemble members (blue). Decision-makers stated that the interannual variability demonstrated by each model member is more valuable for demonstrating the credibility of the data than the ensemble mean (Tye, 2023). We recommend that the full range of values of each metric (i.e., after individual computation for each ensemble member) be communicated in addition to the climatological means to help bound uncertainty around decisions (Wilby et al., 2021).
The magnitude of interannual variability in WDV (i.e., the absolute differences between the maximum and minimum values in each member time series) is typically within 10 % of observations in all the regions, as illustrated for two regions in Fig. 3. Exceptions are the Lower Colorado, South Atlantic-Gulf, and Upper Mississippi regions, where the simulated distributions are too narrow. Many different sources of error may contribute to this discrepancy, such as the inability to resolve convective precipitation (Chen et al., 2021) and elevation changes not captured by the coarse model resolution or the “drizzle effect” that is common in GCMs (Chen et al., 1996; Dai, 2006).
CESM2 captures the longest spells of consecutive dry days per year (CDD; Fig. 4a) and consecutive wet days per year (CWD; Fig. 4b), together with their variability. Many regions capture both the interannual variability and the climatological mean duration of CWD, particularly in those regions that are subject to large-scale synoptic systems (e.g., Pacific Northwest, Mid Atlantic-Gulf, and California). Several regions either overestimate (South Atlantic-Gulf) or underestimate (Great Lakes and Souris-Red-Rainy) the absolute durations of the longest wet spells but do reflect the magnitude of interannual variability. The exception is Tennessee, where both interannual variability and mean CWD are overestimated. At the grid scale, the broad spatial patterns of CWD are correct, but the finer atmospheric processes arising from topographic features are incorrect, as expected from the coarse model resolution. A similar pattern is present in CDD, except that some drier regions with CDD > 30 d do not capture the full range of interannual variability (Souris-Red-Rainy, Missouri, and Rio Grande). As GCMs have a tendency to produce drizzle, adjusting for a higher wet day threshold (e.g., 2 mm) might improve dry spell representation in those regions. It is also important to communicate such model sensitivities to users more effectively.
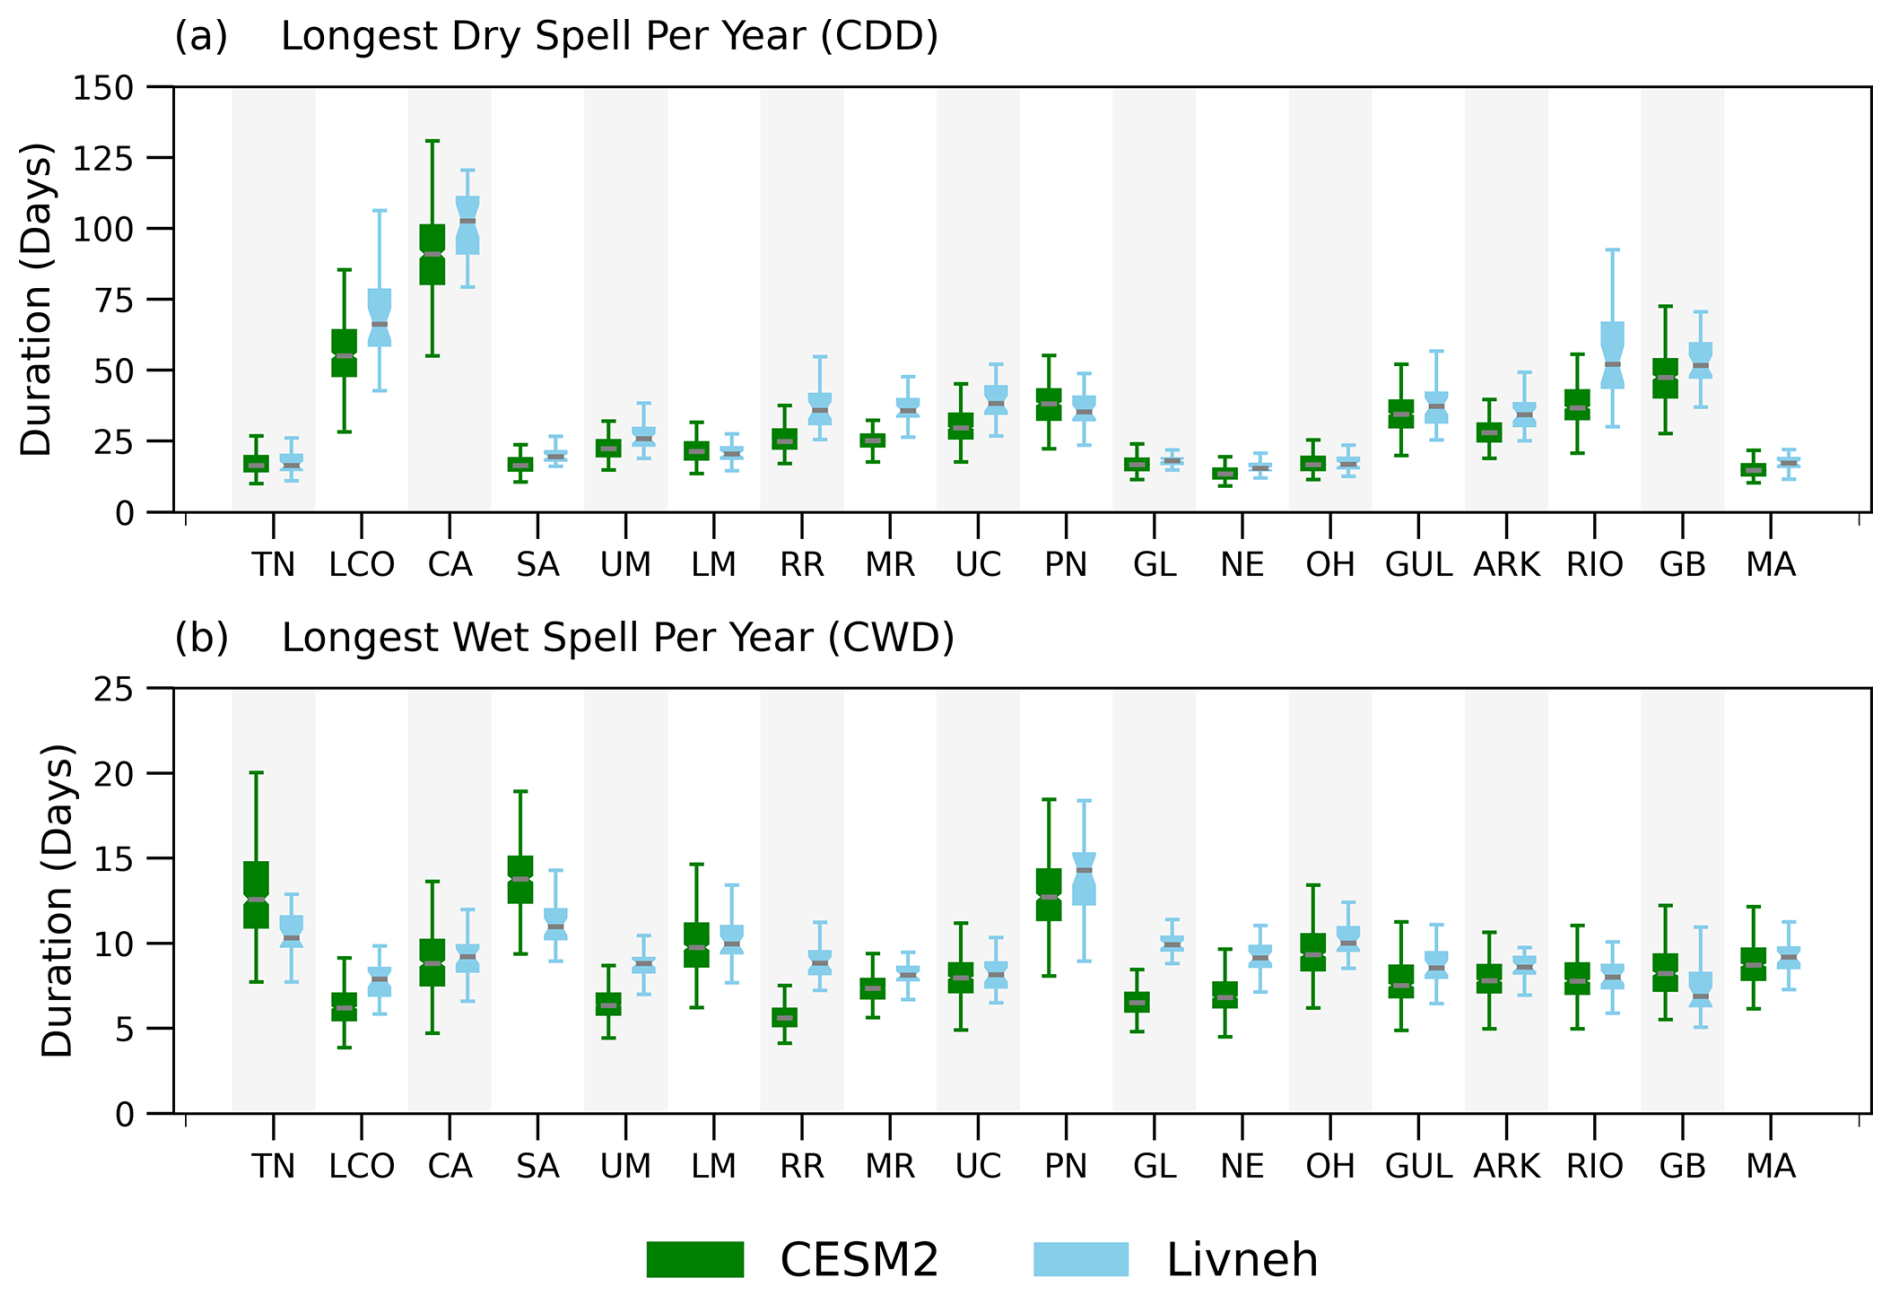
Figure 4(a) Longest duration per year of consecutive days with < 1 mm of rain (longest dry spell) for Livneh over all the years (green) and the CESM2 ensemble range over all the years (blue) for all the HUC2 regions. (b) Longest duration per year of consecutive days with ≥ 1 mm of rain (longest wet spell). The regional abbreviations are given in Fig. 2.
The thresholds for heavy and very heavy rain days (P95 and P99) are defined with respect to the wet days, are calculated individually, and are compared for Livneh and CESM2 in order to understand whether the intensity of more extreme rainfall is captured and to evaluate the models' behavior. A comparison of the thresholds reflects the considerable improvements in modeling capabilities in recent years (Gettelman et al., 2022). For instance, earlier versions of CESM underestimated extreme precipitation intensity by 10–30 mm d−1 east of the Rockies and overestimated intensity by 5–10 mm d−1 to the west (Gervais et al., 2014). We found that CESM2 still underestimates the most extreme rainfall but that errors have approximately halved. As these differences are still inadequate for many engineering and major infrastructure decisions (Wright et al., 2019), we focus on CESM2's ability to capture the relative contributions of P95 and P99 to the annual total and the interannual variability in their frequency. A result with considerable useability is the proportion of total annual precipitation derived from the heaviest rain days, or “proportional contribution of extreme days” (P95Tot). This proportion and its interannual variability are well represented by CESM2 at the HUC2 scale and have proven skillful in other models (Tebaldi et al., 2021).
The interannual variability in the frequency (N95) and intensity of extreme rainfall, as represented by P95Tot, is illustrated in Figs. 5 and 6. In several HUC2 regions the simulations report more frequent events and proportionally higher totals (e.g., Rio Grande, Missouri, Upper Colorado, and Lower Colorado; Fig. S3). Overall, there is good subjective agreement between Livneh and CESM2, identifying an opportunity to inform local decisions from large-scale ESMs.
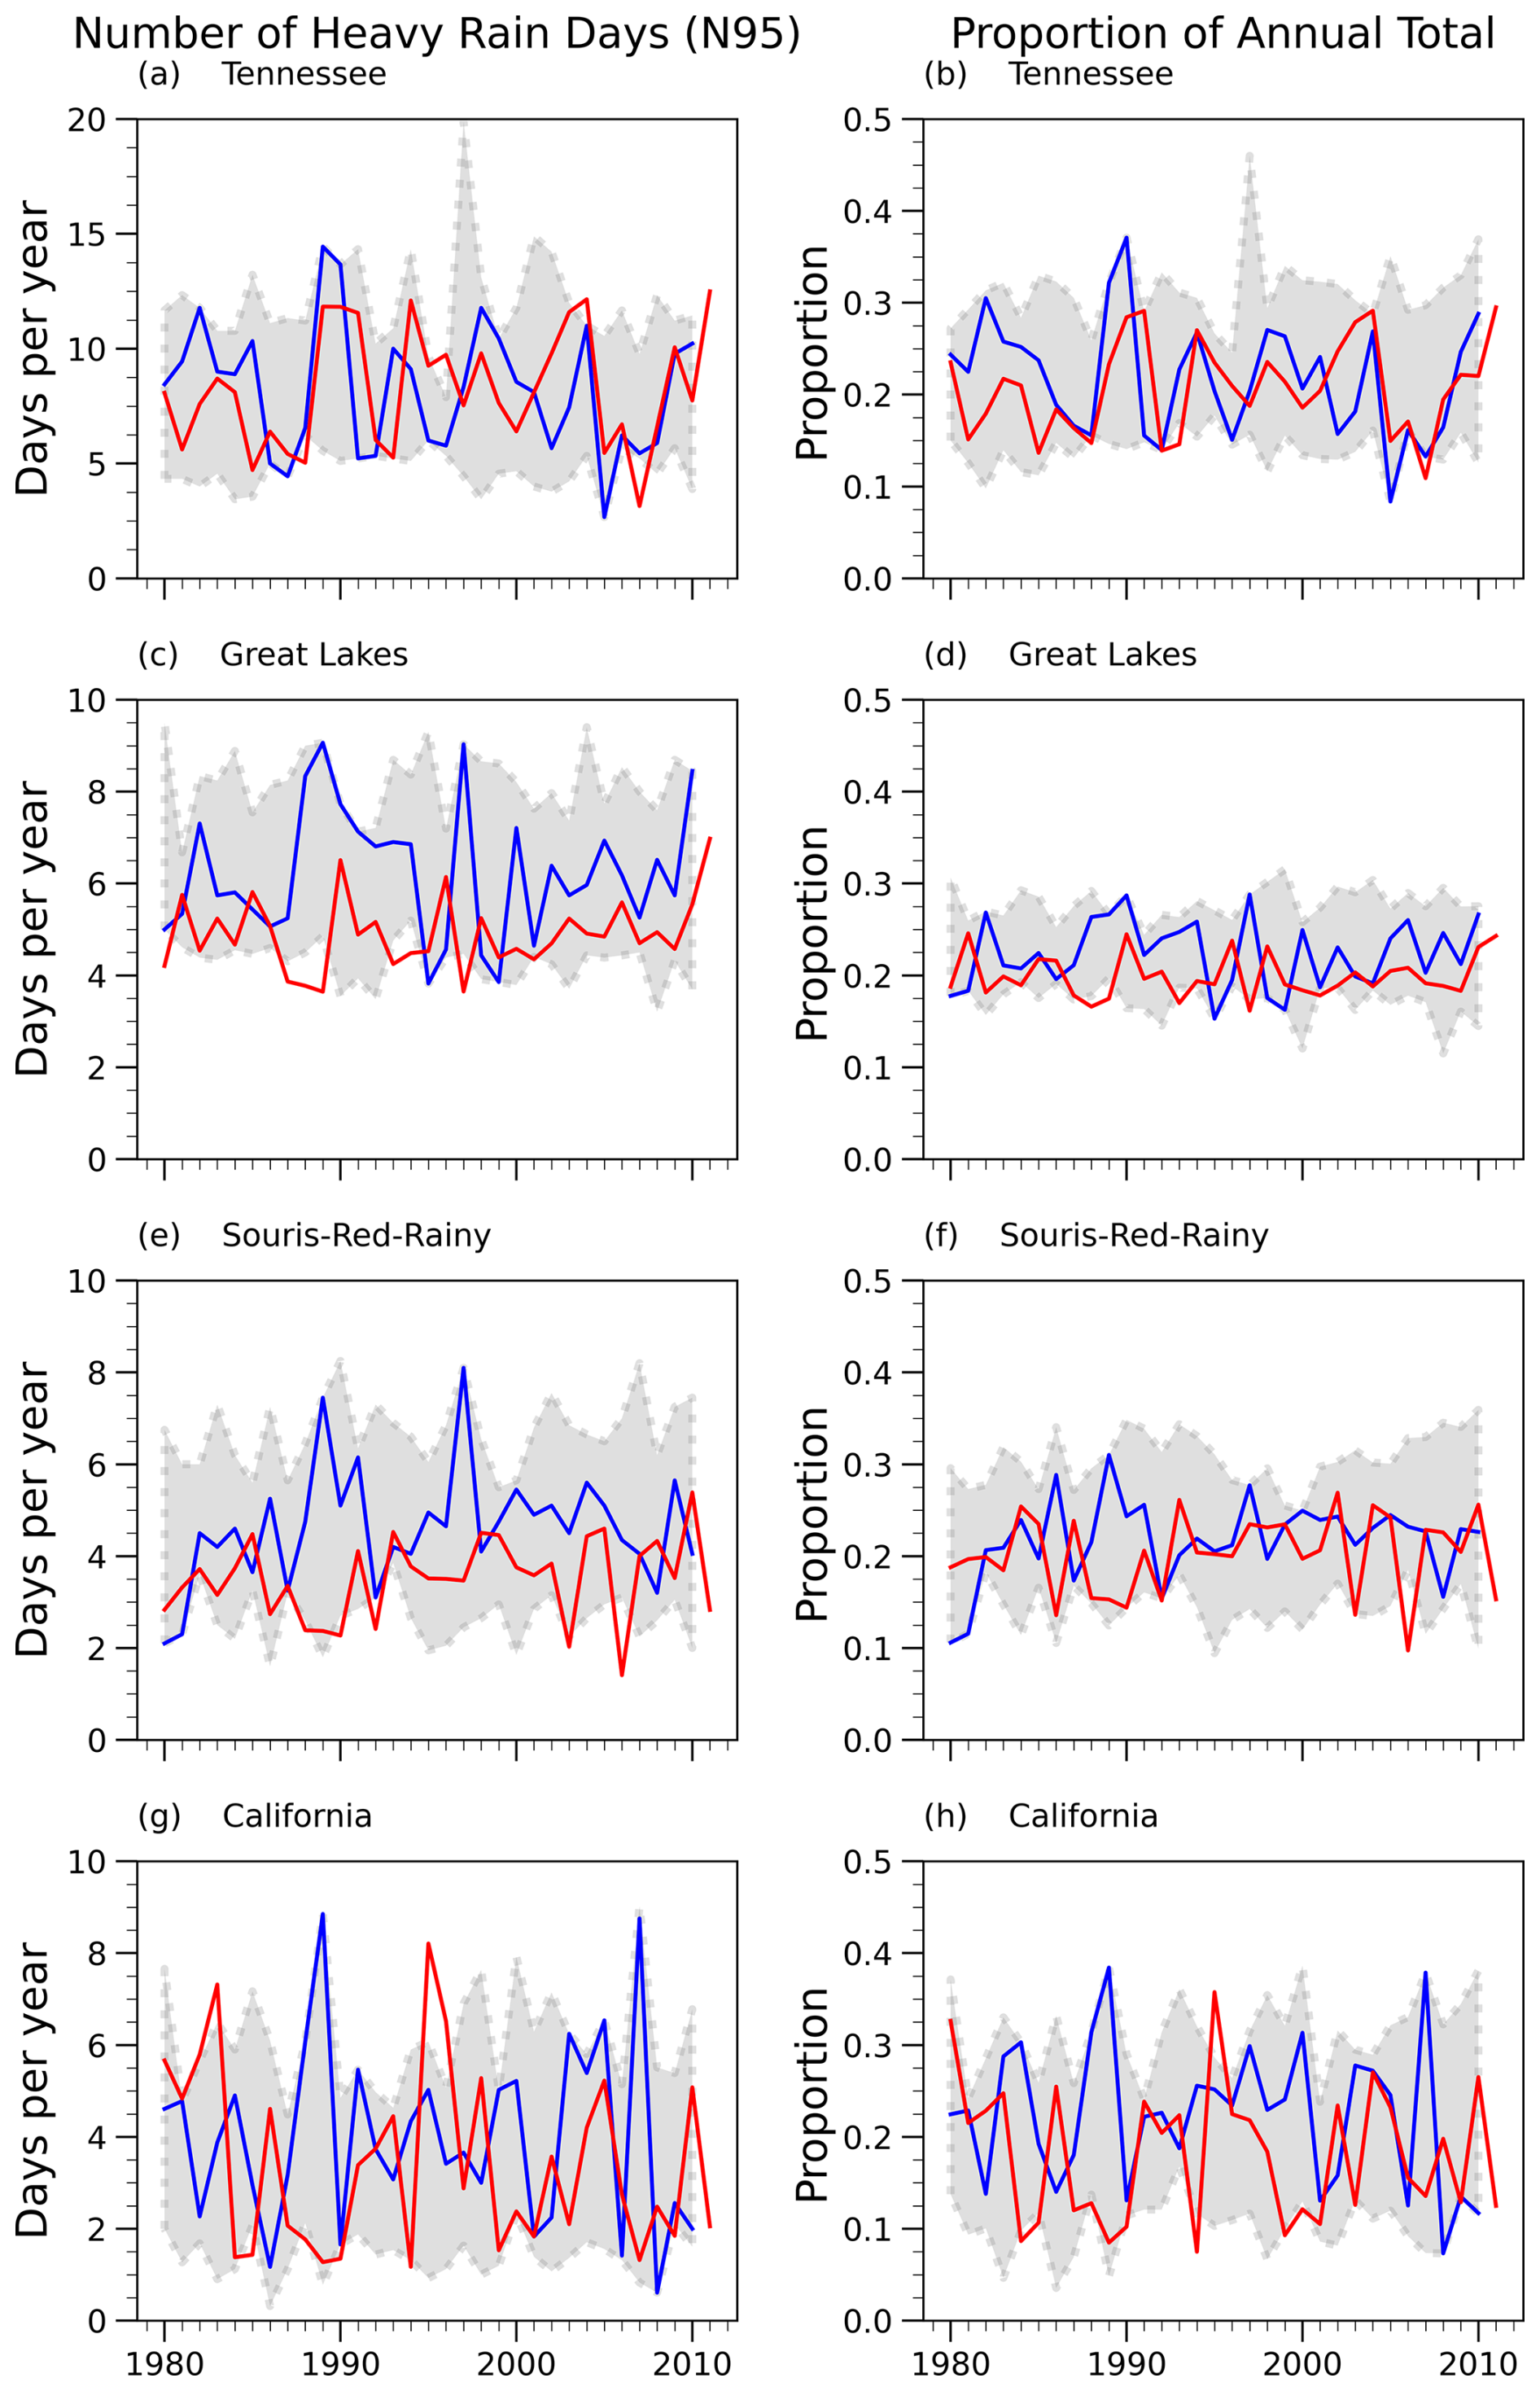
Figure 5(a, c, e, g) Number of very heavy rain days per year and (b, d, f, h) total rain from very heavy rain days as a proportion of the annual total for the (a, b) TN, (c, d) GL, (e, f) RR, and (g, h) CA HUC2 regions. Observations are in red, the CESM2 ensemble spread is in gray, and single randomly selected ensemble members are in blue.
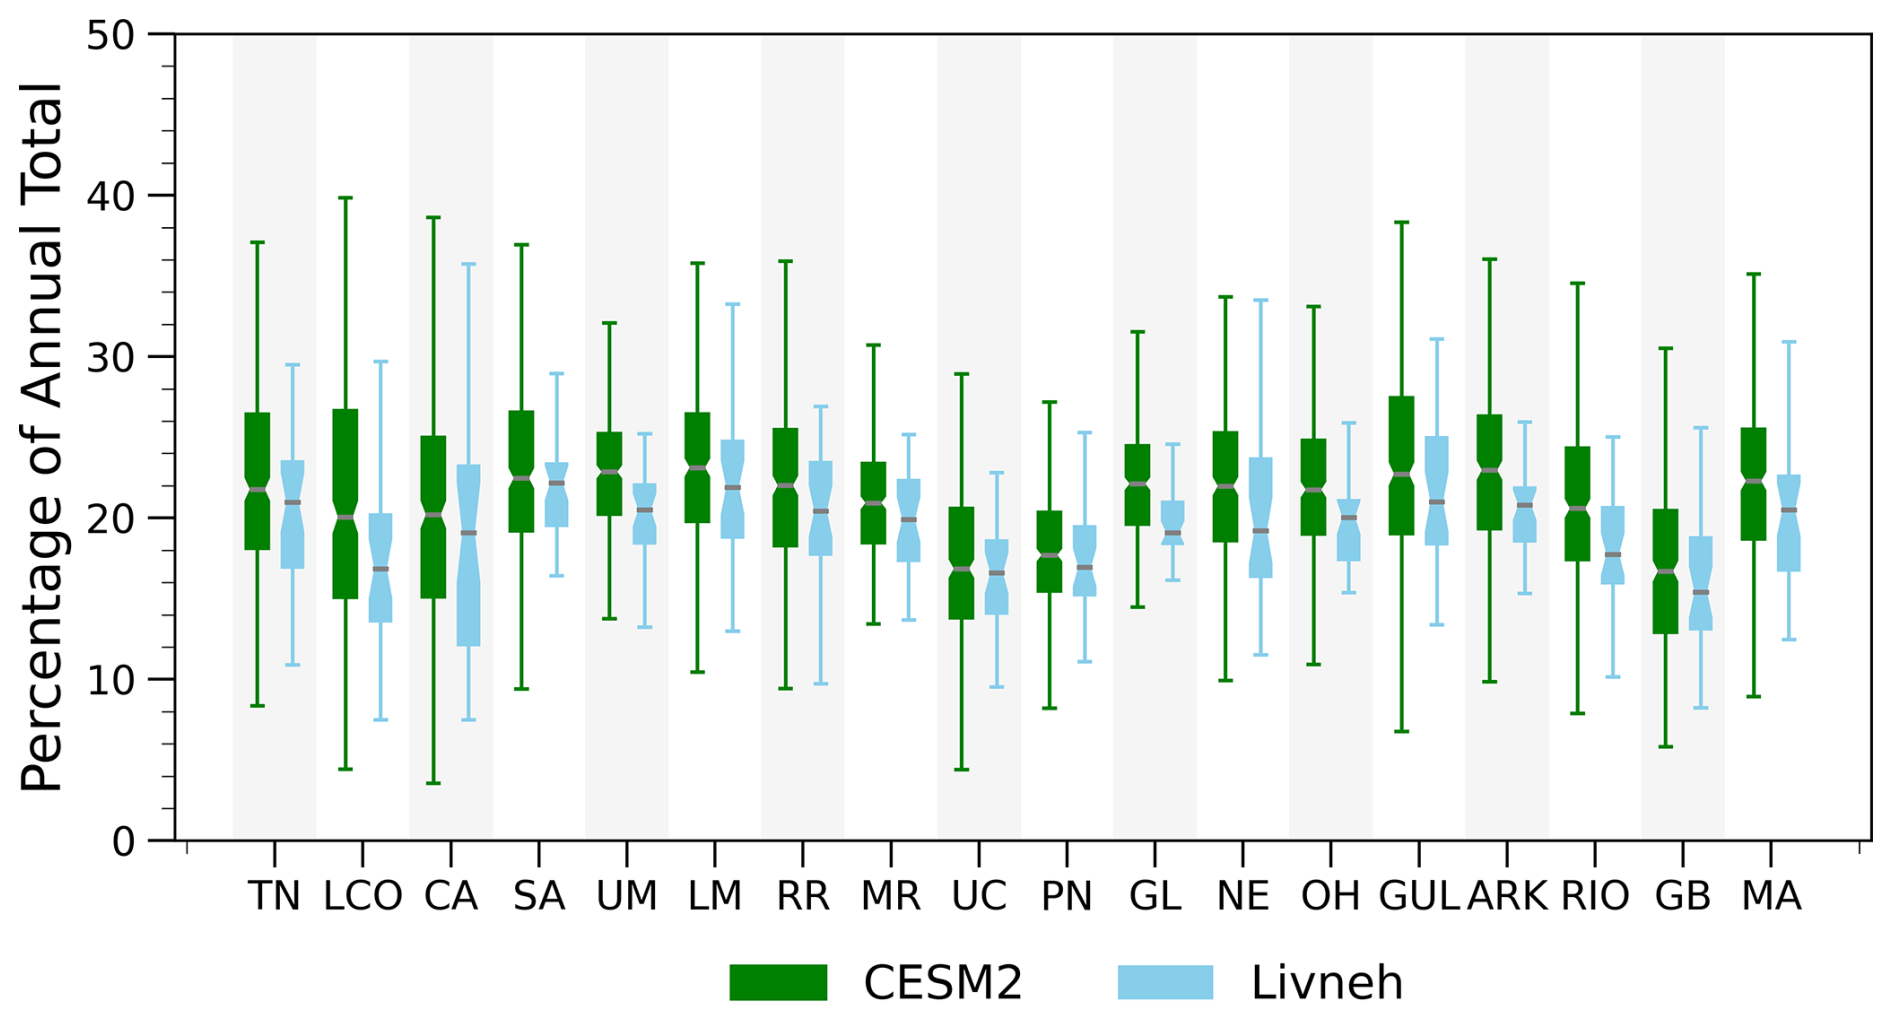
Figure 6Boxplots of the interannual range of contributions to total annual rainfall from very heavy days (P95Tot), shown as percentages for observations (light blue) and the ensemble range for CESM2 (green) for all HUC2 regions. Boxes are bound by the interquartile range, black lines indicate the median, notches indicate the degree of spread from the median, and bars extend to the full data range.
4.2 Runoff metrics
Runoff estimates are taken from the individual components of surface and subsurface runoff generated within CLM5 (Lawrence et al., 2019) and compared to the Livneh-forced VIC runoff (“Livneh-VIC”).
Assessing the skill of runoff in large-scale models is complicated by many factors, including the mismatch of scales between in-channel flow (∼ 1–102 m) and the grid scale (∼ 105 m). Thus, metrics of climate model runoff should be selected carefully, and the runoff should be aggregated or combined with other metrics rather than used directly (Lehner et al., 2019). Appendix D demonstrates the discrepancies between the grid-scale representation of runoff from Livneh-VIC and CESM2. The large discrepancies arise from different processes that are not captured adequately, such as groundwater, topography, and the associated snow ablation and snowmelt, in addition to meteorological biases.
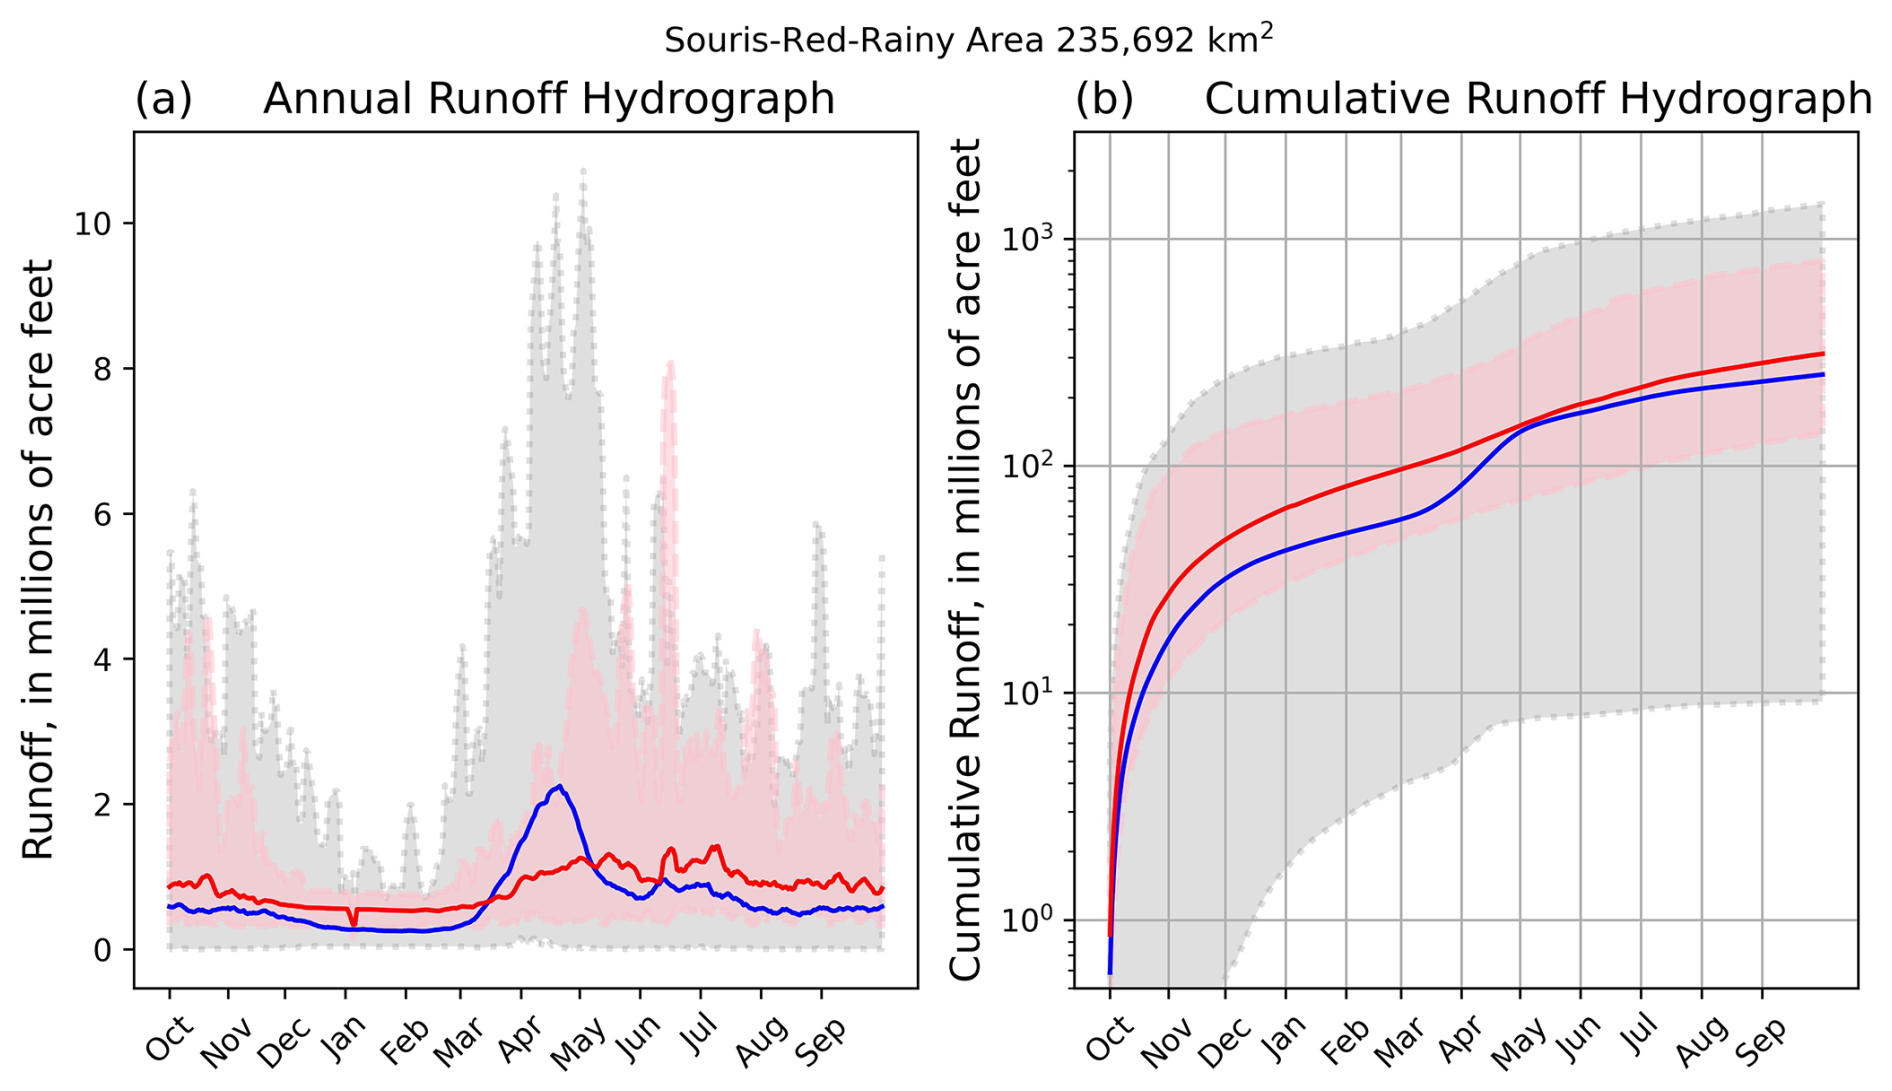
Figure 7Interannual variability in runoff in the RR region for (a) the mean seasonal cycle and (b) the cumulative watershed runoff over the water year. The Livneh-VIC climatological mean is in red, the range of all the years is in pink, the CESM2 ensemble mean is in blue, and the ensemble range is in gray. The figure highlights the underestimation of the lowest runoff volume by CESM2 by a factor of 10.
However, water management decisions are made over watersheds in units such as acre feet1 or cubic meters, while model data are output as a depth of runoff over each grid cell (e.g., mm d−1 km−2). We aggregated the 7 d running mean daily runoff (Q7) within each HUC2 region to generate Q7 time series in each basin. Figure 7a illustrates the 25-year mean seasonal cycle for Livneh-VIC in red and CESM2 in blue, together with the full range of values over all years and ensemble members for the RR basin (HUC Region 9). Additional basins are included in Fig. S4. Data are presented in millions of acre feet in order to align with decision-maker needs. The minimum simulated Q7 in any year considerably underestimates the lowest flows in this region compared to Livneh-VIC. In contrast, the largest total runoff volume is overestimated and peaks too early in the water year. Figure 7b plots the same information as the cumulative runoff volume from the start of the water year, highlighting that the lowest runoff volume is underestimated by a factor of 10 for this region; the other regions are illustrated in Fig. S5. Low runoff volumes were typically underestimated in smaller regions (e.g., NE and TN). High runoff volumes were only underestimated in three regions (LM, ARK, and GUL) and considerably overestimated in seven regions. Snow-dominated regions perform particularly poorly for both QMax and QMin, as snowpacks and the timing of the associated runoff are not simulated well. Transitional regions that straddle both snow- and rain-dominated hydrologies also fail to capture QMax but better estimate Qmin (not shown). Only the South Atlantic region reproduces both QMax and QMin.
We explored the relationships between the highest and total annual runoff (QMax QTot) and the lowest and total annual runoff (QMin QTot). Some regions performed well for QMax QTot and others performed better for QMin QTot, but there was no consistent relationship that could be utilized by decision-makers.
Participants in the NSF NCAR workshop (Tye, 2023) emphasized that the exact numbers produced by climate models are not very important for future decisions. Others have also emphasized the importance of well-represented processes in the model (Reed et al., 2022) and correlations with known experiences (Mach et al., 2020; Shepherd et al., 2018). Focusing on fidelity to the historical climate exaggerates the importance of model performance instead of robustness to different conditions without ensuring that model predictions are useful or reliable (Brunner et al., 2021; Wagener et al., 2022). Runoff estimates in transitional catchments may be inadequate in the current climate but plausible in the future if the model reproduces rain-dominated hydrological processes (McMillan, 2021).
Climatological mean runoff cycles are estimated from Pardé coefficients – calculated as Q7 QTot on each calendar day – a dimensionless value that enables comparison across regions. Figure 8 depicts the mean seasonal cycle for representative snow-dominated (Upper Colorado), transitional (Missouri), and rain-dominated (Tennessee) regions, demonstrating how an imperfect representation of snow in the Upper Colorado region results in CESM2 peak runoff occurring 2 months earlier than Livneh-VIC (Fig. 8a). The runoff regimes display very different seasonal characteristics, with CESM2 having a “mid to late spring” runoff regime rather than Livneh-VIC's “extreme early summer” regime (Fig. 8a; Haines et al., 1988). Peak runoff is also too early in the transitional regions but is closer to Livneh-VIC than in snow-dominated regions (Fig. 8b). Rain-dominated regions capture both the timing of QMax and the overall seasonal hydrograph shape (Fig. 8c).
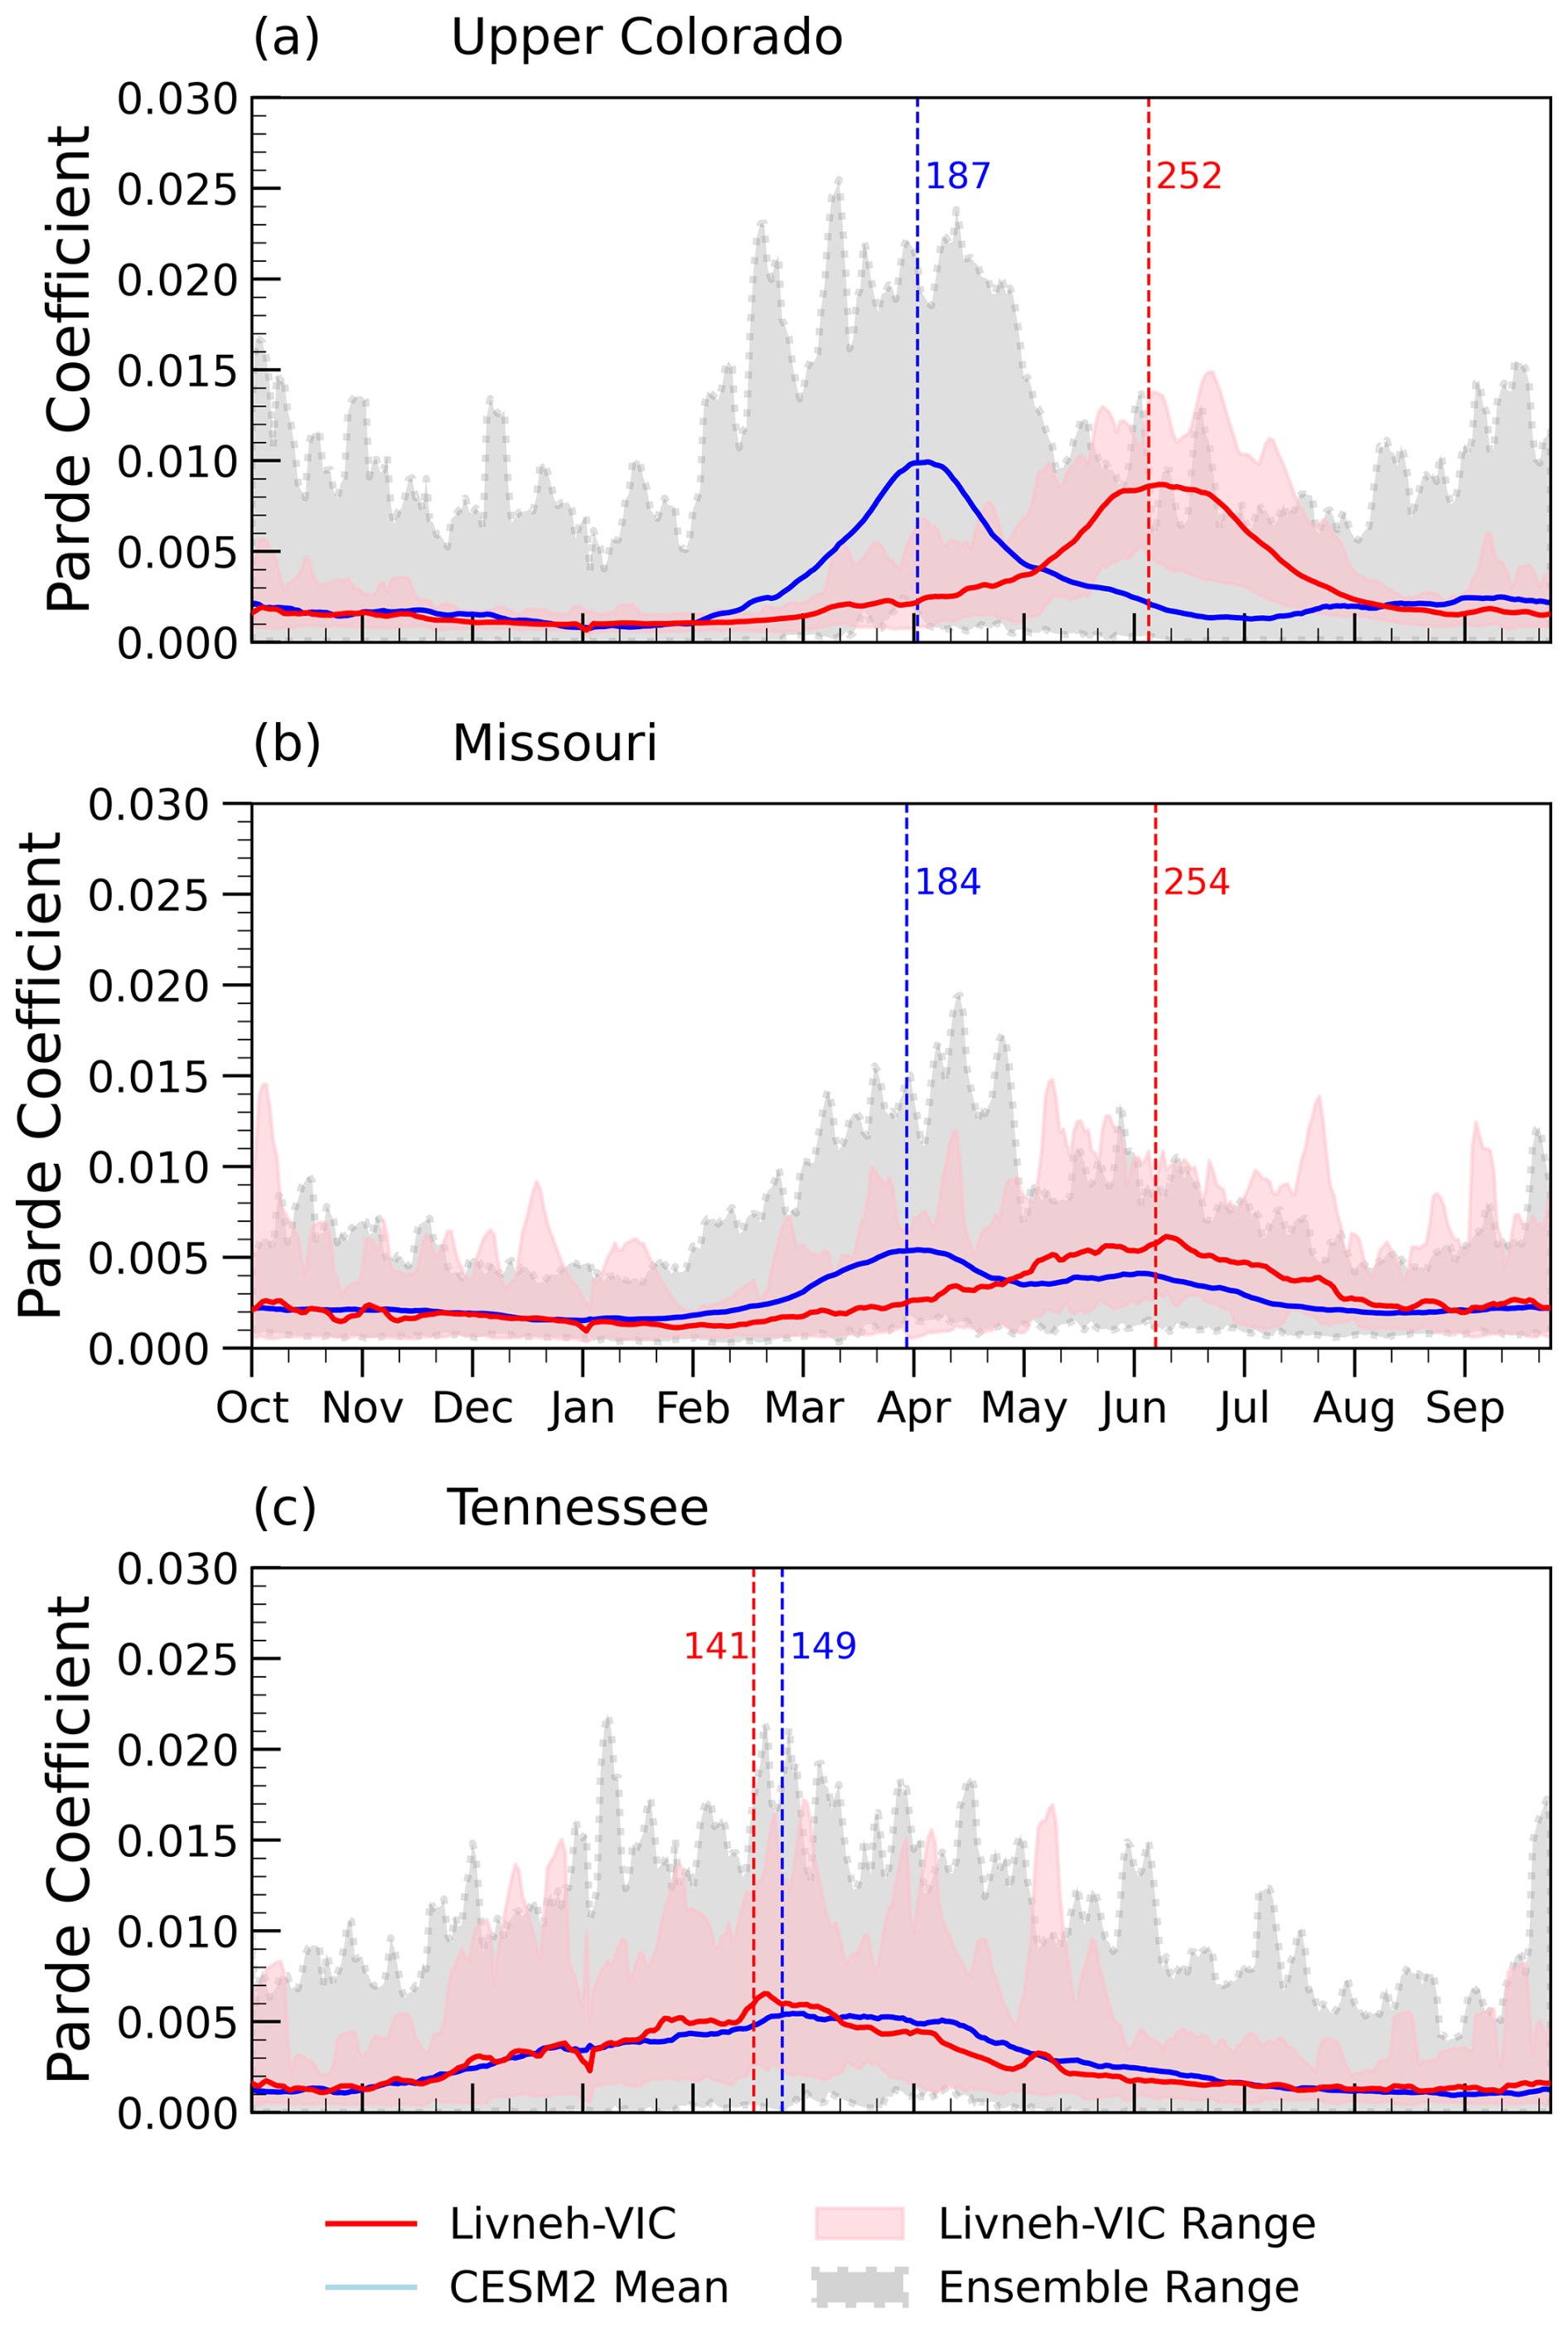
Figure 8Seasonal patterns of runoff for HUC2 regions: (a) UC, (b) TN, and (c) MR, constructed from normalized series of the ratio of 7 d mean runoff to the mean annual total. Livneh-VIC runoff climatological mean (red), climatological range (pink), CESM2 ensemble mean (blue), and ensemble range (gray with a dashed border). Vertical lines indicate the mean date of peak runoff with the number of days since the start of the water year.
Table 1Very low (7Q10) and very high (7Q90) regional runoff, together with the standard deviation in the regional annual minima (σ QMin) and maxima (σ QMax) for Livneh and CESM2. Values in bold indicate where CESM2 and Livneh-VIC regional runoff is statistically similar according to a χ2 test.
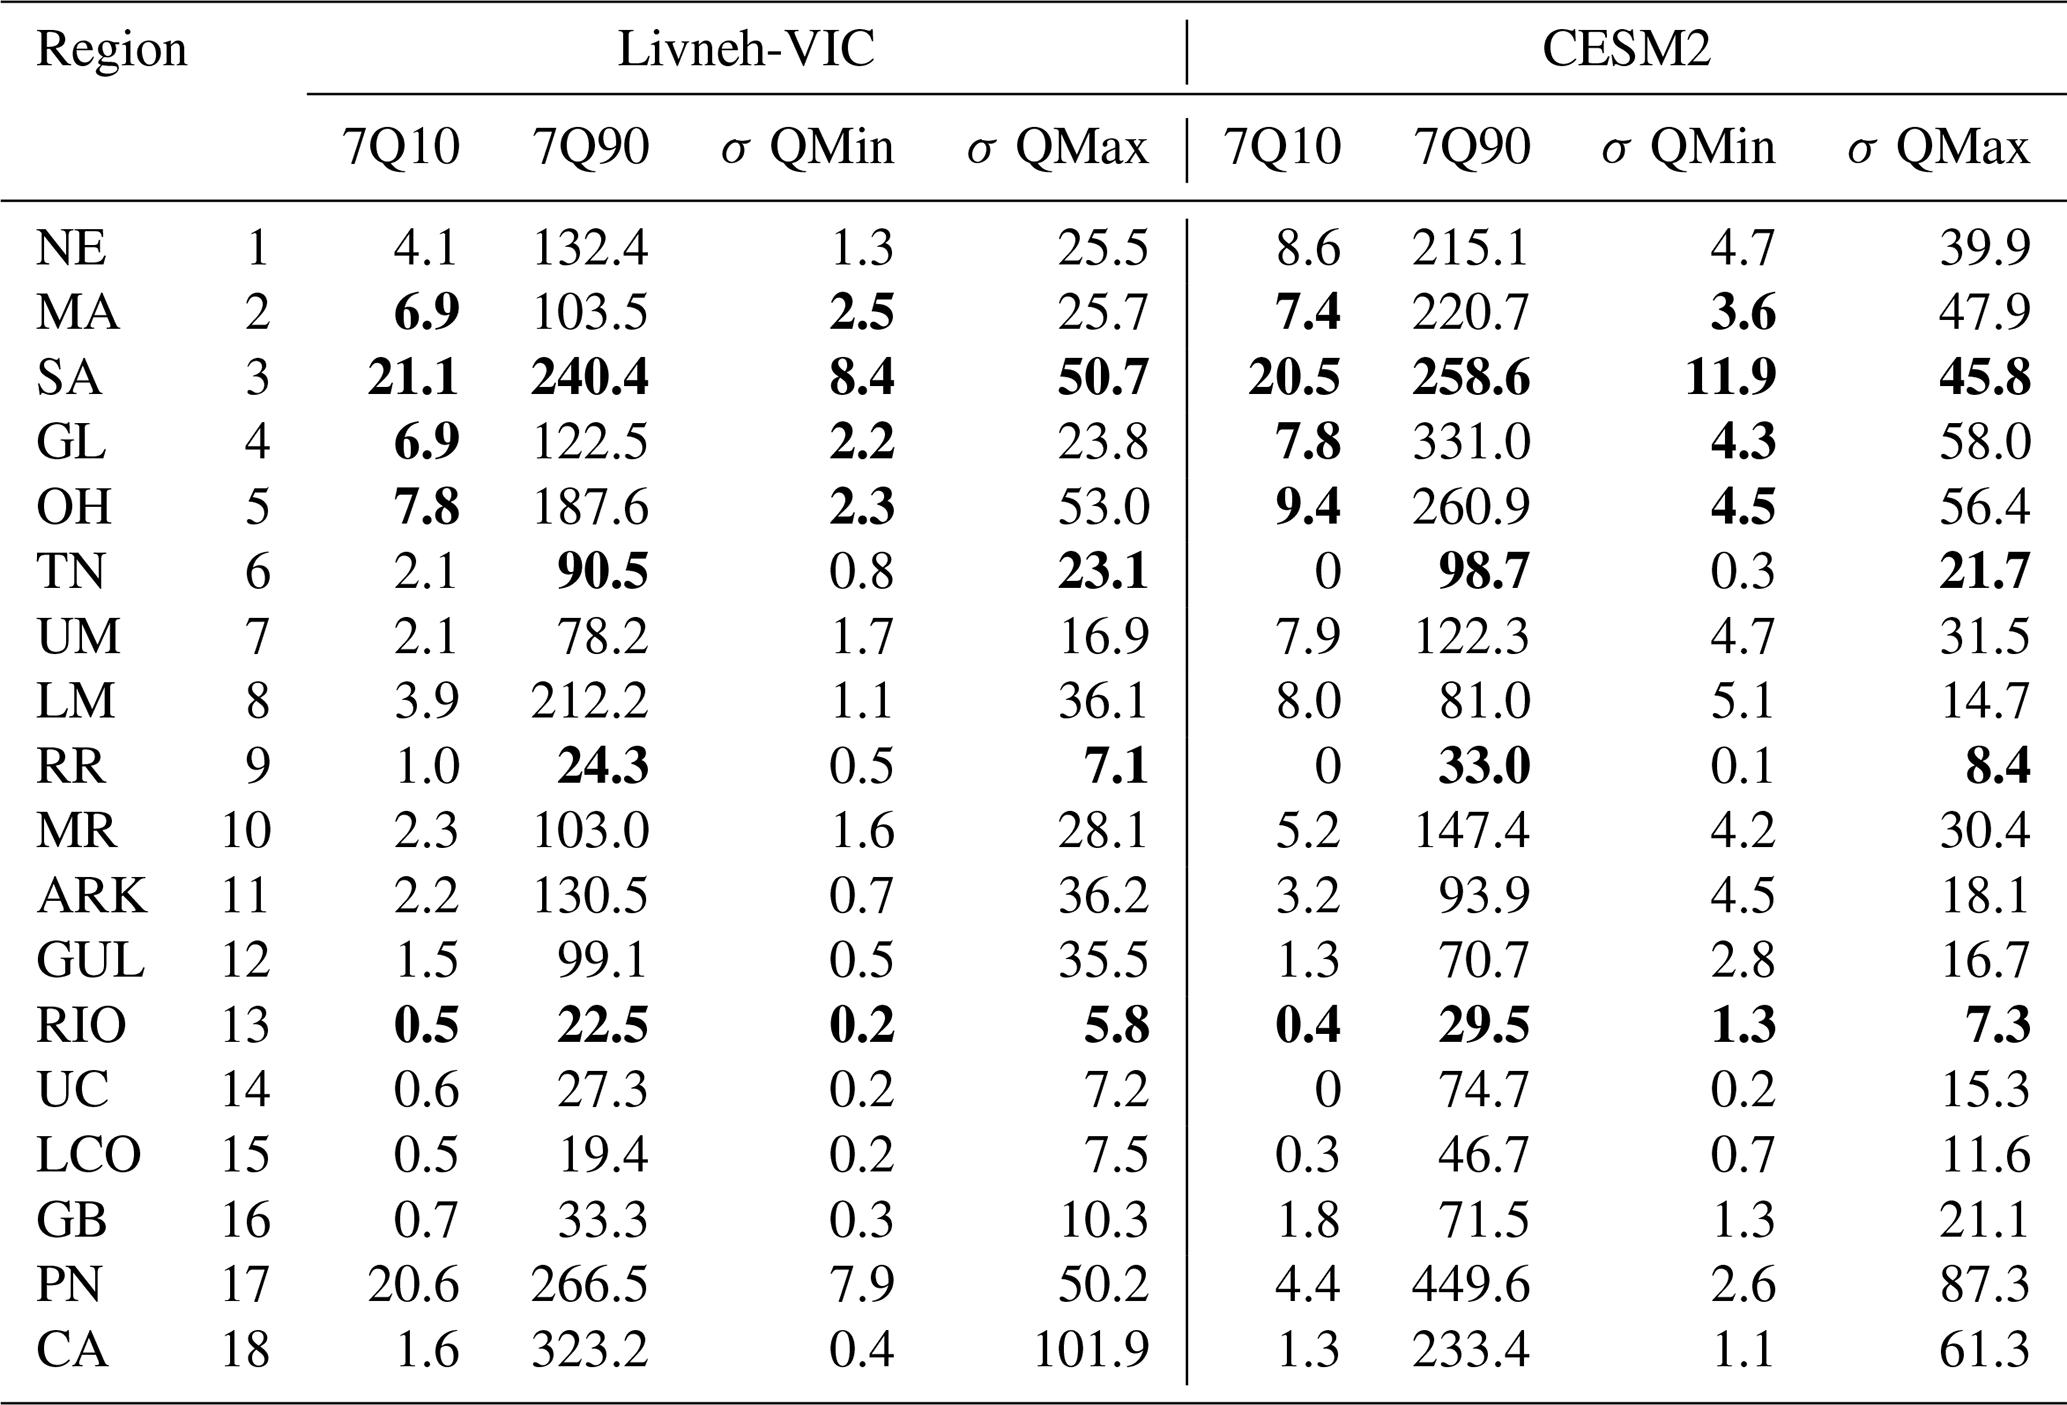
7Q10 and 7Q90 are estimated empirically from annual minima and maxima as occurring once per decade. Projected changes in the frequency of very low or very high runoff volumes are deemed credible where CESM2 replicates the standard deviation of annual minima and maxima according to a χ2 test at the 5 % significance level. Table 1 reports CESM2 and Livneh-VIC regional estimates of 7Q10 and 7Q90 and standard deviations of the annual maxima and minima; values in bold indicate where estimates are statistically similar. It should be noted that the values in Table 1 have ≤ 10 % occurring in any year and so represent the tails of the runoff distribution.
Grid-scale estimates such as mean daily runoff readily highlight why decision-makers have low confidence in CESM2 output: the metrics are not salient and appear to have no skill. After aggregating the 7 d mean daily runoff to watershed scales, some skill emerges in the annual minima and maxima as well as the seasonal cycles. Snow-dominated watersheds perform poorly with regard to the peak runoff volume and the timings of the peaks and lows, as expected (McCrary et al., 2022). Rain-dominated watersheds capture the interannual variability and magnitudes of the peak and low flows as well as the seasonal hydrographs. While CESM2 at this coarse scale does not represent the local topography and cannot represent finer-scale snow, our analysis indicates that the land surface model correctly simulates the overall bulk water budget for most watersheds, as illustrated in Figs. 7 and 8. However, the tail behavior of the highest and lowest total watershed runoffs is only captured by a few basins, and so caution needs to be exercised in the interpretation and use of model results, as biases may propagate into the future. This is premised on the understanding of why the model can produce accurate results and whether the accuracy can be reproduced reliably for the future climate (Wagener et al., 2022).
While participants in the NSF NCAR workshop stated that precise estimates are not necessary, they also emphasized their desire for high confidence in the projected scale and direction of any changes. We note that “confidence” is derived from a combination of (1) credible process representation; (2) agreement with historical trends, given internal variability; and (3) agreement across multiple models. It is worth noting that trends in extremes may be important without being statistically significant, as a limited sample of points (e.g., one per year) from a stochastic series is inherently noisy. However, some of these trends may emerge from the noise in the distribution and so are important to monitor.
As decision-makers have become more immersed in developing water management adaptation plans, the role of “climate services” in developing salient climate information has increased (Briley et al., 2020; Brugger et al., 2016; Dilling et al., 2019). We tested our hypothesis that recent improvements in ESMs can allow decision-relevant metrics to be produced directly by leveraging the combined experience of the author team, results from the NCAR workshop, and the wealth of literature on actionable knowledge (Bremer et al., 2020; Jagannathan et al., 2021; Mach et al., 2020; Vano et al., 2014). Given that no model can perfectly address all decision needs, we identified and evaluated multiple metrics that can frame specific water management decisions within the known constraints of the data (Lempert, 2021) or within the decision-makers' experiences (Austin, 2023; Clifford et al., 2020; Reed et al., 2022; Shepherd et al., 2018).
It is important to communicate the original purpose of the model and the associated weaknesses, so that decision-makers fully understand which information is appropriate to use in other applications (Fisher and Koven, 2020; Gettelman and Rood, 2016; Wagener et al., 2022). Given the balance between model fidelity and model complexity (Clark et al., 2015) and the absence of detailed global-scale observation data (e.g., Gleason and Smith, 2014; Reba et al., 2011), CESM2 provides a plausible representation of Earth system processes and moisture fluxes but may not capture basin-scale specifics (Ek, 2018; Lehner et al., 2019). That said, there are continued efforts to improve the simulation of land surface processes, and analyses such as those presented in this article can flag weaknesses for future improvement (Lawrence et al., 2019).
Establishing model fidelity also requires one to distinguish between an accurate representation of the climate processes from serendipitous correlations and observations. Whether the model has good process representation overall or exactitude in one simulation can be established through internal variability analyses using large ensembles (e.g., Deser et al., 2020; Tebaldi et al., 2021). Repeating the analyses with several different ESMs to establish the degree of agreement (Mankin et al., 2020) would further strengthen the usability of the metrics presented in this article. It is also worth noting that the analysis presented here only used one reference dataset. As different reanalysis and observational datasets can have large discrepancies, a thorough model evaluation would also benefit from comparison to several products (Kim et al., 2020; Newman et al., 2015), including an assessment of how removing temporal adjustments in observations affects the statistics of extremes (Pierce et al., 2021).
While the precise details of precipitation and runoff may not be simulated well by CESM2, we found some aspects to be credible. The frequency of wet days highlighted regions where the current seasonal behavior is captured well and may support planning around flood and drought control or wildfire risk when used in combination with other models or data sources (Austin, 2023; Clifford et al., 2020; Jagannathan et al., 2021; Reclamation, 2016).
This paper presented an assessment of whether a standard-resolution (∼ 100 km grid) Earth system model is capable of producing information that water users typically employ in their decisions. Our motivation was to explore whether it is possible to reduce the need for intermediate downscaling and to extend the use of large model ensembles to quantification of the influence of internal variability on localized decisions. We drew on the combined experience of the project team and workshop participants to identify potential metrics and familiar modes of visualization. This project only used CESM2 over the conterminous United States to develop example metrics that may be explored within other models and over other regions. CESM2 is unable to reproduce some metrics given the lack of topographical detail. A companion paper by Rugg et al. (2023) examines potential improvements to the subgrid-scale simulation of land processes in order to improve the representation of the hydrological cycle in mountainous regions.
We encourage others working in the decision space between climate data producers and users to be forthcoming about specific regions and reasons where model data are not credible or where the model has particular weaknesses (such as the drizzle effect) that may be overcome with a different analysis approach.
For future model assessors, the following metrics were found to be salient for water users and were skillfully reproduced in many regions.
Rainfall:
-
Number of wet days (≥ 1 mm of rain) per year or season
-
Mean precipitation on wet days
-
Duration of the longest wet and dry spells per year
-
Number of days with rain > 95th percentile of the current climate's wet day totals
-
Proportion of the annual total derived from days > 95th percentile of the wet day totals
Runoff (aggregated up to the basin level as a volume for 3 and 7 d averages):
-
Annual maxima and minima
-
Frequency of very high or very low flows (< 10 % annual chance of occurring in the current climate)
-
Proportion of averaged daily runoff in the annual total
The work presented in this paper is a small step towards establishing greater usability of climate model output by decision-makers. The present evaluation is also only the first step in evaluating ESM performance. Additional research is needed to support water managers, placing these results and their uncertainty in the context of additional observational data (such as remote sensing) that may already be available to them. Continued collaboration is essential for improving the transfer of knowledge (e.g., data requirements, model assumptions, or decision constraints) between communities.
Table A1Hydrometeorological responses used in water management decisions and the specific metrics that have the potential for representation in ESMs. The metrics in bold are presented in this article.
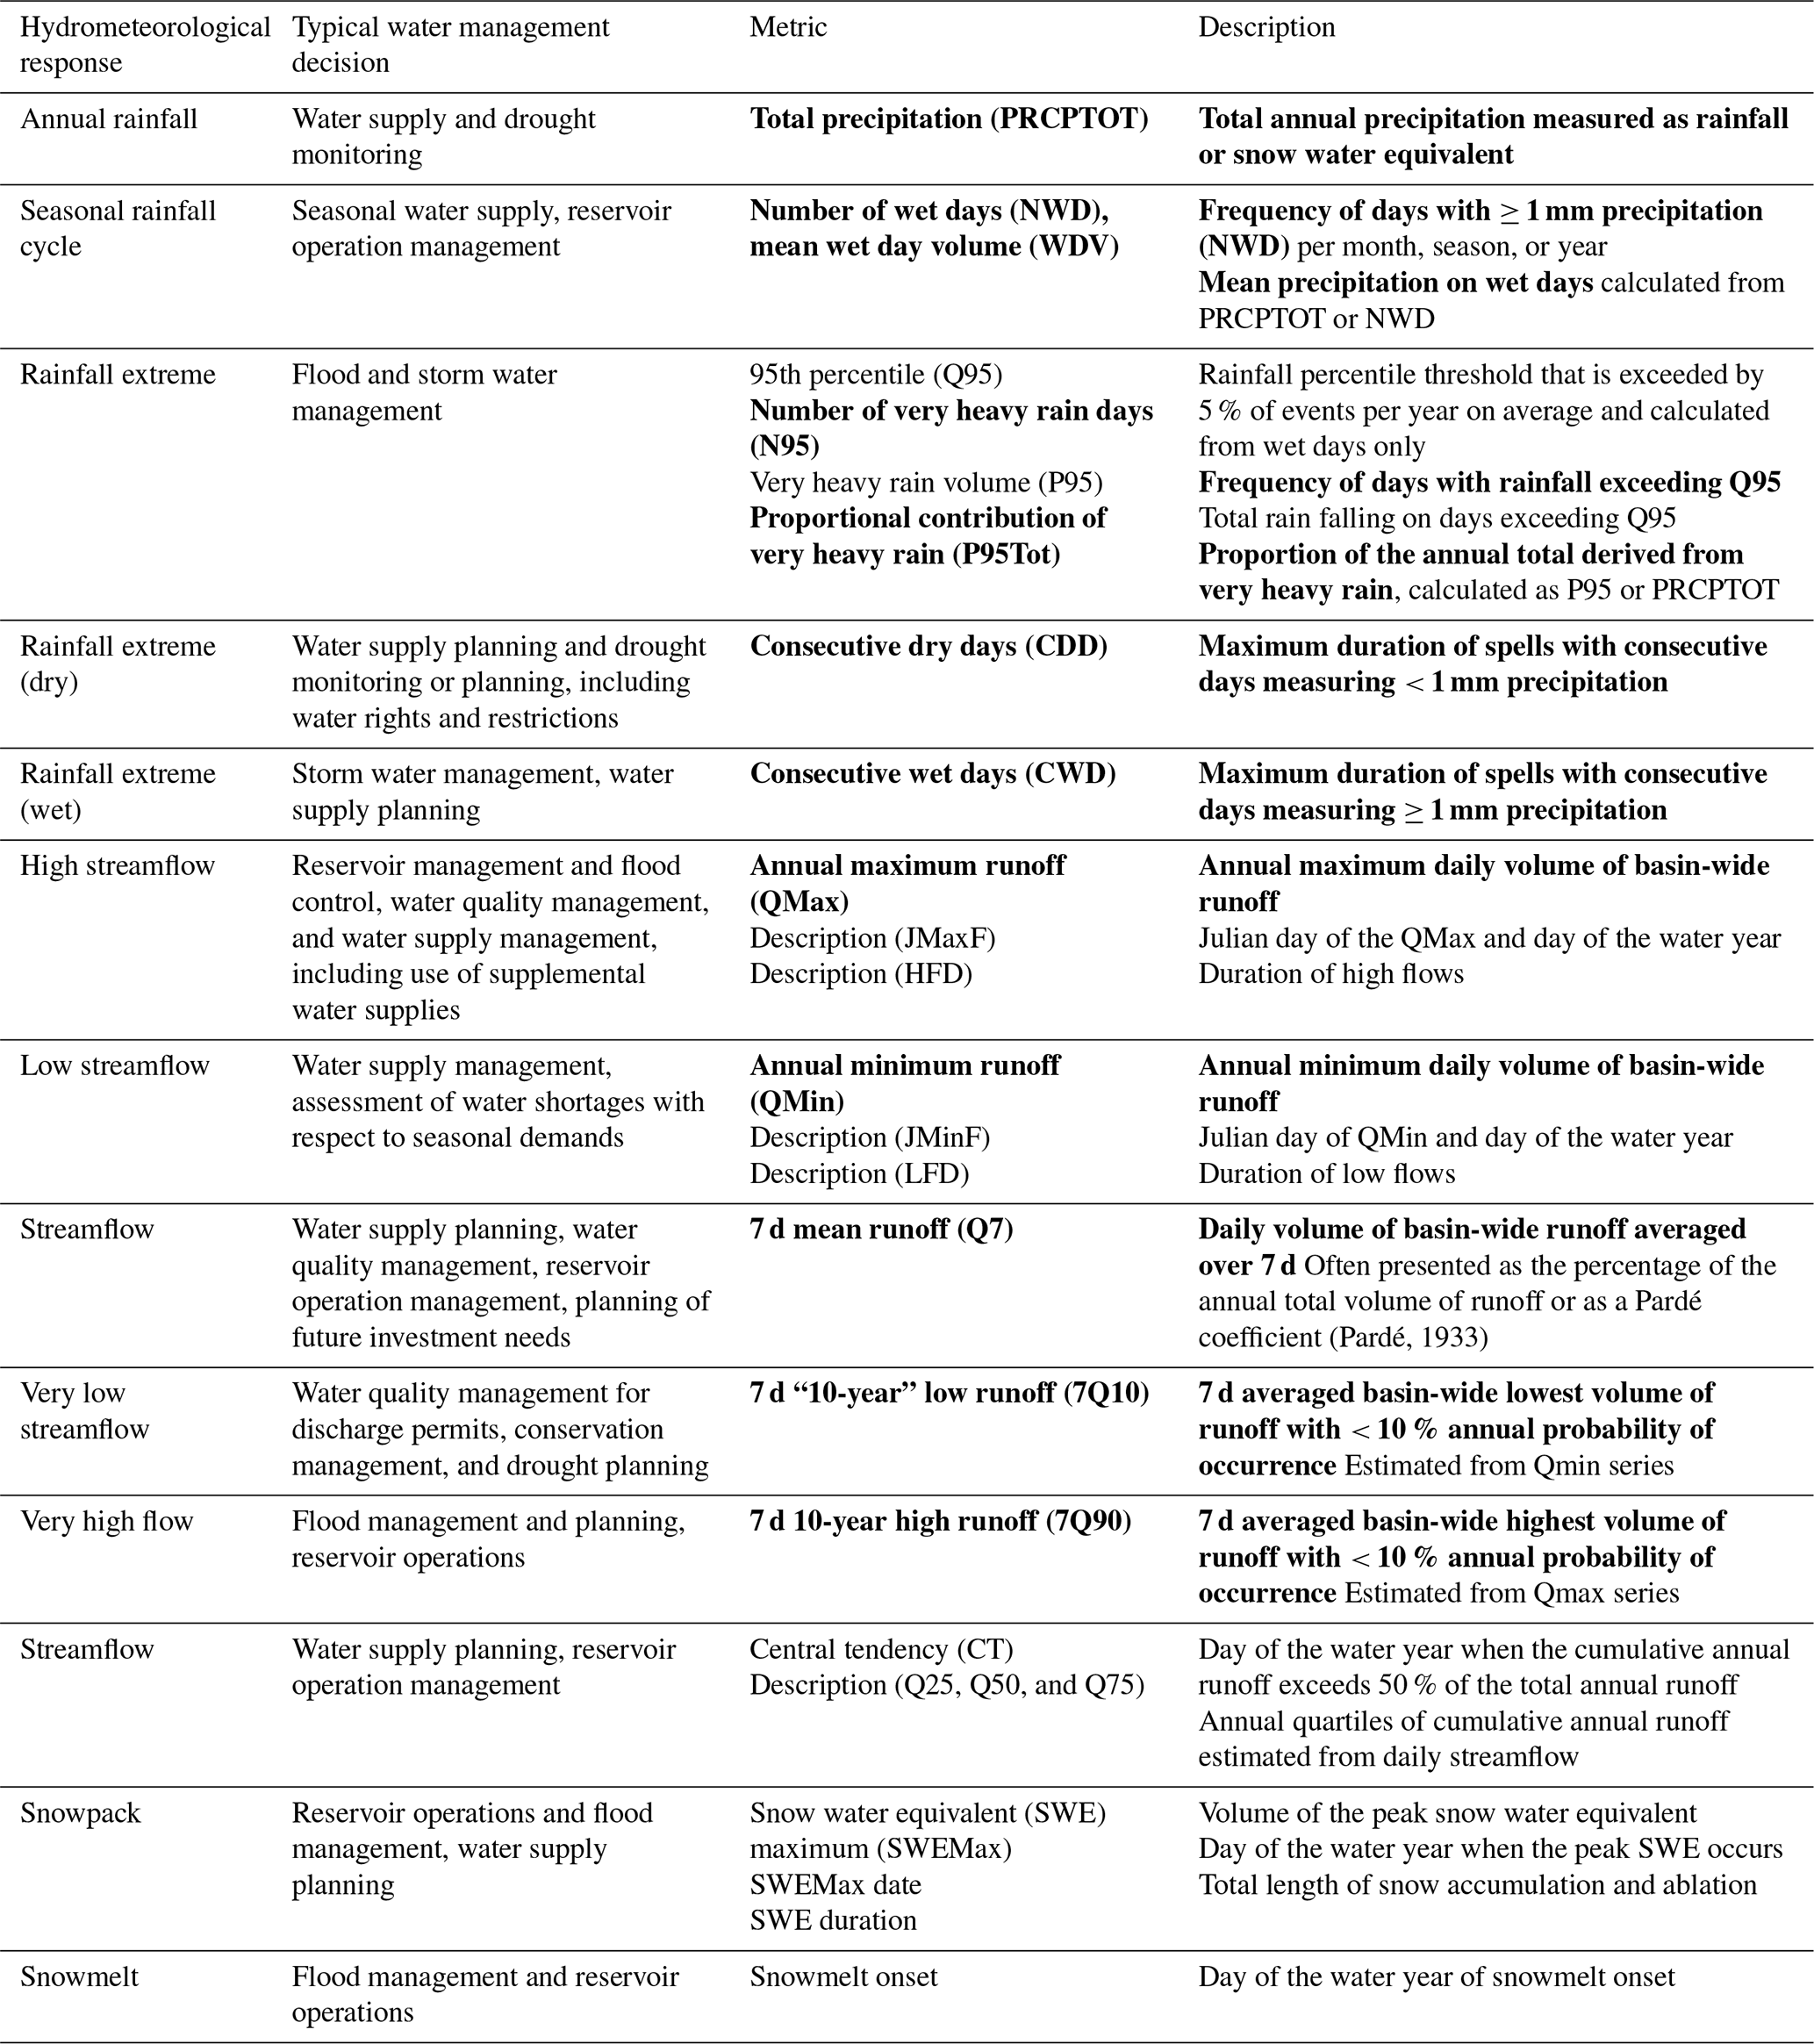
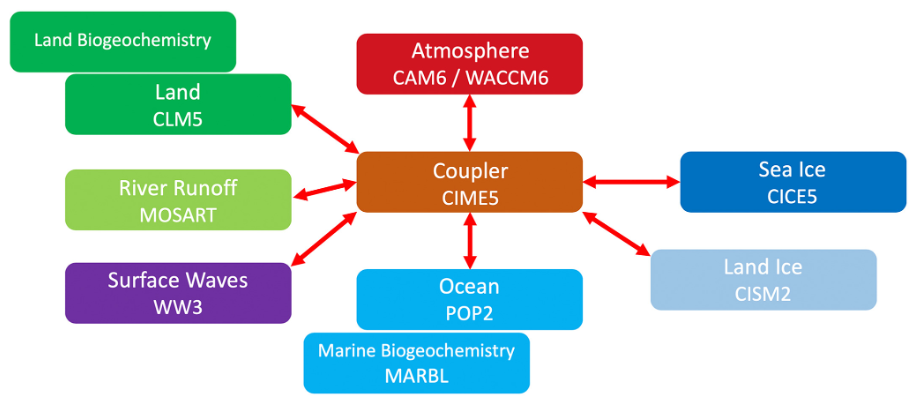
Figure B1Schematic of the Community Earth System Model version 2 (CESM2) model components, reproduced from Danabasoglu et al. (2020, Fig. 1).
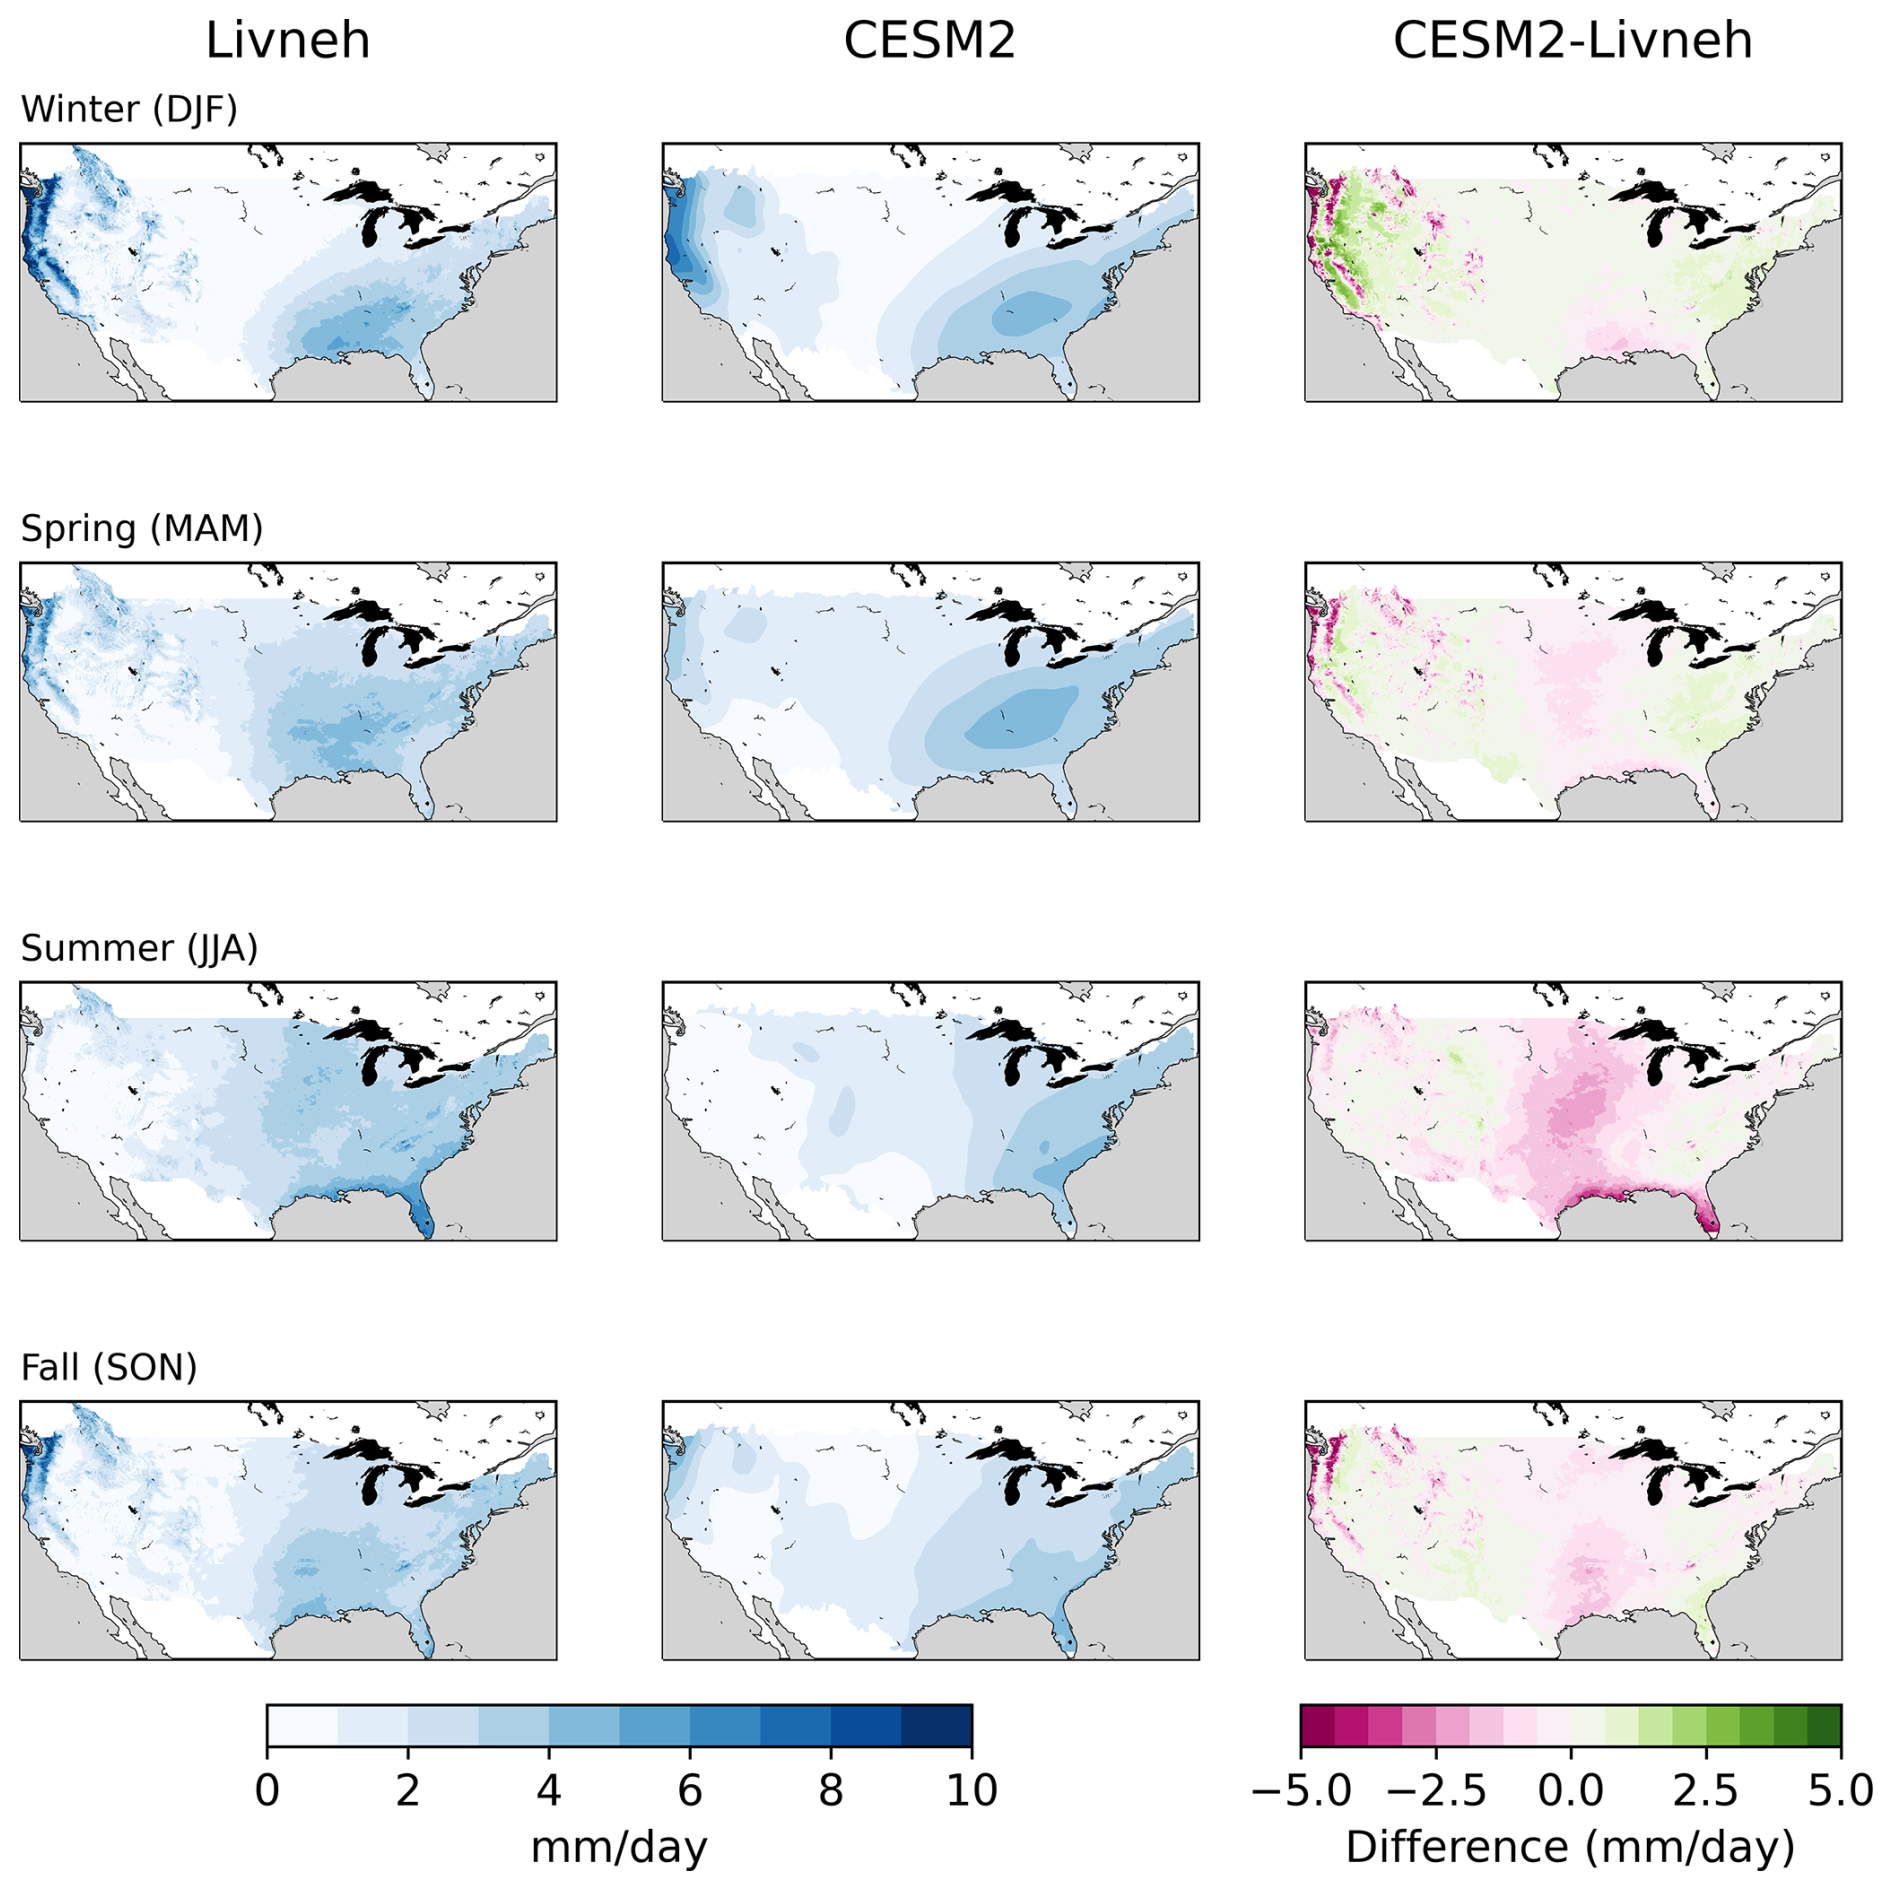
Figure C1Seasonal mean precipitation for winter (top row), spring (row 2), summer (row 3), and fall (bottom row) as shown in Livneh (left column) and CESM2 (middle column), together with the difference CESM2 − Livneh (right column).
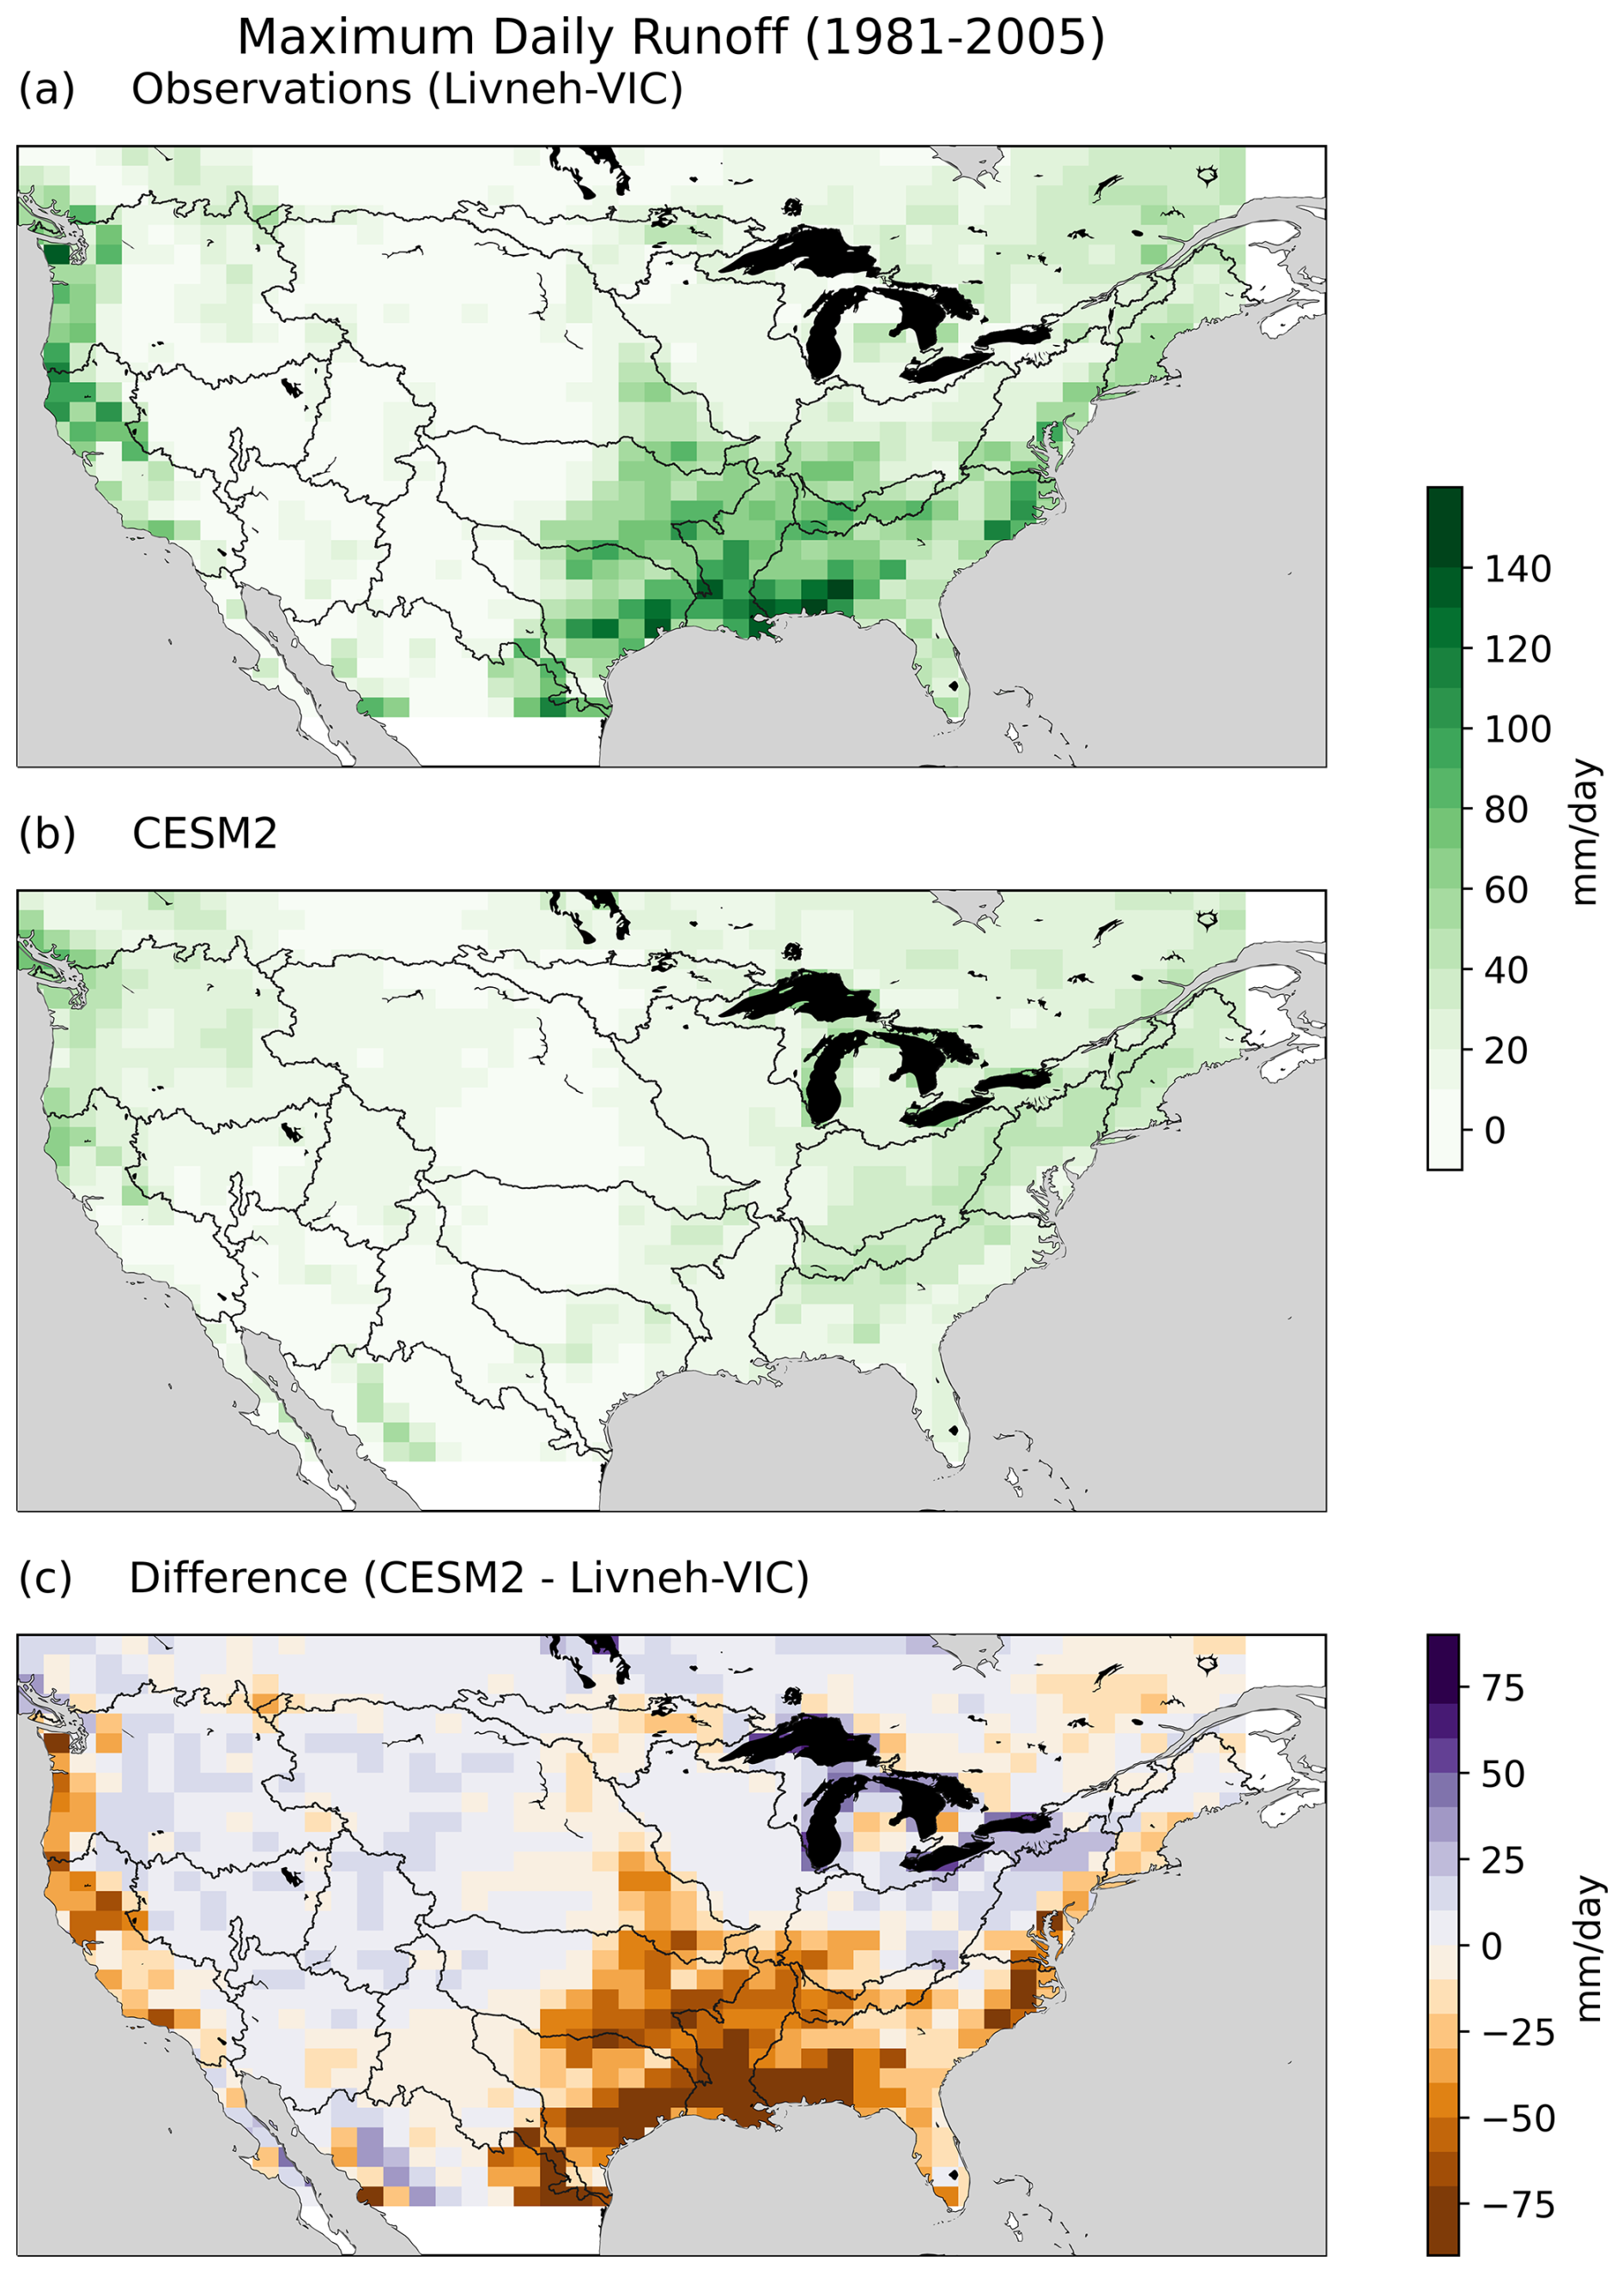
Figure D1Comparison of the maximum daily runoff between 1981 and 2005 in (a) Livneh, (b) CESM2, and (c) the difference CESM2 − Livneh.
All the data generated for this study (e.g., CESM2- and Livneh-VIC-calculated indices) along with Jupyter notebooks to recreate the tables and figures are available in the repository at https://github.com/maritye/PSIF_water_avail (last access: 5 January 2025) (https://doi.org/10.5281/zenodo.14611111; Tye and Ge, 2025).
The supplement related to this article is available online at https://doi.org/10.5194/hess-29-1117-2025-supplement.
Conceptualization: MRT, JHR, EDG, AJN, AW, and RM. Methodology: MRT, JHR, and EDG. Investigation: MG and MRT. Data curation: MG and MRT. Writing – original draft: MRT, AR, and RM. Writing – review and editing: MRT, JHR, EDG, AJN, AW, RM, AR, FL, CLB, and SEH. Visualization: CLB, MG, and MRT. Supervision: JHR, EDG, AJN, FL, and AW. Funding acquisition: JHR, EDG, AJN, AW, FL, CLB, SEH, and MRT. Project administration: JHR.
The contact author has declared that none of the authors has any competing interests.
Publisher's note: Copernicus Publications remains neutral with regard to jurisdictional claims made in the text, published maps, institutional affiliations, or any other geographical representation in this paper. While Copernicus Publications makes every effort to include appropriate place names, the final responsibility lies with the authors.
This material is based upon work supported by the NSF National Center for Atmospheric Research, which is a major facility sponsored by the US National Science Foundation under cooperative agreement no. 1852977. Computing resources were provided by the Climate Simulation Laboratory at NCAR's Computational and Information Systems Laboratory (CISL). The CESM project is supported primarily by the NSF. We thank all the scientists, software engineers, and administrators who contributed to the development of CESM2. For the CESM2 Large Ensemble output we thank the CESM2 Large Ensemble Community Project and are grateful for the supercomputing resources provided by the IBS Center for Climate Physics in South Korea. This research was primarily supported by the UCAR President's Strategic Initiative Fund. Portions of this study were supported by the Regional and Global Model Analysis (RGMA) component of the Earth and Environmental System Modeling Program of the U.S. Department of Energy's Office of Biological and Environmental Research
This research has been supported by the National Science Foundation (grant no. 1852977) and the US Department of Energy's Office of Biological and Environmental Research (grant no. DE-SC0022070).
This paper was edited by Yongping Wei and reviewed by Fabian Stenzel and three anonymous referees.
ASCE: Standard Guidelines for the Design of Urban Stormwater Systems, Standard Guidelines for Installation of Urban Stormwater Systems, and Standard Guidelines for the Operation and Maintenance of Urban Stormwater Systems, 45th edn., American Society of Civil Engineers, Reston, VA, https://doi.org/10.1061/9780784408063, 2006.
Austin, C.: Jeanine Jones: Drought and lessons learned. Maven’s Notebook | Water News, https://mavensnotebook.com/2023/03/01/jeanine-jones-drought-and-lessons-learned/ (last access: 5 February 2023), 2023.
Bachmair, S., Stahl, K., Collins, K., Hannaford, J., Acreman, M., Svoboda, M., Knutson, C., Smith, K. H., Wall, N., Fuchs, B., Crossman, N. D., and Overton, I. C.: Drought indicators revisited: the need for a wider consideration of environment and society, WIREs Water, 3, 516–536, https://doi.org/10.1002/wat2.1154, 2016.
Brekke, L. D.: Addressing Climate Change in Long-Term Water Resources Planning and Management: User Needs for Improving Tools and Information, Bureau of Reclamation, Technical Service Center, Denver, https://www.usbr.gov/climate/userneeds/ (last access: 20 February 2025), 2011.
Brekke, L. D., Kiang, J. E., Olsen, J. R., Pulwarty, R. S., Raff, D. A., Turnipseed, D. P., Webb, R. S., and White, K. D.: Climate change and water resources management – A federal perspective, U.S. Geological Survey, https://doi.org/10.3133/cir1331, 2009.
Bremer, L. L., Hamel, P., Ponette-González, A. G., Pompeu, P. V., Saad, S. I., and Brauman, K. A.: Who Are we Measuring and Modeling for? Supporting Multilevel Decision-Making in Watershed Management, Water Resour. Res., 56, e2019WR02601, https://doi.org/10.1029/2019WR026011, 2020.
Briley, L., Kelly, R., Blackmer, E. D., Troncoso, A. V., Rood, R. B., Andresen, J., and Lemos, M. C.: Increasing the Usability of Climate Models through the Use of Consumer-Report-Style Resources for Decision-Making, B. Am. Meteorol. Soc., 101, E1709–E1717, https://doi.org/10.1175/BAMS-D-19-0099.1, 2020.
Brugger, J., Meadow, A., and Horangic, A.: Lessons from First-Generation Climate Science Integrators, B. Am. Meteorol. Soc., 97, 355–365, https://doi.org/10.1175/BAMS-D-14-00289.1, 2016.
Brunner, M. I., Slater, L., Tallaksen, L. M., and Clark, M.: Challenges in modeling and predicting floods and droughts: A review, WIREs Water, 8, e1520, https://doi.org/10.1002/wat2.1520, 2021.
Cantor, A., Kiparsky, M., Kennedy, R., Hubbard, S., Bales, R., Pecharroman, L. C., Guivetchi, K., McCready, C., and Darling, G.: Data for Water Decision Making: Informing the Implementation of California's Open and Transparent Water Data Act through Research and Engagement, Wheeler Water Institute, Center for Law, Energy & the Environment, UC Berkeley School of Law, Berkeley, CA, https://doi.org/10.15779/J28H01, 2018.
Chen, D., Dai, A., and Hall, A.: The Convective-To-Total Precipitation Ratio and the “Drizzling” Bias in Climate Models, J. Geophys. Res.-Atmos., 126, e2020JD034198, https://doi.org/10.1029/2020JD034198, 2021.
Chen, M., Dickinson, R. E., Zeng, X., and Hahmann., A. N.: Comparison of Precipitation Observed over the Continental United States to That Simulated by a Climate Model, J. Climate, 9, 2233–2249, https://doi.org/10.1175/1520-0442(1996)009<2233:COPOOT>2.0.CO;2, 1996.
Clark, M. P., Fan, Y., Lawrence, D. M., Adam, J. C., Bolster, D., Gochis, D. J., Hooper, R. P., Kumar, M., Leung, L. R., Mackay, D. S., Maxwell, R. M., Shen, C., Swenson, S. C., and Zeng, X.: Improving the representation of hydrologic processes in Earth System Models, Water Resour. Res., 51, 5929–5956, https://doi.org/10.1002/2015WR017096, 2015.
Clifford, K. R., Travis, W. R., and Nordgren, L. T.: A climate knowledges approach to climate services, Climate Services, 18, 100155, https://doi.org/10.1016/j.cliser.2020.100155, 2020.
Dai, A.: Precipitation Characteristics in Eighteen Coupled Climate Models, J. Climate, 19, 4605–4630, https://doi.org/10.1175/JCLI3884.1, 2006.
Danabasoglu, G. and Lamarque, J.-F.: Building a Better Model to View Earth's Interacting Processes, Eos, 102, 2021EO155818, https://doi.org/10.1029/2021EO155818, 2021.
Danabasoglu, G., Lamarque, J. -F., Bacmeister, J., Bailey, D. A., DuVivier, A. K., Edwards, J., Emmons, L. K., Fasullo, J., Garcia, R., Gettelman, A., Hannay, C., Holland, M. M., Large, W. G., Lauritzen, P. H., Lawrence, D. M., Lenaerts, J. T. M., Lindsay, K., Lipscomb, W. H., Mills, M. J., Neale, R., Oleson, K. W., Otto-Bliesner, B., Phillips, A. S., Sacks, W., Tilmes, S., Kampenhout, L., Vertenstein, M., Bertini, A., Dennis, J., Deser, C., Fischer, C., Fox-Kemper, B., Kay, J. E., Kinnison, D., Kushner, P. J., Larson, V. E., Long, M. C., Mickelson, S., Moore, J. K., Nienhouse, E., Polvani, L., Rasch, P. J., and Strand, W. G.: The Community Earth System Model Version 2 (CESM2), J. Adv. Model. Earth Syst., 12, e2019MS00191, https://doi.org/10.1029/2019MS001916, 2020.
Deser, C., Knutti, R., Solomon, S., and Phillips, A. S.: Communication of the role of natural variability in future North American climate, Nat. Clim. Change, 2, 775–779, https://doi.org/10.1038/nclimate1562, 2012.
Deser, C., Lehner, F., Rodgers, K. B., Ault, T., Delworth, T. L., DiNezio, P. N., Fiore, A., Frankignoul, C., Fyfe, J. C., Horton, D. E., Kay, J. E., Knutti, R., Lovenduski, N. S., Marotzke, J., McKinnon, K. A., Minobe, S., Randerson, J., Screen, J. A., Simpson, I. R., and Ting, M.: Insights from Earth system model initial-condition large ensembles and future prospects, Nat. Clim. Chang., 10, 277–286, https://doi.org/10.1038/s41558-020-0731-2, 2020.
Dilling, L., Daly, M. E., Kenney, D. A., Klein, R., Miller, K., Ray, A. J., Travis, W. R., and Wilhelmi, O.: Drought in urban water systems: Learning lessons for climate adaptive capacity, Climate Risk Management, 23, 32–42, https://doi.org/10.1016/j.crm.2018.11.001, 2019.
Ek, M. B.: Land Surface Hydrological Models, in: Handbook of Hydrometeorological Ensemble Forecasting, edited by: Duan, Q., Pappenberger, F., Thielen, J., Wood, A., Cloke, H. L., and Schaake, J. C., Springer Berlin Heidelberg, Berlin, Heidelberg, 1–42, https://doi.org/10.1007/978-3-642-40457-3_24-1, 2018.
Ekström, M., Gutmann, E. D., Wilby, R. L., Tye, M. R., and Kirono, D. G. C.: Robustness of hydroclimate metrics for climate change impact research, WIREs Water, 5, e1288, https://doi.org/10.1002/wat2.1288, 2018.
Feng, R., Otto-Bliesner, B. L., Brady, E. C., and Rosenbloom, N.: Increased Climate Response and Earth System Sensitivity From CCSM4 to CESM2 in Mid-Pliocene Simulations, J. Adv. Model. Earth Syst., 12, https://doi.org/10.1029/2019MS002033, 2020.
Fisher, R. A. and Koven, C. D.: Perspectives on the Future of Land Surface Models and the Challenges of Representing Complex Terrestrial Systems, J. Adv. Model. Earth Syst., 12, e2018MS00145, https://doi.org/10.1029/2018MS001453, 2020.
Gervais, M., Gyakum, J. R., Atallah, E., Tremblay, L. B., and Neale, R. B.: How Well Are the Distribution and Extreme Values of Daily Precipitation over North America Represented in the Community Climate System Model? A Comparison to Reanalysis, Satellite, and Gridded Station Data, J. Climate, 27, 5219–5239, https://doi.org/10.1175/JCLI-D-13-00320.1, 2014.
Gettelman, A. and Rood, R. B.: Usability of Climate Model Projections by Practitioners, in: Demystifying Climate Models, vol. 2, Springer Berlin Heidelberg, Berlin, Heidelberg, 221–236, https://doi.org/10.1007/978-3-662-48959-8_12, 2016.
Gettelman, A., Geer, A. J., Forbes, R. M., Carmichael, G. R., Feingold, G., Posselt, D. J., Stephens, G. L., van den Heever, S. C., Varble, A. C., and Zuidema, P.: The future of Earth system prediction: Advances in model-data fusion, Sci. Adv., 8, eabn3488, https://doi.org/10.1126/sciadv.abn3488, 2022.
Gleason, C. J. and Smith, L. C.: Toward global mapping of river discharge using satellite images and at-many-stations hydraulic geometry, P. Natl. Acad. Sci. USA, 111, 4788–4791, https://doi.org/10.1073/pnas.1317606111, 2014.
Haines, A. T., Finlayson, B. L., and McMahon, T. A.: A global classification of river regimes, Appl. Geogr., 8, 255–272, https://doi.org/10.1016/0143-6228(88)90035-5, 1988.
IPCC: Climate Change 2022: Impacts, Adaptation, and Vulnerability. Contribution of Working Group II to the Sixth Assessment Report of the Intergovernmental Panel on Climate Change, edited by: Pörtner, H.-O., Roberts, D. C., Tignor, M., Poloczanska, E. S., Mintenbeck, K., Alegría, A., Craig, M., Langsdorf, S., Löschke, S., Möller, V., Okem, A., and Rama, B., Cambridge University Press, https://doi.org/10.1017/9781009325844, 2022.
Jagannathan, K., Jones, A. D., and Ray, I.: The Making of a Metric: Co-Producing Decision-Relevant Climate Science, B. Am. Meteorol. Soc., 102, E1579–E1590, https://doi.org/10.1175/BAMS-D-19-0296.1, 2021.
Jones, P. W.: First- and Second-Order Conservative Remapping Schemes for Grids in Spherical Coordinates, Mon. Weather Rev., 127, 2204–2210, https://doi.org/10.1175/1520-0493(1999)127<2204:FASOCR>2.0.CO;2, 1999.
Kim, Y.-H., Min, S.-K., Zhang, X., Sillmann, J., and Sandstad, M.: Evaluation of the CMIP6 multi-model ensemble for climate extreme indices, Weather and Climate Extremes, 29, 100269, https://doi.org/10.1016/j.wace.2020.100269, 2020.
Lawrence, D. M., Fisher, R. A., Koven, C. D., Oleson, K. W., Swenson, S. C., Bonan, G., Collier, N., Ghimire, B., Kampenhout, L., Kennedy, D., Kluzek, E., Lawrence, P. J., Li, F., Li, H., Lombardozzi, D., Riley, W. J., Sacks, W. J., Shi, M., Vertenstein, M., Wieder, W. R., Xu, C., Ali, A. A., Badger, A. M., Bisht, G., Broeke, M., Brunke, M. A., Burns, S. P., Buzan, J., Clark, M., Craig, A., Dahlin, K., Drewniak, B., Fisher, J. B., Flanner, M., Fox, A. M., Gentine, P., Hoffman, F., Keppel-Aleks, G., Knox, R., Kumar, S., Lenaerts, J., Leung, L. R., Lipscomb, W. H., Lu, Y., Pandey, A., Pelletier, J. D., Perket, J., Randerson, J. T., Ricciuto, D. M., Sanderson, B. M., Slater, A., Subin, Z. M., Tang, J., Thomas, R. Q., Val Martin, M., and Zeng, X.: The Community Land Model Version 5: Description of New Features, Benchmarking, and Impact of Forcing Uncertainty, J. Adv. Model. Earth Syst., 11, 4245–4287, https://doi.org/10.1029/2018MS001583, 2019.
Lehner, F., Wood, A. W., Vano, J. A., Lawrence, D. M., Clark, M. P., and Mankin, J. S.: The potential to reduce uncertainty in regional runoff projections from climate models, Nat. Clim. Chang., 9, 926–933, https://doi.org/10.1038/s41558-019-0639-x, 2019.
Lempert, R. J.: Measuring global climate risk, Nat. Clim. Chang., 11, 805–806, https://doi.org/10.1038/s41558-021-01165-9, 2021.
Liang, X., Lettenmaier, D. P., Wood, E. F., and Burges, S. J.: A simple hydrologically based model of land surface water and energy fluxes for general circulation models, J. Geophys. Res., 99, 14415, https://doi.org/10.1029/94JD00483, 1994.
Livneh, B., Rosenberg, E. A., Lin, C., Nijssen, B., Mishra, V., Andreadis, K. M., Maurer, E. P., and Lettenmaier, D. P.: A Long-Term Hydrologically Based Dataset of Land Surface Fluxes and States for the Conterminous United States: Update and Extensions, J. Climate, 26, 9384–9392, https://doi.org/10.1175/JCLI-D-12-00508.1, 2013.
Lukas, J. and Payton, E.: Colorado River Basin Climate and Hydrology: State of the Science, University of Colorado Boulder, https://doi.org/10.25810/3HCV-W477, 2020.
Mach, K. J., Lemos, M. C., Meadow, A. M., Wyborn, C., Klenk, N., Arnott, J. C., Ardoin, N. M., Fieseler, C., Moss, R. H., Nichols, L., Stults, M., Vaughan, C., and Wong-Parodi, G.: Actionable knowledge and the art of engagement, Curr. Opin. Env. Sust., 42, 30–37, https://doi.org/10.1016/j.cosust.2020.01.002, 2020.
Mankin, J. S., Lehner, F., Coats, S., and McKinnon, K. A.: The Value of Initial Condition Large Ensembles to Robust Adaptation Decision-Making, Earths Future, 8, e2012EF001610, https://doi.org/10.1029/2020EF001610, 2020.
McCrary, R. R., McGinnis, S., and Mearns, L. O.: Evaluation of Snow Water Equivalent in NARCCAP Simulations, Including Measures of Observational Uncertainty, J. Hydrometeorol., 18, 2425–2452, https://doi.org/10.1175/JHM-D-16-0264.1, 2017.
McCrary, R. R., Mearns, L. O., Hughes, M., Biner, S., and Bukovsky, M. S.: Projections of North American snow from NA-CORDEX and their uncertainties, with a focus on model resolution, Climatic Change, 170, 20, https://doi.org/10.1007/s10584-021-03294-8, 2022.
McMillan, H. K.: A review of hydrologic signatures and their applications, WIREs Water, 8, e1499, https://doi.org/10.1002/wat2.1499, 2021.
Meehl, G. A., Goddard, L., Murphy, J., Stouffer, R. J., Boer, G., Danabasoglu, G., Dixon, K., Giorgetta, M. A., Greene, A. M., Hawkins, E., Hegerl, G., Karoly, D., Keenlyside, N., Kimoto, M., Kirtman, B., Navarra, A., Pulwarty, R., Smith, D., Stammer, D., and Stockdale, T.: Decadal Prediction, B. Am. Meteorol. Soc., 90, 1467–1485, https://doi.org/10.1175/2009BAMS2778.1, 2009.
Mizukami, N., Rakovec, O., Newman, A. J., Clark, M. P., Wood, A. W., Gupta, H. V., and Kumar, R.: On the choice of calibration metrics for “high-flow” estimation using hydrologic models, Hydrol. Earth Syst. Sci., 23, 2601–2614, https://doi.org/10.5194/hess-23-2601-2019, 2019.
Moise, A., Wilson, L., Grose, M., Whetton, P., Watterson, I., Bhend, J., Bathols, J., Hanson, L., Erwin, T., Bedin, T., Heady, C., and Rafter, T.: Evaluation of CMIP3 and CMIP5 models over the Australian region to inform confidence in projections, JSHESS, 65, 19–53, https://doi.org/10.22499/2.6501.004, 2015.
Mukherjee, S., Mishra, A., and Trenberth, K. E.: Climate Change and Drought: a Perspective on Drought Indices, Curr. Clim. Change Rep., 4, 145–163, https://doi.org/10.1007/s40641-018-0098-x, 2018.
Newman, A. J., Clark, M. P., Craig, J., Nijssen, B., Wood, A., Gutmann, E., Mizukami, N., Brekke, L., and Arnold, J. R.: Gridded Ensemble Precipitation and Temperature Estimates for the Contiguous United States, J. Hydrometeorol., 16, 2481–2500, https://doi.org/10.1175/JHM-D-15-0026.1, 2015.
Pacchetti, M. B., Dessai, S., Bradley, S., and Stainforth, D. A.: Assessing the Quality of Regional Climate Information, B. Am. Meteorol. Soc., 102, E476–E491, https://doi.org/10.1175/BAMS-D-20-0008.1, 2021.
Pardé, M.: Fleuves et Rivières, Collection Armand Collin, Section de Géographie (France), Fre No. 155, OCLC Number 20064504, 1933.
Phillips, A., Deser, C., Fasullo, J., Schneider, D. P., and Simpson, I. R.: Assessing Climate Variability and Change in Model Large Ensembles: A User's Guide to the “Climate Variability Diagnostics Package for Large Ensembles”, NCAR, https://doi.org/10.5065/H7C7-F961, 2020.
Pierce, D. W., Su, L., Cayan, D. R., Risser, M. D., Livneh, B., and Lettenmaier, D. P.: An extreme-preserving long-term gridded daily precipitation data set for the conterminous United States, J. Hydrometeorol., 1883–1895, https://doi.org/10.1175/JHM-D-20-0212.1, 2021.
Raff, D. A., Brekke, L. D., Werner, K. V., Wood, A. W., and White, K. D.: Short-Term Water Management Decisions: User Needs for Improved Climate, Weather, and Hydrologic Information, Bureau of Reclamation, U.S. Army Corps of Engineers and National Oceanic and Atmospheric Administration, http://bit.ly/TJpWxK (last access: 2 January 2025), 2013.
Reba, M. L., Marks, D., Seyfried, M., Winstral, A., Kumar, M., and Flerchinger, G.: A long-term data set for hydrologic modeling in a snow-dominated mountain catchment: A 25 year data set for hydrologic modeling, Water Resour. Res., 47, W07702, https://doi.org/10.1029/2010WR010030, 2011.
Reclamation (Bureau of Reclamation): Technical Guidance for Incorporating Climate Change Information into Water Resources Planning Studies, U.S. Department of the Interior, Bureau of Reclamation, Denver, Colorado, https://cawaterlibrary.net/wp-content/uploads/2017/05/WWCRATechnicalGuidance.pdf (last access: 20 February 2025), 2014.
Reclamation (Bureau of Reclamation): SECURE Water Act Section 9503(c) – Reclamation Climate Change and Water, Prepared for United States Congress, U.S. Department of the Interior, Bureau of Reclamation, Denver, Colorado, https://www.usbr.gov/climate/secure/2016secure.html (last access: 20 February 2025), 2016.
Reed, K. A., Goldenson, N., Grotjahn, R., Gutowski, W. J., Jagannathan, K., Jones, A. D., Leung, L. R., McGinnis, S. A., Pryor, S. C., Srivastava, A. K., Ullrich, P. A., and Zarzycki, C. M.: Metrics as tools for bridging climate science and applications, WIREs Climate Change, 13, e799, https://doi.org/10.1002/wcc.799, 2022.
Regional Water Authority: Sacramento Regional Water Bank: A sustainable storage and recovery program, https://rwah2o.org/wp-content/uploads/2019/04/WaterBank_Insert_9-FINAL.pdf (last access: 20 February 2025), 2019.
Rodgers, K. B., Lee, S.-S., Rosenbloom, N., Timmermann, A., Danabasoglu, G., Deser, C., Edwards, J., Kim, J.-E., Simpson, I. R., Stein, K., Stuecker, M. F., Yamaguchi, R., Bódai, T., Chung, E.-S., Huang, L., Kim, W. M., Lamarque, J.-F., Lombardozzi, D. L., Wieder, W. R., and Yeager, S. G.: Ubiquity of human-induced changes in climate variability, Earth Syst. Dynam., 12, 1393–1411, https://doi.org/10.5194/esd-12-1393-2021, 2021.
Rugg, A., Gutmann, E. D., McCrary, R. R., Lehner, F., Newman, A. J., Richter, J. H., Tye, M. R., and Wood, A. W.: Mass-Conserving Downscaling of Climate Model Precipitation over Mountainous Terrain for Water Resource Applications, Geophys. Res. Lett., 50, e2023GL105326, https://doi.org/10.1029/2023GL105326, 2023.
Seaber, P. R., Kapinos, F. P., and Knapp, G. L.: Hydrologic Unit Maps, U.S. Geological Survey, https://doi.org/10.3133/wsp2294, 1987.
Sedláček, J. and Knutti, R.: Half of the world's population experience robust changes in the water cycle for a 2 °C warmer world, Environ. Res. Lett., 9, 044008, https://doi.org/10.1088/1748-9326/9/4/044008, 2014.
Shepherd, T. G., Boyd, E., Calel, R. A., Chapman, S. C., Dima-West, I. M., Fowler, H. J., James, R., Maraun, D., Martius, O., Senior, C. A., Sobel, A. H., Stainforth, D. A., Tett, B., Trenberth, K. E., Hurk, B. J., Watkin, N. W., Wilby, R. L., and Zenghelis, D. A.: Storylines: An alternative approach to representing uncertainty in physical aspects of climate change, Climatic Change, 151, 555–571, https://doi.org/10.1007/s10584-018-2317-9, 2018.
Simpson, I. R., Lawrence, D. M., Swenson, S. C., Hannay, C., McKinnon, K. A., and Truesdale, J. E.: Improvements in Wintertime Surface Temperature Variability in the Community Earth System Model Version 2 (CESM2) Related to the Representation of Snow Density, J. Adv. Model. Earth Syst., 14, e2021MS002880, https://doi.org/10.1029/2021MS002880, 2022.
Tebaldi, C. and Knutti, R.: The use of the multi-model ensemble in probabilistic climate projections, Philos. T. Roy. Soc. A, 365, 2053–2075, https://doi.org/10.1098/rsta.2007.2076, 2007.
Tebaldi, C., Dorheim, K., Wehner, M., and Leung, R.: Extreme metrics from large ensembles: investigating the effects of ensemble size on their estimates, Earth Syst. Dynam., 12, 1427–1501, https://doi.org/10.5194/esd-12-1427-2021, 2021.
Tye, M.: Water Availability Metrics August 2021 Workshop Report, Open Science Framework, https://doi.org/10.17605/OSF.IO/M7NXD, 2023.
Tye, M. and Ge, M.: Data for Evaluating an Earth system model from a water manager perspective, Zenodo [data set], https://doi.org/10.5281/zenodo.14611111, 2025.
Underwood, E. C., Hollander, A. D., Flint, L. E., Flint, A. L., and Safford, H. D.: Climate change impacts on hydrological services in southern California, Environ. Res. Lett., 13, 124019, https://doi.org/10.1088/1748-9326/aaeb59, 2018.
Vano, J. A., Udall, B., Cayan, D. R., Overpeck, J. T., Brekke, L. D., Das, T., Hartmann, H. C., Hidalgo, H. G., Hoerling, M., McCabe, G. J., Morino, K., Webb, R. S., Werner, K., and Lettenmaier, D. P.: Understanding Uncertainties in Future Colorado River Streamflow, B. Am. Meteorol. Soc., 95, 59–78, https://doi.org/10.1175/BAMS-D-12-00228.1, 2014.
Wagener, T., Reinecke, R., and Pianosi, F.: On the evaluation of climate change impact models, WIREs Climate Change, 13, e772, https://doi.org/10.1002/wcc.772, 2022.
Wilby, R. L., Lu, X., Watkiss, P., and Rodgers, C. A.: Towards pragmatism in climate risk analysis and adaptation, Water Policy, 23, 10–30, https://doi.org/10.2166/wp.2021.232, 2021.
Wood, R. R., Lehner, F., Pendergrass, A. G., and Schlunegger, S.: Changes in precipitation variability across time scales in multiple global climate model large ensembles, Environ. Res. Lett., 16, 084022, https://doi.org/10.1088/1748-9326/ac10dd, 2021.
Wright, D. B., Bosma, C. D., and Lopez-Cantu, T.: U.S. Hydrologic Design Standards Insufficient Due to Large Increases in Frequency of Rainfall Extremes, Geophys. Res. Lett., 46, 8144–8153, https://doi.org/10.1029/2019GL083235, 2019.
Yuan, H., Toth, Z., Peña, M., and Kalnay, E.: Overview of Weather and Climate Systems, in: Handbook of Hydrometeorological Ensemble Forecasting, edited by: Duan, Q., Pappenberger, F., Wood, A., Cloke, H. L., and Schaake, J. C., Springer, Berlin, Heidelberg, 35–65, https://doi.org/10.1007/978-3-642-39925-1_10, 2019.
Zhang, X., Alexander, L., Hegerl, G. C., Jones, P., Tank, A. K., Peterson, T. C., Trewin, B., and Zwiers, F. W.: Indices for monitoring changes in extremes based on daily temperature and precipitation data, WIREs Climate Change, 2, 851–870, https://doi.org/10.1002/wcc.147, 2011.
One acre foot is the volume of water it would take to cover 1 acre of land to a depth of 1 foot. This is equal to 325 852 gallons or 1233 m3 (USGS Water Science).
- Abstract
- Introduction
- Climate information needs from prior research
- Data and methods
- Model evaluation
- Discussion
- Conclusions
- Appendix A
- Appendix B
- Appendix C
- Appendix D
- Data availability
- Author contributions
- Competing interests
- Disclaimer
- Acknowledgements
- Financial support
- Review statement
- References
- Supplement