the Creative Commons Attribution 4.0 License.
the Creative Commons Attribution 4.0 License.
 | 27 Feb 2025
The influence of permafrost and other environmental factors on stream thermal sensitivity across Yukon, Canada
Sean K. Carey
Thermal sensitivity, defined as the slope of a linear regression between stream and air temperatures, is a useful indicator of the strength of coupling between meteorological forcings and stream temperature or, conversely, of the presence of non-atmospheric thermal influences such as groundwater contributions to streamflow. Furthermore, thermal sensitivity is known to be responsive to environmental change. This study expands the current state of knowledge of stream thermal sensitivity in cold northern regions across catchment scales, investigates the environmental controls of thermal sensitivity across a range of catchment dispositions, and assesses the thermal influence of environmental conditions unique to cold regions, namely permafrost. We conducted a linear regression analysis relating modelled mean daily air and stream temperatures in 57 catchments in Yukon, Canada, with catchment areas ranging from 5.4 to 86 500 km2 and with catchment mean permafrost probabilities ranging from 0.0 to 0.99. Thermal sensitivities obtained from the linear regressions ranged from 0.14 to 0.84 °C °C−1, with a median of 0.56 °C °C−1, and the regression intercepts ranged from −0.07 to 7.60 °C, with the mean regression Nash–Sutcliffe efficiency of 0.81. Thermal sensitivity was positively related to catchment area, land covers representing surface water storage, and streamflow flashiness or a lack of groundwater contributions. The greatest single environmental characteristic explaining the variance in thermal sensitivity was catchment topography (9 % variance explained); however, 39 % of the variance in thermal sensitivity was jointly explained by catchment physiography, land cover, and permafrost presence indicators, suggesting thermal sensitivity is the result of multiple interacting controls. The primary influence of permafrost on thermal sensitivity appeared to be indirect; permafrost controls on catchment properties affecting stream water residence time, subsurface water storage, and subsurface runoff processes provide separate and counteracting effects that are influencing thermal sensitivity.
- Article
(4958 KB) - Full-text XML
-
Supplement
(594 KB) - BibTeX
- EndNote


Stream temperature is a master water quality variable as it mediates stream physical and biotic processes, and it is a primary control on ecosystem productivity, aquatic species distributions, hydrochemistry through substrate weathering, and nutrient availability (Ebersole et al., 2001; Brown et al., 2004; Anderson, 2005; Caissie, 2006; McNamara et al., 2008; Parkinson et al., 2016; McDowell et al., 2017). Stream temperatures and thermal regimes are sensitive to changes in local or global environmental conditions, and northern latitudes have experienced rapid change in response to climate warming with air temperatures increasing at twice the global average rate (Vincent et al., 2015). Northern and cold regions have unique environmental conditions (such as permafrost presence, which strongly controls surface and subsurface hydrology) that are also sensitive to climate warming (Walvoord et al., 2012; Woo, 2012). While there is increasing interest in understanding the influence of cold region hydrological processes on stream temperature (e.g., King and Neilson, 2019; Sjöberg et al., 2021), there is a distinct lack of knowledge regarding the influence of northern hydrological processes on stream thermal regimes. Permafrost may alter the relationship between groundwater hydrology and stream thermal regimes as it is understood in temperate catchments, where streams with relatively high groundwater contributions have lower thermal sensitivity (e.g., Kelleher et al., 2012; Wissler et al., 2022; McGill et al., 2024). Permafrost presence strongly influences catchment soil storage and runoff response time, which are also hypothesized to influence stream temperature (Woo, 2012; Sjöberg et al., 2021). The primary processes influencing northern stream thermal regimes may not be the same as those in temperate regions, and they may have unique responses to shifting climatic and hydrological conditions.
Stream temperature is ultimately controlled by the stream heat budget, and the primary processes governing stream temperature have received extensive attention over the past decades (Brown, 1969; Constantz, 1998; Webb and Zhang, 1999; Johnson, 2004; Moore et al., 2005b; Leach and Moore, 2010). Radiative heat exchanges (i.e., shortwave and longwave radiation) between the stream and the atmosphere often dominate the stream heat budget in all regions, including northern catchments alike, but local topography, channel morphology, and the timing and volume of streamflow and lateral inflows also influence stream temperature (Story et al., 2003; Caissie, 2006; King et al., 2016). Environmental controls through seasonal snow cover, local riparian vegetation and channel shading, permafrost presence and distribution, and wildfires (Isaak et al., 2010; Leach and Moore, 2010, 2015; MacDonald et al., 2014; Dugdale et al., 2018; King and Neilson, 2019; Wondzell et al., 2019; Sjöberg et al., 2021), as well as anthropogenic disturbances such as watercourse-impounding reservoirs, timber harvesting, and natural resource extraction (Bjerklie and LaPerriere, 1985; Lowney, 2000; Moore et al., 2005a), all exert additional controls on stream temperature by altering energy exchanges between the water and its surroundings. The processes governing stream temperature are complex, may act at the sub-reach or catchment scale, and often have counteracting influences with different processes simultaneously heating and cooling stream water. The cumulative effects of the atmospheric (and non-atmospheric) landscape conditions controlling stream temperature ultimately describe how stream temperature responds to surrounding conditions.
Physically based stream temperature models can be used to investigate controls on stream temperature and enable robust predictions of its response to environmental change but have historically been developed for site-scale studies and face ongoing limitations to regional implementation due to high input-data and computational demands (Dugdale et al., 2017). Linear regression analysis is a simpler alternate approach to investigate the environmental controls on stream thermal regimes by relating stream and air temperatures (Crisp and Howson, 1982; Stefan and Preud'homme, 1993; Hilderbrand et al., 2014; Wissler et al., 2022; McGill et al., 2024). The regression slope, commonly termed the “thermal sensitivity”, provides insight into the degree of coupling between stream temperature and atmospheric forcings or the influence of non-atmospheric processes such as groundwater or glacier meltwater contributions to streamflow. Thermal sensitivity analysis has been effectively used in streams across a range of spatial and temporal scales, can identify the environmental controls on thermal sensitivity, and has provided insight into how stream thermal sensitivities respond to environmental change (e.g., Ducharne, 2008; van Vliet et al., 2011; Kelleher et al., 2012; Luce et al., 2014; Winfree et al., 2018; Leach and Moore, 2019; McGill et al., 2024). Most thermal sensitivity studies to date have focused on temperate regions and have developed into a robust body of literature. Recently, however, there has been increasing interest in improving our understanding of stream thermal regimes in cold northern regions, which have received far less attention but have unique hydrological processes that, when altered, will have uncertain consequences for stream thermal regimes (e.g., Lisi et al., 2015; King et al., 2016; Bolduc et al., 2018; Winfree et al., 2018; Docherty et al., 2019; King and Neilson, 2019; Fabris et al., 2020).
While many of the processes identified as controls of thermal sensitivity in temperate regions are likely to apply in northern regions as well, near-surface permafrost strongly alters surface and subsurface hydrology (Woo, 2012; Kurylyk and Walvoord, 2021), leading to uncertainty in the transferability of our current understanding of the controls of thermal sensitivity to northern regions. Permafrost presence affects hydrology through its influence on vegetation community composition and snowpack accumulation patterns, surface water bodies, and regional groundwater patterns (Jorgenson et al., 2001; Shur and Jorgenson, 2007; Pomeroy and Gray, 1995; Walvoord et al., 2012; Woo, 2012; Grünberg et al., 2020), all of which are expected to influence stream thermal sensitivity. Current research suggests that permafrost may have counteracting influences on stream temperature, depending on scale and process, e.g., by warming lateral inflows in headwater catchments or moderating the heat flux from hyporheic exchange (King and Neilson, 2019; Sjöberg et al., 2021), but the net effect of permafrost on thermal regimes across scales is unclear. Compounding our limited understanding of the role permafrost plays in influencing thermal sensitivity, northern environments have experienced rapid change in response to climate warming, with air temperature increases >2 °C already realized in northern Canada (Zipper et al., 2018; Bush and Lemmen, 2019; DeBeer et al., 2021), and permafrost degradation in response to climate change is expected to alter groundwater temperature and dynamics (Ge et al., 2011; Kurylyk et al., 2016; Chiasson-Poirier et al., 2020), with emergent flow pathways shifting the timing and magnitude of streamflow and therefore also expected to alter thermal sensitivity.
Northern regions have unique environmental conditions different to temperate latitudes, and northern landscape characteristics like permafrost are known to control surface and subsurface hydrology. The ongoing environmental changes in northern regions, such as altered subsurface flow regimes due to permafrost degradation and shifting vegetation distributions, are expected to influence stream thermal sensitivities. Despite this knowledge, however, there is uncertainty in the key environmental controls of thermal sensitivity in northern regions and in how thermal sensitivity will respond to these changing conditions. Considering these gaps in knowledge, we set our research objectives for this study to (1) describe the range and variability of stream thermal sensitivity across a range of catchment sizes and permafrost dispositions in Yukon, Canada; (2) identify key environmental factors correlated with thermal sensitivity in northern streams; and (3) investigate the role that permafrost plays in influencing thermal sensitivity. This study also serves to set a baseline of current stream thermal conditions against which future thermal regimes, in response to changing environmental conditions, may be compared.
2.1 Study area
Yukon Territory, in northwest Canada, has a southern border at 60° N latitude and extends north to the Arctic Ocean; it has a total area of approximately 483 000 km2 (Fig. 1). The physiography of Yukon varies from the maritime-influenced, glacierized St Elias Mountains in the southwest to tundra coast in the north, with a northward transition from boreal forest to taiga cordillera through the territory. Annual precipitation ranges from >2000 mm in the mountainous southwest to ∼250 to 300 mm in lower elevations of the interior. Mean annual temperature (MAT) ranges from −10 °C in the north to between −2 and 0 °C in the south. The Yukon interior has a continental climate which results in intense, convective precipitation events through the summer months. Much of Yukon has mean daily air temperature >10 °C during the summer months of June, July, and August, bolstered by long daylight hours, and daily maximum air temperatures can exceed 25 °C.
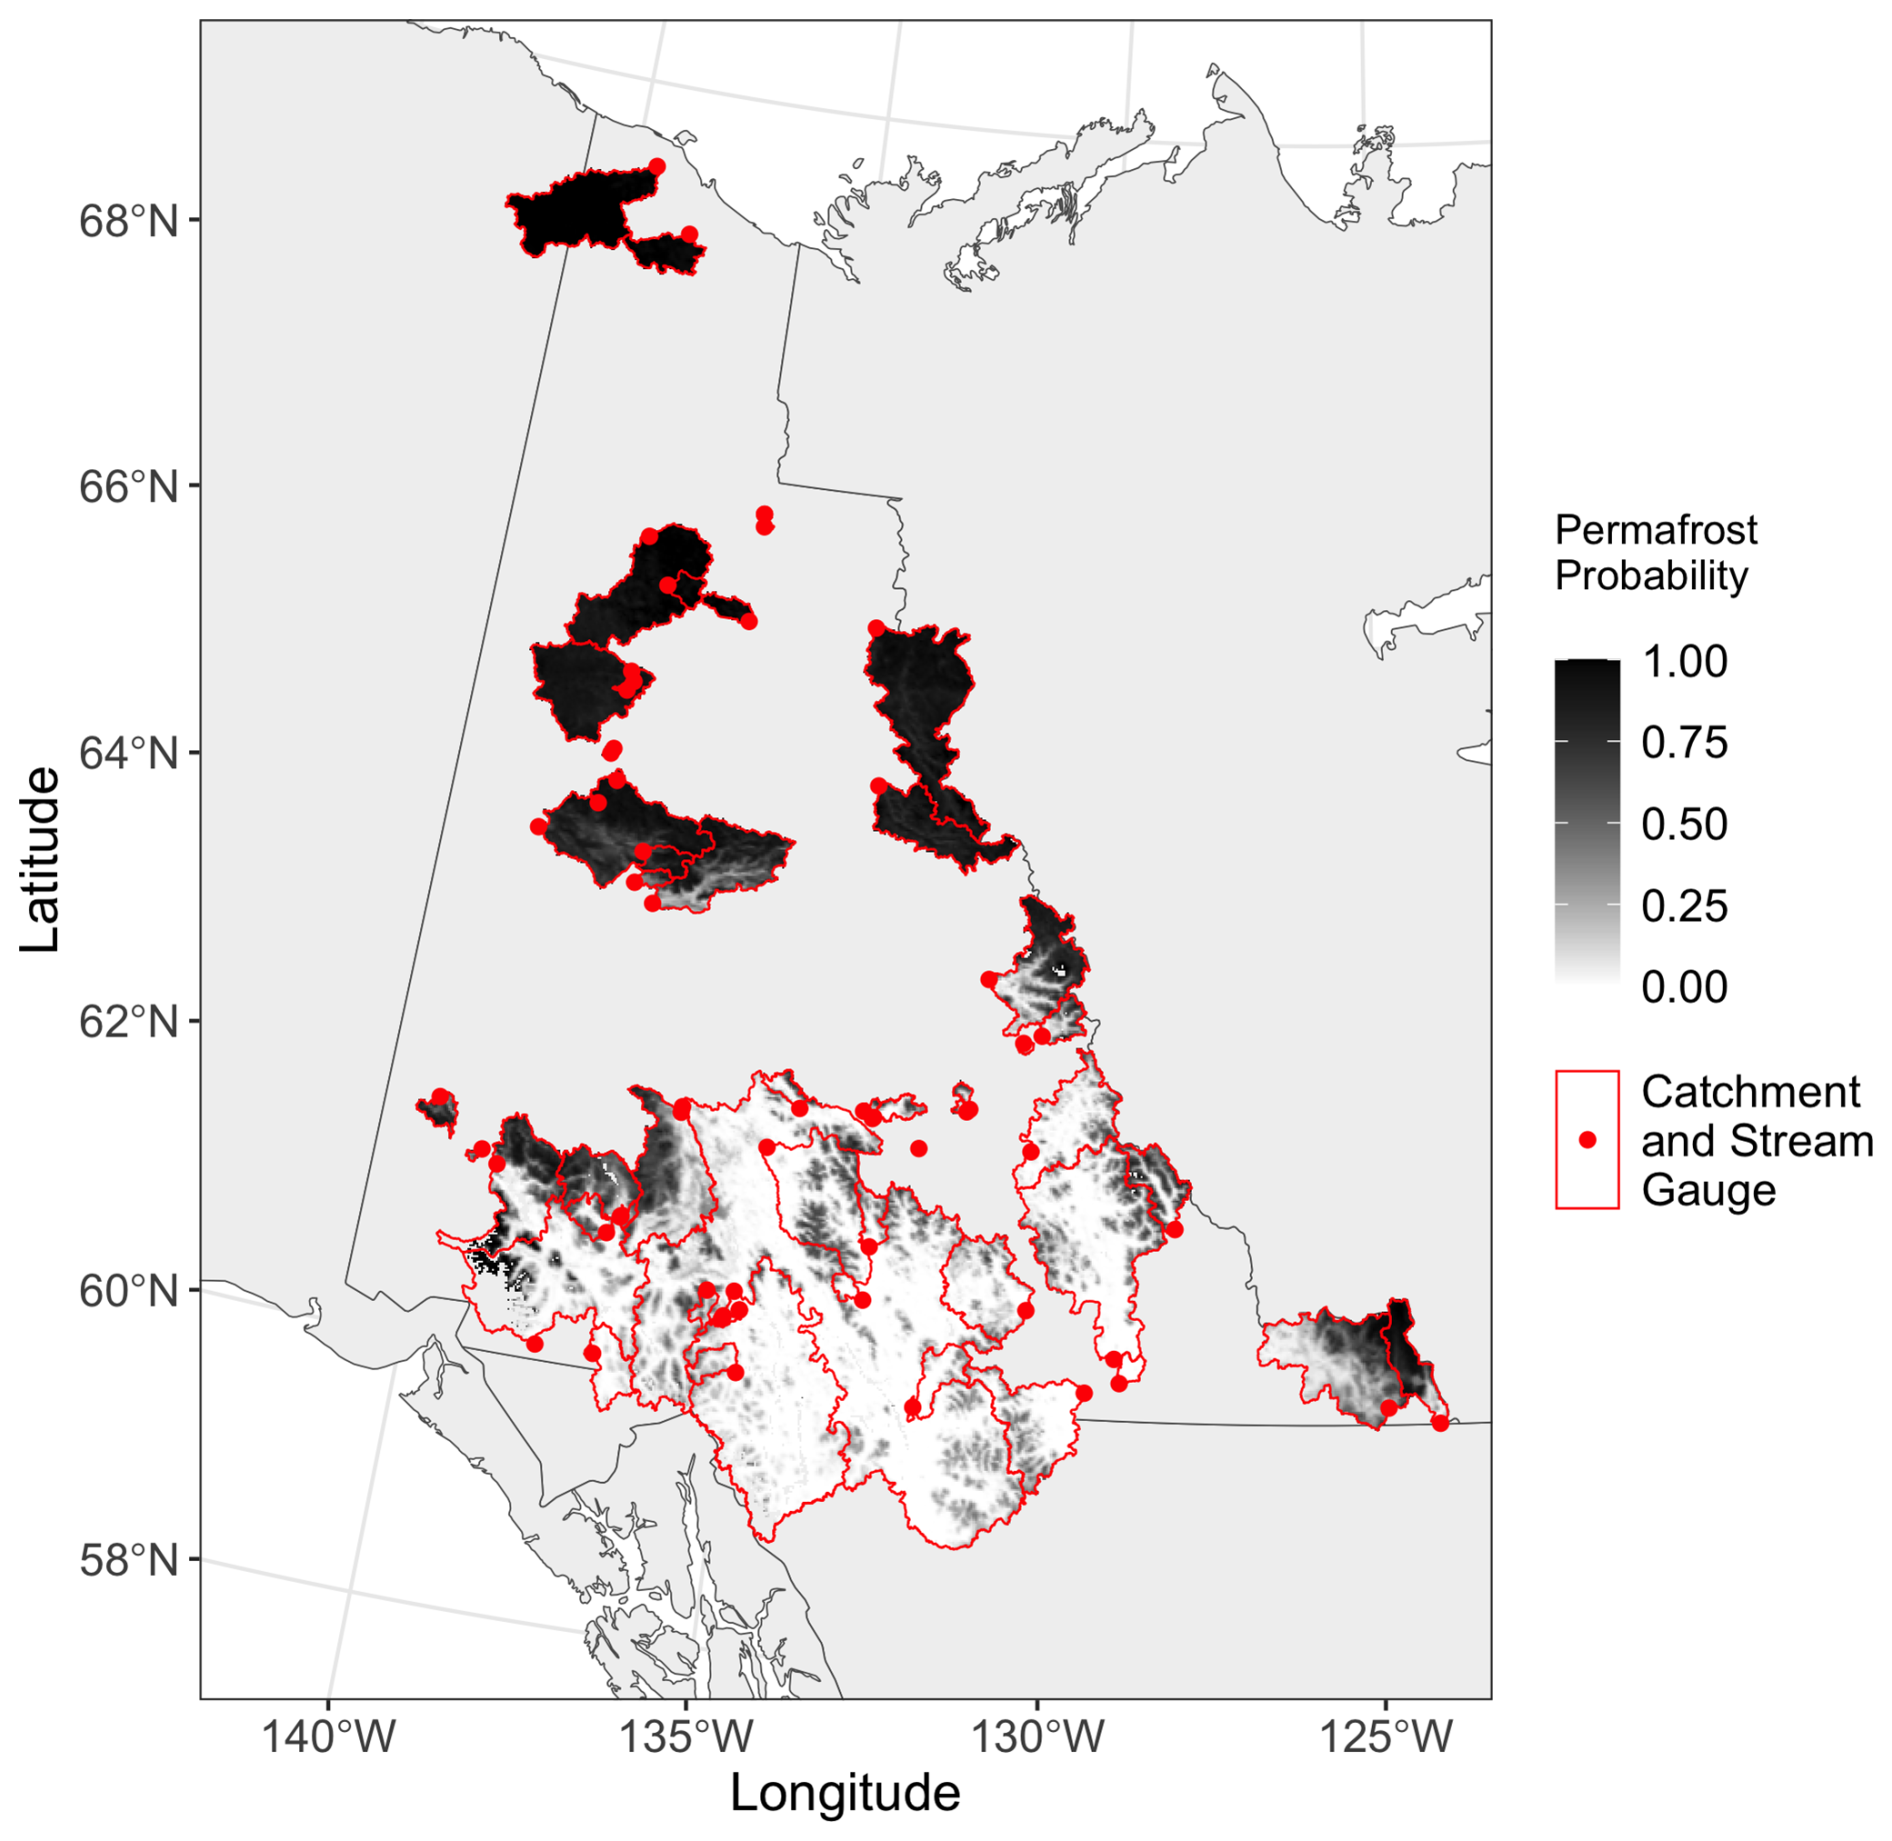
Figure 1The 57 study catchments located across Yukon Territory, Canada. Each catchment is filled with the gridded estimated permafrost probability (Obu et al., 2018), at 1 km resolution.
Areas with MAT consistently <0 °C may be underlain by permafrost, and the permafrost extent is reflected in the MAT gradient from north to south (Fig. 1). Permafrost extents are classified as isolated, sporadic, discontinuous, or continuous, with permafrost coverage corresponding to <10 %, 10 %–50 %, 50 %–90 %, or >90 %, respectively (Obu et al., 2018). Permafrost presence is a strong control on surface characteristics (e.g., vegetation) and hydrology throughout Yukon (Smith et al., 2004).
2.2 Data
All data processing and analyses were conducted using the R programming language, version 4.2.0 (R Core Team, 2022).
2.2.1 Stream temperature and discharge
A data set of continuous sub-daily stream temperature (°C) and discharge (m3 s−1) was acquired from multiple agencies that operate hydrometric stations in streams across Yukon. The Yukon Territorial Government Water Resources Branch (YTG-WRB) provided data for 15 streams it monitors, the Water Survey of Canada (WSC) provided data for 34 stations, and a further 8 streams monitored by the Watershed Hydrology Group (WHG, authors' affiliation) at McMaster University were provided, for a total of 57 sites. Discharge time series were also requested but were unavailable for seven of the streams. The sub-daily data provided by YTG-WRB and WHG were primarily at 15 min intervals, while the WSC data were primarily at hourly intervals.
Data were omitted from the sub-daily data set if they met the following criteria: site days where >15 % of the observations were missing, unrealistic water temperature (e.g., >100 or °C), or quality flags indicating erroneous or potentially inaccurate data. Mean daily stream temperature and discharge were calculated from the filtered sub-daily data. Visual inspection of the stream temperature and discharge time series for indicators of poor data quality, such as frequent or extended data gaps or unexplained spikes in either data type, was conducted for each site and led to the omission of data from WSC station number 09BA001, as the data were of poor quality, and the omission of data from YTG-WRB station number 29AB009, as it was a partial duplicate of station number 29AB002. This study considered the post-freshet open water period, so data were further filtered to be between 1 July and 15 October, and stream and air temperature data <0 °C were also omitted. The analysis-ready temperature and discharge data set had 35 597 values of mean daily stream temperature and 26 159 concurrent values of mean daily discharge, forming the model period of 24 August 1997 through to 30 August 2023.
The stream temperature measurements were obtained using a variety of instruments over their periods of record. Details regarding sensor accuracy and resolution for instruments known to have been used were compiled and assessed, but are incomplete. Direct attribution of a sensor to all sites and years of data is unfortunately not possible. Additionally, it should be noted that no information is available regarding the instruments used by the WSC. Given the uncertainty in the specific instrument used for any given data, it should be assumed that the lowest known sensor accuracy applies to all the data (i.e., accuracy of ±0.44 °C).
2.2.2 Stream network and catchment delineations
Catchment delineations for the WSC stations were obtained from the “National Hydro Network Basin Polygon” spatial data set (Water Survey of Canada, 2016). The delineations for the remaining stations operated by YTG-WRB and WHG were computed using the 32 m spatial resolution ArcticDEM v4.1 digital elevation model (DEM; Porter et al., 2023) as the input DEM for the catchment delineation processes available through the R package whitebox (Wu and Brown, 2022). The catchment delineations' accuracy was assessed visually, and small manual corrections were made where required. Catchment areas ranged from 5.4 to 86 500 km2.
Canada1Water has enhanced the National Hydro Network (NHN) GeoBase data set by deriving stream network properties for all stream vectors included in the NHN data set (Canada1Water, 2023). The Strahler stream order (SO) and Shreve magnitude of each stream at the hydrometric station were extracted using this data set.
2.2.3 Meteorology
Due to the remote nature of many of the hydrometric stations and the sparse network of meteorological stations in Yukon, gridded climate reanalysis data were used to obtain consistent estimates of air temperature and other meteorological variables across all sites. ERA5-Land is a gridded climate data product that provides near-real-time global climate data at a spatial resolution of ∼10 km at hourly or daily intervals (Muñoz-Sabater et al., 2021), and its greater accuracy in comparison to well-established but coarser-resolution gridded data products (e.g., ERA5, NARR) has been demonstrated in recent stream temperature modelling research (Gatien et al., 2023; Mihalevich et al., 2022).
The ERA5-Land data set was queried using Google Earth Engine to extract continuous time series of the mean daily air temperature at 2 m above surface (°C) and precipitation (mm), as well as daily catchment-averaged values of snow cover (as a proportion). Time series were extracted from 1991 through to 2023 to permit the calculation of climate normals (e.g., 1991 to 2020) to be used as climatic predictor variables in the modelling analysis. The modelled air temperature and precipitation time series were extracted from the ERA5-Land grid cell overlying each hydrometric station location, and catchment mean snow cover values were extracted using the catchment delineations created as described in Sect. 2.2.2.
The ERA5-Land grid attributes a mean surface elevation to each grid cell. In mountainous regions, however, the earth surface will span a range of elevations within a given grid cell's domain. Because air temperature varies with elevation and given that many of the hydrometric stations are located in mountainous regions, a temperature lapse rate adjustment was applied to the ERA5-Land air temperature time series as follows:
where Ta is the lapse-corrected air temperature (°C), Ta,E is the air temperature at 2 m above surface as extracted from ERA5-Land (°C), z is the elevation of a given hydrometric station (m a.s.l.), zE is the elevation (m a.s.l.) of a given ERA5-Land grid cell that overlies a given hydrometric station, and Γm is a month-specific adiabatic lapse rate adjustment (°C m−1) applicable to North America (Kunkel, 1989). Mean annual air temperature was calculated for each station from the lapse-adjusted modelled air temperature time series.
Total daily precipitation was extracted for each hydrometric station and summed to total annual and total summer (June, July, August) precipitation. Climate normals of total annual and summer precipitation were calculated for the period 1991 to 2020 to be used in the modelling analysis. The daily snow cover proportions were extracted for each catchment for the period of record, and the catchment mean and median daily values of snow cover were computed accordingly.
2.2.4 Land cover
Terrain indices were calculated and extracted for each catchment and catchment stream network using ArcticDEM v4.1 and the R package terra (Hijmans, 2023). Land cover classifications were extracted for each catchment from the ESA WorldCover 10 m 2020 v100 data set (Zanaga et al., 2021), and the fractional coverage of each land cover class within a catchment was computed. Catchment mean permafrost probability was derived from the Northern Hemisphere “Ground Temperature Map” (Obu et al., 2018), which is a gridded data set including estimated permafrost probability fraction at 1 km resolution developed using a “temperature at the top of the permafrost” model representing permafrost conditions from 2000 to 2016, and catchment median active layer thickness (ALT) was extracted from a similar data set (Ran et al., 2021).
2.2.5 Indices and derived values
Shallow and regional hydrogeological patterns influence stream thermal regimes and are related to catchment soil storage and runoff regimes (Kelleher et al., 2012; Sjöberg et al., 2021), but given the lack of groundwater flux or soil storage data, several proxy indices were derived from the available streamflow data. These indices are the baseflow index (BFI, dimensionless), Richards–Baker index (RBI, dimensionless), and the estimated coefficients from a streamflow recession regression.
The BFI is an indicator of groundwater contributions to streamflow in the absence of local hydrogeological data (Gustard et al., 1992). BFI is computed as the ratio of baseflow to total discharge over a specified time period (e.g., annual or seasonal) after a baseflow separation algorithm is applied to the streamflow time series. Baseflow separation was conducted following the methods of Tallaksen and Lanen (2004) in the R package lfstat (Laaha and Koffler, 2022), and the long-term mean BFI was computed for each stream over the study period (1 July to 15 October). Conversely to the BFI, the RBI is an index of hydrograph flashiness whereby rapid runoff generation indicates a lack of or unavailability of catchment storage (Baker et al., 2004). The RBI is a simpler index that describes daily variation in flow relative to total discharge; it was calculated for each station-year as follows:
where Q is mean daily streamflow (m3 s−1), i represents days, and n represents the number of days between 1 July and 15 October. The long-term mean RBI for each station was computed from the annual values.
The rate of streamflow recession can provide information about flow path complexity (Hinzman et al., 2020) as well as active layer thickness (i.e., soil storage; Sergeant et al., 2023) in catchments with substantial permafrost coverage. These catchment storage–discharge relationships were assessed by fitting a linear regression to the log-transformed recession curve as follows:
where is the change in mean daily runoff per day (mm d−2), and α (mm d−2) and β (–) are estimated coefficients.
2.3 Analysis on the controls of thermal sensitivity
The range of thermal sensitivity across Yukon streams, as well as the catchment controls on their magnitudes, was determined through a sequence of regression analyses. In general terms, the influence of groundwater contributions to streamflow (Johnson et al., 2020), runoff as influenced by catchment storage and permafrost disposition (Sjöberg et al., 2021), stream discharge and stream order (Webb et al., 2003; Kelleher et al., 2012), and influence of catchment and channel topography on groundwater contributions (Hare et al., 2021) and stream shading (Rutherford et al., 1997) have been identified or suspected to influence stream thermal regimes. The suite of catchment characteristics and indices described in Sect. 2.2.4 and 2.2.5, as provided in Table 1, was selected and assessed on the basis that it may explain regional controls in stream thermal sensitivity.
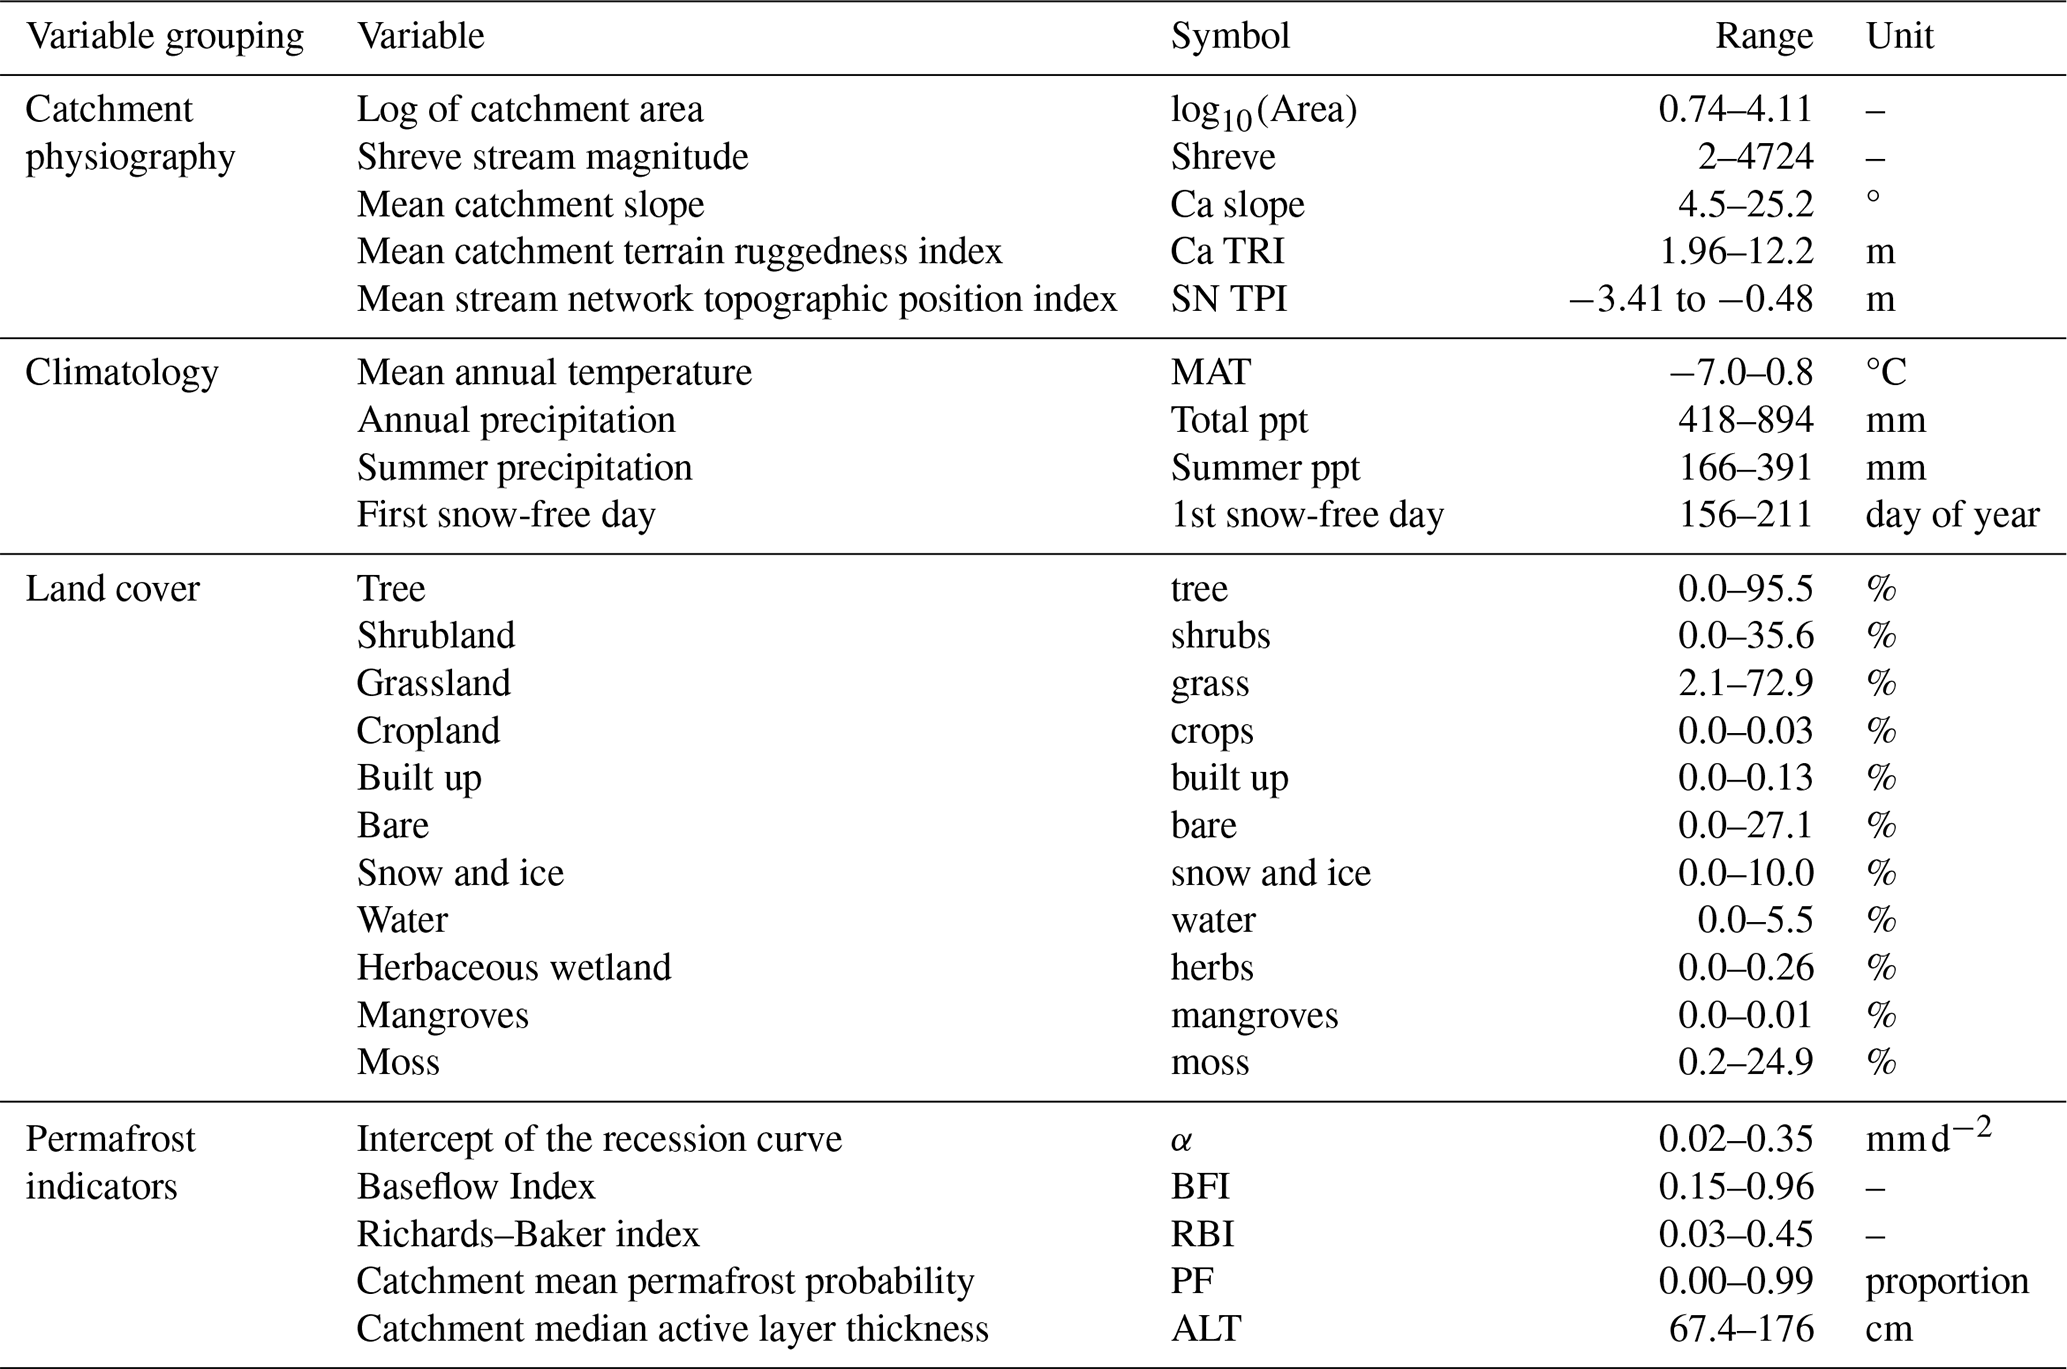
Table 1Environmental properties extracted for each catchment or calculated at the catchment hydrometric station for streamflow-derived variables (BFI, RBI, α). The variable groupings were used to conduct the redundancy analysis and variance partitioning.
Linear regression
Linear regression was used to determine site-specific relationships between modelled air temperature and stream temperature, and the influence of including discharge as a predictor in the linear regressions was assessed. A linear regression relating stream temperature to air temperature was applied to each stream:
where Tw is mean daily stream temperature (°C), Ta is mean daily modelled air temperature (°C), TS is the slope of the regression (°C °C−1), BT is the intercept (°C), and ϵ is the residual error (°C). The slope is commonly referred to as the stream's thermal sensitivity (TS), which represents the stream temperature response to a change in air temperature. Here, we refer to the intercept, BT, as the baseline temperature, which provides information regarding the thermal processes affecting a stream when air temperatures decrease to 0 °C. Equation (4) was expanded with the inclusion of discharge as a predictor variable to
where l is an estimated coefficient (°C s m−3). To assess the potential impact of the maximum uncertainty assumed for the observed Tw, a randomly distributed binomial error of ±0.44 °C with equal probability for −0.44 or 0.44 °C was applied to the observed Tw, and Eq. (4) was re-fit using the uncertainty-adjusted Tw.
A time trend analysis of estimated coefficients and residual errors was conducted to investigate whether there are differences in seasonal thermal sensitivity across the permafrost classifications. This was done by fitting Eq. (4) to the pooled data set filtered to include only observations in the first 2 weeks of July. The resultant estimated coefficients were applied to weekly subsets of the full data set, and the corresponding residuals, ϵ, were calculated and grouped by permafrost classification.
Redundancy analysis, variance partitioning, and multiple regression
The relationships between the estimated coefficients (TS and BT) and catchment characteristics and indices were explored using redundancy analysis (RDA) and correlations to better understand the magnitude and direction of influence among the environmental variables and TS and BT. RDA is a two-step process which involves (1) a fitting of multiple linear regressions between an explanatory variable matrix and a multivariate response matrix followed by (2) a principal component analysis of the fitted values. The RDA shows the correlations between multiple explanatory and response variables, and it produces statistical models that can be tested for significance. Upon conducting an additional variance partitioning analysis, RDA provides estimates of the individual and combined proportions of variance explained by each predictor. Forward selection of the full suite of catchment and environmental variables was conducted prior to the RDA to remove collinear predictors; Table 1 presents the forward-selected variables and variable grouping applied to the RDA. Additionally, Pearson's correlations were computed between TS and BT, and the forward-selected variables for catchments were grouped by permafrost classification to identify trends between the response and predictors across permafrost classes. Lastly, a stepwise multiple regression model was used to identify which catchment or environmental properties were significant predictors of TS (assessed at p<0.05).
The linear and multiple regressions' performances were assessed by calculating model-specific root-mean-squared error (RMSE, °C) and Nash–Sutcliffe efficiency (NSE, dimensionless) as follows:
where is the estimated stream temperature on day i (°C), Tw,i is the observed mean daily stream temperature on day i (°C), is the observed mean stream temperature on day i (°C), and m is the number of observations in the fitting data set.
3.1 Temperature and discharge statistics
A broad range of meteorological and hydrological conditions were represented in the data set (Fig. 2). While the full range of Tw was from 0.01 to 20.9 °C, the smaller streams (SO 2 and 3) had comparable median daily Tw values of 4.9 and 4.5 °C, respectively, while the larger streams (SO 4 to 7) had median daily Tw from 8.4 to 9.9 °C, respectively. The distribution of modelled air temperature across the sites was similar, with a median Ta ranging from 11.2 to 12.2 °C for sites with SO 3 to 7, while SO 2 and 8 had median Ta values of 9.1 and 13.1 °C, respectively. Streamflow increased with SO, with median streamflows ranging from 0.12 to 85.5 m3 s−1. Runoff was relatively uniform across all orders with median daily runoff values ranging from 0.74 to 1.31 mm d−1, although lower-order streams appear to have greater runoff than the higher-order streams.
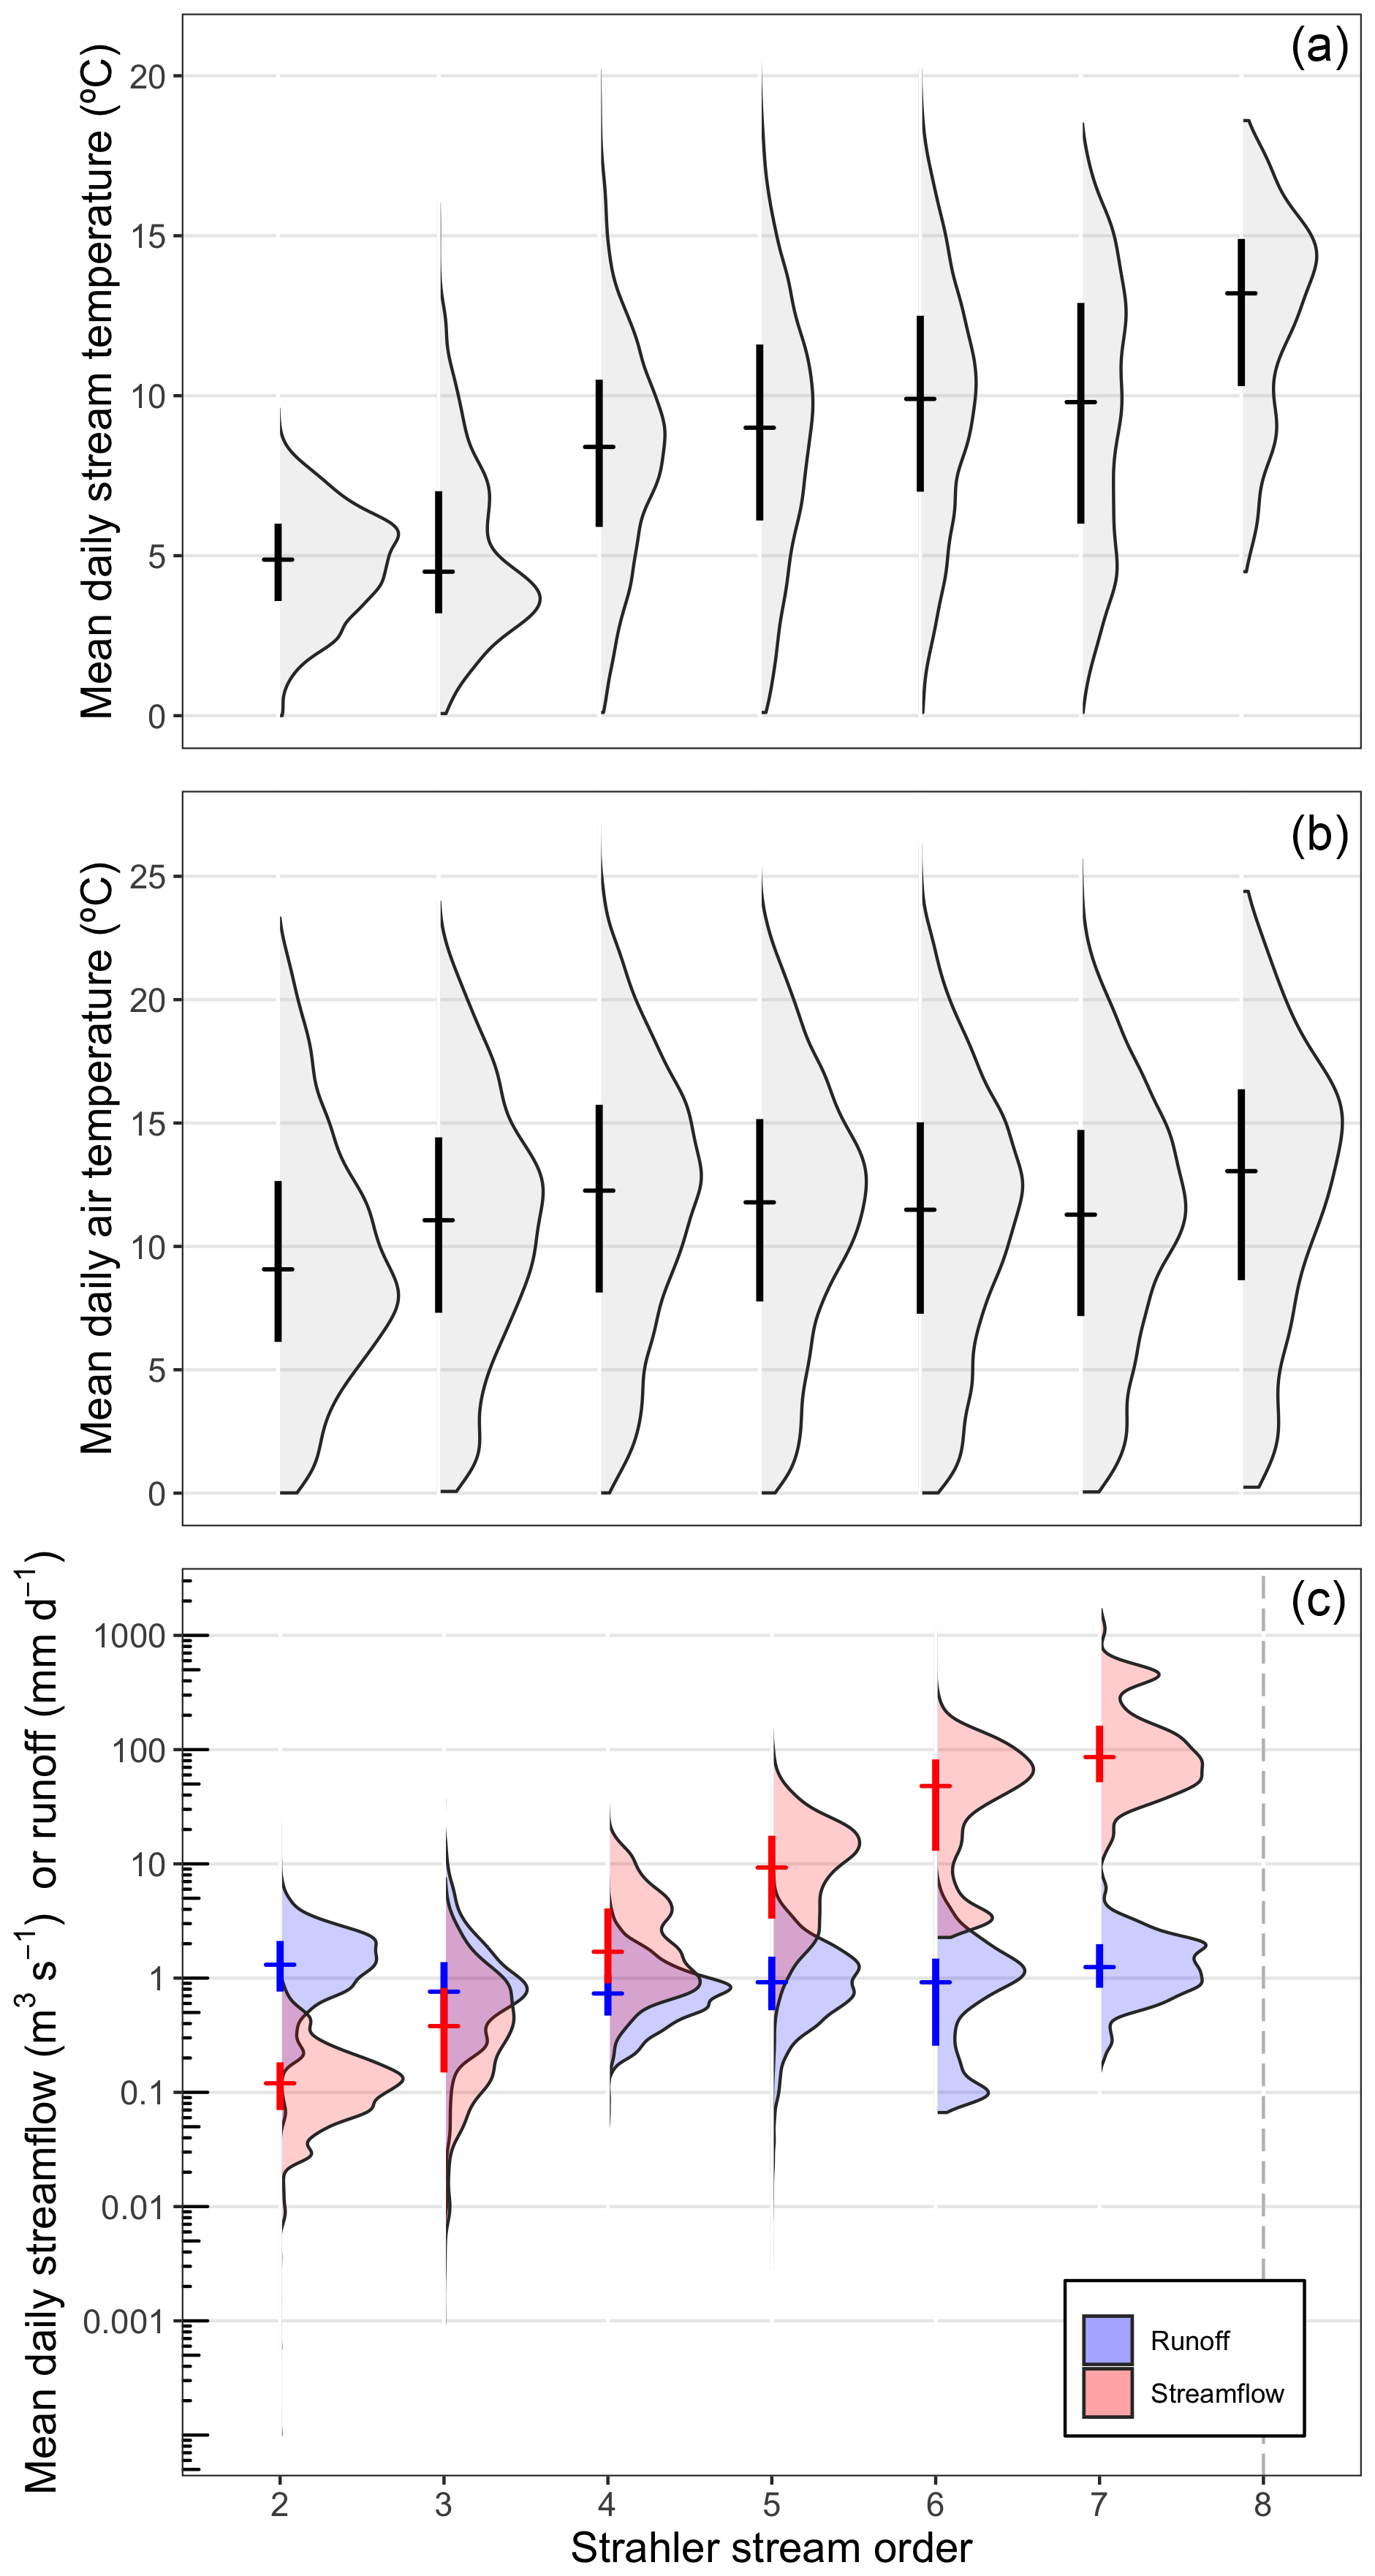
Figure 2Distribution of mean daily stream and air temperatures, and streamflow by Strahler stream order. The data cover the years 1997 through to 2023 and the days from 1 July through to 15 October. The crosses indicate the median and the 25th to 75th percentile value range. There is no streamflow data available for the study stream with Strahler order 8.
Peak flows typically occurred during the snowmelt freshet in May, with 52 % of the streams experiencing annual peak flow prior to 1 June; however, peak flows also occurred throughout the summer and are associated with intense convective storms. Stream temperature was strongly seasonal across all sites and permafrost classifications (Fig. 3), with streams warming from Tw near 0 °C during freshet to their respective annual Tw maxima occurring through July and early August.
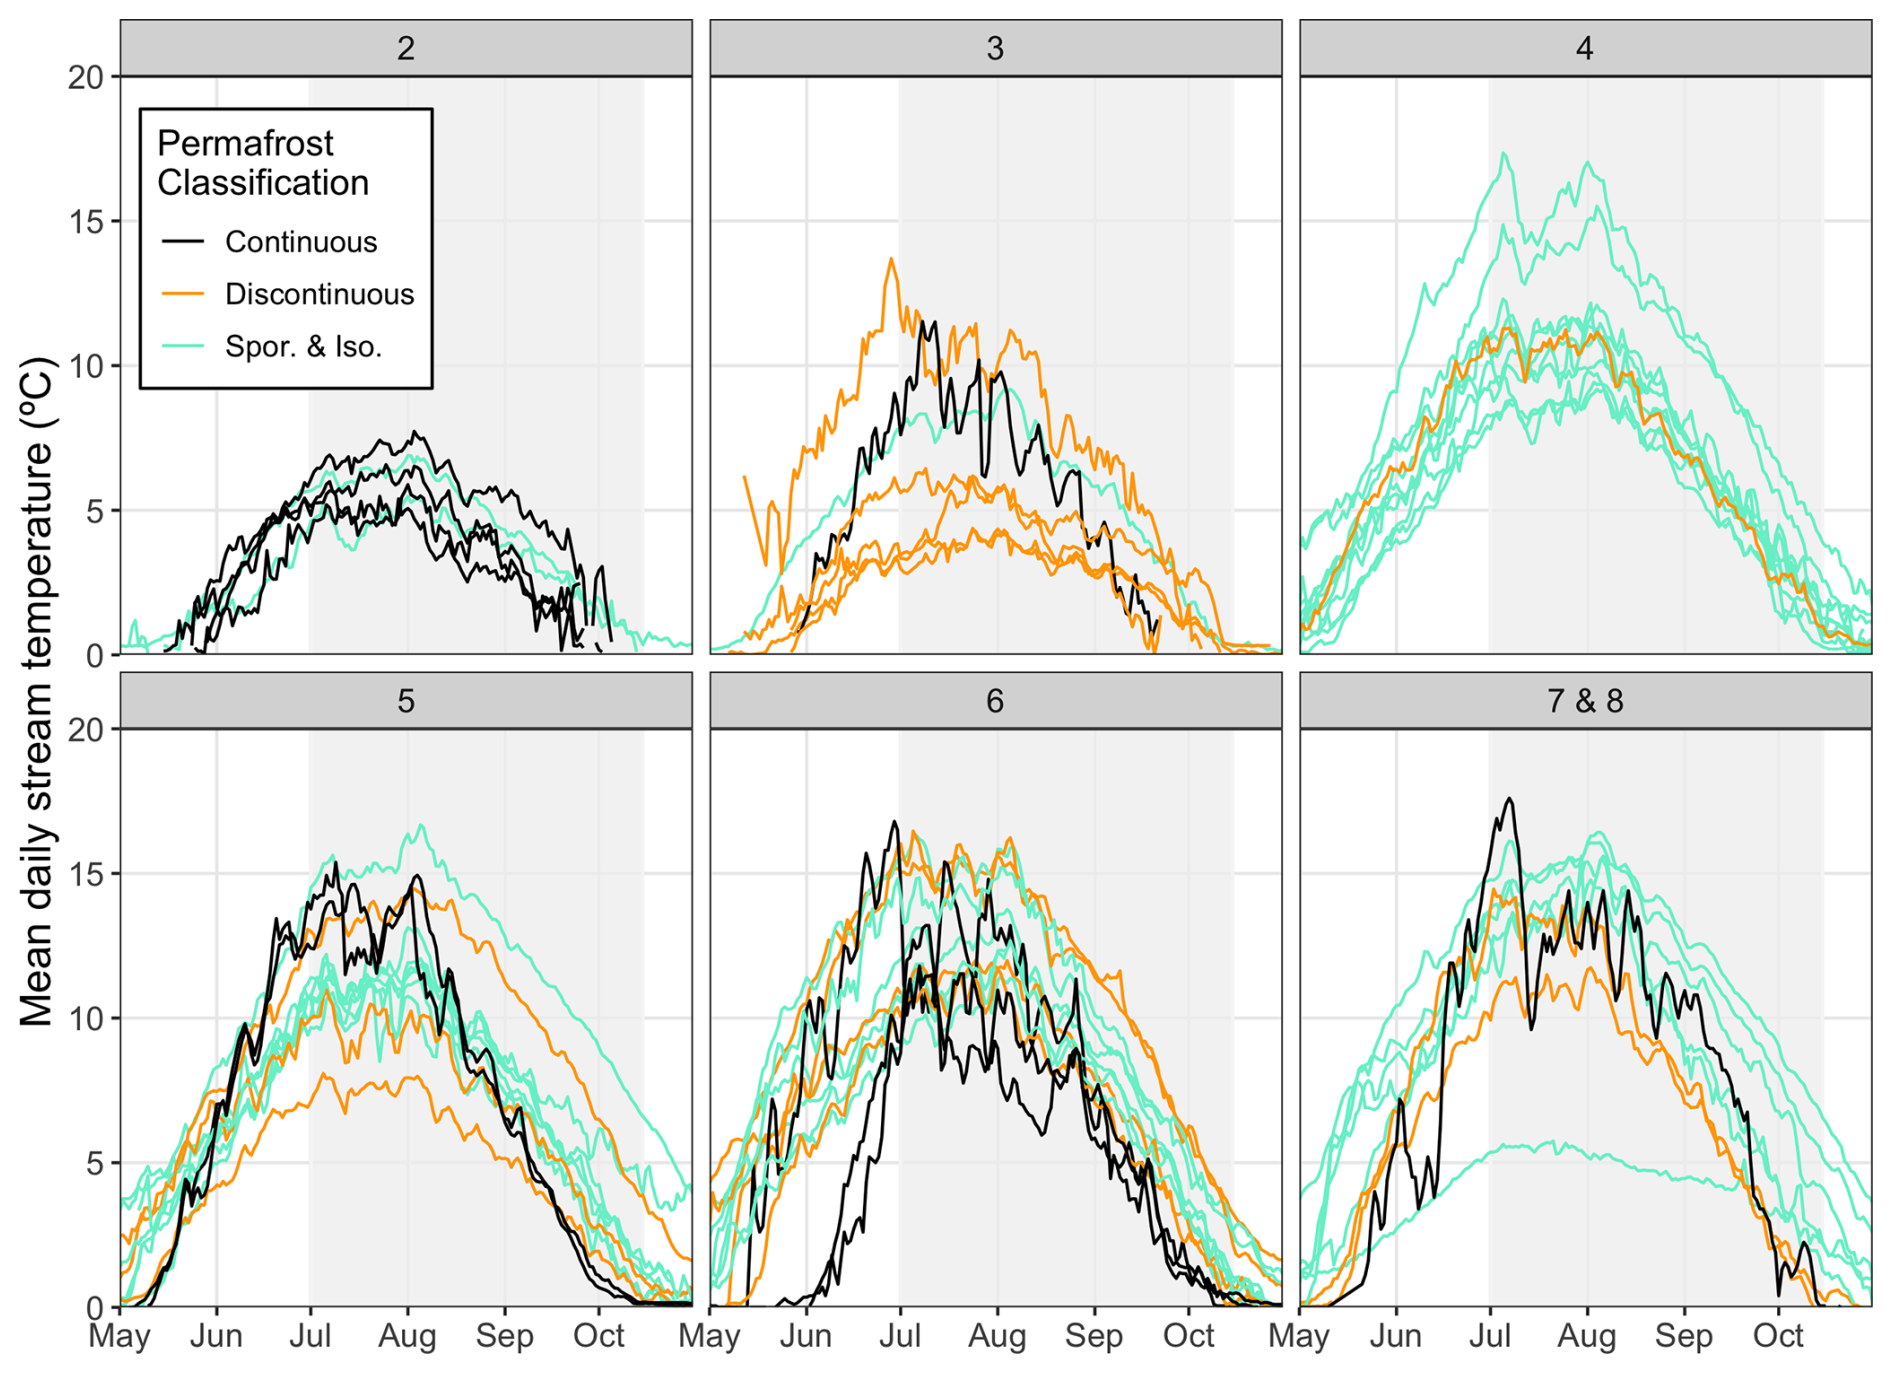
Figure 3Thermograph of long-term mean daily stream temperatures for the study streams, with panels arranged by Strahler stream order. The data cover the period from 1997 through to 2023, although individual study streams will typically have data records shorter than the full period. The model period considered for the analysis for this study is from 1 July to 15 October and is indicated by grey shading.
3.2 Thermal sensitivity
Site-specific RMSE and NSE from fitting Eq. (4) ranged from 0.46 to 2.65 °C and from 0.35 to 0.92, respectively, with corresponding means of 1.21 °C and 0.81. Catchments classified as continuous permafrost consistently had lower NSE than catchments with sporadic or isolated permafrost, which were consistently greater, while discontinuous permafrost catchment model performance increased with increasing stream order (Fig. 4). The mean NSE for each permafrost class was 0.73, 0.82, and 0.83 for continuous, discontinuous, and sporadic and isolated, respectively.
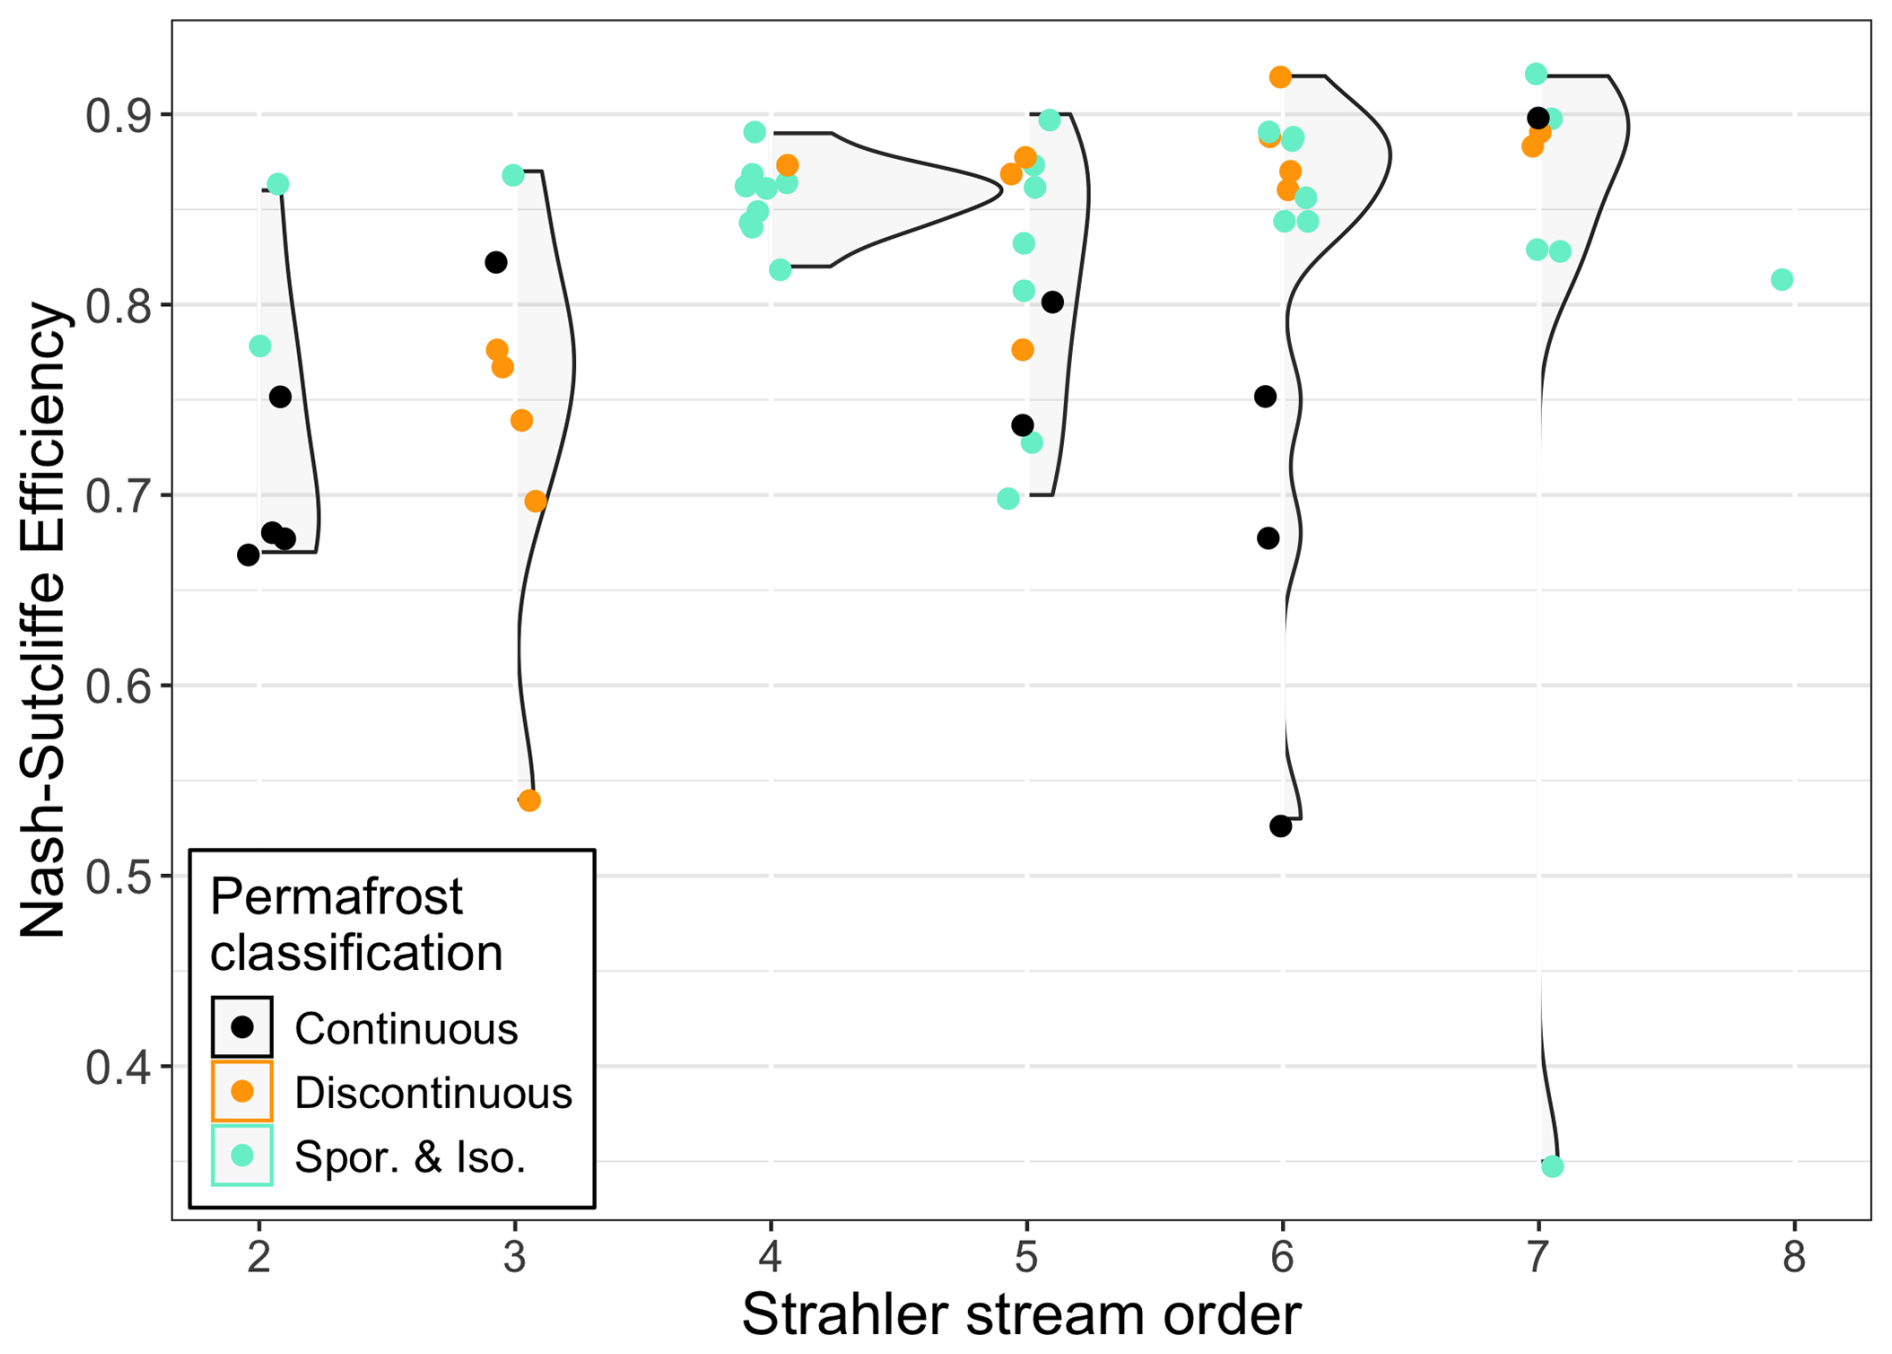
Figure 4Distributions of the Nash–Sutcliffe efficiencies of the linear models relating stream and air temperatures per site. The points are coloured according to catchment permafrost classification and are grouped by Strahler stream order.
The range of TS and BT from fitting Eq. (4) was 0.14 to 0.84 °C °C−1 and from −0.07 to 7.60 °C, respectively (Figs. 5 and S1 in the Supplement). The minimum TS observed was 0.14 for the WSC station number 08AB001; the low TS of this catchment is attributable to its glacierized status and due to the substantial thermal influence of glacial meltwater. Values of TS near 0 represent streams with low sensitivity to atmospheric conditions, while high values (e.g., >0.9) indicate close coupling between Ta and Tw. While the minimum TS (0.14) corresponded to a glacierized catchment, 8 other non-glacierized catchments had TS<0.3 and 19 in total had TS<0.50. Conversely, only six streams had a TS>0.70, indicating that only a few streams had high sensitivity. BT generally increased with decreasing permafrost coverage, with mean BT increasing from 1.81 to 2.62 °C between continuous and sporadic and isolated permafrost classes and with increasing catchment area.
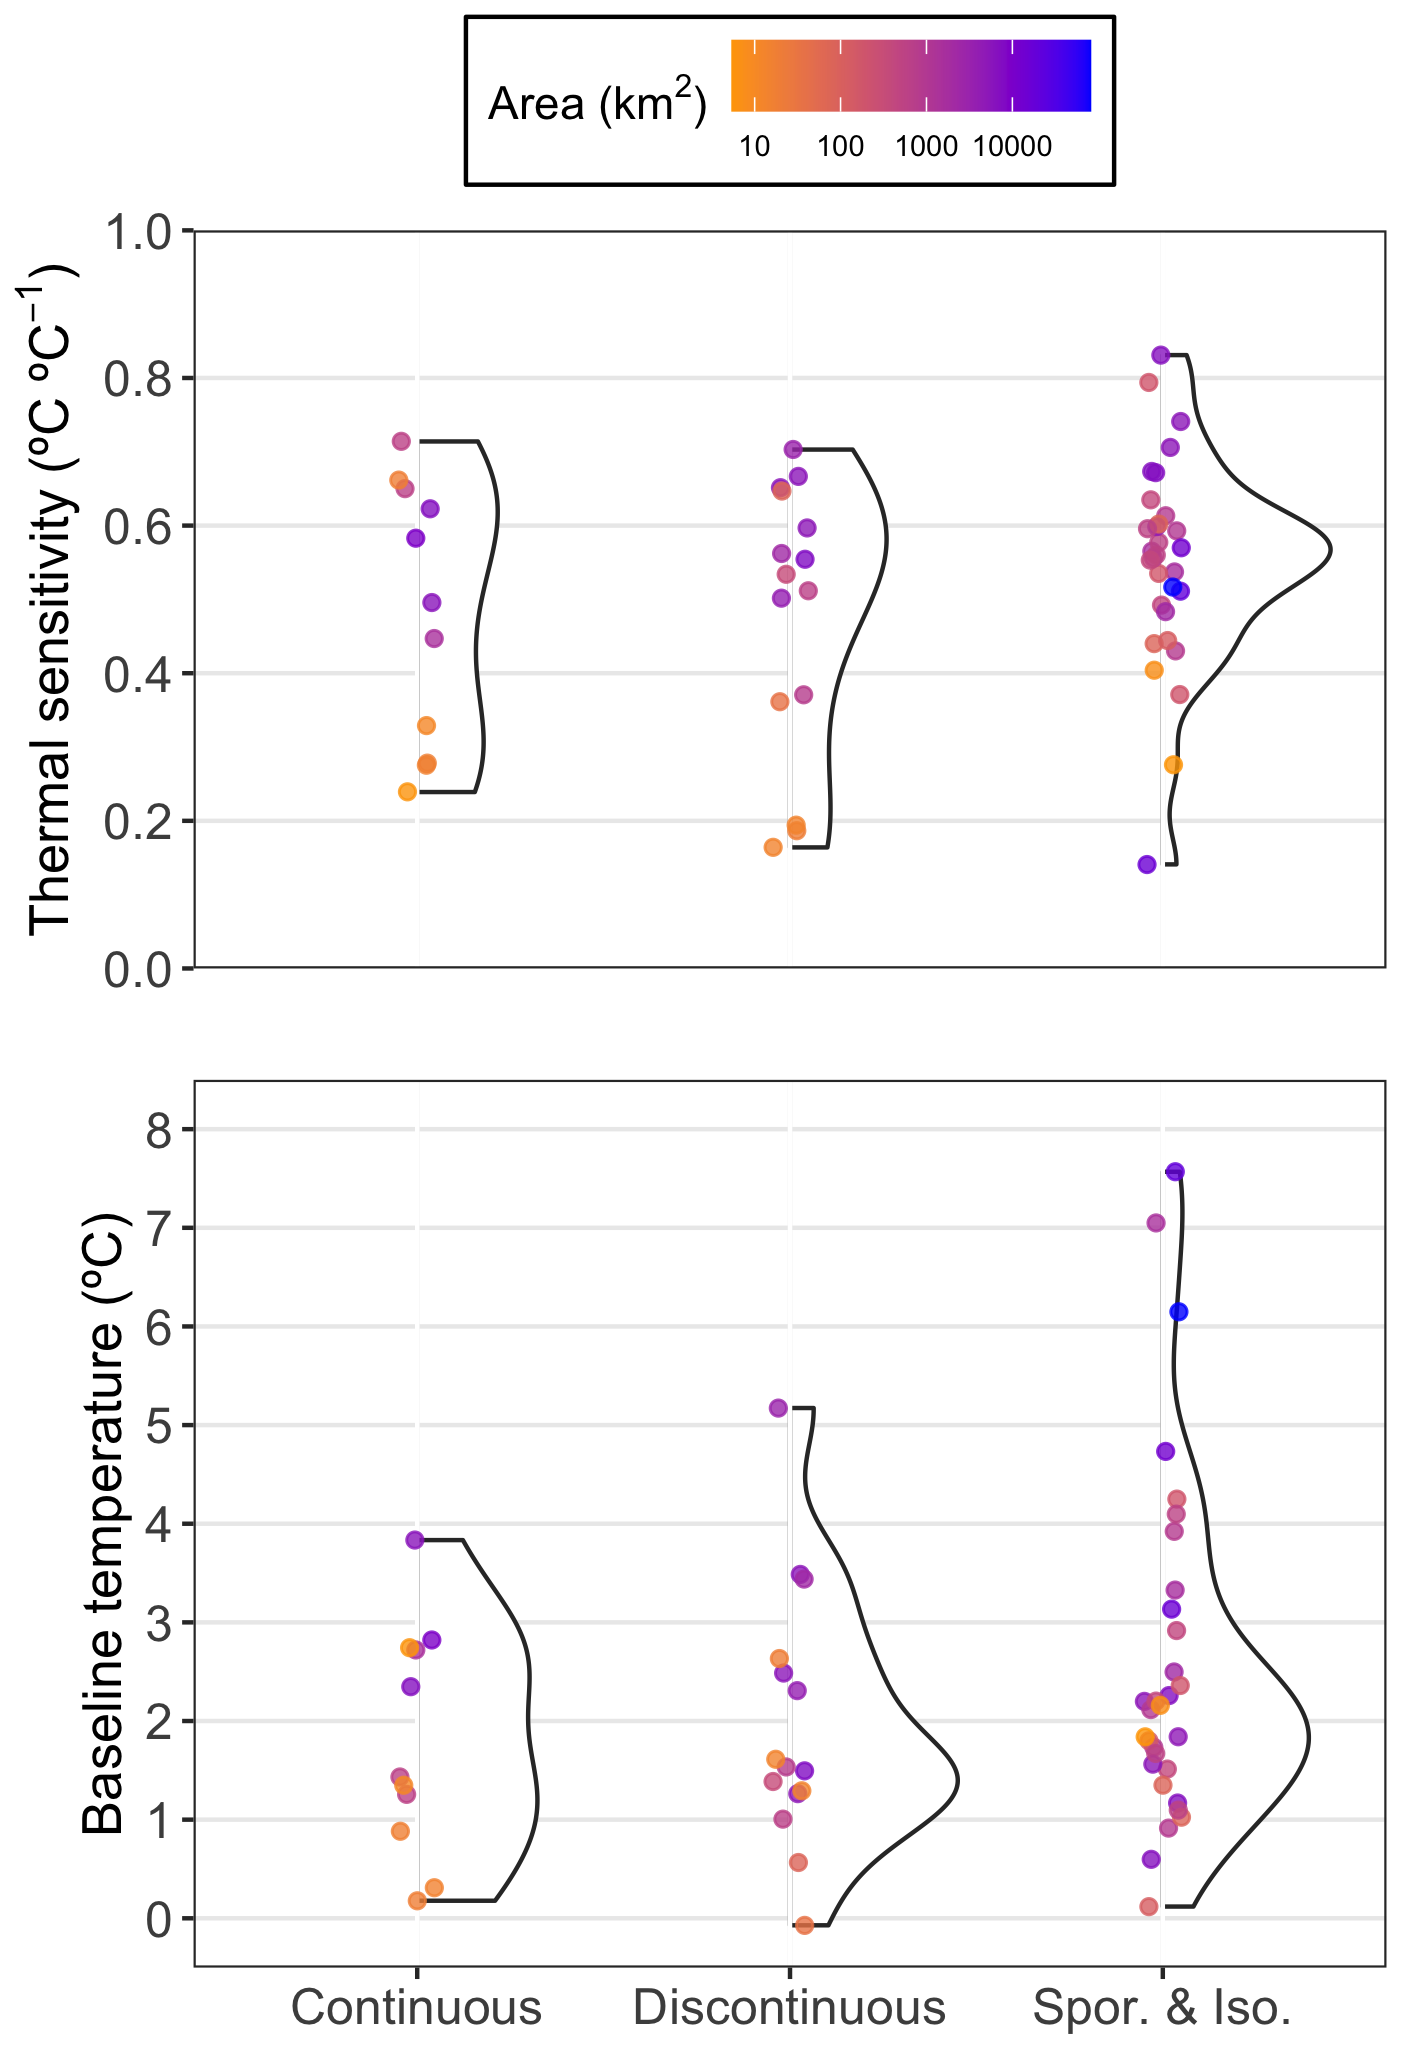
Figure 5The distribution of estimated coefficients for a linear relationship between stream and air temperatures. The slope is defined as the thermal sensitivity, and the regression intercept is defined as the baseline temperature. The distributions are grouped according to catchment permafrost classification; continuous, discontinuous, and sporadic and isolated.
The uncertainty assessment conducted through the re-fitting of Eq. (4) with the randomly distributed binomial error of ±0.44 °C resulted in comparable but slightly worse model statistics. The site-specific mean RMSE and mean NSE from the model fitted to the uncertainty-adjusted Tw were 1.29 °C and 0.78, respectively, in comparison to the model statistics reported above of mean RMSE and mean NSE of 1.21 °C and 0.81, respectively. The range of TS and BT from the uncertainty-adjusted model fit was 0.13 to 0.84 °C °C−1 and 0.05 to 7.63 °C, respectively, which are also comparable to the ranges reported above. The mean difference in site-specific estimates of TS and BT between the model results (Fig. 5) and the uncertainty assessment results was °C °C−1 and 0.01 °C.
The addition of Q as a predictor in Eq. (5) slightly improved model performance; RMSE and NSE ranged from 0.33 to 2.48 °C and from 0.54 to 0.93, respectively, with corresponding means of 1.14 °C and 0.84. The estimated coefficients representing TS and BT ranged from 0.08 to 0.86 and from 0.25 to 7.58, respectively. Model statistics corresponding to Eqs. (4) and (5) are summarized in Table 2.
Table 2The range of estimated thermal sensitivity (TS) and baseline temperature (BT) coefficients for the two linear regressions (Eqs. 4 and 5). The root-mean-square error (RMSE) and Nash–Sutcliffe efficiency (NSE) are the associated model goodness-of-fit statistics.

The addition of Q as a predictor had a greater impact on the estimated BT than the estimated TS. The difference in site-specific TS estimated by the two models was an order of magnitude less than the fitted values; the TS difference ranged from −0.06 to 0.08, with a TS difference <0.02 for 66 % of the streams. In contrast, the difference in BT estimated by both models was of the same order of magnitude as the estimated values, and ranged from −6.3 to 1.34. Equation (4) was re-fitted to the same subset of data as Eq. (5) and both models' Akaike information criterion (AIC) values were compared to determine whether Eq. (5) was a significant improvement, using a threshold of . Equation (5) had an AIC that was 1357 less than Eq. (4) and was deemed a significantly better model.
Residual errors displayed an increasing negative bias through the summer from the time trend analysis (Fig. 6). The mean residual error for each permafrost classification began decreasing by the second week of August; however, discontinuous permafrost catchments did not have an overall negative bias until the third week in August and sporadic and isolated catchments did not have one until the beginning of September. Increasing negative bias indicates that the fitted coefficients representing 1 July to 14 July increasingly overestimated Tw through the summer, with greater overestimation with increasing permafrost extent.
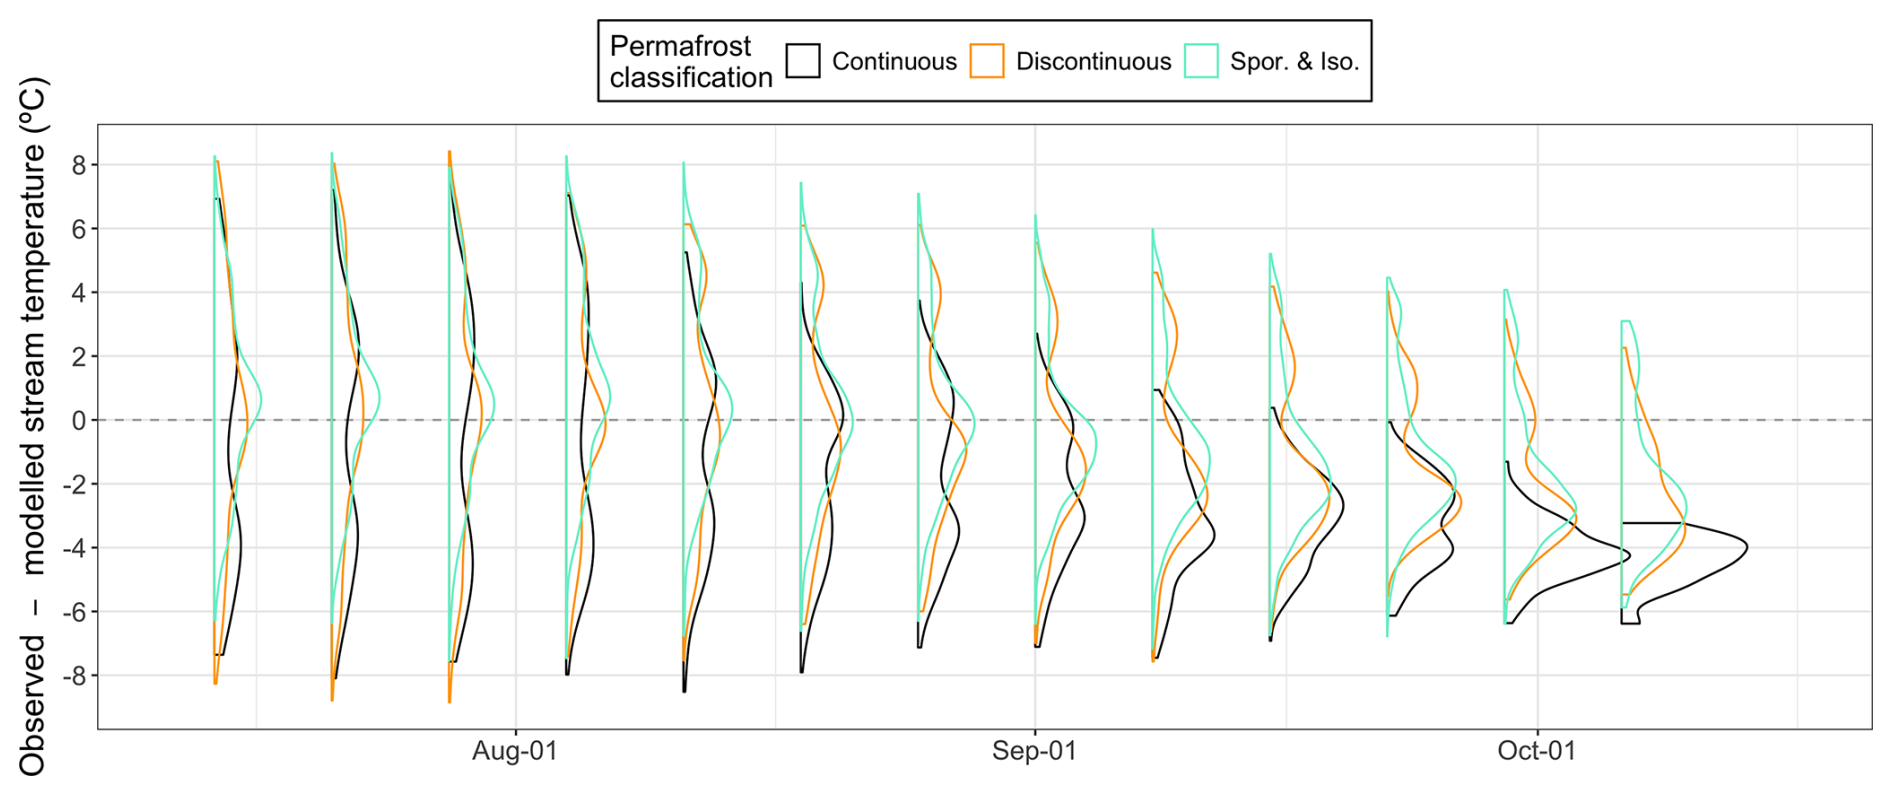
Figure 6The weekly residual error distribution as estimated by applying a linear regression fitted to the first 2 weeks of July. The residuals displayed correspond to dates on or after 15 July, and the distributions are grouped by permafrost classification.
3.3 Redundancy analysis
Catchment physiography
Variance in TS and BT was generally consistently explained by catchment physiography metrics (Fig. 7a), as seen by the alignment of arrows representing physiography variables with TS and BT. A greater portion of variance in TS and BT was explained by topographical variables (e.g., stream network TPI, catchment average slope, and TRI) than the magnitude variables of catchment area or Shreve stream magnitude. Topographical variables were consistently correlated across permafrost classes (Fig. 8) and had stronger correlations with TS (Pearson r ranged from −0.89 to 0.84) than with BT, which was weakly correlated with the magnitude and shading metrics, with r values of 0.37 and 0.36 for log 10(Area) and TRI, respectively. TS was negatively related to greater catchment slope and terrain shading (TPI has the opposite relation because more positive values of TPI indicate less topographic shading), whereas both magnitude variables were positively correlated with BT.
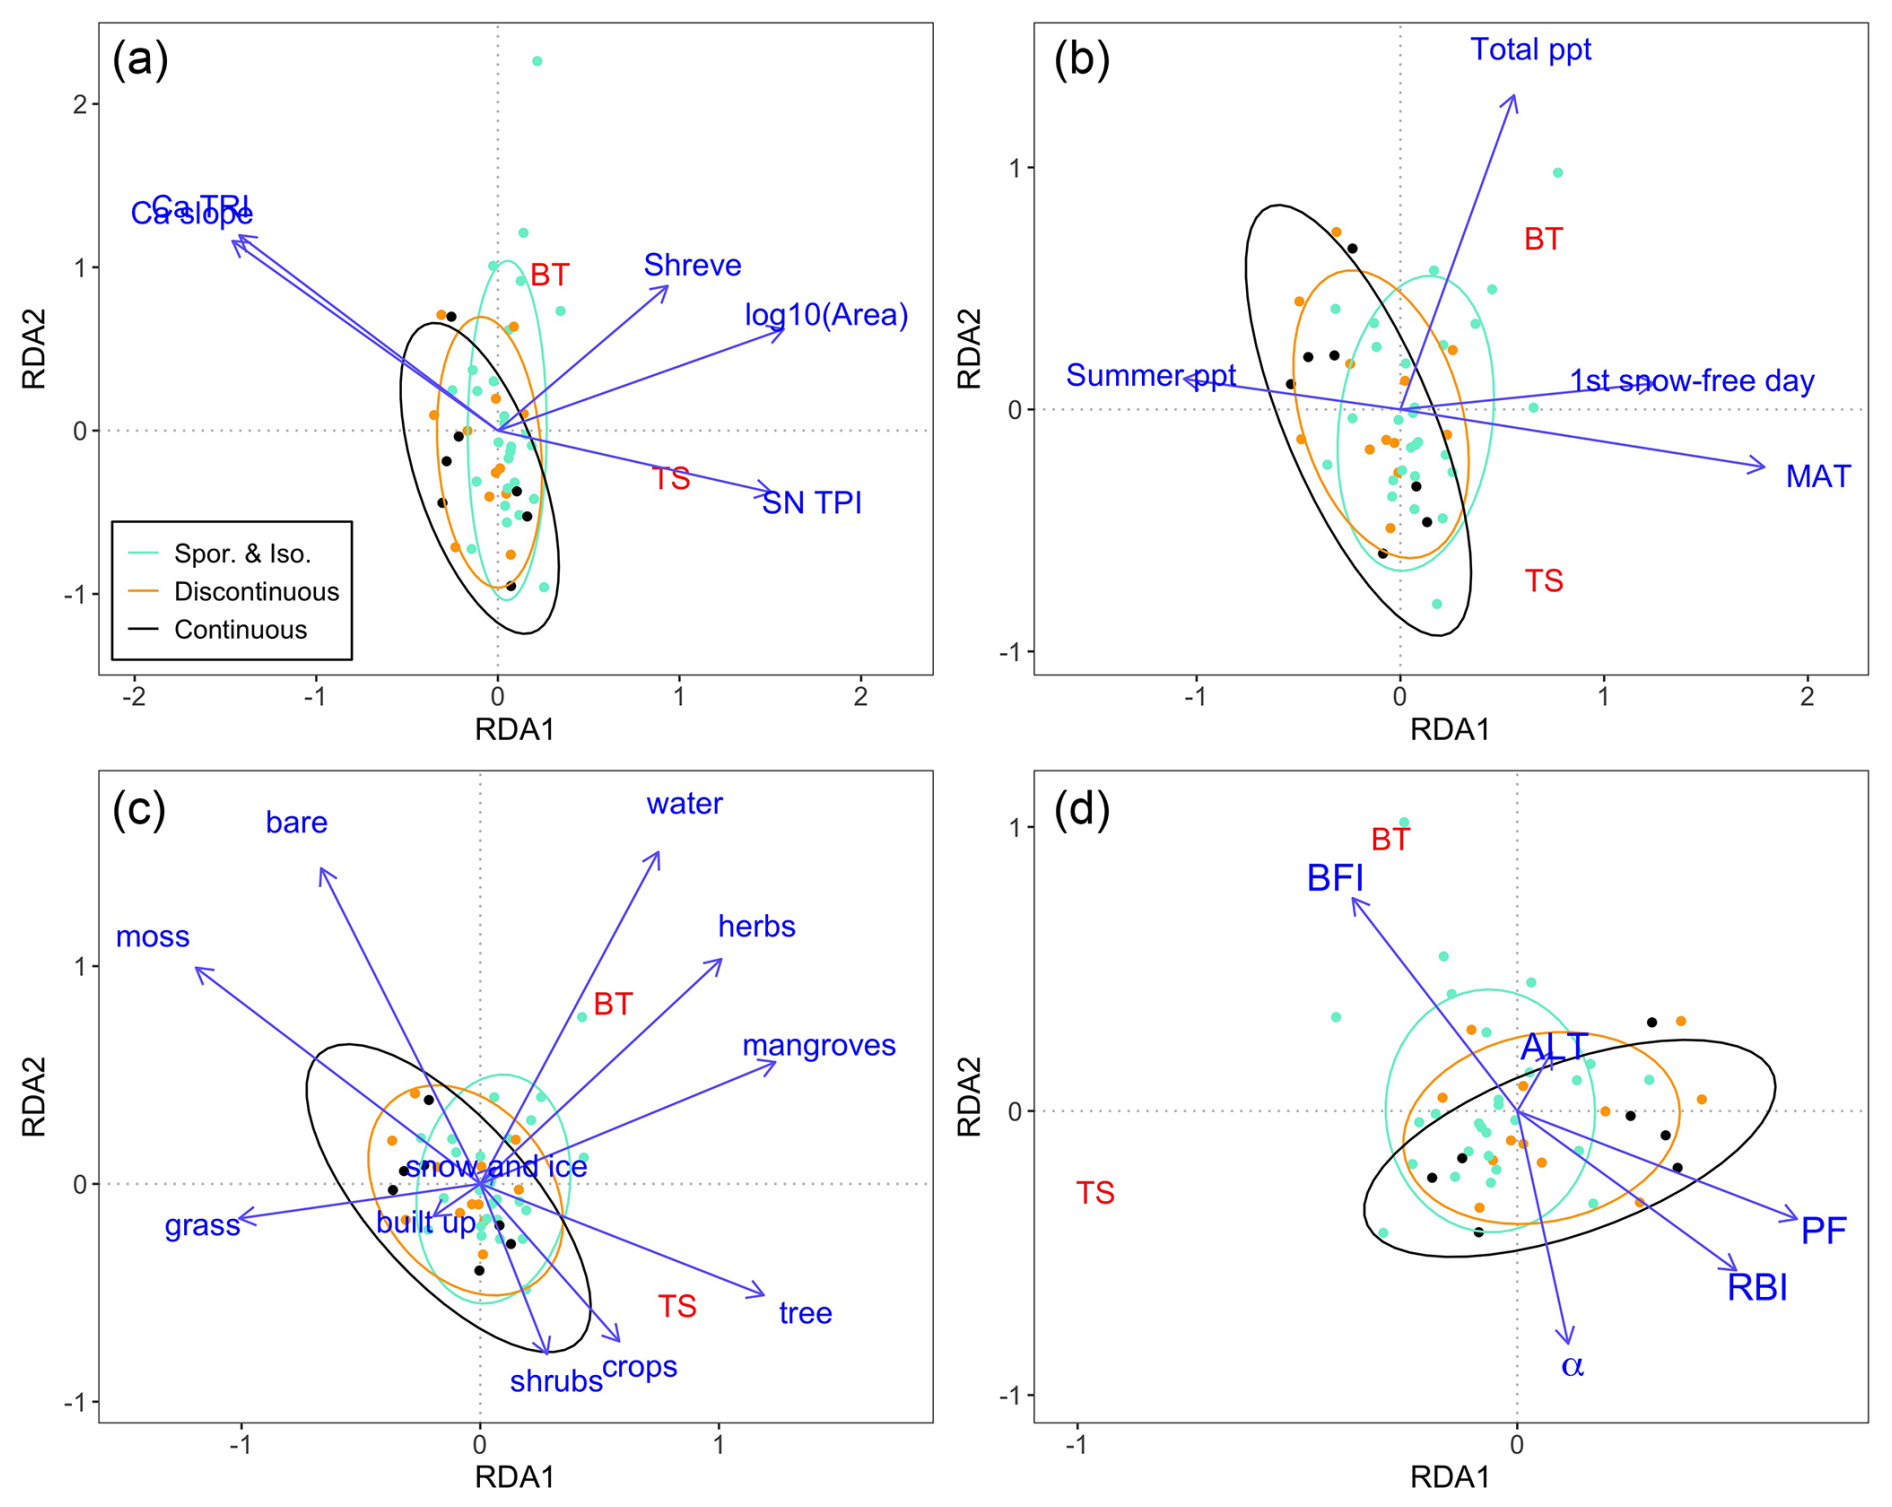
Figure 7Redundancy analysis between thermal sensitivity (TS) and regression intercept (BT) as well as four groups of characteristics and variables corresponding to (a) catchment physiography, (b) climate, (c) land cover, and (d) permafrost presence indicators. Definitions of abbreviated variable names can be found in Table 1. The angle between the explanatory variables (blue text) and the response variables (TS and BT, red text) represents the strength of their correlations, with angles of 0 or 180° indicating the strongest positive or negative correlations, respectively, and the length of the arrows indicates the magnitude of influence. The ellipses are akin to a convex hull for each permafrost class, and the relative position of the ellipses with respect to the explanatory variables indicates the strength of influence of the explanatory variables on the permafrost classes.

Figure 8Pearson correlation coefficients between thermal sensitivity (TS) and baseline temperature (BT), as well as the catchment and environmental variables. The correlations were computed per catchment permafrost classification (i.e., continuous, discontinuous, and sporadic and isolated permafrost). Definitions of abbreviated variable names can be found in Table 1.
Climatology
In comparison to catchment physiography, climate variables were generally weakly correlated to TS and BT (Fig. 7b) and explained a smaller portion of variance. The greatest correlation between TS and a climatological variable was with MAT, as r ranged between −0.63 and 0.67 for continuous and discontinuous permafrost classes, respectively. Summer and total precipitation had a variable correlation with TS across permafrost classes, with r ranging from −0.52 for total precipitation in continuous permafrost to 0.36 for discontinuous permafrost (Fig. 8). Longer seasonal snow cover was positively correlated with BT, but due to the sign of the relationship, this is suspected to relate to catchment size and the associated stream network heat accumulation (Fig. 7a) rather than persistent snow packs suppressing BT with cold meltwater.
Land cover
Of the RDA models, land cover explained the most variance in BT and TS, but there was substantial variability in the magnitude and direction of the correlations between the predictor and response variables (Fig. 7c). The patterns of correlations were generally consistent across permafrost classes (Fig. 8), with the strongest correlations between thermal sensitivity and catchment tree cover (r ranged from 0.40 to 0.46); this positive relationship likely reflects the probability of greater forest cover in larger catchments rather than a direct influence on TS. Land covers negatively related to TS were moss and lichen and bare land (r ranged from −0.66 and −0.34, across both variables, respectively), but these land covers would not be expected to increase stream shading or, hence, moderate TS. They were, however, correlated with catchment physiography variables that were negatively correlated with TS (e.g., r=0.67 with mean catchment slope) and therefore likely overlap with catchment physiographical variables in the total variance explained. Across permafrost classes, BT was consistently positively related to land covers representing surface water storage (i.e., water and herbaceous wetland), with the greatest correlations for continuous and sporadic and isolated permafrost catchments (Fig. 8), which (if connected to the stream network) can act as sources of relatively warm water during the summer.
Permafrost indicators
Variance in TS and BT was explained by a gradient in catchment permafrost disposition (e.g., mean permafrost probability and ALT) and in the catchment flow regime (i.e., whether streamflow is dominated by flashy flow response or baseflow contributions) as seen in Fig. 7d. The correlations between these permafrost indicator variables and TS were not consistent across permafrost classes, with continuous permafrost catchments often having opposing relationships with TS in comparison to the other permafrost classes (Fig. 8). The greatest correlations in continuous permafrost catchments were between TS and the flow regime variables, with r=0.87 and 0.80 for α and RBI, respectively, while BFI had . Thermal sensitivity was positively correlated with catchment mean permafrost probability in continuous permafrost catchments (r=0.55), and it was negatively correlated in the other permafrost classes with and −0.26 for discontinuous and sporadic and isolated permafrost catchments, respectively. There is likely some collinearity in the variance explained by these predictors, as both permafrost probability and ALT had moderate to strong correlations with the flow metrics. For example, the strongest correlation was between permafrost probability and BFI with , and the weakest correlation was between ALT and RBI with .
The influence of permafrost disposition in explaining variance in BT and TS was variable among the RDA models (see colour legend in Fig. 7). Baseline temperature appeared to have the strongest relationship with the gradient in permafrost disposition, with BT generally increasing with decreasing permafrost coverage for all RDA models except catchment physiography. The overlap in permafrost classifications in the RDA, however, precludes a definitive relationship.
Variance partitioning
Variance partitioning revealed that all of the individual RDA models (Fig. 7) had statistically significant individual contributions to explaining the variance in TS and BT (p<0.05, Fig. 9a) when accounting for the other RDA models. The individual RDA models explained between 9 % and 14 % of the variance in TS and BT; the adjusted explanatory power of each RDA model was similar (ranged from 36 % to 39 %), except for the climatology RDA which only explained 15 % of the total variance with the other models considered.
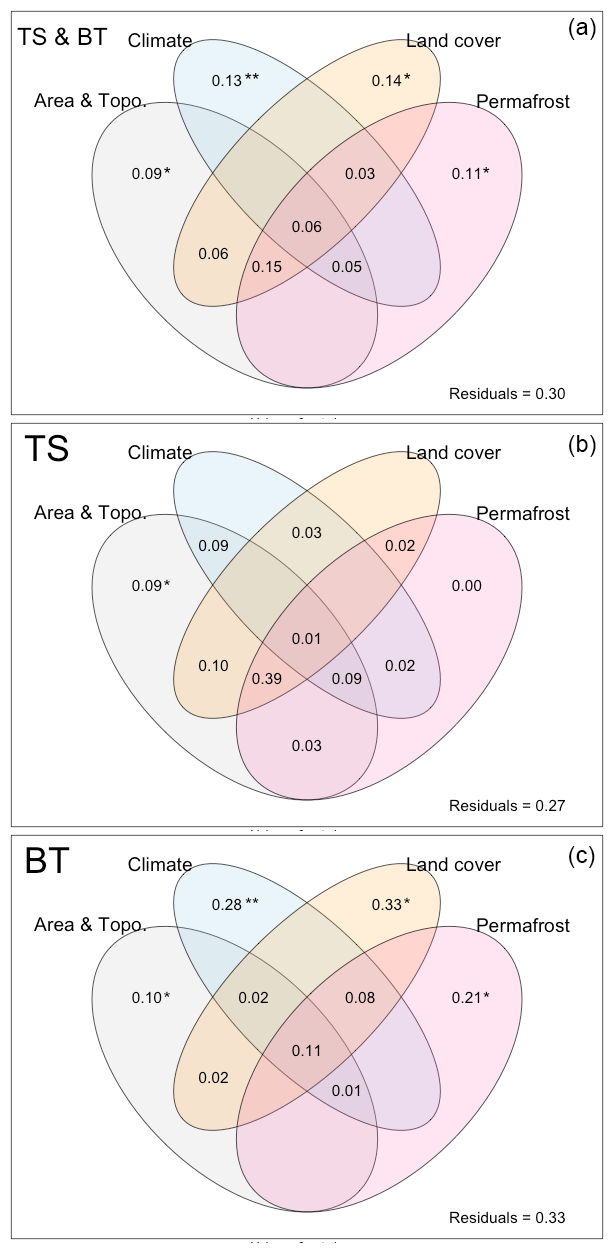
Figure 9Variance partitioning of the redundancy analysis (RDA) models fit to four groups of catchment and environmental predictor variables. The values represent the proportion of variance explained by an individual group of variables (e.g., “Land cover”) or combinations thereof (e.g., “Land cover” and “Area & Topo.”), relative to a global RDA model including all explanatory variables. The panels are labelled according to the response variables included in the RDA models on which variance partitioning was conducted. Panel (a) represents thermal sensitivity (TS) and baseline temperature (BT), panel (b) represents TS, and panel (c) represents BT. Statistical significance of the individual components are indicated with asterisks as follows: * p<0.05, ** p<0.01, and negative values are omitted.
The individual RDA models had less explanatory power for TS alone despite having the greatest combined adjusted R2 of 0.73 (Fig. 9b). Only the catchment physiography RDA model had a statistically significant individual contribution (grey oval, Fig. 9b), explaining 9 % of the total variance. The physiography and permafrost RDA models (grey and pink ovals, respectively, in Fig. 9b) had the greatest explanatory power overall, explaining 76 % and 52 % of the variance in TS, but a substantial portion of each model's skill is redundant with the other models. A combined 39 % of the variance in TS was explained jointly by the catchment physiography, land cover, and permafrost indicator RDA models, indicating that TS is an integrated response to multiple catchment properties and is relatively insensitive to any one type of catchment characteristic.
Similar to the full RDA model, the individual RDA models were all statistically significant in their individual contributions to explaining variance in BT (Fig. 9c). The land cover and climate RDA models were the greatest individual contributors with 33 % and 28 % of the variance in BT explained, respectively. The permafrost RDA model explained 21 % of the variance, while catchment physiography explained only 10 % by itself. The combined adjusted R2 of 0.67 was comparable to the full model (R2=0.70) and to the TS variance partitioning, but there was less redundancy or collinearity in how catchment properties explain variance in BT.
3.4 Multiple regression
The catchment properties used in the RDA (Table 1) and TS coefficients from the linear model were used to fit a multiple linear regression model through stepwise model selection (retention of additional predictor variables assessed at p<0.05). For this analysis, the TS was modelled for the 46 catchments with streamflow records to permit inclusion of streamflow-derived candidate variables (e.g., BFI, α). The final model form was as follows:
where is the predicted thermal sensitivity (°C °C−1), log 10(Area) is the log of catchment area, CS is the mean catchment slope (°), W is surface water land cover as a proportion of catchment area (–), α is the intercept of the recession curve (), respectively. The model described by Eq. (8), as shown in Fig. 10, had an R2 of 0.76, with standard error of 0.076 °C °C−1, and a mean residual error of essentially zero ( °C °C−1). During model selection, one candidate model of note was identified, as it related the influence of catchment permafrost variables to TS. While this candidate model was not the best performing, it was fully statistically significant, and it had the following form:
where PF is the catchment mean permafrost probability (–), and ALT is the catchment median active layer thickness (cm).

Figure 10Catchment thermal sensitivity from the linear regression compared to thermal sensitivity as predicted by catchment properties () through multiple regression.
The TS for one catchment (Blind Creek, a third-order stream in a discontinuous permafrost catchment near Faro, Yukon) was not well estimated by the model, with a model error of 0.24 °C °C−1; there are no clear indications that explain this deviation, so the catchment was retained for the analysis. The regression in Fig. 10 shows that TS is well predicted across all stream orders and all classifications of catchment permafrost disposition. A simpler model with only log 10(Area) and mean catchment slope as predictor variables had slightly worse performance (R2=0.73, standard error = 0.081 °C °C−1) but benefited from parsimony and ready application to ungauged basins; it has the following form:
A multiple regression model to estimate BT performed notably worse in comparison to the model for TS. The best performing model, on the basis of R2 and model standard error, had herbaceous wetland and surface water land covers as predictor variables with model statistics of R2=0.49 and standard error = 1.14 °C. The model residuals, however, showed an increasing trend in model underprediction through the summer and indicated the model did not fully represent the catchment properties that control BT, despite the inclusion of surface water storage predictor variables that can represent sources of warm water to a stream network and hence influence BT.
4.1 Model performance and seasonal trends
Numerous other studies have demonstrated improved model skill by using a non-linear regression (e.g., Mohseni et al., 1998; Kelleher et al., 2012), functional regression methods such as generalized additive models (e.g., Laanaya et al., 2017; Boudreault et al., 2019), or sinusoidal functions (Johnson et al., 2020) when fitting models to time series of air–stream temperature data. Despite the improved model skill of these other techniques, linear regression remains a robust approach to relate the thermal sensitivity of a stream to its environmental and atmospheric forcings, as well as to investigate the controls on its variability, especially when applied to seasonal subsets of data. As this study only considered the post-freshet open water season, the thermal sensitivity and intercept coefficients in Fig. 5 represent the air–stream temperature processes active during a period with minimal snowmelt influence, increasing active layer thickness, and includes peak water temperatures. These characterizations assist in investigating what influence permafrost, as a distinct trait of northern catchments, may have on stream thermal regimes.
Model performance with a simple linear model (Eq. 4) across the range of catchment areas and environmental conditions was good, with a mean NSE of 0.81. Catchment area (as proxied by SO) and permafrost disposition appear to influence the relationship between Tw and Ta (Fig. 4), with NSE generally increasing with SO and being lower for continuous permafrost catchments in comparison to discontinuous or sporadic and isolated permafrost catchments. These differences in model skill suggest greater complexity in stream–air temperature relationships at smaller scales and in catchments predominantly underlain by permafrost. Model performance was slightly improved through the addition of discharge as a predictor variable, with a mean NSE=0.84 and a ΔAIC>2, but it resulted in similar estimated TS for 66 % of the sites. As such, the application of a simple linear model relating Tw and Ta is likely sufficient for the purposes of investigating the environmental controls on TS.
There is additional uncertainty in the model results due to the multi-agency origin of the observed Tw and the lack of information regarding observed Tw data accuracy. Despite this, the uncertainty assessment, which applied the maximum accuracy uncertainty to all observed Tw and compared it to the model outputs using the observed Tw, resulted in comparable model statistics. Perhaps more notably, the site-specific estimates of TS and BT were essentially unchanged, with the mean change in modelled °C °C−1 and the mean change in BT=0.01 °C. While there are additional uncertainties associated with the streamflow data, the primary use of streamflow indices that represent relative changes and temporal trends in streamflow at a given gauging station, e.g., RBI, are likely to realistically represent the primary hydrological processes influencing streamflow trends at a study site. The use of modelled air temperature also incorporates uncertainty into the model results, but the use of a gridded climate data product has the benefit of consistency in bias or error across the study domain. Given these considerations, the data are likely to provide realistic representations of the trends and patterns in the estimates of TS and BT, as well as the subsequent RDA and multiple regression analyses, although the exact values of modelled outputs may differ slightly were there greater constraints on data uncertainty.
The stream–air temperature relationship is dynamic over the study period (Fig. 6) across catchments of all permafrost classifications, with increasing model overprediction from August to October corresponding with decreasing stream temperatures through this period (Fig. 3). However, the estimated coefficients fitted to the pooled data set produced a distinct response for continuous permafrost catchments, with an earlier onset of model overprediction beginning in early August and with a clear negative bias present by September. This contrasts the relatively synchronized timing and distribution of prediction errors for the other permafrost classes. These temporal trends suggest that sites with catchment soil storage and subsurface runoff processes controlled by seasonal active layer thaw have greater intra-annual TS variability. The presence of temporal trends in time trend analysis residuals is consistent with previous research reporting on seasonal variability in TS across the continental USA, but Segura et al. (2015) found the distribution of TS for fall to be slightly less than summer, with greater differences in spring TS and with greater regression intercepts from summer to fall (see Fig. 12; Segura et al., 2015). While the residual time trend seen in Fig. 6 is consistent with the literature, the relatively greater deviation by continuous permafrost catchments suggests that they are subject to different controls on the stream–air temperature relationship in comparison to catchments with less permafrost presence.
4.2 Environmental controls of thermal sensitivity and baseline temperature
The thermal sensitivities reported here, with a range of 0.16 to 0.84 °C °C−1 and median of 0.56, are slightly lower than the ranges reported by studies focused on more temperate regions but are comparable if not greater than studies investigating summer TS in southern Alaska (Lisi et al., 2015; Winfree et al., 2018) or in high-elevation mountain catchments in northwestern North America (e.g., Wissler et al., 2022; McGill et al., 2024). Directly comparing stream thermal regime studies is complicated by the lack of standard approaches and methods (time periods considered, regression models applied, catchment areas included, etc.) among studies. However, when considering the underlying controls on thermal sensitivity (such as catchment area and slope, land cover, and groundwater contributions to discharge), the results presented here are consistent with the literature.
The primary influences on thermal sensitivity were related to catchment properties affecting stream water residence time, surface water storage, and subsurface runoff processes. The results indicating the dampening of TS by steeper catchments, through greater flow velocity, and increasing TS with greater catchment area, due to greater flow volumes and longer exposure times between the stream and the atmosphere, are well supported by previous research (e.g., Donato, 2002; Isaak et al., 2012; Lisi et al., 2015; Ducharne, 2008; Kelleher et al., 2012; Segura et al., 2015). These catchment physiographical controls appear to have a consistent influence regardless of study region.
Greater surface water storage, as represented through the land cover classes of “water” and “herbaceous wetland”, had a positive effect on TS. In the context of northern summers with long daylight hours and with greater residence time compared to streams, surface water bodies may act as stores contributing relatively warm water to a stream network, increasing its TS. While this relationship has also been observed elsewhere (e.g., Mellina et al., 2002), greater lake coverage in southwest Alaska was found to have a dampening effect on TS by Lisi and Schindler (2015) or to be a non-significant influence in southeast Alaska (Winfree et al., 2018). The effect of surface water bodies on TS is likely influenced by local or regional conditions that govern the thermal regimes of the surface waters; elevation, volume, sources of inflows, and topology may all influence whether lakes and surface waters buffer or bolster TS in a given study region.
The α coefficient, representing subsurface runoff processes as a metric of streamflow flashiness, was positively related to TS. The influence of flashiness as represented by α, or RBI for that matter, has not been directly reported previously to the best of our knowledge. Some analogous comparisons may be made, however, as McGill et al. (2024) reported that upland catchments with thin soils overlying impermeable bedrock had greater TS in comparison to catchments with greater soil depth. Segura et al. (2015) investigated the influence of subsurface flow contact time as a predictor of thermal sensitivity as well as the intercept. While Segura et al. (2015) did not find subsurface contact time to be a significant predictor of TS, it was negatively correlated with the intercept (i.e., BT). The suggestion of McGill et al. (2024) that thin soils which rapidly transmit infiltrated water to the channel (and have limited groundwater contributions) result in greater thermal sensitivity is consistent with this study and with the conceptual representation of α both as a metric of flashiness and a variable related to active layer thickness (Brutsaert, 2005; Sergeant et al., 2023). In systems with flashy flow regimes, a lack of thermal buffering from cold (relative to air temperature) groundwater contributions may be compounded by the greater thermal sensitivity associated with decreased flow volumes. While the variables representing flashy runoff generation most likely represent the absence of groundwater contributions to baseflow as a thermal sensitivity moderator, this study cannot conclusively describe the influence that rapid runoff generation in concert with subsurface heat exchange processes between infiltrated water and the soil has on thermal sensitivity, particularly in a permafrost context.
The regression intercepts, while less commonly reported in stream temperature studies, are relevant in the cold regions as (1) permafrost presence creates a cold interface, at maximum 0 °C, which has implications for the heat exchange processes between runoff-generating soil water and the frost table, and (2) catchments with near-continuous and continuous permafrost are commonly understood to have limited hydraulic connection to deep or regional groundwater and have streamflow regimes dominated by near-surface runoff generation processes. Greater permafrost presence appears to suppress the regression intercept, when considering the distribution of fitted intercept values (Fig. 5), and is consistent with the negative relationship seen between BT and PF in the RDA (Fig. 7d). Streamflow indicators associated with greater permafrost presence, such as a low BFI, high RBI, or greater α, all relate negatively with the regression intercept (Figs. 7d and 8) and provide further support for the presence of this process. When considered alongside the regression intercepts from other studies in the continental USA (e.g., Pilgrim et al., 1998; Wissler et al., 2022), the intercepts reported here are relatively low for the summer period, with a median value of 1.88 °C across all catchments.
The RDA results (Figs. 7 and 9) illustrate the complex relationship between TS and BT and their environmental controls. While there is redundancy among catchment physiographical variables, they are strong predictors of TS. Likewise, as permafrost presence strongly influences flow regimes and groundwater contributions, there is redundancy between those predictors, as well, but with greater importance for BT than TS. Stream thermal sensitivity appears to be an emergent property of multiple aspects of the surrounding environment; the only variable class significantly explaining variance alone is topographical variables (9 %, Fig. 9b), but this class can account for 63 % of the variance in TS together with the variable classes of land cover and permafrost indicators. This contrasts BT, where each variable class alone can significantly explain variance (Fig. 9c) but with less predictive power, as has been reported in other studies investigating environmental controls on BT (Segura et al., 2015; McGill et al., 2024). The inter-relatedness of the controls of thermal sensitivity suggests that environmental changes may result in a non-linear response of thermal sensitivity in northern catchments.
4.3 The role of permafrost and implications for stream temperature in a changing environment
The results of this study suggest that permafrost presence does not have a dominant control on the stream–air temperature relationship but rather sets conditions for other catchment properties and processes that influence TS, some of which are counteracting. Extensive permafrost clearly suppresses groundwater contributions to baseflow, resulting in lower baseflow volumes which would be more responsive to atmospheric forcings and greater TS (Figs. 7d and 8; α coefficient in Eq. 8). Ice wedge polygon ponds, wetlands, and fens provide surface water storage in landscapes with extensive permafrost (Woo, 2012), and they may increase both TS and BT through their contributions, at a greater relative temperature, to streamflow, as observed by Docherty et al. (2019) in their study of five headwater streams in northeastern Greenland. Similarly, the presence of beaded streams in continuous permafrost stream networks has been reported to have a warming influence on stream temperatures in comparison to networks with non-beaded streams (King et al., 2016). However, the variable correlations (r ranged from −0.56 to 0.55) and negative estimated regression coefficient (Eq. 9) between permafrost and TS suggest that there are also moderating influences on TS due to permafrost presence. Permafrost underlying stream channels acts as a significant heat sink through hyporheic exchange (King and Neilson, 2019), and this is a process that is likely to moderate TS. Melting ground ice released through seasonal active layer expansion, contributing cool water to streamflow, or the heat sink of the frost table interacting with soil water (Woo, 2012) may also moderate TS. Aufeis, commonly found in northern regions with permafrost presence, although not inherently caused by permafrost (Turcotte et al., 2024), can act akin to in-stream snow banks in moderating summer stream temperatures as a source of cold meltwater to the stream (Bolduc et al., 2018).
The relative contributions of these processes are likely variable and dependent on catchment-specific characteristics and properties, and, together with the counteracting nature of permafrost's influence on TS, this leads to uncertainty in the response of TS to permafrost degradation in response to climate change. Processes that presently increase TS may shift to moderate TS (e.g. greater groundwater contributions to streams as permafrost degrades; Walvoord et al., 2012) and vice versa (e.g., less ground ice forming annually under warmer conditions). It is important to note a key assumption in this analysis was the stationarity of environmental conditions on the surface and in the subsurface, and we did not consider long-term or annual variability in environmental conditions such as snow depth and snow-covered area, permafrost disposition and extent, or active layer thickness. The dynamic subsurface conditions related to permafrost could not be accounted for with the available data mapping permafrost coverage and ALT across the study domain, despite knowledge that permafrost extent and annual active layer thaw is dynamic and responsive to long-term climate warming and the meteorological conditions of the current and preceding year. If permafrost disposition does influence stream thermal sensitivity, as the results of this study suggest, the signal in response to this subsurface non-stationarity would be present in the observed stream temperatures. As permafrost-influenced processes do not act in isolation from other processes known to influence TS and which are also expected to continue changing in the coming decades (e.g., precipitation timing and phase, riparian shrubification, air temperature), resolving the complexities of their interactions in response to climate change is not trivial. There is substantial uncertainty in how northern stream thermal sensitivity, as an integrated catchment signal, will respond to climate change, and further research into the individual controls on thermal sensitivity, their responses to climate change, and the presence of non-stationarity influencing interannual variability in thermal sensitivity is needed.
The range and variability of summer stream thermal sensitivity observed in Yukon was comparable to values reported in temperate regions, although with lower maximum values across catchments of all permafrost classifications. The influence of cold northern region hydrology on thermal sensitivity is apparent, with a median thermal sensitivity of 0.56 °C °C−1 across all catchments. The baseline temperatures (i.e., regression intercepts) were moderated by greater permafrost extent, although catchments of all permafrost dispositions had numerous instances of low (<2 °C) baseline temperature.
Thermal sensitivity was suppressed by greater catchment slope and was positively related to catchment area or stream order, surface water storage as represented by land cover classification, and streamflow flashiness. These results suggest that catchment physiography, influencing in-stream residence time and stream network heat accumulation, has a consistent influence on stream thermal sensitivity in both northern and temperate environments. Surface water bodies connected to stream networks may supply relatively warm water through the summer season, bolstering thermal sensitivity and baseline temperature. Groundwater contributions represented by a baseflow index is commonly identified in temperate regions as a moderating control on thermal sensitivity, but flashy streamflow regimes are characteristic of continuous permafrost environments and indicate limited deep groundwater discharge to streams.
Permafrost appears to have offsetting influences on thermal sensitivity. The limiting influence of greater permafrost extent on baseflow contributions increases thermal sensitivity, but there is a simultaneous moderating influence of permafrost, possibly attributable to melting ground ice, lateral advection of hillslope runoff cooled by the frost table interface, in-stream aufeis, or heat loss to streambeds underlain by permafrost through hyporheic exchange processes and/or heat conduction. As permafrost degrades in response to climate change, we expect a dynamic response in the thermal regimes and thermal sensitivity of streams in environments with continuous and discontinuous permafrost. The net effect of these changes is uncertain due to the complex interactions between permafrost disposition, seasonal snow cover, precipitation timing, and subsurface hydrology. However, identifying current thermal sensitivities across catchment scales and permafrost conditions may help provide insight into the thermal evolution of streams in northern regions.
The data used in this study are available in a Zenodo repository (https://doi.org/10.5281/zenodo.11668943; Szeitz, 2024).
The supplement related to this article is available online at https://doi.org/10.5194/hess-29-1083-2025-supplement.
AJS contributed to the research design; compiled the data set; and conducted the data processing, analysis, and manuscript preparation. SKC contributed to the research design and manuscript preparation.
The contact author has declared that neither of the authors has any competing interests.
Publisher's note: Copernicus Publications remains neutral with regard to jurisdictional claims made in the text, published maps, institutional affiliations, or any other geographical representation in this paper. While Copernicus Publications makes every effort to include appropriate place names, the final responsibility lies with the authors.
This article is part of the special issue “Northern hydrology in transition – impacts of a changing cryosphere on water resources, ecosystems, and humans (TC/HESS inter-journal SI)”. It is not associated with a conference.
We would like to thank the Yukon Territorial Government – Water Resources Branch, and the Water Survey of Canada for providing streamflow and stream temperature data. We thank two anonymous reviewers for their comments which helped improve the clarity of the paper. The reviewer comments regarding non-stationarity in particular were helpful and are appreciated.
This research has been supported by a Natural Sciences and Engineering Research Council (NSERC) Discovery Grant (grant no. RGPIN-2020-06722) to Sean K. Carey and an NSERC CGS-D awarded to Andras J. Szeitz.
This paper was edited by Christa Kelleher and reviewed by two anonymous referees.
Anderson, S. P.: Glaciers show direct linkage between erosion rate and chemical weathering fluxes, Geomorphology, 67, 147–157, https://doi.org/10.1016/j.geomorph.2004.07.010, 2005.
Baker, D. B., Richards, R. P., Loftus, T. T., and Kramer, J. W.: A new flashiness index: Characteristics and applications to midwestern rivers and streams, J. Am. Water Resour. As., 40, 503–522, https://doi.org/10.1111/j.1752-1688.2004.tb01046.x, 2004.
Bjerklie, D. M. and LaPerriere, J. D.: Gold-mining effects on stream hydrology and water quality, Circle Quadrangle, Alaska, J. Am. Water Resour. As., 21, 235–242, https://doi.org/10.1111/j.1752-1688.1985.tb00133.x, 1985.
Bolduc, C., Lamoureux, S. F., and Franssen, J.: Thermal and isotopic evidence for surface and subsurface water contributions to baseflow in a high Arctic river, Hydrol. Process., 32, 602–616, https://doi.org/10.1002/hyp.11427, 2018.
Boudreault, J., Bergeron, N. E., St-Hilaire, A., and Chebana, F.: Stream temperature modeling using functional regression models, J. Am. Water Resour. As., 55, 1382–1400, https://doi.org/10.1111/1752-1688.12778, 2019.
Brown, G. W.: Predicting temperatures of small streams, Water Resour. Res., 5, 68–75, https://doi.org/10.1029/WR005i001p00068, 1969.
Brown, J. H., Gillooly, J. F., Allen, A. P., Savage, V. M., and West, G. B.: Toward a metabolic theory of ecology, Ecology, 85, 1771–1789, https://doi.org/10.1890/03-9000, 2004.
Brutsaert, W.: Hydrology: An Introduction, Cambridge University Press, https://doi.org/10.1017/CBO9780511808470, 2005.
Bush, E. and Lemmen, D. S. (Eds.): Canada's changing climate report, Government of Canada, Ottawa, ON, ISBN 978-0-660-30222-5, 2019.
Caissie, D.: The thermal regime of rivers: A review, Freshwater Biol., 51, 1389–1406, https://doi.org/10.1111/j.1365-2427.2006.01597.x, 2006.
Canada1Water: Canada1Water (Version 1) [Stream Order data set], https://doi.org/10.4095/331515, 2023.
Chiasson-Poirier, G., Franssen, J., Lafrenière, M. J., Fortier, D., and Lamoureux, S. F.: Seasonal evolution of active layer thaw depth and hillslope-stream connectivity in a permafrost watershed, Water Resour. Res., 56, e2019WR025828, https://doi.org/10.1029/2019WR025828, 2020.
Constantz, J.: Interaction between stream temperature, streamflow, and groundwater exchanges in alpine streams, Water Resour. Res., 34, 1609–1615, https://doi.org/10.1029/98WR00998, 1998.
Crisp, D. T. and Howson, G.: Effect of air temperature upon mean water temperature in streams in the north Pennines and English Lake District, Freshwater Biol., 12, 359–367, https://doi.org/10.1111/j.1365-2427.1982.tb00629.x, 1982.
DeBeer, C. M., Wheater, H. S., Pomeroy, J. W., Barr, A. G., Baltzer, J. L., Johnstone, J. F., Turetsky, M. R., Stewart, R. E., Hayashi, M., van der Kamp, G., Marshall, S., Campbell, E., Marsh, P., Carey, S. K., Quinton, W. L., Li, Y., Razavi, S., Berg, A., McDonnell, J. J., Spence, C., Helgason, W. D., Ireson, A. M., Black, T. A., Elshamy, M., Yassin, F., Davison, B., Howard, A., Thériault, J. M., Shook, K., Demuth, M. N., and Pietroniro, A.: Summary and synthesis of Changing Cold Regions Network (CCRN) research in the interior of western Canada – Part 2: Future change in cryosphere, vegetation, and hydrology, Hydrol. Earth Syst. Sci., 25, 1849–1882, https://doi.org/10.5194/hess-25-1849-2021, 2021.
Docherty, C. L., Dugdale, S. J., Milner, A. M., Abermann, J., Lund, M., and Hannah, D. M.: Arctic river temperature dynamics in a changing climate, River Res. Appl., 35, 1212–1227, https://doi.org/10.1002/rra.3537, 2019.
Donato, M. M.: A statistical model for estimating stream temperatures in the Salmon and Clearwater River basins, central Idaho, U. S. Geological Survey, Reston, VA, https://doi.org/10.3133/wri024195, 2002.
Ducharne, A.: Importance of stream temperature to climate change impact on water quality, Hydrol. Earth Syst. Sci., 12, 797–810, https://doi.org/10.5194/hess-12-797-2008, 2008.
Dugdale, S. J., Hannah, D. M., and Malcolm, I. A.: River temperature modelling: A review of process-based approaches and future directions, Earth-Sci. Rev., 175, 97–113, https://doi.org/10.1016/j.earscirev.2017.10.009, 2017.
Dugdale, S. J., Malcolm, I. A., Kantola, K., and Hannah, D. M.: Stream temperature under contrasting riparian forest cover: Understanding thermal dynamics and heat exchange processes, Sci. Total Environ., 610–611, 1375–1389, https://doi.org/10.1016/j.scitotenv.2017.08.198, 2018.
Ebersole, J., Liss, W., and Frissell, C.: Relationship between stream temperature, thermal refugia and rainbow trout Oncorhynchus mykiss abundance in arid-land streams in the northwestern United States, Ecol. Freshw. Fish, 10, 1–10, https://doi.org/10.1034/j.1600-0633.2001.100101.x, 2001.
Fabris, L., Rolick, R. L., Kurylyk, B. L., and Carey, S. K.: Characterization of contrasting flow and thermal regimes in two adjacent subarctic alpine headwaters in Northwest Canada, Hydrol. Process., 34, 3252–3270, https://doi.org/10.1002/hyp.13786, 2020.
Gatien, P., Arsenault, R., Martel, J.-L., and St-Hilaire, A.: Using the ERA5 and ERA5-Land reanalysis datasets for river water temperature modelling in a data-scarce region, Can. Water Resour. J., 48, 93–110, https://doi.org/10.1080/07011784.2022.2113917, 2023.
Ge, S., McKenzie, J., Voss, C., and Wu, Q.: Exchange of groundwater and surface-water mediated by permafrost response to seasonal and long term air temperature variation, Geophys. Res. Lett., 38, L14402, https://doi.org/10.1029/2011GL047911, 2011.
Grünberg, I., Wilcox, E. J., Zwieback, S., Marsh, P., and Boike, J.: Linking tundra vegetation, snow, soil temperature, and permafrost, Biogeosciences, 17, 4261–4279, https://doi.org/10.5194/bg-17-4261-2020, 2020.
Gustard, A., Bullock, A., and Dixon, J. M.: Low flow estimation in the United Kingdom, Institute of Hydrology, Oxfordshire, UK, ISBN 0-948540-45-1, 1992.
Hare, D. K., Helton, A. M., Johnson, Z. C., Lane, J. W., and Briggs, M. A.: Continental-scale analysis of shallow and deep groundwater contributions to streams, Nat. Commun., 12, 1450, https://doi.org/10.1038/s41467-021-21651-0, 2021.
Hijmans, R. J.: terra: Spatial Data Analysis, R package version 1.7-55, https://CRAN.R-project.org/package=terra (last access: 19 September 2023), 2023.
Hilderbrand, R. H., Kashiwagi, M. T., and Prochaska, A. P.: Regional and local scale modelling of stream temperatures and spatio-temporal variation in thermal sensitivities, Environ. Manage., 54, 14–22, https://doi.org/10.1007/s00267-014-0272-4, 2014.
Hinzman, A. M., Sjöberg, Y., Lyon, S. W., Ploum, S. W., and van der Velde, Y.: Increasing non-linearity of the storage-discharge relationship in sub-Arctic catchments, Hydrol. Process., 34, 3894–3909, https://doi.org/10.1002/hyp.13860, 2020.
Isaak, D. J., Luce, C. H., Rieman, B. E., Nagel, D. E., Peterson, E. E., Horan, D. L., Parkes, S., and Chandler, G. L.: Effects of climate change and wildfire on stream temperatures and salmonid thermal habitat in a mountain river network, Ecol. Appl., 20, 1350–1371, https://doi.org/10.1890/09-0822.1, 2010.
Isaak, D. J., Wollrab, S., Horan, D., and Chandler, G.: Climate change effects on stream and river temperatures across the northwest U. S. From 1980–2009 and implications for salmonid fishes, Climatic Change, 113, 499–524, https://doi.org/10.1007/s10584-011-0326-z, 2012.
Johnson, S. L.: Factors influencing stream temperatures in small streams: Substrate effects and a shading experiment, Can. J. Fish Aquat. Sci., 61, 913–923, https://doi.org/10.1139/f04-040, 2004.
Johnson, Z. C., Johnson, B. G., Briggs, M. A., Devine, W. D., Snyder, C. D., Hitt, N. P., Hare, D. K., and Minkova, T. V.: Paired air-water annual temperature patterns reveal hydrogeological controls on stream thermal regimes at watershed to continental scales, J. Hydrol., 587, 124929, https://doi.org/10.1016/j.jhydrol.2020.124929, 2020.
Jorgenson, M. T., Racine, C. H., Walters, J. C., and Osterkamp, T. E.: Permafrost degradation and ecological changes associated with a warming climate in Central Alaska, Climatic Change, 48, 551–579, https://doi.org/10.1023/A:1005667424292, 2001.
Kelleher, C., Wagener, T., Gooseff, M., McGlynn, B., McGuire, K., and Marshall, L.: Investigating controls on the thermal sensitivity of Pennsylvania streams, Hydrol. Process., 26, 771–785, https://doi.org/10.1002/hyp.8186, 2012.
King, T. V. and Neilson, B. T.: Quantifying reach-average effects of hyporheic exchange on Arctic river temperatures in an area of continuous permafrost, Water Resour. Res., 55, 1951–1971, https://doi.org/10.1029/2018WR023463, 2019.
King, T. V., Neilson, B. T., Overbeck, L. D., and Kane, D. L.: Water temperature controls in low arctic rivers, Water Resour. Res., 52, 4358–4376, https://doi.org/10.1002/2015WR017965, 2016.
Kunkel, K. E.: Simple procedures for extrapolation of humidity variables in the mountainous western United States, J. Climate, 2, 656–669, https://doi.org/10.1175/1520-0442(1989)002<0656:SPFEOH>2.0.CO;2, 1989.
Kurylyk, B. and Walvoord, M.: Permafrost hydrogeology, in: Arctic Hydrology, Permafrost and Ecosystems, edited by: Yang, D. and Kane, D. L., Springer, 493–523, https://doi.org/10.1007/978-3-030-50930-9, 2021.
Kurylyk, B. L., Hayashi, M., Quinton, W. L., McKenzie, J. M., and Voss, C. I.: Influence of vertical and lateral heat transfer on permafrost thaw, peatland landscape transition, and groundwater flow, Water Resour. Res., 52, 1286–1305, https://doi.org/10.1002/2015WR018057, 2016.
Laaha, G. and Koffler, D.: lfstat: Calculation of Low Flow Statistics for Daily Stream Flow Data, R package version 0.9.12, https://CRAN.R-project.org/packages=lfstat (last access: 31 October 2023), 2022.
Laanaya, F., St-Hilaire, A., and Gloaguen, A.: Water temperature modelling: Comparison between the generalized additive model, logistic, residuals regression and linear regression models, Hydrolog. Sci. J., 62, 1078–1093, https://doi.org/10.1080/02626667.2016.1246799, 2017.
Leach, J. A. and Moore, R. D.: Above-stream microclimate and stream surface energy exchanges in a wildfire-disturbed riparian zone, Hydrol. Process., 24, 2369–2381, https://doi.org/10.1002/hyp.7639, 2010.
Leach, J. A. and Moore, R. D.: Observations and modeling of hillslope throughflow temperatures in a coastal forested catchment, Water Resour. Res., 51, 3770–3795, https://doi.org/10.1002/2014WR016763, 2015.
Leach, J. A. and Moore, R. D.: Empirical stream thermal sensitivities may underestimate stream temperature response to climate warming, Water Resour. Res., 55, 5453–5467, https://doi.org/10.1029/2018WR024236, 2019.
Lisi, P. J. and Schindler, D. E.: Wind-driven upwelling in lakes destabilizes thermal regimes of downstream rivers, Limnol. Oceanogr., 60, 169–180, https://doi.org/10.1002/lno.10010, 2015.
Lisi, P. J., Schindler, D. E., Cline, T. J., Scheuerell, M. D., and Walsh, P. B.: Watershed geomorphology and snowmelt control stream thermal sensitivity to air temperature, Geophys. Res. Lett., 42, 3380–3388, https://doi.org/10.1002/2015GL064083, 2015.
Lowney, C. L.: Stream temperature variation in regulated rivers: Evidence for a spatial pattern in daily minimum and maximum magnitudes, Water Resour. Res., 36, 2947–2955, https://doi.org/10.1029/2000WR900142, 2000.
Luce, C., Staab, B., Kramer, M., Wenger, S., Isaak, D., and McConnell, C.: Sensitivity of summer stream temperatures to climate variability in the Pacific Northwest, Water Resour. Res., 50, 3428–3443, https://doi.org/10.1002/2013WR014329, 2014.
MacDonald, R. J., Boon, S., Byrne, J. M., and Silins, U.: A comparison of surface and subsurface controls on summer temperature in a headwater stream, Hydrol. Process., 28, 2338–2347, https://doi.org/10.1002/hyp.9756, 2014.
McDowell, R. W., Elkin, K. R., and Kleinman, P. J.: Temperature and nitrogen effects on phosphorus uptake by agricultural stream-bed sediments, J. Environ. Qual., 46, 295–301, https://doi.org/10.2134/jeq2016.09.0352, 2017.
McGill, L. M., Steel, E. A., and Fullerton, A. H.: Empirical stream thermal sensitivity cluster on the landscape according to geology and climate, Hydrol. Earth Syst. Sci., 28, 1351–1371, https://doi.org/10.5194/hess-28-1351-2024, 2024.
McNamara, J. P., Kane, D. L., Hobbie, J. E., and Kling, G. W.: Hydrologic and biogeochemical controls on the spatial and temporal patterns of nitrogen and phosphorus in the Kuparuk River, arctic Alaska, Hydrol. Process., 22, 3294–3309, https://doi.org/10.1002/hyp.6920, 2008.
Mellina, E., Moore, R. D., Hinch, S. G., Macdonald, J. S., and Pearson, G.: Stream temperature responses to clearcut logging in British Columbia: the moderating influences of groundwater and headwater lakes, Can. J. Fish Aquat. Sci., 59, 1886–1900, https://doi.org/10.1139/f02-158, 2002.
Mihalevich, B. A., Neilson, B. T., and Buahin, C. A.: Evaluation of the ERA5-Land reanalysis data set for process-based river temperature modeling over data sparse and topographically complex regions, Water Resour. Res., 58, e2021WR031294, https://doi.org/10.1029/2021WR031294, 2022.
Mohseni, O., Stefan, H. G., and Erickson, T. R.: A nonlinear regression model for weekly stream temperatures, Water Resour. Res., 34, 2685–2692, https://doi.org/10.1029/98WR01877, 1998.
Moore, R. D., Spittlehouse, D. L., and Story, A.: Riparian microclimate and stream temperature response to forest harvesting: A review, J. Am. Water Resour. As., 41, 813–834, https://doi.org/10.1111/j.1752-1688.2005.tb03772.x, 2005a.
Moore, R. D., Sutherland, P., Gomi, T., and Dhakal, A.: Thermal regime of a headwater stream within a clear-cut, coastal British Columbia, Canada, Hydrol. Process., 19, 2591–2608, https://doi.org/10.1002/hyp.5733, 2005b.
Muñoz-Sabater, J., Dutra, E., Agustí-Panareda, A., Albergel, C., Arduini, G., Balsamo, G., Boussetta, S., Choulga, M., Harrigan, S., Hersbach, H., Martens, B., Miralles, D. G., Piles, M., Rodríguez-Fernández, N. J., Zsoter, E., Buontempo, C., and Thépaut, J.-N.: ERA5-Land: a state-of-the-art global reanalysis dataset for land applications, Earth Syst. Sci. Data, 13, 4349–4383, https://doi.org/10.5194/essd-13-4349-2021, 2021.
Obu, J., Westermann, S., Kääb, A., and Bartsch, A.: Ground Temperature Map, 2000–2016, Northern Hemisphere Permafrost, PANGAEA [data set], https://doi.org/10.1594/PANGAEA.888600, 2018.
Parkinson, E., Lea, E., Nelitz, M., Knudson, J., and Moore, R.: Identifying temperature thresholds associated with fish community changes in British Columbia, Canada, to support identification of temperature sensitive streams, River Res. Appl., 32, 330–347, https://doi.org/10.1002/rra.2867, 2016.
Pilgrim, J. M., Fang, X., and Stefan, H. G.: Stream temperature correlations with air temperatures in Minnesota: implications for climate warming, J. Am. Water Resour. As., 34, 1109–1121, https://doi.org/10.1111/j.1752-1688.1998.tb04158.x, 1998.
Pomeroy, J. and Gray, D. M.: Snowcover: Accumulation, relocation, and management, National Hydrology Research Institute, Environment Canada, Saskatoon, SK, ISBN 0-660-15816-7, 1995.
Porter, C., Howat, I., Noh, M.-J., Husby, E., Khuvis, S., Danish, E., Tomko, K., Gardiner, J., Negrete, A., Yadav, B., Klassen, J., Kelleher, C., Cloutier, M., Bakker, J., Enos, J., Arnold, G., Bauer, G., and Morin, P.: ArcticDEM – Mosaics, Version 4.1 (V1), Harvard Dataverse [data set], https://doi.org/10.7910/DVN/3VDC4W, 2023.
Ran, Y., Li, X., Cheng, G., Che, J., Juha, A., Olli, K., Jan, H., Miska, L., Jin, H., Jaroslav, O., Masahiro, H., Yu, Q., and Chang, X.: High-resolution datasets of permafrost thermal state and hydrothermal zonation in the Northern Hemisphere, National Tibetan Plateau / Third Pole Environment Data Center [data set], https://doi.org/10.11888/Geocry.tpdc.271190, 2021.
R Core Team: R: A language and environment for statistical computing, R Foundation for Statistical Computing, Vienna, Austria, https://www.R-project.org/ (last access: 17 January 2024), 2022.
Rutherford, J. C., Blackett, S., Blackett, C., Saito, L., and Davies-Colley, R. J.: Predicting the effects of shade on water temperature in small streams, New Zeal. J. Mar. Fresh., 31, 707–721, https://doi.org/10.1080/00288330.1997.9516801, 1997.
Segura, C., Caldwell, P., Sun, G., McNulty, S., and Zhang, Y.: A model to predict stream water temperature across the conterminous USA, Hydrol. Process., 29, 2178–2195, https://doi.org/10.1002/hyp.10357, 2015.
Sergeant, F., Therrien, R., Anctil, F., and Gatel, L.: Simulating the recession dynamics of Arctic catchments in the context of a thawing permafrost, J. Hydrol., 623, 129847, https://doi.org/10.1016/j.jhydrol.2023.129847, 2023.
Shur, Y. L. and Jorgenson, M. T.: Patterns of permafrost formation and degradation in relation to climate and ecosystems, Permafrost Periglac., 18, 7–19, https://doi.org/10.1002/ppp.582, 2007.
Sjöberg, Y., Jan, A., Painter, S. L., Coon, E. T., Carey, M. P., O'Donnell, J. A., and Koch, J. C.: Permafrost promotes shallow groundwater flow and warmer headwater streams, Water Resour. Res., 57, e2020WR027463, https://doi.org/10.1029/2020WR027463, 2021.
Smith, C. A. S., Meikle, J. C., and Roots, C. F. (Eds.): Ecoregions of the Yukon Territory: biophysical properties of Yukon landscapes, Agriculture and Agri-Food Canada PARC Technical Bulletin No. 04-01, Summerland, British Columbia, Canada, 313 pp., ISBN 0-660-18828-7, 2004.
Stefan, H. G. and Preud'homme, E. B.: Stream temperature estimation from air temperatures, J. Am. Water Resour. As., 29, 27–45, https://doi.org/10.1111/j.1752-1688.1993.tb01502.x, 1993.
Story, A., Moore, R. D., and Macdonald, J. S.: Stream temperatures in two shaded reaches below cutblocks and logging roads: Downstream cooling linked to subsurface hydrology, Can. J. Forest Res., 33, 1383–1396, https://doi.org/10.1139/x03-087, 2003.
Szeitz, A. J.: The influence of permafrost and other environmental controls on stream thermal sensitivity across Yukon, Canada – data set (Version 1.0), Zenodo [data set], https://doi.org/10.5281/zenodo.11668943, 2024.
Tallaksen, L. M. and van Lanen, H. A. J.: Hydrological Drought: Processes and Estimation Methods for Streamflow and Groundwater, Elsevier, Amsterdam, https://doi.org/10.1016/C2017-0-03464-X, 2004.
Turcotte, B., Dubnick, A., McKillop, R., and Ensom, T.: Icing and aufeis in cold regions i: The origin of overflow, Can. J. Civil Eng., 51, 93–108, https://doi.org/10.1139/cjce-2023-0057, 2024.
van Vliet, M. T. H., Ludwig, F., Zwolsman, J. J. G., Weedon, G. P., and Kabat, P.: Global river temperatures and sensitivity to atmospheric warming and changes in river flow, Water Resour. Res., 47, W02544, https://doi.org/10.1029/2010WR009198, 2011.
Vincent, L., Zhang, X., Brown, R., Feng, Y., Mekis, E., Milewska, E., Wan, H., and Wang, X.: Observed trends in Canada's climate and influence of low-frequency variability modes, J. Climate, 28, 4545–4560, https://doi.org/10.1175/JCLI-D-14-00697.1, 2015.
Walvoord, M. A., Voss, C. I., and Wellman, T. P.: Influence of permafrost distribution on groundwater flow in the context of climate-driven permafrost thaw: example from Yukon Flats Basin, Alaska, United States, Water Resour. Res., 48, W07524, https://doi.org/10.1029/2011WR011595, 2012.
Water Survey of Canada: National Hydro Network Basin Polygons, Environment and Climate Change Canada, Government of Canada Open Data Repository [data set], https://open.canada.ca/data/en/dataset/0c121878-ac23-46f5-95df-eb9960753375 (last access: 3 October 2023), 2016.
Webb, B. W. and Zhang, Y.: Water temperatures and heat budgets in Dorset chalk water courses, Hydrol. Process., 13, 309–321, https://doi.org/10.1002/(SICI)1099-1085(19990228)13:3<309::AID-HYP740>3.0.CO;2-7, 1999.
Webb, B. W., Clack, P. D., and Walling, D. E.: Water–air temperature relationships in a Devon river system and the role of flow, Hydrol. Process., 17, 3069–3084, https://doi.org/10.1002/hyp.1280, 2003.
Winfree, M. M., Hood, E., Stuefer, S. L., Schindler, D. E., Cline, T. J., Arp, C. D., and Pyare, S.: Landcover and geomorphology influence streamwater temperature sensitivity in salmon bearing watersheds in Southeast Alaska, Environ. Res. Lett., 13, 064034, https://doi.org/10.1088/1748-9326/aac4c0, 2018.
Wissler, A. D., Segura, C., and Bladon, K. D.: Comparing headwater stream thermal sensitivity across two distinct regions in Northern California, Hydrol. Process., 36, e14517, https://doi.org/10.1002/hyp.14517, 2022.
Wondzell, S. M., Diabat, M., and Haggerty, R.: What matters most: Are future stream temperatures more sensitive to changing air temperatures, discharge, or riparian vegetation?, J. Am. Water Resour. As., 55, 116–132, https://doi.org/10.1111/1752-1688.12707, 2019.
Woo, M.-K.: Permafrost Hydrology, Springer, Berlin, https://doi.org/10.1007/978-3-642-23462-0, 2012.
Wu, Q., Brown, A.: whitebox: `WhiteboxTools' R Frontend, R package version 2.2.0, https://CRAN.R-project.org/package=whitebox (last access: 19 September 2023), 2022.
Zanaga, D., Van De Kerchove, R., De Keersmaecker, W., Souverijns, N., Brockmann, C., Quast, R., Wevers, J., Grosu, A., Paccini, A., Vergnaud, S., Cartus, O., Santoro, M., Fritz, S., Georgieva, I., Lesiv, M., Carter, S., Herold, M., Li, L., Tsendbazar, N.-E., Ramoino, F., and Arino, O.: ESA WorldCover 10 m 2020 v100 (v100), Zenodo [data set], https://doi.org/10.5281/zenodo.5571936, 2021.
Zipper, S. C., Lamontagne-Hallé, P., McKenzie, J. M., and Rocha, A. V.: Groundwater controls on postfire permafrost thaw: Water and energy balance effects, J. Geophys. Res.-Earth, 123, 2677–2694, https://doi.org/10.1029/2018JF004611, 2018.