the Creative Commons Attribution 4.0 License.
the Creative Commons Attribution 4.0 License.
 | 27 Feb 2025
Runoff component quantification and future streamflow projection in a large mountainous basin based on a multidata-constrained cryospheric–hydrological model
Mengjiao Zhang
The Yarlung Tsangpo River (YTR) is one of several major rivers originating on the Tibetan Plateau (TP). Large uncertainties exist in studies related to streamflow variations in this basin, and such investigations are difficult due to the widely distributed snowpack, glaciers, and permafrost, as well as their complex effects on hydrological processes. In this study, we conducted a systematic analysis of the streamflow variations and runoff components in the YTR basin, using a physically based hydrological model validated by streamflow and multiple datasets related to cryospheric processes. The main findings of this work are as follows:
-
The contributions of both snowmelt and glacier melt runoff to streamflow are limited (about 5 %–6 % for the whole basin), and these contributions might have been overestimated in previous studies.
-
Annual runoff will evidently increase in the future. The relative change in annual streamflow could exceed 90 mm (∼38 %) at the outlet station in the far-future period, compared with the historical period, under the high-emission scenario.
-
Adopting more observational data to calibrate the hydrological model played a critical role in reducing the uncertainty in the hydrological simulation. The biases in the snow and glacier simulation for unconstrained data led to a marked overestimation of the contributions of snowmelt and glacier melt runoff to streamflow and, further, introduced an underestimation of the increasing trends of annual runoff by approximately 5 %–10 % in the future projection.
These results provide a relatively reliable reference for the streamflow change and runoff components in both the historical and future periods in the YTR basin, as more datasets were used to constrain the model uncertainty compared with previous studies.
- Article
(4648 KB) - Full-text XML
-
Supplement
(1382 KB) - BibTeX
- EndNote


Changes in streamflow and sediment in cold mountainous regions around the world have drawn great interest from researchers (Slosson et al., 2021; Zhang et al., 2023). The Tibetan Plateau (TP), as a typical cold mountainous region, widely known as the “Asian water tower”, is the source region for many large rivers in Asia and plays a pivotal role in providing invaluable fresh water to downstream countries. The hydrological changes in the TP region have drawn a large amount of attention for a long time, and there have been numerous relevant studies on its hydrological process (Li et al., 2022; Zhang et al., 2022). However, further research is necessary to fully understand the streamflow conditions on the TP, and there is still a lot of uncertainty with respect to variation in its runoff.
On the one hand, unique environmental conditions increase the complexity of hydrological processes in the TP region. Vast areas of snow, glaciers, permafrost, and seasonally frozen ground are distributed over the TP throughout the year, and all of these cryospheric components can contribute to streamflow in various ways (Lan et al., 2014). Understanding their impact on hydrological processes is crucial for the confident prediction of runoff change under climate warming. However, this is a difficult task, as the complex hydrological and cryospheric processes have typically been insufficiently represented by hydrological models (Nan et al., 2022; Wang et al., 2024). On the other hand, marked atmospheric warming has changed the water balance of the TP and altered water resources in downstream countries (Yao et al., 2022). Remarkably, the TP is one of the most significant regions responding to climate change, and the effects of climate change on water availability differ substantially among basins (Immerzeel et al., 2010). Moreover, the region's continuously rising temperature has led to the rapid retreat of perennial snow and glaciers, thereby also impacting runoff and regional water security (Chen et al., 2017).
The Yarlung Tsangpo River (YTR), also referred to as the Brahmaputra after it flows into India, is one of several major rivers originating on the TP and the largest river system on the southern TP. As a representative river basin of the TP, the dynamic interactions between the cryosphere, hydrosphere, and atmosphere are prominent in the YTR basin, in which hydrological processes like snow and glacial melting are more vital compared with some other regions, and the hydrological processes are complicated, sensitive to climate changes, and have high uncertainty (Jiang et al., 2022; Xu et al., 2019).
The monitoring of hydrological stations is critical to investigate the changes in streamflow, and this is also the prominent data source for related studies. Observational evidence demonstrates substantial increases in both annual runoff and annual sediment fluxes in the headwaters of the TP across the past 6 decades (Li et al., 2021). However, further research on the composition and future changes in streamflow currently still relies on hydrological models. Distributed hydrological models are an essential tool for work on the hydrological processes of basins; however, the difficulty is that the model parameters are physically insufficient, containing large uncertainty, due to the limited observational data available to calibrate models (Tian et al., 2020). There have already been many studies trying to simulate hydrological processes more realistically, including considering the contributions of snow and glacier (Zhang et al., 2013; Chen et al., 2017), simulating seasonal permafrost (Wang et al., 2023), and developing tracer-aided hydrological models (Nan et al., 2022). Nevertheless, the contribution of the runoff components still has a significant uncertainty among different studies, and a consistent conclusion on this issue has yet to be reached. Specifically, the estimated contribution of glacier melt to streamflow in the YTR basin ranges from 3.5 % (Wang et al., 2021b) to 29 % (Boral and Sen, 2020). However, the reason for such divergence remains unclear, and the influence of the runoff component estimation on future streamflow projection has not been adequately investigated. A reliable reference value for runoff components obtained by a robust modeling method is crucial for water resource management.
In this study, we conducted a systematic analysis of streamflow change in the YTR basin based on observed streamflow data and various datasets related to cryospheric processes. We focused on the streamflow change during the historical period, the contribution of multiple runoff components, and the trend in the future period. We conducted different calibration variants to evaluate the value of different datasets with respect to the model performance and the consequent impacts on the runoff component partitioning and future projection results. We structured the paper into the following sections: Sect. 1 formulates the background of this study; Sect. 2 briefly introduces the YTR basin and the materials and methods used in this work; the main results are presented in Sect. 3; a brief discussion, including a comparison with previous studies, is provided in Sect. 4; and conclusions are given in Sect. 5.
2.1 The Yarlung Tsangpo River
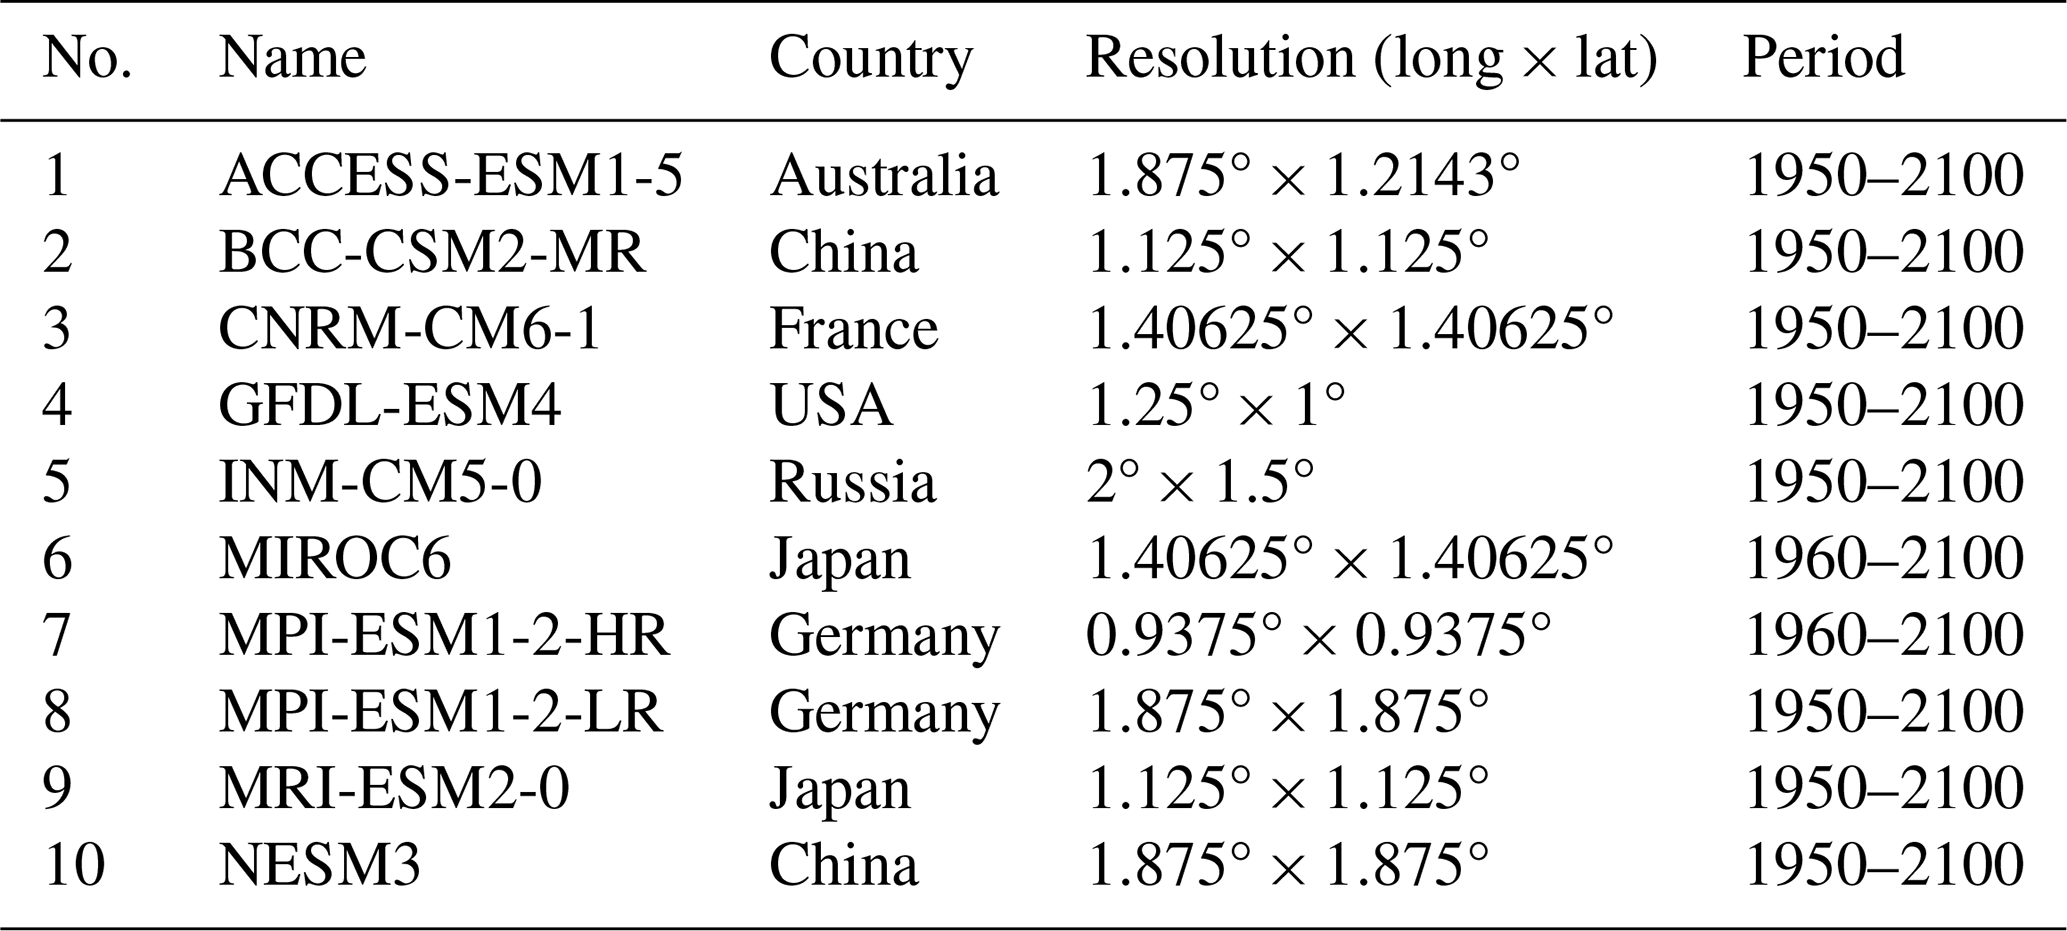
Located north of the Himalaya Mountains on the southern TP, the YTR originates on the Gyima Yangzoin Glacier at the northern foot of the Himalayas and then travels through China, Bhutan, and India before emptying into the Bay of Bengal in the Indian Ocean. The length of the main stream is over 2000 km, and there are four streamflow gauging stations distributed along it, including the Lazi, Nugesha, Yangcun, and Nuxia stations, from upstream to downstream (see the red triangles in Fig. 1; Tian et al., 2020). Nuxia station, near the border of the TP, is selected as the basin outlet of the study area, with a total drainage area of approximately 2×10⁵ km2 (Fig. 1). The average elevation of the YTR basin is about 4850 m a.s.l. (meters above sea level), with an extent of 1890–6840 m.
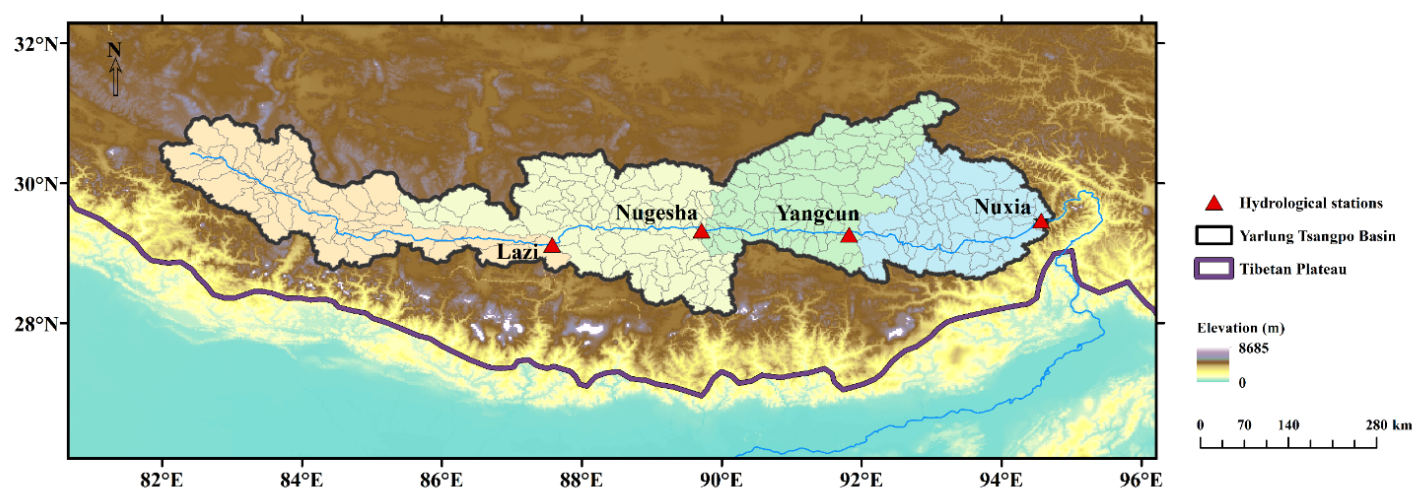
Figure 1The study area and locations of the hydrological stations.
The mean temperature of the basin is relatively low ( over the 1979–2018 period) due to the high altitude, while the precipitation is mostly driven by the South Asian monsoon, with an average annual precipitation of about 475 mm (also over the 1979–2018 period). Large amounts of moisture from the Indian Ocean entering the plateau water cycle through precipitation can significantly supplement its water resources (Zhou et al., 2019), with an obvious wet season from June to September, which accounts for 60 %–70 % of the total annual rainfall (Xu et al., 2019). Moreover, the changes in the precipitation and runoff demonstrate strong consistency in the exoreic TP rivers, including the YTR (Tian et al., 2023). The average snow cover area is 16.8 %, and glaciers cover ∼2.1 % of the basin (He et al., 2021), resulting in a considerable contribution of meltwater to runoff.
2.2 Data
2.2.1 Hydrological station data
Extensive streamflow measurements were collected at four hydrological stations for variation analysis and hydrological model evaluation. The monthly/annual observations during 1960–2020 were obtained for trend testing, and daily data covering the model simulation period were obtained for model calibration. It should be noted that, due to data confidentiality requirements, the measured discharge in Sect. 3 are not presented directly; instead, they have been normalized or the vertical coordinates have been hidden.
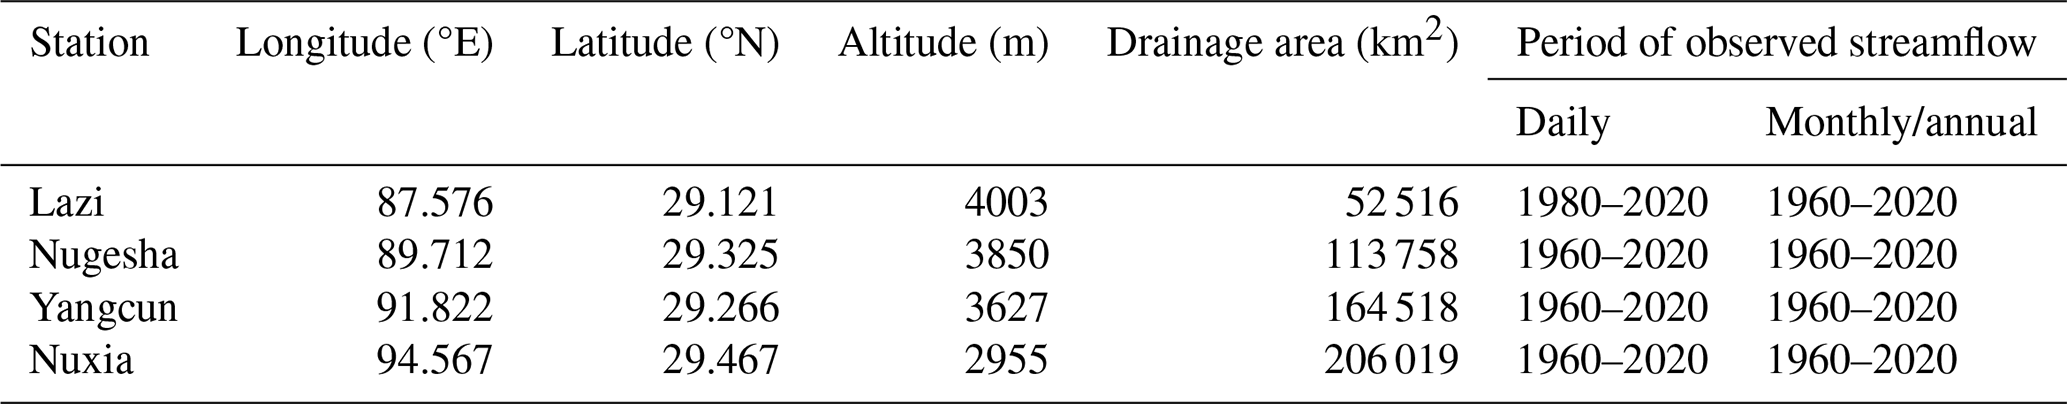
Table 1Basic information on the hydrological stations used in the study area.
2.2.2 Data used to force the model and for calibration
Daily meteorological inputs mainly include precipitation, temperature, and potential evapotranspiration (PET). Precipitation data for the YTR basin were collected from the 0.1° grid of the China Meteorological Forcing Dataset (CMFD; Yang et al., 2019), while temperature and potential evapotranspiration were obtained from the 1.0° ERA5-Land grid reanalysis dataset for the historical calibration and validation periods. Underlying surface inputs consist of topography, glacier, vegetation coverage, and soil parameters. Elevation was derived from a digital elevation model (DEM) with a spatial resolution of 30 m from the Geospatial Data Cloud (https://www.gscloud.cn, last access: 1 January 2023). The second glacier inventory dataset of China (Liu, 2012) was used to denote the glacier coverage. Vegetation coverage information was extracted from the following MODIS satellite products: the MOD15A2H 8 d leaf area index (LAI) dataset (Myneni et al., 2015) and the MOD13A3 monthly normalized difference vegetation index (NDVI) dataset (Didan, 2015). Soil types and properties were collected from a global high-resolution dataset of soil hydraulic and thermal parameters (Dai et al., 2019). For future hydrological simulations, data from 10 CMIP6 (Coupled Model Intercomparison Project Phase 6, https://esgfnode.llnl.gov/search/cmip6/, last access: 1 January 2023) general circulation models (GCMs) were used as climate inputs (see the more detailed introduction in Sect. 2.2.3).
For calibration in the historical periods, in addition to the observed daily streamflow during the 1980–2018 period at the four stations mentioned in Sect. 2.2.1, snow and glacier datasets were adopted to evaluate the hydrological model. The snow depth (SD) dataset for the TP (Yan et al., 2021), the Tibetan Plateau Snow Cover Extent (TPSCE) product (Chen et al., 2018), and glacier mass balance data (Hugonnet et al., 2021a) were used to calibrate the SWE (snow water equivalent), SCA (snow-covered area), and GMB (glacier mass balance), respectively. More details on the abovementioned datasets can be found in Table 2. Here, the SD measurements were transferred to SWE for calibration using the following expression (Chen et al., 2017):
where ρsnow is the snow density, SD is the PMV-based (where PMV denotes passive microwave) snow depth of the snowpack, and ρwater is the density of liquid water. The coefficients were estimated using in situ data.
Table 2Data from global and regional datasets used for hydrological models in this study.
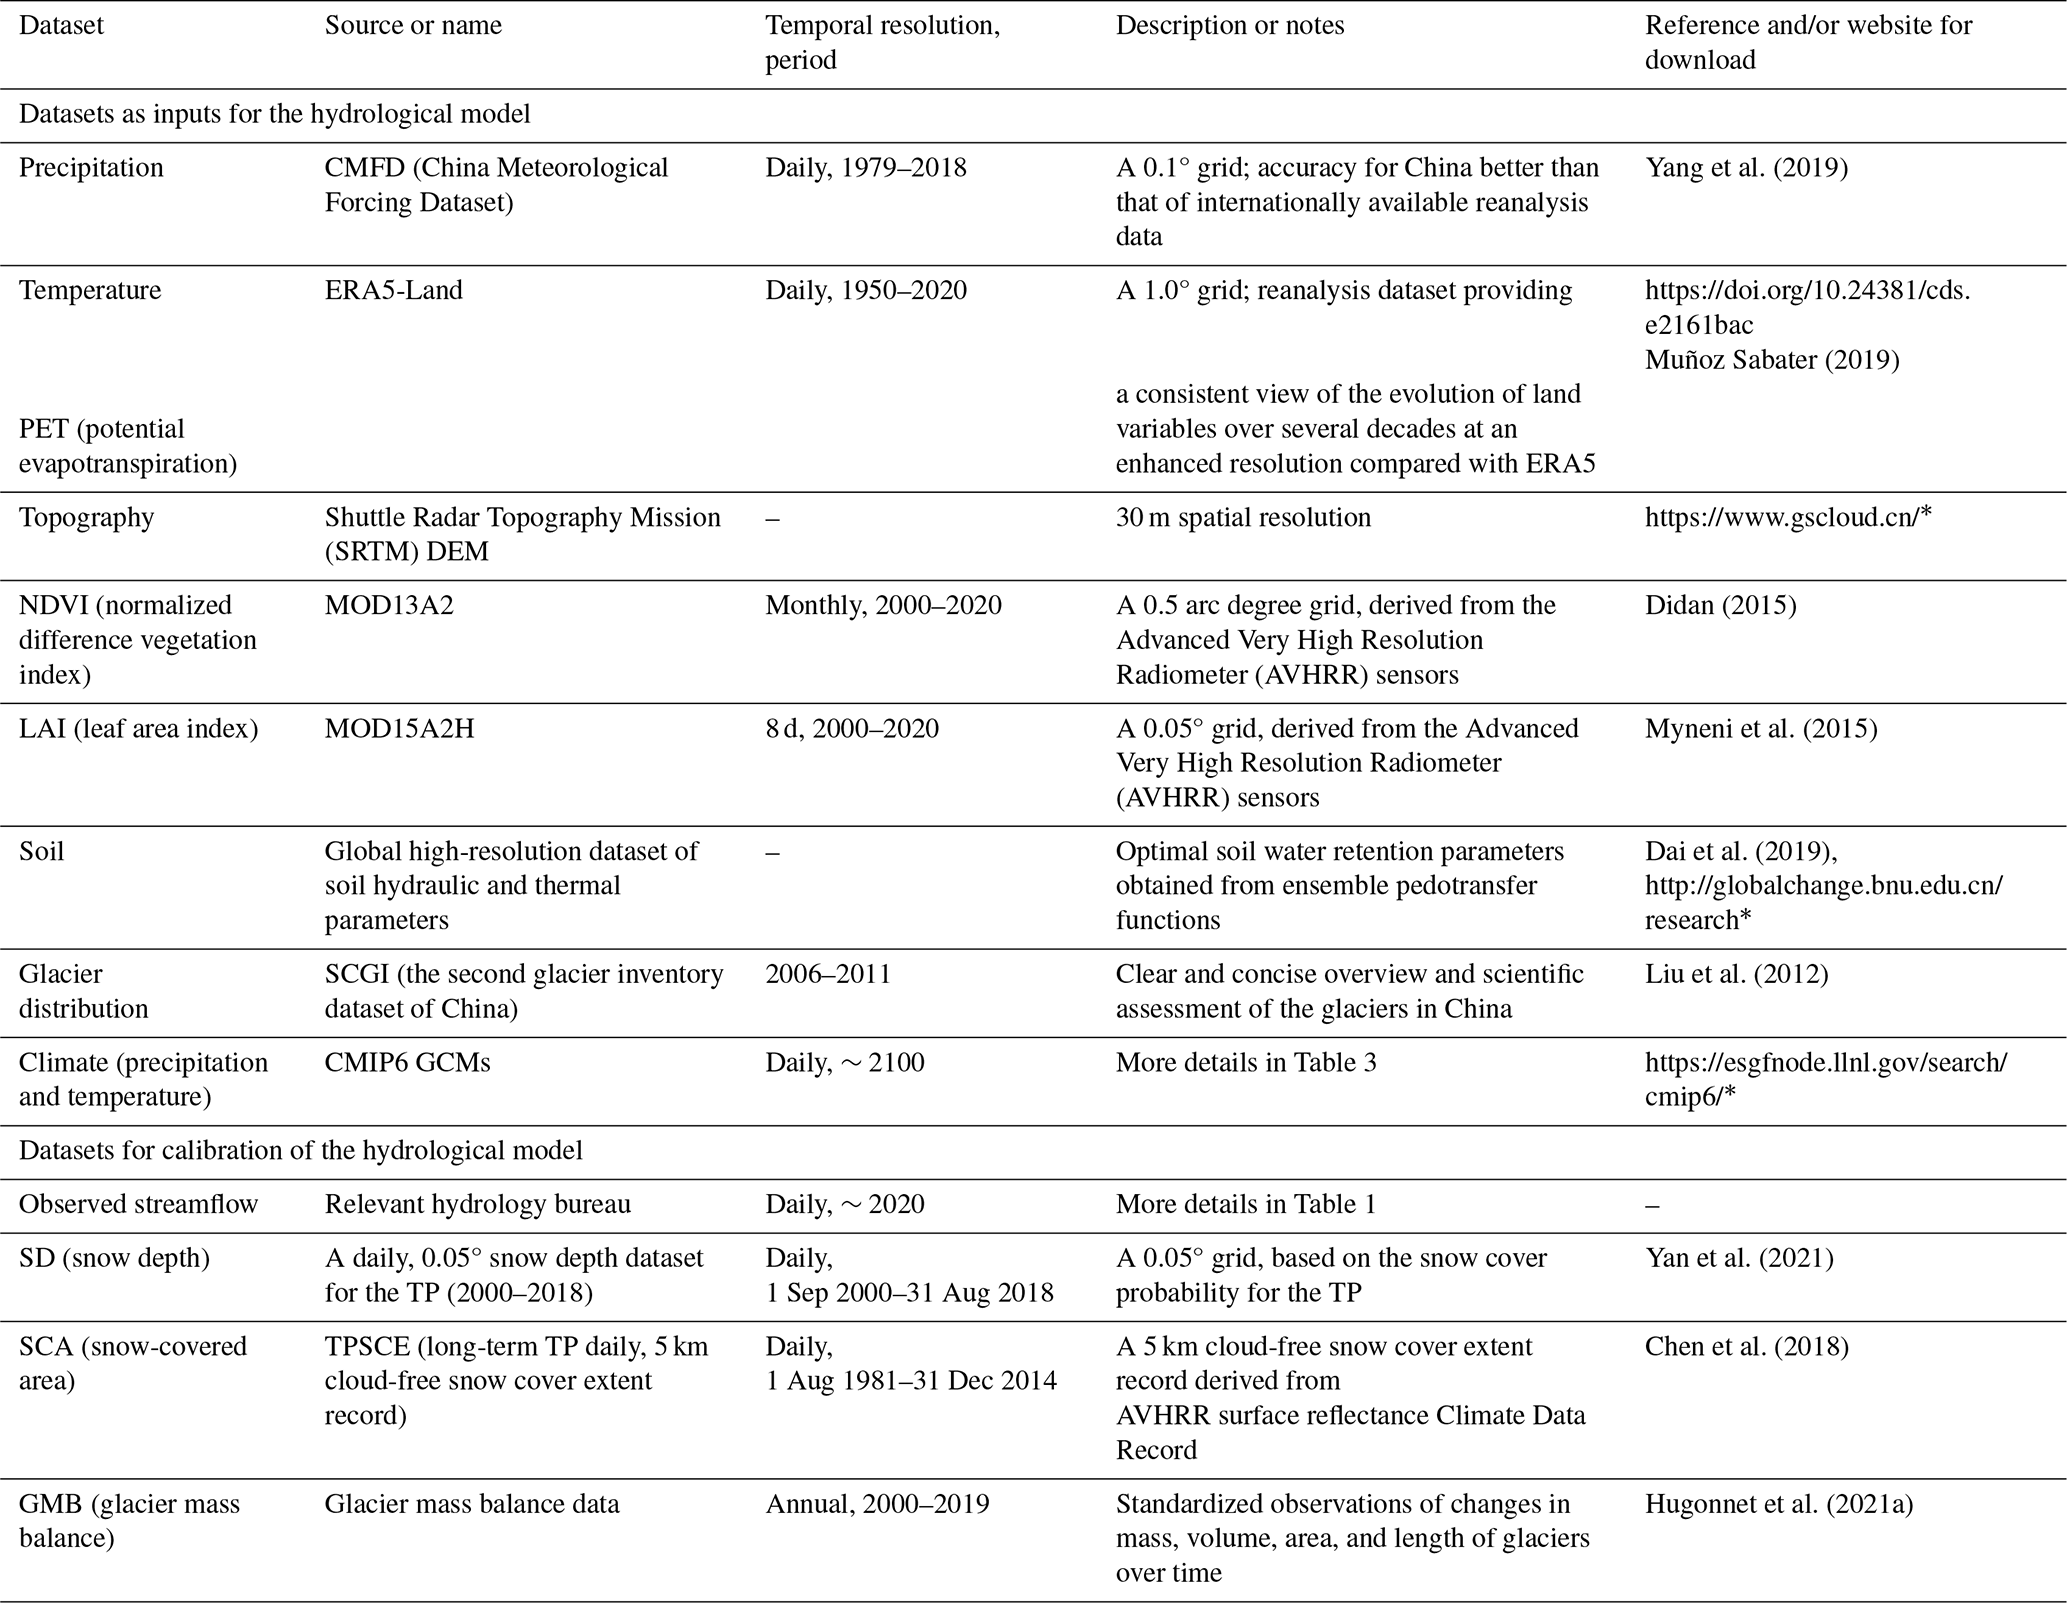
* Last access: 1 January 2023.
2.2.3 Bias-corrected GCM data
General circulation models (GCMs) are commonly used to simulate the Earth's climate change and project future climate change under a suite of different possible emission scenarios. Phase 6 of the Coupled Model Intercomparison Project (CMIP6) comprises the latest available CMIP simulations, which have been improved compared with the previous CMIP phase. Nevertheless, the CMIP6 GCMs still have diverse deviations at the regional scale. Taking the TP region, for instance, most models underestimate the observed trends in the mean and extreme temperature and precipitation (Cui et al., 2021).
We evaluated the performance of 22 CMIP6 GCM products and finally chose 10 GCMs to conduct this study, based on the stability of these data in the hydrological model and the rationality of the simulation results. The basic information on these 10 GCMs is shown in Table 3. The CMIP6 data for 1960–2100 (divided into historical and future periods at the year 2014) were interpolated from various spatial resolutions into the same 0.1° resolution grid using a bilinear interpolation scheme. The biases in the GCM data were further corrected against meteorological reanalysis data (CMFD for precipitation and ERA5-Land for temperature, using 1979–2009 as the reference period for correction and 2010–2018 for validation) based on a multiplicative bias correction approach (MBCn algorithm; Cannon, 2018; Cui et al., 2023). The average precipitation and temperature of the corrected GCMs are presented in Fig. 2. After bias correction, the overestimation of the precipitation and temperature by the GCMs was corrected, but uncertainties still existed in different GCMs. Specifically, different GCMs produced a 14.3 mm yr−1 and 0.27 °C difference in the mean annual precipitation and temperature, respectively, for the historical period. For the future period, these differences increased to 68.32, 62.78, and 102.43 mm yr−1 for precipitation and 1.01, 1.01, and 1.66 °C for temperature under the respective SSP1-2.6, SSP2-4.5, and SSP5-8.5 scenarios. When driving the future model, future PET data were calculated with CMIP6 temperature data and the historical temperature–PET correlation, as shown in Eq. (2) below (Cui et al., 2023), and other input data were kept the same as the historical period.
where and are the respective daily mean temperature (in °C) and potential evapotranspiration (in mm d−1) for the calendar month during the 1979–2009 period (provided by the ERA5-Land), T is the daily temperature from the CMIP6 model output (in °C), and α0 is determined for each calendar month by regressing the ERA5-Land-based PET to daily temperature over each grid.
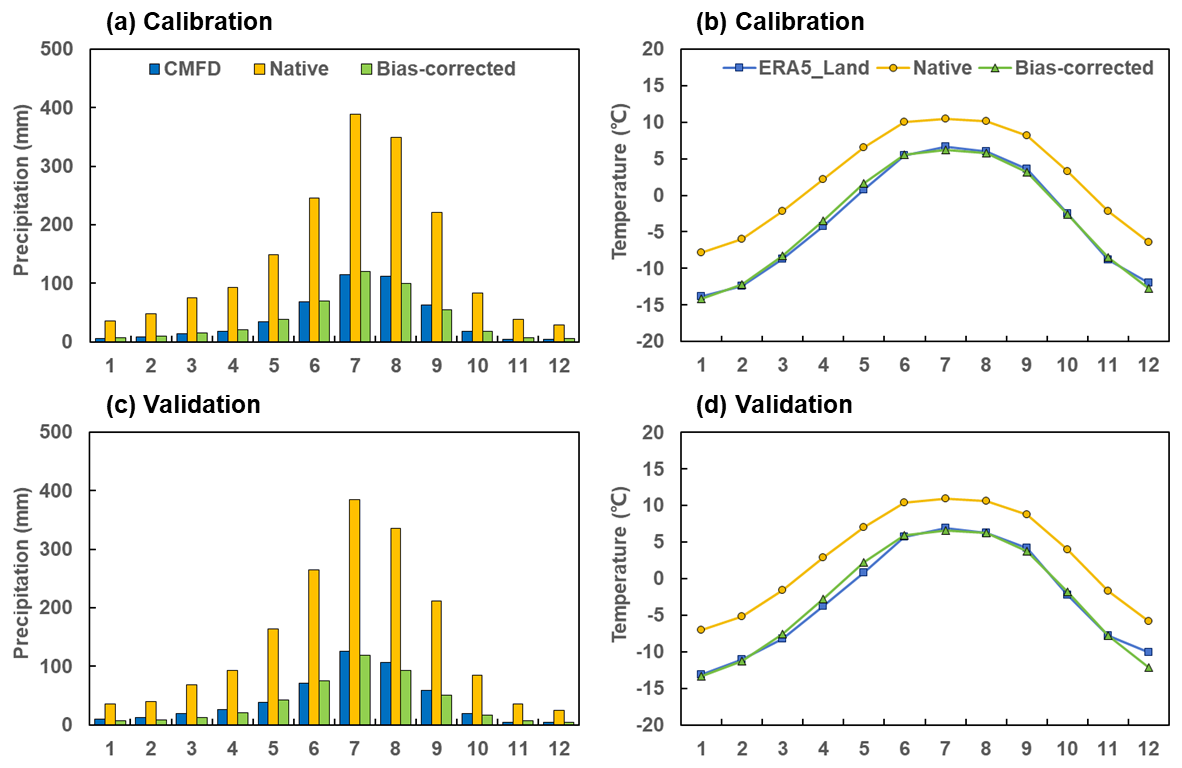
Figure 2Seasonal cycles of precipitation (a, c) and temperature (b, d) calculated from the historical data (CMFD/ERA5-Land) for the ensemble mean of 10 native and bias-corrected CMIP6 datasets during the calibration (1979–2009) and validation (2010–2018) period.
2.3 Hydrological model
A spatially distributed physically based hydrological model, the Tsinghua Representative Elementary Watershed (THREW) model (Tian et al., 2006), was adopted to simulate the streamflow of the YTR basin. This model uses the representative elementary watershed (REW) method for the spatial discretization of catchments (Reggiani et al., 1999), and the YTR basin was divided into 276 REWs based on DEM data, as shown in Fig. 1. Areal averages of the gridded estimates of meteorological variables, vegetation cover, soil properties, and CMIP6 data were calculated in each REW to drive the model.
For application in cold mountainous regions, the THREW model is incorporated with modules characterizing cryospheric hydrological processes, including snowpack dynamics and glacier evolution, and has been successfully applied in several basins across China and the world (Xu et al., 2019; Tian et al., 2020; Nan et al., 2022; Cui et al., 2023). In the THREW model, the degree-day method was used to simulate snow and glacier melting, assuming that snow and glaciers melt at different rates (i.e., different degree-day factors), and relevant parameters including temperature thresholds were calibrated. The snow water equivalent in each REW was updated based on the snowfall and snowmelt, and the snow-covered area was then determined using the snow cover depletion curve. To represent the change in meteorological factors along the altitudinal profile of glaciers, each REW was further divided into several elevation bands to simulate the evolution of glaciers. For each glacier simulation unit, processes including the snow accumulation and snowmelt over a glacier, the turnover of snow to ice, and the ice melt were considered. The mass balance of each glacier simulation unit equaled the difference between snowfall on glacier and the total meltwater. A detailed description of the snow and glacier modules and the related equations can be found in Cui et al. (2023).
Here, a modification was made to the simulation of snowpack accumulation and melting processes on the basis of the model in Cui et al. (2023). The snow sublimation was newly taken into account, similar to Han et al. (2019). Specifically, a certain proportion of sublimation was deducted from the amount of snowfall entering the runoff-generation process, and two additional parameters were introduced for this simulation. The details of the calibrated parameters of the THREW model in this study can be found in Table S1 in the Supplement.
There are two definitions to quantify the contributions of runoff components to streamflow in the THREW model: one is based on the individual water sources in the total water input triggering runoff processes, including rainfall, snowmelt, and glacier melt, whereas the other is based on pathways of runoff generation, resulting in surface and subsurface runoff (baseflow) (Nan et al., 2022). Here, we focused on the first definition and calculated the contributions of different water sources (rainfall, snowmelt, and glacier melt) to the total runoff. More precisely, the terms snowmelt and glacier melt refer to the respective meltwater from snow and glaciers that enters the catchment and drives runoff-generation processes without having undergone evaporation, and the total discharge was equal to the sum of these three components minus the evaporation, thereby achieving the water balance in the THREW model.
2.4 Model calibration
Considering the time period of multiple datasets (the most applicative precipitation data over the YTR basin to build the model covered 1979–2018), the simulation period was selected as 1980–2018, and it was divided into two periods at the year 2009 (i.e., 1980–2009 for calibration and 2010–2018 for validation). Automatic calibration was implemented using the pySOT (Python Surrogate Optimization Toolbox) algorithm to obtain the multiple-optimal objective (Eriksson et al., 2019). The Nash–Sutcliffe efficiency (NSE) coefficient and the logarithmic Nash–Sutcliffe efficiency (lnNSE) coefficient were used together to optimize the simulation of discharge, which can assess the simulations of both high-flow and baseflow processes. The root-mean-square error (RMSE) was used for the evaluation of the SWE, SCA, and GMB simulations. More details on these metrics are presented in Table 4. The datasets for calibration in Table 2 were used separately with the corresponding model outputs to calculate these evaluation indicators during model calibration.
Table 4The calibration elements and the metrics used to evaluate the model performance in this study.
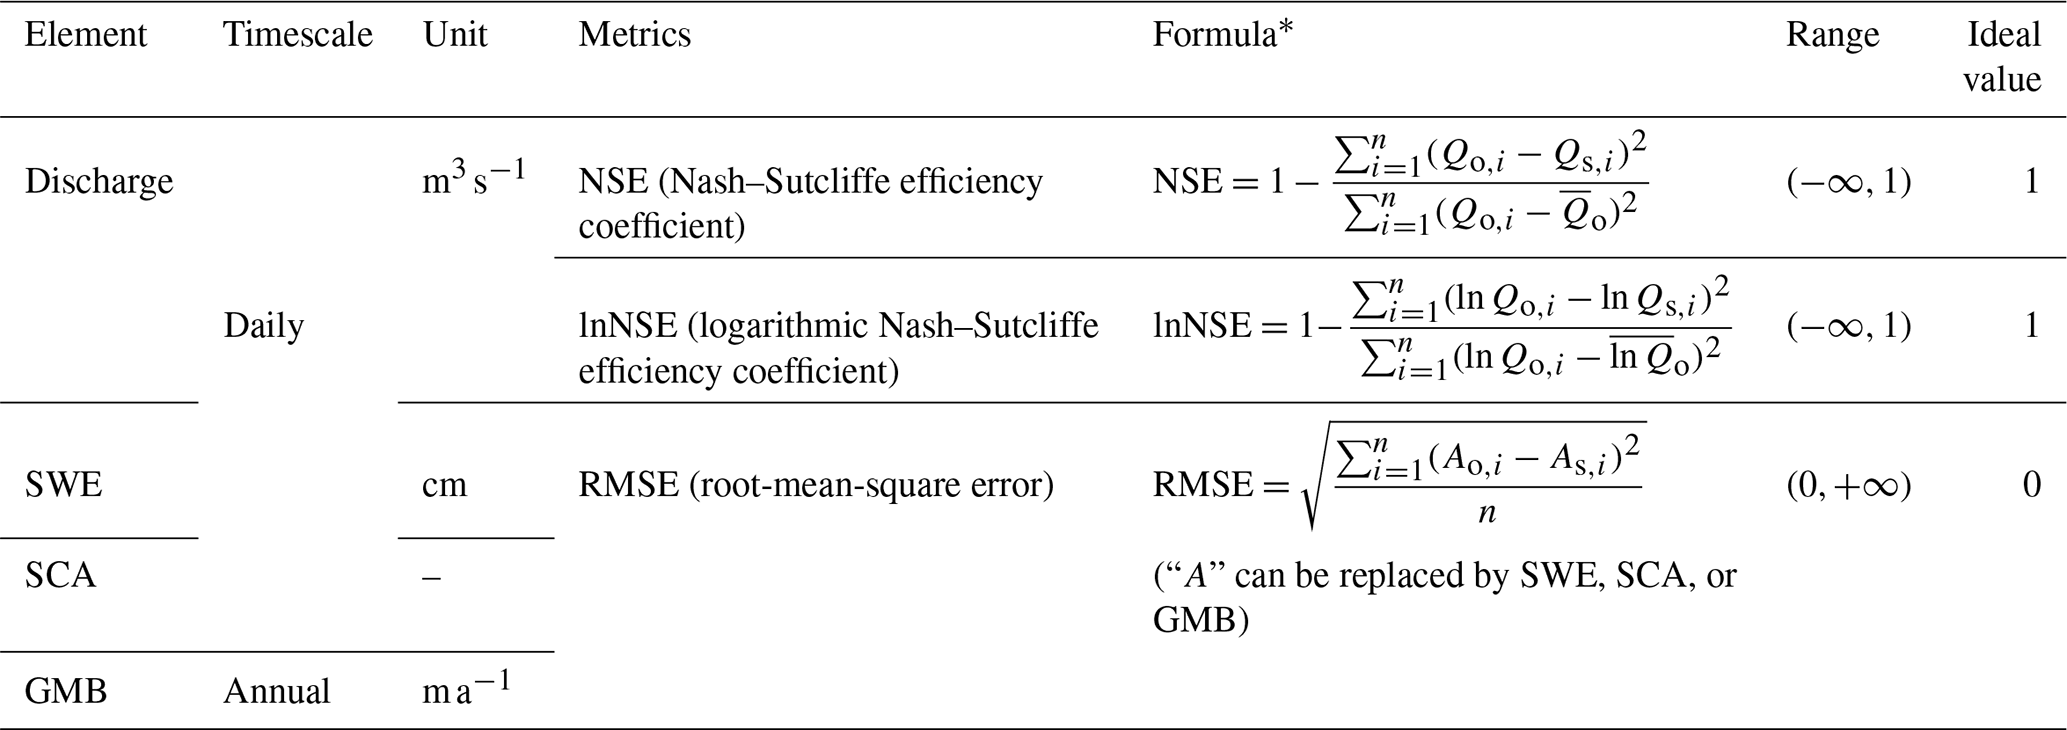
* n is the total number of observations, and the subscripts “o” and “s” refer to observed and simulated variables, respectively.
To assess the effect of various datasets on the calibration as well as their impact on simulation results, in addition to the scenario considering all of the elements (discharge, SWE, SCA, and GMB), we deleted different elements from the calibration objectives to form different comparative variants. Thus, there were four variants for comparison: (1) “D” – calibration solely using discharge; (2) “DG” – calibration using discharge and GMB; (3) “DS” – calibration using discharge, SWE, and SCA; and (4) “DSG” – calibration using discharge, SWE, SCA, and GMB. A plainer description of the calibration variant designation is shown in Table 5. For these variants, the model is calibrated for the whole basin; i.e., the discharge of the basin outlet (Nuxia station) and the basin-scale average values of other elements (SWE, SCA, and GMB) were compared between simulations and observations to evaluate the model. Correspondingly, the value of the parameter was assumed to be universal for all of the REWs in the basin.
Table 5Five calibration variants of the THREW model in this study.
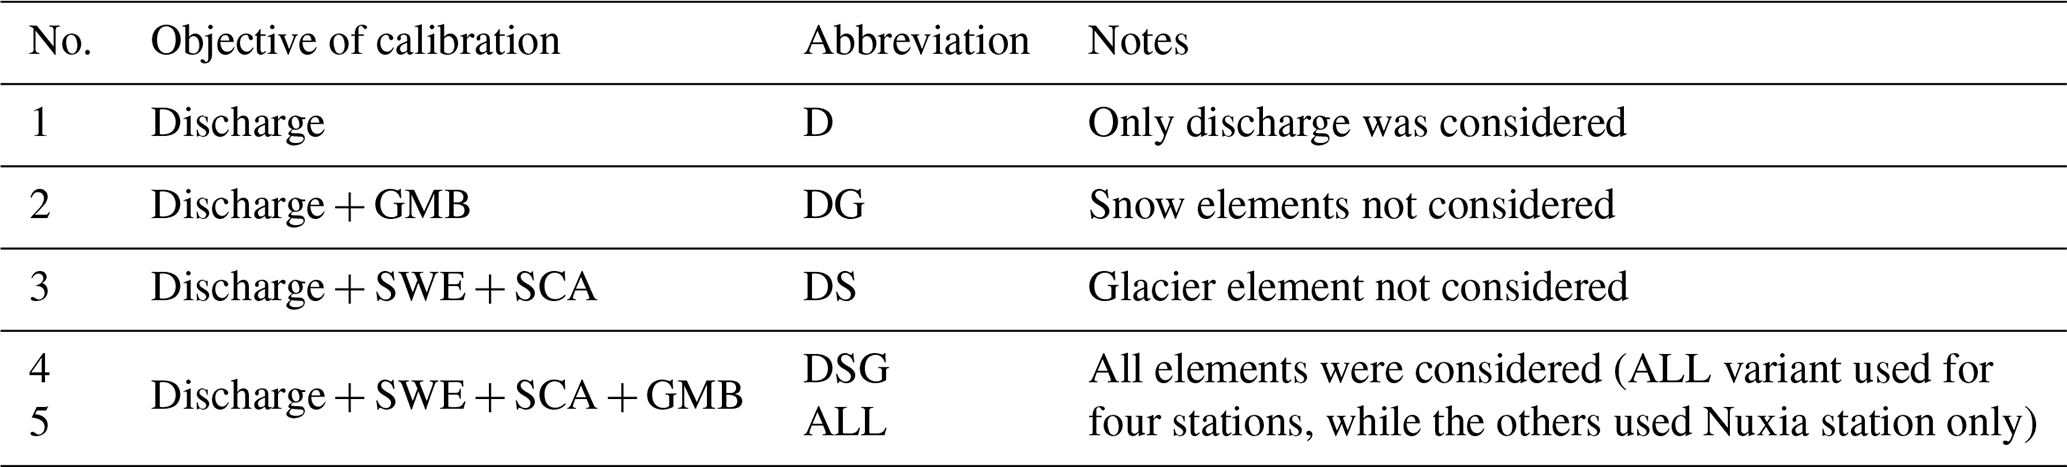
Furthermore, an additional variant, referred to as “ALL”, was added on the basis of the DSG variant. It also considered all elements, but the discharge data at upstream stations were used for calibration to better consider the spatial heterogeneity within the basin. In the ALL variant, the model used four different sets of parameters for the four subregions divided by four hydrological stations.
In each calibration variant, the pySOT program was run 100 times to obtain adequate parameter samples. A final parameter set was manually selected from the 100 calibrated sets based on the overall performance with respect to multiple objectives. The parameters of the THREW model adopted in the YTR basin by all calibration variants are provided in Table S2 in the Supplement.
2.5 Analysis on the streamflow change
2.5.1 Historical trend
The past 6 decades (1960–2020) was selected to analyze historical streamflow changes based on the start time of the measurements at hydrological stations. To analyze the trend and change point in streamflow, the Pettitt test and linear regression methods were adopted with the monthly/annual runoff observations at the four hydrological stations (Zhang et al., 2024). The Pettitt test is a nonparametric approach to the change-point problem (Pettitt, 1979) that can be used for the mutation analysis of hydrological sequences to test the abrupt change points. After obtaining the abrupt change point of the runoff in the historical period (1960–2020), if the periods divided by it are still long (>20 a), the test is conducted again to obtain the abrupt change points relative to the primary abrupt change point. The linear regression method is commonly used to analyze the long-term evolution characteristics of hydrological sequences, reflecting the overall trend and then providing guidance with respect to water resource utilization. Here, the linear regression method was used to calculate the rate of change, whereas the t test method was used to determine the significance, quantitatively reflecting the trend in runoff variation over time.
2.5.2 Future projection
As mentioned in Sect. 2.2.3, 10 CMIP6 GCMs were used in this study, and GCM bias correction was conducted based on observational data. Although the bias correction process modified the mean values of precipitation and temperature, their variation characteristics in the future were mostly preserved, exhibiting significantly rising precipitation and temperature in the future (Fig. S1 in the Supplement). The observation-constrained THREW model in the YTR basin was then driven by the bias-corrected CMIP6 data for the historical period (1960–2014) and the future period (2015–2100) under three Shared Socioeconomic Pathways (SSPs) scenarios: SSP1-2.6 (SSP126), SSP2-4.5 (SSP245), and SSP5-8.5 (SSP585). The results simulated by models of different calibration variants and those using different future SSP scenarios were both compared in this study. In the meantime, considering the time period for model calibration and the GCM bias correction, the results for 1980–2009 were used as the baseline for the historical simulation, and two periods (2020–2049 as the near-future period and 2070–2099 as the far-future period) were selected as representatives for simulation of the future. The relative changes in streamflow in these two future periods compared with the historical period and the contributions of different runoff components to discharge in these representative time periods were specifically calculated to evaluate the future changes.
Different time periods were adopted in different analyses. In summary, the past 6 decades (1960–2020) was selected as the time period of historical streamflow trend analysis, based on the available time period of measurement streamflow data. The simulation period was selected as 1980–2018, as the most applicable precipitation input dataset over the YTR basin (the CMFD dataset) only covered this period, and it was further divided into two periods at the year 2009 for model calibration (1980–2009) and validation (2010–2018). The future projection analysis adopted 1960–2014 and 2015–2100 as the respective historical and future periods, as the CMIP6 GCMs divided the historical and future periods at the year 2014, while the historical period here had several years of overlap with the simulation period. Consequently, three periods were selected to represent the baseline historical period (1980–2009), the near-future period (2020–2049), and the far-future period (2070–2099).
3.1 Streamflow change characteristics during the historical period
As shown in Table 6, the annual runoff at four stations in the YTR basin did not exhibit a significant trend over the past 6 decades. The annual runoff of the three upper stations (Lazi, Nugesha, and Yangcun) showed a deceasing trend, whereas that of the outlet station (Nuxia) exhibited an increasing trend, but all of these trends were insignificant. Figure 3 presents the annual runoff process divided by abrupt change years at the four stations. The change point in annual runoff was different among the four stations, but 1998 was a common turning year during which an abrupt runoff change occurred at three of the stations.
Table 6Abrupt change points and trend testing results of annual and seasonal streamflow in the historical period (1960–2020) at the four hydrological stations of the YTR basin.
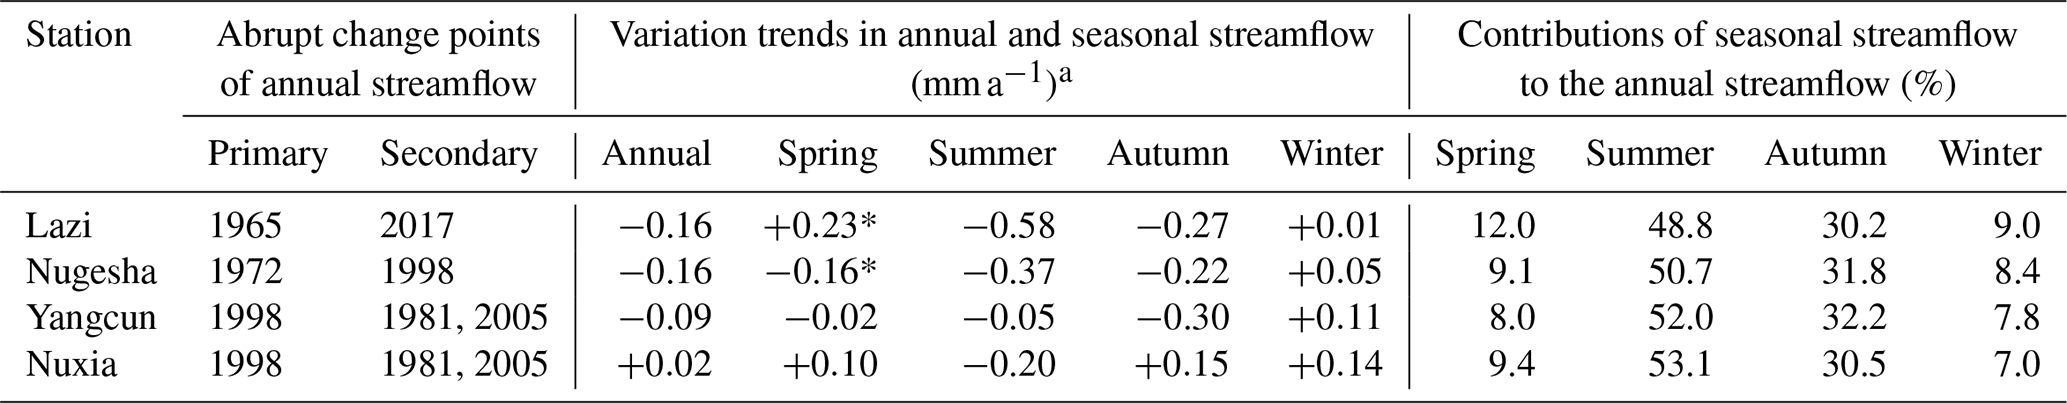
a An asterisk (*) indicates a significant change (at the 0.05 level of significance).
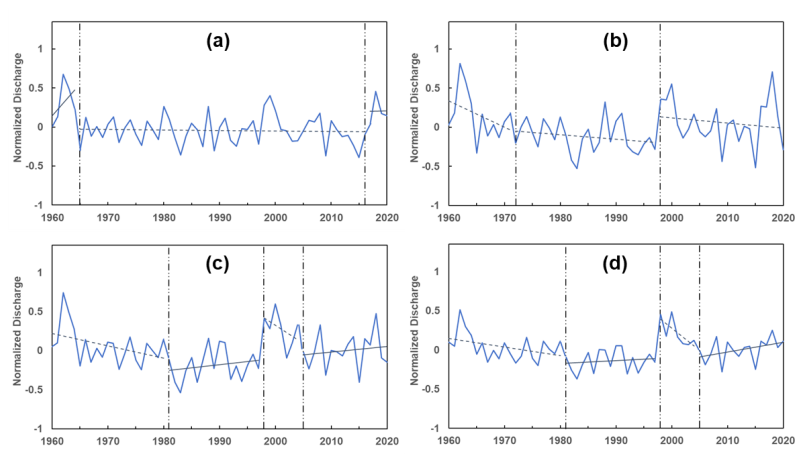
Figure 3Annual runoff processes divided by abrupt change years at the four stations in the YTR basin: (a) Lazi, (b) Nugesha, (c) Yangcun, and (d) Nuxia.
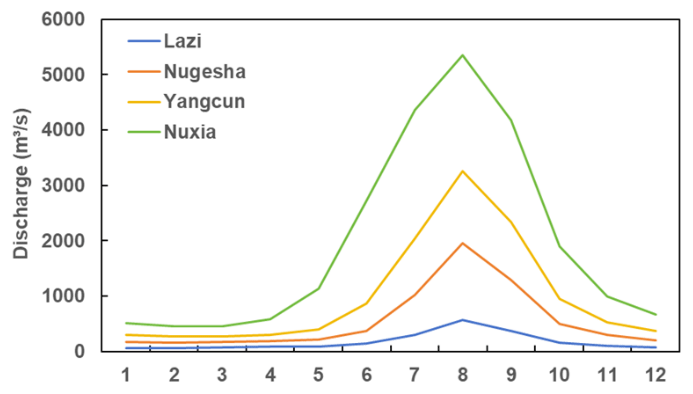
Figure 4 shows the average monthly runoff at the four stations. The runoff was mostly contributed by summer (June–August) and autumn (September–November) runoff, accounting for ∼50 % and ∼30 % of the annual runoff, respectively (Table 6). As for the spatial variation, the measured runoff at different stations appeared to be consistent overall, showing a similar intra-annual distribution of monthly runoff, but the change rates for annual and seasonal runoff were different among stations. The summer and winter runoff at all four stations displayed a decreasing and increasing trend, respectively, while the changes in autumn runoff were consistent with the annual runoff. The spring runoff at the upper stations (Lazi and Nugesha) displayed significant changes.
3.2 Model performance obtained by different calibration variant
Figure 5 shows the observed and simulated discharge at Nuxia station for the calibration and validation periods using various calibration variants. The THREW model performed well with respect to discharge simulation using these variants: almost all of their NSE and lnNSE values were beyond 0.8 during the calibration and validation periods, with some of them exceeding 0.9. However, with respect to the simulation of other elements, variants performed dissimilarly. The performance of the SWE, SCA, and GMB simulations and the specific evaluation metrics is shown in Fig. 6 and Table 7.
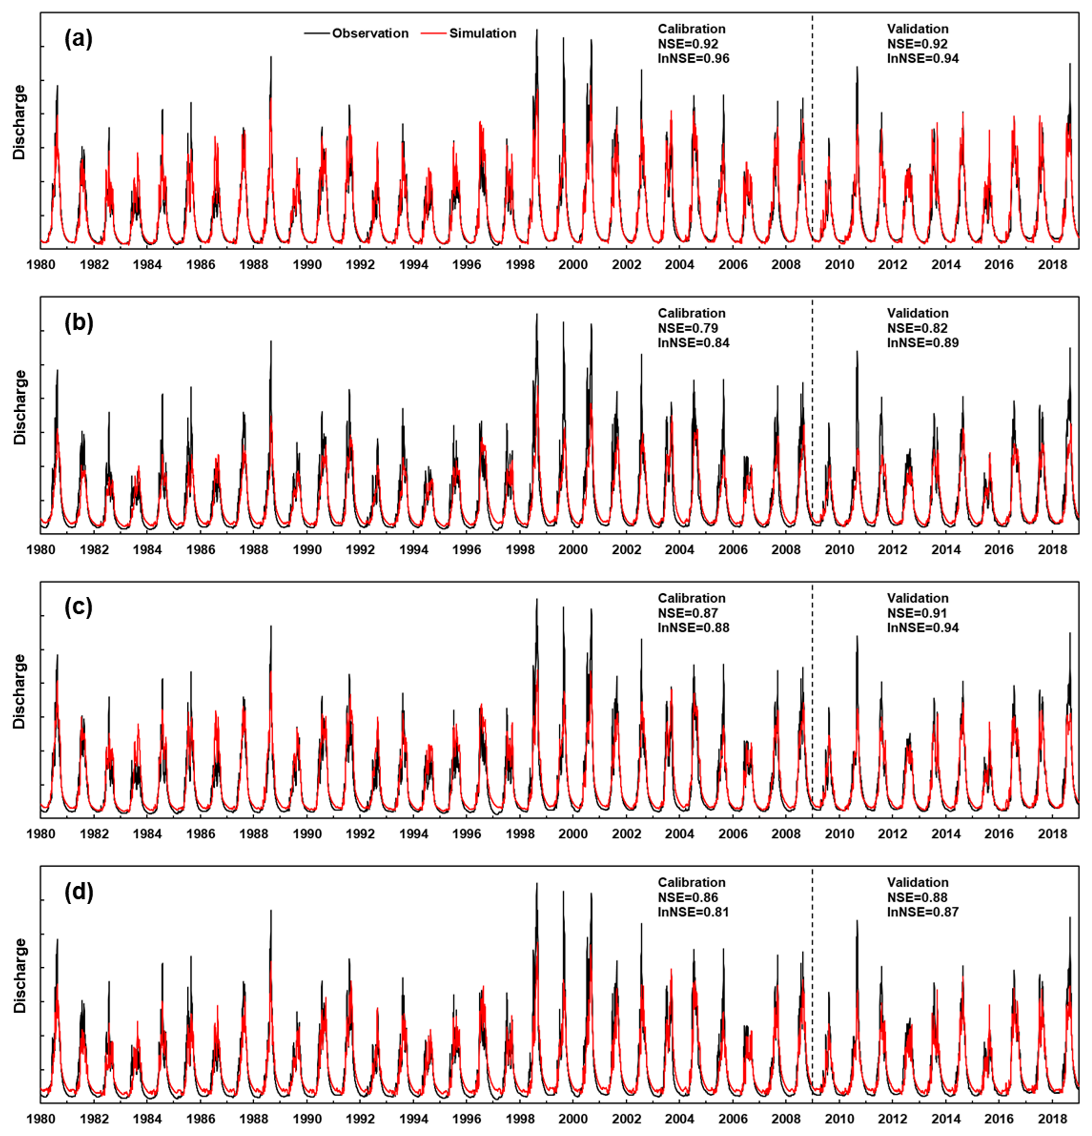
Figure 5Annual discharge processes for observations and simulations at Nuxia station during 1980–2018 using various calibration variants: (a) D, (b) DG, (c) DS, and (d) DSG. The discharge data are hidden due to data confidentiality regulations; this is also the case for Figs. 7, 9, and 10.
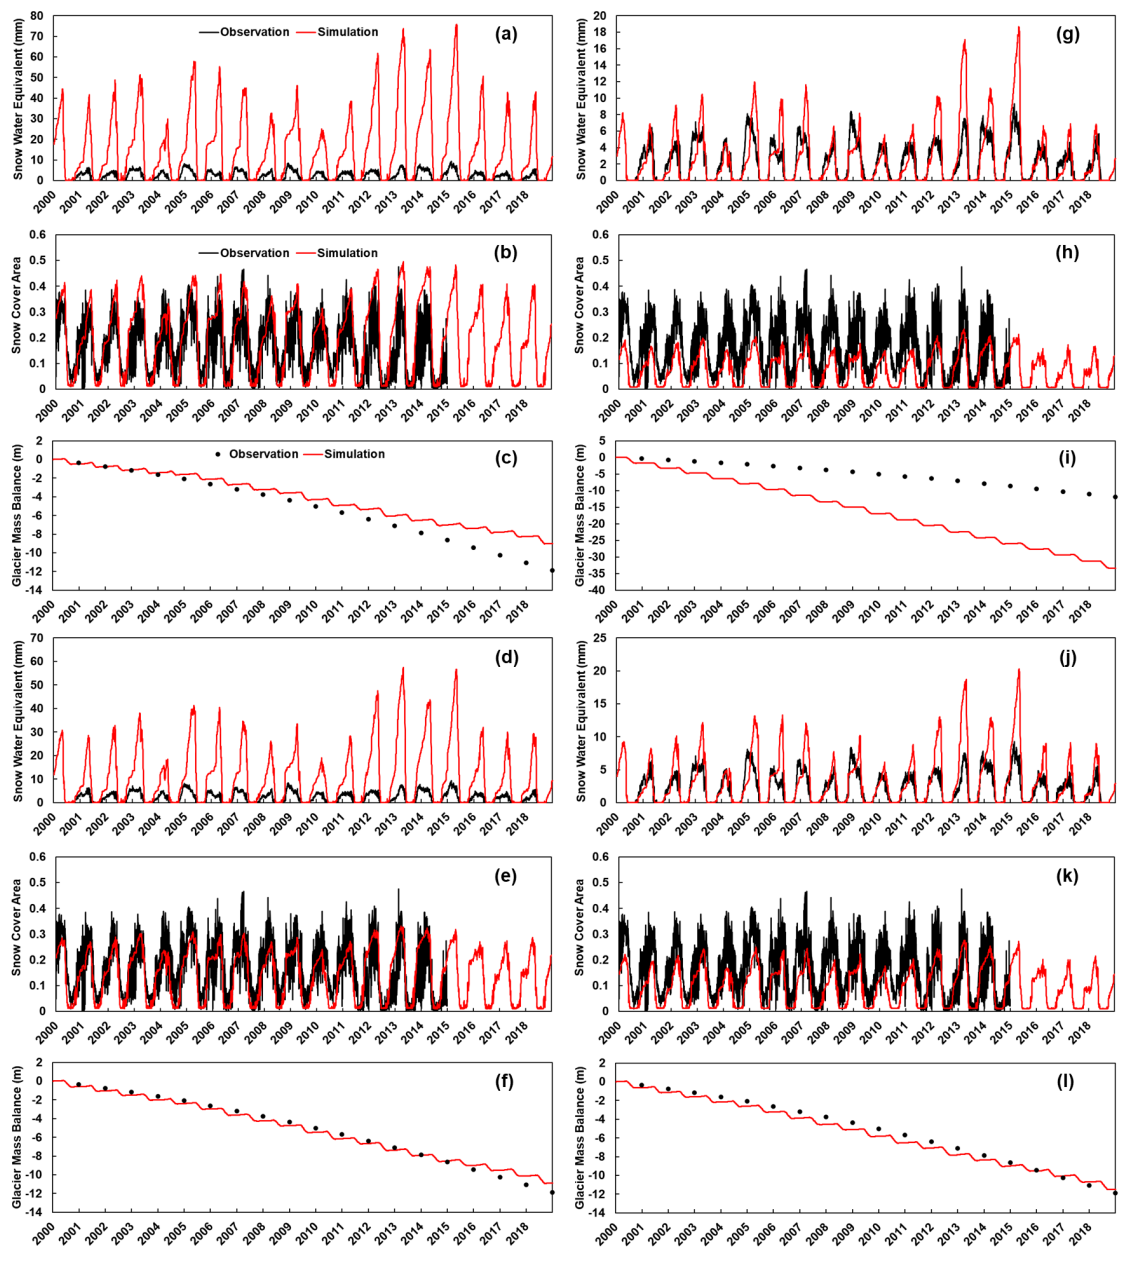
Figure 6Annual processes of SWE, SCA, and GMB for observations and simulations for the whole YTR basin (Nuxia station) during 2000–2018 using various calibration variants: (a–c) D, (d–f) DG, (g–i) DS, and (j–l) DSG.
Table 7Calibrated and validated results at Nuxia station using various calibration variants.
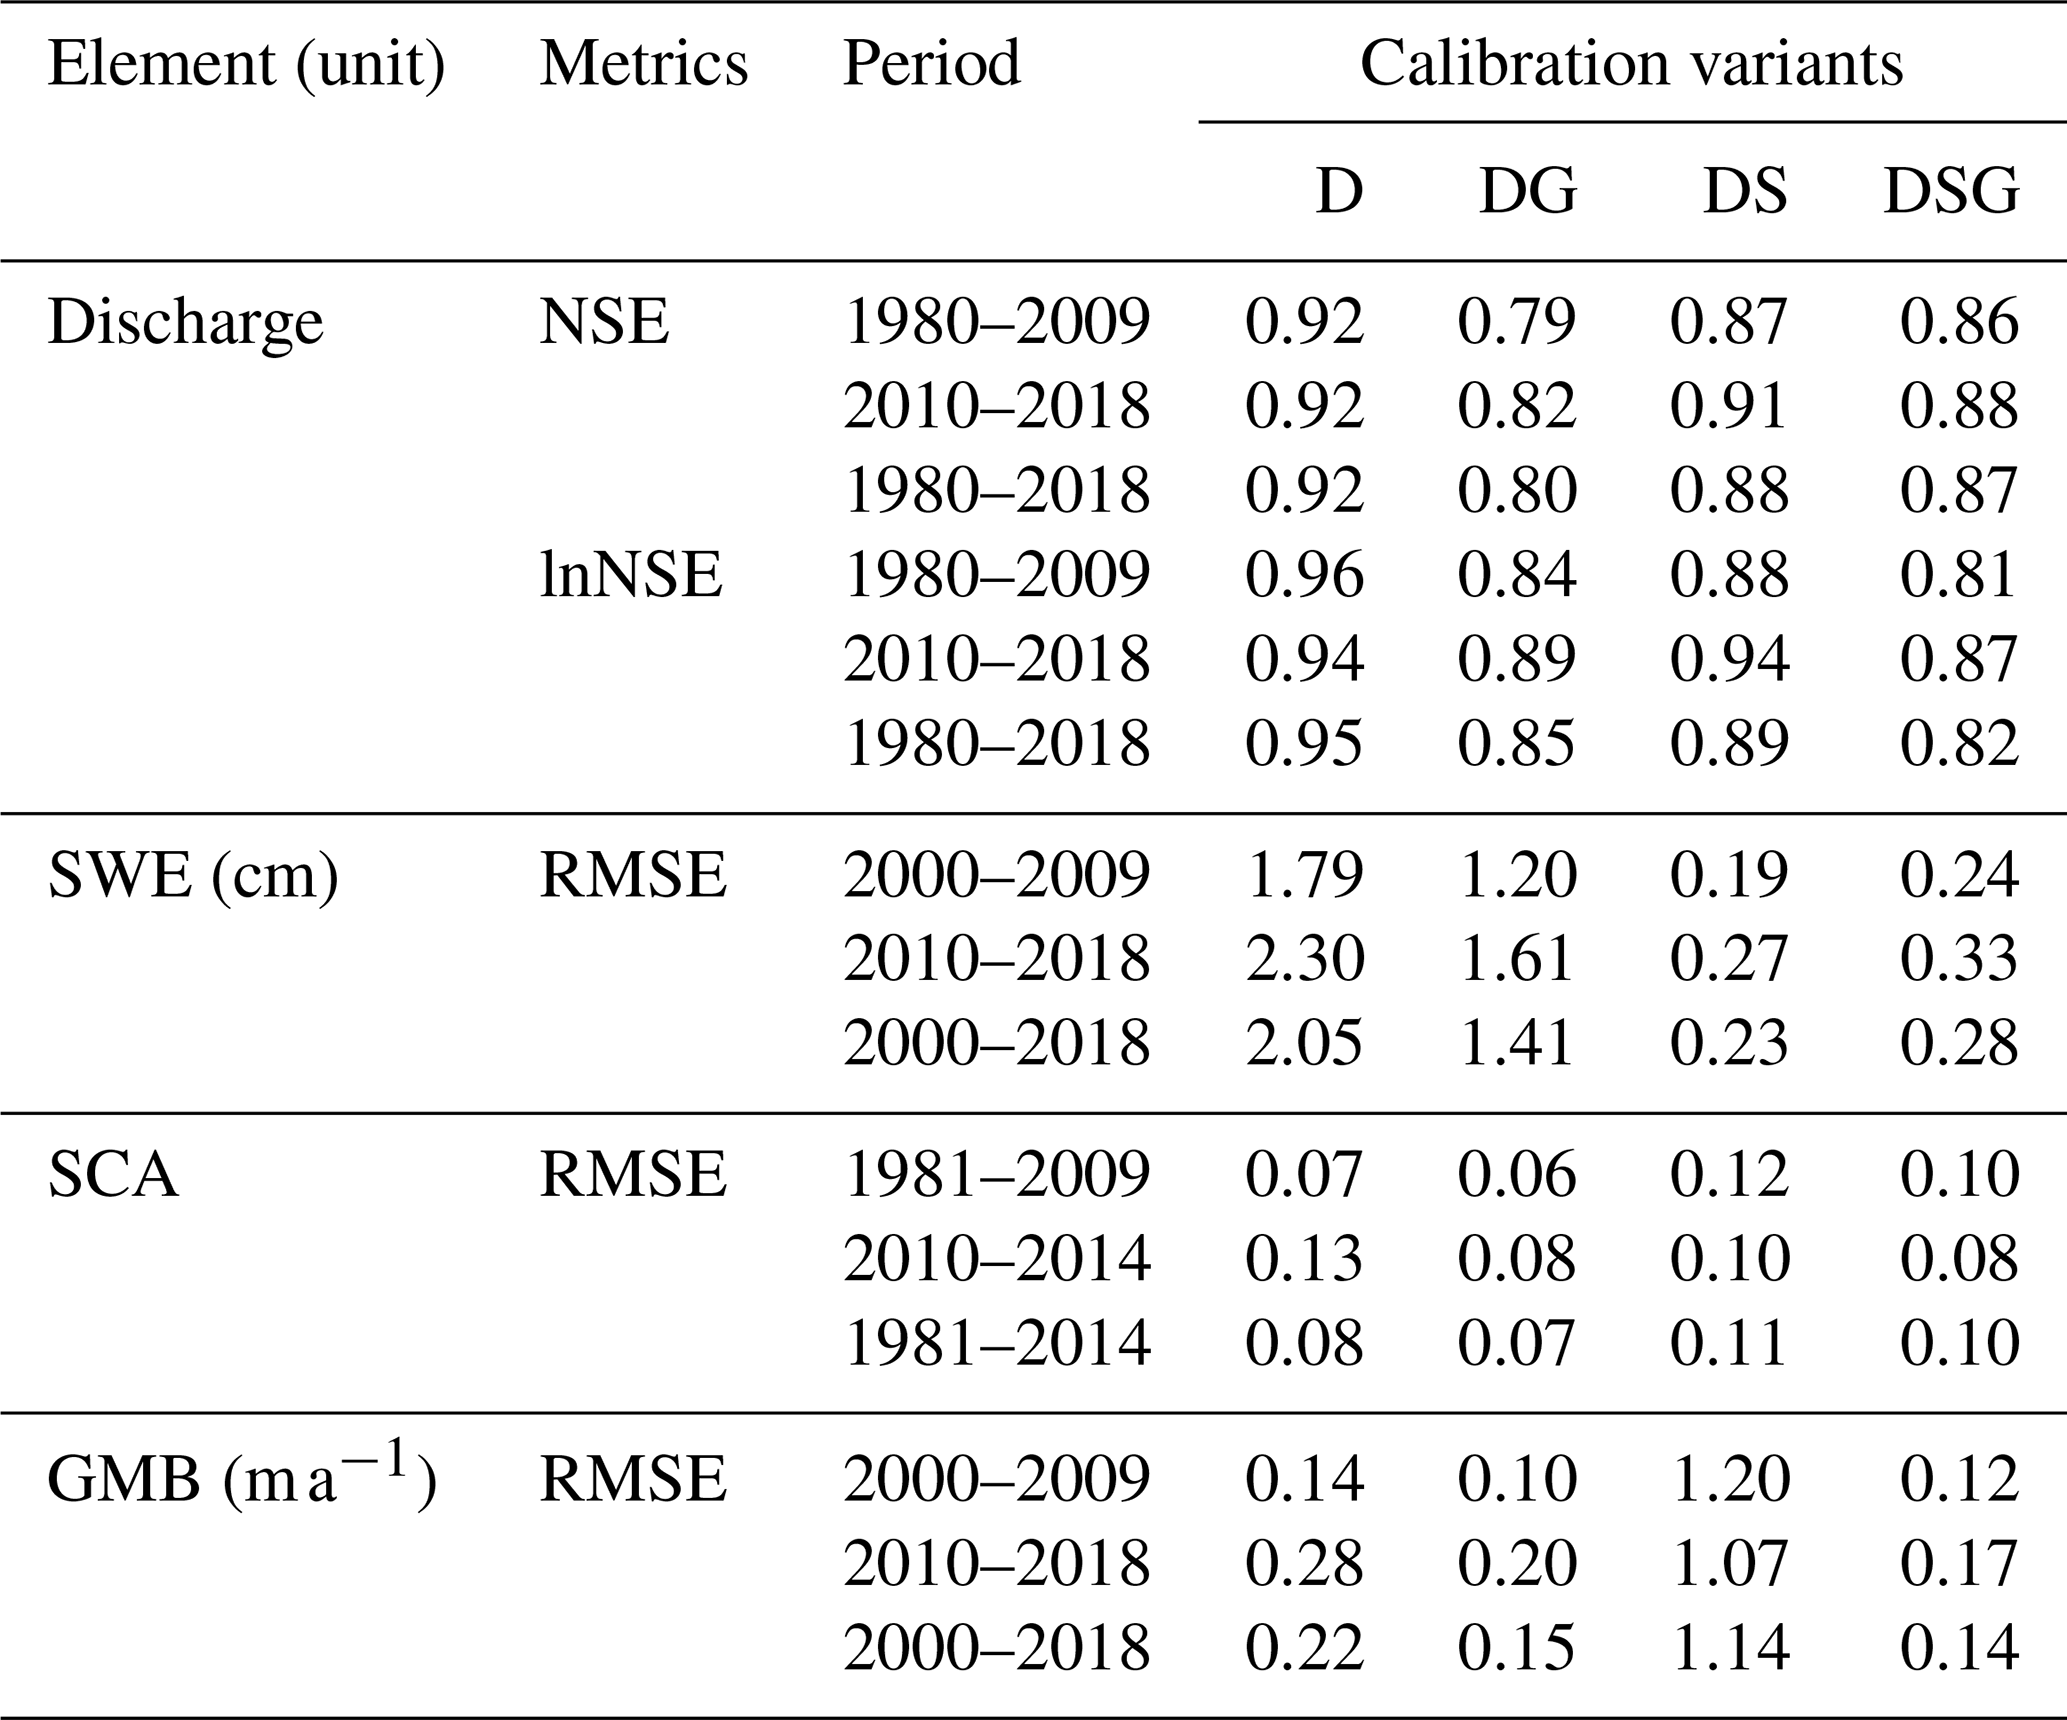
Seasonal and interannual variations in SWE, SCA, and GMB were reproduced well by calibration variant DSG, as indicated by the low values of RMSESWE, RMSESCA, and RMSEGMB. Due to the uncertainty in the observed SD product and the relatively simplified calculation process of SWE, the variations in the SWE were not simulated as well as other elements, but the average simulated SWE was close to the average observation, indicating that the amount of snowpack was reproduced well. In comparison, the DG variant significantly overestimated the SWE, as indicated by the high RMSESWE, while an obvious overestimation in the GMB simulation occurred using the DS variant, with a high value of RMSEGMB. Variant D performed the worst overall: along with the most significant overestimation of SWE, there was an obvious bias in GMB and high values of RMSESWE and RMSEGMB. For the calibration of snow, SWE played a more pronounced role as a constraint, while SCA's constraint was easier to satisfy. The values of RMSESCA for these four variants were all relatively low (∼0.10), but the simulated SCA processes of variants DG and D were higher than the observations, while the peaks were slightly underestimated by the other two variants (Fig. 6).
In summary, variations in all elements (discharge, SWE, SCA, and GMB) were reproduced well by calibration variant DSG, effectively utilizing all observed data. Comparatively, variants DG and DS performed poorly with respect to the simulation of snow and glacier process, respectively, whereas the single-objective variant D presented poor performance with respect to simulating all of the elements except for discharge. Thus, among these four different variants, variant DSG (with the most objectives in the calibration) could arguably achieve the best comprehensive results.
We then further focused on the simulations of upstream stations, and the calibration variant ALL was set as a supplement. The simulation results for all hydrological stations in the YTR basin using calibration variants DSG and ALL are shown in Table 8. Although the two variants achieved similar performance at the outlet station (Nuxia), with both reproducing the processes of discharge, SWE, SCA, and GMB well, there were significant differences in the results at the upstream stations. The ALL variant obviously performed better in the simulation of upstream stations, with high values of NSE and lnNSE (NSE>0.8 and lnNSE>0.7 at the Yangcun and Nugesha stations and NSE and lnNSE>0.6 at Lazi station) and low values of RMSESWE, RMSESCA, and RMSEGMB during the calibration and validation periods, whereas variant DSG showed significant deviations, especially for the most upstream station (Lazi). Therefore, the ALL variant was considered to offer further improvements compared with the DSG variant, the former of which could better simulate the hydrological processes in different regions of the basin. Figures 7 and 8 present the observed and simulated discharge and other calibration elements at all four stations in the YTR basin using the ALL variant. The simulated discharge process for all stations generally coincided with the observed process, and the simulated processes for SWE, SCA, and GMB in the different regions were also generally close to the observed processes. For comparison, the simulations at upstream stations using the DSG variant are shown in Figs. S2 and S3 in the Supplement. The DSG variant produced an abnormal fluctuation in discharge during the baseflow period at upstream stations, resulting in extremely low values of lnNSE. The snow and glacier simulations were also worse than those using the ALL variant, showing larger RMSEs for the SWE, SCA, and GMB simulations.
Table 8Calibrated and validated results at all hydrological stations in the YTR basin using calibration variants DSG and ALL.

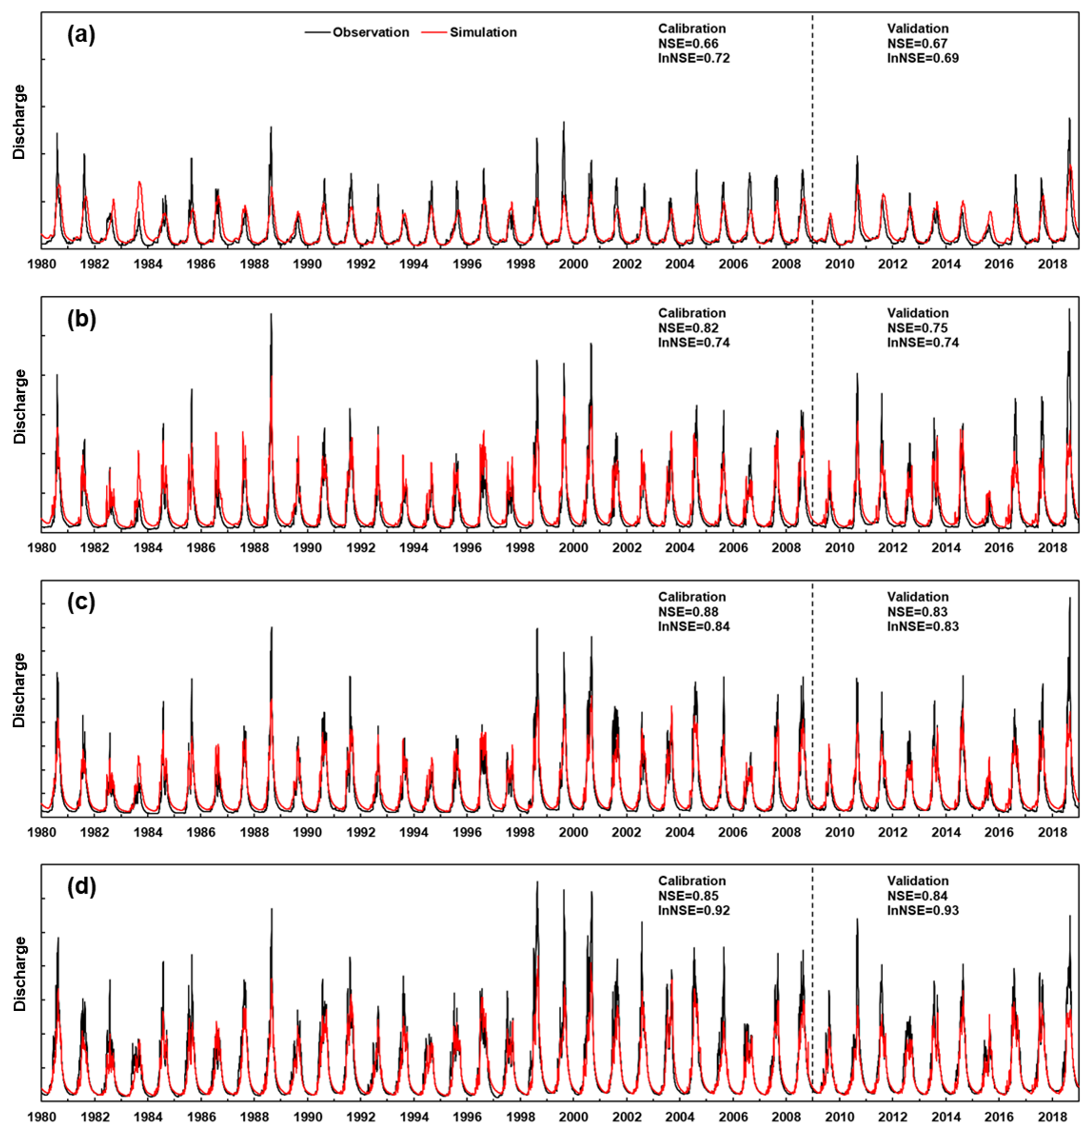
Figure 7Annual discharge processes for observations and simulations at the four stations in the YTR basin during 1980–2018 using calibration variant ALL: (a) Lazi, (b) Nugesha, (c) Yangcun, and (d) Nuxia.
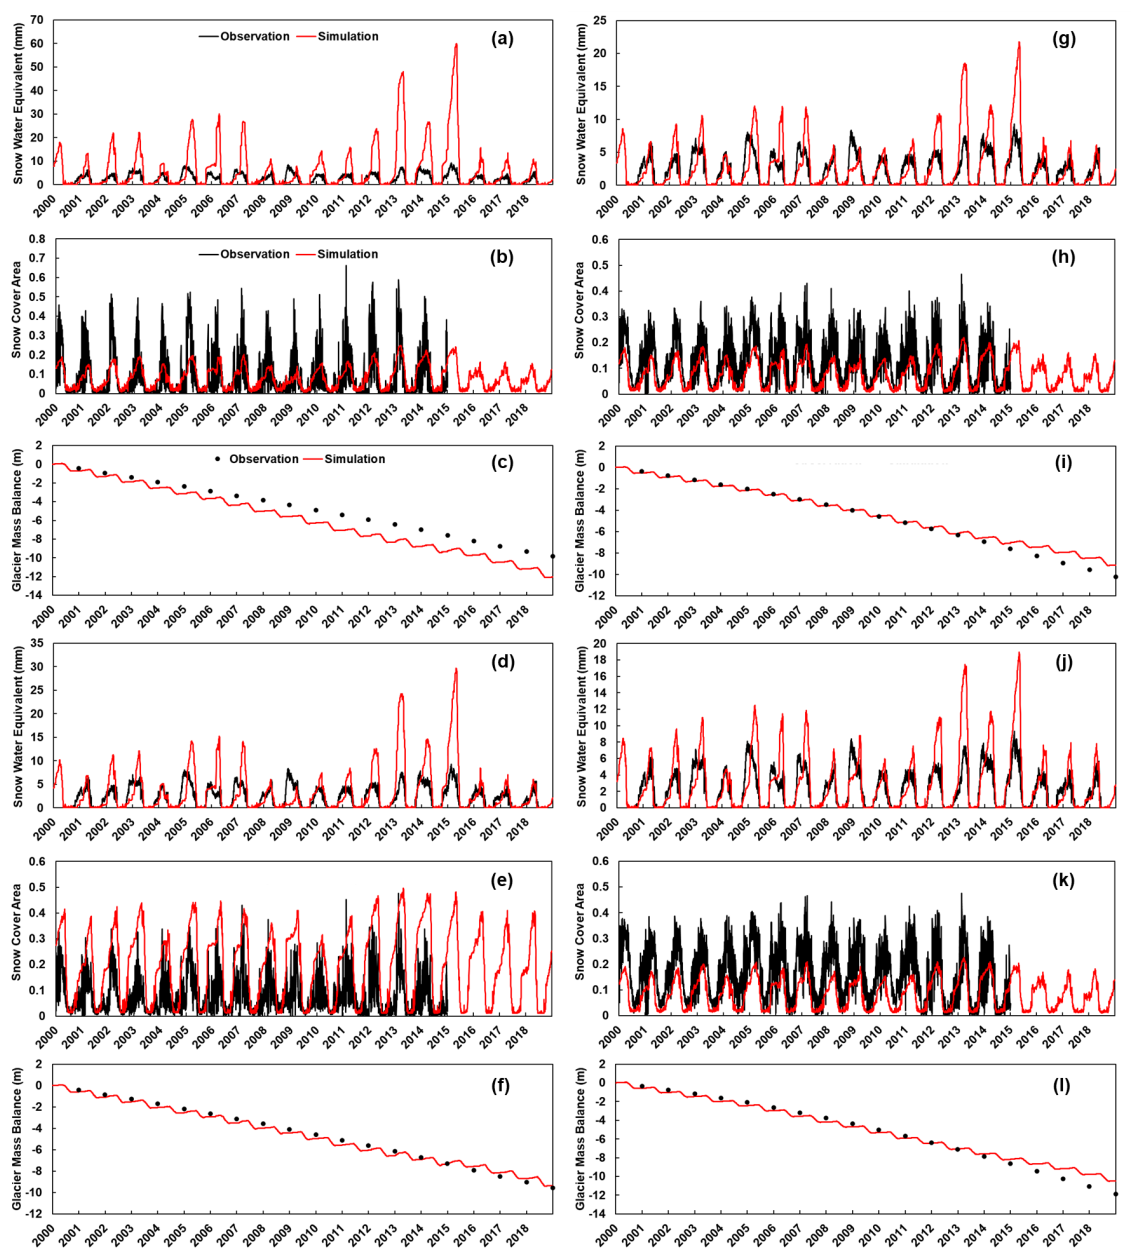
Figure 8Annual processes of SWE, SCA, and GMB for observations and simulations in various regions of the YTR basin during 2000–2018 using calibration variant ALL: (a–c) Lazi, (d–f) Nugesha, (g–i) Yangcun, and (j–l) Nuxia.
3.3 Contributions of each runoff component to streamflow
Table 9 shows the contributions of different runoff components to streamflow during the simulation period (1980–2018) at Nuxia station estimated using various calibration variants. Although the discharge variation was well reproduced by all variants in the calibration and validation periods, the contributions of runoff components were quite different among different variants. For all calibration variants, rainfall was the dominant water source, with a contribution of more than 70 %. The contribution of glacier melt was estimated to be lower than 10 %, while the contribution of snowmelt varied significantly among different variants. For the DSG calibration variant, the mean contributions of rainfall, snowmelt, and glacier melt to annual streamflow in the YTR basin were around 88.8 %, 4.9 %, and 6.3 %, respectively. For variant DG, the contribution of glacier melt to streamflow was 6.3 % (same as that of the DSG variant), but the contribution of snowmelt was much higher (16.7 %). Conversely for variant DS, the contribution of snowmelt to streamflow was 4.5 % (close to that of the variant DSG), yet the contribution of glacier melt was higher (9.7 %). Regarding variant D, the contributions of the runoff component were similar to variant DG, but the contribution of snowmelt was even higher, close to 20 %. The above differences in the contributions of the runoff components were basically consistent with the model performance with respect to the simulation of each element.
Table 9Contributions of different runoff components to discharge during 1980–2018 at Nuxia station using various calibration variants and at upper stations using the DSG and ALL calibration variants.
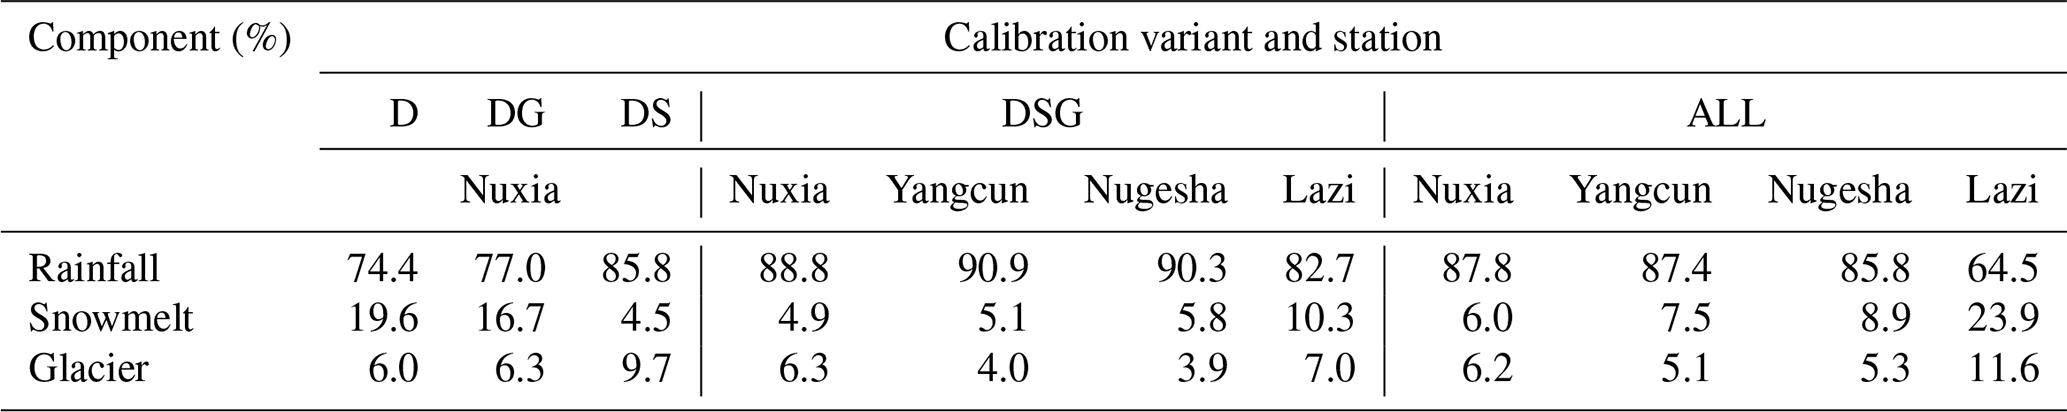
Comparing the DSG and ALL variants, the contributions of the runoff components to streamflow at Nuxia station obtained by the two variants were similar, with snowmelt and glacier melt together accounting for 11 %–12 %. However, as for upstream stations, the contributions of meltwater runoff in the upstream stations under variant DSG were quite small (<10 % at Yangcun and Nugesha stations and <20 % at Lazi station), while the results obtained using the ALL variant were slightly different. Snowmelt and glacier melt runoff accounted for a larger proportion at upstream stations. The respective contributions of snowmelt and glacier melt runoff during 1980–2018 were 7.5 % and 5.1 % at Yangcun station, 8.9 % and 5.3 % at Nugesha station, and 23.9 % and 11.6 % at Lazi station. The contributions of snowmelt and glacier melt runoff in different regions would vary due to factors like the difference in snow and glacier coverage within the region, and the spatial variation in degree-day factors (Zhang et al., 2006). Owing to the calibration results at upstream stations, the runoff composition results at different stations under the ALL variant were believed to be more reasonable.
3.4 Projection of future streamflow
Figure 9 shows the average annual discharge simulated with 10 CMIP6 GCMs during 1960–2100 at Nuxia station with the model calibrated using four variants. The streamflow projections generated by the 10 GCMs exhibited substantial variation, ranging from 60 % to 160 % of the average streamflow, as indicated by the uncertainty bars in Fig. 9. To address this variability, we used the average of the 10 GCMs to represent the ensemble projection result. In spite of the deviations among GCMs and the different parameters obtained by different calibration variants, the annual mean streamflow in the YTR basin was projected to increase consistently in the future. The runoff increased insignificantly under the SSP126 and SSP245 scenarios, while an increasing trend was visible under the SSP585 scenario, with a P value <0.01 in all time periods under the latter scenario. Figure 9 also shows the relative changes in annual discharge under three SSP scenarios in the near- and far-future periods. Here, we find that, under some SSP scenarios (mainly SSP245 and SSP585), there could also be a slight decrease in total runoff in the near-future period, which is compatible with the results of a previous study (Cui et al., 2023). However, in the far-future period, the total runoff showed a notable increase under three SSP scenarios using all calibration variants. For instance, under calibration variant DSG, the relative change in annual streamflow depth at Nuxia station was 6.0 mm (2.2 %), −3.0 mm (−1.1 %), and −13.1 mm (−4.8 %) under the SSP126, SSP245, and SSP585 scenarios, respectively, in the near-future period (2020–2049) compared with the historical period (1960–2009), whereas it was 16.2 mm (6.0 %),31.4 mm (11.6 %), and 90.9 mm (33.6 %) for the corresponding scenarios in the future period (2070–2099).
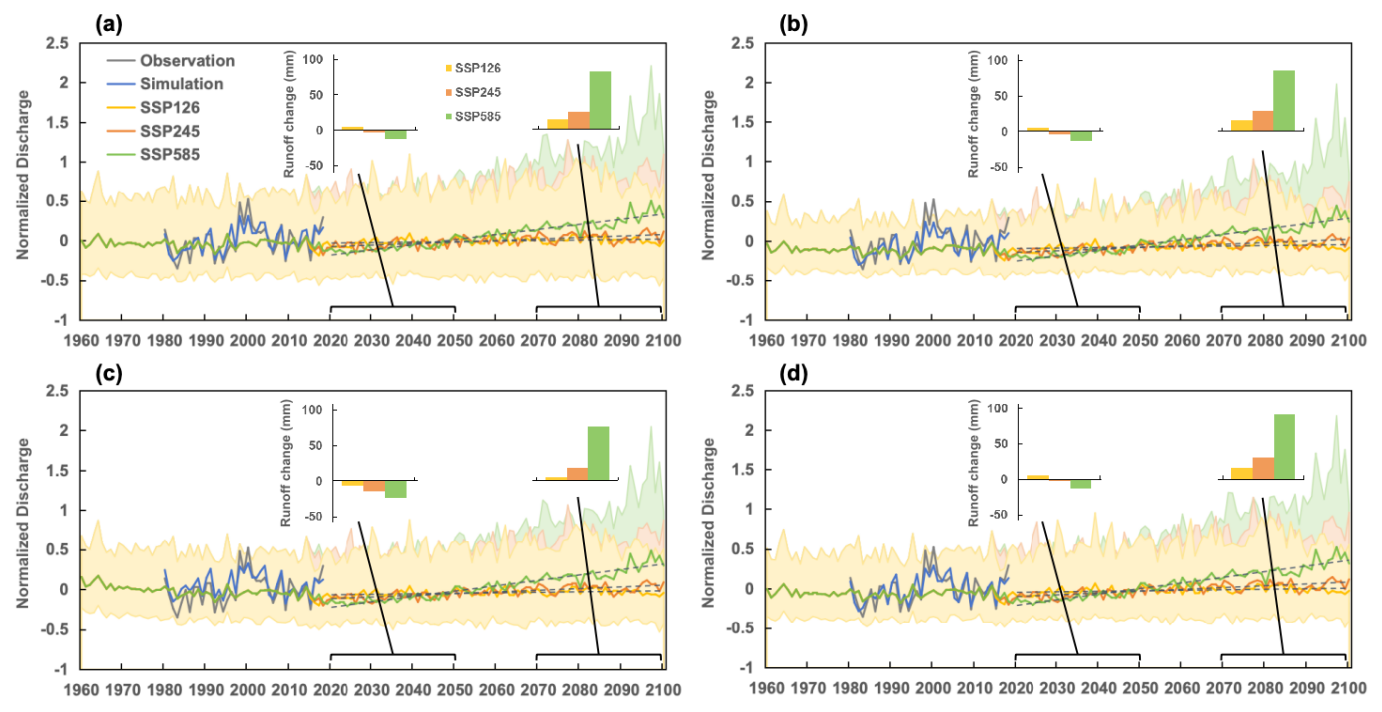
Figure 9Average annual discharge simulated with 10 CMIP6 GCMs during 1960–2100 at Nuxia station using the calibrated model with four variants: (a) D, (b) DG, (c) DS, and (d) DSG. The gray line is the observed value, the blue line is the simulated value in calibration, and the shaded area indicates the deviations of the 10 GCMs' data.
Table 10 provides the specific average variation trends during different periods simulated with 10 CMIP6 GCMs. Under different variants, the increasing trends in streamflow under the SSP585 scenario at Nuxia Station were all projected to exceed 1.7 mm a−1 during the future period (2015–2100), especially the far-future period (all ). However, under the SSP126 scenario, the annual total streamflow showed a downward trend in the far-future period, while the variation trends in streamflow in this period were low (most ) under the SSP245 scenario. Moreover, the future streamflow at all of the upstream stations also presented an increasing trend (Fig. 10), but the increasing trends at these stations were not as significant as at the outlet station (Nuxia). Using the ALL variant, the variation trend in streamflow at Nuxia station was about 1.92 mm a−1 during 2015–2100 under the SSP585 scenario, while the trends in streamflow at the Yangcun, Nugesha, and Lazi stations were 1.47, 0.99, and 0.50 mm a−1, respectively. Similar to Nuxia station, the total runoff of the upstream station exhibited relatively small changes in the near-future period, whereas it showed significant changes in the far-future period. Compared with the historical period, the relative change in annual streamflow depth in the far-future period was 26.6 mm (102.8 %), 50.3 mm (57.7 %), 76.2 mm (51.0 %), and 94.6 mm (39.9 %) at Lazi, Nugesha, Yangcun, and Nuxia station, respectively, under the SSP585 scenario.
Table 10Average variation trends during different periods at Nuxia station using various calibration variants and average variation trends at the upper stations using the ALL calibration variant simulated with 10 CMIP6 GCMs.
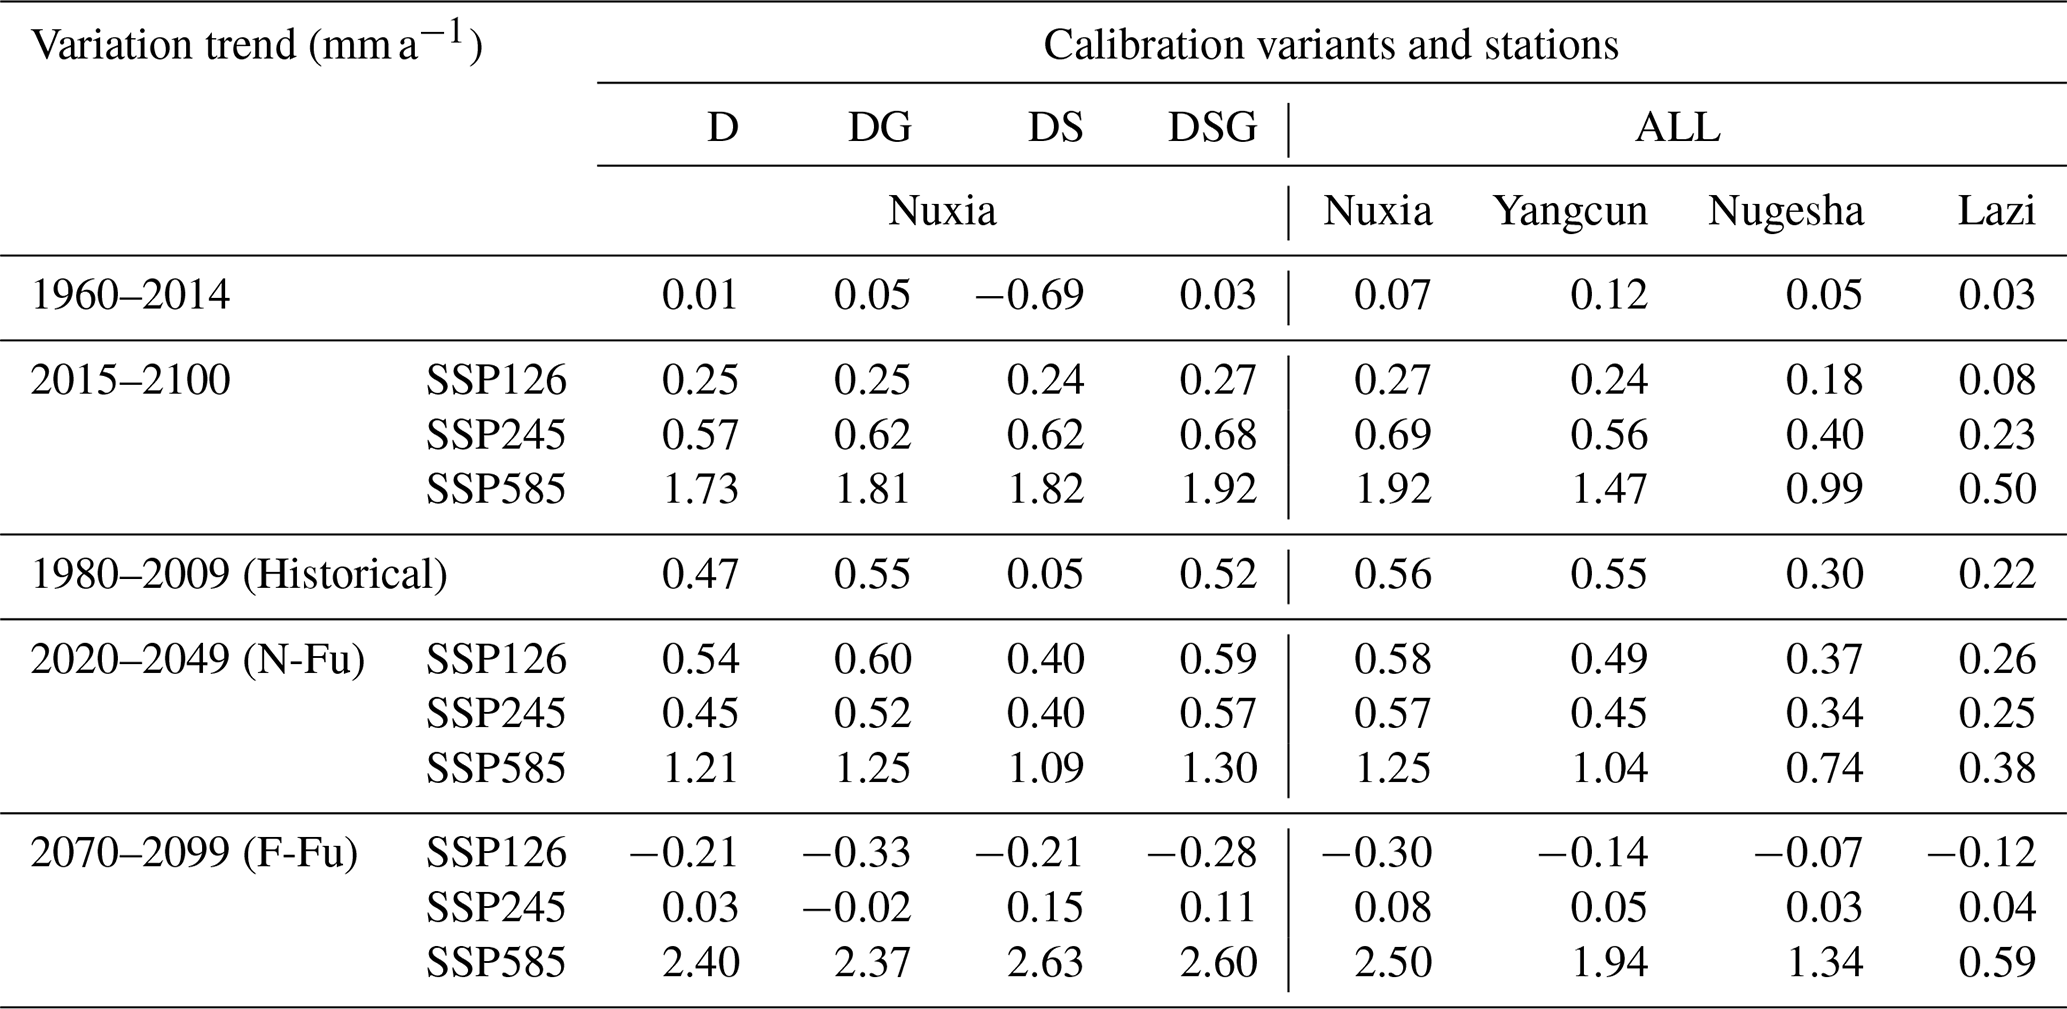
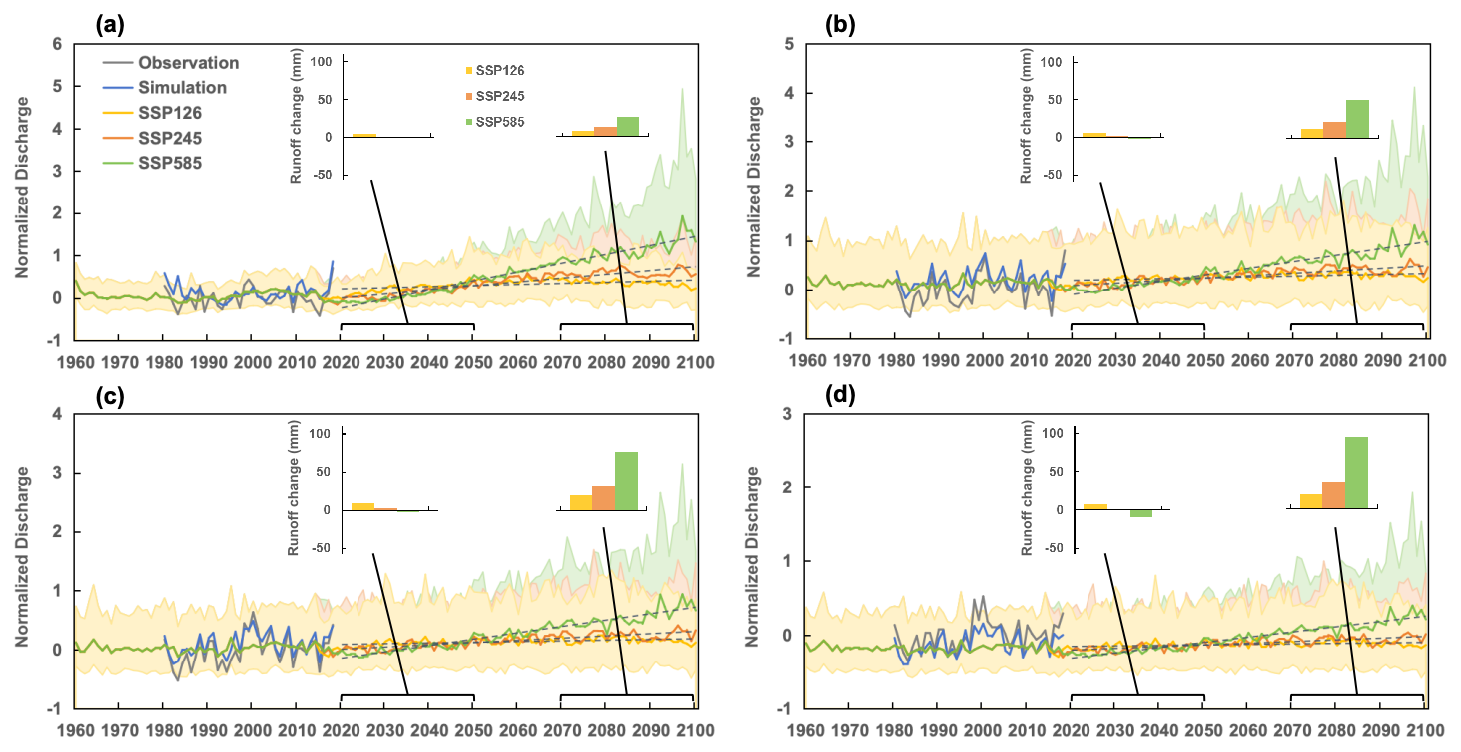
Figure 10Average annual discharge simulated with 10 CMIP6 GCMs during 1960–2100 at four stations in the YTR basin using the calibrated model with the ALL calibration variant: (a) Lazi, (b) Nugesha, (c) Yangcun, and (d) Nuxia. The gray line is the observed value, the blue line is the simulated value in calibration, and the shaded area indicates the deviations of 10 GCMs' data.
Despite the similar future trend in total streamflow, the changes in its components were different among variants, as shown in Fig. 11. With rising precipitation and temperature, the contributions of both snowmelt and glacier melt will decrease in the future. The decreasing trend in snowmelt/glacier melt runoff was more rapid in the variants estimating higher contributions of the corresponding runoff component. The amounts and contribution proportions of snowmelt and glacier melt runoff exhibited a significant decreasing trend, regardless of the calibration variants and SSP scenarios used. Decreasing snowmelt runoff was due to the reduced snowfall caused by climate warming, while reduced glacier melt runoff indicated that the effect of shrinking glacier areas was more dominant than the acceleration of glacier melting caused by global warming. For instance, in calibration variant DSG, the glacier area in the YTR basin by the end of 2100 was only about 37 %, 33 %, and 25 % of that in the 2010s under the three respective SSP scenarios.
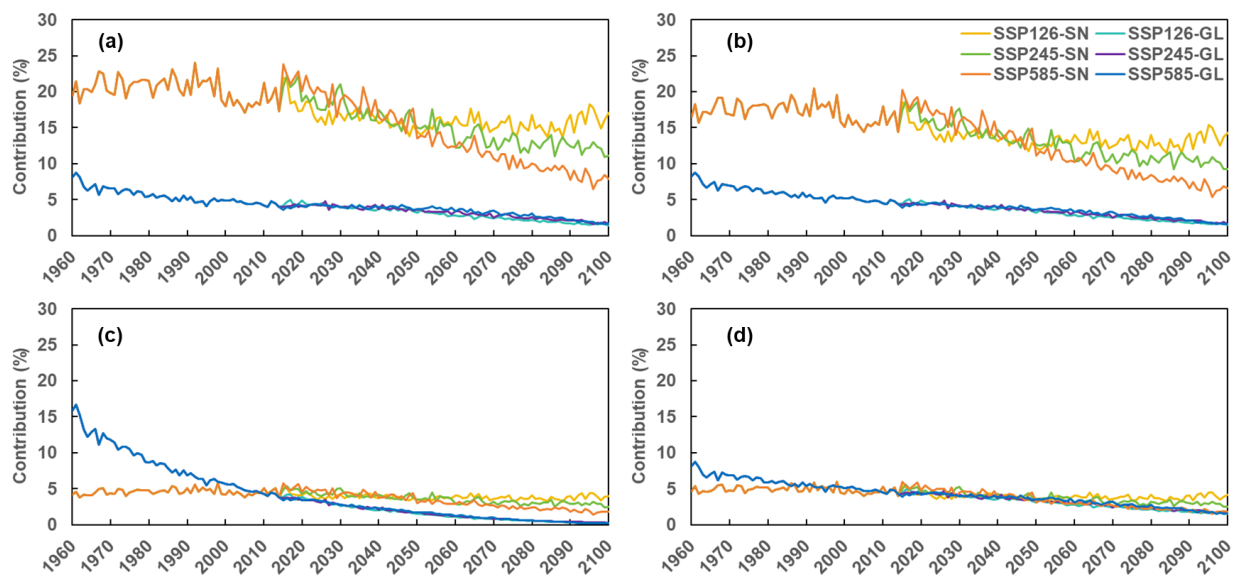
Figure 11Average annual snowmelt runoff and glacier melt runoff simulated with 10 CMIP6 GCMs during 1960–2100 at Nuxia station using the calibrated model with four calibration variants: (a) D, (b) DG, (c) DS, and (d) DSG. The abbreviations SN and GL represent snowmelt and glacier melt runoff, respectively.
More visible results regarding the changes in various runoff compositions can be seen in Figs. 12 and 13, which show the relative changes in annual discharge and different runoff components at Nuxia station under the three SSP scenarios in the near-future (2020–2049) and far-future (2070–2099) periods, respectively, compared with the historical period (1980–2009) estimated using four calibration variants. The reduction in snowmelt runoff was most notable under the SSP585 scenario in the far-future period due to the most significant increase in temperature, while the reduction in the glacier melt runoff did not differ that significantly under the different SSP scenarios. The contribution of meltwater in the DSG variant was relatively small, so the decrease in meltwater runoff due to the rising temperature played a less significant role, and the increase in total runoff in the future was more significant compared with other calibration variants, which was also reflected by the more significant variation trends in streamflow in the DSG variant (Table 10). The most significant decrease in streamflow was estimated by the DS calibration variant. DS estimated the highest contribution of glacier melt runoff among the variants, which seemed counterintuitive; however, this is because of the most significant shrinkage of glacier coverage area caused by the fast glacier melting rate compared with other variants. Specifically, the glacier area simulated by the DS variant in the YTR basin by the end of 2049 was only about 40 % of that in the 2010s under the SSP245 scenario, while this proportion was approximately 68 % for the DSG variant.
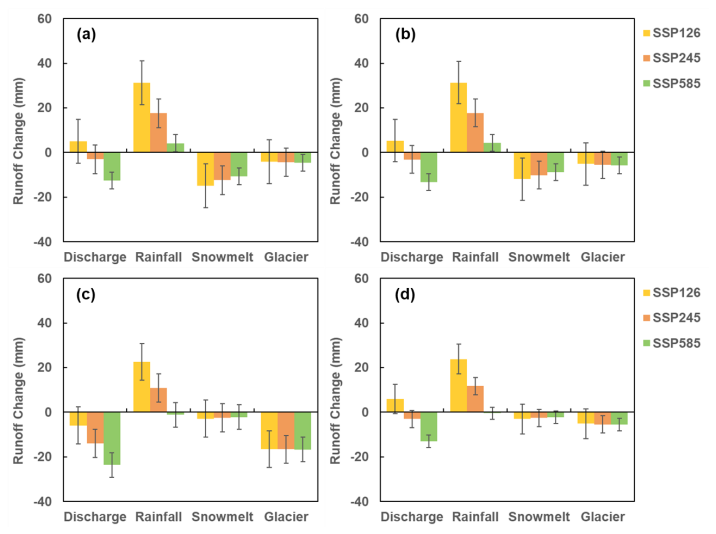
Figure 12Relative changes in the annual discharge and different runoff components at Nuxia station under three SSP scenarios in the near-future period (2020–2049) compared with the historical period (1980–2009) estimated using four calibration variants: (a) D, (b) DG, (c) DS, and (d) DSG”. Error bars represent 1 standard deviation.
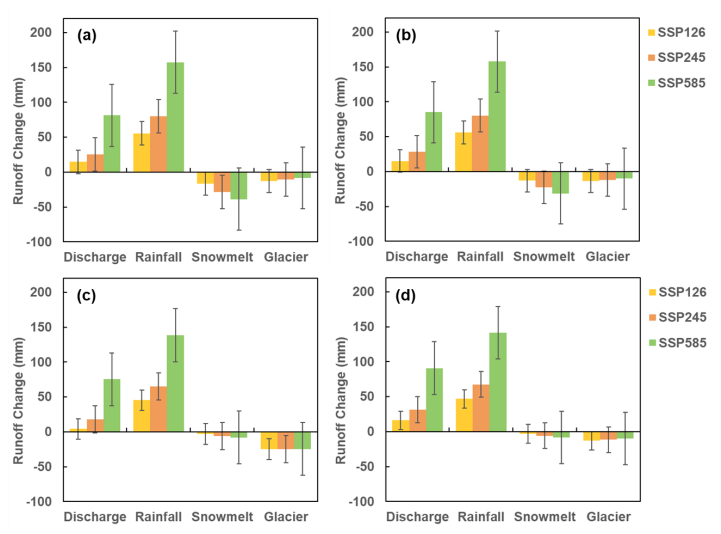
Figure 13Relative changes in the annual discharge and different runoff components at Nuxia station under three SSP scenarios in the far-future period (2070–2099) compared with the historical period (1980–2009) estimated using four calibration variants: (a) D, (b) DG, (c) DS, and (d) DSG. Error bars represent 1 standard deviation.
Figure 14 presents the average contributions of different runoff components to discharge at Nuxia station in different periods under the SSP585 scenario estimated by four calibration variants. The contributions of runoff components in the historical period estimated by the model driven by the bias-corrected CMIP6 data were similar to those from the model driven by the original input dataset (CMFD and ERA5), as illustrated by the “Sim” and “His” columns, respectively. Under the most extreme scenario (i.e., SSP585), the sum contribution of snowmelt and glacier melt runoff could decrease from 10 % to less than 5 % using calibration variants DSG and DS (Fig. 14a and c), while it could decrease from over 20 % to less than 10 % in variants DG and D (Fig. 14b and d), in which the contribution of glacier melt runoff would only be about 1 %–2 % under the SSP585 scenario in the far-future period. Because of the high contribution of rainfall runoff, increasing precipitation was the determining factor causing the rise in future runoff in the YTR basin, and rainfall runoff would also play a more dominant role in the total runoff in the near- and far-future periods compared with the historical period.
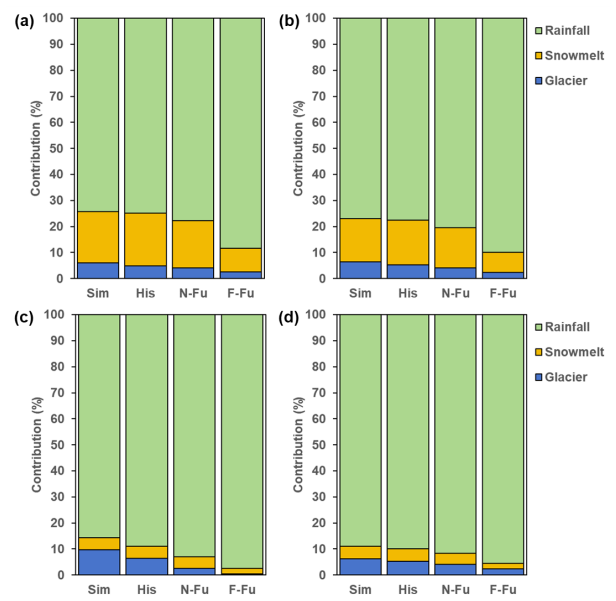
Figure 14Contributions of different runoff components to discharge at Nuxia station in the calibration period (i.e., 1980–2018, represented by “Sim”), the historical period (1980–2009, represented by “His”), the near-future period (2020–2049, represented by “N-Fu”), and the far-future period (2070–2099, represented by “F-Fu”) under the SSP585 scenario estimated using four calibration variants: (a) D, (b) DG, (c) DS, and (d) DSG.
For intra-annual variations, Fig. 15 shows the relative changes in the annual and seasonal discharge and different runoff components at Nuxia station under the SSP585 scenario in the far-future period compared with the historical period estimated by four calibration variants. With respect to the different calibration variants, the similar result was that the reduction in snowmelt runoff (the orange column) in the far-future period was most remarkable in spring and summer, while the decrease in glacier melt runoff (the green column) was most significant in summer. The DG calibration variant estimated the most significant decreasing snowmelt runoff in spring (−63.1 mm, −35.8 %), whereas variant D estimated the most significant decreasing snowmelt runoff in summer (−71.3 mm, −78.1 %). The annual decrease in summer glacier melt runoff was most marked in variant DS (−75.0 mm, −92.0 %). Meanwhile, despite the decreasing snowmelt and glacier melt runoff, the discharge in the YTR basin in the far-future period was expected to increase in all four seasons, mainly owing to the increasing rainfall. The rainfall runoff was estimated to increase in the future, evidently in spring, summer, and autumn but especially in summer (>270 mm, ∼25 % in all variants).
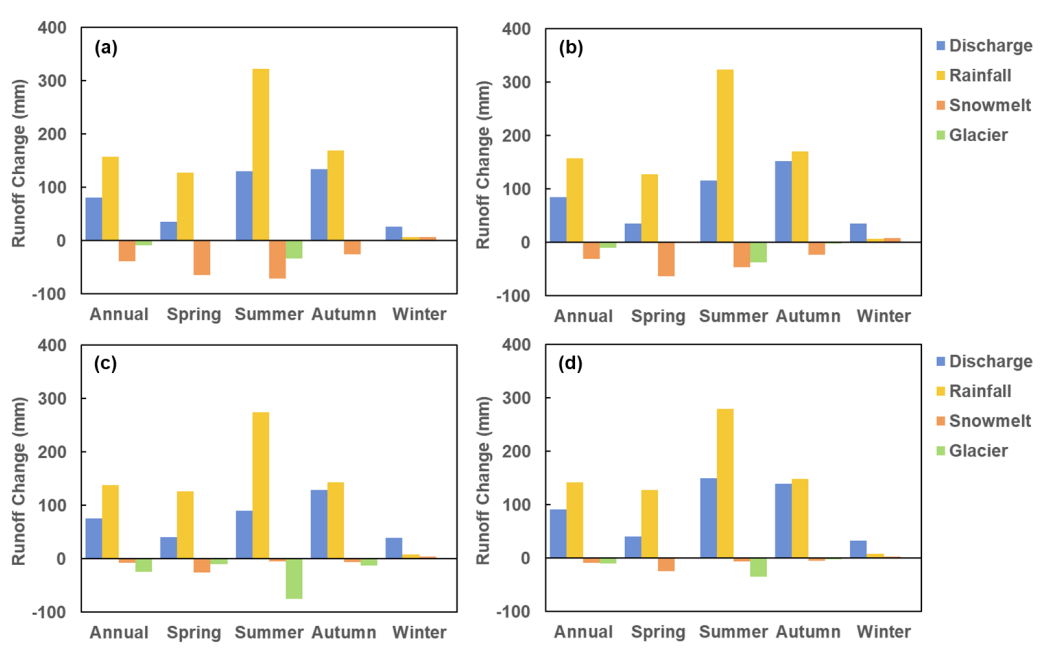
Figure 15Relative changes in the annual and seasonal discharge and different runoff components at Nuxia station under the SSP585 scenario in the far-future period (2070–2099) compared with the historical period (1980–2009) estimated using four calibration variants: (a) D, (b) DG, (c) DS, and (d) DSG.
As for spatial diversity, the changes in different runoff components at upstream stations were further examined. Figure 16 shows the average contributions of different runoff components to discharge in different periods under the SSP585 scenario at all stations in the YTR basin estimated by the ALL calibration variant. Similar to the results at Nuxia station, the contributions of snowmelt and glacier melt runoff at upstream stations all displayed a significant decreasing trend under the SSP585 scenario in the far-future period. Up to the far-future period, the sum contribution of snowmelt and glacier melt runoff could decrease from ∼35 % to ∼10 % at Lazi station, which possessed the highest contribution of melting runoff in the historical period, and from over 10 % to less than 5 % at the other stations (Nugesha, Yangcun, and Nuxia) under the SSP585 scenario. On the whole, the future variations in runoff and its components at upstream stations were consistent with the outlet station.
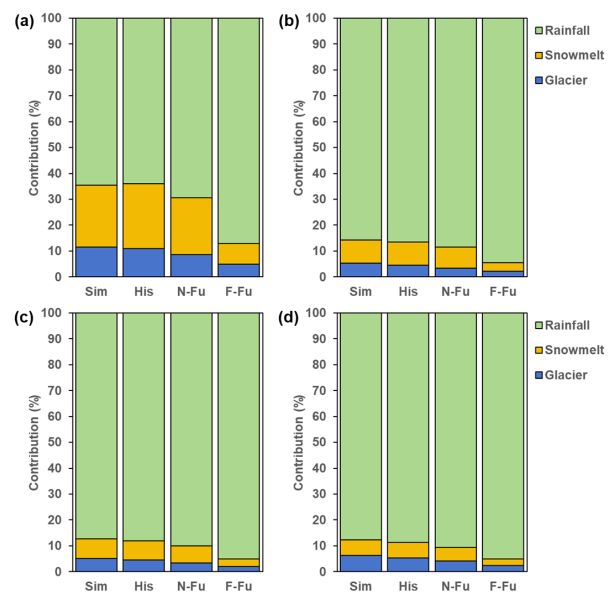
Figure 16Contributions of different runoff components to discharge in the calibration period (i.e., 1980–2018, represented by “Sim”), the historical period (1980–2009, represented by “His”), the near-future period (2020–2049, represented by “N-Fu”), and the far-future period (2070–2099, represented by “F-Fu”) under the SSP585 scenario for four stations in the YTR basin estimated using the ALL calibration variant: (a) Lazi, (b) Nugesha, (c) Yangcun, and (d) Nuxia.
4.1 Influence of the runoff component apportionment on streamflow projection
Four different calibration variants for the whole basin were adopted in this study to examine the effects of various observational datasets on the model simulation; furthermore, the contributions of different runoff components and the future streamflow projected by the model calibrated using each calibration variant were assessed. Compared with the variant utilizing all of the observational data for calibration, the main differences in the other variants could be attributed to two situations: one is the variant with snow unconstrained and the other is the variant with glaciers unconstrained. It was observed that the contribution of snowmelt runoff to discharge was relatively high in the case of unconstrained snow, whereas the contribution of glacier melt runoff was relatively high in the historical period in the case of unconstrained glaciers, which might be overestimated compared with the actual situation. Furthermore, adding the observational datasets of upstream stations to the calibration could further improve the distribution of the model and reduce simulation deviations in different regions within the basin.
For the future projection, the streamflow simulated by models under different calibration variants was generally similar in terms of the interannual variation and average seasonal distribution. However, the overestimate of the contribution of snowmelt and glacier melt runoff could lead to a 5 %–10 % underestimation of the increasing trends in future runoff. The reduction in snowmelt runoff was more marked in the projection under the variant with unconstrained snow, and similar results occurred in the projection under the variant with glacier unconstrained, in which the decrease in glacier melt appeared to be more significant.
The calibration variants had an impact on the variation trend in streamflow in the near-future period and under the low-emission scenario (SSP126), while the impact was not significant in the far-future period or under the high-emission scenarios (SSP245 and SSP585). For all calibration variants, the total streamflow significantly increased in the far-future period, along with the overwhelmingly dominant role of rainfall runoff in the streamflow and the substantially reduced meltwater runoff. Furthermore, the significant decrease in snowmelt and glacier melt runoff as well as their contributions to streamflow in the future also occurred at the upstream stations. Altogether, it is beneficial to utilize more observational data to constrain the model during calibration in order to obtain better simulation results and more accurate contributions of runoff components and to obtain a more reliable projection of future streamflow's change and the changes in various elements.
4.2 Comparison with other studies
Table 11 summarizes the contributions of snowmelt and glacier melt runoff to discharge and future projection results in the YTR basin in both previous studies and this study. Various hydrological models with different characteristics have been used in the hydrological simulation of the YTR basin, including SRM, SPHY, VIC, and CREST, and divergences exist in the results of runoff component apportionment and future streamflow projection. For instance, the contribution of snowmelt and glacier melt runoff to the total runoff both range from less than 10 % to over 30 %. In some studies, the contribution of snowmelt runoff was significantly higher than that of glacier melt (e.g., Zhang et al., 2013, and Su et al., 2016), whereas other studies presented the opposite situation, with glacier melt runoff making a larger contribution than the snowmelt (e.g., Lutz et al., 2014, and Feng, 2020). Moreover, the contributions of snowmelt runoff and glacier melt runoff have been reported to be close in some studies (Chen et al., 2017), while others did not distinguish between the two components or only considered one of them (e.g., Bookhagen and Burbank, 2010, and Gao et al., 2019). Furthermore, some previous studies also carried out future runoff projection in the YTR basin, most of which used the CMIP5 GCMs, and the results of future streamflow changes, including the changes in snowmelt and glacier melt runoff, also differed.
Table 11The contributions of snowmelt and glacier melt runoff to discharge and the future projection results modeled in the YTR basin in previous studies.
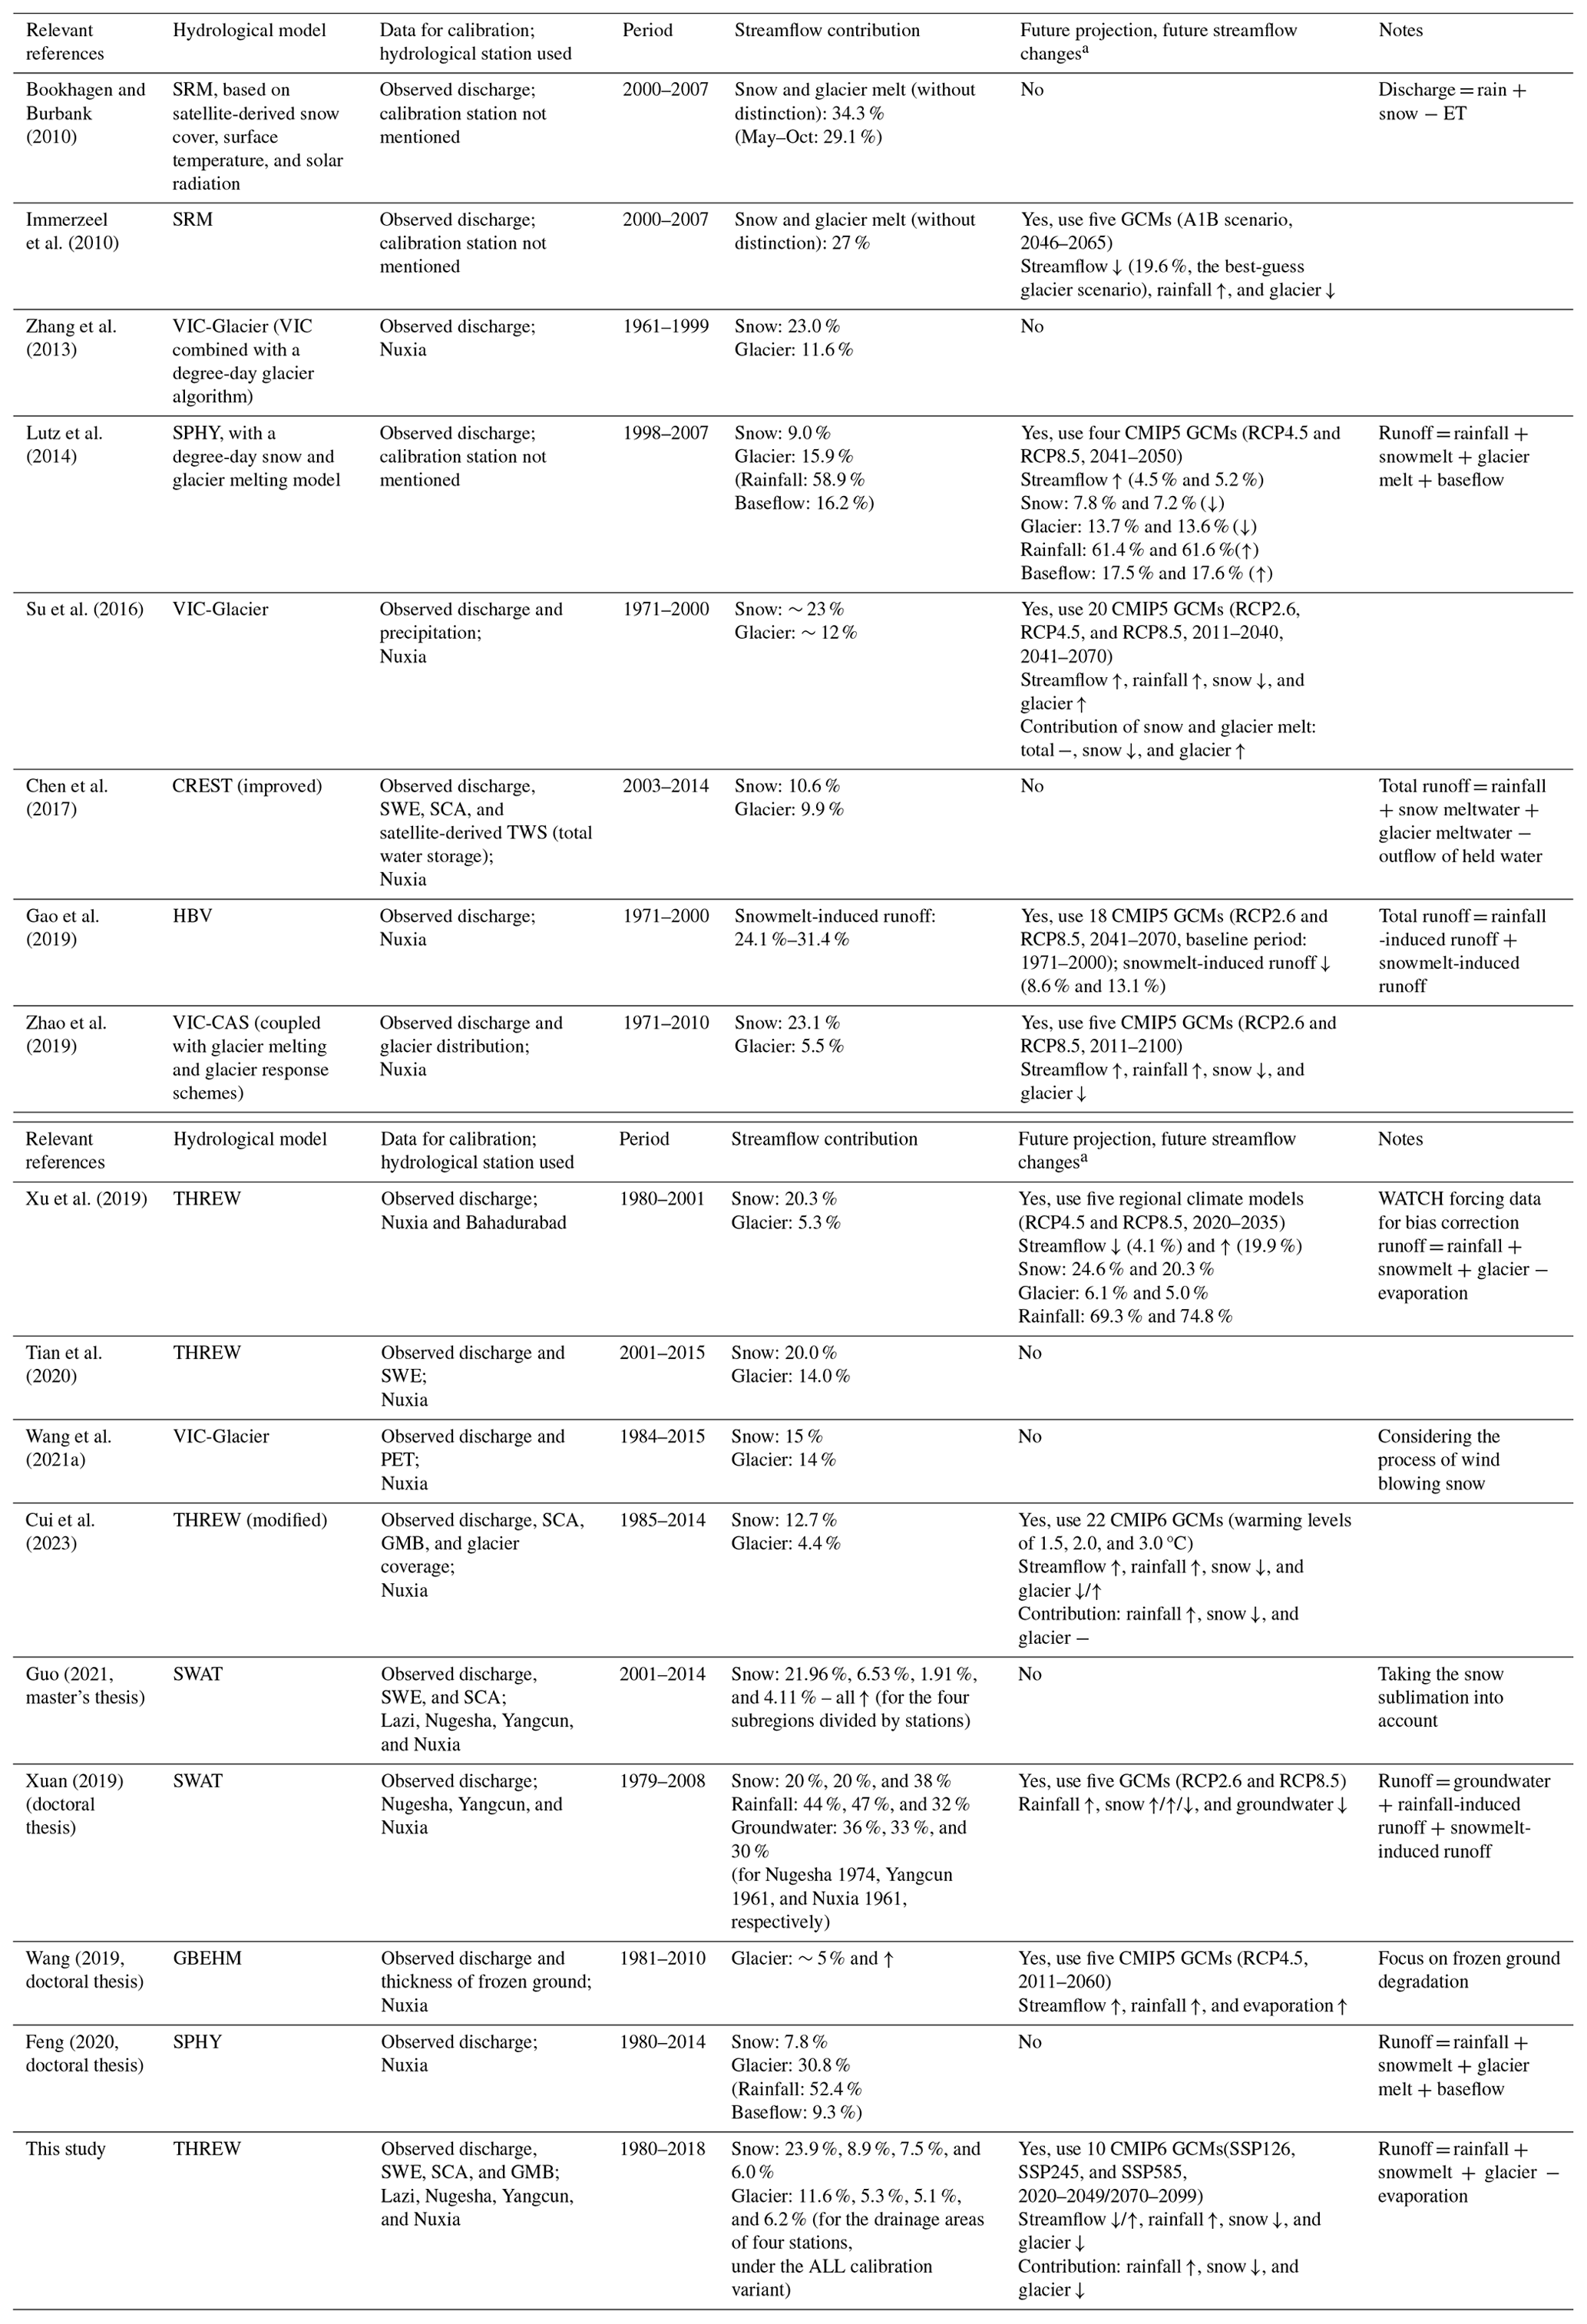
a The notations “↑”, “↓”, and“–” represent an increasing, decreasing, or generally unchanged trend, respectively.
In comparison, the contributions of snowmelt and glacier melt runoff to the total runoff in the YTR basin in our study, constrained by all observational data (discharge, SWE, SCA and GMB), are lower than the results from most previous studies. The divergence of the results could be attributed to several factors. The first and most critical factor is the data used to force and calibrate the model. Constraining the model parameters using the observational datasets related to snow and glaciers could provide confidence in the runoff component partitioning. Our results indicated that calibrating the model without snow depth and glacier mass balance datasets resulted in an overestimation of meltwater, which was consistent with the fact that the studies not adopting these two datasets estimated a much higher contribution of meltwater than our study (e.g., Zhang et al., 2013).
The second factor is the definition of the runoff component. Although the terms “snowmelt runoff” and “glacier melt runoff” were adopted in all of the studies, they actually referred to different things. Our study considered snow and glacier meltwater as input water sources, while the baseflow from groundwater was not considered as a component. This is because the groundwater was fed by infiltrated water, which could be finally tracked to the three water sources. However, some studies regarded the baseflow as a coordinate component with rainfall and meltwater (e.g., Lutz et al., 2014); thus, the rainfall and meltwater runoff in those studies may only refer to the surface runoff induced by the corresponding water source. The results also depended on the equation used to calculate the reported contribution ratio. For example, Chen et al. (2017) adopted a similar definition to us and utilized SCA, SWE, and total water storage datasets to constrain the snow and glacier simulations, but the contribution ratio was about twice that of our results. This is because the aforementioned work calculated the contribution by dividing the meltwater by the total streamflow, which was about half of the denominator adopted in our study (the sum of rainfall, snowmelt, and glacier melt) due to evaporation.
Furthermore, the simulation of snow and glacier processes also influences the runoff component. For instance, if the sublimation during snowfall is not simulated, the contribution of snowmelt runoff may be overestimated. Moreover, the consideration (or omission) of glacier area and how to simulate its changes could also impact the results (e.g., Immerzeel et al., 2010; Lutz et al., 2014, and Gao et al., 2019). If the influence of a reduction in glacier area exceeds that of the acceleration of glacier melting caused by rising temperature, the amount of glacier melt runoff would decrease, thereby affecting the total runoff variation (e.g., Immerzeel et al., 2010, and this study). On the contrary, a situation in which a reduction in glacier area is offset by the acceleration of glacier melting might lead to different streamflow change results (e.g., Lutz et al., 2014).
As for the future projection, in addition to the differences discussed above, the factors affecting the model results also included the differences between CMIP5 and CMIP6 data, whether the GCM data were corrected and the reference for correction, and the chosen projection period. For example, the precipitation was overestimated for WATCH forcing data (WFD) on the TP, and using it for GCM data correction would lead to a higher streamflow in the future (e.g., Xu et al., 2019). Furthermore, the changes in streamflow had different variations during different time periods, as our study presented. Generally, the streamflow exhibited an increasing trend in the far-future period, but the variation might be different in the near-future period (e.g., Immerzeel et al., 2010; Su et al., 2016; and Zhao et al., 2019).
The results were also compared with the studies in other mountainous regions across the world. Streamflow has commonly been projected to increase significantly in mountainous river basins, but the mechanism for the increasing trend could be different. In the YTR basin, where rainfall dominates runoff, the projected runoff is mainly determined by the trend in precipitation. On the contrary, in basins where meltwater contributes significantly to streamflow, the runoff trend is more related to that of temperature, and the runoff might increase, even if precipitation decreases (Slosson et al., 2021). The contribution of meltwater could be especially significant in regions where precipitation and heat are asynchronous, such as the Pamir Mountains and pan-Arctic regions (Pohl et al., 2015; Zhang et al., 2023).
4.3 Limitations and perspectives
This study constructed the distributed hydrological model THREW in the YTR basin and used various calibration variants to compare the constraint effects of different datasets on the model and analyze the streamflow components and future runoff changes estimated under different variants. However, there are still some limitations to the current research that can be further improved in subsequent studies.
Firstly, although the current model reproduced the snow and glacier melting processes well and also considered the sublimation of snowfall, using abundant datasets (observed discharge, SWE, SCA, and GMB) to calibrate it, the calculation of snow sublimation and the conversion of snow depth data to SWE were taken from previous work; therefore, the calculation might be a bit rough. Moreover, more processes and corresponding data could be incorporated into the hydrological processes, such as the contribution of frozen soil.
Secondly, our model calibration procedure focused more on the total streamflow and the overall performance with respect to all objectives, paying less attention to the simulation of extreme events and peak flow processes. The model produced a generally underestimated peak flow, even when using variant D, for which the NSE for streamflow was higher than 0.9. These results are similar to those of some other hydrological modeling studies in the major river basins on the TP (e.g., Su et al., 2023; Xu et al., 2019). Such simulation bias could be due to either the limitation of daily-scale modeling or the uncertainties in the precipitation dataset. Specifically, the mainstream precipitation datasets generally underestimated the precipitation amount on the TP, especially the extreme events, due to the lack of validation toward observational data in high-altitude regions, where the precipitation amount is generally high (Xu et al., 2017; Lyu et al., 2024). Higher-resolution simulation and more accurate forcing datasets would be helpful to improve the simulation of extreme-peak events.
Thirdly, different GCMs showed significant divergence in terms of future precipitation and temperature, even after bias correction, leading to large uncertainty ranges in the projected streamflow (Figs. 9 and 10). For now, the ensemble-average value of the simulated streamflow forced by different GCMs is regarded as the projection result. Although this has been a commonly used method in similar studies (e.g., Cui et al., 2023), the conclusion is highly dependent on the quality of the selected GCMs. Improvements in GCMs and a more comprehensive understanding of the bias characteristics of such models would have been helpful to improve streamflow projections.
Finally, our discussion in this study mostly focuses on the annual discharge at the outlet station of the YTR basin. Although some seasonal characteristics and results at upstream stations have also been mentioned, their analysis is relatively limited. On a more detailed temporal and spatial scale, there would be more complex variations in runoff changes and components. Therefore, subsequent studies could further analyze runoff changes and runoff components in different regions within the basin, as well as their characteristics on a smaller timescale. Moreover, the current study mainly focused on the runoff changes and did not consider more socioeconomic factors. However, by combining more factors for analysis, like the population distribution and water demand situation, more practical conclusions may be obtained.
The distributed hydrological model THREW was constructed in the YTR basin in order to analyze the runoff components and estimate future runoff changes. Different calibration variants were set up to compare the constraint effects of each dataset and their impacts on the results. The main findings are as follows:
-
In the historical periods, no significant changes in annual runoff in the YTR basin were noted over the past 6 decades, with a decrease in annual runoff at upstream stations and an increase at the outlet station. The THREW model constrained by streamflow, snow, and glacier datasets indicated that the contributions of snowmelt and glacier melt runoff to streamflow were relatively low for the whole basin, both accounting for about 5 %–6 %. Concretely, the respective contributions of snowmelt and glacier melt runoff to streamflow were 23.9 % and 11.6 %, 8.9 % and 5.3 %, 7.5 % and 5.1 %, and 6.0 % and 6.2 % for the Lazi, Nugesha, Yangcun, and Nuxia stations.
-
In the future periods, the annual runoff in the YTR basin exhibited an increasing trend; this trend was not significant under the low-emission scenarios (SSP126 and SSP245), whereas it was significant under the high-emission scenario (SSP585) at all stations. The relative change in the annual streamflow depth in the far-future period (2070–2099) compared with the historical period (1980–2009) was 26.6 mm (102.8 %), 50.3 mm (57.7 %), 76.2 mm (51.0 %), and 94.6 mm (39.9 %) at the Lazi, Nugesha, Yangcun, and Nuxia stations, respectively, under the high-emission scenario. Furthermore, the amounts and contributions of snowmelt and glacier melt runoff were found to decrease markedly, with their combined contribution reaching less than 10 % at Lazi station and less than 5 % at other stations in the far-future period under the high-emission scenario.
-
Comparing the results of different calibration variants, it was suggested that using more data to calibrate the model played a vital role in reducing the uncertainty in the hydrological simulation. The simulations of SWE, SCA, and GMB could all exhibit a significant bias due to the lack of corresponding observational data used to constrain the model, resulting in overestimated contributions of snowmelt and glacier melt runoff to streamflow (nearly 17 % and 10 %, respectively) at the outlet station. Moreover, the overestimation of the contribution of meltwater runoff led to an underestimation of the increasing trends in annual runoff (by approximately 5 %–10 %) in the future projection, along with a faster reduction in meltwater runoff.
This study provides a relatively reliable reference for streamflow changes and runoff components during both historical and future periods in the YTR basin, owing to the use of multiple datasets to constrain simulation uncertainties. In the future, the study could potentially be further improved via the incorporation of a more physically based cryospheric module, more accurate input data, and a more comprehensive analysis of streamflow change patterns.
The ERA5-Land data are available from https://doi.org/10.24381/cds.e2161bac (Muñoz Sabater, 2019). Other datasets for this study are publicly available and include the following: CMFD (https://doi.org/10.11888/AtmosphericPhysics.tpe.249369.file, Yang et al., 2019), the glacier inventory (https://doi.org/10.3972/glacier.001.2013.db, Liu et al., 2012), glacier elevation change information (https://doi.org/10.6096/13, Hugonnet et al., 2021a, b), snow depth information (https://doi.org/10.11888/Snow.tpdc.271743, Yan et al., 2021), snow cover information (https://doi.org/10.1016/j.rse.2018.06.021, Chen et al., 2018), the LAI (https://doi.org/10.5067/MODIS/MOD15A2H.006, Myneni et al., 2015), the NDVI (https://doi.org/10.5067/MODIS/MOD13A3.006, Didan, 2015), and soil property information (https://doi.org/10.1029/2019ms001784, Dai et al., 2019). The simulated streamflow, snow water equivalent, snow cover, and glacier mass balance data produced by the model in this work are available from Zenodo: https://doi.org/10.5281/zenodo.11111724 (Nan, 2024).
The supplement related to this article is available online at https://doi.org/10.5194/hess-29-1033-2025-supplement.
MZ and YN conceived the idea and collected the data. MZ, YN, and FT conducted the analysis and wrote the paper.
At least one of the (co-)authors is a member of the editorial board of Hydrology and Earth System Sciences. The peer-review process was guided by an independent editor, and the authors also have no other competing interests to declare.
Publisher's note: Copernicus Publications remains neutral with regard to jurisdictional claims made in the text, published maps, institutional affiliations, or any other geographical representation in this paper. While Copernicus Publications makes every effort to include appropriate place names, the final responsibility lies with the authors.
This study has been supported by the National Natural Science Foundation of China (grant nos. 52309023 and 51825902), the China Postdoctoral Science Foundation (grant no. 2024T170488), and the Shuimu Tsinghua Scholar Program.
This paper was edited by Roberto Greco and reviewed by two anonymous referees.
Bookhagen, B. and Burbank, D. W.: Toward a complete Himalayan hydrological budget: Spatiotemporal distribution of snowmelt and rainfall and their impact on river discharge, J. Geophys. Res.-Earth, 115, F03019, https://doi.org/10.1029/2009jf001426, 2010.
Boral, S. and Sen, I. S.: Tracing “Third Pole” ice meltwater contribution to the Himalayan rivers using oxygen and hydrogen isotopes, Geochem. Perspect. Lett., 13, 48–53, https://doi.org/10.7185/geochemlet.2013, 2020.
Cannon, A. J.: Multivariate quantile mapping bias correction: an N-dimensional probability density function transform for climate model simulations of multiple variables, Clim. Dynam., 50, 31–49, https://doi.org/10.1007/s00382-017-3580-6, 2018.
Chen, X., Long, D., Hong, Y., Zeng, C., and Yan, D.: Improved modeling of snow and glacier melting by a progressive two-stage calibration strategy with GRACE and multisource data: How snow and glacier meltwater contributes to the runoff of the Upper Brahmaputra River basin?, Water Resour. Res., 53, 2431–2466, https://doi.org/10.1002/2016wr019656, 2017.
Chen, X., Long, D., Liang, S., He, L., Zeng, C., Hao, X., and Hong, Y.: Developing a composite daily snow cover extent record over the Tibetan Plateau from 1981 to 2016 using multisource data, Remote Sens. Environ., 215, 284–299, https://doi.org/10.1016/j.rse.2018.06.021, 2018.
Cui, T., Li, C., and Tian, F.: Evaluation of Temperature and Precipitation Simulations in CMIP6 Models Over the Tibetan Plateau, Earth and Space Science, 8, e2020EA001620, https://doi.org/10.1029/2020ea001620, 2021.
Cui, T., Li, Y., Yang, L., Nan, Y., Li, K., Tudaji, M., Hu, H., Long, D., Shahid, M., Mubeen, A., He, Z., Yong, B., Lu, H., Li, C., Ni, G., Hu, C., and Tian, F.: Non-monotonic changes in Asian Water Towers' streamflow at increasing warming levels, Nat. Commun., 14, 1176, https://doi.org/10.1038/s41467-023-36804-6, 2023.
Dai, Y., Xin, Q., Wei, N., Zhang, Y., Wei, S., Yuan, H., Zhang, S., Liu, S., and Lu, X.: A Global High-Resolution Data Set of Soil Hydraulic and Thermal Properties for Land Surface Modeling, J. Adv. Model. Earth Sy., 11, 2996–3023, https://doi.org/10.1029/2019ms001784, 2019.
Didan, K.: MOD13A3 MODIS/Terra vegetation Indices Monthly L3 Global 1 km SIN Grid V006, NASA EOSDIS Land Processes DAAC [data set], https://doi.org/10.5067/MODIS/MOD13A3.006, 2015.
Eriksson, D., Bindel, D., and Shoemaker, C. A.: pySOT and POAP: An event-driven asynchronous framework for surrogate optimization, arXiv [preprint], https://doi.org/10.48550/arXiv.1908.00420, 2019.
Feng, Y.: Changes of glaciers and permafrost in Qinghai-Tibet plateau and their ecological and hydrological effects, PhD thesis, China University of Geosciences, https://doi.org/10.27493/d.cnki.gzdzy.2020.000100, 2020.
Gao, C., Liu, L., Ma, D., He, K., and Xu, Y.-P.: Assessing responses of hydrological processes to climate change over the southeastern Tibetan Plateau based on resampling of future climate scenarios, Sci. Total Environ., 664, 737–752, https://doi.org/10.1016/j.scitotenv.2019.02.013, 2019.
Guo:, R.: Study on snow cover variations and snowmelt runoff modeling in the Yarlung Tsangpo-Brahmaputra River Basin, PhD theis, Yunnan University, https://doi.org/10.27456/d.cnki.gyndu.2021.002615, 2021.
Han, P., Long, D., Han, Z., Du, M., Dai, L., and Hao, X.: Improved understanding of snowmelt runoff from the headwaters of China's Yangtze River using remotely sensed snow products and hydrological modeling, Remote Sens. Environ., 224, 44–59, https://doi.org/10.1016/j.rse.2019.01.041, 2019.
He, Q., Yang, J., Chen, H., Wang, Y., Tang, F., Ji, Q., and Ge, Q.: Study on hydrological regulation function of glaciers in the cold region basins of western China, Journal of Glaciology and Geocryology, 43, 1512–1522, http://www.bcdt.ac.cn/EN/10.7522/j.issn.1000-0240.2021.0102 (last access: 1 January 2024), 2021.
Hugonnet, R., McNabb, R., Berthier, E., Menounos, B., Nuth, C., Girod, L., Farinotti, D., Huss, M., Dussaillant, I., Brun, F., and Kaab, A.: Accelerated global glacier mass loss in the early twenty-first century, Nature, 592, 726–731, https://doi.org/10.1038/s41586-021-03436-z, 2021a.
Hugonnet, R., McNabb, R., and Berthier, E.: Accelerated global glacier mass loss in the early twenty-first century – Dataset, SEDOO [data set], https://doi.org/10.6096/13, 2021b.
Immerzeel, W. W., van Beek, L. P. H., and Bierkens, M. F. P.: Climate Change Will Affect the Asian Water Towers, Science, 328, 1382–1385, https://doi.org/10.1126/science.1183188, 2010.
Jiang, Y., Xu, Z., and Xiong, L.: Runoff variation and response to precipitation on multi-spatial and temporal scales in the southern Tibetan Plateau, J. Hydrol.-Reg. Stud., 42, 101157, https://doi.org/10.1016/j.ejrh.2022.101157, 2022.
Lan, C., Zhang, Y., Zhu, F., and Liang, L.: Characteristics and changes of streamflow on the Tibetan Plateau: A review, J. Hydrol.-Reg. Stud., 2, 49–68, https://doi.org/10.1016/j.ejrh.2014.08.004, 2014.
Li, D., Lu, X., Overeem, I., Walling, D. E., Syvitski, J., Kettner, A. J., Bookhagen, B., Zhou, Y., and Zhang, T.: Exceptional increases in fluvial sediment fluxes in a warmer and wetter High Mountain Asia, Science, 374, 599–603, https://doi.org/10.1126/science.abi9649, 2021.
Li, D. F., Lu, X. X., Walling, D. E., Zhang, T., Steiner, J. F., Wasson, R. J., Harrison, S., Nepal, S., Nie, Y., Immerzeel, W. W., Shugar, D. H., Koppes, M., Lane, S., Zeng, Z. Z., Sun, X. F., Yegorov, A., and Bolch, T.: High Mountain Asia hydropower systems threatened by climate-driven landscape instability, Nat. Geosci., 15, 520–530, https://doi.org/10.1038/s41561-022-00953-y, 2022.
Liu, S., Guo, W., and Xu, J.: The second glacier inventory dataset of China (version 1.0) (2006–2011), National Tibetan Plateau Data Center [data set], https://doi.org/10.3972/glacier.001.2013.db, 2012.
Lutz, A. F., Immerzeel, W. W., Shrestha, A. B., and Bierkens, M. F. P.: Consistent increase in High Asia's runoff due to increasing glacier melt and precipitation, Nat. Clim. Change, 4, 587–592, https://doi.org/10.1038/nclimate2237, 2014.
Lyu, Y., Yong, B., Huang, F., Qi, W. Q., Tian, F. Q., Wang, G. Q., and Zhang, J. Y.: Investigating twelve mainstream global precipitation datasets: Which one performs better on the Tibetan Plateau?, J. Hydrol., 633, 130947, https://doi.org/10.1016/j.jhydrol.2024.130947, 2024.
Muñoz Sabater, J.: ERA5-Land hourly data from 1950 to present, Copernicus Climate Change Service (C3S) Climate Data Store (CDS) [data set], https://doi.org/10.24381/cds.e2161bac, 2019.
Myneni, R., Knyazikhin, Y., and Park, T.: MOD15A2H MODIS/Terra Leaf Area Index/FPAR 8-Day L4 Global 500 m SIN Grid V006, NASA EOSDIS Land Processes DAAC [data set], https://doi.org/10.5067/MODIS/MOD15A2H.006, 2015.
Nan, Y.: Datasets for: The component and future trend of streamflow in the Yarlung Tsangpo River, Zenodo [data set], https://doi.org/10.5281/zenodo.11111724, 2024.
Nan, Y., He, Z., Tian, F., Wei, Z., and Tian, L.: Assessing the influence of water sampling strategy on the performance of tracer-aided hydrological modeling in a mountainous basin on the Tibetan Plateau, Hydrol. Earth Syst. Sci., 26, 4147–4167, https://doi.org/10.5194/hess-26-4147-2022, 2022.
Pettitt, A. N.: A non-parametric approach to the change-point problem, Appl. Stat., 28, 126–135, https://doi.org/10.2307/2346729, 1979.
Pohl, E., Knoche, M., Gloaguen, R., Andermann, C., and Krause, P.: Sensitivity analysis and implications for surface processes from a hydrological modelling approach in the Gunt catchment, high Pamir Mountains, Earth Surf. Dynam., 3, 333–362, https://doi.org/10.5194/esurf-3-333-2015, 2015.
Reggiani, P., Hassanizadeh, S. M., Sivapalan, M., and Gray, W. G.: A unifying framework for watershed thermodynamics: constitutive relationships, Adv. Water Resour., 23, 15–39, https://doi.org/10.1016/s0309-1708(99)00005-6, 1999.
Slosson, J. R., Kelleher, C., and Hoke, G. D.: Contrasting Impacts of a Hotter and Drier Future on Streamflow and Catchment Scale Sediment Flux in the High Andes, J. Geophys. Res.-Earth, 126, e2021JF006182, https://doi.org/10.1029/2021jf006182, 2021.
Su, F., Zhang, L., Ou, T., Chen, D., Yao, T., Tong, K., and Qi, Y.: Hydrological response to future climate changes for the major upstream river basins in the Tibetan Plateau, Global Planet. Change, 136, 82–95, https://doi.org/10.1016/j.gloplacha.2015.10.012, 2016.
Su, T., Miao, C., Duan, Q., Gou, J., Guo, X., and Zhao, X.: Hydrological response to climate change and human activities in the Three-River Source Region, Hydrol. Earth Syst. Sci., 27, 1477–1492, https://doi.org/10.5194/hess-27-1477-2023, 2023.
Tian, F., Hu, H., Lei, Z., and Sivapalan, M.: Extension of the Representative Elementary Watershed approach for cold regions via explicit treatment of energy related processes, Hydrol. Earth Syst. Sci., 10, 619–644, https://doi.org/10.5194/hess-10-619-2006, 2006.
Tian, F., Xu, R., Nan, Y., Li, K., and He, Z.: Quantification of runoff components in the Yarlung Tsangpo River using a distributed hydrological model, Adv. Water Sci., 31, 324–336, https://doi.org/10.14042/j.cnki.32.1309.2020.03.002, 2020.
Tian, F., Li, K., Han, S., Nan, Y., and Yang, L.: Dipole spatiotemporal variations of river runoff in Eastern Tibetan Plateau, Adv. Water Sci., 34, 481–489, https://doi.org/10.14042/j.cnki.32.1309.2023.04.001, 2023.
Wang, L., Liu, H., Bhlon, R., Chen, D. L., Long, J. S., and Sherpa, T. C.: Modeling glacio-hydrological processes in the Himalayas: A review and future perspectives, Geo. Sustain., 5, 179–192, https://doi.org/10.1016/j.geosus.2024.01.001, 2024.
Wang, Y.: Simulation and analysis of changes in frozen ground and hydrology in typical basins of the Tibetan Plateau, PhD thesis, Tsinghua University, https://doi.org/10.27266/d.cnki.gqhau.2019.000058, 2019.
Wang, Y., Xie, X., Shi, J., and Zhu, B.: Ensemble runoff modeling driven by multi-source precipitation products over the Tibetan Plateau, Chinese Sci. Bull., 66, 4169–4186, https://doi.org/10.1360/tb-2020-1557, 2021a.
Wang, Y., Wang, L., Zhou, J., Chai, C., Hu, Z., Zhao, L., Wang, S., and Fan, M.: Impacts of frozen ground degradation and vegetation greening on upper Brahmaputra runoff during 1981–2019, Int. J. Climatol., 43, 3768–3781, https://doi.org/10.1002/joc.8057, 2023.
Wang, Y. W., Wang, L., Zhou, J., Yao, T. D., Yang, W., Zhong, X. Y., Liu, R. S., Hu, Z. D., Luo, L., Ye, Q. H., Chen, N. S., and Ding, H. T.: Vanishing Glaciers at Southeast Tibetan Plateau Have Not Offset the Declining Runoff at Yarlung Zangbo, Geophys. Res. Lett., 48, e2021GL094651, https://doi.org/10.1029/2021gl094651, 2021b.
Xu, R., Tian, F. Q., Yang, L., Hu, H. C., Lu, H., and Hou, A. Z.: Ground validation of GPM IMERG and TRMM 3B42V7 rainfall products over southern Tibetan Plateau based on a high-density rain gauge network, J. Geophys. Res.-Atmos., 122, 910–924, https://doi.org/10.1002/2016jd025418, 2017.
Xu, R., Hu, H., Tian, F., Li, C., and Khan, M. Y. A.: Projected climate change impacts on future streamflow of the Yarlung Tsangpo-Brahmaputra River, Global Planet. Change, 175, 144–159, https://doi.org/10.1016/j.gloplacha.2019.01.012, 2019.
Xuan, W.: Impact of climate change on runoff and components based on semi-distributed hydrological model, PhD thesis, Zhejiang University, https://doi.org/10.27461/d.cnki.gzjdx.2019.002158, 2019.
Yan, D., Ma, N., and Zhang, Y.: A daily, 0.05° Snow depth dataset for Tibetan Plateau (2000–2018), National Tibetan Plateau/Third Pole Environment Data Center [data set], https://doi.org/10.11888/Snow.tpdc.271743, 2021.
Yang, K., He, J., Tang, W., Lu, H., Qin, J., Chen, Y., and Li, X.: China meteorological forcing dataset (1979–2018), National Tibetan Plateau/Third Pole Environment Data Center [data set], https://doi.org/10.11888/AtmosphericPhysics.tpe.249369.file, 2019.
Yao, T., Bolch, T., Chen, D., Gao, J., Immerzeel, W., Piao, S., Su, F., Thompson, L., Wada, Y., Wang, L., Wang, T., Wu, G., Xu, B., Yang, W., Zhang, G., and Zhao, P.: The imbalance of the Asian water tower, Nature Reviews Earth & Environment, 3, 618–632, https://doi.org/10.1038/s43017-022-00299-4, 2022.
Zhang, L., Su, F., Yang, D., Hao, Z., and Tong, K.: Discharge regime and simulation for the upstream of major rivers over Tibetan Plateau, J. Geophys. Res.-Atmos., 118, 8500–8518, https://doi.org/10.1002/jgrd.50665, 2013.
Zhang, M., Nan, Y., Wu, Y., Ding, Y., Xu, M., and Tian, F.: Streamflow and sediment change of major rivers in the Eastern Tibetan Plateau from 1960 to 2020, Adv. Water Sci., 35, 298–312, https://doi.org/10.14042/j.cnki.32.1309.2024.02.011, 2024.
Zhang, S. Y., Gan, T. Y., Bush, A. B. G., and Zhang, G. X.: Evaluation of the impact of climate change on the streamflow of major pan-Arctic river basins through machine learning models, J. Hydrol., 619, 129295, https://doi.org/10.1016/j.jhydrol.2023.129295, 2023.
Zhang, T., Li, D. F., and Lu, X. X.: Response of runoff components to climate change in the source-region of the Yellow River on the Tibetan plateau, Hydrol. Process., 36, e14633, https://doi.org/10.1002/hyp.14633, 2022.
Zhang, Y., Liu, S., and Ding, Y.: Observed degree-day factors and their spatial variation on glaciers in western China, Ann. Glaciol., 43, 301–306, https://doi.org/10.3189/172756406781811952, 2006.
Zhao, Q., Ding, Y., Wang, J., Gao, H., Zhang, S., Zhao, C., Xu, J., Han, H., and Shangguan, D.: Projecting climate change impacts on hydrological processes on the Tibetan Plateau with model calibration against the glacier inventory data and observed streamflow, J. Hydrol., 573, 60–81, https://doi.org/10.1016/j.jhydrol.2019.03.043, 2019.
Zhou, T., Gao, J., Zhao, Y., Zhang, L., and Zhang, W.: Water Vapor Transport Processes on Asian Water Tower, Bull. Chin. Acad. Sci., 34, 1210–1219, https://doi.org/10.16418/j.issn.1000-3045.2019.11.004, 2019.