the Creative Commons Attribution 4.0 License.
the Creative Commons Attribution 4.0 License.
Spatio-temporal patterns and trends of streamflow in water-scarce Mediterranean basins
Xavier Garcia
Joan Saló-Grau
Rafael Marcé
Antoni Munné
Vicenç Acuña
The issue of water scarcity, exacerbated by climate change and demographic increase, has become a growing concern in many regions throughout the world. Understanding hydrological behaviour to promote resilient and sustainable water management is paramount. Hydrological models that integrate natural processes and anthropogenic alterations of the basin's hydrology are a powerful tool to support decision-making. We developed a SWAT+ hydrological model including stakeholder expert knowledge on water management and introducing a novel calibration and validation approach suitable for heterogeneous basins in space and/or time. We also assessed spatio-temporal patterns and trends of streamflow during the first 2 decades of the 21st century in the Catalan River Basin District, in the western Mediterranean, using a wide variety of indicators to fully characterize the hydrological regime. We calibrated and validated the model using data from 50 gauging stations, verifying the usefulness of the new calibration and validation strategy. Co-development with stakeholders and the integration of expert knowledge, most notably on reservoir operations, helped improve model performance. Results revealed a generalized streamflow reduction, as well as increased dominance of streamflow flashiness and zero-flow recurrence. We also observed differences in seasonal trends, with autumn being the most affected season. These results provide insights into how climate change and anthropogenic pressures are going to keep affecting water resources availability in the future, thus raising the need for sustainable management practices in the Catalan River Basin District, as well as other regions vulnerable to water scarcity.
- Article
(10731 KB) - Full-text XML
-
Supplement
(2262 KB) - BibTeX
- EndNote
Water scarcity, a situation in which freshwater demands exceed its availability due to climatic or non-climatic factors, is a growing concern in many regions, with half the world's population being subject to severe water scarcity (Caretta et al., 2022). The Mediterranean region is already prone to water scarcity due to its intrinsic high inter-annual rainfall variability, but rising demands and climate change, which includes warming at faster rates than the global mean as well as reduced rainfall, will exacerbate this issue (Cramer et al., 2018). Promoting sustainable water resources management is thus vital to address the challenges brought on by the combined effects of climate change, demographic growth, and overexploitation of resources (Zribi et al., 2020).
Identifying and analysing streamflow patterns and trends is of great interest to understand the evolution of hydrologic dynamics under both natural and anthropogenic pressures. However, many studies addressing this topic only use observed flows, which can constrain the spatial interpretation of trends. Hydrological models, on the other hand, can bridge this gap by providing spatially coherent patterns and trends of streamflow (Stahl et al., 2012), including in ungauged basins. At the global level, Gudmundsson et al. (2019) used streamflow observations to identify trends in low, mean, and high flows, and Gudmundsson et al. (2021) verified that observed trends were only reproducible with models if anthropogenic climate change was considered. Both observations and models show a strong and significant decreasing trend of streamflow in the Mediterranean region, while the opposite is observed in northern Europe. This fact is also confirmed in studies at the European level using observations (Blöschl et al., 2019; Masseroni et al., 2021; Stahl et al., 2010) and models (Gudmundsson et al., 2017; Stahl et al., 2012). Local studies have also identified this decreasing trend in the Mediterranean using observations (Folton et al., 2019; Lutz et al., 2016) and models (Llanos-Paez et al., 2023). Many of these studies only focus on trends in annual streamflow, with some also evaluating trends on low, high, and monthly flows. However, none delve into trends informing of key hydrological regime characteristics other than magnitude (i.e. timing, duration, frequency, and rate of change), excluding Folton et al. (2019) and Llanos-Paez et al. (2023), where trends on the duration and timing of low flows and on the duration, timing, and frequency of zero flows are evaluated, respectively.
Hydrological models can also be used to predict water resources availability under different climate and/or management scenarios and thus to identify efficient adaptation measures and support decision-making (Loucks and van Beek, 2017). However, despite their potential contribution to the water management sector, their practical implementation remains a challenge (Pezij et al., 2019). In some cases, the main issue is the lack of active involvement from end-users (i.e. stakeholders and water managers) during the model's implementation process, which can lead to the actual management needs not being addressed by the model or the model's capabilities not being effectively conveyed (Loucks and van Beek, 2017). Co-development with end-users can significantly improve the model through the inclusion of first-hand expert knowledge (e.g. addressing specific needs or simulating more accurate management operations). Additionally, this collaborative approach increases the likelihood of the model being used in the planning and management processes, as end-users become aware of its capabilities and limitations (Højberg et al., 2013; Bots et al., 2011).
Many studies have successfully applied hydrological modelling in watersheds susceptible to water scarcity to characterize streamflow dynamics and evolution (e.g. Swain et al., 2020; Tanner et al., 2022), including in the Mediterranean region (e.g. Brouziyne et al., 2021; De Girolamo et al., 2022). While many studies focus on basins with natural or near-natural flow regimes, it is important to note that larger regulated basins, typically more relevant to water management, are often excluded. Some studies include regulated basins with coupled hydrological–water allocation models (Haro-Monteagudo et al., 2020) or a specific reservoir module (Eekhout et al., 2020). However, these studies perform separate calibrations for the hydrological and the water allocation/reservoir models. Moreover, hydrological calibration either is only performed upstream of the reservoirs or uses naturalized streamflow data. To our knowledge, there are no studies yet involving an integrated model (i.e. a single model including both hydrological and water allocation processes) calibrated in a single process using both natural and altered flow regimes.
Also in relation to the calibration process, most model applications rely on streamflow data from one or a few gauging stations within the basin. This practice, however, constrains the accuracy and practicality of the calibrated model, especially in larger case studies with heterogeneous rainfall regimes, varying elevation, and diverse land uses (i.e. where spatial variability and, often, temporal variability are pronounced). Despite the importance of multi-site calibration for large and/or highly heterogeneous basins being noted, most studies use a limited number of gauging stations, most likely due to data availability (e.g. Pandey et al., 2020; Wang et al., 2012; Wi et al., 2015).
Moreover, the division of data into calibration and validation periods can significantly affect model results. This highlights the importance of selectively choosing those periods, despite the fact that in most studies it is done arbitrarily (Myers et al., 2021), allocating either the first or last recorded years for calibration and the rest for validation. Although generally it is recommended that both periods are statistically similar (Abbaspour et al., 2018; Dakhlaoui et al., 2019), using distinctly different periods can also be interesting depending on the intended use of the calibrated model, specifically, when the model is to be applied to future climate and/or land use change scenarios (Daggupati et al., 2015). An alternate approach is to randomize the data splitting to obtain a calibrated model that can be accurately used under conditions that are both similar to and different from those of the calibration period, as well as ensuring that the model performance is not biased by the allocation of data (Daggupati et al., 2015; Bennett et al., 2013). This is of particular interest for watersheds with spatio-temporally heterogeneous gauging data, as each individual record presents different lengths and hydrological characteristics. Selectively choosing the calibration and validation period for each gauging station may be challenging, but the random approach effectively ensures that all spatio-temporal variability is captured across all stations provided that enough data are available. However, this has not been explored before in large-scale applications with many gauging stations, as generally only calibration is performed (Chawanda et al., 2020), or the last period of years of the record is arbitrarily chosen for validation without considering the statistical similarity (or dissimilarity) between the two periods (Abbaspour et al., 2015; Piniewski and Okruszko, 2011).
The objective of this research is to develop a hydrological model to identify and characterize spatio-temporal patterns and trends of streamflow in Mediterranean basins during the first 2 decades of the 21st century. The resulting model can also serve as a valuable tool in the water management sector, as it integrates both physical and anthropogenic processes, including expert knowledge of management operations. We also introduce a novel calibration and validation strategy, which overcomes the limitations of conventional approaches, particularly when dealing with relatively large modelling studies involving numerous and spatio-temporal heterogenous gauging stations. Moreover, this new approach can deal with records differing in length and/or with significant gaps, as it determines calibration and validation periods for each gauging station individually. The widely employed hydrological model Soil Water and Assessment Tool (SWAT) is used, more particularly its revised version SWAT+ (Bieger et al., 2017). This research contributes to deepen our understanding of how water-scarce Mediterranean basins behave under changing climatic conditions and anthropogenic pressures. It also provides valuable insights into modelling improvements achieved by promoting co-development with end-users and introducing a novel calibration and validation approach.
2.1 Study site
The study was performed in the Catalan River Basin District (CRBD), located in the northeastern part of the Iberian Peninsula (western Mediterranean). It covers an area of over 16 000 km2, comprising several small-/medium-sized river basins, and it is managed as a single river basin district by the Catalan Water Agency. However, for this study only part of the CRBD is considered, including the Llobregat, Ter, Fluvià, Besòs, Tordera, and Foix basins (Fig. 1). This selection was based on data availability and the overall significance of these basins, as they host most of the water resources and demand in the region.
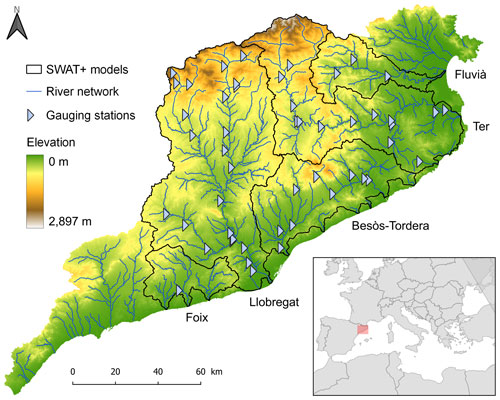
Figure 1Location of the CRBD in the western Mediterranean. The study area has been divided into five SWAT+ models, named after its main river basin.
The elevation within the CRBD ranges from 0 to 2910 m a.s.l. Almost 60 % of the area is covered by forests, mainly coniferous, although in the eastern basins broad-leaved forests are dominant, especially sclerophyll forests. Crops are mainly found in the medium and lower parts of the basins, the most common being barley, wheat, and grapevines. The majority is rain-fed, with only 3.2 % irrigated.
For the period 2001–2022, the CRBD received on average 660 mm of annual precipitation. However, as is characteristic of the Mediterranean climate, there is a high interannual variability, ranging between 480 and 990 mm. There is also a high spatial variability within the CRBD, with annual averages ranging from 900 mm in the Pyrenees to 450 mm in coastal regions.
Water demand within the CRBD exceeds 1000 hm3 yr−1, of which 42 % is for agricultural use, 32 % for domestic use, 10 % for industrial use, and the remaining 15 % for other urban uses (ACA, 2021). Over 7.1 million people live in the CRBD, of which 91 % live within the basins chosen for this study.
2.2 Hydrological modelling with SWAT+
SWAT is a semi-distributed ecohydrological model widely used worldwide (Abbaspour et al., 2015; Gassman et al., 2014; Samimi et al., 2020), including many applications in Mediterranean basins (Boithias et al., 2017; Brouziyne et al., 2021; De Girolamo et al., 2022). The upgraded SWAT+ model offers an improved spatial representation of hydrological processes and interactions within a watershed (Bieger et al., 2017, 2019), as well as more flexibility in defining management schedules and operations using decision tables (Arnold et al., 2018). SWAT+ has also been successfully used in Mediterranean basins (Pulighe et al., 2021; Castellanos-Osorio et al., 2023; Llanos-Paez et al., 2023).
SWAT+ divides the basin into several sub-basins, which can be further divided into landscape units (LSUs; floodplain and upland) and those into hydrological response units (HRUs), the smallest unit at which hydrological processes are simulated. Each HRU consists of the area within a LSU with a unique combination of land use, soil type, and topographic slope (Bieger et al., 2017). Connectivity between spatial objects, including HRUs and LSUs as well as channels, aquifers, and reservoirs, can be adjusted by the user to realistically represent the basin's physical characteristics (Bieger et al., 2019).
2.3 Co-development with end-users
In order to familiarize end-users (i.e. water managers from the Catalan Water Agency, the governing body of the CRBD) with the hydrological model and promote its use as a tool to support decision-making in the CRBD, we have actively involved them in the development of the SWAT+ model from conceptualization to application. The main role of end-users in model development has been to procure data, including weather; streamflow; point source discharges; and, more notably, expert knowledge on actual management practices. This expert knowledge includes real reservoir release operations, which were adapted into custom-built decision tables, as well as irrigation practices, inter-basin water transfers, and urban abstractions. The integration of management practices results in a more accurate hydrological model with the potential use of testing different management scenarios and thus supports better-informed decision-making.
We conducted several meetings with water managers from the Catalan Water Agency to discuss progress on model development, as well as organized SWAT+ training sessions to help them familiarize themselves with the model and its capabilities as a tool to support decision-making.
2.4 SWAT+CRBD inputs and configuration
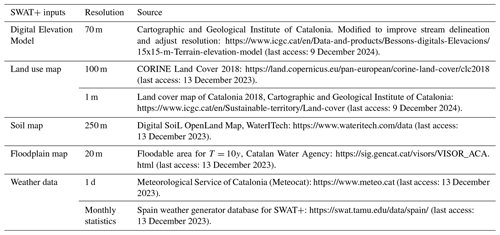
The basic inputs needed to set up a SWAT+ model are a digital elevation model (DEM), land use map, soil map, and weather data. The weather data consist of daily measurements of precipitation, maximum and minimum temperatures, relative humidity, wind speed, and solar radiation, as well as a database of monthly statistics to fill in null values. A floodplain map is also required if the LSUs floodplain and upland within a sub-basin are to be separated. The basic inputs used for the SWAT+CRBD model are listed in Table 1. Additional input data, including reservoir operations, cropland management, and point source discharges and abstractions, were also used to enhance the SWAT+CRBD model.
Table 1SWAT+ input data, resolution, and sources. Weather data include precipitation, maximum and minimum temperature, relative humidity, wind speed, and solar radiation.
2.4.1 Digital elevation model
The original DEM had a resolution of 15 m but was modified to improve the delineation of the river network through plain terrain, as well as resampled to a 70 m resolution. The lower resolution is more reasonable to the extent of the CRBD. A threshold of 5 km2 of drainage area was used for the channel delineation; however the river network was then manually modified by merging or splitting default river reaches generated by the automatic delineation. The criteria used were the official body masses defined by the Catalan Water Agency, as well as other constraints (i.e. gauging stations, wastewater treatment plants (WWTPs), and industrial point source discharges).
2.4.2 Land use data
The land use map was based on the CORINE Land Cover (CLC) 2018 (EEA, 2018) product and adapted to SWAT+ nomenclature. We also used the land cover map of Catalonia (ICGC, 2018) to differentiate between deciduous and sclerophyll broad-leaved forests, as well as more specific crop land uses.
It should be noted that only a static rather than dynamic land use map is considered in this study, and thus we are omitting the effect that changes in land use during the simulation period may have on streamflow, under the assumption that climate and not land use change is the main driver of the hydrological response. To verify this hypothesis, we performed an analysis of the trends in the model residuals (Sect. S1 in the Supplement).
2.4.3 Soil data
We used the Digital SoiL OpenLand Map (DSOLMap), a newly developed soil map at 250 m resolution, with a detailed six-horizon soil profile, specifically tailored to use with the SWAT+ model (López-Ballesteros et al., 2023).
2.4.4 Floodplain map
We used a floodplain map to differentiate between the floodplain and upland LSUs within a subbasin. We used the floodable area for a return period of 10 years, and we complemented it using geomorphological criteria in the sections of the river network where this area was not defined.
2.4.5 Weather data
We used daily data from 141 meteorological stations spread out across the CRBD for the simulation period 2000–2022. We used a 1-year warm-up, as it is the SWAT+ default. Most of the data were provided by the Catalan Water Agency, who previously gathered data from different sources, including the Meteorological Service of Catalonia (SMC), the Spanish Meteorological Agency (AEMET), and the Ebro Basin Water Authority (CHE). Data for the years 2021–2022 are exclusively from the SMC (Table 1).
Not all stations have complete records for the period 2000–2022; therefore, the Spain weather generator dataset for SWAT+ was used to fill daily missing values with monthly statistics (Senent-Aparicio et al., 2021).
2.4.6 Additional data
We included five reservoirs in the SWAT+CRBD model. Each reservoir has its own decision table where the release operations are defined according to actual release rules provided by the Catalan Water Agency. There are five possible release scenarios depending on the reservoir level: water excess, normality, drought alert, exceptional drought, and emergency. In the first case, the reservoir is full, and all daily inputs through the river network are then released. During normality, a fixed daily release rate for every month is defined according to the mean releases from the last 5 years. For the rest of the scenarios, the fixed release rate is decreased according to the drought restrictions defined by the Catalan Water Agency. When possible, the performance of the decision tables was tested in R using real daily inputs and water level, and the estimated fixed release rates for every scenario/month were calibrated to the median value instead.
WWTP discharge and industrial discharge were included in the SWAT+CRBD model by means of point source objects to account for the added volumes to the river network, as in some smaller rivers their influence is considerable. Abstractions for urban use were also accounted for with negative point sources.
We have implemented decision tables to manage crop schedules and operations based on plant growth and soil water content for most of the crops, except for orchards, grape vines, and olive trees, which have a manual harvest operation. Irrigation is also managed by decision tables as well as the water allocation routines native to SWAT+. Irrigated HRUs are grouped into irrigation districts with its own irrigation source (either a channel, a reservoir, or an aquifer) and a threshold to only allow water abstraction if this is exceeded (respectively, environmental flow, minimum volume, and minimum water table). On each simulation day, if water stress in a HRU exceeds a threshold, irrigation demand is defined. We modified the SWAT+ source code so that the irrigation demand is the difference between the potential evapotranspiration and the real evapotranspiration instead of a fixed volume. If an HRU has an irrigation demand and there is enough water in the irrigation district's source, then this HRU is irrigated.
2.5 Sensitivity analysis
We performed a global sensitivity analysis using the variance-based Fourier amplitude sensitivity test (FAST) method (Cukier et al., 1973) using the R packages Fast (Reusser, 2015) and SWATplusR (Schürz, 2022). Variance-based methods are widely used for parameter sensitivity analysis in hydrological models (Song et al., 2015), including SWAT (Guse et al., 2014) and SWAT+ (Llanos-Paez et al., 2023) applications.
For the Llobregat and Ter models, we performed the sensitivity analysis with 30 parameters (Table 2), while for the rest of the SWAT+ models we used 28, as the last two parameters are related to reservoirs, and either these models do not include reservoirs (Besòs–Tordera, Fluvià), or gauging stations are located upstream (Foix). We ran 5763 simulations for the Llobregat and Ter models and 4795 for the rest, as the number of iterations required to determine the sensitivity indices is related to the number of parameters. We used the objective function Kling–Gupta efficiency (KGE) (Gupta et al., 2009) and considered a parameter sensitive if their partial variance accounted for more than 1 ‰ of the total (Table 2).
Table 2Parameters used in the sensitivity analysis. For “pctchg” the parameter is altered by a percentage of the default value, while for “absval” the absolute value is replaced. For each sub-model, bolded variances indicate that a parameter is sensitive. Llob.: Llobregat; B-T: Besòs–Tordera.
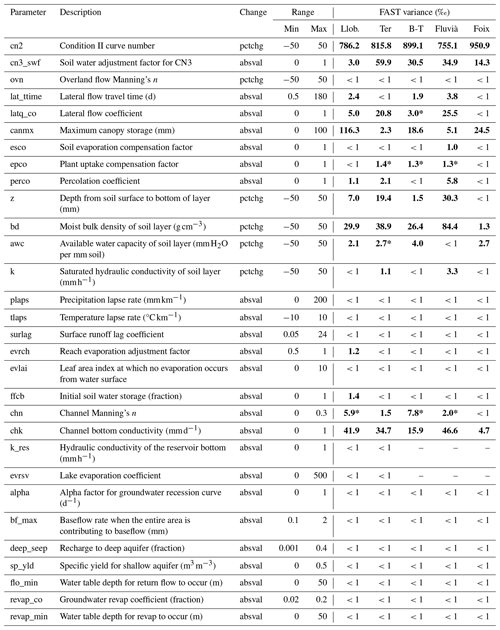
∗ Variance assessed for monthly streamflow. These parameters are considered sensitive even though the daily variance is less than 1 ‰.
2.6 Calibration and validation
We conducted the model calibration with daily streamflow data obtained from 50 gauging stations distributed across the study area. We calibrated each of the five SWAT+ models independently, using 23, 14, 9, 3, and 1 gauging stations for the Llobregat, Ter, Besòs–Tordera, Fluvià, and Foix models, respectively (Fig. 1). The simulation period is from 2001 to 2022; however, many gauging stations present significant gaps in their records. These gaps in data are characterized by variability in terms of record length and temporal distribution throughout the simulation period. Traditional methods to determine calibration and validation periods involve either discretionarily using a period at the beginning or end for validation and the rest for calibration or selecting statistically similar periods. However, due to the spatial and temporal heterogeneity in our gauged data, these methods are not suitable for our study. To address this, we randomly selected the calibration and validation periods for each station independently. Specifically, we allocated 70 % of the records for calibration and reserved 30 % for validation. To prevent numerous alternating periods, we introduced the constraint of a single validation window, which can randomly occur at any point within the station's record. Consequently, this approach resulted in one or two calibration periods and one validation period. We assume that with the random approach all spatiotemporal variability is captured. Moreover, all bias that might arise during the selection of periods is removed.
For each SWAT+ model and its corresponding sensitive parameters (Table 2), we used Latin hypercube sampling to generate 2000 parameter combinations. Only one calibration iteration was performed, as during the sensitivity analysis we already ran many simulations and further iterations were not expected to yield better results. The model performance was assessed by the objective functions KGE and percent bias (PBIAS). We considered that results were “satisfactory” if KGE>0.5 and , “good” if KGE>0.65 and , and “very good” if KGE>0.75 and (Moriasi et al., 2007; Odusanya et al., 2021). We also assessed the 95PPU uncertainty bands and their metrics P-factor and R-factor (Abbaspour et al., 2015, 2018) for representative gauging stations of each main basin (Sect. S2 in the Supplement).
2.7 Trend analysis
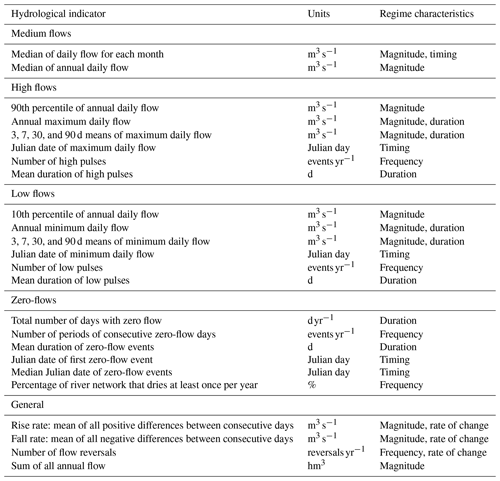
To identify and characterize spatio-temporal patterns and trends of streamflow in the CRBD, we calculated 40 annual hydrological indicators for each of the 999 SWAT+CRBD river reaches, as well as the annual percentage of reaches that dry at least once for the whole river network (Table 3). We used indicators characterizing low, medium and high flows in relation of their magnitude, frequency, duration, timing, and rate of change (Richter et al., 1996; Alcaraz-Hernández et al., 2023), as well as several zero-flow indicators to characterize flow intermittency (Llanos-Paez et al., 2023).
The advantage of using simulated streamflow rather than observed is working with 999 values for each indicator instead of only 50 (gauging stations), which allows us to better observe spatial patterns. Moreover, some gauging stations present gaps for the period 2001–2022, so simulated streamflow also provides a complete temporal series. Nevertheless, we compared the trends in indicators calculated with observed streamflow with the simulated trends at four gauging stations (see Sect. S3 in the Supplement). We found significant observed trends for 20–29 hydrological indicators (50 %–72.5 % of all indicators) and significant simulated trends for 11–23 hydrological indicators (27.5 %–57.5 %). Most of the significant simulated trends (66.7 %–73.3 %) are also significant using the observed flow, and the majority of those (82 %–100 %) are in the same direction (i.e. positive or negative trend). Therefore, while we do not capture all the observed trends with the model, the trends that we do capture are comparable to the observed trends.
We applied a modified Mann–Kendall test (Yue and Wang, 2004) to identify statistically significant temporal trends with a p value lower than 0.05 while accounting for serial autocorrelation. The Theil–Sen estimator (Theil, 1992; Sen, 1968), hereby referred to as only Sen's slope, was employed to assess the magnitude of trends. Sen's slopes for indicators with units of volume (hm3) or flow (m3 s−1) were standardized to remove the stronger influence of river segments with higher streamflow and thus avoid a skewed interpretation of spatial patterns. These methods have been widely used in hydrology to identify and quantify trends, as demonstrated in prior studies (e.g. Clavera-Gispert et al., 2023; Gudmundsson et al., 2017; Khorchani et al., 2021).
3.1 Sensitivity analysis
The FAST sensitivity analysis identified in each SWAT+ model between 6 and 13 sensitive parameters (Table 2). Most of the sensitive parameters are identified in multiple models, and they are mostly related to surface and plant processes (cn2, cn3_swf, canmax, epco), soil processes (latt_ttime, lat_co, esco, perco, z, bd, awc, k), and channel processes (chn, chk).
3.2 Calibration and validation
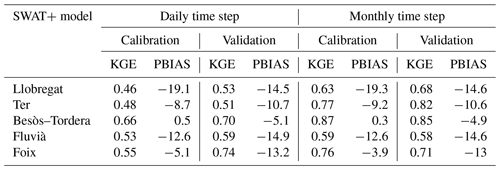
The comparisons between observed and simulated streamflow for representative gauging stations of the main rivers of the CRBD demonstrate good model performance (Fig. 2; see also Sect. S2 for daily streamflow and 95PPU uncertainty bands). The values of the objective functions overall indicate satisfactory results for both the calibration and validation periods (Table 4). For the validation period, KGE values are satisfactory or above for both the daily and monthly time step, and PBIAS values are good or very good.
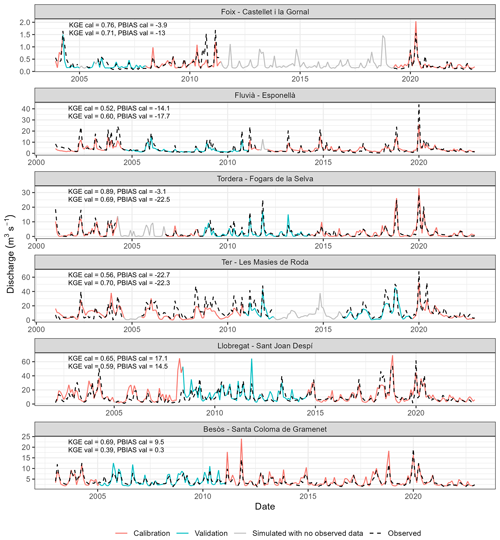
Figure 2Observed and simulated monthly streamflow for the period 2001–2022 in the six main rivers of SWAT+CRBD. Individual KGE and PBIAS values for both the calibration and validation periods are also shown.
3.3 Analysis of spatial and temporal patterns
The analysis of the simulated streamflow for the period 2001–2022 in the CRBD revealed several spatio-temporal patterns and trends (Figs. 3–8).
Figure 3 shows the evolution of the percentage of river segments that dry at least once a year for the period 2001–2022. We observe a drying tendency in the CRBD, which can be positively correlated to an increase in mean annual temperature (Table 5). However, while individual annual percentages negatively correlate with mean annual rainfall (Pearson's , p<0.05), there is no significant decreasing trend in the latter (Table 5).
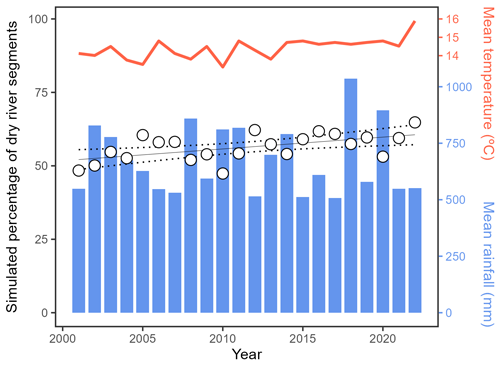
Figure 3Evolution of simulated annual percentage of river segments that dry at least once a year, as well as observed mean annual rainfall and temperature.
Table 5Analysis of trends for the annual percentage of dry river segments, mean annual temperature, and mean annual precipitation. Significant trends are marked in bold (p value<0.05). Slope units are % yr−1, °C yr−1, and mm yr−1, respectively. LR: linear regression. MK: Mann–Kendall.

Significant trends in total annual flow show a general decrease, of up to 6 hm3 yr−1, except in the headwaters of the Llobregat basin (Fig. 4). However, this region shows a poorer model adjustment (see discussion in Sect. 4.1), which may compromise the reliability of this result. Figure 4a shows that larger negative trends can be observed along the course of the main rivers, when significant, most notably along the lower course of the Llobregat River but also observed upstream of the reservoirs in the Ter River as well as near the mouths of the Besòs and Tordera rivers. Removing the stronger influence of reaches with higher flows, standardized Sen's slopes show that the larger relative negative trends can be observed in smaller tributaries (Fig. 4b).
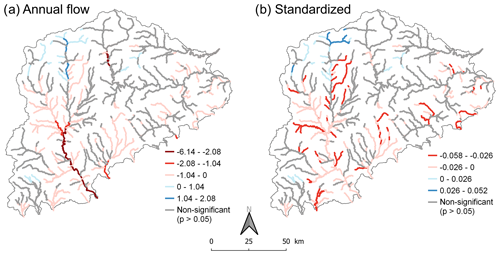
Figure 4Spatial distribution of Sen's slope (a, units hm3 yr−1) and standardized Sen's slope (b, units yr−1) for the hydrological indicator total annual flow.
Significant trends in median flow are most generally negative, both in annual (Fig. 5a) and seasonal (Fig. 5b–e) median flows, the Llobregat basin being the most clearly affected. Autumn is the season with the most widespread negative trends (Fig. 5e). Positive trends are not as dominant and are generally located in the headwaters, while lower regions of the Ter basin also show positive trends during winter (Fig. 5b).
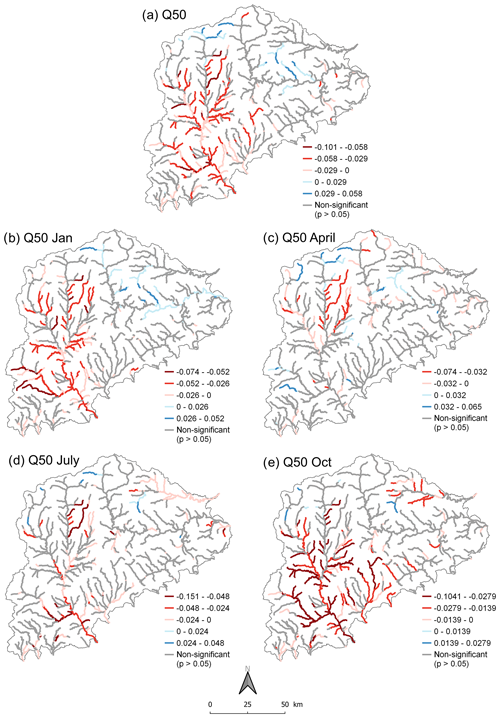
Figure 5Spatial distribution of standardized Sen's slope (units yr−1) for the hydrological indicators annual Q50 (a) and Q50 in January (b), in April (c), in July (d), and in October (e), representative of the different seasonal flow patterns.
Negative trends in the magnitude of high flows (90th percentile) are also consistently dominant, although some significant positive trends can also be found mainly in the headwaters of the Llobregat basin (see discussion in Sect. 4.1), as well as some other river segments in the Ter and Fluvià basins (Fig. 6a). However, for low flows (10th percentile), most river segments do not present significant trends (Fig. 6b), primarily because the 10th percentile threshold is zero in many of these segments. The few significant trends are mostly negative and located in the lower sections of the Llobregat and the Besòs basin. Conversely, positive trends can be observed in the headwaters of the Fluvià basin and downstream of the reservoirs in the Ter basin.
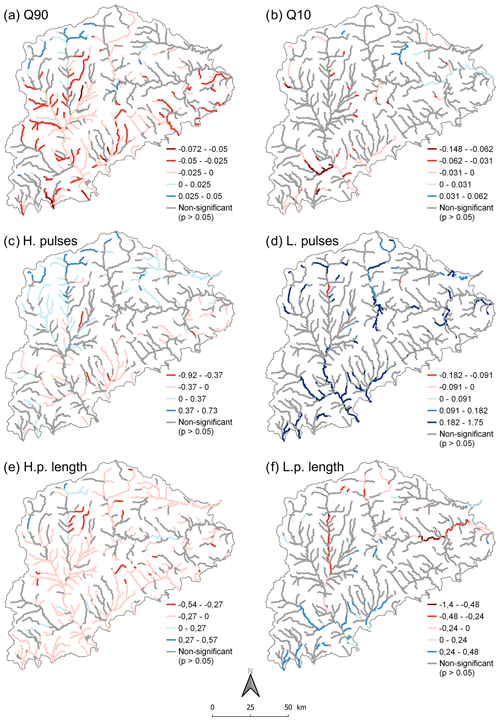
Figure 6Spatial distribution of Sen's slope for the hydrological indicators Q90 (a), Q10 (b), number of high and low flow pulses (c, d), and their mean duration (e, f). Sen's slopes for Q90 and Q10 are standardized (a, b, units yr−1), while the units for the other indicators are number of events yr−1 (c, d) and d yr−1 (e, f).
Concerning the frequency of high- and low-flow events, we observe a distinct spatial pattern for the number of high-flow events per year, with positive trends in the north (Pyrenees headwaters) and negative trends in the southern/coastal regions (Fig. 6c). Trends for the number of low-flow events are generally non-significant, but segments with significant trends show an increase in annual episodes (Fig. 6d). The mean duration of high-flow events generally decreases across the entire study area (Fig. 6e), while significant trends for the mean duration of low-flow events show a decrease in the Pyrenees/northern regions and an increase in the Besòs, Foix, and lower Llobregat basins (Fig. 6f).
Despite the general decrease in high flows in the Llobregat basin, the annual maximum daily flow shows an overall positive trend. In other basins, trends vary, with some displaying mixed patterns (Besòs, Foix) and others primarily characterized by non-significant trends or limited negative trends.
Zero-flow indicators complement and expand the information that is not captured with low-flow indicators, as most of the river network shows some degree of intermittency. The number of days with zero flows per year has notably increased, with Sen's slopes of up to 11 d yr−1 in many segments in the Llobregat and Besòs basins (Fig. 7a). There are very few segments, all tributaries of the Ter River, with a decrease of zero-flow days. Trends in the mean duration of zero-flow events show mixed results, but a slight tendency towards shorter and longer zero-flow events can be observed in the southern and northeastern regions, respectively (Fig. 7b). We observe a general tendency towards an earlier onset of zero flows, on the scale of several days and up to a week per year (Fig. 7c), while more mixed results can be observed for the central point of zero flows (Fig. 7d).
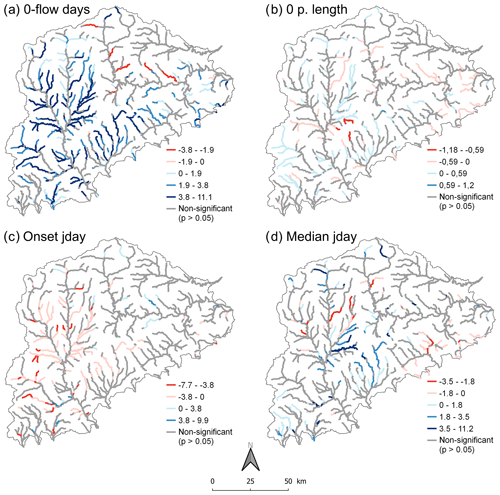
Figure 7Spatial distribution of Sen's slope for the hydrological indicators total annual days with zero flow (a), mean duration of zero-flow pulses (b), Julian day of first zero flow (c), and median Julian day of zero flows (d). Sen's slope units for all indicators are d yr−1.
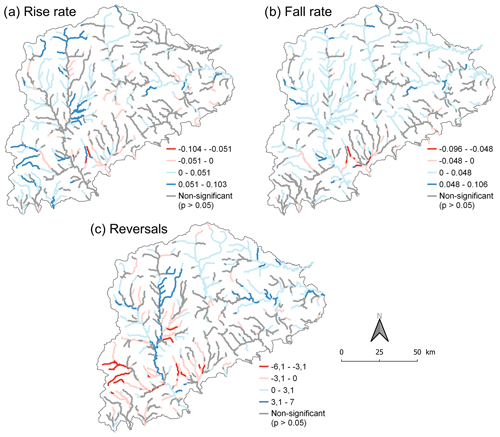
Regarding trends in hydrological indicators informing of the rate of change, there is a clear tendency towards increased rise (Fig. 8a) and fall (Fig. 8b) rates, except for the Besòs basin. The number of reversals tends to increase in the Pyrenees/northern regions, while the number decreases in the Besòs and Foix basins, as well as some notable tributaries in the Llobregat basin (Fig. 8c).
4.1 Shifting integrative hydrological modelling
Before proceeding with the discussion of the results, several considerations concerning the followed approach should be discussed. As highlighted in the Introduction, the incorporation of anthropogenic activities in hydrological modelling plays a crucial role in accurately capturing watershed dynamics and supporting decision-making. We integrated anthropogenic activities in our SWAT+ model such as crop scheduling, irrigation, urban water abstractions, discharges from wastewater treatment plants and industries, water transfers between basins, and reservoir release operations. The last one is especially important due to the profound impact of reservoirs on natural flow regimes regarding both timing and magnitude. We used expert knowledge on how releases are managed to construct custom decision tables for each reservoir. However, actual releases depend on other factors besides the ones that can be included in decision tables, such as hydropower demand and preventive releases for flood risk mitigation. As a result, our approach approximates real management operations, much like the other anthropogenic factors in our model, which are also based on estimations and generalizations. Another consideration on model inputs is the fact that land use change during the simulation period is not considered in our study, due to having determined that land use change (and in particular afforestation) is not a main driver of hydrological response for the scope of this study (Sect. S1). However, it can still be an important factor at the local scale, and its consideration represents an opportunity for future management practices. Forest cover can be managed to reduce “green water” (i.e. water stored in the soil and vegetation and that is then consumed) and turn it into “blue water” (i.e. runoff), increasing water availability in potential areas suffering from water scarcity. Garcia et al. (2024) used the SWAT+ CRBD model to assess the effect of forest thinning on water yield, and results highlighted the potential of forest management to enhance blue water availability.
We introduced a novel approach to unbiasedly determine the calibration and validation periods suitable for case studies where gauging data are abundant but spatio-temporally heterogenous. We consider that, given the high number of gauging stations in our study, randomly determining the calibration and validation periods for each station effectively captures spatio-temporal variability in both periods. In other words, even if the random selection for a specific gauging station leads to a calibration/validation period which does not capture all climatic variability, this variability will be included in other gauging stations, and due to the calibration process being at the basin scale, the model will still account for all variability. Thus, a bootstrapping method to repeatedly resample the calibration and validation periods, which is time-consuming and would imply running many more iterations, is not necessary. However, the validity of this consideration could be further explored in future applications, as well as other approaches based on statistically similarities in cases where gauging data are less abundant and a random split would not be sufficient. Hydrological indicators, such as the ones used in this research to identify trends, or techniques such as persistent homology (Musa et al., 2022), could be used to characterize hydrological behaviour of gauged data and define statistically similar calibration and validation periods. Even though we explored using such methods in our study, it would have required analyses for each individual gauging station, as well as developing a more complex methodology with uniform selecting criteria, and ultimately, we assumed that for our study the random approach would be sufficient to capture the spatio-temporal variability.
The calibration and validation results are satisfactory overall (Table 4), and for many of the gauging stations, however, some gauging stations show poorer results. This might be due to the quality/length of the recorded data and the spatio-temporal distribution of weather stations within the draining area. Some gauging stations present periods with incongruous data, which have been removed, but some less evidently inconsistent data may remain and affect model performance. Moreover, in stations with shorter records, the calibration and validation periods might end up being too different from each other due to the random approach, and this could also affect the performance of individual gauging stations, despite their reduced weight in determining overall results. Another important factor affecting local model performance is the inaccuracy of the default SWAT+ aquifer module in accurately representing hydrogeological processes. The integration of complex hydrogeological processes and their interaction with surface water in hydrological modelling are both required to more accurately simulate watershed dynamics (Frey et al., 2021). Future studies should prioritize the refinement of models to better capture these intricate processes, using, for example, the more advantageous gwflow module for SWAT+ (Bailey et al., 2020). One region with poorer performance, as it has been noted in the results section, is the headwaters of the Llobregat basin, due to it being a mountainous heterogenous area with complex karstic geology, as well as not having enough coverage of meteorological stations to properly capture the complex rainfall distribution.
The last consideration does not concern the model but rather the spatio-temporal analysis of streamflow patterns and trends. A modified Mann–Kendall test was used to account for temporal autocorrelation, but spatial autocorrelation (i.e. the effect that upstream segments have on downstream segments) was not considered in the analysis. We explored the possibility of removing spatial autocorrelation (e.g. using spectral clustering), as it could provide insights into factors influencing streamflow aside from network connectivity, but ultimately, we deemed it non-relevant for the purpose of this paper's analysis. However, further studies could expand on removing spatial autocorrelation as complementary information to conventional analysis.
4.2 Patterns and trends of streamflow
The analysis of patterns and trends of streamflow for the first 2 decades of the 21st century in the CRBD has revealed an overall trend indicating a reduction in water resources availability, which is consistent with other Mediterranean case studies (Clavera-Gispert et al., 2023; Masseroni et al., 2021). Three main messages can be derived from this research's results:
-
We identified a reduction in streamflow as well as an increase in intermittency.
-
Streamflow flashiness has been intensified.
-
Monthly trends reveal that all seasons have not been evenly affected by recent climate change.
4.2.1 Streamflow reduction and increased intermittency
Significant decreasing trends over the CRBD during the first 2 decades of the 21st century have been identified for medium and high flows (Figs. 5a and 6a), as well as total annual streamflow (Fig. 4). The larger absolute decreasing trends in total annual streamflow, between −2.08 and −6.14 hm3 yr−1, are found in the lower Llobregat and in the Ter River upstream of the reservoirs (Fig. 4a). Both of these areas are of notable interest from the water management perspective to supply Barcelona's metropolitan area, the largest urban centre within the CRBD.
There has also been a reduction in high-flow events, except in the Pyrenees/northern region (Fig. 6c), as well as in their duration (Fig. 6e). The regional positive trend in high-flow events is most probably due to complex spatio-temporal patterns of rainfall distribution (Lana et al., 2021) which produce high-flow events, but the rest of the indicators reveal a decreasing trend in water resources availability, and this decreasing tendency has been predicted to continue during the 21st century (Caretta et al., 2022; Marx et al., 2018). Most trends on low-flow and number of low-flow events are not significant (Fig. 6b and d), mainly because the 10th percentile which defines the low-flow threshold is zero in many river segments, but the few significant trends also reveal a decreasing tendency. Zero-flow indicators are more informative, showing an increase in number of days with zero flow (Fig. 7a) and in the percentage of river segments that dry at least once a year (Fig. 3), as well as an earlier annual onset of zero flow (Fig. 7c). This increase in flow intermittency has also been identified in other Mediterranean case studies (Llanos-Paez et al., 2023; Tramblay et al., 2021).
Precipitation in the Mediterranean region is projected to decrease over the following decades, which is expected in turn to decrease water resources availability (Dai et al., 2018; MedECC, 2020). However, in this study we identified a tendency towards flow reduction and increased intermittency, while no decreasing trend in precipitation is observed for the period 2001–2022 (Table 5), although there is a clear inter-annual correlation (Fig. 3). Khorchani et al. (2021), Peña-Angulo et al. (2020), and Vicente-Serrano et al. (2022) have reported similar findings. This implies that factors other than precipitation affect streamflow, such as temperature (and consequently evaporative demand), which in our study does in fact follow an increasing tendency and is also projected to increase in the following decades (Ali et al., 2022; MedECC, 2020).
Land use change has also been identified as an important factor influencing streamflow (Dennedy-Frank and Gorelick, 2020), and numerous studies in the Mediterranean region have explored the impact of these land use changes on streamflow (Buendia et al., 2016; Gallart et al., 2011; Gallart and Llorens, 2004; Khorchani et al., 2021). These studies report a correlation between afforestation in the headwaters and decreases in streamflow. Rural exodus during the second half of the 20th century in the CRBD resulted in the expansion of forests on abandoned cropland and pasture land (Cervera et al., 2019). During the first 2 decades of the 21st century this trend continued, with forested area going from 46 % of our study area in 2000 to 56 % in 2018 (EEA, 2000, 2018). However, climate variability rather than afforestation is usually the main driver of streamflow reduction (Buendia et al., 2016). To confirm whether in our study this assumption is valid, and it is reasonable to exclude these land use changes without compromising model results, we performed an analysis of trends in model residuals (see Sect. S1) using the forested area in 2018 for the whole simulation period. This analysis does not evidence the presence of a factor other than the ones already included in the model affecting the hydrological response and thus justifies the exclusion of land use changes in our study. However, it must be noted that despite not accounting for land use changes per se, we do account for the increase in evapotranspiration due to increased temperatures.
To sum up, the reduction in streamflow observed during the last 20 years in this study allows us to infer that this tendency will continue in the following decades due to the combined effects of climate change, land use change, and rising anthropogenic demands, thus reinforcing the need for sustainable water resources management.
4.2.2 Increased streamflow flashiness
An increase in streamflow flashiness has also been observed. Flashiness refers to the frequency, rapidity, and magnitude of short-term changes in streamflow (daily changes in this study).
Despite the overall tendency towards a reduction in streamflow, the annual maximum daily flow has increased in the Llobregat, Besòs, and Foix basins. Similar results have been found by Bouadila et al. (2020) and Varlas et al. (2023). This trend might be due to increased precipitation extremes events (Ali et al., 2022), which are projected to keep increasing in the following decades in spite of total precipitation reduction (Zittis et al., 2021). Therefore, Mediterranean basins will suffer both from water scarcity and from increased flood risk, making the role of water management even more prominent to defend vulnerable regions.
Changes in annual maximum are not the only evidence of intensified streamflow flashiness. Trends in median rise and fall rate indicate a generalized increase in daily streamflow changes (Fig. 8a and b), and the annual number of reversals also shows a positive trend in most regions (Fig. 8c). All this implies that day-to-day changes in streamflow are both more significant and more frequent, thus increasing flashiness, which can have severe impacts on ecosystem function (Pletterbauer et al., 2018).
4.2.3 Uneven seasonal response to climate change
Most hydrological indicators are calculated and assessed at an annual scale. However, the Mediterranean climate is characterized by marked seasonality with hot, dry summers and mild winters, with most rainfall occurring in autumn and spring. Therefore, in this study we also analysed trends for monthly median flow to characterize intra-annual dynamics and different seasonal patterns.
The most relevant tendency is that of autumn median flows (Fig. 5e), where most significant trends are negative. The Llobregat basin, of special interest for water management, is particularly affected. Trends in winter flows also reveal a notable decrease in the Llobregat basin, but positive trends are observed in northeastern basins (Fig. 5b), which might be a result of reduced snowfall in the Pyrenees due to increasing temperature (Döll and Schmied, 2012). Many spring and summer trends are non-significant, but negative trends prevail (Fig. 5c and d).
Although decreasing trends in streamflow are prevalent for all seasons, their extent and magnitude differ. Autumn is the most affected season, followed by winter and summer, while spring remains almost neutral. The marked reduction in autumn flows, which has traditionally been the wettest season in CRBD, has also been observed in Clavera-Gispert et al. (2023). The extension of summer conditions into autumn, which were exceptionally anomalous in 2022 (Meteocat, 2023), is projected to continue (Spinoni et al., 2018). Delayed rains or a lack of autumn rains puts significant pressure on reservoirs and aquifers, already depleted after dry summers with higher demands, and this exacerbates water scarcity.
4.3 Hydrological modelling in water-scarce regions and implications for water management
Process-based hydrological modelling is a useful tool to characterize water resources availability within a watershed, which then has the potential to support decision-making in the water sector, especially if management operations and infrastructures are integrated into the modelling framework. Climatic and/or management scenarios can be implemented and assessed to project measures to promote sustainable and resilient societies and ecosystems. Integrating the management factor is especially important when modelling water-scarce regions, characterized by both an intrinsic limitation on water resources availability, which can be exacerbated by climate change, and growing demographic pressures.
The Mediterranean has been identified as one of the most critical regions where the issue of water scarcity will be aggravated by climate change (Cramer et al., 2018), to the point of being described as a climate emergency (Bremberg et al., 2022). Therefore, the importance of hydrological modelling to support water resources management will continue to grow, and modellers and managers need to communicate effectively so that hydrological modelling can be successfully integrated into the planning and management processes.
Our approach led to successfully simulating hydrological and anthropogenic processes in water-scarce Mediterranean basins. During model development there was collaboration with water managers from the Catalan Water Agency, the CRBD's authority, who provided valuable first-hand expert knowledge on actual management operations to include in the SWAT+ modelling framework, as well as participating in several follow-up meetings and SWAT+ training sessions. This co-development with water managers improves the quality of the hydrological model in simulating management operations and helps address specific problems and concerns of water managers, while also allowing water managers to get more familiarized with the model's capabilities and its use during planning and management. In particular, the inclusion of expert knowledge on reservoir operations in custom decision tables allows us to simulate real reservoir releases more accurately, and it also provides water managers with an intuitive tool to test different management scenarios and thus supports decision-making on this topic. Past applications of decision tables for reservoir release operations were based on generic rules, which cannot reproduce complex reservoir-specific management guidelines (Chawanda et al., 2020; Arnold et al., 2018), thus limiting their application and reinforcing the need to integrate this expert knowledge to better simulate releases.
The good model performance achieved for the validation period corroborates our assumption that the new strategy proposed to define the calibration and validation periods randomly for each individual gauging station efficiently captures spatio-temporal variability, and it is a good approach when dealing with spatio-temporally heterogeneous basins. However, as discussed in Sect. 4.1, this strategy could be improved using some other criteria to replace the random selection and accounting for statistical similarity between periods.
Future developments should also focus on further improving the integration of anthropogenic pressures and processes into hydrological modelling. Moreover, as already discussed in Sects. 4.1 and 4.2.1, land use changes can have a notable impact on water resources availability and distribution, and their integration into the modelling framework can be of great interest, especially when considering future management scenarios. Another interesting path for future research is the development of more easily accessible and operable hydrological models, such as online tools and river basin digital twins, that allow for the continuous estimation of streamflow using easily available meteorological forecasts.
There is a pressing need to promote sustainable water management, especially in regions vulnerable to water scarcity, such as the Mediterranean, where rising anthropogenic demands and increased severity of droughts due to climate change are expected to exacerbate water scarcity in the following decades. In this context, hydrological modelling that can accurately simulate both natural and anthropogenic processes to assess water resources availability stands as a useful tool to support efficient decision-making in such water-scarce regions. In this research, we integrated first-hand expert knowledge on management operations into the hydrological model SWAT+ and applied it in the CRBD, located in the western Mediterranean.
We used the SWAT+CRBD model to characterize and identify spatio-temporal patterns and trends of streamflow for the period 2001–2022, to deepen our understanding of how climate change and anthropogenic dynamics impact water-scarce basins. We identified a tendency towards flow reduction and increased streambed drying throughout the study region despite not observing a decreasing trend in mean annual rainfall, which indicates that other factors such as increasing temperature and anthropogenic pressures have a profound impact on water resources availability.
The spatio-temporal analysis of streamflow patterns and trends has provided insights into the evolution of hydrological dynamics under climate change and increasing anthropogenic pressures in basins vulnerable to water scarcity. Moreover, the integration of first-hand expert knowledge from water managers into our modelling framework has resulted in a more realistic simulation of anthropogenic process. Lastly, the introduction of a randomized calibration and validation approach allows us to overcome the limitations and biases arising of conventional approaches when dealing with multiple gauging stations of variable length.
The modified SWAT+ source code is available in Estrada (2023) (https://doi.org/10.5281/zenodo.10362245). All data used and presented in this paper are available upon request.
The supplement related to this article is available online at: https://doi.org/10.5194/hess-28-5353-2024-supplement.
LE: conceptualization, data curation, formal analysis, methodology, visualization, writing (original draft preparation and review and editing). XG: data curation, writing (review and editing). JSG: software, writing (review and editing). RM: supervision, writing (review and editing). AM: data curation, project administration, writing (review and editing). VA: conceptualization, funding acquisition, project administration, supervision, writing (review and editing).
The contact author has declared that none of the authors has any competing interests.
Publisher's note: Copernicus Publications remains neutral with regard to jurisdictional claims made in the text, published maps, institutional affiliations, or any other geographical representation in this paper. While Copernicus Publications makes every effort to include appropriate place names, the final responsibility lies with the authors.
Authors acknowledge the support from the Economy and Knowledge Department of the Catalan Government through Consolidated Research Groups (ICRA-ENV 2021 SGR 01282), as well as from the CERCA programme.
This research was funded by the Catalan Water Agency under contract CTN20A0533, titled “Analysis of the potential urban sanitation improvements and industrial point source contaminants' traceability”. Laia Estrada was supported by the Secretariat of Universities and Research of Generalitat de Catalunya and the European Social Fund through an FI fellowship (2024 FI-3 00168).
This paper was edited by Roger Moussa and reviewed by Francesc Gallart and François Colin.
Abbaspour, K., Rouholahnejad, E., Vaghefi, S., Srinivasan, R., Yang, H., and Kløve, B.: A continental-scale hydrology and water quality model for Europe: Calibration and uncertainty of a high-resolution large-scale SWAT model, J. Hydrol., 524, 733–752, https://doi.org/10.1016/J.JHYDROL.2015.03.027, 2015.
Abbaspour, K., Vaghefi, S. A., and Srinivasan, R.: A Guideline for Successful Calibration and Uncertainty Analysis for Soil and Water Assessment: A Review of Papers from the 2016 International SWAT Conference, Water, 10, 6, https://doi.org/10.3390/W10010006, 2018.
Alcaraz-Hernández, J. D., Soler, J., Mezger, G., Corrochano Codorníu, A., Calleja Arriero, B., and Magdaleno, F.: Hydrological classification of non-perennial Mediterranean rivers and streams: A new insight for their management within the water framework directive, River Res. Appl., 39, 675–691, https://doi.org/10.1002/RRA.4095, 2023.
Ali, E., Cramer, W., Carnicer, J., Georgopoulou, E., Hilmi, N. J. M., Le Cozannet, G., and Lionello, P.: Cross-Chapter Paper 4: Mediterranean Region, in: Climate Change 2022: Impacts, Adaptation and Vulnerability. Contribution of Working Group II to the Sixth Assessment Report of the Intergovernmental Panel on Climate Change, edited by: Pörtner, H.-O., Roberts, D. C., Tignor, M., Poloczanska, E. S., Mitenbeck, K., Alegría, A., Craig, M., Langsdorf, S., Löschke, S., Möller, V., Okem, A., and Rama, B., Cambridge University Press, Cambridge, UK and New York, NY, USA, 2233–2272, https://doi.org/10.1017/9781009325844.021, 2022.
Arnold, J. G., Bieger, K., White, M. J., Srinivasan, R., Dunbar, J. A., and Allen, P. M.: Use of Decision Tables to Simulate Management in SWAT+, Water, 10, 713, https://doi.org/10.3390/W10060713, 2018.
Bailey, R. T., Bieger, K., Arnold, J. G., and Bosch, D. D.: A New Physically-Based Spatially-Distributed Groundwater Flow Module for SWAT+, Hydrology, 7, 75, https://doi.org/10.3390/HYDROLOGY7040075, 2020.
Bennett, N. D., Croke, B. F. W., Guariso, G., Guillaume, J. H. A., Hamilton, S. H., Jakeman, A. J., Marsili-Libelli, S., Newham, L. T. H., Norton, J. P., Perrin, C., Pierce, S. A., Robson, B., Seppelt, R., Voinov, A. A., Fath, B. D., and Andreassian, V.: Characterising performance of environmental models, Environ. Modell. Softw., 40, 1–20, https://doi.org/10.1016/J.ENVSOFT.2012.09.011, 2013.
Bieger, K., Arnold, J. G., Rathjens, H., White, M. J., Bosch, D. D., Allen, P. M., Volk, M., and Srinivasan, R.: Introduction to SWAT+, A Completely Restructured Version of the Soil and Water Assessment Tool, J. Am. Water Resour. As., 53, 115–130, https://doi.org/10.1111/1752-1688.12482, 2017.
Bieger, K., Arnold, J. G., Rathjens, H., White, M. J., Bosch, D. D., and Allen, P. M.: Representing the Connectivity of Upland Areas to Floodplains and Streams in SWAT+, J. Am. Water Resour. As., 55, 578–590, https://doi.org/10.1111/1752-1688.12728, 2019.
Blöschl, G., Hall, J., Viglione, A., Perdigão, R. A. P., Parajka, J., Merz, B., Lun, D., Arheimer, B., Aronica, G. T., Bilibashi, A., Boháč, M., Bonacci, O., Borga, M., Čanjevac, I., Castellarin, A., Chirico, G. B., Claps, P., Frolova, N., Ganora, D., Gorbachova, L., Gül, A., Hannaford, J., Harrigan, S., Kireeva, M., Kiss, A., Kjeldsen, T. R., Kohnová, S., Koskela, J. J., Ledvinka, O., Macdonald, N., Mavrova-Guirguinova, M., Mediero, L., Merz, R., Molnar, P., Montanari, A., Murphy, C., Osuch, M., Ovcharuk, V., Radevski, I., Salinas, J. L., Sauquet, E., Šraj, M., Szolgay, J., Volpi, E., Wilson, D., Zaimi, K., and Živković, N.: Changing climate both increases and decreases European river floods, Nature, 573, 108–111, https://doi.org/10.1038/S41586-019-1495-6, 2019.
Boithias, L., Sauvage, S., Lenica, A., Roux, H., Abbaspour, K. C., Larnier, K., Dartus, D., and Sánchez-Pérez, J. M.: Simulating Flash Floods at Hourly Time-Step Using the SWAT Model, Water, 9, 929, https://doi.org/10.3390/W9120929, 2017.
Bots, P. W. G., Bijlsma, R., Von Korff, Y., Van Der Fluit, N., and Wolters, H.: Supporting the Constructive Use of Existing Hydrological Models in Participatory Settings: a Set of “Rules of the Game,” Ecol. Soc., 16, 16, https://doi.org/10.5751/ES-03643-160216, 2011.
Bouadila, A., Tzoraki, O., and Benaabidate, L.: Hydrological modeling of three rivers under Mediterranean climate in Chile, Greece, and Morocco: study of high flow trends by indicator calculation, Arab. J. Geosci., 13, 1–17, https://doi.org/10.1007/s12517-020-06013-2, 2020.
Bremberg, N., Cramer, W., Dessì, A., Philippe, D., Fusco, F., Guiot, J., Pariente-David, S., and Raineri, L.: Climate Change and Security in the Mediterranean: Exploring the Nexus, Unpacking International Policy Responses, edited by: Dessì, A. and Fusco, F., Nuova Cultura, Rome, 146 pp., ISBN 9788833654584, 2022.
Brouziyne, Y., De Girolamo, A. M., Aboubdillah, A., Benaabidate, L., Bouchaou, L., and Chehbouni, A.: Modeling alterations in flow regimes under changing climate in a Mediterranean watershed: An analysis of ecologically-relevant hydrological indicators, Ecol. Inform., 61, 101219, https://doi.org/10.1016/j.ecoinf.2021.101219, 2021.
Buendia, C., Batalla, R. J., Sabater, S., Palau, A., and Marcé, R.: Runoff Trends Driven by Climate and Afforestation in a Pyrenean Basin, Land Degrad. Dev., 27, 823–838, https://doi.org/10.1002/LDR.2384, 2016.
Caretta, M. A., Mukherji, A., Arfanuzzaman, M., Betts, R. A., Gelfan, A., Hirabayashi, Y., Lissner, T. K., Liu, J., Lopez Gunn, E., Morgan, R., Mwanga, S., and Supratid, S.: Water, in: Climate Change 2022: Impacts, Adaptation, and Vulnerability. Contribution of Working Group II to the Sixth Assessment Report of the Intergovernmental Panel on Climate Change, edited by: Pörtner, H.-O., Roberts, D. C., Tignor, M., Poloczanska, E. S., Mitenbeck, K., Alegría, A., Craig, M., Langsdorf, S., Löschke, S., Möller, V., Okem, A., and Rama, B., Cambridge University Press, Cambridge, UK and New York, NY, USA, 551–712, https://doi.org/10.1017/9781009325844.006, 2022.
Castellanos-Osorio, G., López-Ballesteros, A., Pérez-Sánchez, J., and Senent-Aparicio, J.: Disaggregated monthly SWAT+ model versus daily SWAT+ model for estimating environmental flows in Peninsular Spain, J. Hydrol., 623, 129837, https://doi.org/10.1016/j.jhydrol.2023.129837, 2023.
Catalan Water Agency (ACA): Pla de gestió del districte de conca fluvial de Catalunya 2022–2027, https://info.aca.gencat.cat/ca/aca/informacio/geco/plans-programes/PDG/CA/01-00-Pla-de-gestio-2022-27.pdf (last access: 8 December 2024), 2021.
Cervera, T., Pino, J., Marull, J., Padró, R., and Tello, E.: Understanding the long-term dynamics of forest transition: From deforestation to afforestation in a Mediterranean landscape (Catalonia, 1868–2005), Land Use Policy, 80, 318–331, https://doi.org/10.1016/J.LANDUSEPOL.2016.10.006, 2019.
Chawanda, C. J., Arnold, J., Thiery, W., and van Griensven, A.: Mass balance calibration and reservoir representations for large-scale hydrological impact studies using SWAT+, Climatic Change, 163, 1307–1327, https://doi.org/10.1007/s10584-020-02924-x, 2020.
Clavera-Gispert, R., Quintana-Seguí, P., Palazón, L., Zabaleta, A., Cenobio, O., Barella-Ortiz, A., and Beguería, S.: Streamflow trends of the Pyrenees using observations and multi-model approach (1980–2013), J. Hydrol. Reg. Stud., 46, 101322, https://doi.org/10.1016/J.EJRH.2023.101322, 2023.
Cramer, W., Guiot, J., Fader, M., Garrabou, J., Gattuso, J. P., Iglesias, A., Lange, M. A., Lionello, P., Llasat, M. C., Paz, S., Peñuelas, J., Snoussi, M., Toreti, A., Tsimplis, M. N., and Xoplaki, E.: Climate change and interconnected risks to sustainable development in the Mediterranean, Nat. Clim. Change, 8, 972–980, https://doi.org/10.1038/s41558-018-0299-2, 2018.
Cukier, R. I., Fortuin, C. M., Shuler, K. E., Petschek, A. G., and Schaibly, J. H.: Study of the sensitivity of coupled reaction systems to uncertainties in rate coefficients. I Theory, J. Chem. Phys., 59, 3873–3878, https://doi.org/10.1063/1.1680571, 1973.
Daggupati, P., Pai, N., Ale, S., Douglas-Mankin, K. R., Zeckoski, R. W., Jeong, J., Parajuli, P. B., Saraswat, D., and Youssef, M. A.: A Recommended Calibration and Validation Strategy for Hydrologic and Water Quality Models, T. ASABE, 58, 1705–1719, https://doi.org/10.13031/TRANS.58.10712, 2015.
Dai, A., Zhao, T., and Chen, J.: Climate Change and Drought: a Precipitation and Evaporation Perspective, Curr. Clim. Chang. Reports, 4, 301–312, https://doi.org/10.1007/S40641-018-0101-6, 2018.
Dakhlaoui, H., Ruelland, D., and Tramblay, Y.: A bootstrap-based differential split-sample test to assess the transferability of conceptual rainfall-runoff models under past and future climate variability, J. Hydrol., 575, 470–486, https://doi.org/10.1016/J.JHYDROL.2019.05.056, 2019.
De Girolamo, A. M., Barca, E., Leone, M., and Lo Porto, A.: Impact of long-term climate change on flow regime in a Mediterranean basin, J. Hydrol. Reg. Stud., 41, 101061, https://doi.org/10.1016/J.EJRH.2022.101061, 2022.
Dennedy-Frank, P. J. and Gorelick, S. M.: Insights on expected streamflow response to land-cover restoration, J. Hydrol., 589, 125121, https://doi.org/10.1016/j.jhydrol.2020.125121, 2020.
Döll, P. and Schmied, H. M.: How is the impact of climate change on river flow regimes related to the impact on mean annual runoff? A global-scale analysis, Environ. Res. Lett., 7, 014037, https://doi.org/10.1088/1748-9326/7/1/014037, 2012.
EEA – European Environment Agency: Corine Land Cover (CLC) 2000, Version 2020_20u1, https://land.copernicus.eu/en/products/corine-land-cover/clc-2000 (last access: 13 December 2023), 2000.
EEA – European Environment Agency: Corine Land Cover (CLC) 2018, Version 2020_20u1, https://land.copernicus.eu/en/products/corine-land-cover/clc2018 (last access: 13 December 2023), 2018.
Eekhout, J. P. C., Boix-Fayos, C., Pérez-Cutillas, P., and De Vente, J.: The impact of reservoir construction and changes in land use and climate on ecosystem services in a large Mediterranean catchment, J. Hydrol., 590, 125208, https://doi.org/10.1016/j.jhydrol.2020.125208, 2020.
Estrada, L.: SWAT+CRBD source code, Zenodo [code], https://doi.org/10.5281/zenodo.10362245, 2023.
Folton, N., Martin, E., Arnaud, P., L'Hermite, P., and Tolsa, M.: A 50 year analysis of hydrological trends and processes in a Mediterranean catchment, Hydrol. Earth Syst. Sci., 23, 2699–2714, https://doi.org/10.5194/hess-23-2699-2019, 2019.
Frey, S. K., Miller, K., Khader, O., Taylor, A., Morrison, D., Xu, X., Berg, S. J., Hwang, H. T., Sudicky, E. A., and Lapen, D. R.: Evaluating landscape influences on hydrologic behavior with a fully-integrated groundwater – surface water model, J. Hydrol., 602, 126758, https://doi.org/10.1016/J.JHYDROL.2021.126758, 2021.
Gallart, F. and Llorens, P.: Observations on land cover changes and water resources in the headwaters of the Ebro catchment, Iberian Peninsula, Phys. Chem. Earth, 29, 769–773, https://doi.org/10.1016/j.pce.2004.05.004, 2004.
Gallart, F., Delgado, J., Beatson, S. J. V., Posner, H., Llorens, P., and Marcé, R.: Analysing the effect of global change on the historical trends of water resources in the headwaters of the Llobregat and Ter river basins (Catalonia, Spain), Phys. Chem. Earth Parts A/B/C, 36, 655–661, https://doi.org/10.1016/J.PCE.2011.04.009, 2011.
Garcia, X., Estrada, L., Saló, J., and Acuña, V.: Blueing green water from forests as strategy to cope with climate change in water scarce regions: The case of the Catalan river basin District, J. Environ. Manage., 353, 120249, https://doi.org/10.1016/J.JENVMAN.2024.120249, 2024.
Gassman, P. W., Sadeghi, A. M., and Srinivasan, R.: Applications of the SWAT Model Special Section: Overview and Insights, J. Environ. Qual., 43, 1–8, https://doi.org/10.2134/JEQ2013.11.0466, 2014.
Gudmundsson, L., Seneviratne, S. I., and Zhang, X.: Anthropogenic climate change detected in European renewable freshwater resources, Nat. Clim. Change, 7, 813–816, https://doi.org/10.1038/NCLIMATE3416, 2017.
Gudmundsson, L., Leonard, M., Do, H. X., Westra, S., and Seneviratne, S. I.: Observed Trends in Global Indicators of Mean and Extreme Streamflow, Geophys. Res. Lett., 46, 756–766, https://doi.org/10.1029/2018GL079725, 2019.
Gudmundsson, L., Boulange, J., Do, H. X., Gosling, S. N., Grillakis, M. G., Koutroulis, A. G., Leonard, M., Liu, J., Schmied, H. M., Papadimitriou, L., Pokhrel, Y., Seneviratne, S. I., Satoh, Y., Thiery, W., Westra, S., and Zhang, X.: Globally observed trends in mean and extreme river flow attributed to climate change, Science, 371, 1159–1162, https://doi.org/10.1594/PANGAEA.887470, 2021.
Gupta, H. V., Kling, H., Yilmaz, K. K., Martinez, G. F., and Kling, H.: Decomposition of the mean squared error and NSE performance criteria: Implications for improving hydrological modelling, J. Hydrol., 377, 80–91, https://doi.org/10.1016/j.jhydrol.2009.08.003, 2009.
Guse, B., Reusser, D. E., and Fohrer, N.: How to improve the representation of hydrological processes in SWAT for a lowland catchment – temporal analysis of parameter sensitivity and model performance, Hydrol. Process., 28, 2651–2670, https://doi.org/10.1002/HYP.9777, 2014.
Haro-Monteagudo, D., Palazón, L., and Beguería, S.: Long-term sustainability of large water resource systems under climate change: A cascade modeling approach, J. Hydrol., 582, 124546, https://doi.org/10.1016/j.jhydrol.2020.124546, 2020.
Højberg, A. L., Troldborg, L., Stisen, S., Christensen, B. B. S., and Henriksen, H. J.: Stakeholder driven update and improvement of a national water resources model, Environ. Modell. Softw., 40, 202–213, https://doi.org/10.1016/J.ENVSOFT.2012.09.010, 2013.
ICGC – Cartographic and Geological Institute of Catalonia: Land Cover Map of Catalonia, https://www.icgc.cat/en/Sustainable-territory/Land-cover (last access: 9 December 2024), 2018.
Khorchani, M., Nadal-Romero, E., Lasanta, T., and Tague, C.: Natural revegetation and afforestation in abandoned cropland areas: Hydrological trends and changes in Mediterranean mountains, Hydrol. Process., 35, e14191, https://doi.org/10.1002/HYP.14191, 2021.
Lana, X., Casas-Castillo, M. C., Rodríguez-Solà, R., Serra, C., Martínez, M. D., and Kirchner, R.: Rainfall regime trends at annual and monthly scales in Catalonia (NE Spain) and indications of CO2 emissions effects, Theor. Appl. Climatol., 146, 981–996, https://doi.org/10.1007/S00704-021-03773-Z, 2021.
Llanos-Paez, O., Estrada, L., Pastén-Zapata, E., Boithias, L., Jorda-Capdevila, D., Sabater, S., and Acuña, V.: Spatial and temporal patterns of flow intermittency in a Mediterranean basin using the SWAT+ model, Hydrolog. Sci. J., 68, 276–289, https://doi.org/10.1080/02626667.2022.2155523, 2023.
López-Ballesteros, A., Nielsen, A., Castellanos-Osorio, G., Trolle, D., and Senent-Aparicio, J.: DSOLMap, a novel high-resolution global digital soil property map for the SWAT+ model: Development and hydrological evaluation, CATENA, 231, 107339, https://doi.org/10.1016/J.CATENA.2023.107339, 2023.
Loucks, D. P. and van Beek, E.: Water Resource Systems Modeling: Its Role in Planning and Management, in: Water Resource Systems Planning and Management, Springer, Cham, 51–72, https://doi.org/10.1007/978-3-319-44234-1_2, 2017.
Lutz, S. R., Mallucci, S., Diamantini, E., Majone, B., Bellin, A., and Merz, R.: Hydroclimatic and water quality trends across three Mediterranean river basins, Sci. Total Environ., 571, 1392–1406, https://doi.org/10.1016/J.SCITOTENV.2016.07.102, 2016.
Marx, A., Kumar, R., Thober, S., Rakovec, O., Wanders, N., Zink, M., Wood, E. F., Pan, M., Sheffield, J., and Samaniego, L.: Climate change alters low flows in Europe under global warming of 1.5, 2, and 3 °C, Hydrol. Earth Syst. Sci., 22, 1017–1032, https://doi.org/10.5194/hess-22-1017-2018, 2018.
Masseroni, D., Camici, S., Cislaghi, A., Vacchiano, G., Massari, C., and Brocca, L.: The 63 year changes in annual streamflow volumes across Europe with a focus on the Mediterranean basin, Hydrol. Earth Syst. Sci., 25, 5589–5601, https://doi.org/10.5194/hess-25-5589-2021, 2021.
MedECC: Climate and Environmental Change in the Mediterranean Basin – Current Situation and Risks for the Future. First Mediterranean Assessment Report, edited by: Cramer, W., Guiot, J., and Marini, K., Union for the Mediterranean, Plan Bleu, UNEP/MAP, Marseille, France, 632 pp., https://doi.org/10.5281/ZENODO.7224821, 2020.
Meteocat – Servei Metereológic de Catalunya: Butlletí Anual d'Indicadors Climátics 2022, https://www.meteo.cat/wpweb/climatologia/butlletins-i-episodis-meteorologics/butlleti-anual/#anualanterior (last access: 8 December 2024), 2023.
Moriasi, D. N., Arnold, J. G., Van Liew, M. W., Bingner, R. L., Harmel, R. D., and Veith, T. L.: Model Evaluation Guidelines for Systematic Quantification of Accuracy in Watershed Simulations, T. ASABE, 50, 885–900, https://doi.org/10.13031/2013.23153, 2007.
Musa, S. M. S. S., Noorani, M. S. M., Razak, F. A., Ismail, M., and Alias, M. A.: Streamflow Data Analysis for Flood Detection using Persistent Homology, Sains Malays., 51, 2211–2222, https://doi.org/10.17576/jsm-2022-5107-22, 2022.
Myers, D. T., Ficklin, D. L., Robeson, S. M., Neupane, R. P., Botero-Acosta, A., and Avellaneda, P. M.: Choosing an arbitrary calibration period for hydrologic models: How much does it influence water balance simulations?, Hydrol. Process., 35, e14045, https://doi.org/10.1002/HYP.14045, 2021.
Odusanya, A. E., Schulz, K., Biao, E. I., Degan, B. A. S., and Mehdi-Schulz, B.: Evaluating the performance of streamflow simulated by an eco-hydrological model calibrated and validated with global land surface actual evapotranspiration from remote sensing at a catchment scale in West Africa, J. Hydrol. Reg. Stud., 37, 100893, https://doi.org/10.1016/J.EJRH.2021.100893, 2021.
Pandey, V. P., Dhaubanjar, S., Bharati, L., and Thapa, B. R.: Spatio-temporal distribution of water availability in Karnali-Mohana Basin, Western Nepal: Hydrological model development using multi-site calibration approach (Part-A), J. Hydrol. Reg. Stud., 29, 100690, https://doi.org/10.1016/J.EJRH.2020.100690, 2020.
Peña-Angulo, D., Vicente-Serrano, S. M., Domínguez-Castro, F., Murphy, C., Reig, F., Tramblay, Y., Trigo, R. M., Luna, M. Y., Turco, M., Noguera, I., Aznárez-Balta, M., García-Herrera, R., Tomas-Burguera, M., and El Kenawy, A.: Long-term precipitation in Southwestern Europe reveals no clear trend attributable to anthropogenic forcing, Environ. Res. Lett., 15, 094070, https://doi.org/10.1088/1748-9326/AB9C4F, 2020.
Pezij, M., Augustijn, D. C. M., Hendriks, D. M. D., and Hulscher, S. J. M. H.: The role of evidence-based information in regional operational water management in the Netherlands, Environ. Sci. Policy, 93, 75–82, https://doi.org/10.1016/J.ENVSCI.2018.12.025, 2019.
Piniewski, M. and Okruszko, T.: Multi-Site Calibration and Validation of the Hydrological Component of SWAT in a Large Lowland Catchment, in: Modelling of Hydrological Processes in the Narew Catchment, edited by: Świątek, D. and Okruszko, T., Springer, Berlin, Heidelberg, 15–41, https://doi.org/10.1007/978-3-642-19059-9_2, 2011.
Pletterbauer, F., Melcher, A., and Graf, W.: Climate Change Impacts in Riverine Ecosystems, in: Riverine Ecosystem Management, edited by: Schmutz, S. and Sendzimir, J., Springer, Cham, 203–223, https://doi.org/10.1007/978-3-319-73250-3_11, 2018.
Pulighe, G., Lupia, F., Chen, H., and Yin, H.: Modeling Climate Change Impacts on Water Balance of a Mediterranean Watershed Using SWAT+, Hydrology, 8, 157, https://doi.org/10.3390/hydrology8040157, 2021.
Reusser, D.: Fast: Implementation of the Fourier Amplitude Sensitivity Test (FAST), https://cran.r-project.org/package=fast (last access: 9 December 2024), 2015.
Richter, B. D., Baumgartner, J. V., Powell, J., Braun, D. P., and Braunt, D. P.: A Method for Assessing Hydrologic Alteration within Ecosystems, Conserv. Biol., 10, 1163–1174, https://doi.org/10.1046/j.1523-1739.1996.10041163.x, 1996.
Samimi, M., Mirchi, A., Moriasi, D., Ahn, S., Alian, S., Taghvaeian, S., and Sheng, Z.: Modeling arid/semi-arid irrigated agricultural watersheds with SWAT: Applications, challenges, and solution strategies, J. Hydrol., 590, 125418, https://doi.org/10.1016/j.jhydrol.2020.125418, 2020.
Schürz, C.: SWATplusR: Running SWAT2012 and SWAT+ Projects in R, R Package Version 0.6, Zenodo [code], https://doi.org/10.5281/zenodo.6517027, 2022.
Sen, P. K.: Estimates of the Regression Coefficient Based on Kendall's Tau, J. Am. Stat. Assoc., 63, 1379, https://doi.org/10.2307/2285891, 1968.
Senent-Aparicio, J., Jimeno-Sáez, P., López-Ballesteros, A., Giménez, J. G., Pérez-Sánchez, J., Cecilia, J. M., and Srinivasan, R.: Impacts of swat weather generator statistics from high-resolution datasets on monthly streamflow simulation over Peninsular Spain, J. Hydrol. Reg. Stud., 35, 100826, https://doi.org/10.1016/J.EJRH.2021.100826, 2021.
Song, X., Zhang, J., Zhan, C., Xuan, Y., Ye, M., and Xu, C.: Global sensitivity analysis in hydrological modeling: Review of concepts, methods, theoretical framework, and applications, J. Hydrol., 523, 739–757, https://doi.org/10.1016/j.jhydrol.2015.02.013, 2015.
Spinoni, J., Vogt, J. V., Naumann, G., Barbosa, P., and Dosio, A.: Will drought events become more frequent and severe in Europe?, Int. J. Climatol., 38, 1718–1736, https://doi.org/10.1002/JOC.5291, 2018.
Stahl, K., Hisdal, H., Hannaford, J., Tallaksen, L. M., van Lanen, H. A. J., Sauquet, E., Demuth, S., Fendekova, M., and Jódar, J.: Streamflow trends in Europe: evidence from a dataset of near-natural catchments, Hydrol. Earth Syst. Sci., 14, 2367–2382, https://doi.org/10.5194/hess-14-2367-2010, 2010.
Stahl, K., Tallaksen, L. M., Hannaford, J., and van Lanen, H. A. J.: Filling the white space on maps of European runoff trends: estimates from a multi-model ensemble, Hydrol. Earth Syst. Sci., 16, 2035–2047, https://doi.org/10.5194/hess-16-2035-2012, 2012.
Swain, S. S., Mishra, A., Sahoo, B., and Chatterjee, C.: Water scarcity-risk assessment in data-scarce river basins under decadal climate change using a hydrological modelling approach, J. Hydrol., 590, 125260, https://doi.org/10.1016/j.jhydrol.2020.125260, 2020.
Tanner, J., Mantel, S., Paxton, B., Slaughter, A., and Hughes, D.: Impacts of climate change on rivers and biodiversity in a water-scarce semi-arid region of the Western Cape, South Africa, Front. Water, 4, 949901, https://doi.org/10.3389/frwa.2022.949901, 2022.
Theil, H.: A Rank-Invariant Method of Linear and Polynomial Regression Analysis, in: Henri Theil's Contributions to Economics and Econometrics, edited by: Raj, B. and Koerts, J., Springer, Dordrecht, 345–381, https://doi.org/10.1007/978-94-011-2546-8_20, 1992.
Tramblay, Y., Rutkowska, A., Sauquet, E., Sefton, C., Laaha, G., Osuch, M., Albuquerque, T., Alves, M. H., Banasik, K., Beaufort, A., Brocca, L., Camici, S., Csabai, Z., Dakhlaoui, H., DeGirolamo, A. M., Dörflinger, G., Gallart, F., Gauster, T., Hanich, L., Kohnová, S., Mediero, L., Plamen, N., Parry, S., Quintana-Seguí, P., Tzoraki, O., and Datry, T.: Trends in flow intermittence for European rivers, Hydrolog. Sci. J., 66, 37–49, https://doi.org/10.1080/02626667.2020.1849708, 2021.
Varlas, G., Papadaki, C., Stefanidis, K., Mentzafou, A., Pechlivanidis, I., Papadopoulos, A., and Dimitriou, E.: Increasing Trends in Discharge Maxima of a Mediterranean River during Early Autumn, Water, 15, 1022, https://doi.org/10.3390/W15061022, 2023.
Vicente-Serrano, S. M., Peña-Angulo, D., Beguería, S., Domínguez-Castro, F., Tomás-Burguera, M., Noguera, I., Gimeno-Sotelo, L., and El Kenawy, A.: Global drought trends and future projections, Philos. T. Roy. Soc. A, 380, 20210285, https://doi.org/10.1098/RSTA.2021.0285, 2022.
Wang, S., Zhang, Z., Sun, G., Strauss, P., Guo, J., Tang, Y., and Yao, A.: Multi-site calibration, validation, and sensitivity analysis of the MIKE SHE Model for a large watershed in northern China, Hydrol. Earth Syst. Sci., 16, 4621–4632, https://doi.org/10.5194/hess-16-4621-2012, 2012.
Wi, S., Yang, Y. C. E., Steinschneider, S., Khalil, A., and Brown, C. M.: Calibration approaches for distributed hydrologic models in poorly gaged basins: implication for streamflow projections under climate change, Hydrol. Earth Syst. Sci., 19, 857–876, https://doi.org/10.5194/hess-19-857-2015, 2015.
Yue, S. and Wang, C. Y.: The Mann-Kendall test modified by effective sample size to detect trend in serially correlated hydrological series, Water Resour. Manag., 18, 201–218, https://doi.org/10.1023/B:WARM.0000043140.61082.60, 2004.
Zittis, G., Bruggeman, A., and Lelieveld, J.: Revisiting future extreme precipitation trends in the Mediterranean, Weather Clim. Extrem., 34, 100380, https://doi.org/10.1016/j.wace.2021.100380, 2021.
Zribi, M., Brocca, L., Tramblay, Y., and Molle, F.: Water Resources in the Mediterranean Region, Elsevier, Amsterdam, the Netherlands, https://doi.org/10.1016/C2018-0-02971-0, 2020.


