the Creative Commons Attribution 4.0 License.
the Creative Commons Attribution 4.0 License.
Modeling 2D gravity-driven flow in unsaturated porous media for different infiltration rates
Miloslav Šír
The gravity-driven flow in an unsaturated porous medium remains one of the most important unsolved problems in multiphase flow. Sometimes a diffusion-like flow with a uniform wetting front, known as stable flow, is observed, but, at other times, the flow is unstable with distinct preferential pathways. The formation of an unstable wetting front in a porous medium depends on many factors, including the type of porous medium, the initial saturation, and the applied infiltration rate. As the infiltration rate increases, the wetting front first transitions from stable to unstable at low infiltration rates and then from unstable to stable at high infiltration rates. We propose a governing equation and its discretized form, the semi-continuum model, to describe this significant non-monotonic transition. We show that the semi-continuum model is able to capture the influx dependence together with the correct finger width and spacing. Moreover, we demonstrate that the instability of the wetting front is closely related to the saturation overshoot in one dimension. Finally, we show that the flow can still be preferential even when the porous medium is completely wetted.
- Article
(6311 KB) - Full-text XML
- BibTeX
- EndNote
In the field of hydrology, the gravity-driven multiphase flow in porous media, typically involving the flow of water into soil, remains a long-standing and unsolved problem. In the early 1980s, a series of seminal papers provided important insights into this phenomenon (Diment et al., 1982; Diment and Watson, 1983, 1985). A decade later, the influence of soil matrix hydrophobicity on water movement was described (Dekker and Ritsema, 1994). A detailed overview of the research on porous-media flow up to the year 2000 is presented in de Rooij (2000).
The infiltration of water into soil is an extremely complicated physical phenomenon that exhibits two kinds of flow behavior: diffusion-like flow and finger-like flow (de Rooij, 2000; DiCarlo, 2013; Xiong, 2014). In the case of diffusion-like flow, a stable wetting front is observed; this kind of flow behavior is referred to as stable flow. Conversely, finger-like flow, characterized by an unstable wetting front, is called unstable flow. The lack of a physically based and experimentally verified model of soil water movement is a major obstacle to the development of rainfall–runoff models at the hydrological scale. This issue has received consistent attention for many years, as evidenced by the recommendation that rainfall–runoff models should include a robust model of soil water movement (Kutílek and Nielsen, 1994). Traditionally, the standard concept of diffusion-like flow based on Richards' equation (Richards, 1931) has been used for modeling water movement in soil. However, this concept is inadequate for modeling finger-like flow (DiCarlo, 2013). Consequently, there is an ongoing search for a concept that can describe both types of flow, given its substantial application potential in soil science (Lake et al., 2014; Bundt et al., 2000; DiCarlo, 2013; Xiong, 2014) and other fields (Sutherland and Chase, 2008; Vafai, 2010). This paper is devoted to the description of such a model.
The instability of the wetting front is accompanied by preferential flow, where most of the water moves through the preferential pathways, leaving much of the porous medium dry even after hours of uniform infiltration. This type of flow is characterized by the formation of fingers (DiCarlo, 2013). A finger consists of two parts, namely an undersaturated tail and an oversaturated tip, and this non-monotonicity of saturation is known as saturation overshoot. Therefore, wetting-front instability and associated saturation overshoot have been at the center of attention for several decades (Saffman and Taylor, 1958; Chuoke et al., 1959; Smith, 1967; Hill and Parlange, 1972). Since then, a huge number of laboratory and field experimental works have become available. Some of the works concern 3D experiments (Glass et al., 1990; Yao and Hendrickx, 1996), but most are performed in 1D (long vertical tubes) (DiCarlo, 2004, 2007, 2010; Aminzadeh and DiCarlo, 2010) and in 2D (Hele–Shaw cells) (Smith, 1967; Glass et al., 1988, 1989a, b, c; Liu et al., 1994; DiCarlo et al., 1999; Glass et al., 2000; Bauters et al., 2000; Sililo and Tellam, 2005; Rezanezhad et al., 2006; Wei et al., 2014; Cremer et al., 2017; Pales et al., 2018; Chen et al., 2022; Liu et al., 2023) due to simpler realization.
It turns out that flow in an unsaturated porous medium has many unexpected features. For example, a non-monotonic dependence of the wetting-front velocity and finger width on the initial saturation is observed (Bauters et al., 2000). At lower initial saturation, the wetting front is unstable with slow and wide fingers. With increasing initial saturation, the fingers first narrow and speed up and then slow and widen again until a stable wetting front is observed. Another non-intuitive behavior is the dependence on applied influx (Glass et al., 1989c; Yao and Hendrickx, 1996; DiCarlo, 2013), which is crucial for understanding the precipitation–runoff relationship in hydrology. Glass et al. (1989c) built a two-dimensional chamber with a thickness of 1 cm filled with a homogeneous porous medium. Water was uniformly applied at a constant flux qtop at the top boundary. They observed a stable wetting front when the flux was close to the saturated conductivity, but with decreasing applied influx, the flow tended to become significantly preferential. Yao and Hendrickx (1996) performed similar experiments, but they infiltrated water into large three-dimensional columns with diameters of 30 and 100 cm, and the applied flux was much lower. They demonstrated that, as the flux decreases, the finger-like flow disappears, and a stable wetting front reappears. This behavior was maintained regardless of the type of homogeneous sand used. Therefore, preferential flow is observed only within a certain range of infiltration flux. Note that, while homogeneous soil does not actually exist, as there is always some level of heterogeneity, this term commonly refers to soils, such as sands, where the characteristics of soil hydraulic properties appear to be uniform from a macroscopic perspective.
Approaches to modeling unsaturated porous-media flow can be divided into two categories: (1) microscale models, which are developed for small scales where the Darcy–Buckingham law (Buckingham, 1907) can be applied, and (2) macroscale models, which focus directly on large scales where the Darcy–Buckingham law is not applicable. Macroscale models, such as the ARM model (Liu et al., 2005; Liu, 2022), cannot capture individual fingers because the computational grid is too coarse, and so multiple fingers are included within each computational element. In contrast, microscale models do not have this limitation but are very computationally intensive. A typical example of a microscale model is Richards' equation, which combines the mass balance law and the Darcy–Buckingham law. Richards' equation is diffusive in nature as it is unable to model a non-monotonic saturation profile in the case of a uniform infiltration rate with a smooth and non-decreasing retention curve (Fürst et al., 2009). Therefore, many extensions of Richards' equation, known as continuum models, have been proposed (Hassanizadeh et al., 2002; Eliassi and Glass, 2002; Brindt and Wallach, 2020; Cueto-Felgueroso et al., 2020; Beljadid et al., 2020; Roche et al., 2021; Ommi et al., 2022a, b). Other approaches include discrete (pore-scale) models (Lenormand et al., 1988; Primkulov et al., 2018; Wei et al., 2022) and combinations of discrete and continuum approaches (Glass and Yarrington, 1996, 2003; Vodák et al., 2022).
Any microscale model designed primarily for small-scale processes should first be thoroughly validated using small-scale experiments. The opposite approach, i.e., validating with in-field experiments without proper small-scale validation, can lead to fundamentally incorrect conclusions. For instance, Tesař et al. (2004) developed a model based on upscaling Richards' equation. The model was validated using outflow data from the Liz catchment, covering an area of 1 km2 during the vegetation season of 1999. However, subsequent simulations showed that water always flowed through the entire porous medium regardless of initial and boundary conditions, revealing the model's inaccuracies. Therefore, the validation of microscale models should be focused on small-scale experiments, such as those performed in the laboratory, which provide a detailed analysis of flow behavior. Well-defined boundary and initial conditions in laboratory experiments enable a thorough examination of simulation details, allowing one to determine whether the model accurately captures preferential and diffusion flow. This makes the validation of the model more thorough and reliable. Following rigorous validation, one can then transition to more complex in-field experiments.
A validation procedure on a small scale through detailed laboratory experiments was proposed by DiCarlo (2013). Specifically, the author suggested criteria for evaluating which model is the “most appropriate” (see Sect. 6.6 in DiCarlo, 2013). According to the author, the model should have a minimum in terms of adjustable parameters; should be capable of producing the diffusive character of the flow as seen in Richards' equation; should match observed 1D profiles well; and, finally, should be able to predict 2D and 3D preferential flow in terms of finger widths and finger spacings. Our aim is to demonstrate that the semi-continuum model proposed by Vodák et al. (2022) succeeds in this type of evaluation. The authors developed the semi-continuum model and its formal limit in the form of a partial differential equation with a Prandtl-type hysteresis operator (Visintin, 1993) under the derivative. It was shown that the semi-continuum model was able to correctly reproduce experiments of flow in a long vertical tube (Kmec et al., 2019). In Kmec et al. (2021), the model was used to replicate the transition between unstable and stable wetting fronts for increasing initial saturation. Along with this, the model was shown to correctly capture the finger persistence and the flow across a heterogeneous porous medium. Finally, the strong non-monotonic dependence of the wetting front on the initial saturation for a point source infiltration was captured well (Kmec et al., 2023). According to the suggested model evaluation, the semi-continuum model has successfully addressed all aspects except for predictions of 2D and 3D preferential flow. The model has already reproduced the dependency on initial saturation in 2D (Kmec et al., 2021, 2023). However, the final aspect required for full validation is to accurately capture the dependence on the infiltration rate in 2D and/or 3D.
There are a few models that are able to capture the transition between diffusion- and finger-like flow for various infiltration rates in 1D, but analyzing the 2D case is much more complex. Although the 2D experiments are over 30 years old (Glass et al., 1989c; Yao and Hendrickx, 1996), they have not yet been successfully reproduced by any model. Finding a model capable of simulating this complex transition thus remains a major challenge (DiCarlo, 2013). One of the most promising and recent attempts to simulate the dependence on applied influx in 2D was proposed by Beljadid et al. (2020), who introduced a nonlocal model endowed with an entropy function. This model extends Richards' equation by incorporating a fourth-order spatial derivative of saturation. The authors demonstrated the transition from finger-like to diffusion-like flow under high applied fluxes. Moreover, the model showed good agreement with experimentally measured finger widths for large fluxes (Glass et al., 1989c). However, inconsistencies arise at very low fluxes, where the wetting front does not stabilize as expected from experiments (Yao and Hendrickx, 1996). In contrast, decreasing the infiltration rate results in thinner fingers, maintaining the preferential character of the flow. Therefore, matching experiments in 1D does not guarantee a match in 2D and 3D (Cueto-Felgueroso and Juanes, 2009; Beljadid et al., 2020).
In this paper, we aim to demonstrate the ability of the semi-continuum model to accurately capture the 2D transition from stable to unstable flow for low infiltration fluxes (Yao and Hendrickx, 1996) and the transition from unstable to stable flow for high infiltration fluxes (Glass et al., 1989c), along with making correct predictions of preferential flow in terms of experimentally measured finger widths and spacings. In addition, we will investigate the relationship between the saturation overshoot in 1D and the wetting-front instability in 2D to demonstrate further agreement with experimental observations.
In soil physics, the relationship between saturation S and pressure P exhibits strong hysteresis and is known as the retention curve. The retention curve consists of two main branches: the wetting and draining branches. Various approaches have been proposed to model the hysteresis, including those by Mualem (1976), Lenhard and Parker (1987), Parker and Lenhard (1987), Beliaev and Hassanizadeh (2001), McNamara (2014), Schweizer (2017), and Abreu et al. (2019).
The shape of the retention curve strongly depends on the size of the sample on which the measurement is performed (Larson and Morrow, 1981; Mishra and Sharma, 1988; Zhou and Stenby, 1993; Perfect et al., 2004; Hunt et al., 2013; Ghanbarian et al., 2015; Silva et al., 2018). As the sample size decreases, the pore size variability within the sample also decreases, and the retention curve becomes flatter (Silva et al., 2018). Therefore, it is useful to examine the influence of pore size variability on the shape of the retention curve. This influence has been studied by Pražák et al. (1999). They demonstrated that the main draining branch becomes flatter as the pore size variability decreases, which is consistent with the flattening of the retention curve as sample size decreases.
Although it is well known that the retention curve is dependent on the sample size of the porous medium (Ghanbarian et al., 2015), the implementation of this dependence is not common in flow modeling. Moreover, other characteristics of the porous medium, such as permeability and porosity, are also dependent on the sample size (Mishra and Sharma, 1988; Ewing et al., 2010; Ghanbarian et al., 2017, 2021; Esmaeilpour et al., 2021). This sample size dependence can be integrated into models by transferring this dependency to the individual elements or volumes of the discretization mesh. This means that these elements or volumes represent a real sample of the porous medium and carry information about its physical characteristics. This approach fundamentally differs from standard numerical schemes for partial differential equations, where the mesh serves only a mathematical role and ignores the fact that individual elements or volumes represent the real domain. However, some authors have already considered this aspect in modeling porous media. For instance, White et al. (2006) estimated a lower limit of finite elements and then used this size in their model. They argue that the use of smaller elements would not be appropriate because it would lead to a violation of the continuum assumptions. Note that, in the semi-continuum model, the sample size dependence of the retention curve is not neglected as it is a crucial feature of the model. This is further discussed in Sect. 3.4.
In this section, we first introduce the Prandtl-type hysteresis operator and the resulting governing partial differential equation, which was derived as a formal limit of the semi-continuum model (Vodák et al., 2022). We then present a proper discretization of the governing equation along with the discretization of the Prandtl-type hysteresis operator to provide a detailed description of the semi-continuum model. This model describes the movement of the wetting liquid in a porous medium; specifically, it is a multiphase flow model used for modeling unsaturated porous-media flow.
3.1 Prandtl-type hysteresis operator
The Prandtl-type hysteresis operator PH (Pa) is the pressure operator defined by the following differential inequality (Visintin, 1993):
where S (−) denotes the saturation of the wetting phase, and KPS (Pa), C1 (Pa), and C2 (Pa) are constants. A detailed description of this operator's characteristics can be found in Visintin (1993), specifically on p. 16.
Figure 1 illustrates the form of the Prandtl-type hysteresis operator for KPS=105 Pa. Hysteresis implies that the pressure value P depends not only on the current saturation S but also on its history. The Prandtl operator, described by Eq. (1), defines how the pressure value is assigned as a function of saturation. Assume that the initial pressure value is C1. When the saturation is non-decreasing over time, the pressure value remains at C1. Otherwise, the pressure value “jumps” from C1 to C2 over time, with the rate of this transition determined by KPS. The same principle applies when the pressure value is C2. The value remains at C2 when saturation is non-increasing; otherwise, it jumps from C2 to C1. These transitions, represented by non-vertical scanning curves, are marked in black in Fig. 1. The value KPS indicates a large gradient of these scanning curves, causing the pressure to change significantly between values C1 and C2 with a negligible change in saturation.
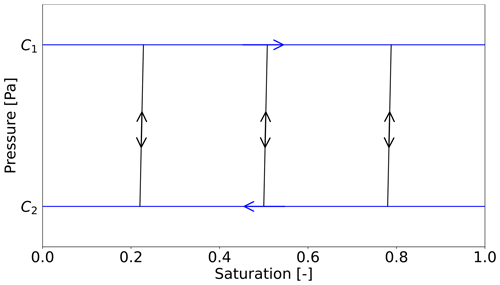
Figure 1Prandtl-type hysteresis operator PH. Blue lines denote constants C1 and C2, and black lines are non-vertical scanning curves with a large gradient of KPS=105 Pa.
Although the behavior of the Prandtl operator is relatively straightforward, its mathematical description is not trivial as the community is usually not familiar with differential inequalities. For more details, we refer to Vodák et al. (2022), specifically its Supplement, where we have demonstrated that the mathematical description follows the explanation of the Prandtl operator provided above. We have also shown that the Prandtl operator can be generalized using non-decreasing functions instead of constants C1 and C2.
3.2 Governing equation
The governing equation is given by Eq. (2). It is a partial differential equation containing the Prandtl-type hysteresis operator PH (Fig. 1) under the spatial derivative:
In this equation, the porous medium is characterized by its porosity θ (−), intrinsic permeability κ (m2), and relative permeability k(S) (−). The wetting phase (liquid) is characterized by its saturation S (−), density ρ (kg m−3), dynamic viscosity μ (Pa s), and pressure P (Pa) defined by operator PH. In a porous material that is not completely filled with liquid, the pressure P represents the capillary pressure, which is the tensile stress by which the liquid is held in pores. This pressure P in the liquid phase is lower than the pressure in the non-wetting phase (gas), which serves as the reference for expressing the liquid pressure. As a result, the pressure P becomes negative. The vector , where g (m s−2) denotes the acceleration due to gravity; thus, the gravity acts only in the third dimension. Note that k(S−) and k(S+) denote the left and right limits of relative permeability in the spatial variable. The discontinuity in saturation arises from the use of a geometric mean conductivity (Vodák et al., 2022). In the case of continuous saturation, , which results in .
The Prandtl-type hysteresis operator causes Eq. (2) to switch between parabolic and hyperbolic types in the case of an unsaturated porous medium. When the pressure value is defined by values C1 or C2 (blue lines in Fig. 1), the pressure–saturation relation is constant, resulting in ∇PH=0. Thus, the equation becomes a hyperbolic differential equation. Otherwise, when the pressure is given by the scanning curves (black lines in Fig. 1), the equation is a parabolic differential equation.
It is well known that different types of flow, saturated and unsaturated, can occur in parallel in the porous medium (Brandhorst et al., 2021). In a fully saturated medium, the pressure–saturation relation is no longer defined by the Prandtl-type hysteresis operator PH. In this case, the pressure becomes hydrostatic pressure and takes on positive values. Using the hydrostatic pressure in Eq. (2) instead of PH, we obtain Laplace's equation as k(S)=1 and . Since we focus on unsaturated flow, hydrostatic pressure is not implemented, and the case of a fully saturated medium is not studied further.
3.3 Discretization of the porous medium
We want to simulate experiments in a two dimensional Hele–Shaw cell of a porous medium; hence, a 2D discretization is used. The porous medium is a rectangle of size A×B, where A and B denote the horizontal and vertical widths of the porous medium, respectively. The porous medium is represented by a square mesh consisting of N×M blocks (finite volumes) of size Δx×Δx. These blocks retain the character of the porous medium.
3.4 Discretization of the Prandtl-type hysteresis operator
The discretization of the Prandtl-type hysteresis operator given by Eq. (1) has already been described in Kmec et al. (2023). Its discretized version is the capillary pressure operator P(S), which satisfies P(S)→PH(S) as Δx→0. The well-known fact that the shape of the retention curve depends on the sample size (Ghanbarian et al., 2015; Silva et al., 2018) is incorporated into our model so that the retention curve depends on the block size Δx. We refer to this discretization as the scaling of the retention curve. The proposed scaling is explained below; however, for a detailed mathematical and physical justification, we refer to Vodák et al. (2022). For the reference block size Δx0, the reference retention curve is given by the van Genuchten equation (van Genuchten, 1980):
where is the main wetting branch, is the main draining branch, αw and nw are parameters of the main wetting branch, and αd and nd are parameters of the main draining branch. For a block size Δx<Δx0, the main wetting and draining branches are scaled as follows:
Obviously, for Δx=Δx0, the retention curve is given by Eq. (3). For Δx→0, the retention curve converges to the Prandtl-type hysteresis operator PH so that and . Constants C1 and C2 in the semi-continuum model represent the water entry and air entry values, respectively (Vodák et al., 2022). Instead of the midpoint S=0.5 in Eq. (4), it is possible to choose, for example, an inflection point of the main branches. However, the effect on the results is negligible because the flux is calculated relative to the pressure gradient. Note that the reference block size Δx0 is a parameter of the semi-continuum model, and its determination can be obtained, for example, through calibration experiments.
Figure 2 shows the capillary pressure operator P(S) for different block sizes. It can be clearly seen that, for Δx→0, the operator P(S) converges to the Prandtl-type hysteresis operator PH shown in Fig. 1. For non-zero but very small Δx (see black lines in Fig. 2), both main branches take the form of step-like functions that are almost constant for . Since decreasing the block size reduces pore size variability, the proposed linear scaling defined by Eq. (4) perfectly aligns with the findings of Pražák et al. (1999), where the authors demonstrated a step-like form of the main draining branch for a hypothetical porous medium without pore size variability.
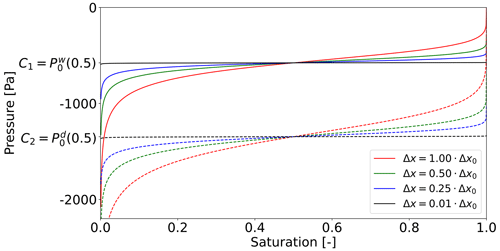
Figure 2The scaling of the retention curve for different block sizes Δx. The solid lines denote the main wetting branches, and the dashed lines denote the main draining branches. The parameters αw, nw, αd, and nd are given in Table 1. For Δx→0, the retention curve converges to the Prandtl-type hysteresis operator PH as both main branches take the form of horizontal lines C1 and C2.
Note that all scanning curves are non-vertical straight lines, as illustrated in Fig. 1. This approach is similar to the play-type hysteresis (Schweizer, 2017). Various approaches to modeling the hysteresis between saturation and pressure could potentially be implemented in our model. However, using a more complex hysteresis model is not beneficial as we have achieved good agreement with experiments using the simpler model.
3.5 Discretization of the governing equation – the semi-continuum model
Each block of the discretized porous medium is denoted by indices (i,j) representing the corresponding row and column. St(i,j) (−) and Pt(i,j) (Pa) represent, respectively, the saturation and pressure of the wetting phase (liquid) within block (i,j) at time t. These values are assumed to be constant within each block. Moreover, (m s−1) denotes the flux of the wetting phase from block (i1,j1) to block (i2,j2) at time t.
The semi-continuum model, which is the discretization of the governing Eq. (2), consists of three consecutive steps: saturation update, pressure update, and flux update. First, the saturation in each block is updated according to the discretized mass balance law for a given time step Δt and the block size Δx:
The second step is to update the pressure in each block to obtain the pressure at time t+Δt, i.e., Pt+Δt. The pressure is updated according to the hysteretic capillary pressure operator P(S), whose main wetting and draining branches are given by Eq. (4) and whose scanning curves are illustrated in Fig. 1.
The third and final step is the flux update. We adopt the following form of the relative permeability function k(S) (van Genuchten, 1980):
where λ (−) is a free parameter, and n (−) is a parameter of the retention curve given by Eq. (3). To simplify the notation, we introduce the so-called effective permeability as γ(S)=κk(S). The flux between blocks is updated using the discretized version of Darcy–Buckingham law (Bear, 1972):
The acceleration due to gravity is included only for the vertical fluxes. Unsurprisingly, the fluxes between non-neighboring blocks are set to zero. The geometric mean is used to average the effective permeability between blocks. This aligns with the approach utilized in governing Eq. (2), where the geometric mean is also used. Moreover, this type of averaging is also consistent with the findings of Jang et al. (2011). After updating the fluxes between neighboring blocks, we update the time and return to the saturation update given by Eq. (5).
If the fluxes between blocks are too large, especially if the flux is close to the saturated conductivity , the saturation may exceed 1. This occurs due to the inherent nature of the semi-continuum model and is often the case for other models as well. For example, in Cueto-Felgueroso and Juanes (2009), a “compressibility term” is used for the capillary energy saturation dependence. This term becomes dominant near saturation close to 1, and so it prevents the saturation from increasing any further. We use a different approach; the magnitude of the flux to the block can be, at most, so large that the saturation does not exceed 1. This straightforward approach is only possible because of the simple numerical scheme used.
According to Eqs. (5) and (7), if a standard retention curve without scaling is used (i.e., it does not converge to a Prandtl-type hysteresis operator PH), the semi-continuum model degenerates into a numerical scheme for solving the classical Richards' equation. The crucial difference in our model is that the shape of the retention curve depends on the block size Δx. From a mathematical point of view, in the case of an unsaturated porous medium, Richards' equation is diffusive in nature as it is a parabolic differential equation (DiCarlo, 2013). This is not the case for the governing Eq. (2), which is a hyperbolic–parabolic differential equation.
4.1 Numerical setup
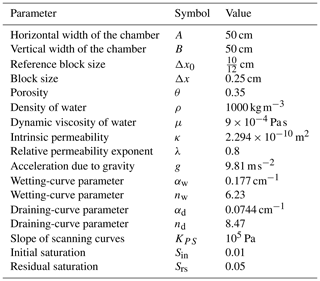
The parameters used for simulations of the infiltration dependence experiments are given in Table 1. The porous medium used for simulations is sand. The parameter λ=0.8, which is consistent with measurements (Schaap and Leij, 2000). It is important to emphasize that we use the same parameters as in Kmec et al. (2023), where the semi-continuum model accurately reproduced the experiments reported in Bauters et al. (2000). This includes a parameter of the semi-continuum model, the reference block size , which was calibrated for sand in Kmec et al. (2023) using the experiments of Bauters et al. (2000). This decision was made to demonstrate that the semi-continuum model can simulate different flow phenomena without additional parameter adjustments. Hence, our aim is not to optimize the parameters to achieve the best agreement with experiments. Let us note that the slope of the scanning curves KPS does not affect the results if it is chosen to be large enough. The differences between solutions are negligible for KPS≥105 Pa; hence, we set KPS to this value.
Table 1Parameters used for reproducing the flow dependence on different infiltration rates. Parameters for sand were adopted from Schroth et al. (1996) and DiCarlo (2004).
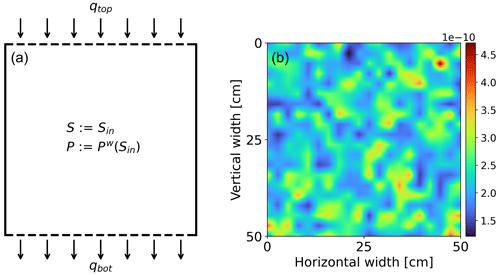
The scheme of the numerical setup is shown in the left panel of Fig. 3. Initial and boundary conditions are set to be consistent with the experiments we aim to reproduce (Yao and Hendrickx, 1996; Glass et al., 1989c). The porous medium is initially dry with an initial saturation Sin=0.01, and all the blocks begin on the main wetting branch. A constant infiltration rate qtop is applied to the entire top boundary. A total of 18 different infiltration rates qtop are used, with the lowest influx being equal to 0.001 cm min−1 and the highest influx being equal to the saturated conductivity KS=15 cm min−1. The lateral boundaries of the porous medium are impenetrable, and so the lateral fluxes are set to zero. For the bottom boundary flux qbot, the outflow of water into the air is prescribed. The following implementation is applied so that it does not affect the flow above the bottom boundary. This allows us to isolate the behavior of the model from the influence of the bottom boundary condition.
In the above, N denotes the bottom-row index. Thus, the flux from the bottom boundary is set to zero if the saturation of the corresponding block does not exceed the residual saturation Srs; otherwise, it is non-zero. Residual saturation refers to the maximum amount of water that the porous medium can retain against the force of the gravity. The value of Srs=0.05 corresponds to the experimentally measured residual saturation for sand in Bauters et al. (2000). This implementation of bottom boundary flux is similar to a free discharge (Šimůnek and Suarez, 1994) and has already been used for the semi-continuum model in Kmec et al. (2021).
The measurement of the macroscopic properties of a homogeneous porous medium, such as permeability or porosity, is typically performed by averaging microscopic quantities over the domain (White et al., 2006; Ghanbarian et al., 2021). Therefore, to obtain a more realistic description of a porous medium, such as sand, it is convenient to perturb its characteristics slightly. In this study, we employ a slightly distributed and spatially correlated intrinsic permeability (see the right panel of Fig. 3). To achieve this, we first generate a normally distributed array for larger blocks (2.5 cm). This array is then zoomed-in to smaller blocks of size Δx using linear interpolation, which ensures a spatially correlated distribution. The resulting values represent a multiplication factor for the intrinsic permeability, adjusted so that the probability of being n times smaller is the same as that of being n times larger. The specific implementation can be found in Kmec (2023a). A similar distribution has been used in Cueto-Felgueroso and Juanes (2009); Gomez et al. (2013); Kmec et al. (2023). The effect of intrinsic permeability distribution is further discussed in Sect. 5.4.
4.2 Evolution of the saturation profile
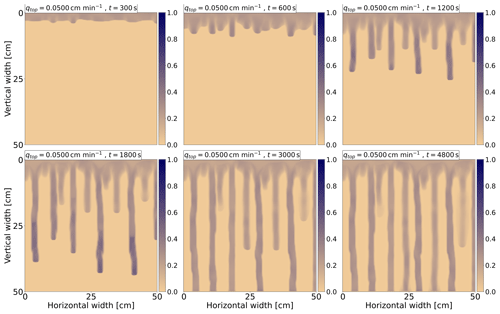
Figure 4 shows the evolution of the saturation profile at six different times for qtop=0.05 cm min−1. Times are displayed in the upper-left corner for each frame. Initially, a stable wetting front with small frontal perturbations develops at t=300 s. These perturbations then grow into long persistent fingers. Finally, when the fingers reach the bottom of the chamber, the water flows out of the chamber through preferential pathways so that most of the porous medium remains dry. This evolution of the wetting-front instability is consistent with the experimental observation (DiCarlo, 2013).
4.3 Dependence of flow on infiltration rate
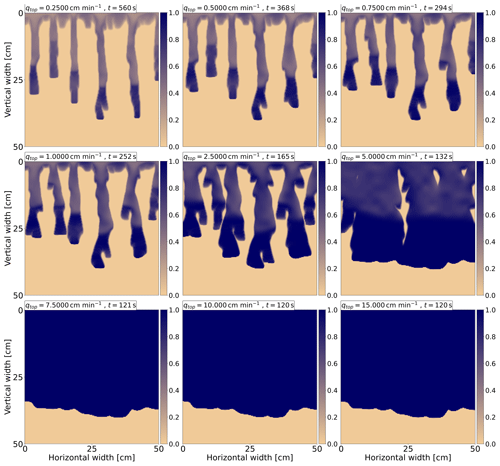
A total of 18 simulations for infiltration rates in the range qtop=0.001–15 cm min−1 are performed. Saturation profiles for nine infiltration rates are shown in Fig. 5. For clarity, saturation profiles for all infiltration rates are provided in Appendix A1 (Figs. A1 and A2). The time for each flux is selected so that the saturation reaches 40 cm from the upper boundary. The flux and corresponding time are displayed in the upper-left corner for each frame. At low fluxes, the transition from a stable wetting front to finger-like flow is clearly observed. As the flux approaches the hydraulic conductivity, the fingers widen, and a stable wetting front develops. To the best of our knowledge, this is the first model capable of simulating this non-trivial transition. More detailed views are available in the videos of transient simulations corresponding to each applied influx (Kmec, 2023b).
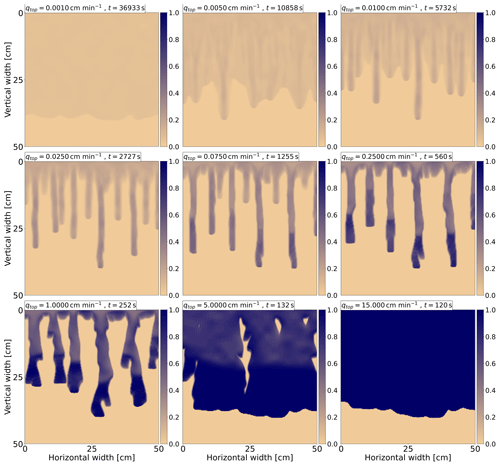
Figure 5Saturation profiles for nine infiltration rates. For each frame, the influx is displayed together with the simulation time in the upper-left corner. The transition from stable to unstable flow and then back to stable flow is clearly observed. Saturation is colored according to the color bar on the right.
The saturation overshoot is evident for fluxes between 0.075–5 cm min−1. Even at lower fluxes, for which unstable behavior persists, the saturation overshoot is observed. However, its magnitude (i.e., the saturation difference between finger tip and tail) is very small and thus is not visible in Fig. 5. This phenomenon is further discussed in Sect. 4.6. Additionally, a saturated wetting front emerges for infiltration rates lower than the saturated conductivity KS, as shown in Fig. A2 in the Appendix. This is a direct consequence of the developed saturation overshoot.
In cases of unstable flow, two fingers can merge, or one finger can split into two (Glass et al., 1989b, c; Rezanezhad et al., 2006). Both scenarios are reproduced here, but for detailed observation, we recommend viewing the videos of transient simulations (Kmec, 2023b). Merging can be observed at qtop=5 cm min−1, where two wide fingers merge. However, finger merging is also noticeable at lower fluxes. Splitting can be seen at qtop=2.5 cm min−1. Although these are minor details, such experimental consistency is beneficial.
4.4 Finger width as a function of influx
DiCarlo (2013) plotted experimentally measured finger widths as a function of influx in a single graph, incorporating data for both low (Yao and Hendrickx, 1996) and high (Glass et al., 1989c) infiltration rates. The measured finger widths are shown in Fig. 2 in DiCarlo (2013) along with the predicted finger widths using standard theory (Chuoke et al., 1959; Parlange and Hill, 1976). The observed results can be summarized as follows:
-
A stable wetting front is observed at very low fluxes, where the finger width is equal to the chamber width. This is not predicted by standard theory (Chuoke et al., 1959; Parlange and Hill, 1976).
-
As the influx increases, a rapid decrease in finger width is observed, followed by a long flat valley of almost constant finger widths for different fluxes – specifically, the finger width first decreases slightly and then increases.
-
As the influx approaches the saturated conductivity, the finger widths increase again, followed by stable flow.
-
Fingers in contact with the edge of the chamber are narrower and thinner and are not included in the analysis of DiCarlo (2013). Simulations performed by the semi-continuum model are consistent with this observation; thus, these fingers are not included in the following analysis as well.
To calculate the finger width for a specific applied influx, we use the saturation profile at the time of the simulation when the water reaches the bottom of the chamber. This ensures that the bottom boundary condition does not influence the obtained results. For each saturation profile, all fingers are segmented, as shown in Fig. A3 in Appendix A2. For preferential flow, this segmentation is straightforward because all the fingers are fully developed. It is worth noting that the fully developed fingers are persistent over time, and so segmented fingers are not influenced by a longer simulation time. In the case of stable flow, the approach used by DiCarlo (2013) is followed, where the entire saturation profile is assumed to be one “finger”. However, the so-called intermediate flow – the transition between stable and unstable flow – is more complicated because some fingers are narrow while others are diffusively expanding. Therefore, completely objective segmentation is not possible in this case. After segmenting the fingers, the average finger width is calculated for each applied influx.
Figure 6 shows calculated finger widths for 18 infiltration rates. Red, green, and blue dots indicate fluxes for which we observe stable, intermediate, and unstable flows, respectively. The results are consistent with experimentally observed behavior – a nearly constant finger width is observed for fluxes between 0.01–2.5 cm min−1, followed by stable flow for very low and very high applied fluxes. Even a slight increase in the finger width for fluxes above 0.01 cm min−1 is in perfect agreement with experiments (see Fig. 2 in Glass et al., 1989c). The special case is at qtop=5 cm min−1 (see Fig. 5), where two fingers are first developed, and then both fingers merge at a depth of approximately 30 cm. In this case, the average width is calculated from one merged finger.
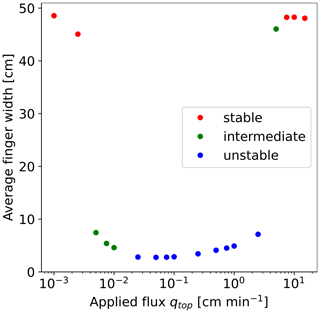
Figure 6Finger width as a function of the applied influx. A stable wetting front is observed at either very low or very high applied fluxes – in this case, the finger width is approximately equal to the horizontal width of the chamber. The color of the dots indicates the type of flow: stable, intermediate, and unstable flow.
According to the evaluation suggested by DiCarlo (2013), the model should be able to predict preferential flow in terms of finger widths and finger spacings. It has already been demonstrated that finger widths are captured well. To demonstrate the model's capability in terms of finger spacings, the number of fingers can be investigated. Glass et al. (1989c) calculated the number of fingers, including those in contact with the edge of the chamber. They reported that, in the case of preferential flow, the number of fingers does not change significantly with different fluxes, varying between four and six. Given the size of the chamber used in their experiments (30 cm), the expected number of fingers for the 50 cm used in our simulations is approximately between 7 and 10. This corresponds well to the number of fingers developed in the simulations, which ranges from 6 to 10 for preferential flow. Hence, the spacing between the fingers is also well captured.
4.5 Preferential flow as a function of influx
To calculate the degree of preferential water flow, the bypass ratio approach is used, which is defined as the ratio of the preferential flow rate to the total flow rate (Kneale and White, 1984). First, the inflow is calculated for each block corresponding to the horizontal section at a depth of 30 cm. These inflow values are then divided by the top boundary flux qtop to normalize them to 1. The normalized values represent the bypass ratio. The simulation time is always chosen to be sufficiently long to ensure that extending the simulation time period further does not affect the calculated values. Note that, if the flow is uniform throughout the porous medium, the bypass ratio is equal to 1 everywhere.
The left panel of Fig. 7 shows the bypass ratio in the horizontal section at a depth of 30 cm for three different influxes. The color indicates the type of flow: red, green, and blue denote examples of stable, intermediate, and unstable flow, respectively. The bypass ratio for stable flow equals 1 almost everywhere, with no significant flow preferences. For unstable flow, the bypass ratio corresponds to the developed fingers. Water flows only through the fingers, whereas the flow is zero outside the fingers. The intermediate case is quite surprising: water flows through the entire porous medium, but the flow is still highly preferential. This is counterintuitive since the porous medium is fully wetted in this case, yet preferential pathways are formed, through which most of the water flows. The origin of these pathways can be seen in Fig. 5 for qtop=0.005 cm min−1, where they appear as a slight increase in saturation. For a better illustration, the right panel of Fig. 7 shows the saturation profile at a longer simulation time (t=24 000 s), with the maximum value of the color bar adjusted to make the pathways more visible. Developed pathways are well observed and do not disappear even when the porous medium is completely wetted. Comparing the bypass ratio for qtop=0.005 cm min−1 (the left panel of Fig. 7) and the corresponding saturation profile (the right panel of Fig. 7), we can clearly see that the highest bypass ratio corresponds to the most saturated parts of the porous medium.
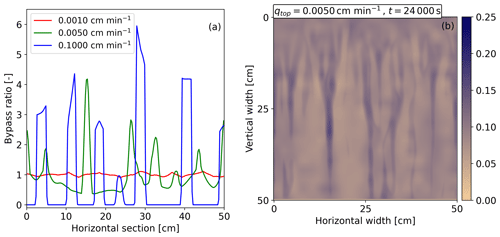
Figure 7(a) The bypass ratio, defined as the ratio of the preferential flow rate to the total flow rate, is shown for stable (red), intermediate (green), and unstable flow (blue) at a depth of 30 cm in the porous medium. There are no significant preferences for stable flow, while pronounced preferential pathways develop for unstable flow. Such behavior is expected for both cases. A surprise, however, is the intermediate case, where water still flows preferentially even when the porous medium is fully wetted. (b) Saturation profile for qtop=0.005 cm min−1 at time t=24 000 s. The simulation corresponds to the intermediate case in the left panel (a) of this figure. Saturation is colored according to the color bar on the right. The pathways of saturation are clearly visible and correspond to the highest bypass ratio values.
We conjecture that this is a very important observation about the problem of preferential flow in unsaturated porous media because experimental measurements are highly limited for this case. Using the semi-continuum model, more details can be observed, making it easier to understand the origin of the preferential pathways for different boundary conditions. For completeness, bypass ratios for all performed simulations are depicted in Fig. A4. It is evident that a similar scenario, as for qtop=0.005 cm min−1, holds for another two intermediate cases, i.e., for qtop=0.0075 and 0.01 cm min−1.
To compare the degree of preferential water flow for different boundary fluxes, it is convenient to represent it with a single value. Again, the horizontal section at a depth of 30 cm is used. We calculate the smallest number of blocks through which at least 50 % of the total amount of water flows at this horizontal section. For each influx, the length is then calculated as Δx×nB, where nB denotes the calculated number of blocks. In the case of uniform flow, the length is equal to half the horizontal width of the porous medium, i.e., 25 cm. The smaller the length is, the more the preferential flow dominates.
Figure 8 shows the length of the porous medium through which 50 % of the water flows, depending on influx. For stable flow, half of the total water flows through almost 25 cm, while, for unstable flow, it ranges between 5.50–8.75 cm. An exception is at qtop=2.5 cm min−1, where the length is 12.50 cm due to significantly wider fingers compared to lower fluxes. For qtop=0.005–0.01 cm min−1 (intermediate case), the length is similar to the values of unstable flow, indicating significant preferential flow. This aligns with the bypass ratio analysis.
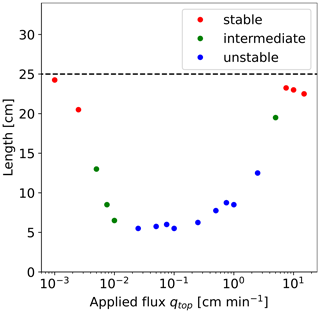
Figure 8The length of the porous medium in the horizontal section at a depth of 30 cm, through which 50 % of the water flows, is plotted against the influx. For each influx, the simulation times are chosen such that the flow through the porous medium does not change any further. The dashed line denotes the case of uniform flow, i.e., 25 cm. The color of the dots indicates the type of flow: stable, intermediate, and unstable flow.
4.6 Wetting-front instability
The cause of preferential flow is the saturation and pressure overshoot (Eliassi and Glass, 2001; Egorov et al., 2003; DiCarlo, 2013). The flux range for the saturation overshoot in 1D (DiCarlo, 2004) experimentally corresponds to the flux range for preferential flow in higher dimensions (Yao and Hendrickx, 1996; Glass et al., 1989c). The same applies to different initial saturation levels (DiCarlo, 2004; Bauters et al., 2000). This simplifies the analysis of wetting-front instability as we can switch to 1D. To analyze whether this experimentally confirmed dependence is replicated by the semi-continuum model, 1D simulations are performed using the same parameters as for 2D simulations. However, the distribution of the intrinsic permeability is not included to avoid influencing the results.
The left panel of Fig. 9 shows saturation profiles for six different applied fluxes qtop. The range for which the saturation overshoot occurs is the same for 1D and 2D simulations. For the lowest influx, qtop=0.001 cm min−1, the profile is stable without saturation overshoot. For qtop=0.010 cm min−1, the saturation overshoot is formed and becomes more pronounced with increasing influx up to qtop=1.000 cm min−1. The saturation overshoot then becomes less pronounced until it disappears completely, and a stable profile is observed again for the highest influx qtop=15.00 cm min−1. This is in good agreement with 1D experiments (DiCarlo, 2010).
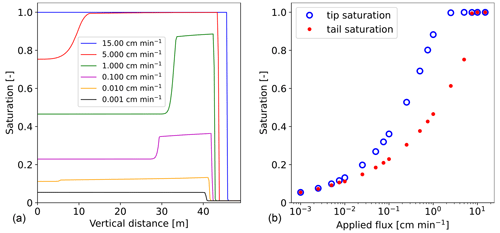
Figure 9(a) Saturation profiles for various applied fluxes. The saturation overshoot is not developed for the lowest flux (qtop=0.001 cm min−1) and the highest flux (qtop=15.00 cm min−1). (b) Finger tip and tail saturations for 18 different infiltration rates. The occurrence of the saturation overshoot is consistent with 2D preferential flow.
The right panel of Fig. 9 shows the saturation of finger tips and tails for 18 different infiltration rates. The results are, again, in agreement with 1D experiments (DiCarlo, 2010). Moreover, the flux range connection between 1D overshoot and 2D preferential flow is well captured by the semi-continuum model. When preferential flow is observed in 2D, significant saturation overshoot is developed in 1D. Conversely, for diffusion-like flow in 2D, no overshoot occurs in 1D. The most interesting results are found for intermediate cases for the flux range between qtop=0.005–0.010 cm min−1, where very small saturation overshoots are formed, with magnitudes between 0.007 and 0.02. Even a small saturation overshoot with a magnitude below 0.02 indicates that the flow is preferential in 2D. For qtop=0.005 cm min−1, the magnitude of the saturation overshoot equals only 0.007, yet the flow remains preferential. This close relationship is quite surprising.
5.1 Preferential flow in the case of a fully wetted porous medium
The semi-continuum model is the first to correctly predict both diffusion-like and finger-like flow for various applied fluxes, as well as being the first to accurately predict experimentally measured finger widths and spacings. The well-captured connection between saturation overshoot in 1D and preferential flow in 2D has also been demonstrated. In addition to these results, we have observed that flow can be highly preferential even when the porous medium is fully wetted and when water flows through the entire medium. This surprising behavior is illustrated for qtop=0.005 cm min−1 in Fig. 7. The flow remains preferential because pathways with slightly increased saturation develop during infiltration into a dry porous medium and persist over time. This slight increase in saturation is enough to make the flow preferential, causing water to flow faster through these pathways. This is due to the power-law nature of the relative permeability function. The left panel of Fig. 10 shows the bypass ratio along with the saturation and relative permeability at a depth of 30 cm. Clearly, the highest bypass ratio values correspond to the highest relative permeability values. A slight difference is caused by the distribution of the intrinsic permeability, as demonstrated in the right panel of Fig. 10, where the effective permeability closely follows the bypass ratio.
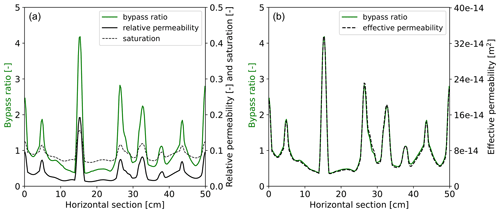
Figure 10(a) The bypass ratio at a depth of 30 cm of the porous medium is plotted for qtop=0.005 cm min−1 at time t=24 000 s, together with the saturation and the corresponding relative permeability. Bypass ratio values are plotted on the left y axis, and values of saturation and relative permeability are plotted on the right y axis. Relative permeability values are multiplied by 100 since these values are much smaller compared to the saturation. It can be clearly seen that the bypass ratio correlates with relative permeability. (b) The bypass ratio at a depth of 30 cm of the porous medium is plotted for qtop=0.005 cm min−1 at time t=24 000 s, together with the effective permeability. Bypass ratio values are plotted on the left y axis, and values of the effective permeability are plotted on the right y axis. Effective permeability closely follows the bypass ratio in this case.
5.2 Formation of saturation overshoot and stabilization of wetting front
Borrowing the term “hold-back pile-up effect” from Eliassi and Glass (2001), saturation overshoot occurs when water cannot enter the dry porous medium, causing water to be held back. This hold-back effect subsequently leads to water piling up above the interface between the wet and dry porous medium. As the amount of water increases, the pressure gradient between the wet and dry parts of the porous medium also increases, allowing water to advance. The same principle applies to the semi-continuum model, where the hold-back effect is caused by appropriate averaging of conductivity. However, it is not the only factor governing the formation of the saturation overshoot in the model. The saturation overshoot is formed by two factors: (1) the geometric mean for averaging the permeability and (2) the scaling of the retention curve. The geometric mean plays a crucial role in creating the hold-back effect, which consequently forms the saturation overshoot. This effect occurs due to the very low relative permeability between blocks, which is a direct consequence of the applied geometric mean. However, without the scaling of the retention curve, the overshoot would disappear as the block size Δx→0 (Vodák et al., 2022). Note that the geometric mean can be replaced by any type of averaging that produces a small value if one of the averaged numbers is small, such as the harmonic mean. The geometric mean is used in the model because it is more appropriate in the case of a random stratified medium, while the harmonic mean is more suitable for a medium which is stratified perpendicularly to the flow direction (Jang et al., 2011).
A crucial question arises: why does the wetting front stabilize at low or high infiltration rates in the semi-continuum model? It is known that the stability of the 2D wetting front correlates with the saturation overshoot in 1D (DiCarlo, 2013). Since the semi-continuum model implies the same conclusions, as demonstrated in Sect. 4.6, it is sufficient to study the origin of the saturation overshoot in 1D. This significantly simplifies the analysis as we do not have to consider the spatial variability of flow in 2D or 3D. When a small amount of water flows into a dry porous medium, the conductivity of this part increases rapidly due to the power-law nature of the relative permeability function. Using the parameters in Table 1, when the saturation increases from 0.01 to 0.05, the relative permeability increases approximately 170 times. At very low infiltration rates, water has enough time to proceed downwards so that the conductivity of the dry part of the porous medium increases significantly, which subsequently allows more water to flow downwards. In principle, this means that water does not have sufficient time to pile up at low infiltration rates. On the other hand, at very high infiltration rates, the porous medium is fully saturated, and, hence, the saturation overshoot cannot occur. This is well observed in Fig. 9 for qtop=15 cm min−1, where the saturation is equal to 1 everywhere. As the applied flux decreases, the porous medium is not fully saturated, and there is room for the saturation overshoot to arise. This can be seen for qtop=5 cm min−1; the saturation at the finger tip is still equal to 1, but the influx is not high enough to fully saturate the entire porous medium, and the saturation overshoot develops. This observation is in agreement with the experiments of DiCarlo (2010). The author showed that the saturation of the finger tip approaches unity at very high infiltration fluxes for which a stable flow is observed (see Fig. 3 in DiCarlo, 2010, for details).
According to the comprehensive experimental works of DiCarlo (2004, 2010), saturation and pressure are constant at the finger tail under uniform top boundary conditions. However, some studies, such as Cho et al. (2005), have shown the opposite. Assuming constant saturation and pressure in the finger tail, the flux between the blocks is stabilized and is given by the value of the top boundary flux qtop. Using the Darcy–Buckingham law given by Eq. (7), we can calculate the saturation in the finger tail:
where Stail denotes the saturation in the finger tail within the relative permeability function. Therefore, Stail is independent of the initial saturation, which is in agreement with experimental measurements (Zhuang et al., 2019). A necessary and sufficient condition for saturation overshoot to form is an increase in the saturation of the block above the value Stail. The saturation overshoot will then develop as the saturation of this block drops to Stail over time. Moreover, for qtop=KS, it follows from Eq. (9) that Stail equals 1. Consequently, the flow will always be stable in the semi-continuum model as long as the influx qtop≥KS because the porous medium is fully saturated in this case, and, thus, saturation overshoot cannot arise. This has been demonstrated in both 1D (Fig. 9) and 2D simulations (Fig. 5). Note that this is consistent with the stability condition (Saffman and Taylor, 1958; Parlange and Hill, 1976; DiCarlo, 2013), which predicts stable flow for qtop≥KS.
5.3 Importance of the geometric mean in terms of water entry value
The porous medium comprises many pores, each characterized by a specific water entry value determined by the Young–Laplace equation based on its principal radii. The shape of the main wetting branch of the retention curve results from the combination of various pore water entry values. The pores with the smallest radii determine the lowest pressure Plow and the corresponding lowest saturation Slow, marking the beginning of the main wetting branch. Although this is a necessary physical characteristic of the porous medium, it has not been implemented into the retention curve used for simulations. This implies that water can enter a dry porous medium at a pressure equal to −∞. In this case, the Young–Laplace equation gives , where r1 and r2 are the principal radii of the curvature of the pore. This relationship is valid only if at least one of these radii equals zero. Such a hypothetical pore is obviously unable to conduct water. The same reasoning applies to the air entry value and the corresponding main draining branch.
The initial saturation used in simulations is higher than Slow; thus, excluding the beginning of the main wetting branch does not affect the obtained results. One might argue that, even if the chosen initial saturation is above Slow, it would still be reasonable to define the value Slow in the retention curve, ensuring the model's validity for a lower initial saturation. This is clearly not implemented in our model, and the retention curve satisfies for S→0. However, the calculated flux in the semi-continuum model equals zero in this case, which aligns with a hypothetical pore with zero radii. This applies due to the application of the geometric mean of the relative permeability and is not valid for the more common arithmetic mean. To illustrate, consider two blocks denoted by indices 1,2, with the first block being fully saturated (S1=1) and with the second block's saturation decreasing towards zero, i.e., S2→0. Assume that κ, μ, and Δx are equal to 1 as these values are independent of saturation and thus do not affect the limiting process. Note that a fully saturated block satisfies k(S1)=1 and Pw(S1)=0. The horizontal flux q between blocks, given by Eq. (7), can then be simplified to
If the arithmetic mean is used instead of the geometric mean, the limit satisfies
For completeness, the numerical limiting process for both means is depicted in Fig. 11 using the parameters specified in Table 1. For the geometric mean, the limit approaches zero, confirming that the flux indeed equals zero for S2→0, while, for the arithmetic mean, the flux approaches infinity. In the case of the geometric mean, the block with zero saturation thus cannot conduct water and represents a hypothetical pore with zero radii. This is consistent with the Young–Laplace equation that yields a pore with zero radii for . On the other hand, with the application of the arithmetic mean, unrealistic behavior would occur: the flux would rapidly increase as saturation decreases, which is clearly not physically correct. Using the arithmetic mean, it is necessary to cut off the retention curve (e.g., by using a water entry value) for low saturation values to avoid an increase in flux when saturation decreases. However, the increase in flux in Fig. 11 occurs already for saturation S2<0.57. We conjecture that the geometric mean or the harmonic mean is thus a more reasonable type of averaging (Jang et al., 2011).
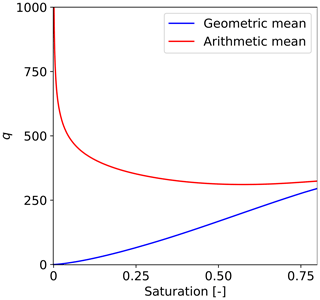
Figure 11Calculated horizontal flux between a fully saturated block (S1=1) and a block with saturation decreasing towards zero (S2→0). The flux equals zero for S2→0 using the geometric mean, while it approaches infinity using the arithmetic mean.
Incorporating the point [Slow,Plow] into the main wetting branch results in a non-smooth retention curve. However, Richards' equation remains unconditionally stable for saturation values above Slow, where the retention curve is smooth. Therefore, to develop saturation overshoot with Richards' equation, it is necessary to violate one of the assumptions of the stability proof derived in Fürst et al. (2009). It is possible to define a bottleneck (zero flux) using a water or air entry pressure (Tesař et al., 2004), which causes non-smoothness of the retention curve. Alternatively, using a non-monotonic influx at the upper boundary can also lead to the formation of saturation overshoot (Steinle and Hilfer, 2017). We conjecture that the model should ideally generate the overshoot without the need for a threshold being incorporated into the model. Forming the saturation overshoot should be a resulting property of the model.
5.4 Effect of intrinsic permeability distribution
One may wonder whether the formation of the saturation overshoot depends on the intrinsic permeability distribution used. As evidenced by 1D simulations in Fig. 9, the saturation overshoot is not caused by the distribution of intrinsic permeability. This corresponds with experimental findings (DiCarlo, 2013), where the formation of saturation overshoot is not determined by heterogeneity. Moreover, Kmec et al. (2023) demonstrated that the distribution has no significant effect on the flow because the nature of the flow remains the same even for eight different intrinsic permeability distributions.
Hence, the questions arise: why use the distribution of intrinsic permeability and how does this distribution affect the development of preferential pathways? Even a slight distribution of intrinsic permeability can cause water not to flow uniformly through the entire porous medium in 2D and 3D. This is expected because no heterogeneity is introduced in the governing equation; hence, water will always flow uniformly unless some additional heterogeneity is introduced. This is demonstrated for 2D simulations in Fig. 12, where saturation profiles for four different infiltration rates without a distribution of intrinsic permeability are shown. The overshoot is observed at qtop=0.05 and 0.25 cm min−1 but not at very low and very high infiltration rates, which is consistent with the previous simulations. Therefore, it is evident that the intrinsic permeability distribution is not the cause of the formation of the saturation overshoot in 2D but rather causes water to flow preferentially. To summarize, (1) when using only the distribution of intrinsic permeability without incorporating the geometric mean and the scaling of the retention curve, the overshoot will not be formed. Consequently, the flow is diffusive in this scenario, and water always flows throughout the entire porous medium. (2) When using only the geometric mean and the scaling of the retention curve, the overshoot can be formed depending on initial and boundary conditions. However, the flow remains uniform throughout the entire porous medium. By combining (1) and (2), the saturation overshoot can be formed, and then water does not flow uniformly.

Figure 12Saturation profiles for four different infiltration rates qtop=0.001, 0.05, 0.25, 15 cm min−1. The distribution of intrinsic permeability is not used. Each frame displays the influx and simulation time. Saturation is colored according to the color bar on the right.
Moreover, when the distribution is employed in the semi-continuum model but the saturation overshoot does not occur (e.g., in the case of low influx), water tends to flow diffusively. This aligns well with experimental observations. Other similar models fail in this case as water flows preferentially even when the saturation overshoot is not formed. In our case, if the overshoot is formed, preferential flow is observed. If there is no overshoot, preferential flow disappears. The distribution of intrinsic permeability is included to make water flow non-uniformly (preferentially) throughout the entire porous medium, but this non-uniformity occurs only when the physics of the semi-continuum model allows it, i.e., when the overshoot is formed.
5.5 Model validation and future plans
The semi-continuum model has been shown to be consistent with well-known experiments in 1D (Kmec et al., 2019) and 2D (Kmec et al., 2021, 2023). Based on the results presented in this paper, we conjecture that the model has been validated by core experiments performed in unsaturated homogeneous porous media (Glass et al., 1988, 1989b, c, a; Selker et al., 1992; Liu et al., 1994; Yao and Hendrickx, 1996; Bauters et al., 2000; DiCarlo, 2004, 2007, 2010; Sililo and Tellam, 2005; Rezanezhad et al., 2006). For a heterogeneous porous medium, the model has been applied (Kmec et al., 2021) to simulate water infiltration experiments in a layered porous medium (Rezanezhad et al., 2006). Therefore, the semi-continuum model is successfully validated according to DiCarlo's approach (DiCarlo, 2013).
A crucial aspect of the model is to account for the retention curve sensitivity to the dimension of the laboratory sample (Ghanbarian et al., 2015). This sensitivity is addressed by incorporating a single parameter, the reference block size Δx0, into the semi-continuum model. This makes the simulations sensitive to this parameter, but once Δx0 is appropriately set through calibration, the simulations become independent of the block size Δx. Therefore, the results are consistent regardless of the computational mesh size used. The convergence of moisture profiles in 1D and 2D for Δx varying over 2 orders of magnitude is demonstrated in Vodák et al. (2022).
The semi-continuum model can be adapted for more complex natural conditions by incorporating different initial and boundary conditions. This adaptability makes the model applicable to large-scale in-field experiments, which is highly desirable for hydrological applications. A complete validation of the semi-continuum model ensures the accuracy and reliability of its results on a large scale. However, the semi-continuum model is computationally intensive; thus, the development of a method to speed up its numerical scheme is necessary. Our future plan is to develop a new numerical scheme based on the lattice Boltzmann method as it has been successfully applied to Richards' equation (Ginzburg et al., 2004). This will allow us to simulate large-scale experiments effectively.
It has long been known that the behavior of the wetting front in an initially dry and homogeneous porous medium strongly depends on the applied infiltration flux. The wetting front remains stable at both low and high infiltration fluxes but becomes unstable within a certain intermediate flux range. The instability is characterized by the formation of fingers that vary in terms of width, velocity, and spacing. Despite decades of experimental observations, no model has yet been developed to reliably capture this dependence. In this paper, we introduced a partial differential equation that includes a Prandtl-type hysteresis operator under the spatial derivative. This equation represents a formal limit of the semi-continuum model of liquid transport in a porous medium. The semi-continuum model accurately captures the complex behavior of infiltration flux dependence. This includes the transition from diffusion-like to finger-like flow and then back to diffusion-like flow as the infiltration flux increases. It also correctly predicts finger widths and spacings. In addition, the model helps explain preferential flow and provides insight into the formation of an unstable wetting front.
A1 Dependence of flow on infiltration rate
A total of 18 simulations for infiltration rates ranging from qtop=0.001 to qtop=15 cm min−1 are presented here. Figures A1 and A2 show a snapshot of the saturation profiles for all applied fluxes. The time for each influx is chosen so that the saturation reaches 40 cm from the upper boundary. The applied influx and simulation time are displayed in the upper-left corner of each frame. The transition between stable and unstable flow is clearly observed.
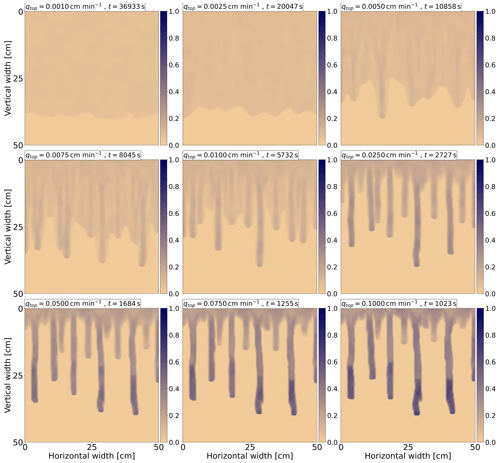
Figure A1Saturation profiles for nine different infiltration rates ranging from qtop=0.001 to 0.1 cm min−1. Each frame displays the influx and simulation time. Saturation is colored according to the color bar on the right.
A2 Finger segmentations
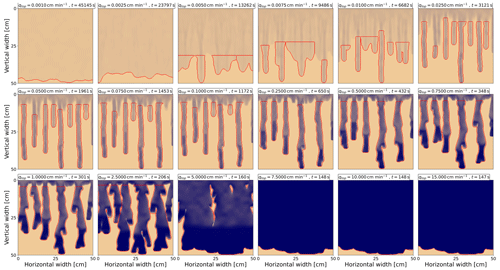
Figure A3Finger segmentations for 18 different infiltration rates ranging from qtop=0.001 to qtop=15 cm min−1. The segmentations are marked in red. The time for each influx is chosen so that the saturation reaches the bottom of the chamber. The applied influx and simulation time are displayed in the upper-left corner of each frame.
A3 Bypass ratio
Figure A4 shows the bypass ratio at a depth of 30 cm for 18 different infiltration rates ranging from qtop=0.001 to qtop=15 cm min−1. The bypass ratio is marked in red and is plotted along with the saturation (in blue) across the same horizontal section. The highest values of the bypass ratio correlate with the locations of the highest saturation values. However, this correlation decreases if the saturation is high enough, as seen for qtop≥7.5 cm min−1. In such cases, the slight change in saturation does not significantly affect the relative permeability values, and, therefore, the bypass ratio remains also unaffected. Instead, the dominant factor influencing the flow is the intrinsic permeability of the porous medium.
Note that the porous medium is first fully saturated for qtop=7.5 and qtop=10 cm min−1 (see Fig. A2). However, the saturation then decreases because the bottom boundary flux qbot approximately equals KS=15 cm min−1, which is larger than qtop. In this scenario, the saturation should correspond to the calculated value Stail given by Eq. (9). Considering the distribution of the intrinsic permeability, the average value of the calculated Stail at a depth of 30 cm is 0.8540 and 0.9218 for qtop=7.5 and qtop=10 cm min−1, respectively. The average values from simulations at a depth of 30 cm are 0.8552 and 0.9225, showing that the saturation indeed corresponds to the calculated values Stail. Therefore, the saturation at the finger tail always tends to decrease to the value obtained by Eq. (9). Moreover, for qtop=15 cm min−1, the porous medium remains fully saturated even when water flows from the bottom boundary as Stail=1 in this case.
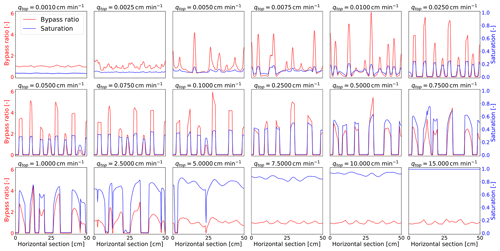
Figure A4The bypass ratio at a depth of 30 cm of the porous medium for 18 different infiltration rates ranging from qtop=0.001 to qtop=15 cm min−1. The bypass ratio is marked in red and is plotted along with the saturation (in blue) across the same horizontal section. Bypass ratio values are plotted on the left y axis, and values of saturation are plotted on the right y axis. The corresponding influx is displayed at the top of each frame.
The software code used to produce the simulations is written in Python and can be downloaded from Kmec (2023a) (https://doi.org/10.5281/zenodo.10117915). The code supports 1D, 2D, and 3D simulations. The simulation data required to create the plots included in the paper can be downloaded from Kmec and Šír (2024a) (https://doi.org/10.5281/zenodo.13768956) and Kmec and Šír (2024b) (https://doi.org/10.5281/zenodo.13769113). Please do not hesitate to contact us if you encounter any problems while downloading the software code and simulation data.
Videos of the transient simulations for all 2D cases can be downloaded from Kmec (2023b) (https://doi.org/10.5281/zenodo.10090841).
JK and MS wrote the paper. JK implemented the computer code and ran and analyzed the simulations.
The contact author has declared that none of the authors has any competing interests.
Publisher's note: Copernicus Publications remains neutral with regard to jurisdictional claims made in the text, published maps, institutional affiliations, or any other geographical representation in this paper. While Copernicus Publications makes every effort to include appropriate place names, the final responsibility lies with the authors.
Jakub Kmec gratefully acknowledges the support of the Operational Programme Research, Development and Education (grant no. CZ.02.1.01/0.0/0.0/17_049/0008422) of the Ministry of Education, Youth and Sports of the Czech Republic. Computational resources were provided by the e-INFRA CZ project (ID no. 90254), supported by the Ministry of Education, Youth and Sports of the Czech Republic. Special thanks are given to Rostislav Vodák for the helpful discussion regarding the theoretical part of this paper and to Tadeáš Fryčák for his significant help in improving the code of the semi-continuum model.
This research has been supported by the EU and the Ministry of Education, Youth and Sports of the Czech Republic (grant no. CZ.02.1.01/0.0/0.0/17_049/0008422).
This paper was edited by Roberto Greco and reviewed by Stefano Barontini and two anonymous referees.
Abreu, E., Bustos, A., Ferraz, P., and Lambert, W.: A Relaxation Projection Analytical–Numerical Approach in Hysteretic Two-Phase Flows in Porous Media, J. Sci. Comput., 79, 1936–1980, 2019. a
Aminzadeh, B. and DiCarlo, D. A.: The Transition between Sharp and Diffusive Wetting Fronts as a Function of Imbibing Fluid Properties, Vadose Zone J., 9, 588–596, https://doi.org/10.2136/vzj2009.0072, 2010. a
Bauters, T. W. J., DiCarlo, D. A., Steenhuis, T., and Parlange, J.-Y.: Soil water content dependent wetting front characteristics in sands, J. Hydrol., 231–232, 244–254, https://doi.org/10.1016/S0022-1694(00)00198-0, 2000. a, b, c, d, e, f, g
Bear, J.: Dynamics of Fluids in Porous Media, American Elsevier Publishing Company, ISBN 10 044400114X, ISBN 13 978-0444001146, 1972. a
Beliaev, A. Y. and Hassanizadeh, S. M.: A Theoretical Model of Hysteresis and Dynamic Effects in the Capillary Relation for Two-phase Flow in Porous Media, Transp. Porous Media, 43, 487–510, 2001. a
Beljadid, A., Cueto-Felgueroso, L., and Juanes, R.: A continuum model of unstable infiltration in porous media endowed with an entropy function, Adv. Water Resour., 144, 103684, https://doi.org/10.1016/j.advwatres.2020.103684, 2020. a, b, c
Brandhorst, N., Erdal, D., and Neuweiler, I.: Coupling saturated and unsaturated flow: comparing the iterative and the non-iterative approach, Hydrol. Earth Syst. Sci., 25, 4041–4059, https://doi.org/10.5194/hess-25-4041-2021, 2021. a
Brindt, N. and Wallach, R.: The moving-boundary approach for modeling 2D gravity-driven stable and unstable flow in partially wettable soils, Water Resour. Res., 56, e2019WR025772, https://doi.org/10.1029/2019WR025772, 2020. a
Buckingham, E.: Studies on the Movement of Soil Moisture, Bulletin 38, USDA Bureau of Soils, Government Printing Office, Washington, https://archive.org/details/studiesonmovemen38buck (last access: 14 November 2024), 1907. a
Bundt, M., Albrecht, A., Froidevaux, P., Blaser, P., and Flühler, H.: Impact of preferential flow on radionuclide distribution in soil, Environ. Sci. Technol., 44, 3895–3899, 2000. a
Chen, L., Qiu, Q., Wang, P., Zhang, X., and Zhang, Z.: Visualization study on preferential flow in highly saturated and super hydrophilic porous media by combining dye tracking and infrared imaging, J. Hydrol., 612, 128077, https://doi.org/10.1016/j.jhydrol.2022.128077, 2022. a
Cho, H., de Rooij, G. H., and Inoue, M.: The Pressure Head Regime in the Induction Zone During Unstable Nonponding Infiltration: Theory and Experiments, Vadose Zone J., 4, 908–914, https://doi.org/10.2136/vzj2004.0158, 2005. a
Chuoke, R. L., van Meurs, P., and van der Poel, C.: The instability of slow, immiscible, viscous liquid-liquid displacements in permeable media, Trans. AIME, 216, 88–194, 1959. a, b, c
Cremer, C. J. M., Schuetz, C., Neuweiler, I., Lehmann, P., and Lehmann, E. H.: Unstable Infiltration Experiments in Dry Porous Media, Vadose Zone J., 16, 1–13, https://doi.org/10.2136/vzj2016.10.0092, 2017. a
Cueto-Felgueroso, L. and Juanes, R.: A phase field model of unsaturated flow, Water Resour. Res., 45, W10409, https://doi.org/10.1029/2009WR007945, 2009. a, b, c
Cueto-Felgueroso, L., Suarez-Navarro, M. J., Fu, X., and Juanes, R.: Numerical Simulation of Unstable Preferential Flow during Water Infiltration into Heterogeneous Dry Soil, Water, 12, 909, https://doi.org/10.3390/w12030909, 2020. a
Dekker, L. W. and Ritsema, C. J.: How water moves in a water repellent sandy soil: 1. Potential and actual water repellency, Water Resour. Res., 30, 2507–2517, https://doi.org/10.1029/94WR00749, 1994. a
de Rooij, G. H.: Modeling fingered flow of water in soils owing to wetting front instability: a review, J. Hydrol., 231–232, 277–294, https://doi.org/10.1016/S0022-1694(00)00201-8, 2000. a, b
DiCarlo, D. A.: Experimental measurements of saturation overshoot on infiltration, Water Resour. Res., 40, W04215, https://doi.org/10.1029/2003WR002670, 2004. a, b, c, d, e, f
DiCarlo, D. A.: Capillary pressure overshoot as a function of imbibition flux and initial water content, Water Resour. Res., 43, W08402, https://doi.org/10.1029/2006WR005550, 2007. a, b
DiCarlo, D. A.: Can continuum extensions to multiphase flow models describe preferential flow?, Vadose Zone J., 9, 268–277, https://doi.org/10.2136/vzj2009.0099, 2010. a, b, c, d, e, f, g
DiCarlo, D. A.: Stability of gravity-driven multiphase flow in porous media: 40 Years of advancements, Water Resour. Res., 49, 4531–4544, https://doi.org/10.1002/wrcr.20359, 2013. a, b, c, d, e, f, g, h, i, j, k, l, m, n, o, p, q, r, s, t
DiCarlo, D. A., Bauters, T. W. J., Darnault, C. J. G., Steenhuis, T., and Parlange, J.-Y.: Lateral expansion of preferential flow paths in sands, Water Resour. Res., 35, 427–434, 1999. a
Diment, G. A. and Watson, K. K.: Stability analysis of water movement in unsaturated porous materials: 2. Numerical studies, Water Resour. Res., 19, 1002–1010, https://doi.org/10.1029/WR019i004p01002, 1983. a
Diment, G. A. and Watson, K. K.: Stability Analysis of Water Movement in Unsaturated Porous Materials: 3. Experimental Studies, Water Resour. Res., 21, 979–984, https://doi.org/10.1029/WR021i007p00979, 1985. a
Diment, G. A., Watson, K. K., and Blennerhassett, P. J.: Stability analysis of water movement in unsaturated porous materials: 1. Theoretical considerations, Water Resour. Res., 18, 1248–1254, https://doi.org/10.1029/WR018i004p01248, 1982. a
Egorov, A. G., Dautov, R. Z., Nieber, J. L., and Sheshukov, A. Y.: Stability analysis of gravity-driven infiltrating flow, Water Resour. Res., 39, 1266, https://doi.org/10.1029/2002WR001886, 2003. a
Eliassi, M. and Glass, R. J.: On the continuum-scale modeling of gravity-driven fingers in unsaturated porous media: The inadequacy of the Richards equation with standard monotonic constitutive relations and hysteretic equations of state, Water Resour. Res., 37, 2019–2035, 2001. a, b
Eliassi, M. and Glass, R. J.: On the porous-continuum modeling of gravity-driven fingers in unsaturated materials: Extension of standard theory with a hold-back-pile-up effect, Water Resour. Res., 38, 16-1–16-11, https://doi.org/10.1029/2001WR001131, 2002. a
Esmaeilpour, M., Ghanbarian, B., Liang, F., and Liu, H.-H.: Scale-dependent permeability and formation factor in porous media: Applications of percolation theory, Fuel, 301, 121090, https://doi.org/10.1016/j.fuel.2021.121090, 2021. a
Ewing, R. P., Hu, Q., and Liu, C.: Scale dependence of intragranular porosity, tortuosity, and diffusivity, Water Resour. Res., 46, W06513, https://doi.org/10.1029/2009WR008183, 2010. a
Fürst, T., Vodák, R., Šír, M., and Bíl, M.: On the incompatibility of Richards' equation and finger-like infiltration in unsaturated homogeneous porous media, Water Resour. Res., 45, W03408, https://doi.org/10.1029/2008WR007062, 2009. a, b
Ghanbarian, B., Taslimitehrani, V., Dong, G., and Pachepsky, Y. A.: Sample dimensions effect on prediction of soil water retention curve and saturated hydraulic conductivity, J. Hydrol., 528, 127–137, https://doi.org/10.1016/j.jhydrol.2015.06.024, 2015. a, b, c, d
Ghanbarian, B., Taslimitehrani, V., and Pachepsky, Y. A.: Accuracy of sample dimension-dependent pedotransfer functions in estimation of soil saturated hydraulic conductivity, CATENA, 149, 374–380, https://doi.org/10.1016/j.catena.2016.10.015, 2017. a
Ghanbarian, B., Esmaeilpour, M., Ziff, R. M., and Sahimi, M.: Effect of Pore-Scale Heterogeneity on Scale-Dependent Permeability: Pore-Network Simulation and Finite-Size Scaling Analysis, Water Resour. Res., 57, e2021WR030664, https://doi.org/10.1029/2021WR030664, 2021. a, b
Ginzburg, I., Carlier, J.-P., and Kao, C.: Lattice Boltzmann approach to Richards' equation, in: Computational Methods in Water Resources, vol. 1, vol. 55 of Developments in Water Science, Elsevier, 583–595, https://doi.org/10.1016/S0167-5648(04)80083-2, 2004. a
Glass, R. J. and Yarrington, L.: Simulation of gravity fingering in porous media using a modified invasion percolation model, Geoderma, 70, 231–252, https://doi.org/10.1016/0016-7061(95)00087-9, 1996. a
Glass, R. J. and Yarrington, L.: Mechanistic modeling of fingering, nonmonotonicity, fragmentation, and pulsation within gravity/buoyant destabilized two-phase/unsaturated flow, Water Resour. Res., 39, 1058, https://doi.org/10.1029/2002WR001542, 2003. a
Glass, R. J., Parlange, J.-Y., and Steenhuis, T. S.: Wetting front instability as a rapid and farreaching hydrologic process in the vadose zone, J. Contam. Hydrol., 3, 207–226, https://doi.org/10.1016/0169-7722(88)90032-0, 1988. a, b
Glass, R. J., Oosting, G. H., and Steenhuis, T. S.: Preferential solute transport in layered homogeneous sands as a consequence of wetting front instability, J. Hydrol., 110, 87–105, https://doi.org/10.1016/0022-1694(89)90238-2, 1989a. a, b
Glass, R. J., Parlange, J.-Y., and Steenhuis, T. S.: Mechanism for finger persistence in homogenous unsaturated, porous media: Theory and verification, Soil Sci., 148, 60–70, https://doi.org/10.1097/00010694-198907000-00007, 1989b. a, b, c
Glass, R. J., Parlange, J.-Y., and Steenhuis, T. S.: Wetting front instability. 2. Experimental determination of relationships between system parameters and two-dimensional unstable flow field behavior in initially dry porous media, Water Resour. Res., 25, 1195–1207, https://doi.org/10.1029/WR025i006p01195, 1989c. a, b, c, d, e, f, g, h, i, j, k, l, m
Glass, R. J., Cann, S., King, J., Baily, N., Parlange, J.-Y., and Steenhuis, T. S.: Wetting front instability in unsaturated porous media: a three-dimensional study in initially dry sand, Transport Porous Med., 5, 247–268, 1990. a
Glass, R. J., Conrad, S. H., and Peplinksi, W.: Gravity-destabilized nonwetting phase invasion in macroheterogeneousporous media: Experimental observations of invasion dynamics and scale analysis, Water Resour. Res., 36, 3121–3137, 2000. a
Gomez, H., Cueto-Felgueroso, L., and Juanes, R.: Three-dimensional simulation of unstable gravity-driven infiltration of water into a porous medium, J. Comput. Phys, 238, 217–239, https://doi.org/10.1016/j.jcp.2012.12.018, 2013. a
Hassanizadeh, S. M., Celia, M. A., and Dahle, H. K.: Dynamic effects in the capillary pressure-saturation relationship and its impact on unsaturated flow, Vadose Zone J., 1, 38–57, https://doi.org/10.2136/vzj2002.3800, 2002. a
Hill, D. E. and Parlange, J. Y.: Wetting front instability in layered soils, Soil Sci. Soc. Am. Proc., 36, 697–702, 1972. a
Hunt, A. G., Ewing, R. P., and Horton, R.: What's wrong with soil physics, Soil Sci. Soc. Am. J., 77, 1877–1887, https://doi.org/10.2136/sssaj2013.01.0020, 2013. a
Jang, J., Narsilio, G. A., and Santamarina, J. C.: Hydraulic conductivity in spatially varying media – a pore-scale investigation, Geophys. J. Int., 184, 1167–1179, 2011. a, b, c
Kmec, J.: Semi-continuum model, Zenodo [code], https://doi.org/10.5281/zenodo.10117915, 2023a. a, b
Kmec, J.: Videos for: Modeling 2D gravity-driven flow in unsaturated porous media for different infiltration rates, Zenodo [video supplement], https://doi.org/10.5281/zenodo.10090841, 2023b. a, b, c
Kmec, J. and Šír, M.: Simulation data for (part 1): Modeling 2D gravity-driven flow in unsaturated porous media for different infiltration rates, Zenodo [data set], https://doi.org/10.5281/zenodo.13768956, 2024a. a
Kmec, J. and Šír, M.: Simulation data for (part 2): Modeling 2D gravity-driven flow in unsaturated porous media for different infiltration rates, Zenodo [data set], https://doi.org/10.5281/zenodo.13769113, 2024b. a
Kmec, J., Fürst, T., Vodák, R., and Šír, M.: A semi-continuum model of saturation overshoot in one dimensional unsaturated porous media flow, Sci. Rep.-UK, 9, 8390, https://doi.org/10.1038/s41598-019-44831-x, 2019. a, b
Kmec, J., Fürst, T., Vodák, R., and Šír, M.: A two dimensional semi-continuum model to explain wetting front instability in porous media, Sci. Rep.-UK, 11, 3223, https://doi.org/10.1038/s41598-021-82317-x, 2021. a, b, c, d, e
Kmec, J., Šír, M., Fürst, T., and Vodák, R.: Semi-continuum modeling of unsaturated porous media flow to explain Bauters' paradox, Hydrol. Earth Syst. Sci., 27, 1279–1300, https://doi.org/10.5194/hess-27-1279-2023, 2023. a, b, c, d, e, f, g, h
Kneale, W. R. and White, R. E.: The movement of water through cores of a dry (cracked) clay-loam grassland topsoil, J. Hydrol., 67, 361–365, https://doi.org/10.1016/0022-1694(84)90251-8, 1984. a
Kutílek, M. and Nielsen, D.: Soil Hydrology, Catena Verlag, Germany, ISBN 978-3-923381-26-5, US-ISBN 978-1-59326-258-7, ISBN 978-3-510-65387-4, https://www.schweizerbart.de/publications/detail/isbn/9783510653874/Kutilek_Nielsen_Soil_Hydrology_GeoEcol (last access: 14 November 2024), 1994. a
Lake, L., Johns, R., Rossen, W., and Pope, G.: Fundamentals of Enhanced Oil Recovery, Society of Petroleum Engineers, Richardson, Texas, ISBN 978-1-61399-328-6, 2014. a
Larson, R. G. and Morrow, N. R.: Effects of sample size on capillary pressures in porous media, Powder Technol., 30, 123–138, https://doi.org/10.1016/0032-5910(81)80005-8, 1981. a
Lenhard, R. J. and Parker, J. C.: A model for hysteretic constitutive relations governing multiphase flow: 2. Permeability-saturation relations, Water Resour. Res., 23, 2197–2206, 1987. a
Lenormand, R., Touboul, E., and Zarcone, C.: Numerical models and experiments on immiscible displacement in porous media, J. Fluid Mech., 189, 165–187, https://doi.org/10.1017/S0022112088000953, 1988. a
Liu, H.-H.: The Large-Scale Hydraulic Conductivity for Gravitational Fingering Flow in Unsaturated Homogenous Porous Media: A Review and Further Discussion, Water, 14, 3660, https://doi.org/10.3390/w14223660, 2022. a
Liu, H.-H., Zhang, R., and Bodvarsson, G. S.: An active region model for capturing fractal flow patterns in unsaturated soils: Model development, J. Contam. Hydrol., 80, 18–30, https://doi.org/10.1016/j.jconhyd.2005.07.002, 2005. a
Liu, Y., Steenhuis, T. S., and Parlange, J. Y.: Formation and persistence of fingered flow fields in coarse grained soils under different moisture contents, J. Hydrol., 159, 187–195, https://doi.org/10.1016/0022-1694(94)90255-0, 1994. a, b
Liu, Y., Zhang, S., and Liu, H.-H.: The relationship between fingering flow fraction and water flux in unsaturated soil at the laboratory scale, J. Hydrol., 622, 129695, https://doi.org/10.1016/j.jhydrol.2023.129695, 2023. a
McNamara, H.: An estimate of energy dissipation due to soil-moisture hysteresis, Water Resour. Res., 50, 725–735, https://doi.org/10.1002/2012WR012634, 2014. a
Mishra, B. K. and Sharma, M. M.: Measurement of pore size distributions from capillary pressure curves, AIChE J., 34, 684–687, https://doi.org/10.1002/aic.690340420, 1988. a, b
Mualem, Y.: A new model for predicting the hydraulic conductivity of unsaturated porous media, Water Resour. Res., 12, 513–522, https://doi.org/10.1029/WR012i003p00513, 1976. a
Ommi, S. H., Sciarra, G., and Kotronis, P.: A phase field model for partially saturated geomaterials describing fluid–fluid displacements. Part I: The model and one-dimensional analysis, Adv. Water Resour., 164, 104170, https://doi.org/10.1016/j.advwatres.2022.104170, 2022a. a
Ommi, S. H., Sciarra, G., and Kotronis, P.: A phase field model for partially saturated geomaterials describing fluid–fluid displacements, Part II: Stability analysis and two-dimensional simulations, Adv. Water Resour., 164, 104201, https://doi.org/10.1016/j.advwatres.2022.104201, 2022b. a
Pales, A. R., Li, B., Clifford, H. M., Kupis, S., Edayilam, N., Montgomery, D., Liang, W.-Z., Dogan, M., Tharayil, N., Martinez, N., Moysey, S., Powell, B., and Darnault, C. J. G.: Preferential flow systems amended with biogeochemical components: imaging of a two-dimensional study, Hydrol. Earth Syst. Sci., 22, 2487–2509, https://doi.org/10.5194/hess-22-2487-2018, 2018. a
Parker, J. C. and Lenhard, R. J.: A model for hysteretic constitutive relations governing multiphase flow: 1. Saturation-pressure relations, Water Resour. Res., 23, 2187–2196, https://doi.org/10.1029/WR023i012p02187, 1987. a
Parlange, J. and Hill, D. E.: Theoretical analysis of wetting front instability in soils, Soil Sci., 122, 236–239, 1976. a, b, c
Perfect, E., McKay, L. D., Cropper, S. C., Driese, S. G., Kammerer, G., and Dane, J. H.: Capillary Pressure–Saturation Relations for Saprolite: Scaling With and Without Correction for Column Height, Vadose Zone J., 3, 493–501, https://doi.org/10.2136/vzj2004.0493, 2004. a
Pražák, J., Šir, M., and Tesař, M.: Retention cruve of simple capillary networks, J. Hydrol. Hydromech., 47, 117–131, 1999. a, b
Primkulov, B. K., Talman, S., Khaleghi, K., Shokri, A. R., Chalaturnyk, R., Zhao, B., MacMinn, C. W., and Juanes, R.: Quasistatic fluid-fluid displacement in porous media: Invasion-percolation through a wetting transition, Phys. Rev. Fluids, 3, 104001, https://doi.org/10.1103/PhysRevFluids.3.104001, 2018. a
Rezanezhad, F., Vogel, H.-J., and Roth, K.: Experimental study of fingered flow through initially dry sand, Hydrol. Earth Syst. Sci. Discuss., 3, 2595–2620, https://doi.org/10.5194/hessd-3-2595-2006, 2006. a, b, c, d
Richards, L. A.: Capillary conduction of liquid through porous media, Physics, 1, 318–333, https://doi.org/10.1063/1.1745010, 1931. a
Roche, W. J., Murphy, K., and Flynn, D. P.: Modelling preferential flow through unsaturated porous media with the Preisach model and an extended Richards Equation to capture hysteresis and relaxation behaviour, J. Phys. Conf. Ser., 1730, 012002, https://doi.org/10.1088/1742-6596/1730/1/012002, 2021. a
Saffman, P. G. and Taylor, G. I.: The penetration of a fluid into a porous medium or Hele-Shaw cell containing a more viscous liquid, P. Roy. Soc. Lond. A Mat., 245, 312–329, https://doi.org/10.1098/rspa.1958.0085, 1958. a, b
Schaap, M. and Leij, F.: Improved Prediction of Unsaturated Hydraulic Conductivity with the Mualem-van Genuchten Model, Soil Sci. Soc. Am. J., 64, 843–851, https://doi.org/10.2136/sssaj2000.643843x, 2000. a
Schroth, M., Ahearn, S., Selker, J., and Istok, J.: Characterization of Miller-similar silica sands for laboratory hydrologic studies, Soil Sci. Soc. Am. J., 60, 1331–1339, https://doi.org/10.2136/sssaj1996.03615995006000050007x, 1996. a
Schweizer, B.: Hysteresis in porous media: Modelling and analysis, Interface. Free Bound., 19, 417–447, https://doi.org/10.4171/IFB/388, 2017. a, b
Selker, J., Parlange, J.-Y., and Steenhuis, T.: Fingered flow in two dimensions: 2. Predicting finger moisture profile, Water Resour. Res., 28, 2523–2528, https://doi.org/10.1029/92WR00962, 1992. a
Sililo, O. T. N. and Tellam, J. H.: Fingering in Unsaturated Zone Flow: A Qualitative Review with Laboratory Experiments on Heterogeneous Systems, Ground Water, 38, 864–871, https://doi.org/10.1111/j.1745-6584.2000.tb00685.x, 2005. a, b
Silva, M. L. N., Libardi, P. L., and Gimenes, F. H. S.: Soil water retention curve as affected by sample height, Rev. Bras. Cienc. Solo, 42, e0180058, https://doi.org/10.1590/18069657rbcs20180058, 2018. a, b, c
Šimůnek, J. and Suarez, D. L.: Two-dimensional transport model for variably saturated porous media with major ion chemistry, Water Resour. Res., 30, 1115–1133, 1994. a
Smith, W. O.: Infiltration in sands and its relation to groundwater recharge, Water Resour. Res., 3, 539–555, 1967. a, b
Steinle, R. and Hilfer, R.: Hysteresis in relative permeabilities suffices for propagation of saturation overshoot: A quantitative comparison with experiment, Phys. Rev. E, 95, 043112, https://doi.org/10.1103/PhysRevE.95.043112, 2017. a
Sutherland, K. and Chase, G.: Filters and Filtration Handbook, in: 5th Edn., Elsevier, Oxford, ISBN 978-1-8561-7464-0, 2008. a
Tesař, M., Šír, M., Pražák, J., and Lichner, L.: Instability driven flow and runoff formation in a small catchment, Geol. Acta, 2, 147–156, https://doi.org/10.1344/105.000001435, 2004. a, b
Vafai, K.: Porous Media: Applications in Biological Systems and Biotechnology, CRC Press, https://doi.org/10.1201/9781420065428, 2010. a
van Genuchten, M. Th.: A closed-form equation for predicting the hydraulic conductivity of unsaturated soils, Soil Sci. Soc. Am. J., 44, 892–898, https://doi.org/10.2136/sssaj1980.03615995004400050002x, 1980. a, b
Visintin, A.: Differential models of hysteresis, Springer, New York, https://doi.org/10.1007/978-3-662-11557-2, 1993. a, b, c
Vodák, R., Fürst, T., Šír, M., and Kmec, J.: The difference between semi-continuum model and Richards' equation for unsaturated porous media flow, Sci. Rep.-UK, 12, 7650, https://doi.org/10.1038/s41598-022-11437-9, 2022. a, b, c, d, e, f, g, h, i
Wei, H., Zhu, X., Liu, X., Yang, H., Tao, W.-Q., and Chen, L.: Pore-scale study of drainage processes in porous media with various structural heterogeneity, Int. Commun. Heat Mass, 132, 105914, https://doi.org/10.1016/j.icheatmasstransfer.2022.105914, 2022. a
Wei, Y., Cejas, C. M., Barrois, R., Dreyfus, R., and Durian, D. J.: Morphology of Rain Water Channeling in Systematically Varied Model Sandy Soils, Phys. Rev. Appl., 2, 044004, https://doi.org/10.1103/PhysRevApplied.2.044004, 2014. a
White, J. A., Borja, R. I., and Fredrich, J. T.: Calculating the effective permeability of sandstone with multiscale lattice Boltzmann/finite element simulations, Acta Geotech., 1, 195–209, https://doi.org/10.1007/s11440-006-0018-4, 2006. a, b
Xiong, Y.: Flow of water in porous media with saturation overshoot: A review, J. Hydrol., 510, 353–362, https://doi.org/10.1016/j.jhydrol.2013.12.043, 2014. a, b
Yao, T. and Hendrickx, J. M. H.: Stability of wetting fronts in dry homogeneous soils under low infiltration rates, Soil Sci. Soc. Am. J., 60, 20–28, https://doi.org/10.2136/sssaj1996.03615995006000010006x, 1996. a, b, c, d, e, f, g, h, i, j
Zhou, D. and Stenby, E. H.: Interpretation of capillary-pressure curves using invasion percolation theory, Transport Porous Med., 11, 17–31, https://doi.org/10.1007/BF00614632, 1993. a
Zhuang, L., Hassanizadeh, S. M., van Duijn, C. J., Zimmermann, S., Zizina, I., and Helmig, R.: Experimental and numerical studies of saturation overshoot during infiltration into a dry soil, Vadose Zone J., 18, 180167, https://doi.org/10.2136/vzj2018.09.0167, 2019. a


