the Creative Commons Attribution 4.0 License.
the Creative Commons Attribution 4.0 License.
Processes and controls of regional floods over eastern China
Yixin Yang
Jinghan Zhang
Qiang Wang
Mounting evidence points to elevated regional flood hazards in a changing climate, but existing knowledge about their processes and controls is limited. This is partially attributed to inadequate characterizations of the spatial extent and potential drivers of these floods. Here we develop a machine-learning-based framework (mainly including the Density Based Spatial Clustering Applications with Noise (DBSCAN) clustering algorithm and a conditional random forest model) to examine the processes and controls of regional floods over eastern China. Our empirical analyses are based on a dense network of stream gauging stations with continuous observations of annual maximum flood peaks (i.e. magnitude and timing) during the period 1980–2017. A comprehensive catalogue of 318 regional floods is developed. We reveal a pronounced clustering of regional floods in both space and time over eastern China. This is dictated by cyclonic precipitating systems and/or their interactions with topography. We highlight contrasting behaviours of regional floods in terms of their spatial extents and intensities. These contrasts are determined by fine-scale structures of flood-producing storms and anomalous soil moisture. While land surface properties might play a role in basin-scale flood processes, it is more critical to capture spatial–temporal rainfall variabilities and soil moisture anomalies for reliable large-scale flood hazard modelling and impact assessments. Our analyses contribute to flood science by better characterizing the spatial dimension of flood hazards and can serve as a basis for collaborative flood risk management in a changing climate.
- Article
(15675 KB) - Full-text XML
-
Supplement
(1617 KB) - BibTeX
- EndNote
Riverine floods evolve in both space and time (Blöschl, 2022). Floods that occur simultaneously over a collection of neighboring basins are interchangeably termed widespread floods (e.g. Brunner et al., 2020a), trans-basin floods (Uhlemann et al., 2010), multi-basin floods (De Luca et al., 2017), or synchronous floods (Berghuijs et al., 2019). Here we collectively refer to them as regional floods by explicitly highlighting their spatial extent, i.e. over a majority of basins within a neighborhood rather than over individual isolated basins (i.e. termed local floods). Understanding the processes and controls of regional floods is motivated by mounting evidence of increased spatial extents of extreme rainfall in a warming climate (Chen et al., 2023; Dai and Nie, 2022; Tan et al., 2021) and the resultant large-scale flood hazards over several continental regions, e.g. Europe (Kemter et al., 2020; Berghuijs et al., 2019), East Asia (Yang et al., 2022), and South Asia (Roxy et al., 2017).
The nature of regional floods that vary both spatially and temporally makes conventional site-specific flood frequency analyses less robust when estimating their hazardous potentials (Timonina et al., 2015; Neal et al., 2013; Brunner et al., 2019). The estimation bias can be especially prominent for floods with long return periods (Nguyen et al., 2020; Metin et al., 2020). Therefore, accurate flood risk assessment requires characterization of the spatial dependence of floods (i.e. the extent to which floods co-occur at different nearby locations) rather than their identification as isolated local floods. Existing endeavors principally rely on multivariate statistical models (Keef et al., 2009b; Heffernan and Tawn, 2004; Keef et al., 2013; Brunner et al., 2019; Lamb et al., 2010), numerical model chains (Falter et al., 2015), or a combination of both physical and statistical models (Quinn et al., 2019; Neal et al., 2013). For instance, Brunner et al. (2019) conducted multivariate frequency analyses using copula theory and showed flood risk estimates that contrasted with those based on conventional site-specific approaches.
There are data-driven approaches to characterizing regional floods and their resultant impacts. For instance, Uhlemann et al. (2010) identified regional floods by selecting flood peaks larger than local 10-year floods within a time window. They characterized flood severity by proposing a metric that was dependent on stream orders. Similarly, Lu et al. (2017) considered the role of drainage networks in regional flood processes. They evaluated regional flood severity by relying on empirical distributions of flood ratios (i.e. the ratio of the flood peak discharge to the sample 10-year flood discharge). Brunner et al. (2020b) defined regional floods as co-occurrences of site-specific flood peaks with similar ranks and sufficiently large magnitudes. They further characterized the degree of spatial dependence of floods according to the number of concurrent flood peaks. Tarouilly et al. (2021) identified regional floods by selecting basins with flood peak discharges exceeding certain thresholds (similarly, see also Brunner et al., 2022). Existing approaches, however, do not explicitly require regional floods to be spatially contiguous but only focus on whether their occurrences are within a small time window or not. This may not be a problem if the setting of interest is a moderately sized basin or a small region with limited hydrological heterogeneities (e.g. Brunner et al., 2020a). Berghuijs et al. (2019) tried to remedy this issue by characterizing regional floods with concurrent flood peaks over a prescribed shape (i.e. a circle in their case) of buffering regions within which there were at least 50 % of stations experiencing floods. Based on the notion of image connectivity, Wang et al. (2023) identified contiguous quantities of runoff grids in both space and time as regional floods. Due to the regular grid spacings of simulated runoff fields, there is no need to prescribe either the shape of the flood extent or the ratio of grids experiencing floods. This advantage unfortunately cannot be inherited by in situ stream gauging observations.
The spatial dependence of floods is related to large-scale weather systems (Villarini et al., 2011), land surface processes (Brunner et al., 2020b; Lu et al., 2023), and hydraulic structures (Turner-Gillespie et al., 2003; Brunner, 2021). Brunner et al. (2020b) showed that the spatial dependence of floods varies by season and region, with winter and spring showing the largest spatial dependence and thus the highest widespread flooding potential over the USA. They showed that the spatial dependence of rainfall does not always translate into floods due to the disturbance of land surface processes (i.e. soil moisture dynamics and snowmelt). Tarouilly et al. (2021) showed that regional floods over the western USA are mainly induced by extreme rainfall associated with atmospheric rivers in winter, snowmelt in spring, and tropical storms in summer, but the most extreme floods reflect the combination of both intense rainfall and favourable land surface processes (e.g. snowmelt). Nanditha and Mishra (2022) confirmed their results by further showing that heavy rainfall on wet soils is a prominent driver of large-scale flooding over Indian river basins. Elevated soil moisture can be induced by snowmelt or excessive rainfall. This is believed to have contributed to flood intensity more than different storm types (Brunner and Dougherty, 2022). Keef et al. (2009a) found negligible impacts of lakes and reservoirs on the spatial dependence of floods in the UK. Brunner (2021) showed that spatial dependence of floods is reduced by reservoirs in winter and fall across the USA but varies in spring and summer, depending on the catchment regulation measures.
The relative importance of meteorological forcing and land surface processes for regional floods over monsoon regions, such as eastern China, has not been elucidated. This is challenged by the mixture of precipitating systems (e.g. monsoon fronts, tropical cyclones, and extratropical cyclones) and the resultant rainfall variabilities in both space and time. Existing evidence over eastern China shows contrasting behaviours of regional floods in terms of spatial extent and intensity. For instance, the July 1931 flood over the Yangtze River, with approximately 180 000 km2 in inundated area and 2 million fatalities (Buck, 1932), is a poster child for the deadliest widespread flood hazards in the world. Extreme rainfall and flood inundation submerged eight provinces over eastern China (Zhou et al., 2023). Another example is the August 1975 flood over the Huai River that resulted in less than one-third the inundated area of the July 1931 flood but comparable economic losses (Qing et al., 2016). The August 1975 flood was also responsible for the world's 6 h rainfall record (i.e. 830 mm) and several unit peak discharges on the world's flood envelope curve (Yang et al., 2017). Understanding processes and controls of regional floods over eastern China, especially pertaining to their contrasting behaviours, can serve as a basis for large-scale flood hazard modelling and risk assessment.
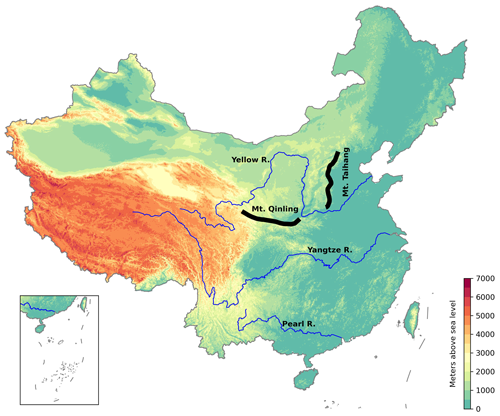
Yang et al. (2021a) showed that extreme floods over the East Asian summer monsoon region tend to cluster in the topographic transition regions along Mt. Qinling and Mt. Taihang (i.e. the northern portion of the topographic divide over eastern China; see the map in the Appendix). Since some of these flood samples “define” the world's flood envelope curve, the spatial extents of these extremes remain uncertain. We hypothesize that extreme floods occur simultaneously with neighboring basins as regional floods rather than as a local flood (which is isolated from its neighbors).
Based on the aforementioned knowledge gaps, we propose an innovative framework for regional flood analyses that relies on in situ stream gauging observations over eastern China. The core of the framework is to identify regional floods using the Density Based Spatial Clustering Applications with Noise (DBSCAN) algorithm. We develop a series of metrics to quantitatively characterize the spatial extents, magnitudes, and potential impacts of regional floods. We further shed light on the controls of the contrasting flood behaviours (in terms of spatial extents and magnitudes) by establishing a statistical model between flood metrics and potential explanatory variables. We expect to advance the characterization of flood hazards by highlighting their spatial extents.
Our empirical analyses are centered on the following research questions: (1) What are the spatial and temporal patterns of regional floods over eastern China? (2) Do extreme floods cluster in space and time? (3) What are the key ingredients of flood-producing storms in large-scale flood hazards? (4) How do rainfall forcing and land surface processes determine the contrasting behaviours of regional floods over eastern China?
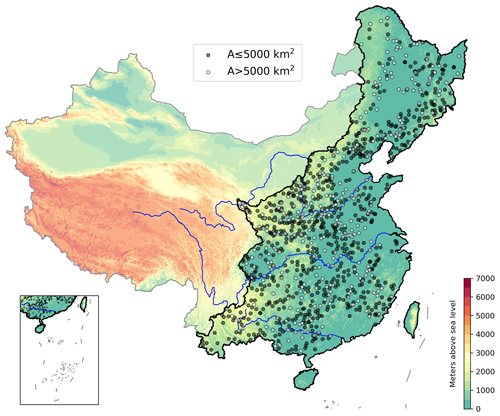
Figure 1Overview of stream gauging stations (all dots, 1036 in total) over the East Asian monsoon region (outlined by the dark black line; Liu and Shi, 2015). Grey and white dots show stations with drainage areas smaller and greater than 5000 km2, respectively. The three blue lines from north to south represent the Yellow River, Yangtze River, and Pearl River, respectively. Shading represents elevation in meters above sea level. The inset plot represents the southernmost Chinese territory. Publisher's remark: please note that the above figure contains disputed territories.
2.1 Dataset
Our analyses are based on a dense network of stream gauging stations over eastern China (Fig. 1). There are 1036 stream gauging stations in total. Each of them has at least 35-year observational records of annual maximum flood peaks (AMFs, including magnitude and timing) from 1980 to 2017 (Fig. 1). The number of complete-record stations remains constant throughout the period. The continuous flood observations have gone through strict quality controls by following standard procedures (including the removal of enormously large values or constantly low values during the period). This dataset has been used in previous flood studies (e.g. Yang et al., 2019, 2021b). The drainage areas of these gauges range from 10 to 1.7×10⁶ km2, with 70 % of them less than 5000 km2. The drainage boundaries are delineated using Hydrological data and maps based on SHuttle Elevation Derivatives at multiple Scales (HydroSHEDS) in ArcGIS and are then checked against the archive maintained by the Ministry of Water Resources, China.
Our empirical analyses of rainfall and soil moisture are based on the gridded CN05.1 daily rainfall product and the ECMWF Reanalysis v5 (ERA5) hourly soil moisture (i.e. the topsoil layer at 0–7 cm) dataset over mainland China. The gridded CN05.1 rainfall product is interpolated from in situ observations of 2416 rain gauges across China (Wu and Gao, 2013). The hourly soil moisture dataset is resampled to the daily scale by totalling hourly records within a calendar day (from 00:00 to 00:00 UTC of the following day). The spatial resolution of both products is 0.25°. Both the rainfall and soil moisture datasets have been validated over mainland China with good performance (Wu and Gao, 2013; Li et al., 2020a, b; Sun et al., 2021).
2.2 Analytical framework of regional floods
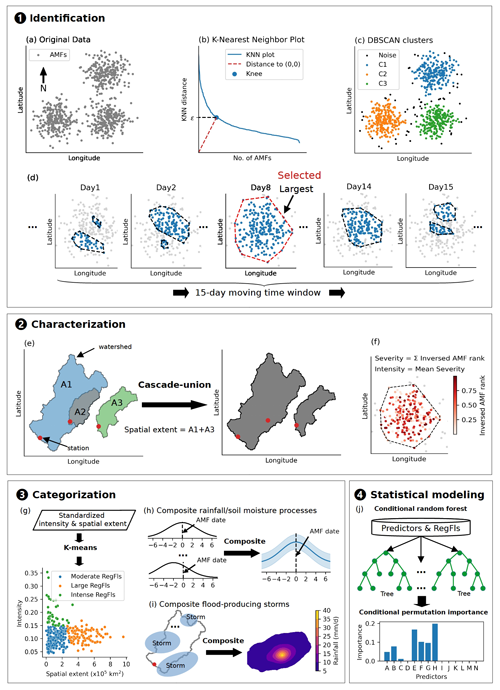
Our proposed analytical framework of regional floods includes four parts: (a) identification, (b) characterization, (c) categorization, and (d) statistical modelling. We demonstrate the workflow in Fig. 2. We provide a flowchart in Fig. S1 in the Supplement to show the sequential steps of data input, data preprocessing, and data processing.
- a.
Identification.
We define a regional flood (referred to as RegFl) based on its intrinsic definition. That is, a RegFl represents multiple flood peaks over several neighboring basins that occur within a certain period of time. We term flood peaks that are isolated from other flood peaks in either space or time “isolated floods” (referred to as IsoFls). The procedures to identify a RegFl are as follows.
We first set a moving time window of T days and select stream gauging stations with observed AMFs during this time window (Fig. 2a). Here we set T to 15 d. The choice of a 15 d time window is designed to capture the entire rainfall and flood-producing processes for a wide range of drainage basin sizes (Boyd, 1978). We then apply a machine-learning-based algorithm, DBSCAN, to automatically cluster these selected stations into a set of spatially contiguous clusters according to their geographic locations (Fig. 2b and c). We choose DBSCAN because it is designed to identify clusters with arbitrary shapes as well as outliers based on sample density (Ester et al., 1996). The algorithm does not require a predefined number of clusters compared to other clustering methods (such as k-means). There are two hyperparameters in the algorithm, i.e. neighbourhood-scale ε and the minimum number of points MinPts. We determine the two hyperparameters through the k-nearest neighbor (KNN) approach (Ester et al., 1996), where ε is determined by detecting the “knee” of the KNN plot, while k equals the value of MinPts. The knee represents the closest point to the origin of the plot (Fig. 2b). MinPts can be interpreted as the number of samples required to define a neighbourhood within which the sample density can be evaluated. A smaller MinPts identifies clusters with less dense cores. In this study, MinPts is set to 10. This is determined by manually checking the clustering results (i.e. flood extent) with a different MinPts against the corresponding spatial patterns of heavy rainfall and historical flood records (e.g. maps or documents). Further systematic validation is carried out by comparison against an independent flood archive (see the details below). To obtain a reliable KNN plot and the knee, we require at least M samples (i.e. selected stations). We set M to 50. Larger MinPts (i.e. MinPts = 15 or 20) or different M values (i.e. M=40 or 60) show little impact on our results. The choice of the two hyperparameters depends on how samples are spatially distributed as well as on the overall densities. The spatial pattern of the identified clusters remains unchanged by selecting a subset of gauges with relatively uniform distributions, indicating negligible impact of gauge density (Fig. S3 in the Supplement).
The 15 d time window moves from the first to last dates of AMF occurrences over the past 4 decades. We thus obtain all qualified clusters (i.e. termed potential RegFls). We use the smallest convex-hull polygon that bounds all AMFs to represent the flood footprint. Due to the propagation of precipitating systems, the extent and position of the footprint changes with time (Fig. 2d). We keep the largest convex-hull polygon representing the largest flood footprint during the time window. These smaller polygons, representing the developing or decaying flood pulses, are removed. The final selection of the largest polygons constitutes our RegFl catalogue. A smaller time window (e.g. T=7) identifies more RegFls but a spatial–temporal pattern consistent with that when using a 15 d time window. This is because flood-producing storms are separated into multiple episodes rather than treating them as consecutive.
We verify the capability of our algorithm to represent large-scale flood hazards by comparing our RegFl catalogue with the Dartmouth Flood Observation dataset (DFO, Brakenridge, 2016). The DFO provides details of observed flood hazards (including their dates of occurrences, spatial extents, and socioeconomic impacts) from 1985 till the present year from miscellaneous sources (e.g. newspapers, observations, or satellite images). It has been widely used as a benchmark for other flood datasets (Wang et al., 2023; Tellman et al., 2021; Dottori et al., 2016) and flood hazard modelling analyses (Kron et al., 2012; Carozza and Boudreault, 2021). We choose DFO over other state-of-the-art flood datasets due to its record length, which largely overlaps with our dataset (e.g. compared to the Global Flood Database; Tellman et al., 2021), and its detail in documenting flood spatial extents (compared to the Emergency Events Database; Guha-Sapir, 2018).
- b.
Characterization.
We characterize the spatial extent, intensity, and severity of a RegFl based on a series of gauge metrics. Only basins with drainage areas less than 5000 km2 are considered in the characterization to avoid the impact of nested basins as much as possible.
We characterize the spatial extent of a RegFl based on the cascade-union area of all watersheds that constitute a flood (Fig. 2e). This basically represents the largest drainage area for all non-nested watersheds within the RegFl. An alternative way of representing the spatial extent is based on a convex-hull polygon (see Fig. 2d, for example). The Spearman correlation coefficient between the coverages of the cascade-union watershed and the convex-hull polygon is 0.87 (P<0.001). It is significantly correlated with the number of AMFs (P<0.001).
The severity of a RegFl represents the accumulative impacts of multiple floods, while the intensity represents the average flood peak magnitude. To make the characteristics of different RegFls comparable, we need to normalize AMF magnitudes. This is because AMFs vary drastically across drainage basins. Here we use the inversed rank of each AMF across its observational period (Fig. 2f; similarly, see Tarouilly et al., 2021). There are other ways of normalizing flood peaks, based on e.g. unit peak discharge (i.e. the ratio of flood peak magnitude to drainage area, e.g. Herschy, 2002; Li et al., 2013) or flood ratio (i.e. the ratio of flood peak discharge to the sample 10-year flood discharge, e.g. Smith et al., 2018). These metrics tend to be biased towards either small drainage basins (for unit peak discharge) or basins with heavy tails of flood peak distributions (for the flood ratio, see Yang et al., 2021a). We note that the inversed rank does not show dependence on either the drainage area or the tail property of flood peak distributions (Fig. S2 in the Supplement).
The severity of a RegFl is contributed by both the magnitude of individual AMFs (i.e. the inversed rank) and their spatial extent (i.e. consistent with the number of AMFs within the cluster). The severity of a RegFl can then be simplified as the summation of the inversed ranks of AMFs in the RegFl.
RFI represents the RegFls severity, and Ranki represents the rank of the ith AMF within its observational records. N represents the total number of AMFs clustered in a RegFl. The averaged RFI over all the AMFs, i.e. the mean severity, is used to represent the intensity of a RegFl. A possible caveat of the RFI is that it cannot distinguish effectively between extreme floods and moderate ones. Since our intention is to characterize flood hazards at the regional scale, the accumulative inversed rank is able to differentiate the potential of regional flood hazards over multiple neighboring basins. We use the flood ratio occasionally to highlight the most extreme floods in the following analyses.
- c.
Categorization.
Intuitively, there are floods with a large spatial extent but relatively lower intensity (e.g. the 1931 Yangtze River flood), while floods with the opposite combinations also exist (e.g. the 1975 Huai River flood). We categorize RegFls into different groups according to their spatial extent and intensity to highlight distinct processes that determine hazardous potentials.
We adopt the k-means algorithm for the categorization. We choose k-means due to its simplicity and easy interpretability (Everitt et al., 2011). We standardize both the spatial extent and the intensity of each RegFl before clustering, i.e. extracted by the mean and divided by the standard deviation. The optimal number of clusters is automatically determined based on the silhouette score (Rousseeuw, 1987) and the Davies–Bouldin score (Davies and Bouldin, 1979). The clustering results agree with intuitive understandings of flood hazards over eastern China, justifying the choice of k-means over other algorithms (Fig. 2g).
- d.
Statistical modelling.
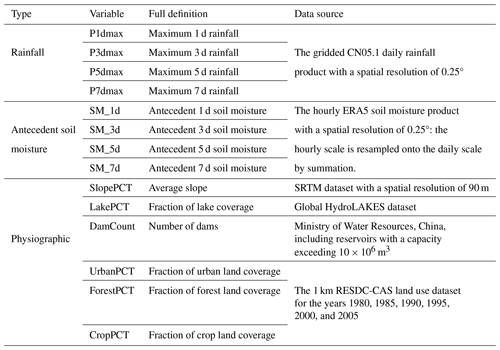
Finally, we establish statistical models for characteristics of RegFls (i.e. severity and extent) and their potential explainable predictors to shed light on the controls of regional flood processes (Fig. 2j). We first extract basin-average annual maximum rainfall and antecedent soil moisture at various temporal scales (i.e. 1, 3, 5, and 7 d) for each basin within the identified cascade-union region. The basin-average rainfall and soil moisture is first normalized by dividing its local annual 75th percentile and is then summed to represent different atmospheric conditions as well as antecedent wetness. We use the fractions of different land uses or land covers over the period 1980–2015 for all 5 years (i.e. the value from the closest year to the dates of flood occurrences), the mean slope, and the total number of dams within the cascade-union watersheds to represent physiographic attributes (Fig. 2e and Table 1). These selected predictors were previously verified for notable impacts on basin-scale flood responses (e.g. Liu et al., 2015; Hall et al., 2014). They are by no means exhaustive but potentially represent drivers responsible for flood-producing processes.
We adopt the conditional random forest (CRF) model as our statistical modelling tool. The CRF model is a variant of the random forest model (Zeileis et al., 2008; Strobl et al., 2008). The model is able to provide unbiased conditional variable importance measures for correlated predictor variables (Tyralis et al., 2019). Each explainable predictor is referred to as a feature of the model. There are two key hyperparameters, ntree and mtry, where ntree decides the number of times bootstrap samples are generated and mtry represents the number of predictor features selected as candidates for tree splitting. In this study, mtry ranges from 2 to 11, while ntree varies from 50 to 500 with intervals of 50. We evaluate the model performance using an out-of-bag (i.e. samples left after bootstrapping) root mean square error (RMSE) and coefficient of determination (i.e. R2). The best combination of ntree and mtry is determined when the RMSE is smallest (see Table S1 in the Supplement for the evaluation metrics). Nonparametric statistical tests are used to evaluate differences between the training error and out-of-bag error for each model to shed light on whether there is any overfitting (see Table S1 for details). We use the conditional permutation feature to evaluate the importance of each explainable predictor (Debeer and Strobl, 2020). This metric takes care of the mutual correlation of predictors by introducing a conditional permutation scheme (Strobl et al., 2008).
2.3 Regional flood attribution
We highlight regional flood processes based on empirical analyses of rainfall and soil moisture anomalies within the 15 d time window. We extract and composite time series of daily basin-average rainfall and soil moisture 7 d before and after each AMF within a RegFl (Fig. 2h). We do the composition by placing the date of flood peak occurrence in the center for both the rainfall and soil moisture series. We normalize the series by dividing the annual 75th percentile daily rainfall (over rainy days, with a daily rain rate exceeding 0.1 mm d−1) and the annual 75th percentile daily soil moisture (over days with soil moisture greater than 0 m3 m−3), respectively.
We examine the fine-scale structures of flood-producing storms. We first label all the CN05.1 rainfall grids with rain rates exceeding the annual 75th percentile daily rainfall. We then identify all spatially continuous patches from grids. Each patch is then given an identifier and termed an individual storm cell. All the storm cells that overlap with each drainage basin within the 7 d prior to the day of each AMF are deemed flood-producing storms (Fig. 2i). This is implemented for RegFls of different groups (see Sect. 2.2c). We compare statistics of storm cells (including the total number, mean size, and mean orientation) across different RegFl groups to highlight the fine-scale structures of flood-producing storms.
Landfall tropical cyclones (TCs) are important flood-producing agents over eastern China (Yang et al., 2020). We associate a TC with RegFls by making a 300 km buffer centered around TC tracks (Gaona et al., 2018). If there is any intersection between the buffer zone and the convex-hull polygon of a RegFl during the 15 d time window, we label the RegFl a TC-induced RegFl. We use convex-hull polygons to associate each RegFl with TCs, since it is a spatially contiguous quantity with which to associate large-scale meteorological drivers. TC tracks are provided by the International Best Track Archive for Climate Stewardship (IBTrACS), with records of longitude and latitude of the TC center as well as its nature (e.g. tropical storm, tropical cyclone, and extratropical transition) at a 6 h time interval.
3.1 Overview of the regional flood catalogue
We identify 318 RegFls during the period 1980–2017 over eastern China, i.e. approximately 8.3 per year on average. These RegFls consist of 22 902 AMFs, accounting for around 55 % of the total AMFs (i.e. the accumulated number of years for all stream gauging stations over eastern China). There are 72 AMFs on average for each RegFl, with the number ranging from 6 to 317. The remaining 45 % of the AMFs are not clustered into any RegFls and are termed IsoFls. These IsoFls are either remote in space (beyond 1000 km on average) or induced by isolated storms (beyond 15 d) and cannot be identified as occurring in any spatially contiguous regions.
We compare our RegFl catalogue with the DFO. There are 274 floods observed in both the DFO and our catalogue during the overlapping period, i.e. 1985–2017. More specifically, 53 % of the DFO floods can be captured well by our catalogue, with the DFO flood extent enveloped by the convex-hull polygons (i.e. see Sect. 3.2 for event comparisons). The missing representation of DFO floods in our catalogue can be partially related to the limitation that only AMFs are adopted in our RegFl identification. The comparable spatial patterns of the DFO floods and our RegFl catalogue demonstrate the capabilities of our proposed framework in examining regional flood hazards.
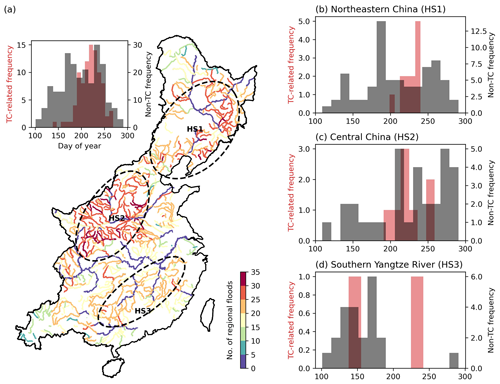
Figure 3(a) Spatial–temporal patterns of RegFls from 1980 to 2017. The inset bar plot shows the temporal distribution of the middle date of TC-related (red) and non-TC (blue) RegFls. The frequency of RegFls for each river reach is estimated by matching AMFs (drainage areas smaller than 5000 km2) in RegFls with the river reach using a 500 m buffer. Three black dashed-line circles highlight the three hotspots (HSs). (b–d) Distribution of the middle date of RegFls in northeastern China (HS1), central China (HS2), and the southern Yangtze River (HS3), respectively.
3.2 Spatial–temporal patterns of regional floods
RegFls are spatially clustered over eastern China, with northeastern China, central China, and the southern Yangtze River as three hotspots (Fig. 3). There are more than 30 RegFls per river reach within the hotspots. These hotspots are distributed over complex terrain (see Fig. A1 for details), highlighting the role of topography in dictating severe large-scale flood hazards over China. The spatial clustering is closely tied to the properties of flood-producing systems (in terms of their propagation speed and intensity) and their interactions with regional topography. For instance, the monsoon front propagates over the middle Yangtze River basin around June. The front tends to remain stagnant for a while before abruptly jumping to central and northern China in mid-July. Excessive rainfall during the stagnancy is responsible for frequent RegFls in the southern Yangtze River (HS3) but a lower possibility of RegFls over the transitional region (i.e. between HS2 and HS3; Fig. 3). The elevated rainfall intensity (i.e. by orographic lifting) and the stagnant storm motion (i.e. by topographic blocking) collectively lead to a temporal clustering of extreme rainfall in central China (Houze, 2012). The mountainous topography elevates the rainfall intensity mainly through enhanced wind convergence and moisture as well as vertical motion induced by diabatic heating (Zhao et al., 2020). This explains why central China experiences the most frequent RegFls and some of the most severe flood hazards (see the detailed analyses below).
One-third of RegFls are associated with landfall TCs over eastern China. A notable feature is that TC-induced floods show striking temporal clustering, with 77 % occurring within a 2-month period, i.e. from early July to late August (Fig. 3). This is in contrast to the RegFls induced by other precipitating systems (e.g. monsoon fronts or extratropical cyclones) that spread across the warm season. The temporal clustering is mainly regulated by the behaviours of TC genesis over the western North Pacific basin. Interactions between landfall TCs and regional topography (e.g. southern Mt. Taihang and Mt. Qinling) are key ingredients in RegFls over eastern China (e.g. the August 1975 Huai River flood).
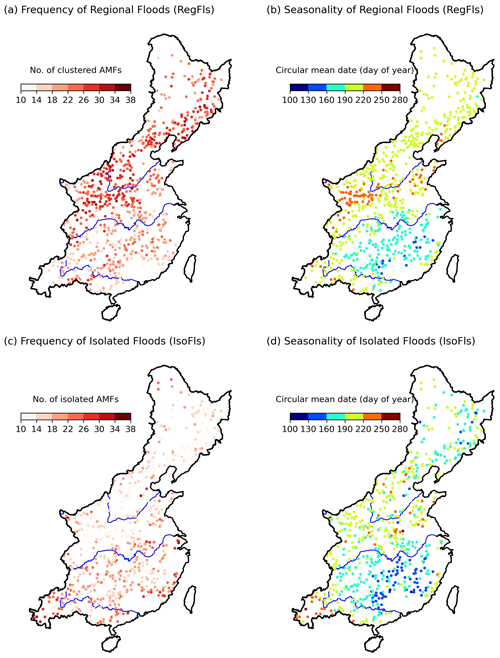
Figure 4Frequency and seasonality of regional (a–b) and isolated (c–d) floods. Circular statistics are applied to obtain the mean date of occurrence of AMFs for each station. Please refer to Berens (2009), Pewsey et al. (2013), and Blöschl et al. (2017) for the details of the circular statistics.
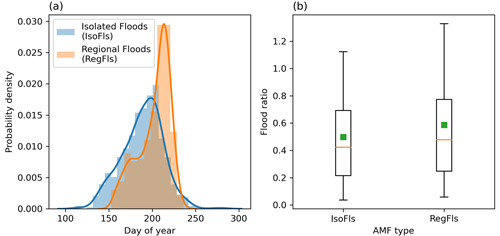
Figure 5(a) Distribution of the circular mean dates of isolated (blue) and regional (orange) floods. (b) Boxplots of the flood ratio for isolated floods (IsoFls) and regional floods (RegFls). The orange line and green square within the box represent the median and mean values, respectively. The box spans the 25th and 75th percentiles, and the whiskers represent the minimum and maximum values.
Unlike RegFls, IsoFls over eastern China are less clustered in space and time. We note that southern China is more likely to experience IsoFls than its northern counterpart, with slightly higher frequencies along the main stream of the Yangtze River (Fig. 4a and c). IsoFls are more uniformly distributed across the warm season (i.e. April to October) compared to RegFls (Figs. 4 and 5). RegFls, however, tend to show greater temporal clustering (Figs. 5a and S4 in the Supplement) and have much larger flood peak magnitudes than IsoFls (Fig. 5b). Approximately two-thirds of the record floods (i.e. the largest flood for a station during its entire observational record) are observed in RegFls. A nonparametric Mann–Whitney U test and a Kruskal–Wallis test suggest that the flood ratios between the two groups are statistically different (both P<0.001), with RegFls being larger. This indicates that extreme floods tend to be concurrent with neighboring basins rather than isolated in space and time. This is likely dictated by the space–time organizations of precipitation systems (e.g. spatial extents and durations) and/or their interactions with regional topography over the East Asian summer monsoon region.
3.3 Synoptic processes of regional floods
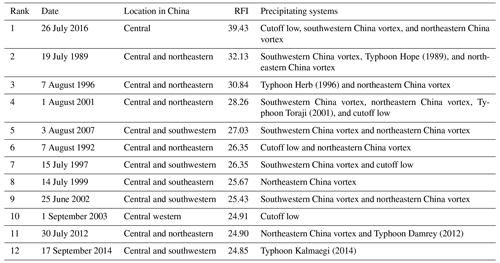
Figure 6 shows the spatial maps of the top 12 most severe RegFls (based on the severity index RFI) over eastern China (see the Appendix for synoptic descriptions). A notable feature is that central China (i.e. the middle to lower Yellow River region) is affected by all 12 RegFls. The occurrence frequency of RegFls in this region is also the largest, with 25 RegFls per stream gauging station on average during the 38-year period.
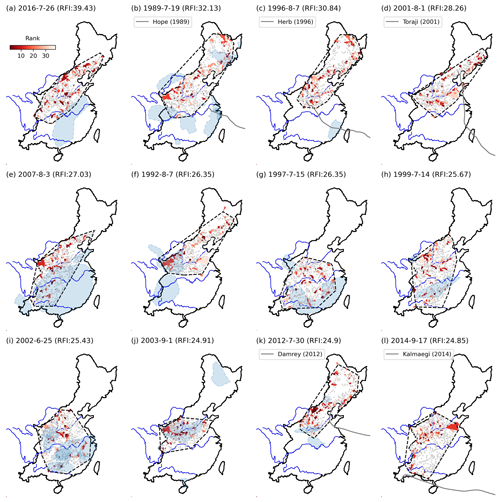
Figure 6The top 12 most severe RegFls over eastern China. The blue polygons represent the spatial extents of the DFO floods. The black dashed-line polygons represent the convex-hull region of RegFls. The small red polygons inside the convex hulls represent watersheds with AMFs (i.e. the shade represents ranks). The grey points represent stations without AMFs. The grey solid lines represent TC tracks. The middle dates of occurrence for each RegFl and the associated RFI are shown in the labels.
The most severe RegFl occurred in July 2016, with the RFI equal to 39.4 (Fig. 6a). Torrential rainfall from 18 July 2016 to 1 August 2016 led to 287 AMFs across central and northern China. The flood was directly responsible for 130 fatalities and substantial socioeconomic losses (Lei et al., 2017). There are 36 AMFs (i.e. 13 % out of all the AMFs in this RegFl), with their magnitudes larger than the sample 10-year flood, i.e. a flood ratio larger than 1.0. The maximum flood ratio is 13.4. It is the sixth largest flood ratio from 1980 to 2017 over eastern China. The RegFls document eight record floods. The rainfall intensity exceeds 20 mm h−1 over a large portion of the flood region. The anomaly of rainfall accumulation is 300 mm larger than the climatological mean (Fig. S5 in the Supplement). Extreme rainfall for the July 2016 flood is tied to an anomalous position of the western Pacific subtropical high that extends westward into the East Asian continent. The synoptic configuration facilitates moisture transport from the western Pacific into eastern China along its southern fringe (Yuan et al., 2017). The year 2016 was also the wettest flood season in the past 6 decades (Gao et al., 2018). An abnormally high rainfall intensity superimposed on notably wet soils (i.e. 20 times as large as the climatological mean state; Fig. S6 in the Supplement) collectively contributed to the severe flood hazards.
As expected, landfall TCs are responsible for some of the most severe RegFls. For instance, the three TCs, i.e. Hope (1989), Herb (1996), and Toraji (2001), are responsible for three of the top five most severe RegFls. These TCs underwent extratropical transition processes (Fig. 6) and are comparable in their tracks, with similar patterns of the flood footprint as well. An interesting finding is that the flood regions are mostly located beyond the termination of TC tracks (see the black dashed line in Fig. 6). This highlights the potential of TC remnants to produce severe flood hazards over eastern China (similarly, see Smith et al., 2023).
The northeastern vortex is the most frequently recurring weather system responsible for RegFls (Table A1). It produces persistent and widespread rainfall during the post-Meiyu period (Xie et al., 2015) and is responsible for 53 % of the extreme rainfall in northeastern China (Tang et al., 2021). Except for Typhoon Kalmaegi (2014), almost all flood-producing TCs are accompanied by the northeastern vortex (Table A1). Six of the top 12 RegFls are associated with southwestern vortexes. The cutoff lows, developed from an eastward-propagating westerly trough, are furthermore responsible for 5 of the top 12 most severe RegFls. Synoptic analyses of flood-producing storms highlight the importance of cyclonic precipitating systems (e.g. tropical cyclones, southwestern vortexes, or cutoff lows) in dictating large-scale flood hazards over the East Asian monsoon region.
3.4 Categorization of regional floods
The RFI is contributed by both the total number of AMFs (i.e. the spatial extent) and the mean inversed rank of AMFs in observational records (i.e. the intensity). The Spearman correlation coefficients between the RFI and the corresponding spatial extent and mean intensity are 0.91 (P<0.001) and 0.36 (P<0.001), respectively. The Spearman correlation coefficient between the spatial extent and intensity is only 0.08 (P=0.15). This means that there are different types of RegFls, depending on the relative dominance of spatial extent and/or intensity in the RFI.
We categorize the 318 RegFls into different groups by considering spatial extent and intensity (see Sect. 2.2c for details). The optimal number of clusters is three (see Sect. 2.3). We name the three RegFl groups moderate RegFls (N=176), large RegFls (N=103), and intense RegFls (N=39), according to their positions in the “intensity-spatial extent” space domain (Fig. 7). Figure 8 shows the spatial distributions of the different RegFl groups. The moderate RegFls and large RegFls tend to occur more frequently in northeastern and central China, while the intense RegFls (i.e. large in intensity but small in extent) show weak geographic contrasts. The large RegFls temporally cluster in early August, while the other two RegFl groups show a bimodal seasonal distribution. The temporal clustering of large RegFls might be associated with frequent TC genesis in the northwestern Pacific basin. There are 40 % large RegFls directly associated with landfall TCs.
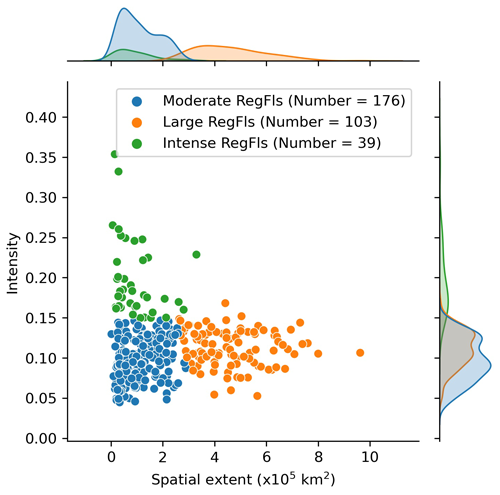
Figure 7k-means classification of RegFls according to the z score of flood intensity (i.e. averaged inversed rank) and spatial extent (i.e. cascade-union watershed areas). The blue, orange, and green dots represent moderate, large, and intense RegFls, respectively. The two subplots in the top and right corners show the probability density distribution of intensity and spatial extent.
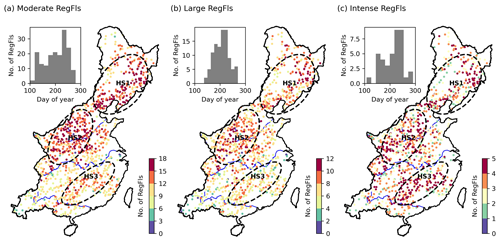
Figure 8Spatial distribution of (a) moderate, (b) large, and (c) intense RegFls. The inset bar plots show the temporal distribution of the middle dates of flood occurrence. The three black dashed-line circles highlight the three hotspots.
Contrasting flood behaviours from different RegFl groups resulted from diverse regional-scale rainfall–runoff processes. Figure 9 shows the composite time series of daily rainfall and soil moisture for the different RegFl groups (see Sect. 2.3 for details). There is a notable average rainfall peak approximately 1 d earlier than the flood peaks. Changes in daily rainfall show abruptly rising and falling limbs, with the composite mean rainfall peak approximately 1.5 times larger than the 75th percentile daily rainfall (Fig. 9a). However, there are negligible differences between the three RegFl groups in the composited rainfall series. The composited mean soil moisture is consistently above the local 75th percentile daily soil moisture. Unlike rainfall, the composited soil moisture shows notable differences between the three groups. For instance, the composited mean daily soil moisture for large RegFls is consistently larger than the other two groups. A similar contrast is also evident when only focusing on the 75th percentile soil moisture. The intense RegFls show a slightly larger soil moisture content during their peak than the moderate RegFls (Fig. 9b). This highlights the importance of antecedent soil wetness in dictating contrasting behaviours of RegFls over eastern China.
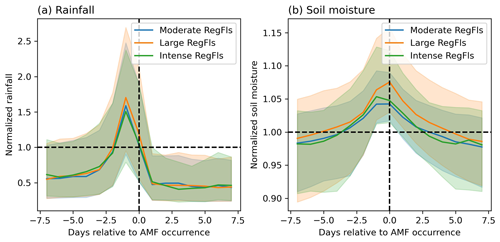
Figure 9Lead-lag analyses of composite series of (a) rainfall and (b) soil moisture for three RegFl groups. The time series are extracted for each drainage basin within the RegFls and are composited by placing the dates of AMF occurrence in the center. The shading represents the range of the 25th to 75th percentiles.
Despite the composited rainfall series being comparable, fine-scale rainfall structures (see Sect. 2.3 for details) show contrasting characteristics across the different RegFl groups (Fig. 10). A large RegFl shows the largest number of storm cells (N=6238) but the smallest storm size (i.e. with a median value of 72 500 km2) (Fig. 11a and d). Intense RegFls show a larger storm-averaged rainfall intensity (i.e. with a median value of 9.80 mm h−1) than that of large RegFls (i.e. with a median value of 7.38 mm h−1) and moderate RegFls (i.e. with a median value of 9.37 mm h−1; Fig. 11b). This indicates that large RegFls are associated with a large number of small storm cells and relatively smaller intensities, while fewer but more intense storm cells contribute to intense RegFls. The median sizes of storm cells for moderate RegFls (225 312 km2) and intense RegFls (284 063 km2) are comparable. These fine-scale storm features highlight the role of fine-scale rainfall organizations in distinguishing between large-scale flood hazards.

Figure 10Composite storm cells for (a) moderate, (b) large, and (c) intense RegFls. The shading represents the daily rain rate (mm d−1). The number of storm cells in the composite and their median size are also shown.
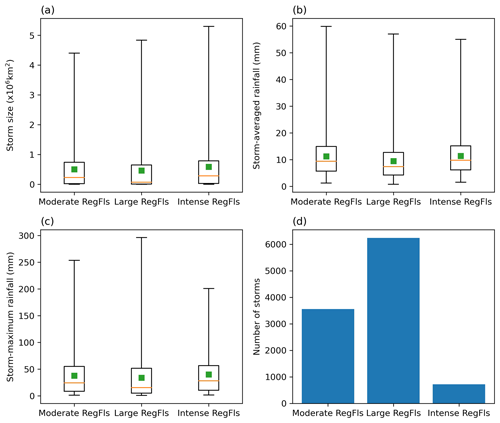
Figure 11Statistics of flood-producing storms for the three RegFl groups. Boxplots of (a) storm size, (b) storm-averaged rainfall, and (c) storm-maximum rainfall. (d) Total number of storm cells for the three RegFl groups. The orange line and green square within the box represent the median and mean values, respectively. The box spans the 25th and 75th percentiles, and the whiskers represent the minimum and maximum values.
3.5 Statistical modelling of regional floods
To further quantify the controls of contrasting flood behaviours, we establish CRF models between the RFI (and the spatial extent) and potential explainable variables. A complete list of variables (i.e. features) is shown in Table 1. The out-of-bag RMSE for the RFI is 2.36, ranging from 1.01 to 3.64 for the three RegFl groups, while the coefficient of determination (i.e. R-squared) is 0.89, ranging from 0.43 to 0.86. This indicates that the selected explanatory variables can adequately explain the contrasting flood behaviours over eastern China. Similarly, we observe good model performance when determining the spatial extents of RegFls, with the out-of-bag RMSE and R-squared equal to 53 600 km2 and 0.93, respectively. There is no significant difference between training error and out-of-bag error, indicating weak evidence of overfitting (Table S1).
Antecedent soil moisture and maximum rainfall at the 1 and 3 d scales are the most important variables in determining the RFI (Fig. 12). Physiographic attributes are less important, with dam counts and urban coverages having only slight impacts. The variable importance is diverse across the RegFl groups. More specifically, antecedent soil moisture (i.e. 3 d prior to the flood peak) is prominent for large RegFls, but basin-average rainfall at 1 and 3 d stands out for intense RegFls. This means that large-scale floods are more likely to be triggered under wet soil conditions than contributed by local intense rainfall.
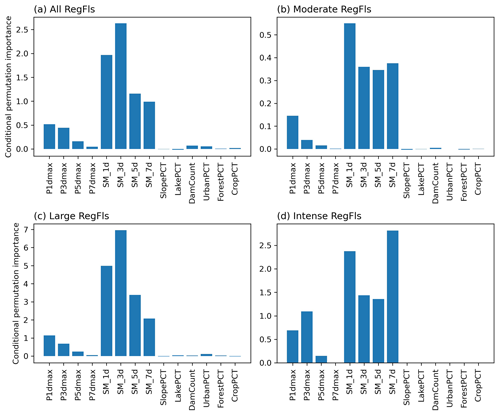
Figure 12Conditional permutation importance of explanatory variables in predicting the RFI of (a) all, (b) moderate, (c) large, and (d) intense RegFls. Please refer to Table 1 for the details of the variables.
Antecedent soil moisture also stands out in determining the spatial extents of floods (Fig. S7 in the Supplement). Neither physiographic attributes (e.g. percentages of different land use types and dam counts) nor basin-average rainfall at various temporal scales show comparable importance, except for intense RegFls (Fig. S7). This is consistent with Sect. 3.3, which highlights contrasting soil moisture anomalies across different flood groups. Our results highlight the importance of soil moisture in dictating large-scale flood hazards. This is due to the increased spatial dependence of floods under wet soil conditions, which is further replenished by rainfall during the monsoon season.
In this study, we propose a machine-learning framework to investigate the processes and controls of RegFls over eastern China. Our analyses highlight distinct rainfall–runoff processes and drivers that dictate contrasting behaviours of RegFls. The main findings are summarized as follows.
-
Identification of RegFls: based on the new framework and a dense stream gauging network, we identify 318 RegFls over eastern China from 1980 to 2017. Our RegFl catalogue provides a detailed spatial–temporal characterization of large-scale flood hazards and can serve as a significant complement to existing flood datasets in the world.
-
Spatial–temporal clustering of RegFls: RegFls are spatially and temporally clustered, with northeastern China, central China, and the southern Yangtze River as the three hotspots with more frequent occurrences. The spatial clustering is dictated by the propagation of precipitating weather systems (e.g. monsoon fronts and landfall TCs) and their interactions with regional topography. The temporal clustering is associated with frequent landfall TCs from late July to early August. TC remnants or extratropical transitions are important features of RegFls over eastern China. Cyclonic precipitating systems are frequent flood agents over the East Asian monsoon region.
-
Isolated floods: IsoFls do not show spatial or temporal clustering compared to RegFls. The flood ratios of IsoFls are statistically smaller than those of RegFls. This indicates that extreme floods tend to occur concurrently with neighboring basins rather than sporadically over the monsoon region. The concurrency is dictated by the key features of precipitating systems and/or their interactions with regional topography.
-
Spatial extent and intensity of RegFls: RegFls are diverse in their spatial extent and intensity. RegFls with large spatial extents (i.e. large RegFls) show the largest soil moisture anomalies. There are notable contrasts in the fine-scale structures of flood-producing storms across different RegFl groups, but they are not reflected in basin-average rainfall anomalies. These fine-scale storm structures superimposed on wet soils dictate contrasting flood behaviours over eastern China. This indicates that the spatial dependence of rainfall can be translated into flood processes during the monsoon season.
-
Predicting RegFl characteristics: statistical modelling further highlights the importance of antecedent soil moisture and maximum rainfall intensity in dictating RegFl severity. While physiographic attributes might play a role in basin-scale flood responses, it is more critical to capture spatial–temporal patterns of rainfall and soil moisture for large-scale flood modelling and risk analyses.
The core of our analytical framework is RegFl identification using a density-based clustering algorithm, with in situ stream gauging observations as the input. Although our results have been tested by manually modifying the density of stream gauging networks over eastern China, it is advisable to apply the algorithm over a stream gauging network with more or less uniform density. This can be achieved by sampling stations according to basin size or stream order. The hyperparameters need manual adjustments by checking against other established flood archives for the region of interest. A caveat of our study is that only stations with AMFs are used for RegFl identification. We use contiguous convex-hull polygons to represent the flood footprint for including neighboring stations that experience smaller floods. We emphasize that our RegFl catalogue represents a collection of the most severe flood hazards over eastern China.
The proposed framework contributes to flood science by reinforcing the spatial characterization of large-scale flood hazards. This is in contrast to conventional flood studies that predominantly rely on derived statistics (e.g. peak discharge, timing, and volume) from flood hydrographs at site scales (Blöschl et al., 2017, 2019; He et al., 2022). Our framework, with explicitly defined metrics of flood extent and intensity, provides an alternative approach to modelling large-scale flood hazards and risk assessment. This can be achieved by examining the statistical properties of these flood metrics and their association with the associated impacts (e.g. economic losses, inundated areas, and affected populations; see Carozza and Boudreault, 2021, for example).
Our results provide a benchmark dataset for large-scale flood modelling (Del Rio Amador et al., 2023; Carozza and Boudreault, 2021; Gnann et al., 2023). The spatial–temporal clustering pattern of RegFls needs to be reproduced before delving into model performance at watershed scales. The ongoing effort includes exploring the link between RegFls and large-scale atmospheric circulations. Upscaling to region-scale processes facilities linking potential flood hazards to synoptic systems rather than dealing with intricate basin-scale flood responses. This link can serve as a basis for improved flood risk management (e.g. coordination of resources for mitigating and adapting large-scale flood hazards).
The CN05.1 (Wu and Gao, 2013) data are available upon request to the corresponding author. The ERA5 soil moisture is available at https://doi.org/10.24381/cds.adbb2d47 (Hersbach et al., 2023). The IBTrACS dataset is available at https://doi.org/10.25921/82ty-9e16 (Gahtan et al., 2024). The land use dataset is available at https://doi.org/10.12078/2018070201 (Xu et al., 2018). The digital elevation model is available at http://srtm.csi.cgiar.org (Jarvis et al., 2008). The global HydroLAKES dataset, flow direction dataset, and accumulation dataset are available at https://www.hydrosheds.org/hydrosheds-core-downloads (Lehner et al., 2008). The flood dataset used in this study is available at https://doi.org/10.6084/m9.figshare.24636153.v1 (Yang et al., 2023a). All the codes are available at https://doi.org/10.6084/m9.figshare.24637266.v1 (Yang et al., 2023b). The MATLAB code for circular statistics is available at https://www.mathworks.com/matlabcentral/fileexchange/10676-circular-statistics-toolbox-directional-statistics (Berens, 2024).
The supplement related to this article is available online at: https://doi.org/10.5194/hess-28-4883-2024-supplement.
YY and LY designed the study and carried out the analysis. YY and LY wrote the manuscript with contributions from JZ and QW. All the authors contributed to the discussion.
The contact author has declared that none of the authors has any competing interests.
Publisher’s note: Copernicus Publications remains neutral with regard to jurisdictional claims made in the text, published maps, institutional affiliations, or any other geographical representation in this paper. While Copernicus Publications makes every effort to include appropriate place names, the final responsibility lies with the authors.
The authors would like to thank Guo Yu and the anonymous reviewer for providing suggestions and comments that helped to substantially improve the manuscript.
This research was supported by the National Natural Science Foundation of China (grant no. 52379012) and the GeoX Interdisciplinary Research Funds of the Frontiers Science Center for Critical Earth Material Cycling, Nanjing University.
This paper was edited by Hongkai Gao and reviewed by Guo Yu and one anonymous referee.
Berens, P.: Circular statistics toolbox (directional statistics), MATLAB Central File Exchange [code], https://www.mathworks.com/matlabcentral/fileexchange/10676-circular-statistics-toolbox-directional-statistics (last access: 9 April 2022), 2024.
Berens, P.: CircStat: a MATLAB toolbox for circular statistics, J. Stat. Softw., 31, 1–21, http://www.jstatsoft.org/v31/i10 (last access: 25 August 2021), 2009.
Berghuijs, W. R., Allen, S. T., Harrigan, S., and Kirchner, J. W.: Growing spatial scales of synchronous river flooding in Europe, Geophys. Res. Lett., 46, 1423–1428, https://doi.org/10.1029/2018gl081883, 2019.
Blöschl, G.: Flood generation: process patterns from the raindrop to the ocean, Hydrol. Earth Syst. Sci., 26, 2469–2480, https://doi.org/10.5194/hess-26-2469-2022, 2022.
Blöschl, G., Hall, J., Parajka, J., Perdigão, R. A., Merz, B., Arheimer, B., Aronica, G. T., Bilibashi, A., Bonacci, O., and Borga, M.: Changing climate shifts timing of European floods, Science, 357, 588–590, https://doi.org/10.1126/science.aan2506, 2017.
Blöschl, G., Hall, J., Viglione, A., Perdigao, R. A. P., Parajka, J., Merz, B., Lun, D., Arheimer, B., Aronica, G. T., Bilibashi, A., Bohac, M., Bonacci, O., Borga, M., Canjevac, I., Castellarin, A., Chirico, G. B., Claps, P., Frolova, N., Ganora, D., Gorbachova, L., Gul, A., Hannaford, J., Harrigan, S., Kireeva, M., Kiss, A., Kjeldsen, T. R., Kohnova, S., Koskela, J. J., Ledvinka, O., Macdonald, N., Mavrova-Guirguinova, M., Mediero, L., Merz, R., Molnar, P., Montanari, A., Murphy, C., Osuch, M., Ovcharuk, V., Radevski, I., Salinas, J. L., Sauquet, E., Sraj, M., Szolgay, J., Volpi, E., Wilson, D., Zaimi, K., and Zivkovic, N.: Changing climate both increases and decreases European river floods, Nature, 573, 108–111, https://doi.org/10.1038/s41586-019-1495-6, 2019.
Boyd, M. J.: A storage-routing model relating drainage basin hydrology and geomorphology, Water Resour. Res., 14, 921–928, https://doi.org/10.1029/WR014i005p00921, 1978.
Brakenridge, G.: Global active archive of large flood events. DFO – Flood Observatory, University of Colorado, USA [data set], http://floodobservatory.colorado.edu/Archives (last access: 9 January 2024), 2016.
Brunner, M. I.: Reservoir regulation affects droughts and floods at local and regional scales, Environ. Res. Lett., 16, 124016, https://doi.org/10.1088/1748-9326/ac36f6, 2021.
Brunner, M. I. and Dougherty, E. M.: Varying importance of storm types and antecedent conditions for local and regional floods, Water Resour. Res., 58, e2022WR033249, https://doi.org/10.1029/2022WR033249, 2022.
Brunner, M. I., Furrer, R., and Favre, A.-C.: Modeling the spatial dependence of floods using the Fisher copula, Hydrol. Earth Syst. Sci., 23, 107–124, https://doi.org/10.5194/hess-23-107-2019, 2019.
Brunner, M. I., Papalexiou, S., Clark, M. P., and Gilleland, E.: How probable is widespread flooding in the United States?, Water Resour. Res., 56, e2020WR028096, https://doi.org/10.1029/2020WR028096, 2020a.
Brunner, M. I., Gilleland, E., Wood, A., Swain, D. L., and Clark, M.: Spatial dependence of floods shaped by spatiotemporal variations in meteorological and land-surface processes, Geophys. Res. Lett., 47, e2020GL088000, https://doi.org/10.1029/2020gl088000, 2020b.
Buck, J. L.: The 1931 flood in China: an economic survey by the Department of Agricultural Economics, College of Agriculture and Forestry, the University of Nanking, in cooperation with the National Flood Relief Commission, The University of Nanking, 74 pp., 1932.
Carozza, D. A. and Boudreault, M.: A global flood risk modeling framework built with climate models and machine learning, J. Adv. Model. Earth Sy., 13, e2020MS002221, https://doi.org/10.1029/2020ms002221, 2021.
Chen, X., Leung, L. R., Gao, Y., Liu, Y., and Wigmosta, M.: Sharpening of cold-season storms over the western United States, Nat. Clim. Change, 13, 167–173, https://doi.org/10.1038/s41558-022-01578-0, 2023.
Dai, P. and Nie, J.: Robust expansion of extreme midlatitude storms under global warming, Geophys. Res. Lett., 49, e2022GL099007, https://doi.org/10.1029/2022gl099007, 2022.
Davies, D. L. and Bouldin, D. W.: A cluster separation measure, IEEE Transactions on Pattern Analysis and Machine Intelligence, PAMI-1, 224–227, https://doi.org/10.1109/TPAMI.1979.4766909, 1979.
De Luca, P., Hillier, J. K., Wilby, R. L., Quinn, N. W., and Harrigan, S.: Extreme multi-basin flooding linked with extra-tropical cyclones, Environ. Res. Lett., 12, 114009, https://doi.org/10.1088/1748-9326/aa868e, 2017.
Debeer, D. and Strobl, C.: Conditional permutation importance revisited, BMC Bioinformatics, 21, 307, https://doi.org/10.1186/s12859-020-03622-2, 2020.
Del Rio Amador, L., Boudreault, M., and Carozza, D. A.: Global asymmetries in the influence of ENSO on flood risk based on 1,600 years of hybrid simulations, Geophys. Res. Lett., 50, e2022GL102027, https://doi.org/10.1029/2022gl102027, 2023.
Dottori, F., Salamon, P., Bianchi, A., Alfieri, L., Hirpa, F. A., and Feyen, L.: Development and evaluation of a framework for global flood hazard mapping, Adv. Water Resour., 94, 87–102, https://doi.org/10.1016/j.advwatres.2016.05.002, 2016.
Ester, M., Kriegel, H. P., Sander, J., and Xu, X.: A density-based algorithm for discovering clusters in large spatial databases with noise, Proceedings of the Second International Conference on Knowledge Discovery and Data Mining, Portland, Oregon, United States, 2 August 1996, 226–231, https://dl.acm.org/doi/10.5555/3001460.3001507 (last access: 9 June 2021), 1996.
Everitt, B., Landau, S., Leese, M., and Stahl, D.: Cluster analysis, Wiley Online Library, https://doi.org/10.1002/9780470977811, 2011.
Falter, D., Schröter, K., Dung, N. V., Vorogushyn, S., Kreibich, H., Hundecha, Y., Apel, H., and Merz, B.: Spatially coherent flood risk assessment based on long-term continuous simulation with a coupled model chain, J. Hydrol., 524, 182–193, https://doi.org/10.1016/j.jhydrol.2015.02.021, 2015.
Gahtan, J., Knapp, k. R., Schreck, C. J., Diamond, H. J., Kossin, J. P., and Kruk, M. C.: International best tack archive for climate stewardship (IBTrACS) project, Version 4r01, NOAA National Centers for Environmental Information [data set], https://doi.org/10.25921/82ty-9e16, 2024.
Gao, R., Song, L., and Zhong, H.: Characteristics of extreme precipitation in China during the 2016 flood season and comparison with the 1998 situation, Meteor. Mon., 44, 699–703, 2018 (in Chinese).
Gaona, M. F. R., Villarini, G., Zhang, W., and Vecchi, G. A.: The added value of IMERG in characterizing rainfall in tropical cyclones, Atmos. Res., 209, 95–102, https://doi.org/10.1016/j.atmosres.2018.03.008, 2018.
Gnann, S., Reinecke, R., Stein, L., Wada, Y., Thiery, W., Müller Schmied, H., Satoh, Y., Pokhrel, Y., Ostberg, S., Koutroulis, A., Hanasaki, N., Grillakis, M., Gosling, S. N., Burek, P., Bierkens, M. F. P., and Wagener, T.: Functional relationships reveal differences in the water cycle representation of global water models, Nature Water, 1, 1079–1090, https://doi.org/10.1038/s44221-023-00160-y, 2023.
Guha-Sapir, D.: EM-DAT, maintained by Centre for Research on the Epidemiology of Disasters/University of Louvain, Brussels, Belgium [data set], https://www.emdat.be (last access: 21 March 2023), 2018.
Hall, J., Arheimer, B., Borga, M., Brázdil, R., Claps, P., Kiss, A., Kjeldsen, T. R., Kriaučiūnienė, J., Kundzewicz, Z. W., Lang, M., Llasat, M. C., Macdonald, N., McIntyre, N., Mediero, L., Merz, B., Merz, R., Molnar, P., Montanari, A., Neuhold, C., Parajka, J., Perdigão, R. A. P., Plavcová, L., Rogger, M., Salinas, J. L., Sauquet, E., Schär, C., Szolgay, J., Viglione, A., and Blöschl, G.: Understanding flood regime changes in Europe: a state-of-the-art assessment, Hydrol. Earth Syst. Sci., 18, 2735–2772, https://doi.org/10.5194/hess-18-2735-2014, 2014.
He, W., Kim, S., Wasko, C., and Sharma, A.: A global assessment of change in flood volume with surface air temperature, Adv. Water Resour., 165, 104241, https://doi.org/10.1016/j.advwatres.2022.104241, 2022.
Heffernan, J. E. and Tawn, J. A.: A conditional approach for multivariate extreme values (with discussion), J. Roy. Stat. Soc. B, 66, 497–546, https://doi.org/10.1111/j.1467-9868.2004.02050.x, 2004.
Hersbach, H., Bell, B., Berrisford, P., Biavati, G., Horányi, A., Muñoz Sabater, J., Nicolas, J., Peubey, C., Radu, R., Rozum, I., Schepers, D., Simmons, A., Soci, C., Dee, D., and Thépaut, J.-N.: ERA5 hourly data on single levels from 1940 to present, Copernicus Climate Change Service (C3S) Climate Data Store (CDS) [data set], https://doi.org/10.24381/cds.adbb2d47, 2023.
Herschy, R. W.: The world's maximum observed flood, Flow Meas. Instrum., 13, 231–235, https://doi.org/10.1016/S0955-5986(02)00054-7, 2002.
Houze, R. A.: Orographic effects on precipitating clouds, Rev. Geophys., 50, RG1001, https://doi.org/10.1029/2011rg000365, 2012.
Jarvis, A., Reuter, H. I., Nelson, A., and Guevara, E.: Hole-filled SRTM for the globe Version 4, CGIAR-CSI SRTM 90m Database [data set], http://srtm.csi.cgiar.org (last access: 17 November 2019), 2008.
Keef, C., Svensson, C., and Tawn, J. A.: Spatial dependence in extreme river flows and precipitation for Great Britain, J. Hydrol., 378, 240–252, https://doi.org/10.1016/j.jhydrol.2009.09.026, 2009a.
Keef, C., Tawn, J., and Svensson, C.: Spatial risk assessment for extreme river flows, J. R. Stat. Soc. C-Appl., 58, 601–618, https://www.jstor.org/stable/40541617 (last access: 6 June 2023), 2009b.
Keef, C., Tawn, J. A., and Lamb, R.: Estimating the probability of widespread flood events, Environmetrics, 24, 13–21, https://doi.org/10.1002/env.2190, 2013.
Kemter, M., Merz, B., Marwan, N., Vorogushyn, S., and Blöschl, G.: Joint trends in flood magnitudes and spatial extents across Europe, Geophys. Res. Lett., 47, e2020GL087464, https://doi.org/10.1029/2020gl087464, 2020.
Kron, W., Steuer, M., Löw, P., and Wirtz, A.: How to deal properly with a natural catastrophe database – analysis of flood losses, Nat. Hazards Earth Syst. Sci., 12, 535–550, https://doi.org/10.5194/nhess-12-535-2012, 2012.
Lamb, R., Keef, C., Tawn, J., Laeger, S., Meadowcroft, I., Surendran, S., Dunning, P., and Batstone, C.: A new method to assess the risk of local and widespread flooding on rivers and coasts, J. Flood Risk Manag., 3, 323–336, https://doi.org/10.1111/j.1753-318X.2010.01081.x, 2010.
Lehner, B., Verdin, K., and Jarvis, A.: New global hydrography derived from spaceborne elevation data, Eos Trans. AGU, 89, 93–94, https://doi.org/10.1029/2008EO100001, 2008 (data available at: https://www.hydrosheds.org/hydrosheds-core-downloads (last access: 24 June 2022).
Lei, L., Sun, J., He, N., Liu, Z., and Zeng, J.: A study on the mechanism for the vortex system evolution and development during the torrential rain event in North China on 20 July 2016, Acta Meteorol. Sin., 75, 685–699, https://doi.org/10.11676/qxxb2017.054, 2017 (in Chinese).
Li, C., Wang, G., and Li, R.: Maximum observed floods in China, Hydrolog. Si. J., 58, 728–735, https://doi.org/10.1080/02626667.2013.772299, 2013.
Li, M., Wu, P., and Ma, Z.: A comprehensive evaluation of soil moisture and soil temperature from third-generation atmospheric and land reanalysis data sets, Int. J. Climatol., 40, 5744–5766, https://doi.org/10.1002/joc.6549, 2020a.
Li, M., Wu, P., Ma, Z., Lv, M., and Yang, Q.: Changes in soil moisture persistence in China over the past 40 years under a warming climate, J. Climate, 33, 9531–9550, https://doi.org/10.1175/jcli-d-19-0900.1, 2020b.
Liu, C. and Shi, R.: Boundary data of East Asia Summer Monsoon Geo_Eco_region (EASMBND) [dataset], https://doi.org/10.3974/geodb.2015.01.12.V1, 2015.
Liu, W., Wei, X., Fan, H., Guo, X., Liu, Y., Zhang, M., and Li, Q.: Response of flow regimes to deforestation and reforestation in a rain-dominated large watershed of subtropical China, Hydrolog. Process., 29, 5003–5015, https://doi.org/10.1002/hyp.10459, 2015.
Lu, M., Yu, Z., Hua, J., Kang, C., and Lin, Z.: Spatial dependence of floods shaped by extreme rainfall under the influence of urbanization, Sci. Total Environ., 857, 159134, https://doi.org/10.1016/j.scitotenv.2022.159134, 2023.
Lu, P., Smith, J. A., and Lin, N.: Spatial characterization of flood magnitudes over the drainage network of the Delaware River basin, J. Hydrometeorol., 18, 957–976, https://doi.org/10.1175/jhm-d-16-0071.1, 2017.
Metin, A. D., Dung, N. V., Schröter, K., Vorogushyn, S., Guse, B., Kreibich, H., and Merz, B.: The role of spatial dependence for large-scale flood risk estimation, Nat. Hazards Earth Syst. Sci., 20, 967–979, https://doi.org/10.5194/nhess-20-967-2020, 2020.
Nanditha, J. S. and Mishra, V.: Multiday precipitation is a prominent driver of floods in Indian river basins, Water Resour. Res., 58, e2022WR032723, https://doi.org/10.1029/2022WR032723, 2022.
Neal, J., Keef, C., Bates, P., Beven, K., and Leedal, D.: Probabilistic flood risk mapping including spatial dependence, Hydrol. Process., 27, 1349–1363, https://doi.org/10.1002/hyp.9572, 2013.
Nguyen, V. D., Metin, A. D., Alfieri, L., Vorogushyn, S., and Merz, B.: Biases in national and continental flood risk assessments by ignoring spatial dependence, Sci. Rep., 10, 19387, https://doi.org/10.1038/s41598-020-76523-2, 2020.
Pewsey, A., Neuhäuser, M., and Ruxton, G. D.: Circular Statistics in R, OUP Oxford, Oxford University Press, ISBN 9780199671137, 2013.
Qing, D., Thibodeau, J. G., Williams, M. R., Dai, Q., Yi, M., and Topping, A. R. (Eds.): The river dragon has come!: Three Gorges Dam and the fate of China’s Yangtze River and its people, Routledge, ISBN 978-0765602060, 2016.
Quinn, N., Bates, P. D., Neal, J., Smith, A., Wing, O., Sampson, C., Smith, J., and Heffernan, J.: The spatial dependence of flood hazard and risk in the United States, Water Resour. Res., 55, 1890–1911, https://doi.org/10.1029/2018wr024205, 2019.
Rousseeuw, P. J.: Silhouettes: a graphical aid to the interpretation and validation of cluster analysis, J. Comput. Appl. Math., 20, 53–65, https://doi.org/10.1016/0377-0427(87)90125-7, 1987.
Roxy, M. K., Ghosh, S., Pathak, A., Athulya, R., Mujumdar, M., Murtugudde, R., Terray, P., and Rajeevan, M.: A threefold rise in widespread extreme rain events over central India, Nat. Commun., 8, 708, https://doi.org/10.1038/s41467-017-00744-9, 2017.
Smith, J. A., Baeck, M. L., Su, Y., Liu, M., and Vecchi, G. A.: Strange storms: Rainfall extremes from the remnants of Hurricane Ida (2021) in the northeastern US, Water Resour. Res., 59, e2022WR033934, https://doi.org/10.1029/2022wr033934, 2023.
Smith, J. A., Cox, A. A., Baeck, M. L., Yang, L., and Bates, P.: Strange floods: The upper tail of flood peaks in the United States, Water Resour. Res., 54, 6510–6542, https://doi.org/10.1029/2018wr022539, 2018.
Strobl, C., Boulesteix, A. L., Kneib, T., Augustin, T., and Zeileis, A.: Conditional variable importance for random forests, BMC Bioinformatics, 9, 307, https://doi.org/10.1186/1471-2105-9-307, 2008.
Sun, G., Hu, Z., Ma, Y., Xie, Z., Sun, F., Wang, J., and Yang, S.: Analysis of local land atmosphere coupling characteristics over Tibetan Plateau in the dry and rainy seasons using observational data and ERA5, Sci. Total Environ., 774, 145138, https://doi.org/10.1016/j.scitotenv.2021.145138, 2021.
Tan, X., Wu, X., and Liu, B.: Global changes in the spatial extents of precipitation extremes, Environ. Res. Lett., 16, 054017, https://doi.org/10.1088/1748-9326/abf462, 2021.
Tang, Y., Huang, A., Wu, P., Huang, D., Xue, D., and Wu, Y.: Drivers of summer extreme precipitation events over East China, Geophys. Res. Lett., 48, e2021GL093670, https://doi.org/10.1029/2021gl093670, 2021.
Tarouilly, E., Li, D., and Lettenmaier, D. P.: Western U.S. superfloods in the recent instrumental record, Water Resour. Res., 57, e2020WR029287, https://doi.org/10.1029/2020wr029287, 2021.
Tellman, B., Sullivan, J. A., Kuhn, C., Kettner, A. J., Doyle, C. S., Brakenridge, G. R., Erickson, T. A., and Slayback, D. A.: Satellite imaging reveals increased proportion of population exposed to floods, Nature, 596, 80–86, https://doi.org/10.1038/s41586-021-03695-w, 2021.
Timonina, A., Hochrainer-Stigler, S., Pflug, G., Jongman, B., and Rojas, R.: Structured coupling of probability loss distributions: assessing joint flood risk in multiple river basins, Risk Anal., 35, 2102–2119, https://doi.org/10.1111/risa.12382, 2015.
Turner-Gillespie, D. F., Smith, J. A., and Bates, P. D.: Attenuating reaches and the regional flood response of an urbanizing drainage basin, Adv. Water Resour., 26, 673–684, https://doi.org/10.1016/s0309-1708(03)00017-4, 2003.
Tyralis, H., Papacharalampous, G., and Langousis, A.: A brief review of random forests for water scientists and practitioners and their recent history in water resources, Water, 11, 910, https://doi.org/10.3390/w11050910, 2019.
Uhlemann, S., Thieken, A. H., and Merz, B.: A consistent set of trans-basin floods in Germany between 1952–2002, Hydrol. Earth Syst. Sci., 14, 1277–1295, https://doi.org/10.5194/hess-14-1277-2010, 2010.
Villarini, G., Smith, J. A., Baeck, M. L., Marchok, T., and Vecchi, G. A.: Characterization of rainfall distribution and flooding associated with U.S. landfalling tropical cyclones: Analyses of Hurricanes Frances, Ivan, and Jeanne (2004), J. Geophys. Res.-Atmos., 116, D23116, https://doi.org/10.1029/2011jd016175, 2011.
Wang, S., Zhang, L., Wang, G., She, D., Zhang, Q., Xia, J., and Zhang, Y.: More intense and longer torrential rain and flood events during the recent past decade in Eurasia, Water Resour. Res., 59, e2022WR033314, https://doi.org/10.1029/2022wr033314, 2023.
Wu, J. and Gao, X.: A gridded daily observation dataset over China region and comparison with the other datasets, Chinese Journal of Geophysics, 56, 1102–1111, https://doi.org/10.6038/cjg20130406, 2013 (in Chinese).
Xie, Z., Bueh, C., Ji, L., and Sun, S.: The cold vortex circulation over northeastern China and regional rainstorm events, Atmos. Ocean. Sci. Lett., 5, 134–139, https://doi.org/10.1080/16742834.2012.11446979, 2015.
Xu, X., Liu, J., Zhang, S., Li, R., Yan, C., and Wu, S.: China multi period land use remote sensing monitoring dataset (CNLUCC), Data Registration and Publishing System of the Resource and Environmental Science Data Center of the Chinese Academy of Sciences [data set], https://doi.org/10.12078/2018070201, 2018.
Yang, L., Yang, Y., and Smith, J.: The upper tail of flood peaks over China: Hydrology, hydrometeorology, and hydroclimatology, Water Resour. Res., 57, e2021WR030883, https://doi.org/10.1029/2021WR030883, 2021a.
Yang, L., Liu, M., Smith, J. A., and Tian, F.: Typhoon Nina and the August 1975 flood over central China, J. Hydrometeorol., 18, 451–472, https://doi.org/10.1175/jhm-d-16-0152.1, 2017.
Yang, L., Wang, L., Li, X., and Gao, J.: On the flood peak distributions over China, Hydrol. Earth Syst. Sci., 23, 5133–5149, https://doi.org/10.5194/hess-23-5133-2019, 2019.
Yang, L., Villarini, G., Zeng, Z., Smith, J., Liu, M., Li, X., Wang, L., and Hou, A.: Riverine flooding and landfalling tropical cyclones over China, Earth's Future, 8, e2019EF001451, https://doi.org/10.1029/2019ef001451, 2020.
Yang, L., Yang, Y., Villarini, G., Li, X., Hu, H., Wang, L., Blöschl, G., and Tian, F.: Climate more important for Chinese flood changes than reservoirs and land use, Geophys. Res. Lett., 48, e2021GL093061, https://doi.org/10.1029/2021gl093061, 2021b.
Yang, Y., Yang, L., Chen, X., Wang, Q., and Tian, F.: Climate leads to reversed latitudinal changes in Chinese flood peak timing, Earth's Future, 10, e2022EF002726, https://doi.org/10.1029/2022ef002726, 2022.
Yang, Y., Yang, L., Zhang, J., and Wang, Q.: YangEtAl_2023_Dataset_Regional flood catalog, figshare [data set], https://doi.org/10.6084/m9.figshare.24636153.v1, 2023a.
Yang, Y., Yang, L., Zhang, J., and Wang, Q.: YangEtAl_2023_Scripts_RegionalFloodAnalyses, figshare [code], https://doi.org/10.6084/m9.figshare.24637266.v1, 2023b.
Yuan, Y., Gao, H., Li, W., Liu, Y., Chen, L., Zhou, B., and Ding, Y.: The 2016 summer floods in China and associated physical mechanisms: A comparison with 1998, J. Meteorol. Res., 31, 261–277, https://doi.org/10.1007/s13351-017-6192-5, 2017.
Zeileis, A., Hothorn, T., and Hornik, K.: Model-based recursive partitioning, J. Comput. Graph. Stat., 17, 492–514, https://doi.org/10.1198/106186008X319331, 2008.
Zhao, Y., Chen, D., Li, J., Chen, D., Chang, Y., Li, J., and Qin, R.: Enhancement of the summer extreme precipitation over North China by interactions between moisture convergence and topographic settings, Clim. Dynam., 54, 2713–2730, https://doi.org/10.1007/s00382-020-05139-z, 2020.
Zhou, Y., Zhou, T., Jiang, J., Chen, X., Wu, B., Hu, S., and Wu, M.: Understanding the forcing mechanisms of the 1931 summer flood along the Yangtze River, the world's deadliest flood on record, J. Climate, 36, 6577–6596, https://doi.org/10.1175/jcli-d-22-0771.1, 2023.


