the Creative Commons Attribution 4.0 License.
the Creative Commons Attribution 4.0 License.
 | 04 Sep 2024
Mesoscale permeability variations estimated from natural airflows in the decorated Cosquer Cave (southeastern France)
Hugo Pellet
Pierre Henry
Stéphanie Touron
Ghislain Gassier
The conservation of decorated caves is highly dependent on airflows in the karst network and through the surrounding host rock. Airflows are driven by the pressure gradient and influenced by the shape of the karst conduits and the permeability of the carbonate rock massif. Cosquer Cave is an Upper Paleolithic decorated cave, half submerged in a coastal karst, where conservation is also dependent on the cave's pools connected to the sea. Hydroclimatic data, such as air pressure and temperature and the water level inside and outside the cave, have been measured for several years to identify the main processes governing the water level variations, the airflows, and the air renewal. The data show unusual behavior for a karst: the karst air pressure is nearly always higher than the atmospheric pressure. As a result, the water level in the cave is below the sea level. The daily variations of the sea tide provide an assessment of the cave volume above the water level in the pools. Although the cave air is confined by the rock and the seawater, there are also external air inflows during short pressurization events connected with waves that can produce and force air bubbles to flow along submarine open fissures or karst conduits inside the massif. Moreover, the effective permeability of the carbonate rocks to air at the massif scale is inferred from the cave air pressure decrease over the summer season by applying Darcy's law in a partially saturated medium. Six years of data show that permeability varies from year to year and according to the cumulative rainfalls during the spring and summer. The driest years are correlated with a higher permeability, a faster air pressure decrease in the cave, and a faster rise in the pools' water level. In the future, in the context of climate change, a perturbation of the rock permeability is then expected in the near-surface caves, which will impact airflows in decorated caves and may alter their fragile hydroclimatic stability.
- Article
(7817 KB) - Full-text XML
- BibTeX
- EndNote


Upper Paleolithic decorated caves constitute an exceptional cultural heritage. The climatic stability of the subterranean karstic environment has ensured the good preservation of paintings and engravings for millennia, despite their vulnerability (Andrieux, 1977; Mangin and Andrieux, 1984; Baffier, 2005; Bourges et al., 2006b). The equilibrium of the cave's climate is delicate and is maintained through intricate interactions with the environment (Quindos et al., 1987; Bourges et al., 2006a, 2014; Peyraube et al., 2018; Leplat et al., 2019). Disruptions in the climatic equilibrium have notably been linked to cave equipment and tourism (Cigna, 1993; Baker and Genty, 1998; Touron et al., 2019) but do not entirely spare caves closed to the public, especially in the context of climate change (Domínguez-Villar et al., 2015; Bourges and Enjalbert, 2020). A shift in the climatic equilibrium could lead to fluctuations of different parameters such as CO2 concentrations, humidity, temperature, or air exchanges and flows (Badino, 2010; Mattey et al., 2013; Kukuljan et al., 2021). This, in turn, could contribute to the deterioration of the artwork due to outbreaks of microorganisms (Lefèvre, 1974; Martin-Sanchez et al., 2012; Borderie et al., 2015), the emergence of efflorescence (Lepinay et al., 2018; Germinario and Oguchi, 2021), or the processes of calcite precipitation or dissolution (Ford and Williams, 2007; Touron and Frouin, 2022).
In karst, two main types of airflows occur: airflows between the outside and inside of caves (and conversely) and airflows within caves (Lismonde, 2002; Sainz et al., 2018; Gázquez et al., 2022). In caves with two openings, airflow is mainly driven by the temperature difference between the outside and inside of the cave or between the upper and lower openings (Lismonde, 2002; Gabrovšek, 2023). The flow is continuous, and its direction depends on the season. Within caves with a single aperture, airflows result from the air density gradient due to differences in temperature or humidity either within the cave or between the cave and the outside environment (Lismonde, 2002; Luetscher and Jeannin, 2004; Malaurent et al., 2006; Liñán et al., 2018; Huang, 2018). These flows are subject to seasonality, with generally stronger flows in winter and stratification of air masses in summer for descending conduits and conversely for ascending conduits (Perrier et al., 2007; Mattey et al., 2013; Lacanette et al., 2023). These air movements also occur in artificially closed caves but are comparatively milder in intensity.
Exchanges with the outside environment resulting in the air renewal of the caves, as well as exchanges between the different rooms, are conventionally assessed through measurements of radon and/or CO2 concentrations (Richon et al., 2005; Kowalczk and Froelich, 2010; Sainz et al., 2018). Air renewal can be calculated when the cave volumes are known, but the latter are not systematically measured as this can be time-consuming and costly. Cave volumes can be obtained using different techniques such as lasergrammetry and photogrammetry (Mohammed Oludare and Pradhan, 2016) or estimated from 3D speleological hand surveys, but they remain limited by accessibility for human investigation. The permeability of the host rock also influences exchanges with the outside environment and can be locally measured at the scale of a few centimeters on plugs (Borgomano et al., 2013) or at the scale of a well using pumping tests in the saturated zone or in the unsaturated zone (Kuang et al., 2013). Permeability to air or water of the unsaturated zone is also dependent on the water content. Thus, when dealing with the conservation of decorated caves, permeability of the carbonate massif in the unsaturated zone is a key parameter since it can control the air or water flows through the rock by limiting or enhancing the flux of exchanges. This paper aims to estimate the volume of a coastal cave, determine the net airflow exchanged with the outside environment, and discuss the variation of the effective air permeability of the massif. The methodology relies on the monitoring of in situ pressure and temperature data.
The topic was explored by studying Cosquer Cave (southeastern France), which is a singular case of a decorated cave located within a partially submerged coastal karst. Although other partially submerged caves have been found in the Mediterranean region (Arfib and Charlier, 2016; Castagnino Berlinghieri et al., 2020; Arfib and Mocochain, 2022), Cosquer Cave is of special interest since it is isolated by siphons on the one side and by a low-permeability limestone massif on the other side. Initial data (Vouvé et al., 1996; Arfib et al., 2018) showed that the air pressure in the cave can remain higher than the outside atmospheric pressure for weeks. Cave air pressure increases through the inflow of outside air during periods with high waves breaking on the cliff of the coastal limestone massif. Waves can produce and force air bubbles to flow along submarine open fissures or karst conduits inside the massif during short periods of time. Since the rock is not airtight, air slowly flows out through the limestone massif over several months. We took advantage of this behavior to investigate the permeability variations of the limestone massif at the mesoscale.
Firstly, we present 2 full years of data, including cave air pressure, atmospheric pressure, cave water level variations, and sea level variations. These data were used to investigate cave pressure fluctuations across annual to daily temporal scales. The daily pressure variations related to tides provide an assessment of the cave volume filled by pressurized air above the water level of the pools by applying the ideal gas law. This outcome was used to compute the net airflows entering and leaving the cave. Finally, the limestone's effective air permeability at the massif scale was estimated from the cave air pressure decrease during the summer season by applying Darcy's law. Permeability was then compared to rainfalls, and its evolution is discussed in the context of climate change. This study proposes for the first time a conceptual model and a quantitative assessment of flows within both the saturated and unsaturated zones of Cosquer Cave. It also highlights that airflows may change in the karst's unsaturated zone with changes in the water cycle.
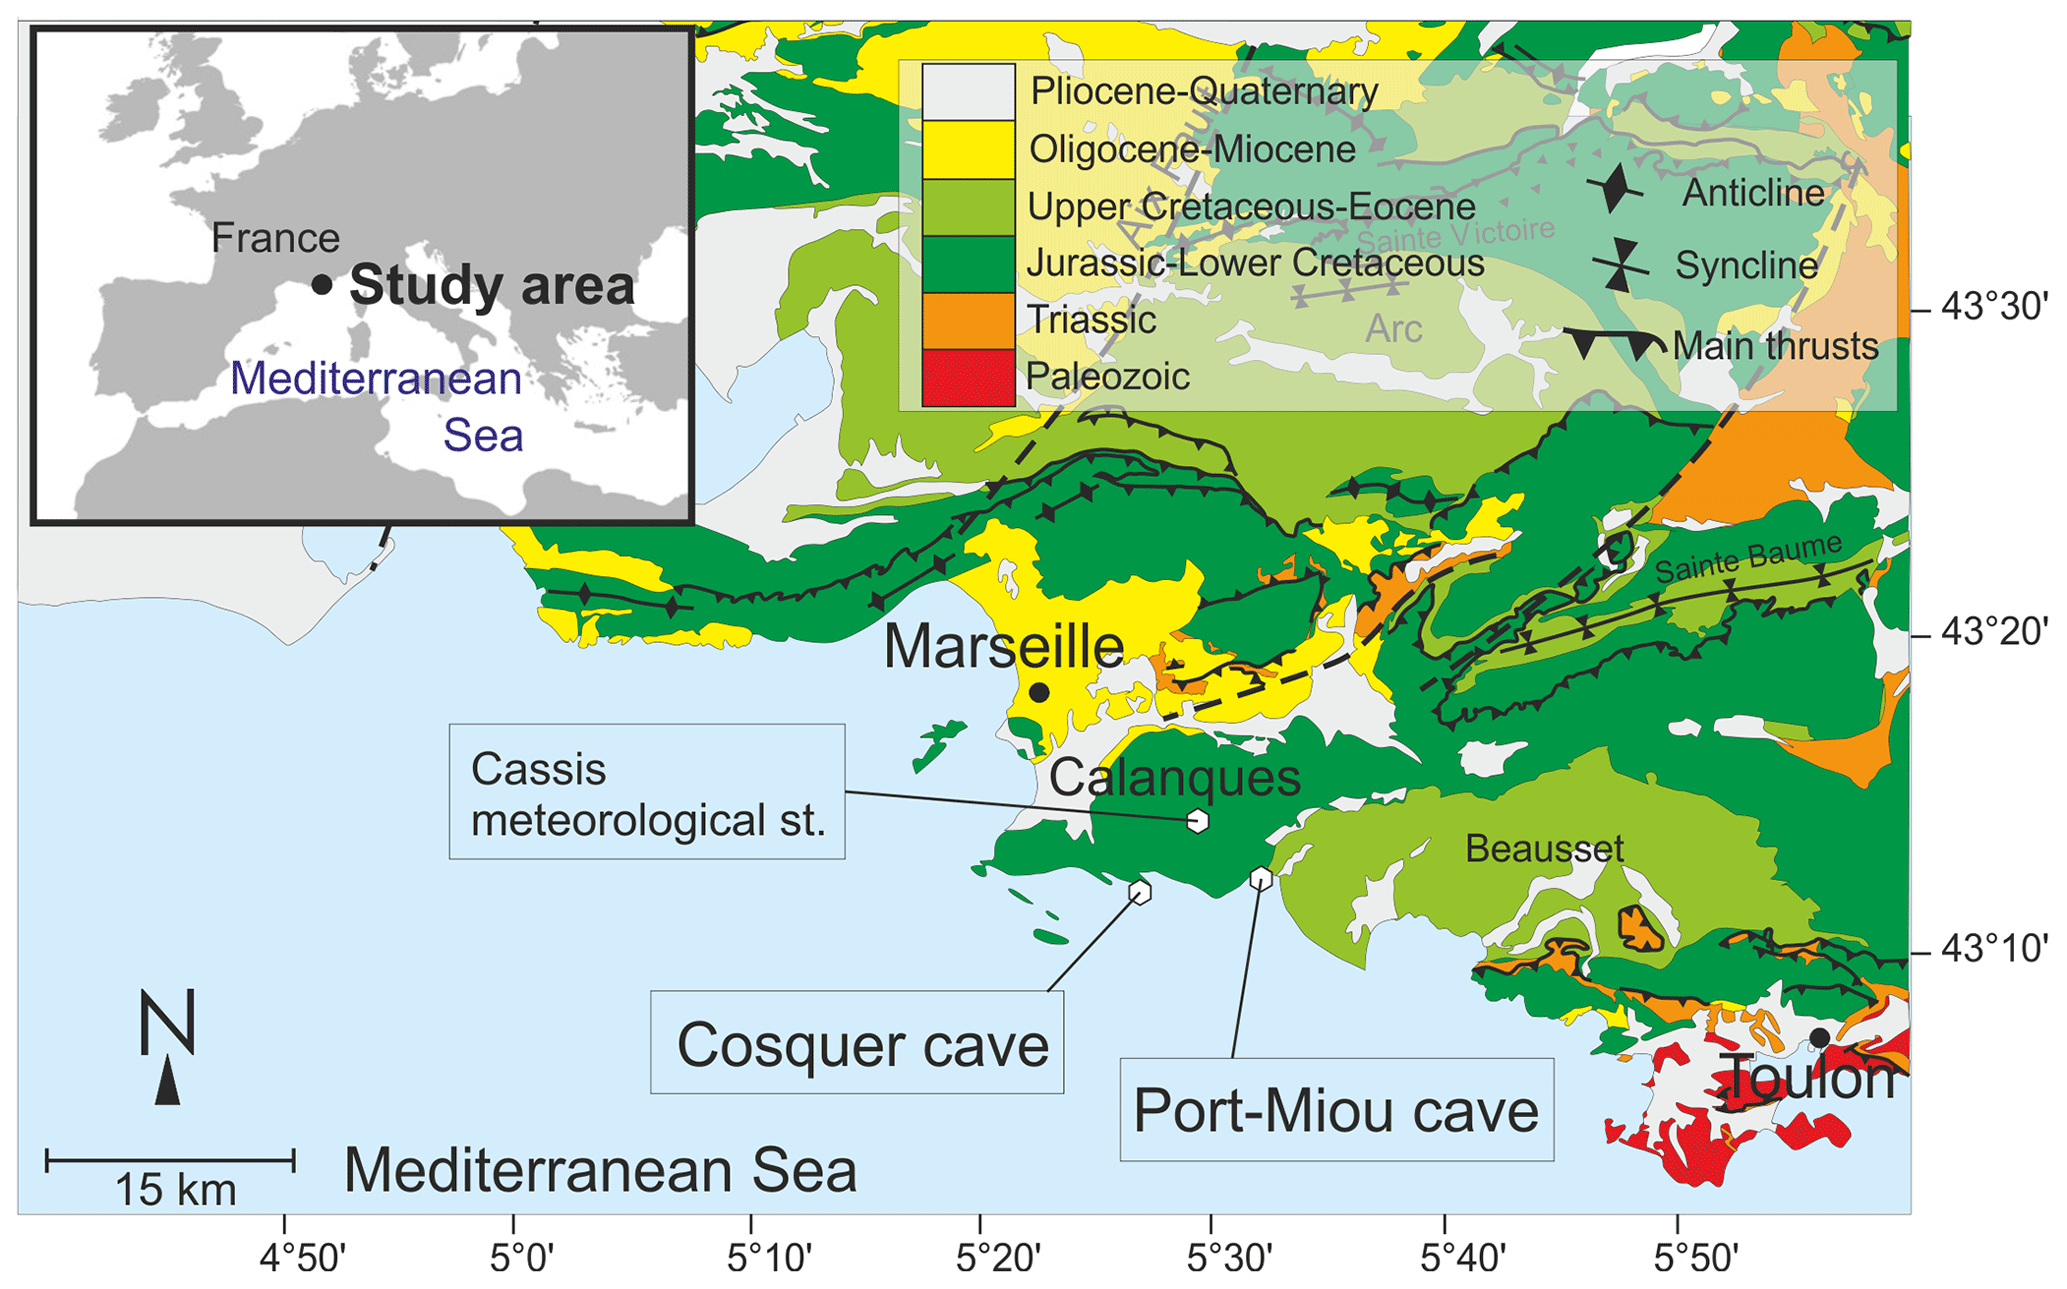
Figure 1Structural map of the Provence region (southeastern France), with the locations of Cosquer Cave, the Port-Miou observation site, and the Cassis meteorological station. Modified from Lamarche et al. (2012).
Cosquer Cave, located in the southeast of France on the Mediterranean seashore, is a partly submerged cave. It is located in Calanques National Park near Marseille in Provence. Part of the cave develops below the current sea level and is filled with seawater, and part of the cave remains filled with air above the sea level. It hosts a large range of paintings and engravings from the Upper Paleolithic, with 553 graphic entities recorded to date, dating back 32 500 to 19 000 yr BP (Clottes et al., 1992a, b, 1997; Valladas et al., 2001, 2017). Among the representations, some animals rarely represented in prehistoric artwork are painted (penguins and jellyfish, Clottes et al., 1992a; Delporte et al., 1994). All the preserved artworks are located in the aerial part of the cave. The only way to currently access the cave in the limestone massif is by cave diving in submerged karstic conduits. However, during the Upper Paleolithic period, prehistoric humans accessed the cave through an entrance that is now 37 m b.s.l. (below sea level). The sea level was lower back then, e.g., during the Last Glacial Maximum about 20 000 years ago, about 120 m lower than today (Benjamin et al., 2017). The entrance was flooded between 10 000 and 8000 yr BP (Sartoretto et al., 1995; Lambeck and Bard, 2000) by the rising sea level.
The cave is located in the Morgiou massif, a peninsula made up of Early Cretaceous–Urgonian limestones (Masse et al., 2020). These limestones are tight carbonates and rudist-rich oolitic grainstones. According to thin sections, these carbonates display neither macroporosity nor microporosity (Lamarche et al., 2012; Matonti et al., 2015). The cave consists of two rooms whose walls host Paleolithic paintings and engravings as well as pools hydraulically connected to the sea. Karstic voids used bedding planes and fractures to develop, forming a karst network made up of four areas: (1) a main conduit from a depth of 37 m to Room 1, below the sea level; (2) Rooms 1 and 2, partly flooded, containing Paleolithic decorations above the water level of the pools; (3) a vertical shaft (named “Grand Puits”, or “high shaft”, crossing Room 2) that is 35 m high above the pool water level; and (4) an upper karst conduit located in a higher bedding plane, running above the decorated rooms and connected on the one side to Room 2 by the Grand Puits and on the other side to a small pool of seawater. This pool is connected to the sea outside by karstic conduits that have not been fully surveyed for accessibility and safety reasons. However, the water level in the pool on the cave side varies with waves outside, which indicates that communication with the sea occurs at a shallow depth (Fig. 2), and it is suspected that large waves can push air bubbles through the conduits. Expeditions in the cave are never scheduled during rough weather, which makes direct observation of this phenomenon nearly impossible. However, we will show that instrumental records display a strong correlation between episodes of high waves and air input into the cave.
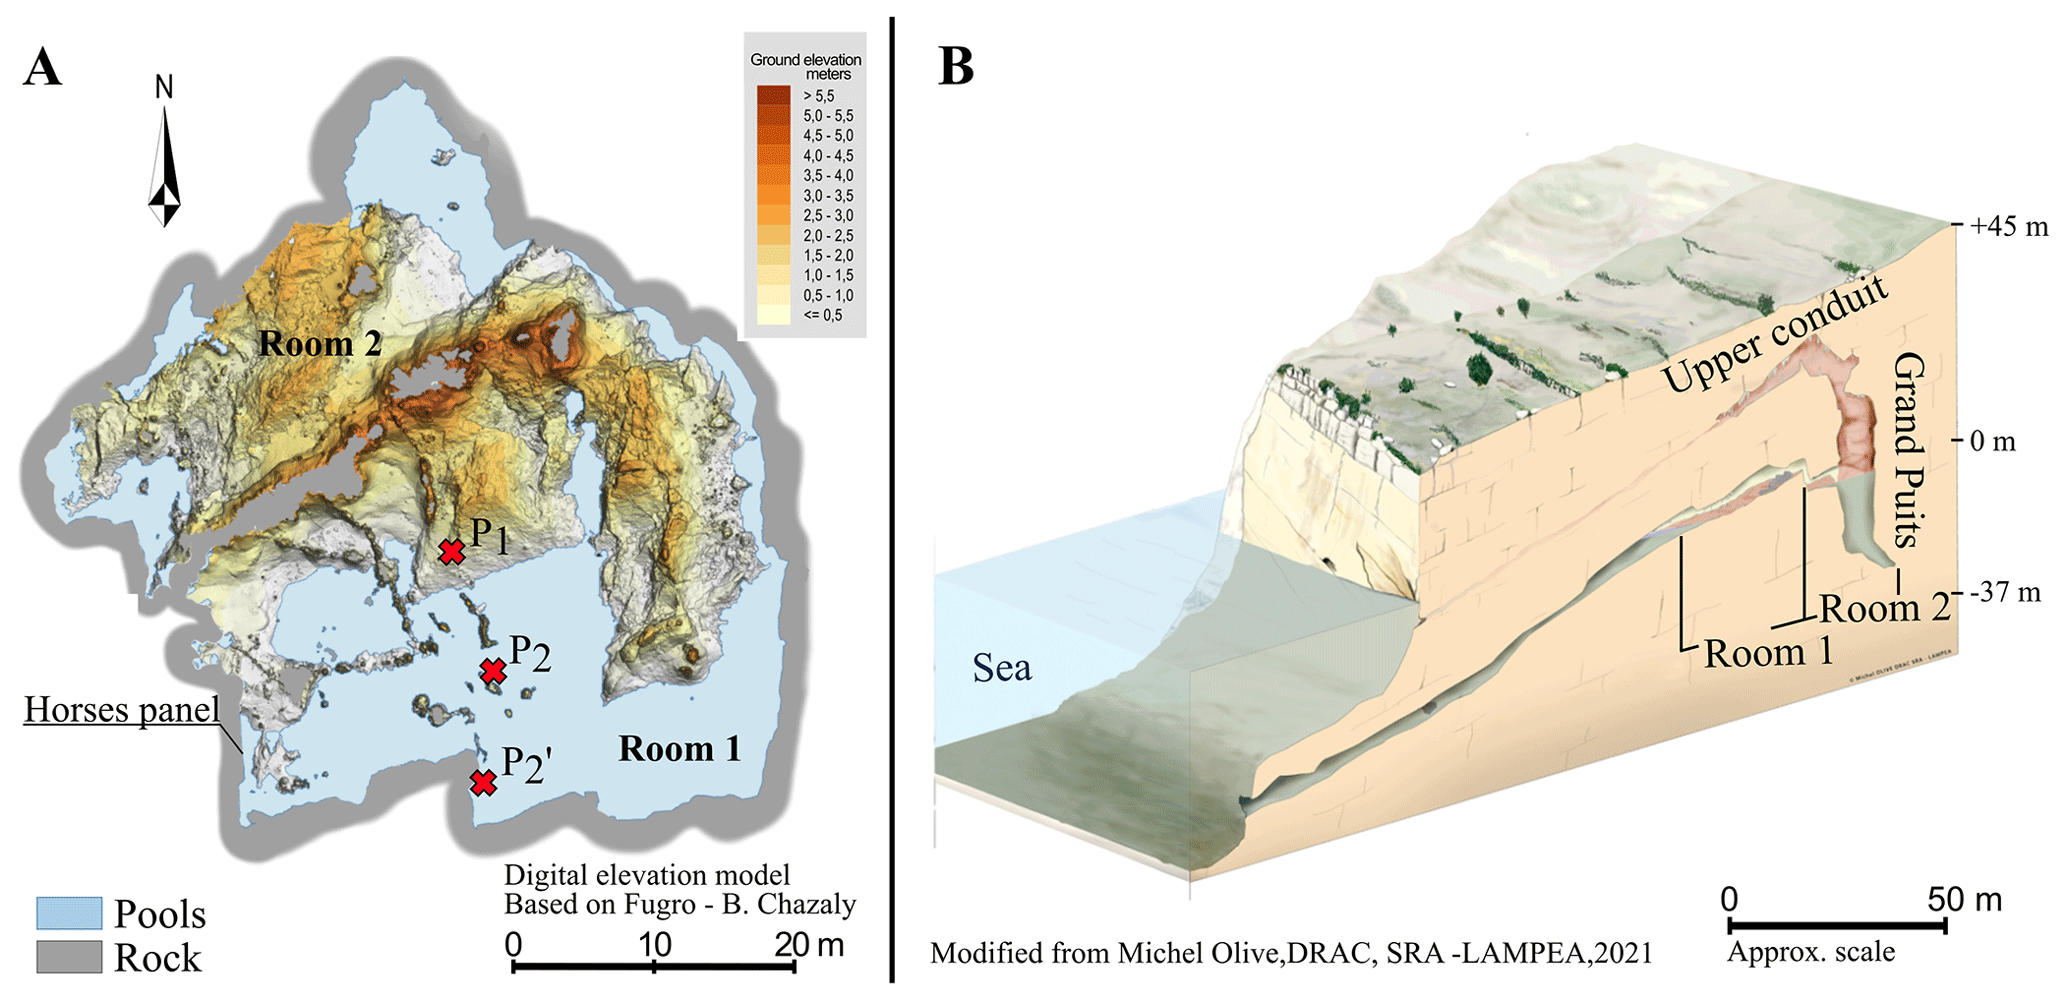
Figure 2(a) Topographic map of Cosquer Cave. The blue areas are the pools. The probes in the air are located in P1, hooked to a stalagmite 5 m away from the water and 1 m above the ground. The probes in the water are located in P2 and P'2 (map designed by C. Font, 2023, Équipe grotte Cosquer). (b) Schematic cross section of Cosquer Cave. The entrance of the conduit is 37 m b.s.l. (below sea level). Modified from Olive and Vanrell (2021).
Temperature and pressure in air are measured in Cosquer Cave using a Cera-Diver probe (resolution of 0.01 °C and accuracy of ±0.2 °C) and a STS DLN probe (resolution of 10 Pa and accuracy of ±0.1 % of the full scale – ±130 Pa). Both probes are located in Room 1, hooked to a stalagmite about 5 m away from the pool, 1 m above the ground, and 10 cm away from the stalagmite (location P1 in Fig. 2a). Conductivity–temperature–depth (CTD) diver probes measure the absolute pressure, temperature, and specific electric conductivity of water in Room 1 (locations P2 and P'2 in Fig. 2a). The CTD pressure resolution is 10 Pa, and the accuracy is 50 Pa. The atmospheric air pressure outside Cosquer Cave (SNO KARST, 2021) and the sea level are measured 5 km away from the cave using Baro-Diver or TD diver probes at the Port-Miou observation site of the French Karst National Observatory Service (Fig. 1). Port-Miou sea probes are moored in a large karst conduit connected to the sea (Arfib and Charlier, 2016; Jourde et al., 2018). This location protects measurements from marine storms and waves. Data have been continuously recorded since 2014 at a 5 min time step. The height of the water column is calculated from the absolute pressure by subtracting the air pressure above the water table and converting it to meters of seawater (msw) using the density of the Mediterranean Sea (ρsea=1027 kg m−3). Probes are factory-calibrated and their clocks synchronized. Measurement and clock drifts are checked with a control probe during data collection (every 4 to 5 months), and pressure sensors of air inside and outside the cave are intercalibrated. When the same pressure is recorded inside and outside the cave, the water level in the cave is thus equal to the sea level. The available data ran from 2014 to 2020 for this study. The precipitation data were provided by Météo-France records at Cassis (Météo-France, 2023), located 5 km to the northeast of Cosquer Cave in the Calanques massif. The significant height of waves in front of the cave is the result of simulations provided by the French Naval Hydrographic and Oceanographic Service (SHOM, 2024).
All the parameters used in this paper are summarized in Table 1 and illustrated in Fig. 3.
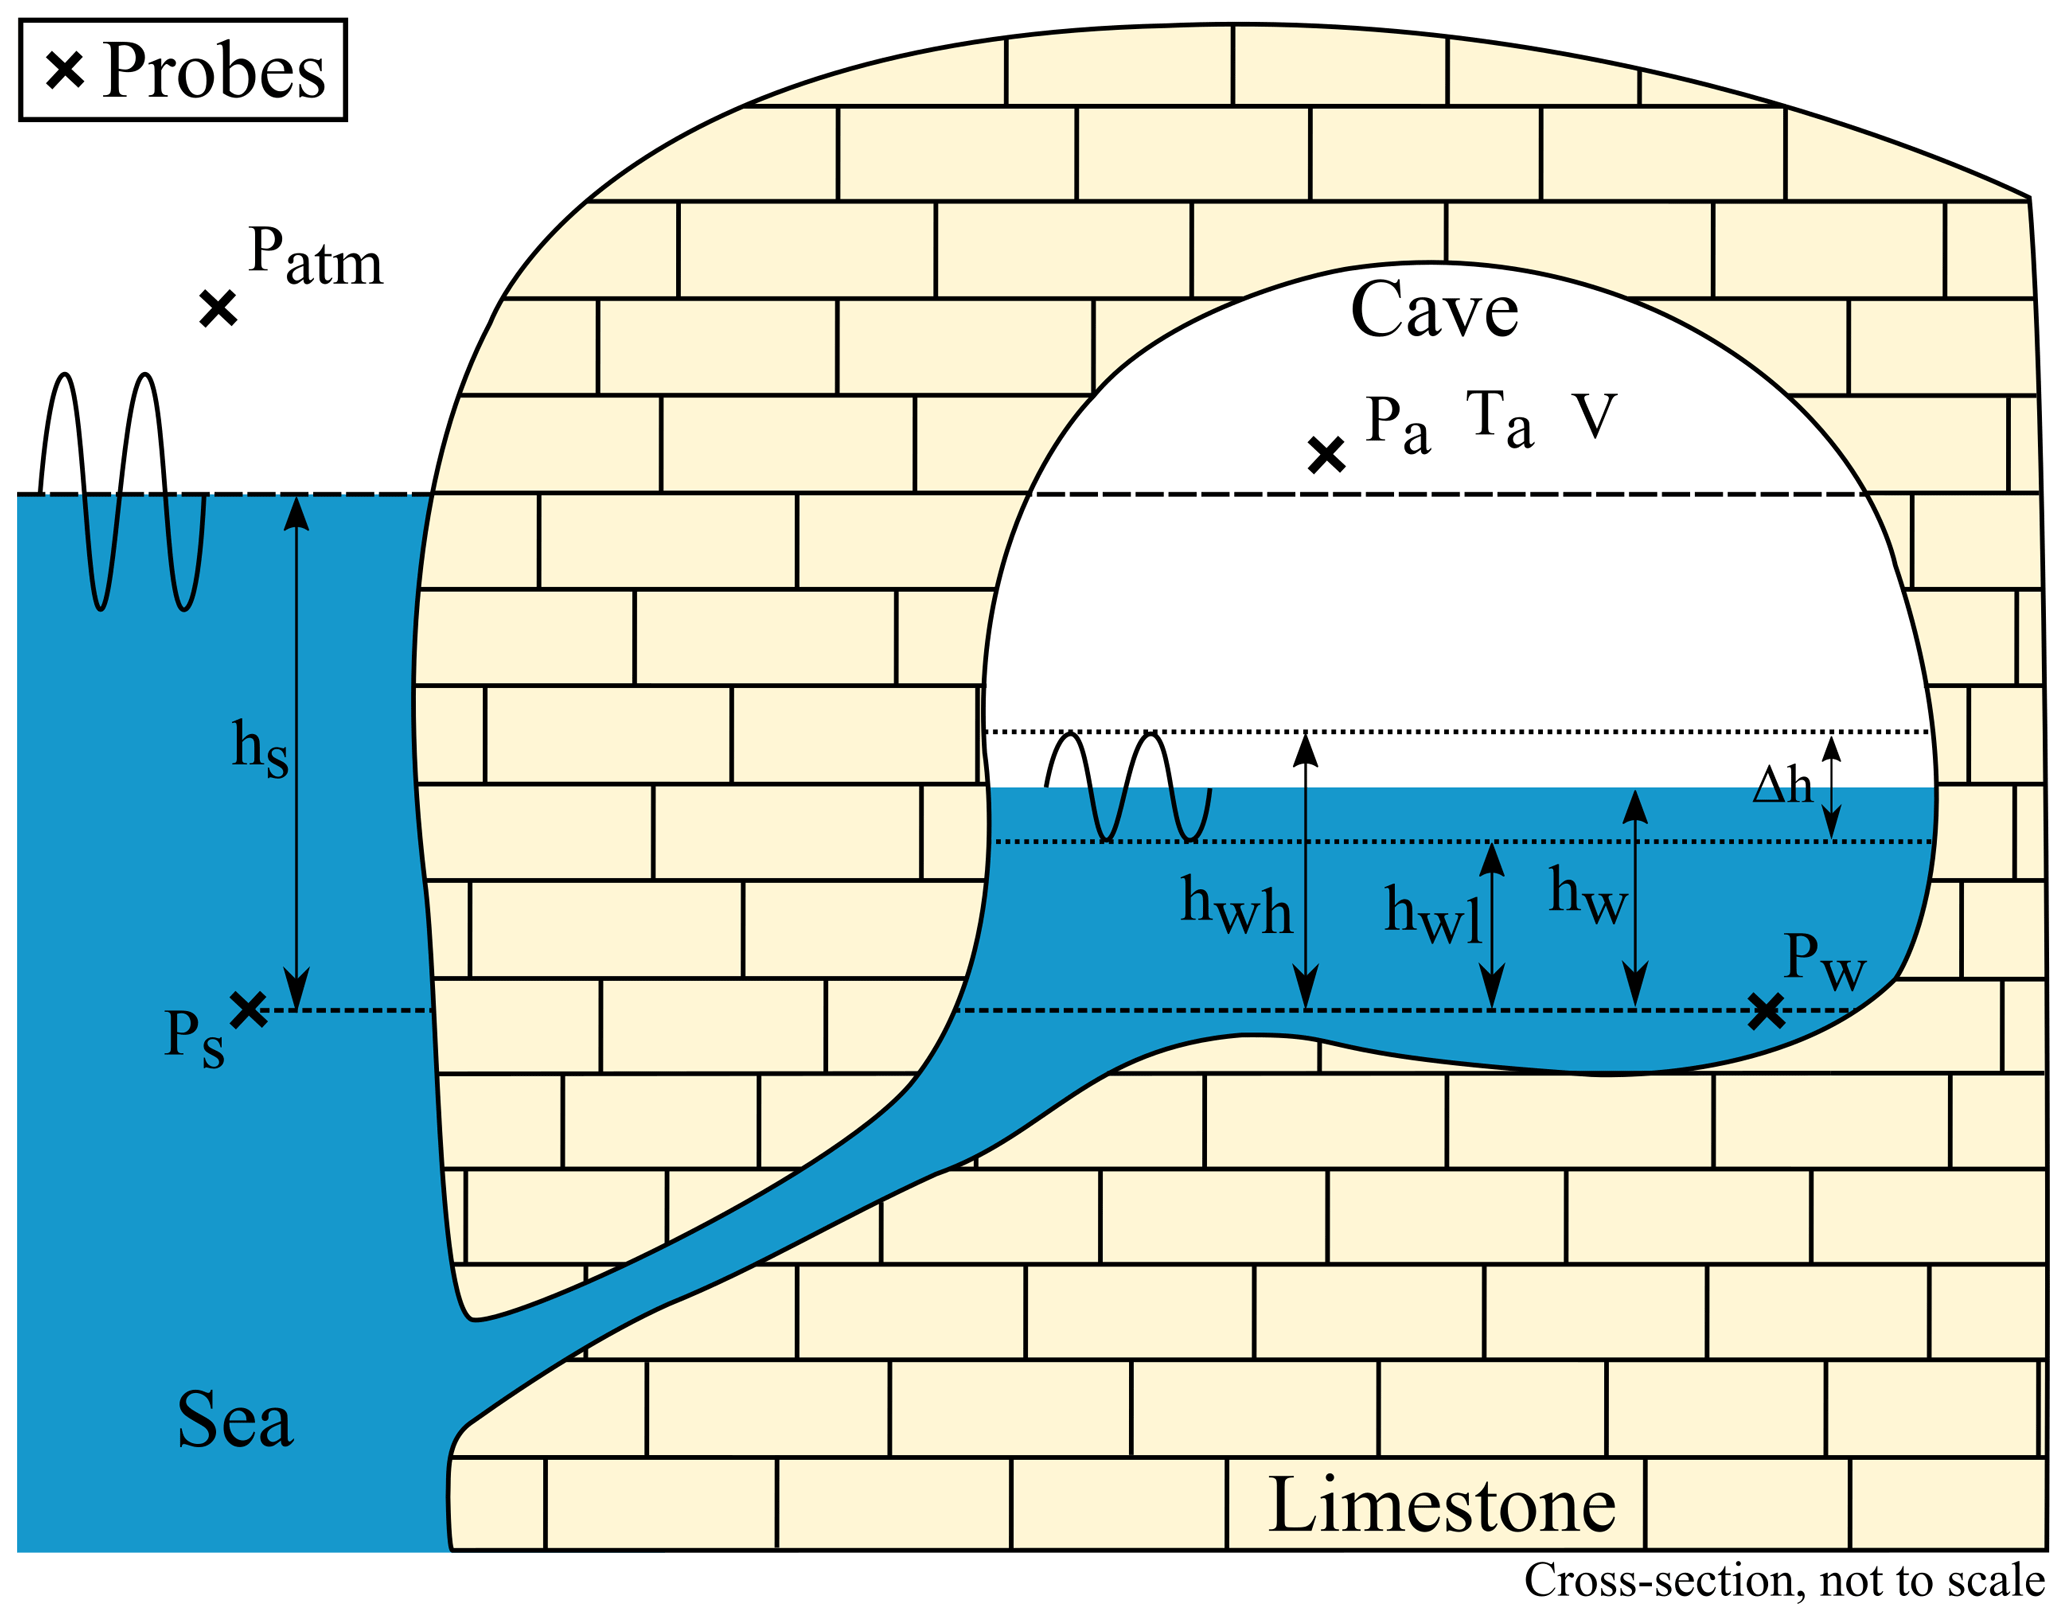
Figure 3The main parameters measured with pressure probes, viewed on a conceptual cross section of the coastal cave. See Table 1 for an explanation of the parameters.
Table 1Presentation of the physical parameters, their notation, and the units used in this paper.
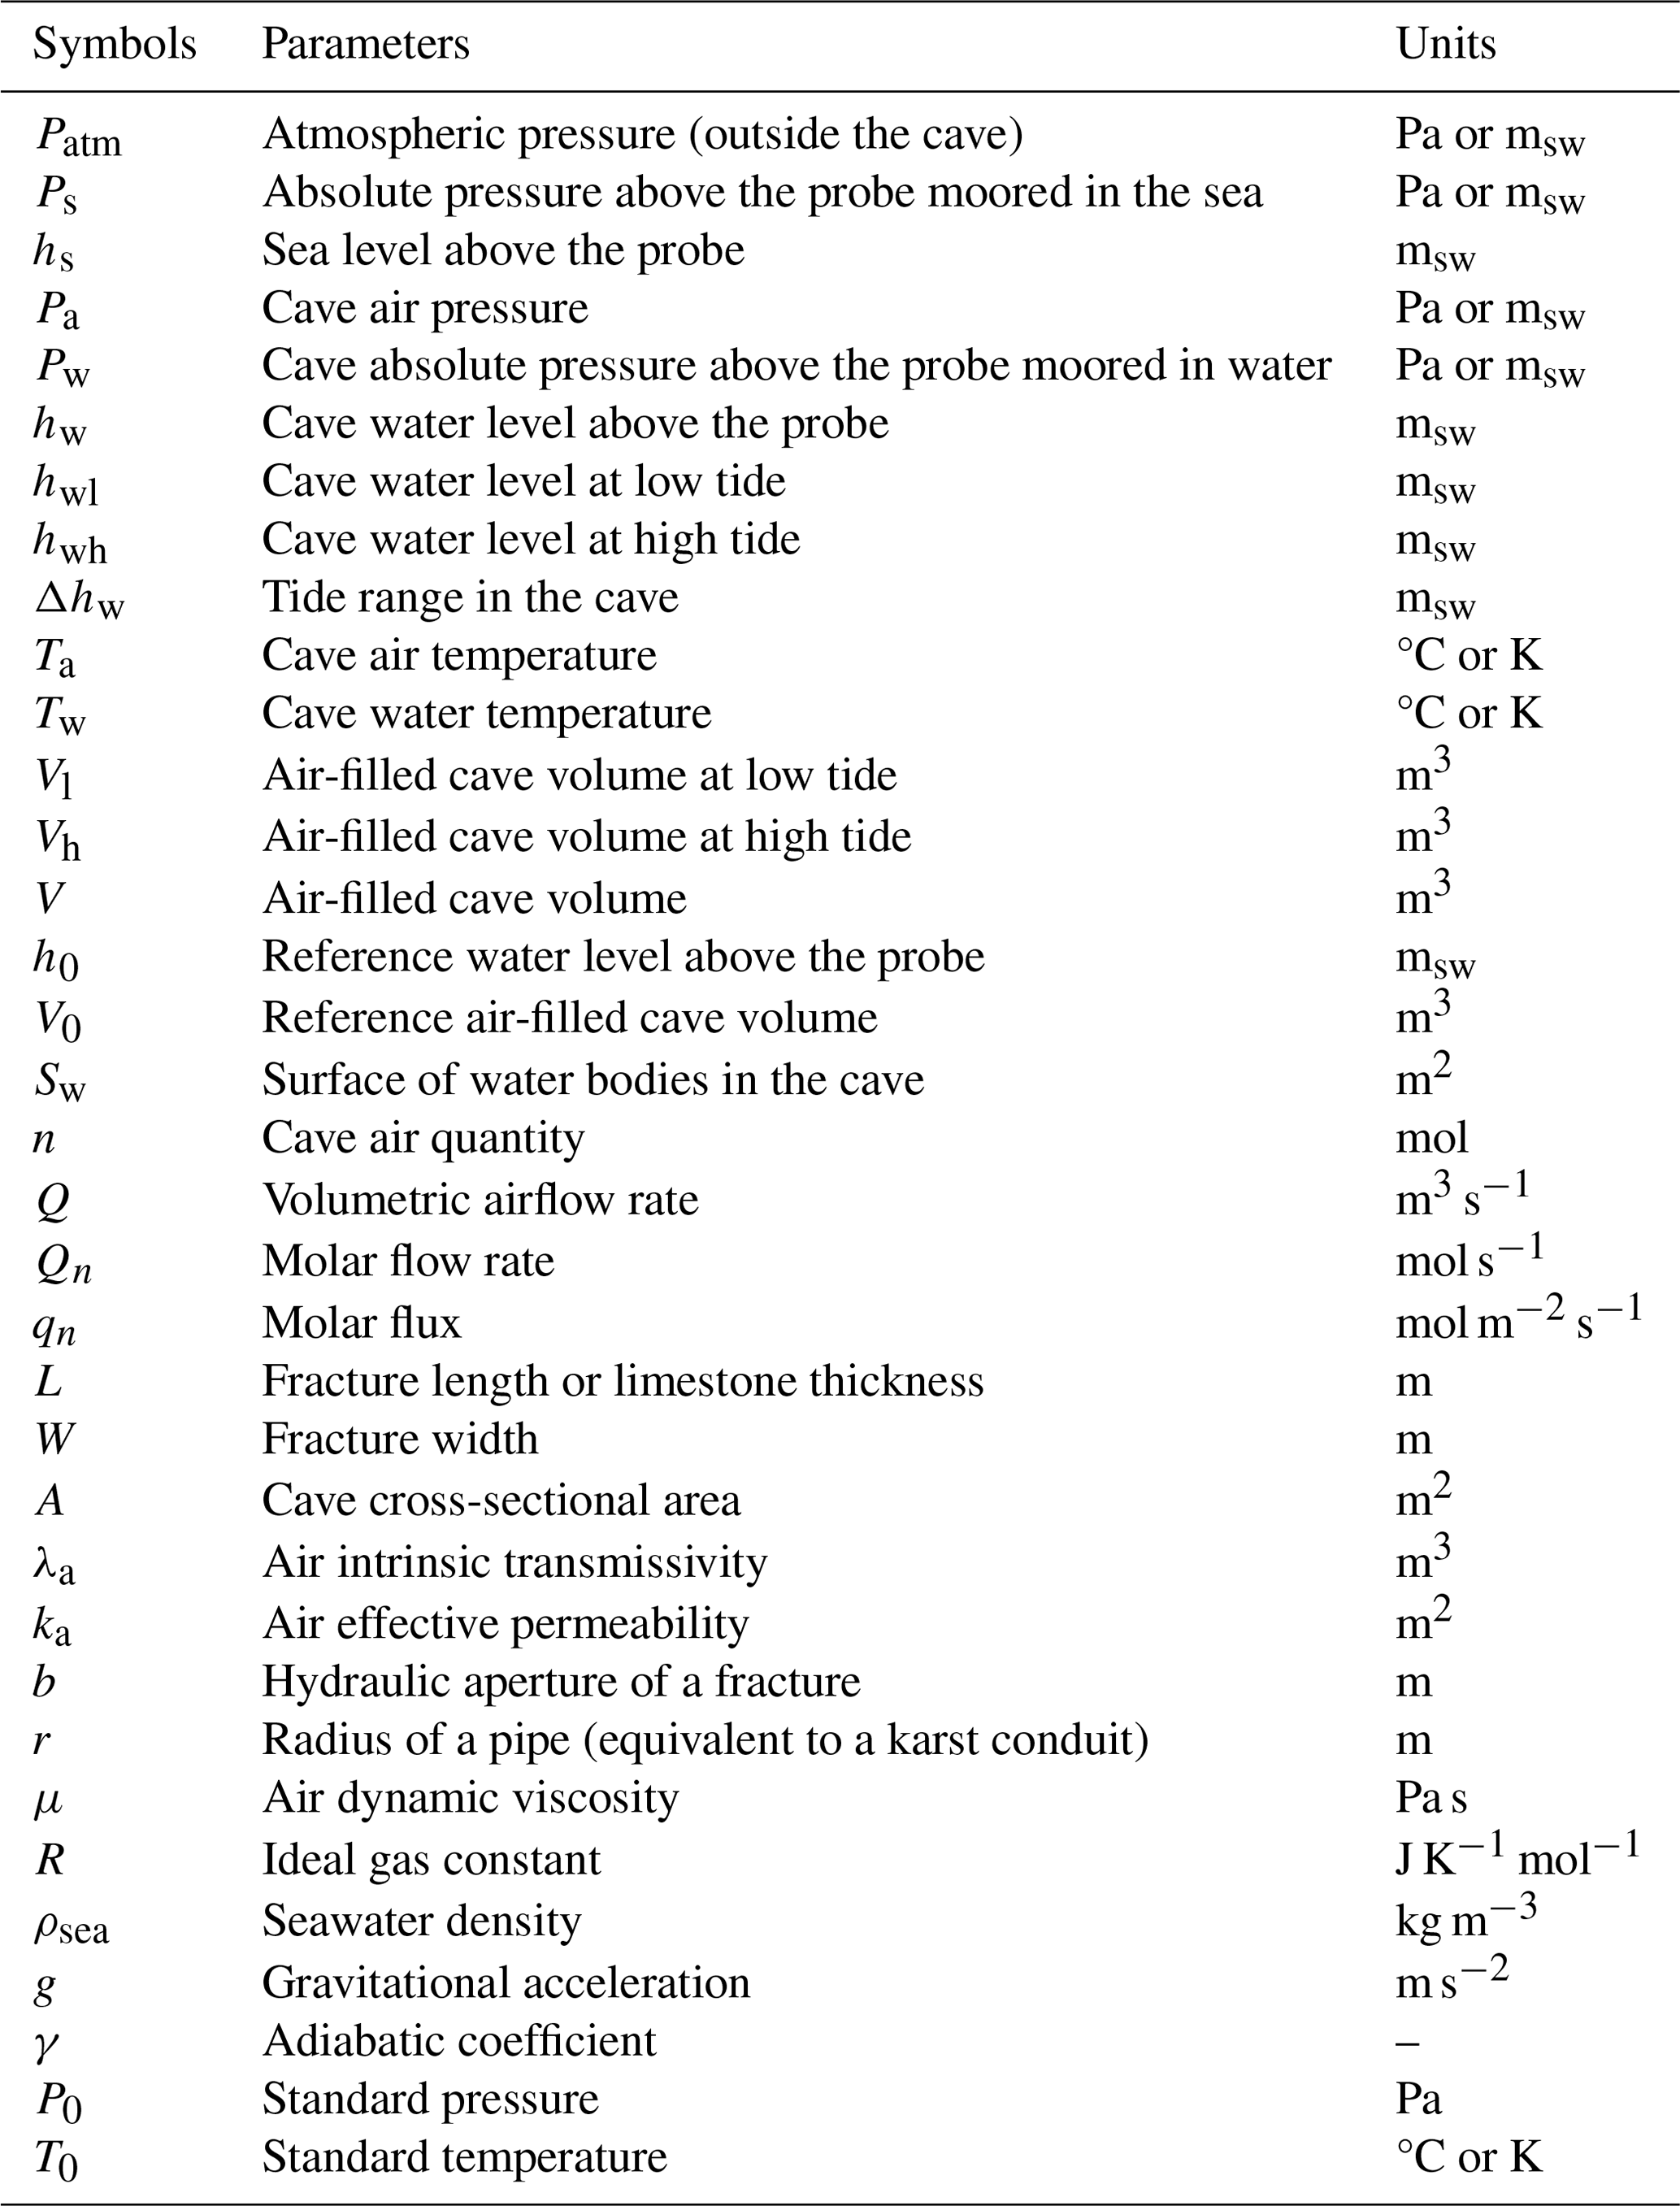
Figure 4 shows the pressure, temperature, and water level time series recorded in 2017 and 2018. These 2 years were used to illustrate the hydroclimatic behavior of the cave. Three types of variations were identified and are described below: (1) seasonal variations, (2) events lasting several hours to several days, and (3) daily variations.
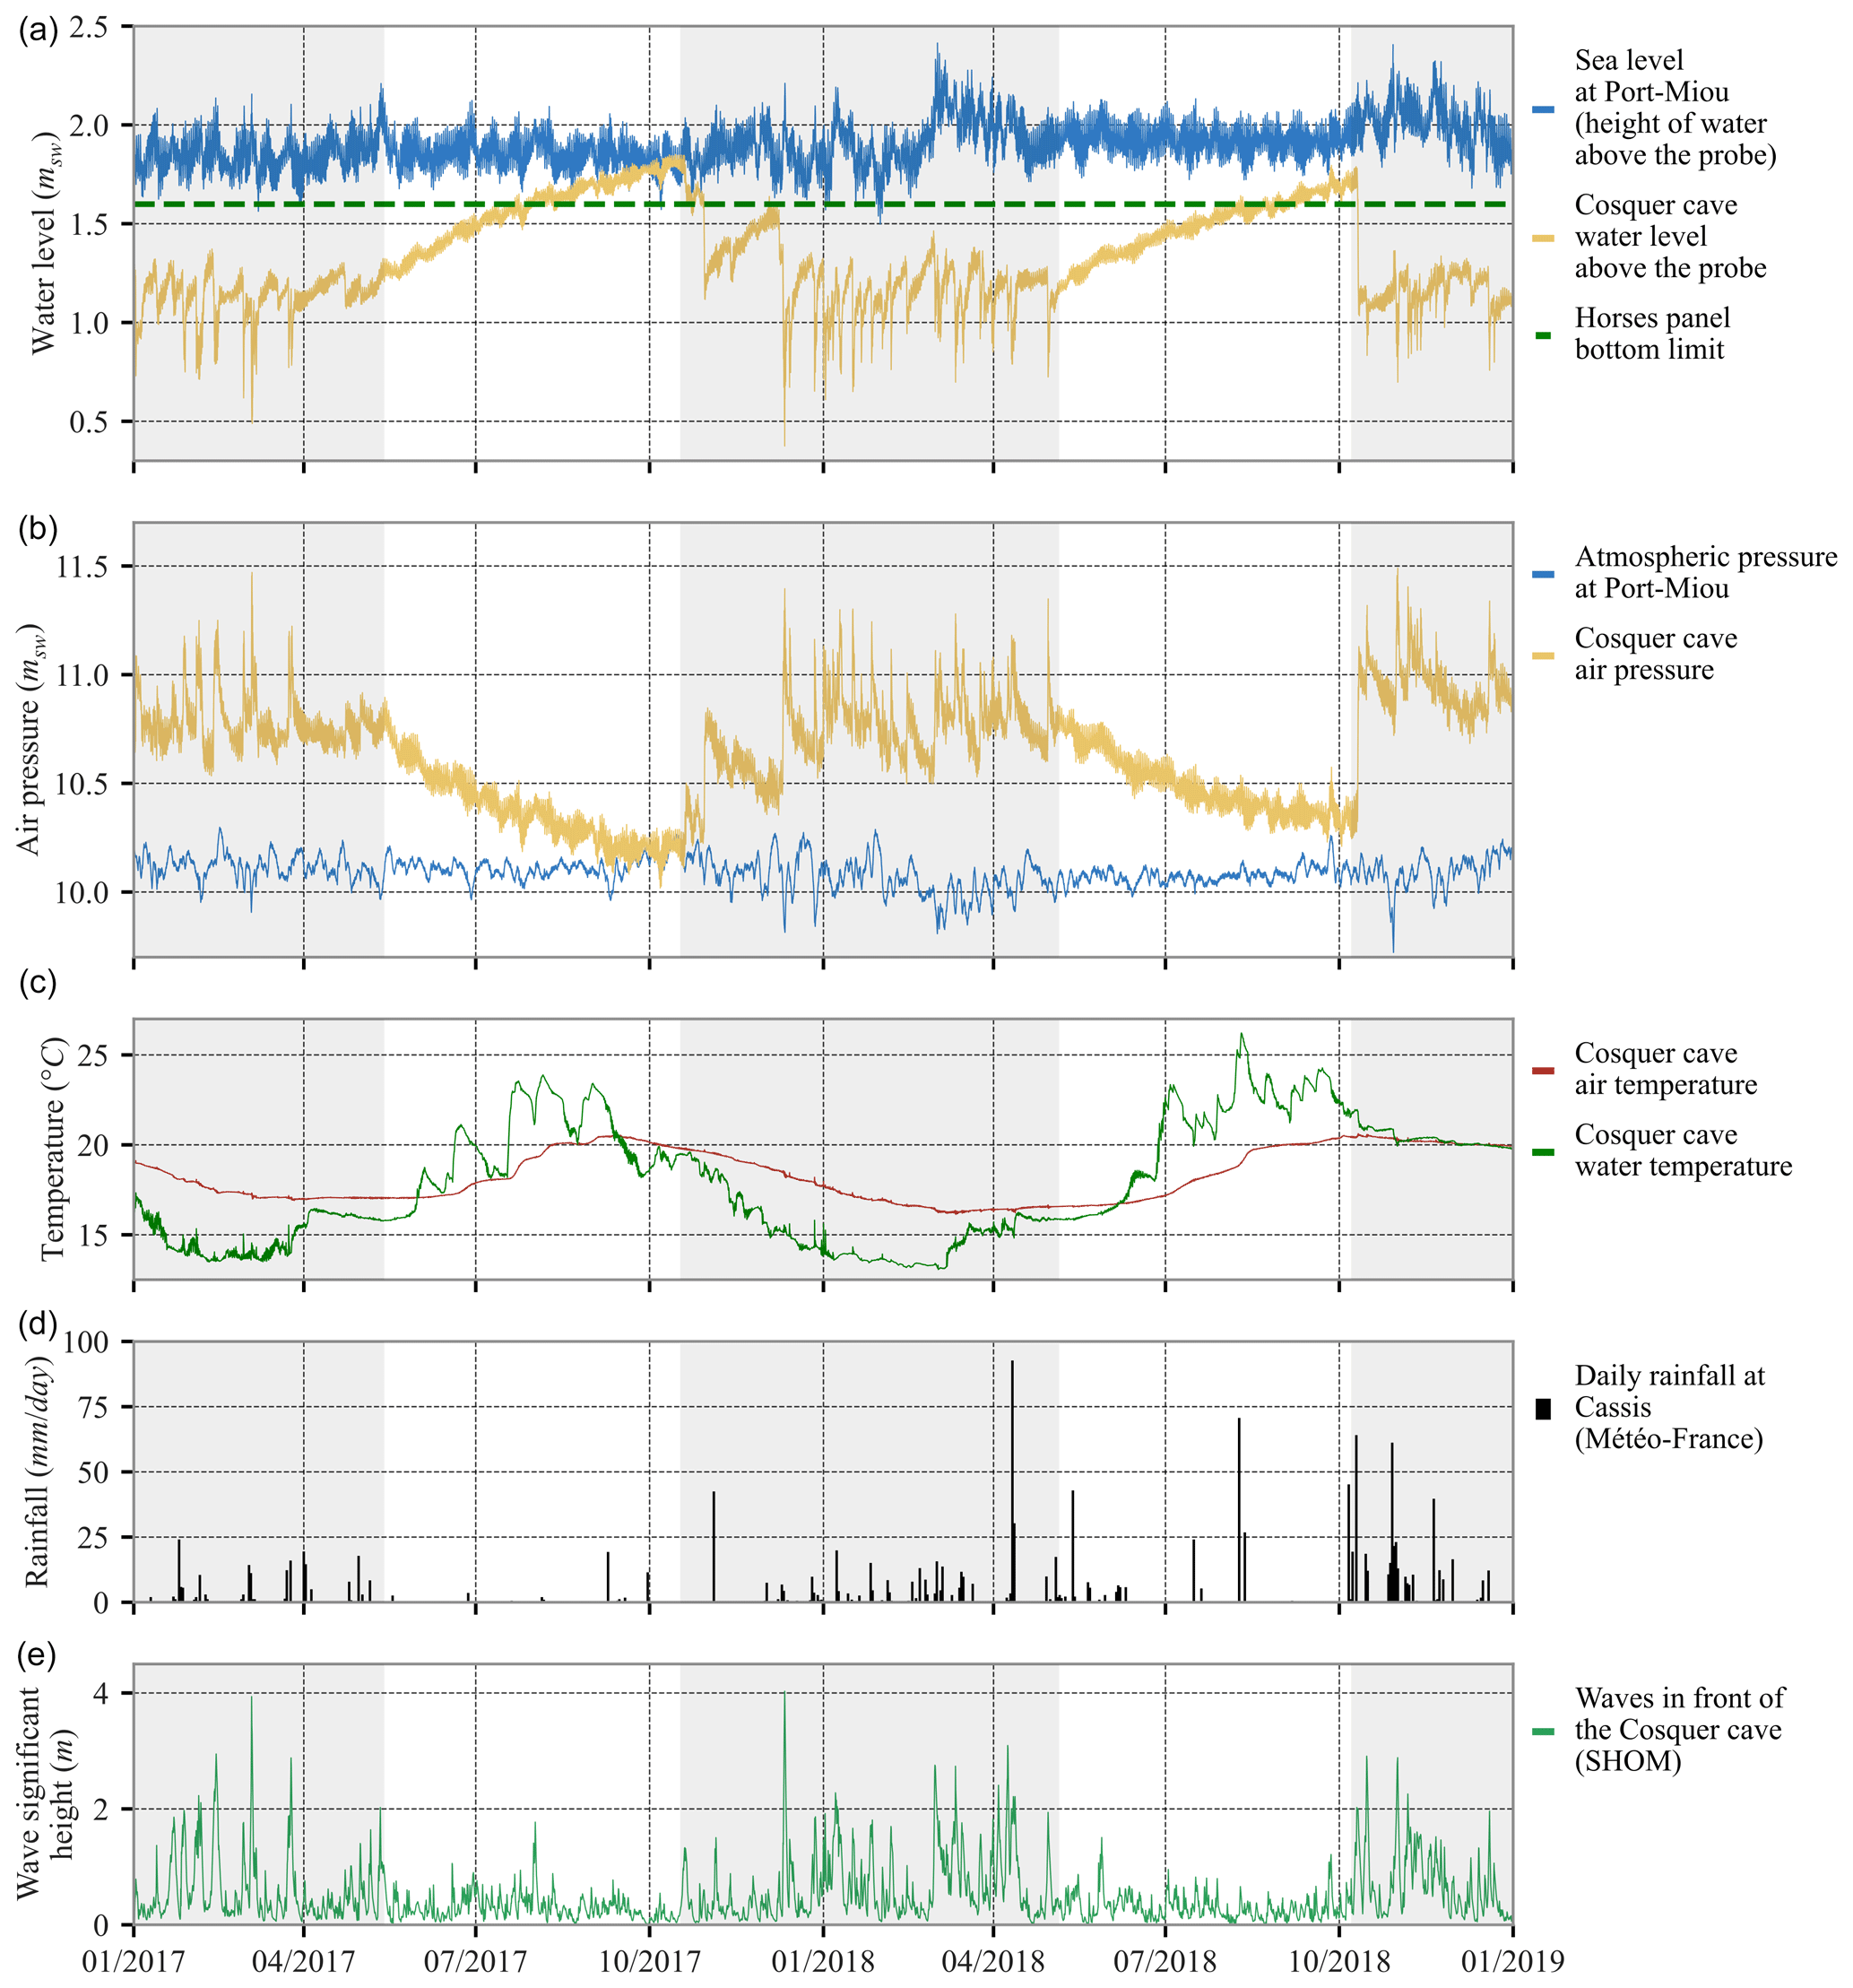
Figure 4Pressure, water level, and temperature time series recorded in Cosquer Cave and at the Port-Miou observation site for the years 2017 and 2018: (a) sea level at Port-Miou (hs) and water level at Cosquer Cave (hw), expressed in column of seawater (msw) above the probe with the same reference level. The green dashed line shows the bottom of the horse panel (Paleolithic decorated wall). (b) Atmospheric pressure (Patm) outside the cave and cave air pressure (Pa). (c) Cave air temperature (Ta) and cave water temperature in Room 1 (Tw). (d) Daily rainfall (Météo-France, 2023). (e) Significant wave height in front of Cosquer Cave (SHOM, 2024). Pressurization event periods are shaded in grey.
3.1 Overpressure in Cosquer Cave
Data show that air pressure in Cosquer Cave is nearly always higher than the outside atmospheric pressure (Fig. 4b). This very peculiar feature had already been shown by previous studies (Vouvé et al., 1996; Arfib et al., 2018) and has now been confirmed on the timescale of several years of continuous monitoring (2014–2020). The air pressure in the cave and the water level of the pools are negatively correlated (Fig. 4a and b). When the air pressure increases, the air is confined by the walls of the cave and pushes down the water table to balance the overpressure. Conversely, between late spring and early fall, there is a slow decrease in cave air pressure, and the water level simultaneously increases. Air slowly flows out of the cave. At the end of summer, cave air pressure is minimal and close to the atmospheric pressure outside the cave. The water level in the cave is then close to the seawater level.
A succession of pressure peaks occurs between October and May (highlighted in grey in Fig. 4), and these are generally absent in summer. These sharp rises in air pressure over tens of minutes to a few hours followed by a rapid pressure decay (over 1 d or so) are referred to in this paper as pressurization events, and the shape of these events will be described in more detail in the following section. Between 20 October 2017 and 30 April 2018, about 30 of these pressurization events occurred. They generate the cave overpressure through the inflow of outside air. They occur systematically during periods with high waves in front of the coastal limestone massif (Fig. 4e). While storms are often associated with rainfall, periods with high rainfall but no high waves occasionally occur (e.g., August 2018, Fig. 4d), and they do not cause pressure variations in the cave (Fig. 4b). Thus, some pressurization events are not associated with heavy rainfall, but they are systematically associated with waves (Fig. 4e). This is consistent with the observed rising water levels during the summer months, when there is no significant wave activity. The current hypothesis is that breaking waves and waves crashing against the cliff can generate bubbles and then force seawater and air to flow through the limestone massif via shallow fissures and karst conduits. Given the existence of karst pathways at several levels connecting the sea and the cave, air flows through shallow sumps and reaches the cave through upper conduits away from the decorated rooms and not through the lower conduit (human entrance), which is too deep to be the air intake point (−37 m).
3.2 Seasonal variations
As described previously, air overpressure in the cave decreases during summer. The summer depressurization rate was on average −0.21 cmsw d−1 in 2017 and −0.32 cmsw d−1 in 2018 (mean over July and August). Conversely, during pressurization events, the net air pressure usually increases in the cave; i.e., the air pressure is usually higher after the event than before. Two thresholds are graphically identified in Fig. 4b: (i) the maximum air pressure never exceeds 11.5 msw (1.16 hPa); and (ii) immediately after the pressurization peaks, the air pressure drops to an overpressure level between 10.8 msw (1.09 hPa) and 10.7 msw (1.08 hPa). Below this level, the pressure decrease rate slows down considerably. The lowest water level is about 1.5 msw below the seawater level (0.40 msw above the probe, Fig. 4a) during winter. Thus, on a seasonal timescale, the pressure variation range (Fig. 4a) is around 1.5 msw (0.15 hPa).
The air temperature varies in the range 16 to 21 °C, in a seasonal pattern. The maximum is observed at the end of summer and the minimum at the beginning of spring (Fig. 4c). The air temperature variations are mainly driven by the water temperature variations. Water temperature variations are related to exchange with seawater outside the cave through conduits. Air temperature variations are smoother than water temperature variations and are delayed because of heat exchange with the cave walls, which have thermal inertia.
3.3 Pressurization events
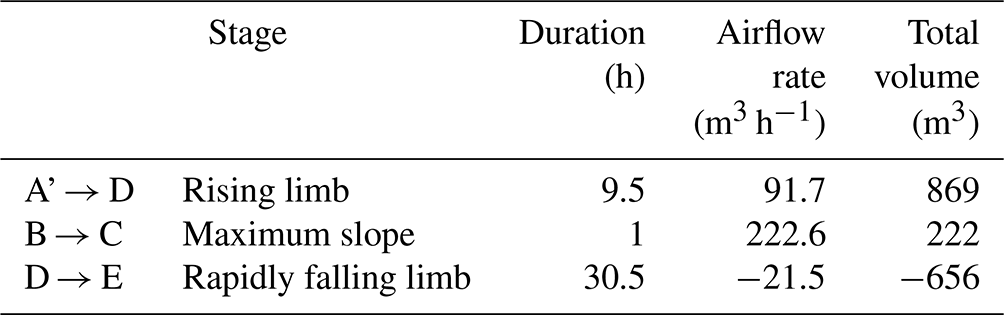
Pressurization events can be separated into different stages by analogy with the flood hydrograph (Chow et al., 2013). One example is detailed in this paper to illustrate the phenomenon. This example, lasting 38.3 h, occurred from 29 April to 1 May 2018. This is a representative pressurization event, with three main stages (Fig. 5) identified by the slope variations of the cave air pressure. The first stage is the pressurization corresponding to the rising limb of the curve (from A to D); it lasted 7.8 h and induced an increase of 73.7 cmsw in the air pressure in the cave (mean pressurization rate around 9.4 cmsw h−1). The maximum slope of the rising limb reached a maximum pressurization rate close to 15.8 cmsw h−1 (Fig. 5, from B to C). After the pressure peak at point D, the second stage ran until an inflection point in the recession curve; the pressure dropped rapidly by 57.4 cmsw from D to E (Fig. 5) at an average rate of −1.9 cmsw h−1, which is more than 100 times higher than the slow pressure decrease rate described in the previous section (summertime). The third stage started from point E, around 10.8 msw with a lower pressure decrease rate of −0.2 cmsw h−1, and was interrupted by the next pressurization event.
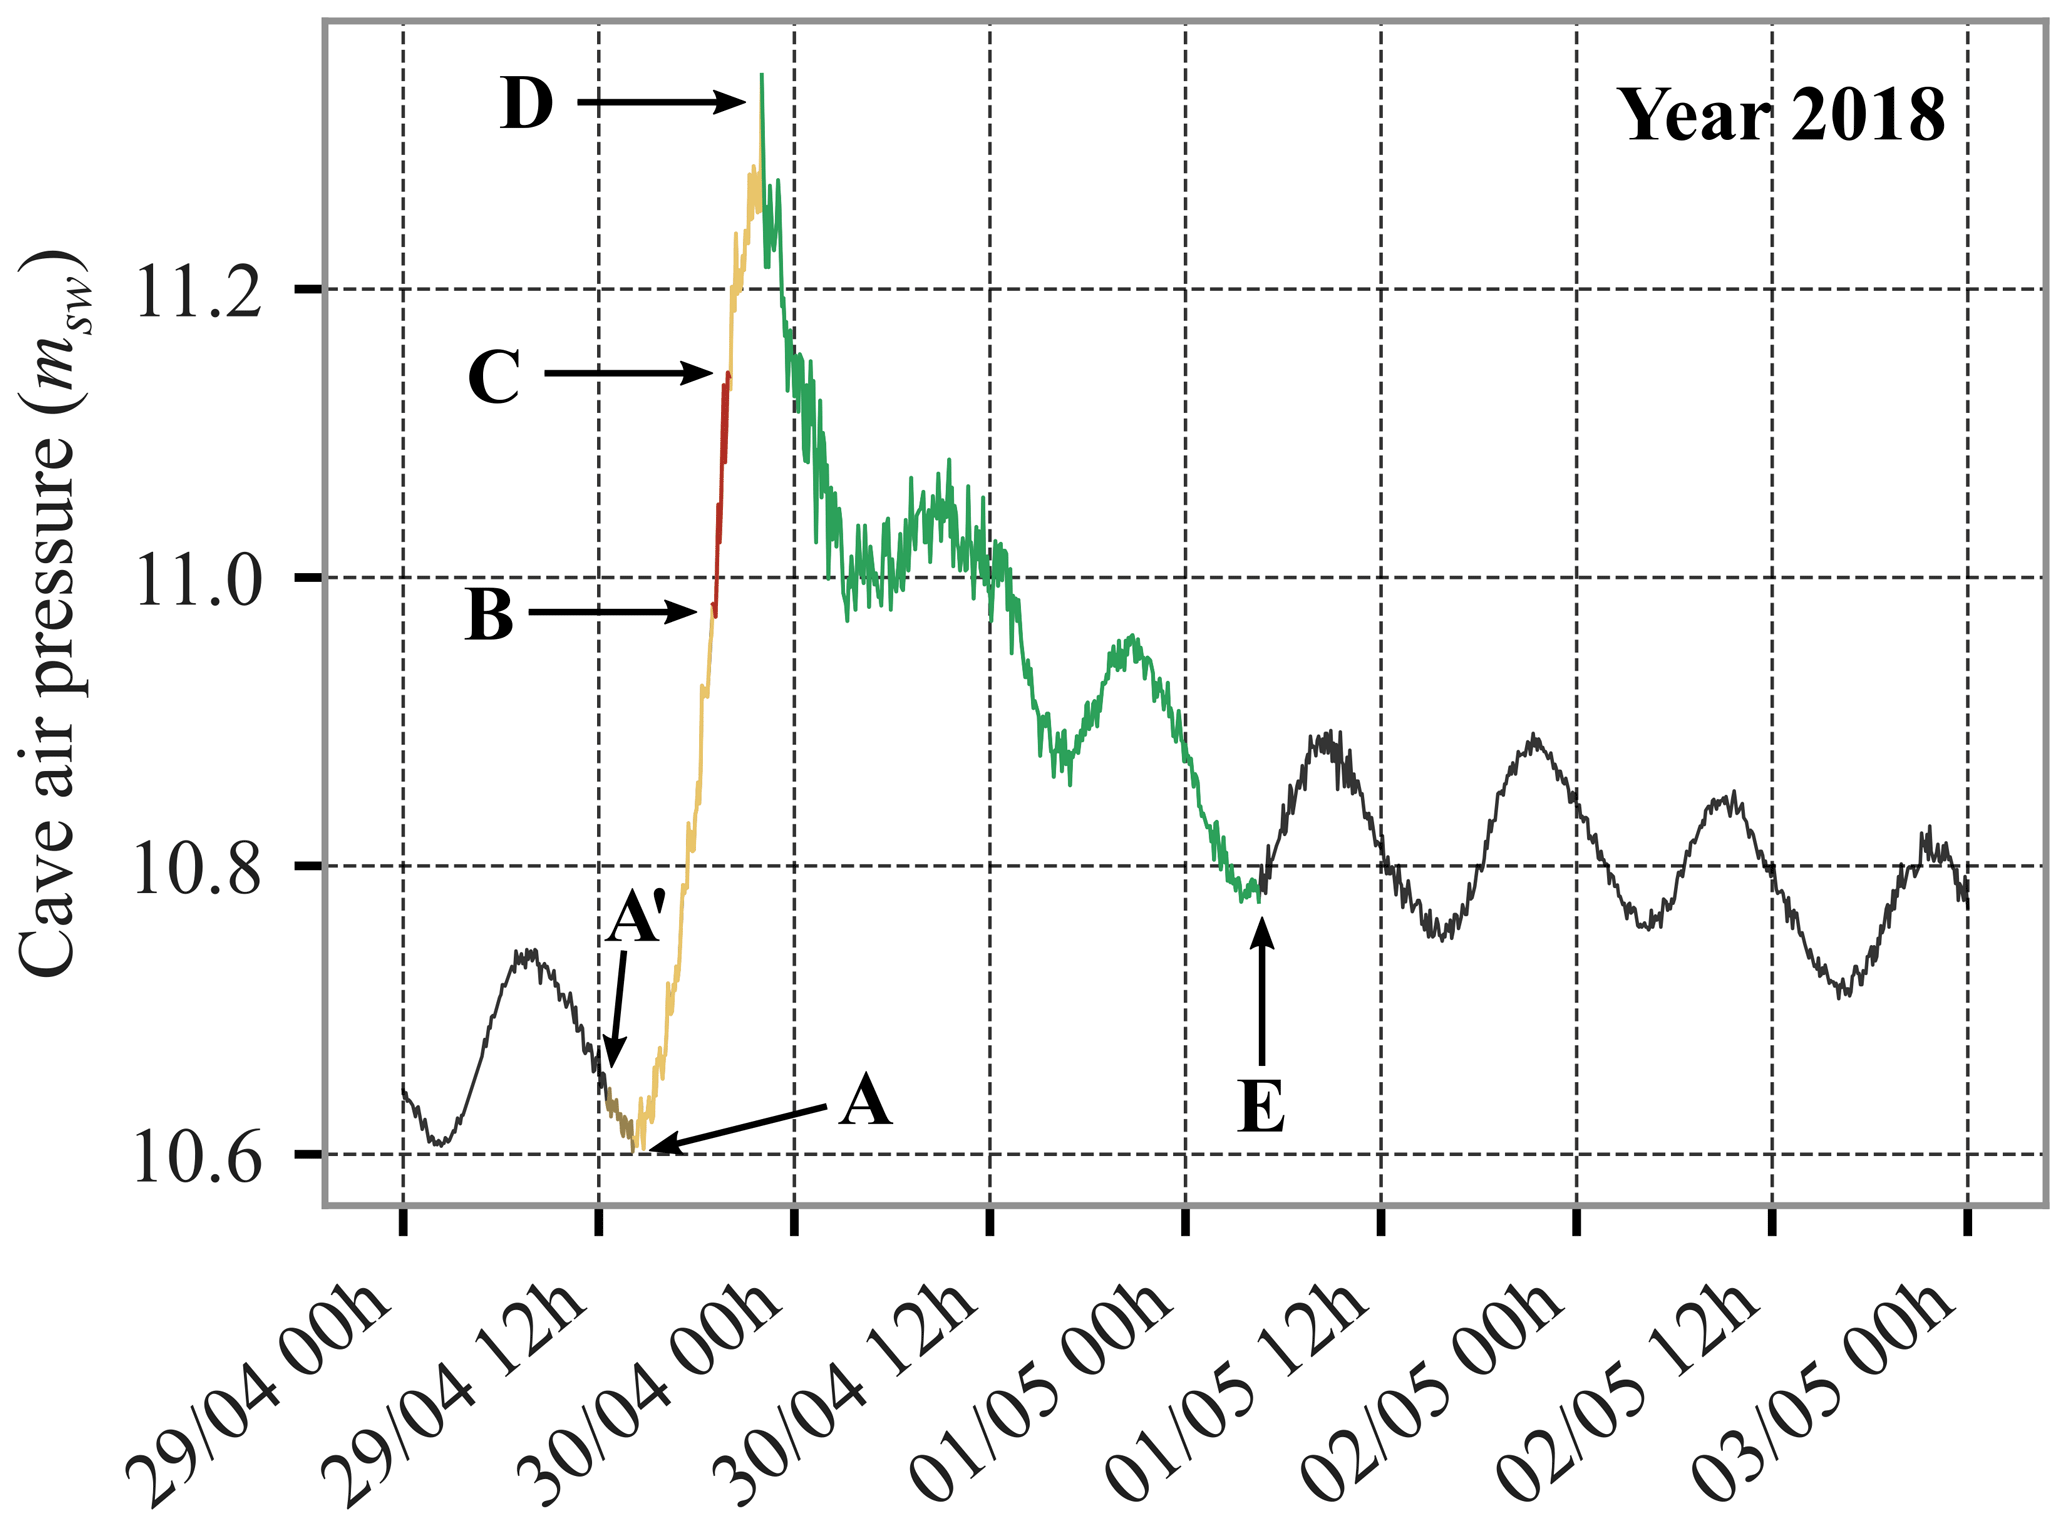
Figure 5Example of the pressurization event that occurred from 29 April to 1 May 2018: (A) start of the pressurization event based on cave air pressure variations; (B–C) maximum slope of the rising limb; (D) pressure peak, end of the pressurization stage and start of the rapid pressure decrease stage (or rapidly falling limb); (E) end of the rapid pressure decrease stage and start of the slow pressure decrease stage; and (A') start of the pressurization event based on cave air quantity computation.
3.4 Variations at the tidal scale
Tide-induced pressure variations are recorded in the cave. Figure 6 shows in situ pressures expressed in meters of seawater (msw) and mean-centered at a 2 d scale in order to focus on the relationships between sea level (hs, measured at Port-Miou), cave air pressure (Pa), cave absolute pressure in water (Pw), and cave water level (hw, computed from Pa and Pw). The different parameters are considered in summer when the cave air pressure is low and the cave water level is high (from 12 to 14 August 2017, Fig. 6a) and in winter when the cave air pressure is high and the cave water level is low (from 23 to 25 December 2017, Fig. 6b). The sea tide is transmitted through the submarine karst conduits or open fractures and bedding planes, so the absolute pressure in water inside Cosquer Cave equilibrates with the sea level variations, without any noticeable lag (the data time step is 5 min).
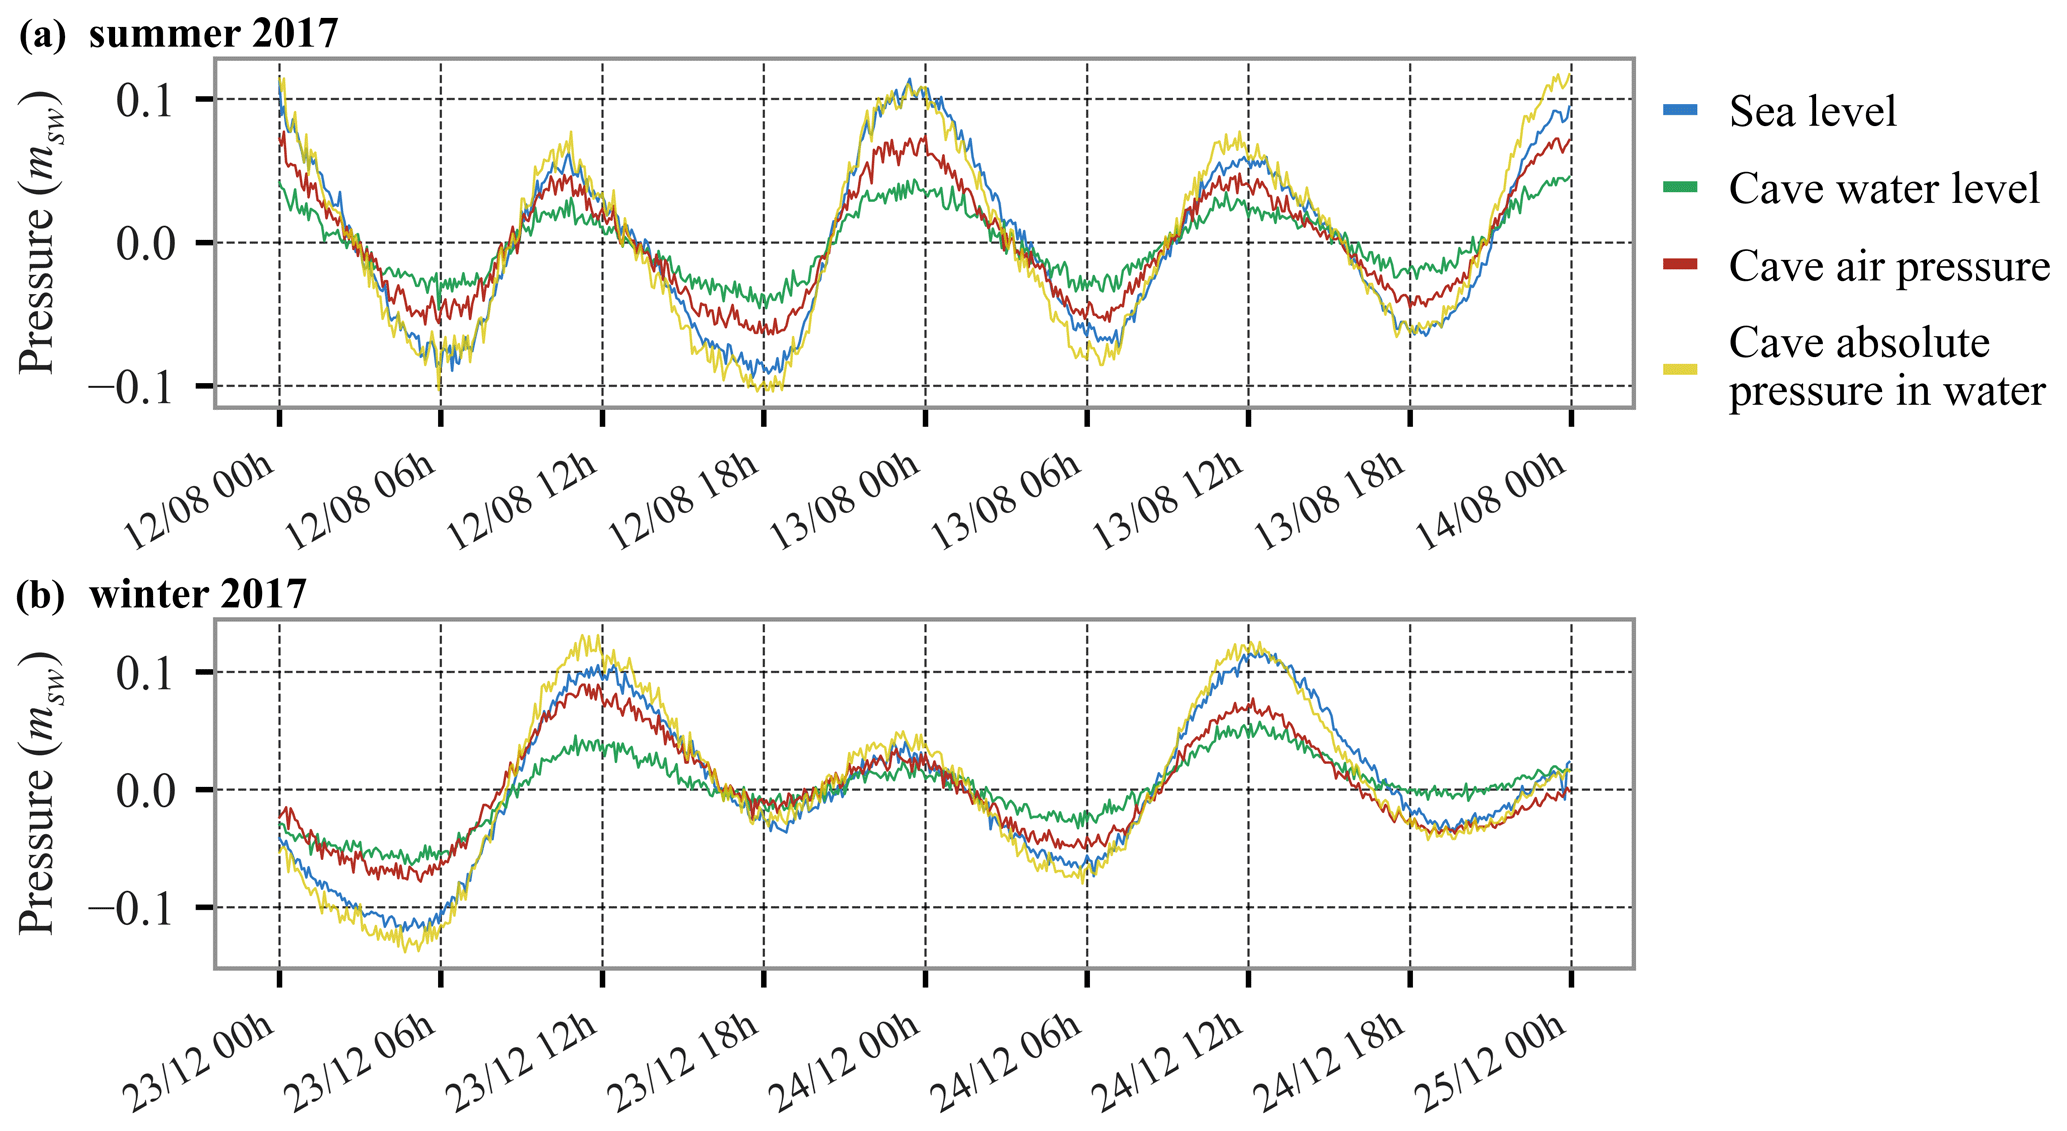
Figure 6Time series of the sea level (hs), the cave air pressure (Pa), the cave water level (hw), and the absolute pressure in water in the cave (Pw) centered by their mean values during (a) a summer period when Pa is low (12–14 August 2017) and (b) a winter period when Pa is high (23–25 December 2017).
The water level in the cave varies less than the tide outside because part of the pressure variation is transmitted to the confined air above the pools' surface. Focusing on the examples in Fig. 6, during summer the mean tide amplitude is 14.1 cmsw outside the cave and 5.6 cmsw inside it. During winter the mean tide amplitude is 12.5 cmsw outside the cave and 5.2 cmsw inside it. In both seasons, the tide amplitude in the cave is thus about 40 % of the sea tide, and variations in the cave air pressure account for the remaining 60 %. The magnitude of the damping of the tide depends on the volume of air trapped in the cave.
Tide-related temperature variations in the cave air are observed. These variations are small, less than 0.05 °C crest to crest (not shown in Figs. 4 or 6), and display a π/2 phase advance (3 h) with respect to tide pressure variations. The amplitude of these variations is much smaller (about 20 times) than the adiabatic temperature variation (Eq. 7) that would result from the tide air pressure changes. Moreover, simultaneous measurements obtained with two probes set 5 and 21 cm from the surface of the nearest wall (a stalagmite) recorded the same small temperature variations within <0.01 °C. These observations indicate that thermal convection is very active (at least in the decorated rooms of the cave) and that, at the tide timescale, the air in the cave and the walls remains close to thermal equilibrium.
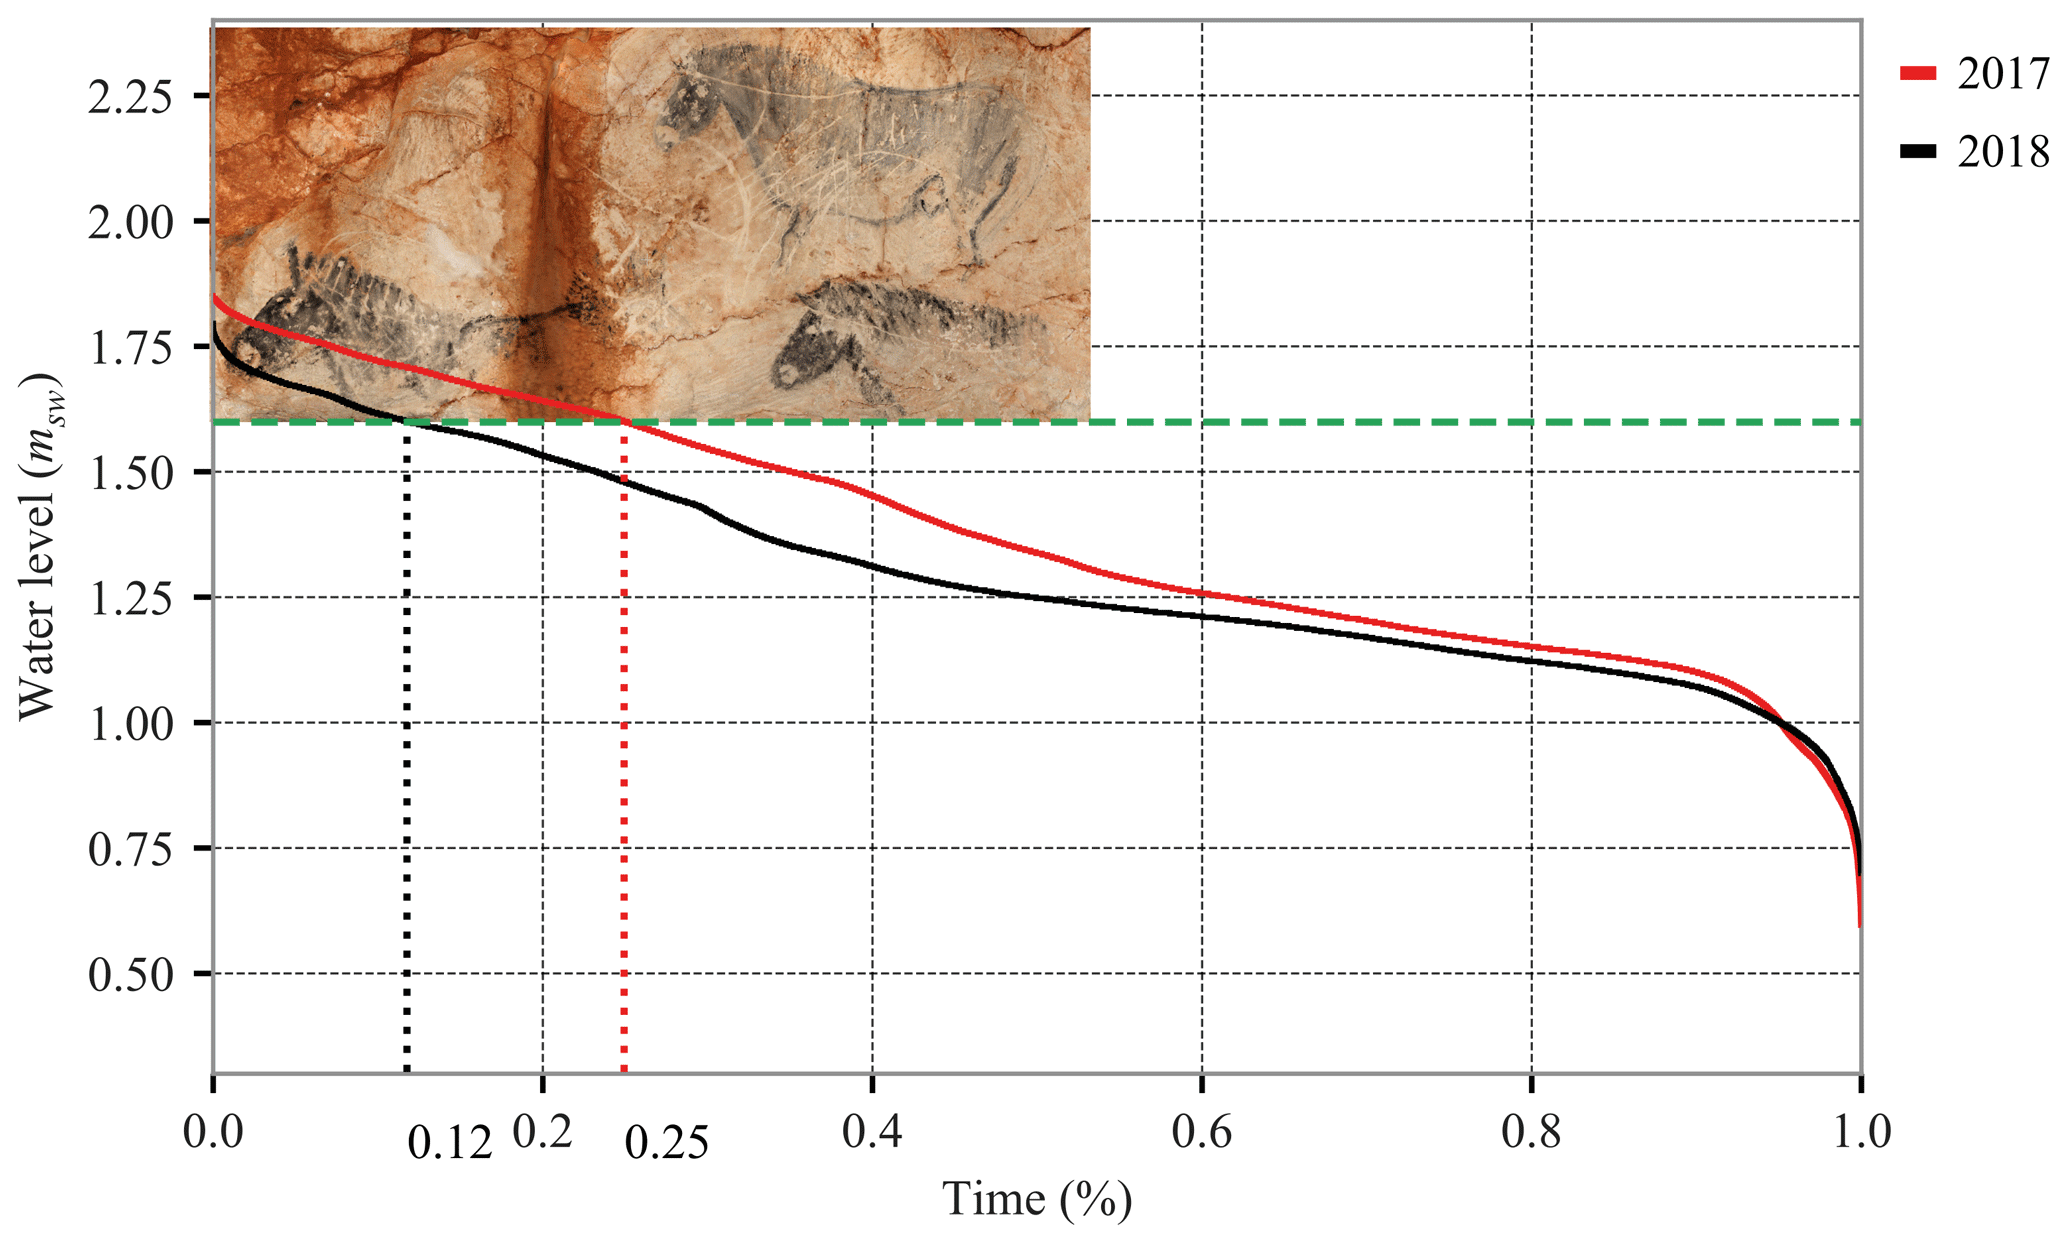
Figure 7Cumulative time (in percentage of the year) of the water level above the probe (msw) for the years 2017 (red) and 2018 (black). The green dashed line marks the bottom of the horse panel represented in the figure.
3.5 A threatened treasure: focus on the horse panel
We showed that the cave water level in Cosquer Cave is lower than the sea level. This behavior limits the submersion of art close to water, such as the horse panel (Fig. 2a). Figure 7 shows, for the years 2017 and 2018, the cumulative time (in percentage of the year) of the water level above the probe (msw). The highest level recorded in 2017 (water level close to 1.8 m above the probe in Fig. 7) was an exceptionally high water level in the cave, equivalent to the sea level for a few days. A scaled photo of the horse panel is added to the figure. It illustrates how high the water level can rise to flood the artwork. The green dashed line marks the bottom of the painting. Usually, the water level in coastal karsts is equal to the sea level; thus, in this theoretical case, the lower part of the horse panel would be continuously flooded. However, in the case of Cosquer Cave, air overpressure kept the horse panel totally out of the water 75 % of the time in 2017 and 88 % of the time in 2018 (Fig. 7). The horse panel is partially flooded from midsummer, when the cave water level slowly rises, to the first pressurization event at the end of summer or the beginning of fall (water level above the green dashed line in Fig. 4).
The horse panel was flooded during 92 d in 2017 and 64 d in 2018. During these periods, the panel underwent (1) washout due to the infiltration of water into the rock porosity and (2) mechanical erosion under the effect of alternating wet and dry periods caused by the tide. Currently, air overpressure and tide damping inside the cave reduce the duration of flooding. The horse panel is not the only art threatened by the water: the negative hands panel and archeological artifacts on the floor are also endangered. The behavior of the karst limits the water level rising to the paintings and engravings, which are still under threat. Global sea level rise is a direct threat to the integrity of the cave.
Recorded data show that air pressure variations in Cosquer Cave are related to the cave volume and the inflow and outflow of air into the confined cave. We sought to calculate the cave volume using the tide variations and the rock permeability using the slow air depressurization stage. This section details the methods and equations used.
4.1 Equations for air pressure and air quantity in the cave
Pressure variations in the air in Cosquer Cave are related to variations in air quantity in the cave, temperatures, and tide variations. Air is approximated as an ideal gas:
where Pa is cave air pressure and Ta is cave air temperature, n is the number of gas moles in the cave, V is the air-filled volume of the cave (defined as the volume of all the connected voids above the water level), and R is the ideal gas constant. Here Pa and Ta represent the average pressure and temperature in the volume of the cave. There is no requirement here with this formulation to assume that P and T are uniform, but the question arises as to whether the measurements do represent the average temperature. This point is dealt with in Sect. 4.2. Variations in n correspond to variations in gas content in the cave regardless of the processes considered. These include air inflows and outflows but potentially also exchanges with the liquid phase by diffusion of dissolved gases and water liquid–vapor phase change. The effect of water evaporation and condensation may be approximated considering that the air in the cave is generally close to the dew point. Using the Tetens equation (Monteith and Unsworth, 2013) to calculate water vapor pressure, a maximum range of vapor pressure variations of 18.2 to 24.9 hPa is obtained for a temperature varying from 16 to 21 °C, representing the range of seasonal variations (Fig. 4). This pressure variation corresponds to a 6.7 cm water level change. Conversely, the effect of the thermal expansion of dry air from 16 to 21 °C leads to a pressure increase of 17.3 hPa, with ideal gas approximation. At the tidal scale, cave air temperature variations do not exceed 0.05 °C, and thus changes in water vapor pressure may be neglected. The mean cave air pressure variation because of tides is about 9.5 cmsw (Fig. 6), whereas during slow depressurization (with a depressurization rate of −0.32 cmsw d−1) cave air pressure decreases by 0.08 cmsw between the two tides (∼6 h), i.e., 1.4 % of the mean tide range. This variation is therefore neglected.
The total volume of the cave and the number of moles are both unknown. Nevertheless, the variation of the air-filled volume of the cave due to tidal variations may be estimated from the variations of water height in the cave, which are measured. Knowing the Pa and Ta variations, it is thus possible to estimate n, assuming it remains constant during a tidal cycle, and hence the total volume of the cave. On the longer timescale, once this volume is known, the variation of n during the slow depressurization may be calculated from the long-term variations of Pa and Ta.
4.2 Volume calculation
The variation of the cave volumes (filled with air) between high and low tide can be expressed as
where Vh and Vl are, respectively, the cave volumes at high and low tide. hwh and hwl are the cave water levels at high and low tide. Sw(h) (m2) is the total surface of water bodies (pools) connected to the sea and thus affected by tides. The surface of the pools for a middle-stand water level was calculated using QGIS tools from a georeferenced map of the cave and was found to be 847 m2. For a first-order approximation, the variations in the pool surface between high and low tide may be neglected because the roof and shore in Room 1, which has the largest pool area, are almost parallel (both follow the dip of sedimentary layers), and the walls of the Grand Puits are subvertical. Sw(h) is thus taken to be constant:
and
Also, n is assumed to be constant on the timescale of a tide. The validity of this assumption was assessed in Sect. 4.1. The perfect gas law is applied at high and low tide:
Combining Eqs. (3) and (4), the volume of the cave at low tide Vl is
Except during the transient pressurization events, air pressure within the connected rooms of the cave is at equilibrium. However, air temperature may not be uniform as it depends on thermal convection for homogenization. To bound volumetric estimations, we will also consider two end-member cases corresponding to isothermal and adiabatic assumptions.
In the isothermal case, Eq. (5) simplifies as
In the case of an adiabatic process, there is no heat transfer between the air and the cave walls or water pools, and the temperature variation of an ideal gas is related to the pressure variation by
The adiabatic coefficient for air at 20 °C is γ=1.4 (Lange and Forker, 1967). Combining Eqs. (3) and (7) yields
As air pressure at low tide is lower than at high tide, the ratio is less than 1 and the volume estimated with the adiabatic assumption is larger than for the isothermal one.
4.3 Airflow rate
Once the volume of the cave has been estimated from the tidal variations, the quantity of air in the cave is computed over time as
where V0 is a reference volume of the cave for a reference water level above the probe h0. The net volumetric flow rate Q (m3 s−1) into Cosquer Cave (inflow positive) is calculated as
where vm is the air molar volume (m3 mol−1), is the molar flow rate (mol s−1), and R=8.314 J K−1 mol−1 is the ideal gas constant. The net volumetric flow rate can be expressed for standard pressure Pa and temperature K.
4.4 Rock mass permeability
The seasonal slow depressurization of the confined Cosquer Cave during spring and summer implies air outflows through the host rock. The effect of gas compressibility on flow is taken into account, approximating air as a perfect gas. Assuming that airflow follows Darcy's law, and neglecting the hydrostatic gradient in the atmosphere (about 11 Pa m−1), the molar flux may then be written as (e.g., Massmann, 1989; Lang, 1999; Charbeneau, 2006)
where qn is the molar flux (mol m−2 s−1), μ is the dynamic viscosity of air (Pa s), ka is the medium effective permeability to air (m2), T is the gas temperature (K), and P is the air pressure (Pa). According to the kinetic theory of gases, the viscosity of a perfect gas is a function of temperature only and does not depend on pressure (Chapman and Cowling, 1990).
Airflows through a porous medium follow Darcy's law if the pores have a sufficiently low water saturation to host a continuous gas phase. The generalization of Darcy's law for airflow in an unsaturated porous medium uses the effective permeability to air (ka):
kra is the relative permeability to air (–), describing the influence of air and water content on permeability. It ranges between 0 (at the percolation threshold) and 1 (dry state). kw is the intrinsic permeability of the host rock (m2), which is independent of the fluid properties and saturation. Our data can constrain ka but not kra. The maximum value of the effective permeability to air from our calculations is thus a lower bound for the intrinsic permeability.
Now, considering a steady-state, or slowly varying, flow between a cave at pressure Pa and the surface at atmospheric pressure Patm, other parameters being held constant (T, μ), it follows from Eq. (11) that the total molar flux depends linearly on the difference of the squared pressure between the boundary conditions (Charbeneau, 2006). Hence, the effective air transmissivity λa between the cave and the ground surface may be defined as
The variations of temperature in the host rock are unknown but are much lower in amplitude than the temperature variations in the cave and at the ground surface (Bourges et al., 2006a). T is thus taken as a constant equal to the yearly mean air temperature in the cave of about 18 °C. In this case Pa s. The interpretation of the air effective transmissivity coefficient λa (m3) can vary based on the geometrical configuration. Three geometries are considered: a porous rock volume (Fig. 8a), a single fracture (Fig. 8b), and a pipe (Fig. 8c).
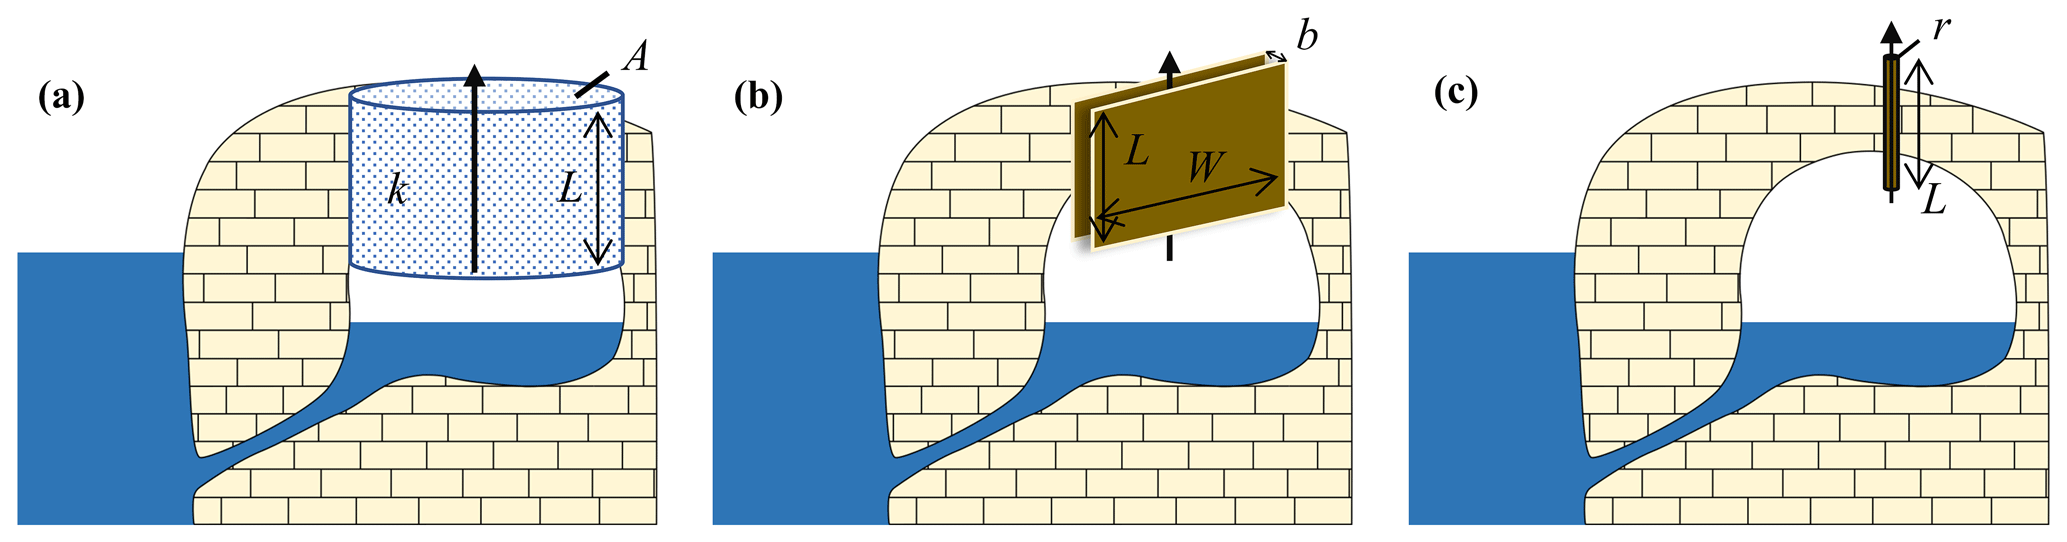
Figure 8Schematic cross sections to illustrate the three theoretical models tested for flow: (a) porous rock volume of cross-sectional area A and length L; (b) fracture of length L, width W, and hydraulic aperture b; and (c) pipe of length L and radius r.
If a pressure gradient is applied over length L (m) to a cross-sectional area A (m2), the air effective permeability (m2) may be defined as
In the case of Cosquer Cave, L and A reflect the dimensions of the boundary conditions and are illustrated in Fig. 8a. One possibility is to consider the air effective permeability of the rock volume between the main cave and the ground surface, i.e., A=2000 m2 and L=40 m. However, it is possible that most of the flow occurs through the upper part of the cave, closer to the ground and likely less water-saturated, i.e., the top part of the Grand Puits (high shaft), which is about 100 m2 and 10 m below the surface according to available 3D models of the cave. The geometric factor may thus be considered to range from 10 to 50 m.
If a leakage occurring through a fracture of length L and width W as shown in Fig. 8b is considered, the hydraulic aperture of the fracture is (Zimmerman and Bodvarsson, 1996)
If a population of N fractures is considered, b3 represents the sum of the cubed apertures of individual fractures. It follows that the larger fractures generally dominate the flow. For instance, if eight identical fractures of hydraulic opening b are present, they are equivalent to a single fracture of opening 2b. In most cases, Eq. (15) yields a correct order of magnitude for the hydraulic opening of the largest active fractures. For pipe conduits of length L (Fig. 8c), the air effective transmissivity is a function of the fourth power of the radius, and, similarly, the larger conduit will dominate the flow. According to Poiseuille's law, the hydraulic radius r of a pipe conduit may be defined as
5.1 Cosquer Cave volume
Volume calculations were done over July and August for the years 2015 to 2020, using pressure and temperature variations between successive tidal extrema. These 2 months were chosen during the summer season, when the cave water level is mainly driven by the tide, without significant pressurization events. This yields four volume calculations per day and 240 values for the 2 months.
Figure 9a shows all the values calculated for the years 2017 and 2018, taking into account the measured air temperature variation during the tide (referred to as the temperature-corrected volume, Eq. 5) with measurement uncertainties. The volume of the cave and its uncertainty were computed using the weighted mean (Eq. B5) and weighted mean standard deviation (Eq. B6) over the July–August period. This method gives more weight to values with smaller uncertainties. Using data recorded in summer 2017, the mean cave volume is 4973±83 m3, for a mean cave water level of msw (the water level reference is the absolute location of the sensor as shown in Fig. 3a). Using data recorded in summer 2018, the mean volume is 4967±78 m3 for a mean cave water level observed at msw, which would be equivalent to 4915 m3 for the reference level hw=1.60 m. Using this latter value, the calculated air-filled volume of the cave was the same in 2017 and 2018, within the range of uncertainties, as expected. This shows that, using data of the 2 summer months, volume can be calculated using the method proposed.
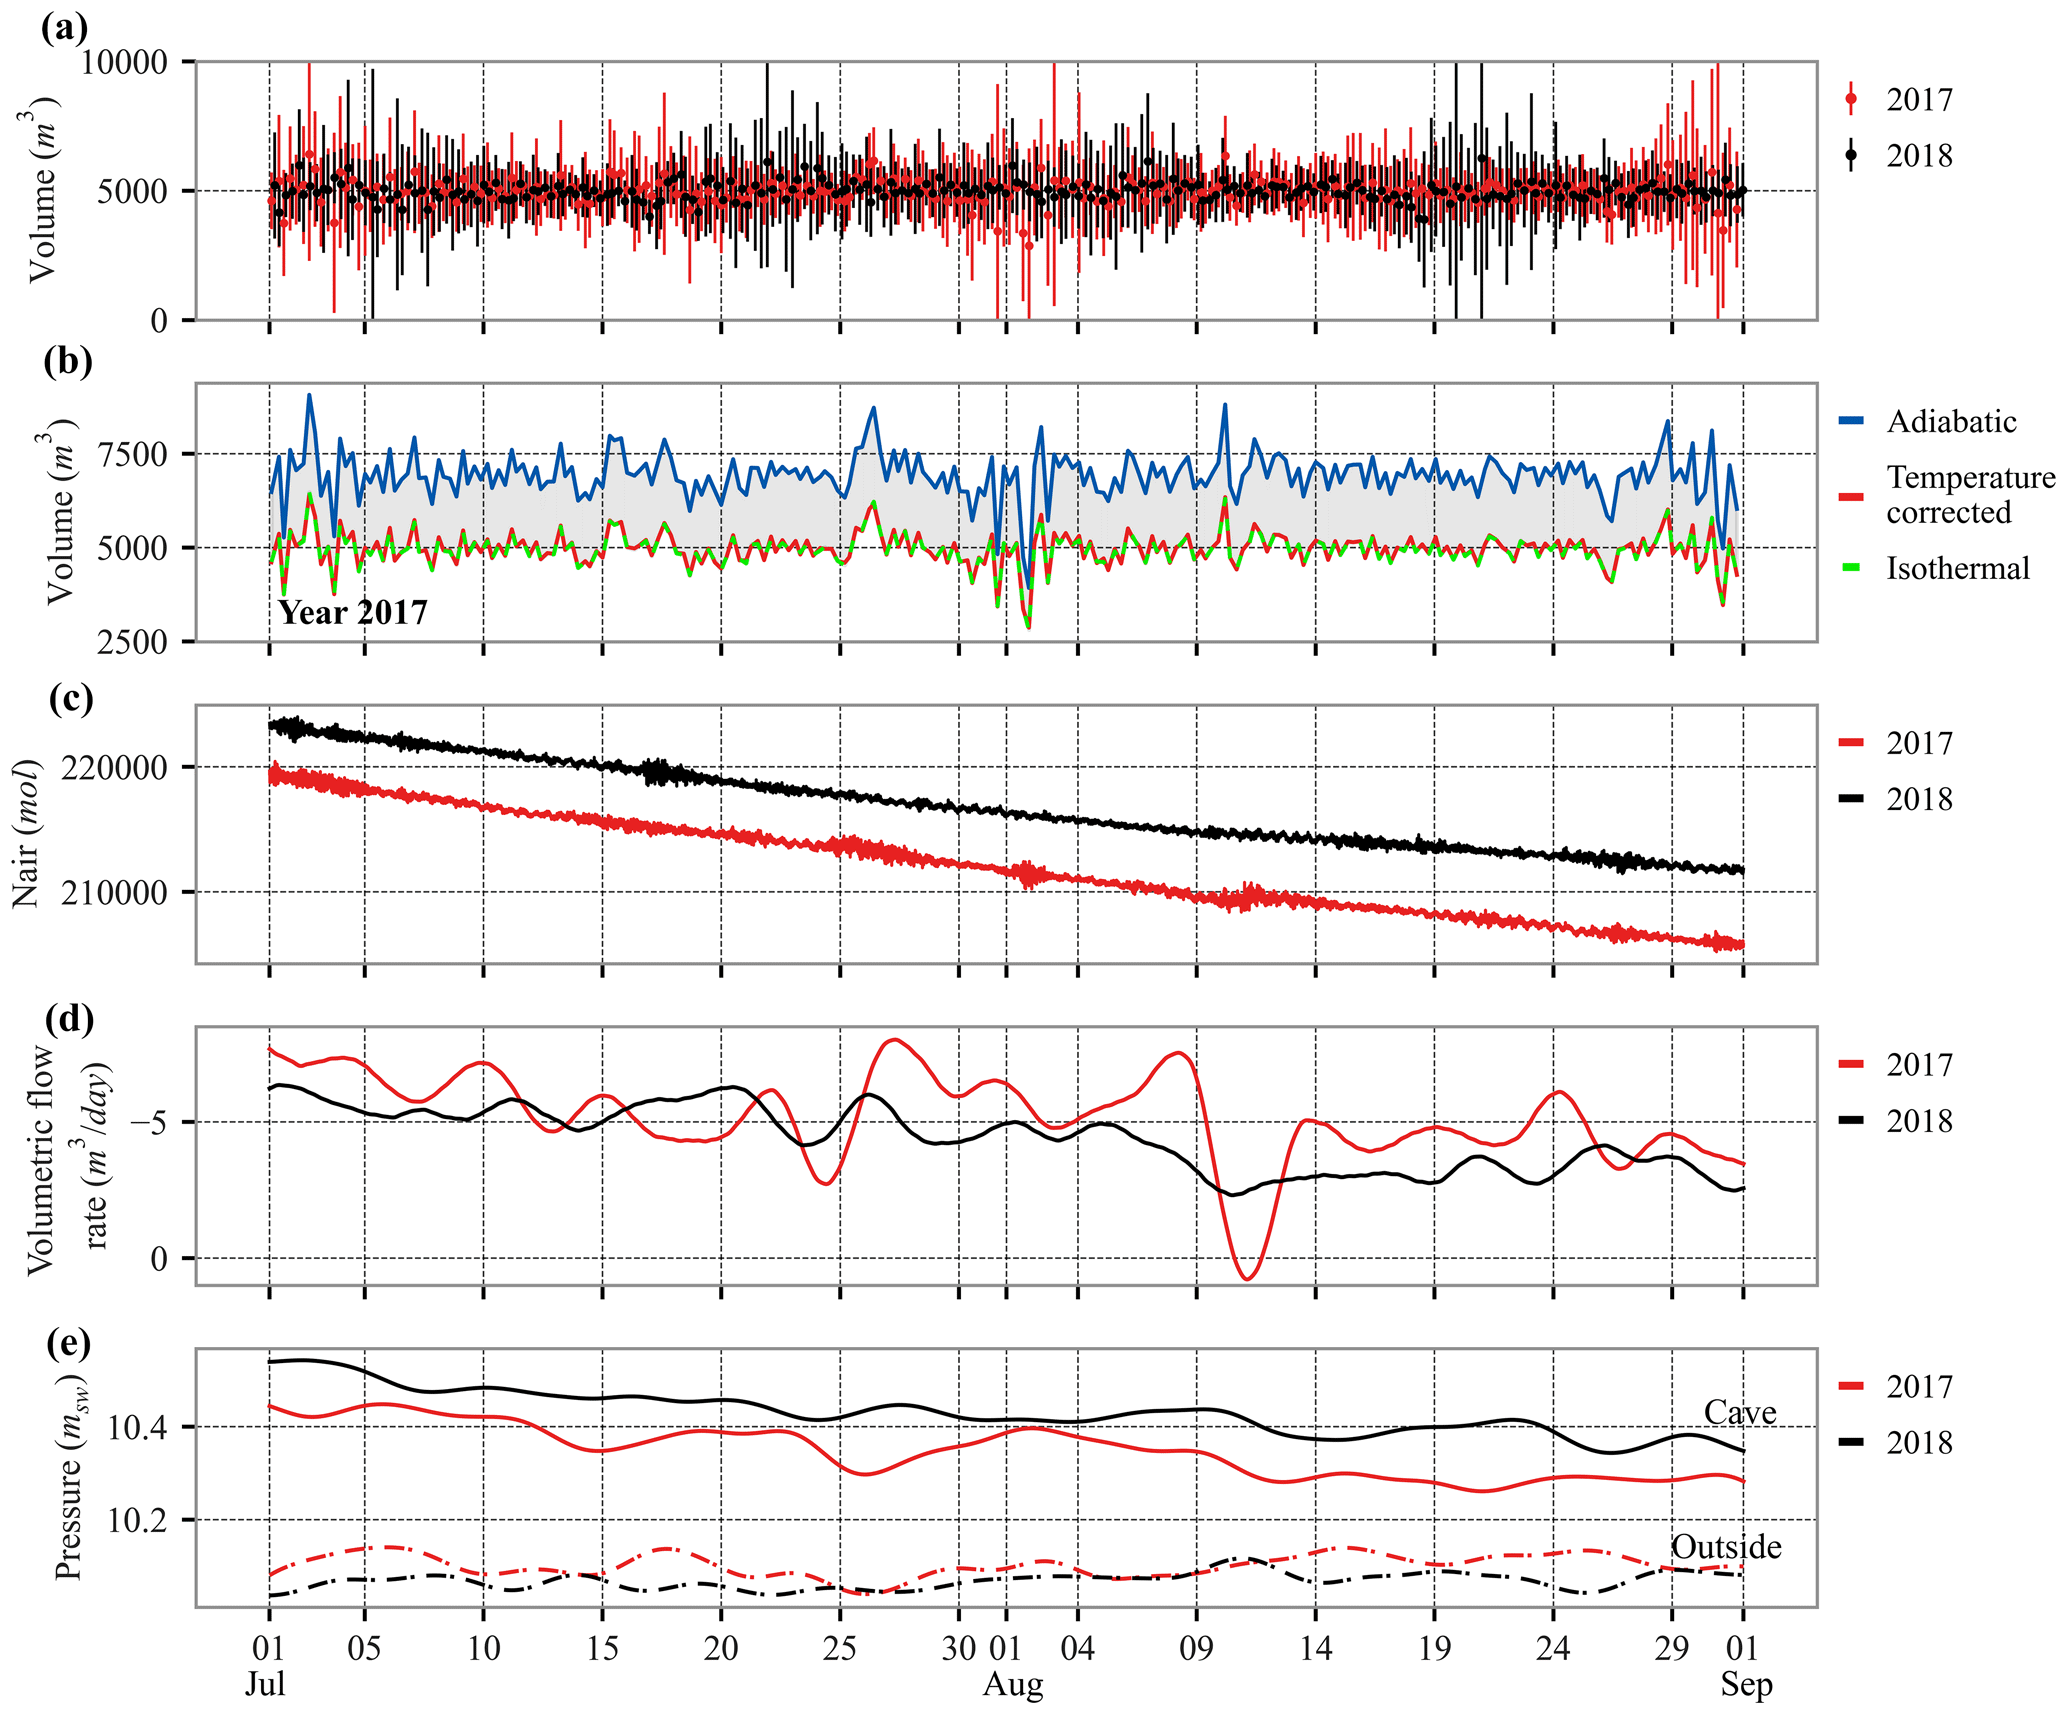
Figure 9Calculated and recorded time series from 1 July to 31 August for the years 2017 and 2018. (a) Results of the cave volume computation using air temperature variations, with uncertainties. (b) Results of the cave volume computation (only the year 2017) for the three assumptions: adiabatic, isothermal, and temperature-corrected (using air temperature variations). (c) Results of cave air quantity. (d) Results of the volumetric flow rate (negative value for outflow) filtered with a 5 d Hann window. (e) Recorded data of cave air pressure and atmospheric pressure (outside the cave) filtered with a 5 d Hann window.
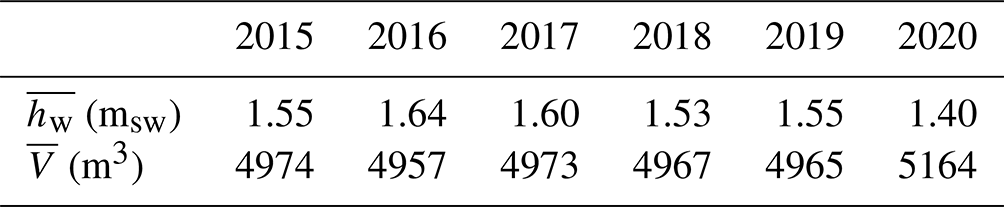
Table 2 summarizes the mean cave water level measurement and volume calculated over the 2 summer months for the years 2015 to 2020. The mean summer cave volume over the 6 years was 5000 m3 for an average water level of 1.54 cmsw. This mean volume was maximal in 2020 when the mean water level was minimal, and it was minimal in 2016 when the mean water level was maximal. Using the complete dataset available from the years 2015 to 2020, the 6-year average water level was 1.33 msw and yielded an average air-filled volume of the cave of 5184 m3.
Table 2Mean cave water level and volume over July and August for the years 2015 to 2020.
In order to show the impact of the heat exchanges between the air and the cave walls or water pools on the cave volume calculation, we performed calculations for three assumptions on year 2017 data, plotted in Fig. 9b. Case I is the temperature-corrected curve (red line in Fig. 9b) using air temperature variation during the tide (Eq. 5); this is the curve connecting the data point given in Fig. 9a. Case II (green dashed line in Fig. 9b) is the volume calculation with an isothermal assumption (Eq. 6), and case III (blue line in Fig. 9b) is the volume calculation with an adiabatic assumption (Eq. 8). Comparison of cases I, II, and III over July and August 2017 shows that the three cases give similar relative variations but different means. Temperature (I) and isothermal (II) plots are almost superimposed, suggesting that the isothermal assumption is a much better approximation than the adiabatic one. The small tide-related temperature variations in the cave (<0.05 °C) show a quasi-isothermal process, which leads to a mean relative difference of less than 1 % with isothermal computation. The mean volume for the adiabatic case is 6993 m3. There is a factor of 1.4 between case III and case II because of the adiabatic index γ (Eq. 8). This gives the possible maximum cave volume in the case where the available temperature record is not representative of average air temperature variations in the cave during the tidal cycle.
5.2 Cave airflow rates
5.2.1 Outflow during slow pressure decrease
The cave volume previously calculated makes it possible to evaluate at any time the cave air quantity (Eq. 9) and therefore the airflow rates (Eq. 10) for standard pressure and temperature conditions (P0=101 325 Pa, T0=288.15 K). The air quantity given in Fig. 9c shows a slow decrease over the 2 months correlated with the slow air pressure decrease (Fig. 4). The quantity of air was lower in 2017 than in 2018 because the air pressure was lower in summer 2017 in the cave. Table 3 summarizes mean airflow rates over July and August for the years 2015 to 2020. Values are negative when air flows out of the karst. The mean summer flow rate over the 6 years was −5.9 m3 d−1 (−0.24 m3 h−1), ranging from a minimum of −4.5 m3 d−1 (in 2018) to a maximum of −7.7 m3 d−1 (in 2020). The years 2017 and 2018 are detailed in Fig. 9d, filtered with a 5 d Hann window. Airflow rates changed from −1.2 to −8.4 m3 d−1 in 2017. These extreme values appear mainly when the air quantity curve (Fig. 9c) shows a noisy shape corresponding to periods with higher sea level variations (waves outside the karst). In 2018, airflow rates varied less, corresponding to a smoother decrease in air quantity over the summer.
Table 3Mean cave airflow rates over July and August for the years 2015 to 2020 (airflows out of the cave for negative values).
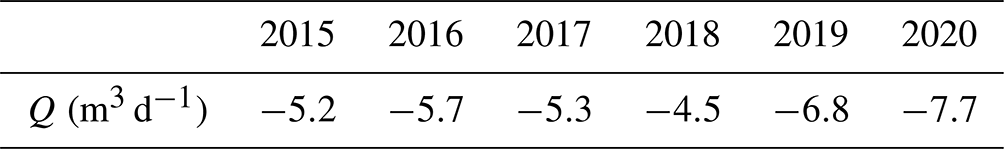
Nevertheless, in 2017 and 2018, the airflow rates tended to decrease (from the highest negative value to the lowest negative value) over the summer as the air overpressure inside the cave decreased (Fig. 9e), and therefore the pressure difference between the cave and the outside atmosphere decreased.
5.2.2 Inflow and outflow during pressurization events
The method to calculate the airflow rate, based on cave air quantity variation, can also be applied to net airflows during pressurization events, which occur during wintertime (Fig. 4). The pressurization event presented in Fig. 5 (from 29 April to 1 May 2018) has been separated into several stages using pressure variations. To enhance precision, the onset of the pressurization event was identified by analyzing changes in air quantity, thus avoiding tidal variations passing points A to A' (Fig. 5). For this event, considered a typical example, the rising limb, from the beginning of the increase in the air quantity to the peak, lasted 9.5 h for a total inflow of 869 m3 (from A' to D). Then, the rapidly falling limb, from the peak to the first inflection point, lasted 30.5 h for a total outflow of 656 m3 (from D to E). The maximum pressure increase during the injection stage was related to a maximum inflow rate of 222 m3 h−1 (from B to C). All the results are summarized in Table 4. During this pressurization event, 26 % of the total air volume was injected in about 10 % of the total pressurization stage duration (from A' to D). The mean outflow rate during the rapid pressure drop (from D to E) was 82 times higher than the mean airflow rate during the slow pressure decrease in the summer season (July and August, mean from 2015 to 2020); 75 % of the air injected during the pressurization stage (from A' to D) leaked out of the cave in the following 30.5 h (from D to E).
Table 4Airflow rates during the pressurization event from 29 April to 1 May 2018.
This method was applied to quantify the total net volume of air flowing in and out of the cave during all the pressurization events spanning from 2015 to 2020. The cumulative annual net air inflow ranged from 10 240 m3 (2015) to 22 460 m3 (2020), with an annual average of 17 590 m3. Similarly, the cumulative net annual air outflow during rapid pressure decays varied from 7720 m3 (2015) to 18 260 m3 (2020), with an annual average of 13 270 m3. The budget gives a remaining outflowing air volume (6-year average, 4320 m3) corresponding to the cumulative net annual air outflow during slow depressurization periods. These results of net air volume flowing in and out of the cave will be used to discuss the air renewal in Sect. 6.2.
5.3 Permeability of the limestone massif
During the periods of slow pressure decrease in July and August, the air effective transmissivity coefficient was calculated according to Eq. (13). It was then converted to effective permeability, effective hydraulic aperture, and effective radius, corresponding to the different ideal flow geometries as defined in Sect. 4.4.
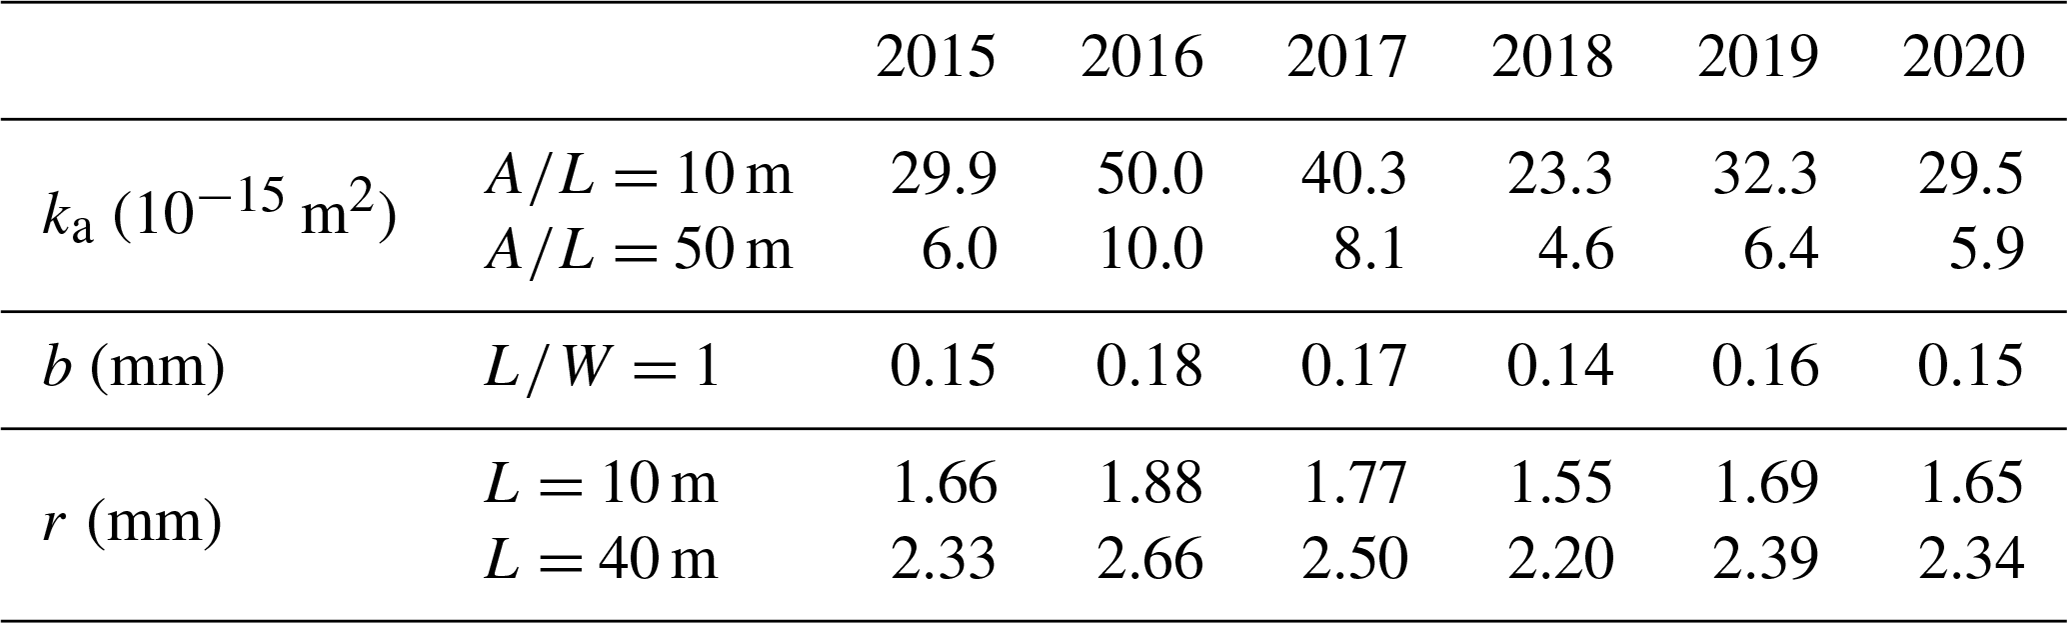
Table 5Averaged results over July and August for the years 2015 to 2020 of the air effective permeability ka considering two different geometries, the equivalent permeability of a fracture with a hydraulic aperture b, and the equivalent permeability of a pipe of radius r considering two different pipe lengths.
-
It is firstly assumed that air flows out through a porous rock volume of cross-sectional area A and length L to compute its air effective permeability ka (Eq. 14, Fig. 8a). We consider two end-member cases consistent with the Cosquer Cave geometry: (i) flow through the rock volume above the Grand Puits, i.e., A=100 m2 and L=10 m ( m); and (ii) flow through the whole rock volume above the main cave, i.e., A=2000 m2 and L=40 m ( m). All the averaged results between 1 July and 31 August for the years 2015 to 2020 for the different models are summarized in Table 5, varying from to m2.
-
It is assumed that air leakage occurs through a fracture of length L and width W to determine its hydraulic aperture b (Eq. 15, Fig. 8b). The ratio was set to 1. Results varied between 0.14 and 0.18 mm (Table 5).
-
It is assumed that air flows out through a small karst conduit equivalent to a pipe of length L and radius r (Eq. 16, Fig. 8c). Two cases are set up: (i) the pipe goes from the main cave to the surface (hence L=40 m), and (ii) the pipe goes from the top of the Grand Puits to the surface (hence L=10 m). The computed radius of this hypothetical pipe is then around 1.5 to 2.7 mm (Table 5).
6.1 Exploring caves with sea tide: accessing the inaccessible volumes
Cave volume is a challenging parameter to quantify and is important as it is involved in the study of the cave air renewal or internal airflow impacting the conservation of artwork or archeological remains. It can also be a parameter of interest for archeological studies to understand the spaces that Paleolithic humans used for decoration. Indeed, the large number of Upper Paleolithic caves decorated in the south of France shows that the volumes of decorated caves vary widely, from small rooms to large caves. For instance, the volume of Lascaux Cave is less than 3000 m3 (Malaurent et al., 2006), the polychrome room in Altamira Cave is 342 m3 (Sainz et al., 2018), Chauvet Cave is 60 000±20 000 m3 (Bourges et al., 2020), Cussac Cave is 50 000 m3 (Peyraube et al., 2016), and l'Aven d'Orgnac is 237 000 m3 (Bourges et al., 2006a). The volumes of accessible parts of caves have usually been obtained by 3D speleological surveys (Jouves et al., 2017) using handheld topographic instruments or by laser scanning (Giordan et al., 2021; Mohammed Oludare and Pradhan, 2016). These methods are efficient but are mainly limited by the accessibility of cave passages to speleological investigation because they require scanning point clouds. Small passages or as yet undiscovered connected rooms are thus not surveyed. In the case of Cosquer Cave, tidal pressure variation makes it possible to assess the entire cave volume independently of the geometry or accessibility of these volumes. The method uses classical equations but is a rather exceptional application since partly submerged confined coastal caves are not widespread. Nevertheless, calculating the whole volume of the cave provides the opportunity to compute other crucial data in this study: air quantity and then airflow rates and rock permeability. One strength of the method is that it uses the natural variation in the pools' water level induced by the sea tides twice a day, giving four slopes per day. Uncertainties in the results vary with the tide range. Uncertainties are maximal when the tide variation is minimal. Computing the mean volume over a long period (2 months) is a way of minimizing the impact of local disturbances (Fig. 9c), generating a few outliers in volume results, although the sources of the disturbances have not been identified and separated. One should remember that the cave volume is almost constant from day to day, and volume changes in Fig. 9a from one result to the next are commonly explained by bias in the measurement (which is sensor-dependent) or water level variations with a very high frequency when the seawater is moving with waves.
Over the 2 summer months, there is a slow decrease in the cave air pressure, and the water level of the pools rises slowly in the cave. The cave volume should then change, decreasing with the rising water level. As shown in Fig. 4, between July and August, the water level rose by 23 cmsw in 2017 and 13 cmsw in 2018. Using the pools' reference surface (847 m2), the cave volume decrease is equivalent to 192 m3 in 2017 and 112 m3 in 2018 during these 2 months. No significant decreasing trend appears in the cave volume measurement time series (Fig. 9a). However, a significant difference in average volumes (197 m3) was found between the year 2020 when the water level remained exceptionally low (1.4 m) and during the years 2015–2019 (average water level 1.57±0.05 m) (Table 2). We also compared this computed volume with the volume calculated from the 3D survey of the cave. We approximated roughly the volume of the cave from the 3D speleological hand-survey maps and cross sections (Fig. 2): 3100 m3 for the decorated rooms (no. 1 in Fig. 10), 1500 m3 for the Grand Puits (no. 2 in Fig. 10), and 1200 m3 for the upper conduit connected to the top of the Grand Puits (no. 3 in Fig. 10). The total estimated volume is 5800 m3, which is significantly higher than our best estimation (5184 m3 for a water level of 1.33 m). Assuming that the geometrical determination is accurate, which still needs to be confirmed by full 3D modeling of the whole cave, this difference may be explained by the actual surface of the pools (which will need to be refined) and by the temperature variations of the air during a tidal cycle. Regarding air temperature, convective movements control temperature homogenization in the cave (Lismonde, 2002), and although the air temperature time series were obtained outside the convective boundary layer, they were only acquired at one location in the main room and may not be representative of the volume-averaged temperature in the cave. We pointed out that the recorded tide-related temperature variations were much smaller than the adiabatic tide-related temperature variations and showed that calculations under fully adiabatic conditions could result in 40 % larger volume estimates. Therefore, other parts of the cave may have larger tide-related temperature variations, which could result in underestimation of the total volume. Nevertheless, our results suggest there are no other connected large rooms that remain to be discovered inside Cosquer Cave.
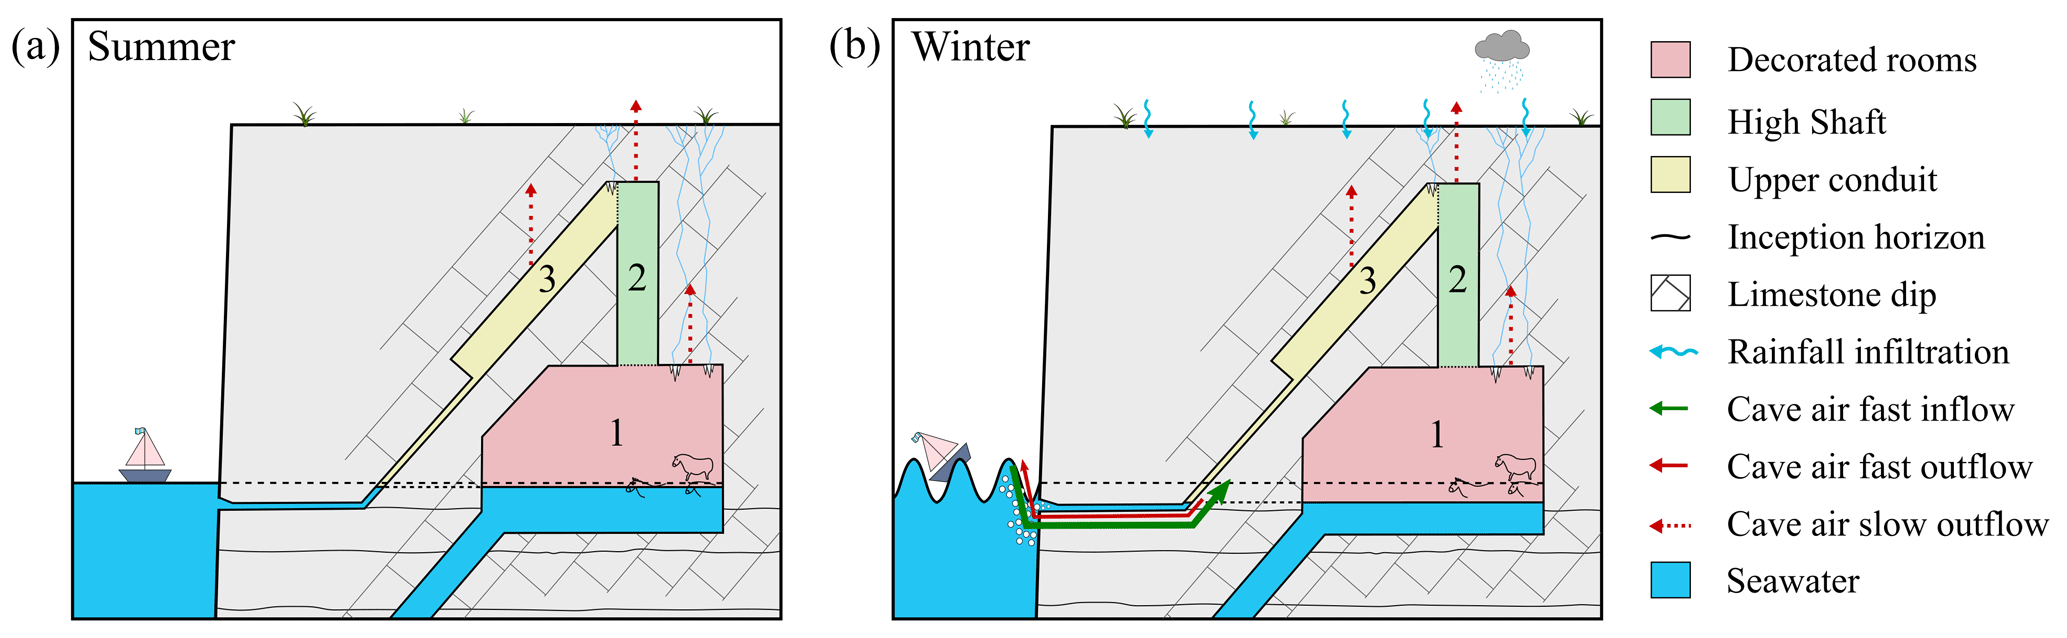
Figure 10Conceptual model of airflows in the saturated and unsaturated zones of the limestone massif surrounding Cosquer Cave (cross section, not to scale).
6.2 Air renewal
Cave airflows typically take place through the entrance of the cave along karst conduits or through fractures or porosity in the formation. If the cave is connected to several entrances, even entrances that are too small for human investigation, ventilation occurs through the karstic network between the entrances (Gabrovšek, 2023; Lismonde, 2002). Here, in Cosquer Cave, the cave is confined, and all the passages are closed by submarine karst sumps. The air pressure inside the cave is almost always higher than the pressure outside, and we showed in the “Results” section that airflows are conditioned by the following: (1) there are rapid air exchanges driven by waves during short pressurization events occurring a few dozen times a year, with rapid inflow and outflow through the saturated karst conduits (these events generally have a positive airflow budget, which results in a net inflow of air to the cave); and (2) excess air slowly leaks through the limestone walls in the unsaturated zone, re-equilibrating air pressure on a seasonal timescale. The processes allowing air renewal are thus very different from other caves, which do not have long-term overpressure.
During the summer period, we showed that there is no significant air inflow and that the air flows out continuously (Fig. 10a). So, the air quantity inside the cave varies, decreasing over the summer, but the air is not renewed. The annual mean pressure difference between inside and outside Cosquer Cave is 56 cmsw (years 2015 to 2020). This is significantly higher than the natural pressure gradients usually found in caves: pressure gradients due to variations in atmospheric pressure or temperature variations in the range of 2 cmsw are observed in Lascaux and Altamira caves (Houillon et al., 2017; Sainz et al., 2018) and up to 5 cmsw in the case of a coastal karst under the influence of tides (Jiao and Li, 2004). In the case of Cosquer Cave, this air supply and consequently air renewal only happen during pressurization events. These events require an additional mechanism to force the air to flow from outside to inside the cave. Field observations and data suggest a close link between sea conditions (wave height) and pressurization events. Waves breaking along the cliff at the shallow submarine karst inception horizons and fractures seem to be the main drivers. Understanding this mechanism is beyond the scope of this paper, but our air content calculations can be used to assess net fluxes occurring during pressurization events.
Pressurization events generally have an initial pressure increase stage indicating inflow, followed by a rapid decay indicating a net outflow through the karst, probably occurring through the same shallow conduit network. Part of the injected air is thus expelled immediately after the pressurization stage. For instance, during the 29 April 2018 event (Fig. 5), 869 m3, corresponding to 17 % of the cave's air volume, was injected in a few hours, but nearly 75 % of this air exited during the following day (Table 4). As no air quality measurements were carried out, it is unclear whether the air exiting was newly entered air or mixed with pre-event air. Moreover, the input air may at first stay near the entrance area and not mix with air in the other rooms. This situation has been reported in many caves. Its occurrence depends on the air density differences inside the cave (Lismonde, 2002; Peyraube et al., 2016) and on the shape of the cave passages (Gabrovšek, 2023; Luetscher and Jeannin, 2004). In Cosquer Cave, in situ observations suggested that air inflow occurs mainly through shallow conduits and fractures connected to the upper conduit (Malaurent and Vouvé, 2003) and not directly in the decorated rooms. We propose a conceptual model in Fig. 10, taking into account the volumes of the three main parts of the cave. The air pushed by the waves below the sea level flows up to pools connected to the lower end of the upper conduit (Fig. 10b). The ascending geometry of the upper conduit may prevent air from flowing down to the decorated rooms. The volume of air flowing in during the event must therefore be greater than the volume of the upper conduit (around 1200 m3) to reach the top of the Grand Puits and flows into the decorated rooms.
Summing all the air volume entering the cave during events, the mean annual air inflow volume is approximately 17 590 m3 (years 2015 to 2020), corresponding to a total annual air renewal of 3.4 times the volume of the cave (considering the mean cave volume of 5184 m3 and under standard pressure and temperature conditions) per year. However, this value represents a maximum renewal rate as 75 % (13 270 m3) of the entering air exits during the rapid pressure decays immediately after the pressure peaks (e.g., Fig. 5, from D to E), possibly without mixing, and 25 % (4300 m3) exits during slow pressure decreases. The minimal air renewal rate in the cave is calculated by excluding the fraction of air outflowing during pressurization events, i.e., only taking into account the volume of air leaving by slow depressurization. This minimum rate is 0.8 times the air volume in the cave per year (mean from the years 2015 to 2020). In either case, air renewal in Cosquer Cave is significantly lower than that measured at Hollow Ridge Cave (∼175–8760 yr−1, Kowalczk and Froelich, 2010), in the Altamira polychrome hall (∼270 yr−1, Sainz et al., 2018), or at Chauvet Cave (∼40 yr−1, Bourges et al., 2020). For preservation reasons, the Altamira and Chauvet decorated caves are artificially closed by gates to limit natural air ventilation, which nevertheless remains 11 to 300 times higher than that in Cosquer Cave.
6.3 Permeability of the unsaturated zone at the cave scale
The case of Cosquer Cave shows that permeability can be highly variable between the saturated zone below sea level and the unsaturated zone surrounding the cave above sea level. Both the saturated and unsaturated zones are of the same rock age and facies, i.e., early Cretaceous limestones with Urgonian facies. At the rock massif scale, permeability differs mainly if karst conduits are connected or if karst fractures or porosity are filled and clogged by low-permeability materials. Studying water level variations in coastal wells is a classic way of calculating the aquifer's transmissivity and storage coefficient in the saturated zone using the amplitude, frequency, and phase shift of the tide (Trefry and Johnston, 1998; Zhang, 2021). This method does not apply to coastal karsts that do not filter the tide pressure wave when karst conduits are large. As the groundwater table fluctuates with sea tides in coastal aquifers, it also causes air pressure fluctuations in some coastal unsaturated zones. Tide-induced airflow has been studied extensively (Kuang et al., 2013). In coastal aquifers with a layered unsaturated zone, airflow is induced by sea tides. Jiao and Li (2004) and Xia et al. (2011) used this feature to validate air permeability estimation with numerical simulations. In the case of Cosquer Cave, air effective permeability calculations have not been done using the tide variation because this requires pressure measurements at several altitudes in the unsaturated zone. However, we showed that air effective permeability calculations can be done on a seasonal timescale using the cave's slow depressurization. This gives air effective permeabilities varying from to m2 (12 values). These values are relatively high compared to the permeability given in the literature for samples taken in similar carbonate formations. Several authors reported permeability measured on plugs (local scale, a few centimeters) in Urgonian limestones in the south of France, ranging from to m2 for porosities ranging from 0.75 % to 18.3 % (Cochard et al., 2020; Danquigny et al., 2023; Jeanne et al., 2013). These measurements were done on plugs and did not include karstic vugs, fractures, or inception horizons on bedding planes (Filipponi et al., 2009) that locally increase the rock permeability. For instance, larger-scale measurements performed with packers in a fault zone with open fractures in the same formation found much higher permeabilities on the order of m2 (Guglielmi et al., 2015). Air effective permeabilities determined by air depressurization of Cosquer Cave gave the permeability of the unsaturated zone at the massif scale, i.e., at a mesoscale around the 100 m length scale, and included fractures and karst conduits. These potentially permeable geological features have been recognized in situ on the cliff and plateau around the cave. However, we calculated that the permeability of the massif surrounding the cave is equivalent to a fracture of a small hydraulic aperture (one equivalent fracture around 150 µm) or an equivalent pipe of very small radius (between 1.5 and 2.7 mm). These relatively small values show that most voids or fractures may be clogged or not connected in the unsaturated zone. This is consistent with in situ geomorphological observations at the outcrop, where karst voids are generally filled up by calcite and clay minerals.
Figure 11 shows the mean air effective permeability calculated for each year over July and August compared to the cumulative rainfall over April to August (5 months). We computed cumulative rainfall for several periods lasting over the slow cave air pressure decrease period, beginning on 1 May, 1 April, or 1 March and ending on 31 August (end of the period used for permeability calculation). The trends were similar, and the best graphical view is given in Fig. 11. This figure shows a relationship between the air effective permeability of the unsaturated zone and the cumulative rainfall. There are no data available on the moisture content in the unsaturated zone, but it may be assumed that the higher the cumulative rainfall is, the higher the moisture in the unsaturated zone should be. A lower water saturation in the limestone massif is then expected during drier years, i.e., years with longer spring and summer droughts. Consequently, drier years should have a higher relative permeability to air because there is less groundwater in contact with grains and more air connection between the pores (Kuang et al., 2013; Weeks, 1978). This may also increase the number of flow paths or open a preferential airflow path through the karstic unsaturated zone. On the other hand, the rainfall infiltrates, fills the porosity, and limits the air effective permeability of the unsaturated zone.
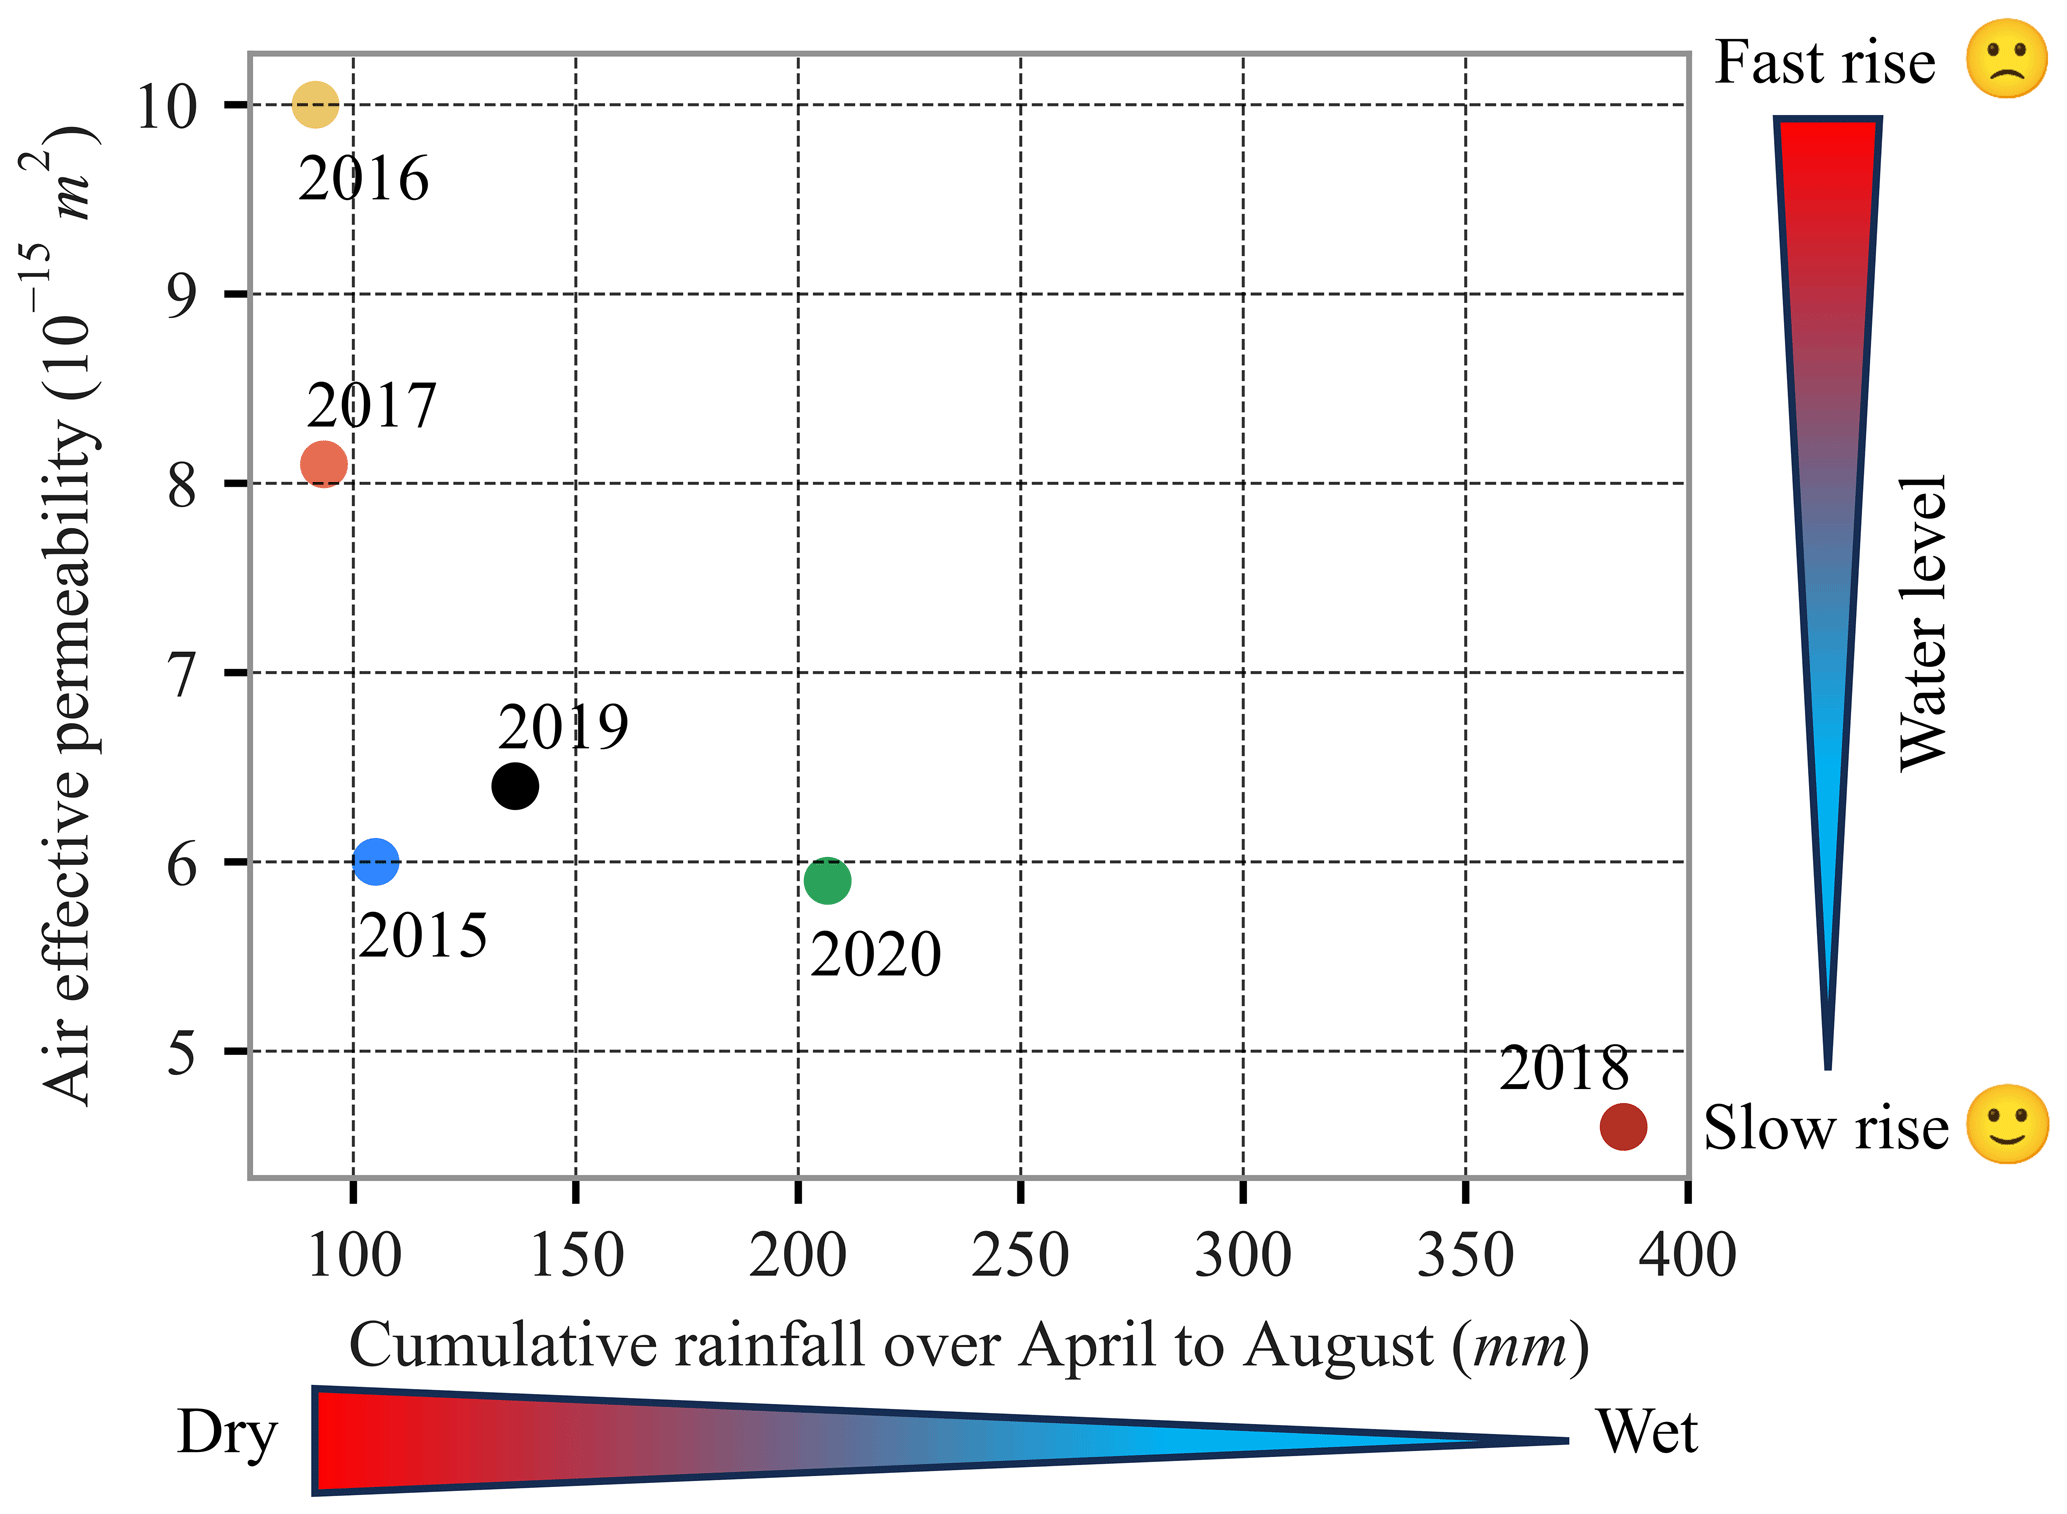
Figure 11Mean air effective permeability (m2) between July and August versus cumulative rainfall at Cassis from April to August (mm) for the years 2015 to 2020 (for model m).
Cumulative rainfall over April to August ranged from 90 to 390 mm for the 6 years studied, while the 30-year average was observed to be equal to 170 mm (1991 to 2020; Météo-France, 2023). Four out of the 6 years (2015, 2016, 2017, and 2019) had below-average cumulative rainfall with drought periods. In contrast, one year (2018) was very rainy. The expected trend can be clearly observed in Fig. 11: air effective permeability of the unsaturated zone increases systematically when rainfall amount decreases. This trend is not linear along the whole range of cumulative rainfall variations. Years 2019, 2020, and 2018 show a large increase in rainfall amount but a small decrease in air effective permeability, whereas drier years show a larger increase in permeability. As a result, the cave air pressure decreases more quickly in drier years, and so the water level inside Cosquer Cave rises more quickly. Drier years could lead to a total loss of overpressure in the cave.
Airflows in decorated caves impact wall art conservation. In karst systems, air can flow through either the karst network, open and connected fractures, or porous carbonate rocks. This paper proposes the first conceptual model and quantification of airflows through the rock massif surrounding Cosquer Cave, including flows through the saturated zone and the unsaturated zone. Data show that the Cosquer Cave air pressure is higher than the atmospheric pressure. In response, the water level in the cave is lower than the sea level. Three types of cave air pressure variations on three different timescales were identified:
-
Seasonal variations consisting of a succession of pressurization events from early fall to late spring. Pressurization events consist of massive air inflows, resulting in a remarkable increase in the cave air pressure that is immediately followed by a rapid pressure drop but with a positive budget showing an increase in air quantity in the cave.
-
There is a slow air pressure decrease from late spring to early fall.
-
Daily cave air pressure and water level variations are forced by sea tides.
We showed that tidal variations in cave air pressure can be used to calculate the air-filled volume of the cave (for a given water surface area) by applying the perfect gas law at low and high tide. The mean cave volume calculated in summer is around 5000 m3, which is consistent with a rough estimation made from the 3D speleological hand-survey maps and cross sections. It seems that archeologists have explored all the main rooms of this decorated cave.
Using the cave volume results, we calculated the air flowing into and out of the cave. Cosquer Cave is closed off by sumps in the saturated part of the karst below the sea level and by the low permeability of the rock in the unsaturated zone surrounding the cave. The high airflow rates during pressurization events (e.g., up to 222 m3 h−1 for the case studied in April–May 2018) revealed that air flows through large voids in the saturated zone of the karst. These results are a first step towards studying the mechanism that generates the overpressure inside the cave. Further studies will focus on the relationship between the pressurization events and the assumed link with the sea waves breaking on the cliff outside the cave. Following the first observations by Malaurent and Vouvé (2003), we confirm that air may use karst or inception horizons on bedding planes to flow a few meters below the sea level across the limestone massif. Consequently, air renewal occurs during pressurization events but at a low rate (3.4 to 0.8 yr−1). However, this air renewal may differ from one area to another: the volume of outside air injected into the cave during pressurization events is on the same order of magnitude as the volume of the upper conduit (about 1200 m3) and may therefore not reach the decorated rooms located in the lower part of the cave. The 3D scan of the cave will give insight into the volumes of the different areas of the cave. Moreover, part of the air flowing in flows out of the cave immediately after the pressurization peak. Further air quality measurements, such as radon concentrations, will help to show whether the air exiting is newly entered air or mixed with pre-event air (Fernández et al., 1986; Cigna, 2005; Kowalczk and Froelich, 2010). In addition, excluding the periods with pressurization events, the gradual decrease in the air pressure over the summer is explained by the slow air outflow through the unsaturated zone, which does not necessarily involve air renewal.
Using the low rates of air outflowing during the slow pressure decreases (around 6 m3 d−1), we estimated the air effective permeability of the rock massif with Darcy's law for several assumptions of flows through the unsaturated zone. Rock effective permeability was found to be in the range to m2, depending on the assumed geometry. Although karstified fractures are visible on the surface of the limestone massif, these are sealed by calcite or clay minerals, which limits permeability. This is in line with the observation of a permanently overpressurized cave. We showed that the massif mean air effective permeability over the months of July and August varies from year to year as a function of the water saturation of the unsaturated zone by comparing effective permeability with the cumulative rainfall over spring and summer. A decrease in rainfall leads to an increase in the air permeability of the massif and therefore to an increase in the air outflow rate through the unsaturated zone of the massif.
Through these first 6 years of measurements in this decorated cave, we show that drought periods and drier spring and summer years impact the conservation of the Paleolithic paintings and engravings on the walls close to the water level of the pools. This result is of utmost importance in the current context of climate change. In the future, an increasing evapotranspiration rate and longer dry periods are expected in the Mediterranean basin (Cramer et al., 2020). Under these conditions, the water levels of the pools in Cosquer Cave should then rise more quickly during spring and summer, and hence the decorated walls and archeological artifacts on the floor would face longer flooding periods. The effect may be even worse if clay infillings in karst voids start drying and cracks open across the unsaturated zone, transforming the current slow air pressure decrease into a rapid decrease. Nevertheless, predicting water level in the future in Cosquer Cave remains hard because other parameters drive the variations, such as the process of air inflow through the saturated zone. The striking example of Cosquer Cave also shows that inland (not coastal) decorated caves could be affected by changes in air circulation through the unsaturated zone in the future in a climate change context, which will affect the water content in the unsaturated zone governing the air permeability. This supports the need to observe our changing world by dedicated data acquisition (Gaillardet et al., 2018).
As seen above, cave air pressure and water level vary with tides. We used this behavior to calculate the variation of the volume of air in the cave. This calculation was done at high and low tide to maximize the amplitudes of these variations and minimize measurement uncertainties. To determine the times of the tidal peaks, the tidal signal ht is isolated from the sea level hs using the TTide Python package (Pawlowicz et al., 2002). The synthetic tide signal ht(t) is then derived.
The tide is low when
and the tide is high when
where tlt and tht are the times of low tide and high tide.
Propagation of uncertainty provides the standard deviation for a sum or difference of measured parameters,
and for product and division,
where f is the resulting value, xi is the measured parameter, and σ(xi) is its standard deviation. The standard deviation of parameters xi is given by
with δi the typical uncertainty of the sensor i. Using Eqs. (C1) and (C2), the typical uncertainty for the cave volume Vl (Eq. 5) is
where
and
The use of the weighted mean reduces the contribution of results with high uncertainties:
where σ is the standard deviation of Vl. The weighted variance of is given by
The volume result is within the range
The codes developed for this research and the code to reproduce the figures are available via GitLab at https://gitlab.osupytheas.fr/hpellet/chapitre-3-mesoscale-permeability-variations (Pellet, 2024). The Port-Miou observation site dataset can be accessed at https://doi.org/10.15148/4140d06c-fa31-4b4c-8c0f-38e6d0c62fbc (SNO KARST, 2024). Meteorological data can be accessed at https://www.data.gouv.fr/fr/datasets/r/5669e5be-8c67-4fbf-aeae-08cbc2369dd4 (Météo-France, 2024). Data from Cosquer Cave are confidential.
HP, BA, and PH conceptualized the research goals and developed the methodology. BA and ST found the funding for the project. HP developed the code and prepared its visualization, and GG provided programming support and analysis tools. HP prepared the original draft with contributions from BA, PH, and ST.
The contact author has declared that none of the authors has any competing interests.
Publisher's note: Copernicus Publications remains neutral with regard to jurisdictional claims made in the text, published maps, institutional affiliations, or any other geographical representation in this paper. While Copernicus Publications makes every effort to include appropriate place names, the final responsibility lies with the authors.
We would like to thank the DRAC PACA (Service Régional de l’Archéologie, Conservation Régionale des Monuments Historiques), which supported this study by authorizing access to the cave. This study was also supported by Aix-Marseille University (AMU) and the Laboratoire de Recherche des Monuments Historiques (LRMH, Ministère de la Culture). This work was performed within the framework of the Port-Miou observation site, part of the KARST observatory network (https://sokarst.org/, last access: 27 August 2024) initiative of the INSU/CNRS, which aims to strengthen knowledge sharing and promote cross-disciplinary research on karst systems. This study was also performed in the framework of the interdisciplinary research team Équipe grotte Cosquer supervised by Cyril Montoya (PCR 2022–2023). We thank the Conservatoire du Littoral, the Calanques National Park, the city of Cassis, and Météo-France. This paper benefited from the work of Bertrand Chazaly on the 3D scan of the cave, Caroline Font on QGIS, and Sylvain Rassat on the 3D model. We thank the Immadras diving team and the DRASSM for their help in field studies. We also thank Sophie Viseur, François Fournier, Philippe Léonide, Baptiste Suchéras-Marx, Lamarche Juliette, Eduardo Roemers De Oliveira, and Paul Namongo Soro at AMU as well as Luc Vanrell and Michel Olive (Immadras, DRAC) for helpful discussions.
This research has been supported by DRAC PACA (Service Régional de l'Archéologie, Conservation Régionale de l'Archéologie), which funded the fieldwork and some of the measurement devices. This work received support from the French government under the France 2030 investment plan as part of the Initiative d’Excellence d’Aix-Marseille Université – A*MIDEX – at the Institute for Mediterranean Archaeology ARKAIA (AMX-19-IET-003). Hugo Pellet was awarded a PhD grant from AMU and the LRMH.
This paper was edited by Gerrit H. de Rooij and reviewed by three anonymous referees.
Andrieux, C.: Étude du climat des cavités naturelles dans les roches calcaires (Grotte de Niaux, Ariège), Gallia préhistoire, 20, 301–322, https://doi.org/10.3406/galip.1977.1564, 1977.
Arfib, B. and Charlier, J.-B.: Insights into saline intrusion and freshwater resources in coastal karstic aquifers using a lumped Rainfall–Discharge–Salinity model (the Port-Miou brackish spring, SE France), J. Hydrol., 540, 148–161, https://doi.org/10.1016/j.jhydrol.2016.06.010, 2016.
Arfib, B. and Mocochain, L.: Deep flooded karst of south-eastern France – Genesis and hydrodynamic functioning, Karstologia, 79, 35–44, https://hal.science/hal-03779651v2 (last access: 29 August 2024), 2022.
Arfib, B., Vanrell, L., and Olive, M.: New insights into the Cosquer art cave hydrogeological functionning (France), in: Eurokarst, Besançon, France, p. 4, https://hal.science/hal-01919939 (last access: 29 August 2024), 2018.
Badino, G.: Underground Meteorology- – “What's the weather underground?”, Acta Carsolog. 39, 427–44, https://doi.org/10.3986/ac.v39i3.74, 2010.
Baffier, D.: La grotte Chauvet: conservation d'un patrimoine, Bulletin de la Société préhistorique française, 102, 11–16, https://doi.org/10.3406/bspf.2005.13332, 2005.
Baker, A. and Genty, D.: Environmental pressures on conserving cave speleothems: effects of changing surface land use and increased cave tourism, J. Environ. Manage., 53, 165–175, https://doi.org/10.1006/jema.1998.0208, 1998.
Benjamin, J., Rovere, A., Fontana, A., Furlani, S., Vacchi, M., Inglis, R. H., Galili, E., Antonioli, F., Sivan, D., Miko, S., Mourtzas, N., Felja, I., Meredith-Williams, M., Goodman-Tchernov, B., Kolaiti, E., Anzidei, M., Gehrels, R.: Late Quaternary sea-level changes and early human societies in the central and eastern Mediterranean Basin: An interdisciplinary review, Quatern. Int., 449, 29–57, https://doi.org/10.1016/j.quaint.2017.06.025, 2017.
Borderie, F., Alaoui-Sossé, B., and Aleya, L.: Heritage materials and biofouling mitigation through UV-C irradiation in show caves: state-of-the-art practices and future challenges, Environ. Sci. Pollut. Res., 22, 4144–4172, https://doi.org/10.1007/s11356-014-4001-6, 2015.
Borgomano, J., Masse, J.-P., Fenerci-Masse, M., and Fournier, F.: Petrophysics of lower cretaceous platform carbonate outcrops in provence (se france): implications for carbonate reservoir characterisation, J. Petrol. Geol., 36, 5–41, https://doi.org/10.1111/jpg.12540, 2013.
Bourges, F. and Enjalbert, J.: Suivi environnemental des grottes ornées paléolithiques d’Occitanie en 2020, Drac Occitanie – France, p. 162, 2020.
Bourges, F., Genthon, P., Mangin, A., and D'Hulst, D.: Microclimates of l'Aven d'Orgnac and other French limestone caves (Chauvet, Esparros, Marsoulas), Int. J. Climatol., 26, 1651–1670, https://doi.org/10.1002/joc.1327, 2006a.
Bourges, F., Mangin, A., D'Hulst, D., and Genthon, P.: La conservation de l'art pariétal préhistorique des grottes, les raisons d'un miracle, Bulletin de la Société préhistorique Ariège-Pyrénées, Préhistoire, Art et Sociétés, 61, 43–50, 2006b.
Bourges, F., Genthon, P., Genty, D., Lorblanchet, M., Mauduit, E., and D'Hulst, D.: Conservation of prehistoric caves and stability of their inner climate: Lessons from Chauvet and other French caves, Sci. Total Environ., 493, 79–91, https://doi.org/10.1016/j.scitotenv.2014.05.137, 2014.
Bourges, F., Genty, D., Perrier, F., Lartiges, B., Régnier, É., François, A., Leplat, J., Touron, S., Bousta, F., Massault, M., Delmotte, M., Dumoulin, J.-P., Girault, F., Ramonet, M., Chauveau, C., and Rodrigues, P.: Hydrogeological control on carbon dioxide input into the atmosphere of the Chauvet-Pont d'Arc cave, Sci. Total Environ., 716, 136844, https://doi.org/10.1016/j.scitotenv.2020.136844, 2020.
Castagnino Berlinghieri, E. F., Antonioli, F., and Bailey, G.: Italy: The Archaeology of Palaeoshorelines, Coastal Caves and Seafaring Connections, in: The Archaeology of Europe's Drowned Landscapes, Coastal Research Library, edited by: Bailey, G., Galanidou, N., Peeters, H., Jöns, H., and Mennenga, M., Springer International Publishing, Cham, 321–340, https://doi.org/10.1007/978-3-030-37367-2_16, 2020.
Chapman, S. and Cowling, T. G.: The Mathematical Theory of Non-uniform Gases: An Account of the Kinetic Theory of Viscosity, Thermal Conduction and Diffusion in Gases, Cambridge University Press, ISBN 978-0-521-40844-8, 1990.
Charbeneau, R. J.: Groundwater Hydraulics and Pollutant Transport, Waveland Press, ISBN 978-1-4786-0831-8, 2006.
Chow, V., Maidment, D., and Mays, L.: Applied Hydrology, in: 2nd Edn., McGraw-Hill Companies, Incorporated, ISBN 978-0-07-174391-4, 2013.
Cigna, A. A.: Environmental management of tourist caves: The examples of Grotta di Castellana and Grotta Grande del Vento, Italy, Environ. Geol., 21, 173–180, https://doi.org/10.1007/BF00775302, 1993.
Cigna, A. A.: Radon in Caves, Int. J. Speleol., 34, 1–18, 2005.
Clottes, J., Beltrán, A., Courtin, J., and Cosquer, H.: La Grotte Cosquer (Cap Morgiou, Marseille), Bulletin de la Société Préhistorique Française, 89, 98–128, https://doi.org/10.3406/bspf.1992.10536, 1992a.
Clottes, J., Courtin, J., Valladas, H., Cachier, H., Mercier, N., and Arnold, M.: La grotte Cosquer datée. Bulletin de la Société Préhistorique Française, 89, 230–234, https://doi.org/10.3406/bspf.1992.9527, 1992b.
Clottes, J., Courtin, J., Collina-Girard, J., and Valladas, H.: News from Cosquer Cave: climatic studies, recording, sampling, dates, Antiquity, 71, 321–326, 1997.
Cochard, J., Léonide, P., Borgomano, J., Guglielmi, Y., Massonnat, G., Rolando, J., Marié, L., and Pasquier, A.: Reservoir properties of barremian – aptian urgonian limestones, SE France, part 1: influence of structural history on porosity-permeability variations, J. Petrol. Geol., 43, 75–94, https://doi.org/10.1111/jpg.12750, 2020.
Cramer, W., Guiot, J., Marini, K., Azzopardi, B., Balzan, M. V., Cherif, S., Doblas-Miranda, E., Santos, M. D., Dobrinski, P., Falder, M., Hassoun, A. E. R., Giupponi, C., Koubi, V., Lange, M., Lionello, P., Llasat, M. C., Moncada, S., Mrabet, R., Paz, S., Savé, R., Snoussi, M., Toreti, A., Vafeidis, A. T., and oplaki, E.: Summary for Policymakers of the First Mediterranean Assessment Report (MAR1) of the Mediterranean Experts on Climate and environmental Change (MedECC), Climate and Environmental Change in the Mediterranean Basin – Current Situation and Risks for the Future, First Mediterranean Assessment Report 11-40, Zenodo, https://doi.org/10.5281/ZENODO.5113087, 2020.
Danquigny, C., Coqueret, J., Massonnat, G., Léonide, P., Barbier, M., Dal Soglio, L., and Lesueur, J. L.: A Smart Analytical and Numerical Interpretation of Injection Tests in Unsaturated, Fractured and Karstified Carbonate Reservoirs, in: Advances in Karst Science, Presented at the EuroKarst 2022, Málaga, edited by: Andreo, B., Barberá, J. A., Durán-Valsero, J. J., Gil-Márquez, J. M., and Mudarra, M., Springer International Publishing, Cham, 115–122, https://doi.org/10.1007/978-3-031-16879-6_17, 2023.
Delporte, H., Clottes, J., and Courtin, J.: La grotte Cosquer, peintures et gravures de la caverne engloutie, Bulletin de la Société Préhistorique Française, 91, 173–174, 1994.
Domínguez-Villar, D., Lojen, S., Krklec, K., Baker, A., Boyce, A. J., and Fairchild, I. J.: Is global warming affecting cave temperatures? Experimental and model data from a paradigmatic case study, Clim. Dynam., 45, 569–581, https://doi.org/10.1007/s00382-014-2226-1, 2015.
Fernández, P. L., Gutierrez, I., Quindós, L. S., Soto, J., and Villar, E.: Natural ventilation of the Paintings Room in the Altamira cave, Nature, 321, 586–588, https://doi.org/10.1038/321586a0, 1986.
Filipponi, M., Jeannin, P.-Y., and Tacher, L.: Evidence of inception horizons in karst conduit networks, Geomorphology, 106, 86–99, https://doi.org/10.1016/j.geomorph.2008.09.010, 2009.
Ford, D. and Williams, P.: Karst Hydrogeology and Geomorphology, John Wiley & Sons, Ltd., England, ISBN 978-0-470-84996-5, 2007.
Gabrovšek, F.: How do caves breathe: The airflow patterns in karst underground, PLoS ONE, 18, 1–22, https://doi.org/10.1371/journal.pone.0283767, 2023.
Gaillardet, J., Braud, I., Hankard, F., Anquetin, S., Bour, O., Dorfliger, N., De Dreuzy, J. R., Galle, S., Galy, C., Gogo, S., Gourcy, L., Habets, F., Laggoun, F., Longuevergne, L., Le Borgne, T., Naaim-Bouvet, F., Nord, G., Simonneaux, V., Six, D., Tallec, T., Valentin, C., Abril, G., Allemand, P., Arènes, A., Arfib, B., Arnaud, L., Arnaud, N., Arnaud, P., Audry, S., Comte, V.B., Batiot, C., Battais, A., Bellot, H., Bernard, E., Bertrand, C., Bessière, H., Binet, S., Bodin, J., Bodin, X., Boithias, L., Bouchez, J., Boudevillain, B., Moussa, I. B., Branger, F., Braun, J. J., Brunet, P., Caceres, B., Calmels, D., Cappelaere, B., Celle-Jeanton, H., Chabaux, F., Chalikakis, K., Champollion, C., Copard, Y., Cotel, C., Davy, P., Deline, P., Delrieu, G., Demarty, J., Dessert, C., Dumont, M., Emblanch, C., Ezzahar, J., Estèves, M., Favier, V., Faucheux, M., Filizola, N., Flammarion, P., Floury, P., Fovet, O., Fournier, M., Francez, A. J., Gandois, L., Gascuel, C., Gayer, E., Genthon, C., Gérard, M. F., Gilbert, D., Gouttevin, I., Grippa, M., Gruau, G., Jardani, A., Jeanneau, L., Join, J. L., Jourde, H., Karbou, F., Labat, D., Lagadeuc, Y., Lajeunesse, E., Lastennet, R., Lavado, W., Lawin, E., Lebel, T., Le Bouteiller, C., Legout, C., Lejeune, Y., Le Meur, E., Le Moigne, N., Lions, J., Lucas, A., Malet, J. P., Marais-Sicre, C., Maréchal, J. C., Marlin, C., Martin, P., Martins, J., Martinez, J. M., Massei, N., Mauclerc, A., Mazzilli, N., Molénat, J., Moreira-Turcq, P., Mougin, E., Morin, S., Ngoupayou, J. N., Panthou, G., Peugeot, C., Picard, G., Pierret, M. C., Porel, G., Probst, A., Probst, J. L., Rabatel, A., Raclot, D., Ravanel, L., Rejiba, F., René, P., Ribolzi, O., Riotte, J., Rivière, A., Robain, H., Ruiz, L., Sanchez-Perez, J. M., Santini, W., Sauvage, S., Schoeneich, P., Seidel, J. L., Sekhar, M., Sengtaheuanghoung, O., Silvera, N., Steinmann, M., Soruco, A., Tallec, G., Thibert, E., Lao, D.V., Vincent, C., Viville, D., Wagnon, P., and Zitouna, R.: OZCAR: The French Network of Critical Zone Observatories, Vadose Zone J., 17, 1–24, https://doi.org/10.2136/vzj2018.04.0067, 2018.
Gázquez, F., Quindós, L., Rábago, D., Fuente, I., Celaya, S., and Sainz, C.: The role of cave ventilation in the triple oxygen and hydrogen isotope composition of condensation waters in Altamira Cave, northern Spain, J. Hydrol., 606, 127416, https://doi.org/10.1016/j.jhydrol.2021.127416, 2022.
Germinario, L. and Oguchi, C. T.: Underground salt weathering of heritage stone: lithological and environmental constraints on the formation of sulfate efflorescences and crusts, J. Cult. Herit., 49, 85–93, https://doi.org/10.1016/j.culher.2021.02.011, 2021.
Giordan, D., Godone, D., Baldo, M., Piras, M., Grasso, N., and Zerbetto, R.: Survey Solutions for 3D Acquisition and Representation of Artificial and Natural Caves, Appl. Sci., 11, 6482, https://doi.org/10.3390/app11146482, 2021.
Guglielmi, Y., Cappa, F., Avouac, J.-P., Henry, P., and Elsworth, D.: Seismicity triggered by fluid injection–induced aseismic slip, Science, 348, 1224–1226, https://doi.org/10.1126/science.aab0476, 2015.
Houillon, N., Lastennet, R., Denis, A., Malaurent, P., Minvielle, S., and Peyraube, N.: Assessing cave internal aerology in understanding carbon dioxide (CO2) dynamics: implications on calcite mass variation on the wall of Lascaux Cave (France), Environ. Earth Sci., 76, 170, https://doi.org/10.1007/s12665-017-6498-8, 2017.
Huang, J.: A Simple Accurate Formula for Calculating Saturation Vapor Pressure of Water and Ice, J. Appl. Meteorol. Clim., 57, 1265–1272, https://doi.org/10.1175/JAMC-D-17-0334.1, 2018.
Jeanne, P., Guglielmi, Y., and Cappa, F.: Dissimilar properties within a carbonate-reservoir's small fault zone, and their impact on the pressurization and leakage associated with CO2 injection, J. Struct. Geol., 47, 25–35, https://doi.org/10.1016/j.jsg.2012.10.010, 2013.
Jiao, J. J. and Li, H.: Breathing of coastal vadose zone induced by sea level fluctuations, Geophys. Res. Lett., 31, 1–4, https://doi.org/10.1029/2004GL019572, 2004.
Jourde, H., Massei, N., Mazzilli, N., Binet, S., Batiot-Guilhe, C., Labat, D., Steinmann, M., Bailly-Comte, V., Seidel, J. L., Arfib, B., Charlier, J. B., Guinot, V., Jardani, A., Fournier, M., Aliouache, M., Babic, M., Bertrand, C., Brunet, P., Boyer, J. F., Bricquet, J. P., Camboulive, T., Carrière, S. D., Celle-Jeanton, H., Chalikakis, K., Chen, N., Cholet, C., Clauzon, V., Soglio, L. D., Danquigny, C., Défargue, C., Denimal, S., Emblanch, C., Hernandez, F., Gillon, M., Gutierrez, A., Sanchez, L. H., Hery, M., Houillon, N., Johannet, A., Jouves, J., Jozja, N., Ladouche, B., Leonardi, V., Lorette, G., Loup, C., Marchand, P., de Montety, V., Muller, R., Ollivier, C., Sivelle, V., Lastennet, R., Lecoq, N., Maréchal, J.C., Perotin, L., Perrin, J., Petre, M. A., Peyraube, N., Pistre, S., Plagnes, V., Probst, A., Probst, J. L., Simler, R., Stefani, V., Valdes-Lao, D., Viseur, S., and Wang, X.: SNO KARST: A French Network of Observatories for the Multidisciplinary Study of Critical Zone Processes in Karst Watersheds and Aquifers, Vadose Zone J.,17, 1–18, https://doi.org/10.2136/vzj2018.04.0094, 2018.
Jouves, J., Viseur, S., Arfib, B., Baudement, C., Camus, H., Collon, P., and Guglielmi, Y.: Speleogenesis, geometry, and topology of caves: A quantitative study of 3D karst conduits, Geomorphology, 298, 86–106, https://doi.org/10.1016/j.geomorph.2017.09.019, 2017.
Kowalczk, A. J. and Froelich, P. N.: Cave air ventilation and CO2 outgassing by radon-222 modeling: How fast do caves breathe?, Earth Planet. Sc. Lett., 289, 209–219, https://doi.org/10.1016/j.epsl.2009.11.010, 2010.
Kuang, X., Jiao, J. J., and Li, H.: Review on airflow in unsaturated zones induced by natural forcings, Water Resour. Res., 49, 6137–6165, https://doi.org/10.1002/wrcr.20416, 2013.
Kukuljan, L., Gabrovšek, F., Covington, M. D., and Johnston, V. E.: CO2 dynamics and heterogeneity in a cave atmosphere: role of ventilation patterns and airflow pathways, Theor. Appl. Climatol., 146, 91–109, https://doi.org/10.1007/s00704-021-03722-w, 2021.
Lacanette, D., Bassel, L., Salmon, F., Portais, J.-C., Bousquet, B., Chapoulie, R., Ammari, F., Malaurent, P., and Ferrier, C.: Climate of a cave laboratory representative for rock art caves in the Vézère area (south-west France), Int. J. Speleol., 52, 85–100, https://doi.org/10.5038/1827-806X.52.2.2442, 2023.
Lamarche, J., Lavenu, A. P. C., Gauthier, B. D. M., Guglielmi, Y., and Jayet, O.: Relationships between fracture patterns, geodynamics and mechanical stratigraphy in Carbonates (South-East Basin, France), Tectonophysics, 581, 231–245, https://doi.org/10.1016/j.tecto.2012.06.042, 2012.
Lambeck, K. and Bard, E.: Sea-level change along the French Mediterranean coast for the past 30 000 years, Earth Planet. Sc. Lett., 175, 203–222, https://doi.org/10.1016/S0012-821X(99)00289-7, 2000.
Lang, S.: Fundamentals of differential geometry, Graduate texts in mathematics, Springer, New York, Berlin, Heidelberg, ISBN 978-0-387-98593-0, 1999.
Lange, N. A. and Forker, G. M.: Handbook of Chemistry, in: 10th Edn., McGraw-Hill Book Company, Inc, New York, Toronto, London, 1967.
Lefèvre, M.: La “maladie verte” de Lascaux, Stud. Conserv., 19, 126–156, 1974.
Lepinay, C., Mihajlovski, A., Touron, S., Seyer, D., Bousta, F., and Di Martino, P.: Bacterial diversity associated with saline efflorescences damaging the walls of a French decorated prehistoric cave registered as a World Cultural Heritage Site, Int. Biodeterior. Biodegrad., 130, 55–64, https://doi.org/10.1016/j.ibiod.2018.03.016, 2018.
Leplat, J., François, A., Touron, S., Galant, P., and Bousta, F.: Aerobiological behavior of Paleolithic decorated caves: a comparative study of five caves in the Gard department (France), Aerobiologia, 35, 105–124, https://doi.org/10.1007/s10453-018-9546-2, 2019.
Liñán, C., del Rosal, Y., Carrasco, F., Vadillo, I., Benavente, J., and Ojeda, L.: Highlighting the importance of transitional ventilation regimes in the management of Mediterranean show caves (Nerja-Pintada system, southern Spain), Sci. Total Environ., 631–632, 1268–1278, https://doi.org/10.1016/j.scitotenv.2018.02.304, 2018.
Lismonde, B.: Climatologie du monde souterrain, in: 1st Edn., Comité Départemental de Spéléologie de l'Isère, Grenoble, ISBN 2-902670-49-4, 2002.
Luetscher, M. and Jeannin, P.-Y.: The role of winter air circulations for the presence of subsurface ice accumulations: an example from Monlési ice cave (Switzerland), Theor. Appl. Karstol., 17, 19–25, 2004.
Malaurent, P., Brunet, J., Lacanette, D., and Caltagirone, J.-P.: Contribution of numerical modelling of environmental parameters to the conservation of prehistoric cave paintings: the example of Lascaux Cave, Conserv. Manage. Archaeolog. Site., 8, 59–76, https://doi.org/10.1179/175355206x202976, 2006.
Malaurent, P. and Vouvé, J.: Caractérisation de la dynamique des transferts dans les galeries de la grotte H. Cosquer, Conséquences pour la conservation (No. G345), Ministère de la culture et de la communication – Laboratoire LRMH and Université Bordeaux I, Talence, France, p. 17, https://www.lrmh.fr/search.aspx?SC=DEFAULT&QUERY=Rapport+annuel+grottes+orn%C3%A9es+2020+Drac+Occitanie+GEConseil&QUERY_LABEL=#/Detail/(query:(Id:'0_OFFSET_0',Index:1,NBResults:1,PageRange:3,SearchQuery:(CloudTerms:!(),FacetFilter:%7B%7D,ForceSearch:!t,InitialSearch:!f,Page:0,PageRange:3,QueryGuid:'803f484e-af87-4316-84ed-f303652bd02a',QueryString:G345,ResultSize:10,ScenarioCode:DEFAULT,ScenarioDisplayMode:display-standard,SearchGridFieldsShownOnResultsDTO:!(),SearchLabel:'',SearchTerms:G345,SortField:YearOfPublication_int_sort,SortOrder:0,TemplateParams:(Scenario:'',Scope:Default,Size:!n,Source:'',Support:'',UseCompact:!f),UseSpellChecking:!n))) (last access: 27 August 2024), 2003.
Mangin, A. and Andrieux, C.: Les Conditions hydrogéologiques et climatiques d'environnement des œuvres pariétales préhistoriques, in: L'Art des cavernes: Atlas des grottes ornées paléolithiques françaises, Imprimerie nationale, Paris, 53–56, ISBN 2-11-080817-9, 1984.
Martin-Sanchez, P. M., Nováková, A., Bastian, F., Alabouvette, C., and Saiz-Jimenez, C.: Use of Biocides for the Control of Fungal Outbreaks in Subterranean Environments: The Case of the Lascaux Cave in France, Environ. Sci. Technol., 46, 3762–3770, https://doi.org/10.1021/es2040625, 2012.
Masse, J.-P., Frau, C., Tendil, A. J.-B., and Fenerci-Masse, M.: Evidence for three successive upper Barremian–lower Aptian rudist faunas in the Urgonian-type deposits of southeastern France and their stratigraphic value, Cretaceous Res., 115, 104561, https://doi.org/10.1016/j.cretres.2020.104561, 2020.
Massmann, J. W.: Applying Groundwater Flow Models in Vapor Extraction System Design, J. Environ. Eng., 115, 129–149, https://doi.org/10.1061/(ASCE)0733-9372(1989)115:1(129), 1989.
Matonti, C., Guglielmi, Y., Viseur, S., Bruna, P. O., Borgomano, J., Dahl, C., and Marié, L.: Heterogeneities and diagenetic control on the spatial distribution of carbonate rocks acoustic properties at the outcrop scale, Tectonophysics, 638, 94–111, https://doi.org/10.1016/j.tecto.2014.10.020, 2015.
Mattey, D. P., Fisher, R., Atkinson, T. C., Latin, J.-P., Durrell, R., Ainsworth, M., Lowry, D., and Fairchild, I. J.: Methane in underground air in Gibraltar karst, Earth Planet. Sc. Lett., 374, 71–80, https://doi.org/10.1016/j.epsl.2013.05.011, 2013.
Météo-France: Meteorological station 13022003, La Gardiole, Cassis (Dataset), Météo-France [data set], https://donneespubliques.meteofrance.fr/FichesClim/FICHECLIM_13022003.pdf (last access: 27 August 2024), 2023.
Météo-France: Open-acces Meteorological data, Météo-France [data set], https://www.data.gouv.fr/fr/datasets/r/5669e5be-8c67-4fbf-aeae-08cbc2369dd4, last access: 29 August 2024.
Mohammed Oludare, I. and Pradhan, B.: A decade of modern cave surveying with terrestrial laser scanning: A review of sensors, method and application development, Int. J. Speleol., 45, 71–88, https://doi.org/10.5038/1827-806X.45.1.1923, 2016.
Monteith, J. L. and Unsworth, M. H. (Eds.): Principles of Environmental Physics, in: Principles of Environmental Physics (Fourth Edition), Academic Press, Boston, https://doi.org/10.1016/B978-0-12-386910-4.00019-6, 2013.
Olive, M. and Vanrell, L.: La caverne et ses différents espaces, Dossiers d'Archéologie, Faton, 408, 26–29, 2021.
Pawlowicz, R., Beardsley, B., and Lentz, S.: Classical tidal harmonic analysis including error estimates in MATLAB using T_TIDE, Comput. Geosci., 28, 929–937, https://doi.org/10.1016/S0098-3004(02)00013-4, 2002.
Pellet, H.: Mesoscale permeability variations, GitLab [code], https://gitlab.osupytheas.fr/hpellet/chapitre-3-mesoscale-permeability-variations, last access: 27 August 2024.
Perrier, F., Richon, P., Gautam, U., Tiwari, D. R., Shrestha, P., and Sapkota, S. N.: Seasonal variations of natural ventilation and radon-222 exhalation in a slightly rising dead-end tunnel, J. Environ. Radioactiv., 97, 220–235, https://doi.org/10.1016/j.jenvrad.2007.06.003, 2007.
Peyraube, N., Lastennet, R., Villanueva, J. D., Houillon, N., Malaurent, P., and Denis, A.: Effect of diurnal and seasonal temperature variation on Cussac cave ventilation using CO2 assessment, Theor. Appl. Climatol., 129, 1045–1058, https://doi.org/10.1007/s00704-016-1824-8, 2016.
Peyraube, N., Lastennet, R., Denis, A., Malaurent, P., Houillon, N., and Villanueva, J. D.: Determination and quantification of major climatic parameters influencing the CO2 of Lascaux Cave, Theor. Appl. Climatol., 133, 1291–1301, https://doi.org/10.1007/s00704-017-2255-x, 2018.
Quindos, L. S., Bonet, A., Diaz-Caneja, N., Fernandez, P. L., Gutierrez, I., Solana, J. R., Soto, J., and Villar, E.: Study of the environmental variables affecting the natural preservation of the Altamira Cave paintings located at Santillana del Mar, Spain, Atmos. Environ., 21, 551–560, https://doi.org/10.1016/0004-6981(87)90037-0, 1987.
Richon, P., Perrier, F., Sabroux, J.-C., Trique, M., Ferry, C., Voisin, V., and Pili, E.: Spatial and time variations of radon-222 concentration in the atmosphere of a dead-end horizontal tunnel, J. Environ. Radioactiv., 78, 179–198, https://doi.org/10.1016/j.jenvrad.2004.05.001, 2005.
Sainz, C., Rábago, D., Celaya, S., Fernández, E., Quindós, J., Quindós, L., Fernández, A., Fuente, I., Arteche, J. L., and Quindós, L. S.: Continuous monitoring of radon gas as a tool to understand air dynamics in the cave of Altamira (Cantabria, Spain), Sci. Total Environ., 624, 416–423, https://doi.org/10.1016/j.scitotenv.2017.12.146, 2018.
Sartoretto, S., Collina-Girard, J., Laborel, J., and Morhange, C.: Quand la Grotte Cosquer a-t-elle été fermée par la montée des eaux?, Méditerranée, 82, 21–24, https://doi.org/10.3406/medit.1995.2897, 1995.
SHOM: Total sea forecast from daily simulations of the Wavewatch III ® wave model, SHOM [data set], https://data.shom.fr/ (last access: 27 August 2024), 2024.
SNO KARST: Time series of type climatology-meteorology-atmosphere in Port-Miou basin – PORT-MIOU observatory – KARST observatory network – OZCAR Critical Zone network Research Infrastructure, OSU OREME [data set], https://doi.org/10.15148/4140d06c-fa31-4b4c-8c0f-38e6d0c62fbc, 2021.
SNO KARST: Time series of type climatology-meteorology-atmosphere in Port-Miou basin – PORT-MIOU observatory – KARST observatory network – OZCAR Critical Zone network Research Infrastructure, OSU OREME [data set], https://doi.org/10.15148/4140d06c-fa31-4b4c-8c0f-38e6d0c62fbc, 2021.
Touron, S. and Frouin, M.: Grotte d'Oulen ou Baume d'Oullins, date de protection 19/01/1911, Travaux en vue de l'isolation de la Salle 2 (Note scientifique No. GO-22-10), LRMH, Champs-sur-Marne, p. 4, https://www.lrmh.fr/search.aspx?SC=DEFAULT&QUERY=GO-22-10&QUERY_LABEL=#/Detail/(query:(Id:'0',Index:1,NBResults:2,PageRange:3,SearchQuery:(CloudTerms:!(),FacetFilter:%7B%7D,ForceSearch:!t,InitialSearch:!f,Page:0,PageRange:3,QueryGuid:'4f73bcab-090e-4473-9328-1f3e8920a786',QueryString:'Grotte%20d!'oulen',ResultSize:10,ScenarioCode:DEFAULT,ScenarioDisplayMode:display-standard,SearchGridFieldsShownOnResultsDTO:!(),SearchLabel:'',SearchTerms:'Grotte%20d%20oulen',SortField:YearOfPublication_int_sort,SortOrder:0,TemplateParams:(Scenario:'',Scope:Default,Size:!n,Source:'',Support:'',UseCompact:!f),UseSpellChecking:!n),TemplateParams:(Scenario:'',Scope:Default,Size:!n,Source:'',Support:'',UseCompact:!f))) (last access: 27 August 2024), 2022.
Touron, S., Frouin, M., Bousta, F., François, A., and Leplat, J.: Grotte du Pech-Merle – Bilan sanitaire (No. GO-19-13), LRMH, Champs-sur-Marne, p. 15, https://www.lrmh.fr/search.aspx?SC=DEFAULT&QUERY=GO-22-10&QUERY_LABEL=#/Detail/(query:(Id:'0_OFFSET_0',Index:1,NBResults:84,PageRange:3,SearchQuery:(CloudTerms:!(),FacetFilter:%7B%7D,ForceSearch:!t,InitialSearch:!f,Page:0,PageRange:3,QueryGuid:'84634ac0-5f75-4f8c-aee8-7782bb4feab0',QueryString:Pech-Merle,ResultSize:10,ScenarioCode:DEFAULT,ScenarioDisplayMode:display-standard,SearchGridFieldsShownOnResultsDTO:!(),SearchLabel:'',SearchTerms:'Pech%20Merle',SortField:YearOfPublication_int_sort,SortOrder:0,TemplateParams:(Scenario:'',Scope:Default,Size:!n,Source:'',Support:'',UseCompact:!f),UseSpellChecking:!n))) (last access: 27 August 2024), 2019.
Trefry, M. G. and Johnston, C. D.: Pumping Test Analysis for a Tidally Forced Aquifer, Ground Water, 36, 427–433,, https://doi.org/10.1111/j.1745-6584.1998.tb02813.x, 1998.
Valladas, H., Tisnérat-Laborde, N., Cachier, H., Arnold, M., de Quirós, F. B., Cabrera-Valdés, V., Clottes, J., Courtin, J., Fortea-Pérez, J. J., Gonzáles-Sainz, C., and Moure-Romanillo, A.: Radiocarbon AMS Dates for Paleolithic Cave Paintings, Radiocarbon, 43, 977–986, https://doi.org/10.1017/S0033822200041643, 2001.
Valladas, H., Quiles, A., Delque-Kolic, M., Kaltnecker, E., Moreau, C., Pons-Branchu, E., Vanrell, L., Olive, M., and Delestre, X.: Radiocarbon Dating of the Decorated Cosquer Cave (France), Radiocarbon, 59, 621–633, https://doi.org/10.1017/RDC.2016.87, 2017.
Vouvé, J., Malaurent, P., and Brunet, J.: Caractérisation physique et environnementale d'un sanctuaire préhistorique sous-marin, semi-noyé et orné préalablement à l'élaboration d'une démarche conservatoire. Cas de la grotte Cosquer, France, Comptes rendus de l'Académie des sciences, Sciences de la Terre et des planètes, 322, 935–942, 1996.
Weeks, E. P.: Field Determination of Vertical Permeability to Air in the Unsaturated Zone, Geological survey professional paper No. 1051, US departement of the interior, USA, https://doi.org/10.3133/pp1051, 1978.
Xia, Y., Li, H., and Wang, L.: Tide-Induced Air Pressure Fluctuations in a Coastal Unsaturated Zone: Effects of Thin Low-Permeability Pavements, Ground Water Monit. Remed., 31, 40–47, https://doi.org/10.1111/j.1745-6592.2011.01322.x, 2011.
Zhang, H.: Characterization of a multi-layer karst aquifer through analysis of tidal fluctuation, J. Hydrol., 601, 126677, https://doi.org/10.1016/j.jhydrol.2021.126677, 2021.
Zimmerman, R. W. and Bodvarsson, G. S.: Hydraulic conductivity of rock fractures, Trans. Porous Media, 23, 1–30, https://doi.org/10.1007/bf00145263, 1996.
- Abstract
- Introduction
- Study site and data
- Cosquer Cave hydroclimate
- Model
- Results
- Discussion
- Summary and conclusion
- Appendix A: Tide filter
- Appendix B: Uncertainty calculation
- Code and data availability
- Author contributions
- Competing interests
- Disclaimer
- Acknowledgements
- Financial support
- Review statement
- References