the Creative Commons Attribution 4.0 License.
the Creative Commons Attribution 4.0 License.
 | 28 Aug 2024
Thermal regime of High Arctic tundra ponds, Nanuit Itillinga (Polar Bear Pass), Nunavut, Canada
Kathy L. Young
This study evaluates the seasonal and inter-seasonal temperature regime of small tundra ponds ubiquitous to an extensive, low-gradient wetland in the Canadian High Arctic. Pond temperatures can modify evaporation and ground thaw rates, impact losses of greenhouse gases, and control the timing and emergence of insects and larvae critical for migratory-bird feeding habits. We focus our study on thaw ponds with a range of hydrologic linkages and sizes across Nanuit Itillinga, formerly known as Polar Bear Pass (PBP), Bathurst Island, and compare their thermal signals to other Arctic ponds. Pond temperatures and water levels were evaluated using temperature and water level loggers and verified by regular manual measurements. Other environmental data collected included microclimate, frost table depths, and water conductivity. Our results show that there is much variability in pond thermal regimes over seasons, years, and space. Cumulative relative pond temperatures were similar across years, with ponds normally reaching 10–15 °C for short to longer periods, except in 2013, which experienced a cold summer season during which pond temperatures never exceeded 5 °C. Pond frost tables and water conductivities respond to variable substrate conditions and pond thermal patterns. This study contributes to the ongoing discussion on climate warming and its impact on Arctic landscapes.
- Article
(11293 KB) - Full-text XML
-
Supplement
(675 KB) - BibTeX
- EndNote


Arctic landscapes are warming faster than temperate locations (e.g., Linderholm et al., 2018; Sim et al., 2019; Kreplin et al., 2021; McCrystall et al., 2021; Webb et al., 2022), specifically, up to 4 times faster than the global average since 1979 (Rantanen et al., 2022). This rapid warming has implications for the thawing of permafrost, alteration of hydrologic regimes (snow-on/snow-off, ice-free duration, and runoff), changes in hydrologic pathways, and a suite of other environmental and ecosystem impacts (e.g., Webb et al., 2022). There is an expectation that the Arctic will transition from a snow-dominated to a rainfall-dominated regime, especially with an occurrence of higher rainfall in the fall (McCrystall et al., 2021), and some suggest that it will occur earlier than initially modeled (McCrystall et al., 2021).
Recently, there has also been a suite of studies and literature reviews evaluating the warming of water bodies (e.g., ponds, lakes, and streams) across Arctic landscapes (e.g., Dranga et al., 2017; Lehnherr et al., 2018; McEwen and Butler, 2018; Saros et al., 2023) and elsewhere (e.g., small ponds in Alaska – Andresen and Lougheed, 2015; wetlands in the high Andes – Dangles et al., 2017; ponds and lakes in western Greenland – Higgens et al., 2019). Saros et al. (2023) remark that “knowing temperatures and thermal structure within lakes and flowing waters at present and predicting their changes in the future is critical for understanding how aquatic ecosystems will undergo future changes”. Other researchers, particularly in the sub-Arctic, are concerned with deepening talik development (unfrozen ground) and lake expansion due to the interactions of shoreline erosion, rising lake bottom temperatures, and the occurrence of deep snow near lake and pond shorelines (Roy-Leveillee and Burn, 2017).
In the Eastern Canadian Arctic, warming has been especially prominent since 2000, with a growing loss of glacier ice; permafrost thaw; disappearance of late-lying snow beds; and the drying of small, patchy wetlands (Woo and Young, 2014). There has been a growing interest in how climate warming will affect northern wetlands here, because temperature increases can enhance evaporation rates, thaw permafrost, drain ponds, or initiate the development of new ponds. Warmer substrates can increase the thaw depth of water bodies, and temperature has an impact on vegetation growth and greenhouse gases, including water vapor, methane, and carbon dioxide (Negandhi et al., 2013; Andresen and Lougheed, 2015; Wrona et al., 2016; Zandt et al., 2020; Kreplin et al., 2021; Dyke and Sladen, 2022; Miner et al., 2022; Rehder et al., 2023). This study of pond thermal regimes at Polar Bear Pass (PBP) adds to this body of literature by evaluating the seasonal and inter-seasonal temperature regime of small tundra ponds ubiquitous to an extensive, low-gradient wetland in the Canadian High Arctic spanning warm and cool spring and summer.
First, we examine the spatial and temporal variability in pond temperatures across PBP, highlighting variations in pond location, hydrological linkages, and response to climate variability on a seasonal and annual basis. We then evaluate whether the July average pond temperatures vary across ponds at PBP and in relation to other Arctic sites. This study also examines the air–pond temperature relationship, and we explore the impact of pond temperatures on the local environment in terms of pond ground thaw and water chemistry (i.e., specific conductivity), given that others have reported deeper thaw in warmer water bodies and higher nutrient loads (e.g., Saros et al., 2023). Finally, we place our results in the context of other studies, discuss how these ponds are affected by both cool and warm seasons, and outline what can be expected in the future for these ponds and the ecosystems that depend on them.
The study took place in the extensive, low-lying Nanuit Itillinga (Polar Bear Pass – PBP) wetland, Nunavut (Bathurst Island; 75.72° N, 98.67° W), from 2007 to 2015. Detailed pond studies occurred here in 2008 and 2009. PBP is a National Wildlife Area and a Ramsar wetland site of international importance (Baker et al., 2021). The wetland itself is about 20 km long and 5 km wide and is boarded by low-lying hills ranging upwards of 160 m to the north and upwards of 170 m to the south (Caledonian River, District of Franklin, NWT, 1985 topographic map, 1:50 000, 68H/11, edition 1). The low-lying wetland encompasses two small lakes and a myriad of ponds (small to large) exhibiting uniform or irregular shapes (Fig. 1). Detailed characteristics of the PBP watershed and study ponds can be found elsewhere (e.g., Abnizova, 2013; Abnizova et al., 2014; Young et al., 2017); however, we do provide a summary of the study ponds, including the location, pond area, water, and frost table depths, and details of the pond substrate where available (Table S1 and Fig. S1 in the Supplement). Overall, we had 17 study ponds in 2007, 25 ponds in 2008, 23 ponds in 2009, 25 ponds in 2010, 2 ponds in 2012, and only 1 pond in 2013 and 2015. No pond work was carried out in 2011 owing to medical issues. Pond surface areas varied from approximately 275 to 31 400 m2, and water levels fell between 60 and 359 mm (Table S1). Where available, pond substrates ranged from gray to dark greyish brown and consisted of fines to coarse sand. Soil tests in 2009 did not fully capture the rocky substrate that existed for some ponds (e.g., Pond 11; see Table S1 and Fig. S1).
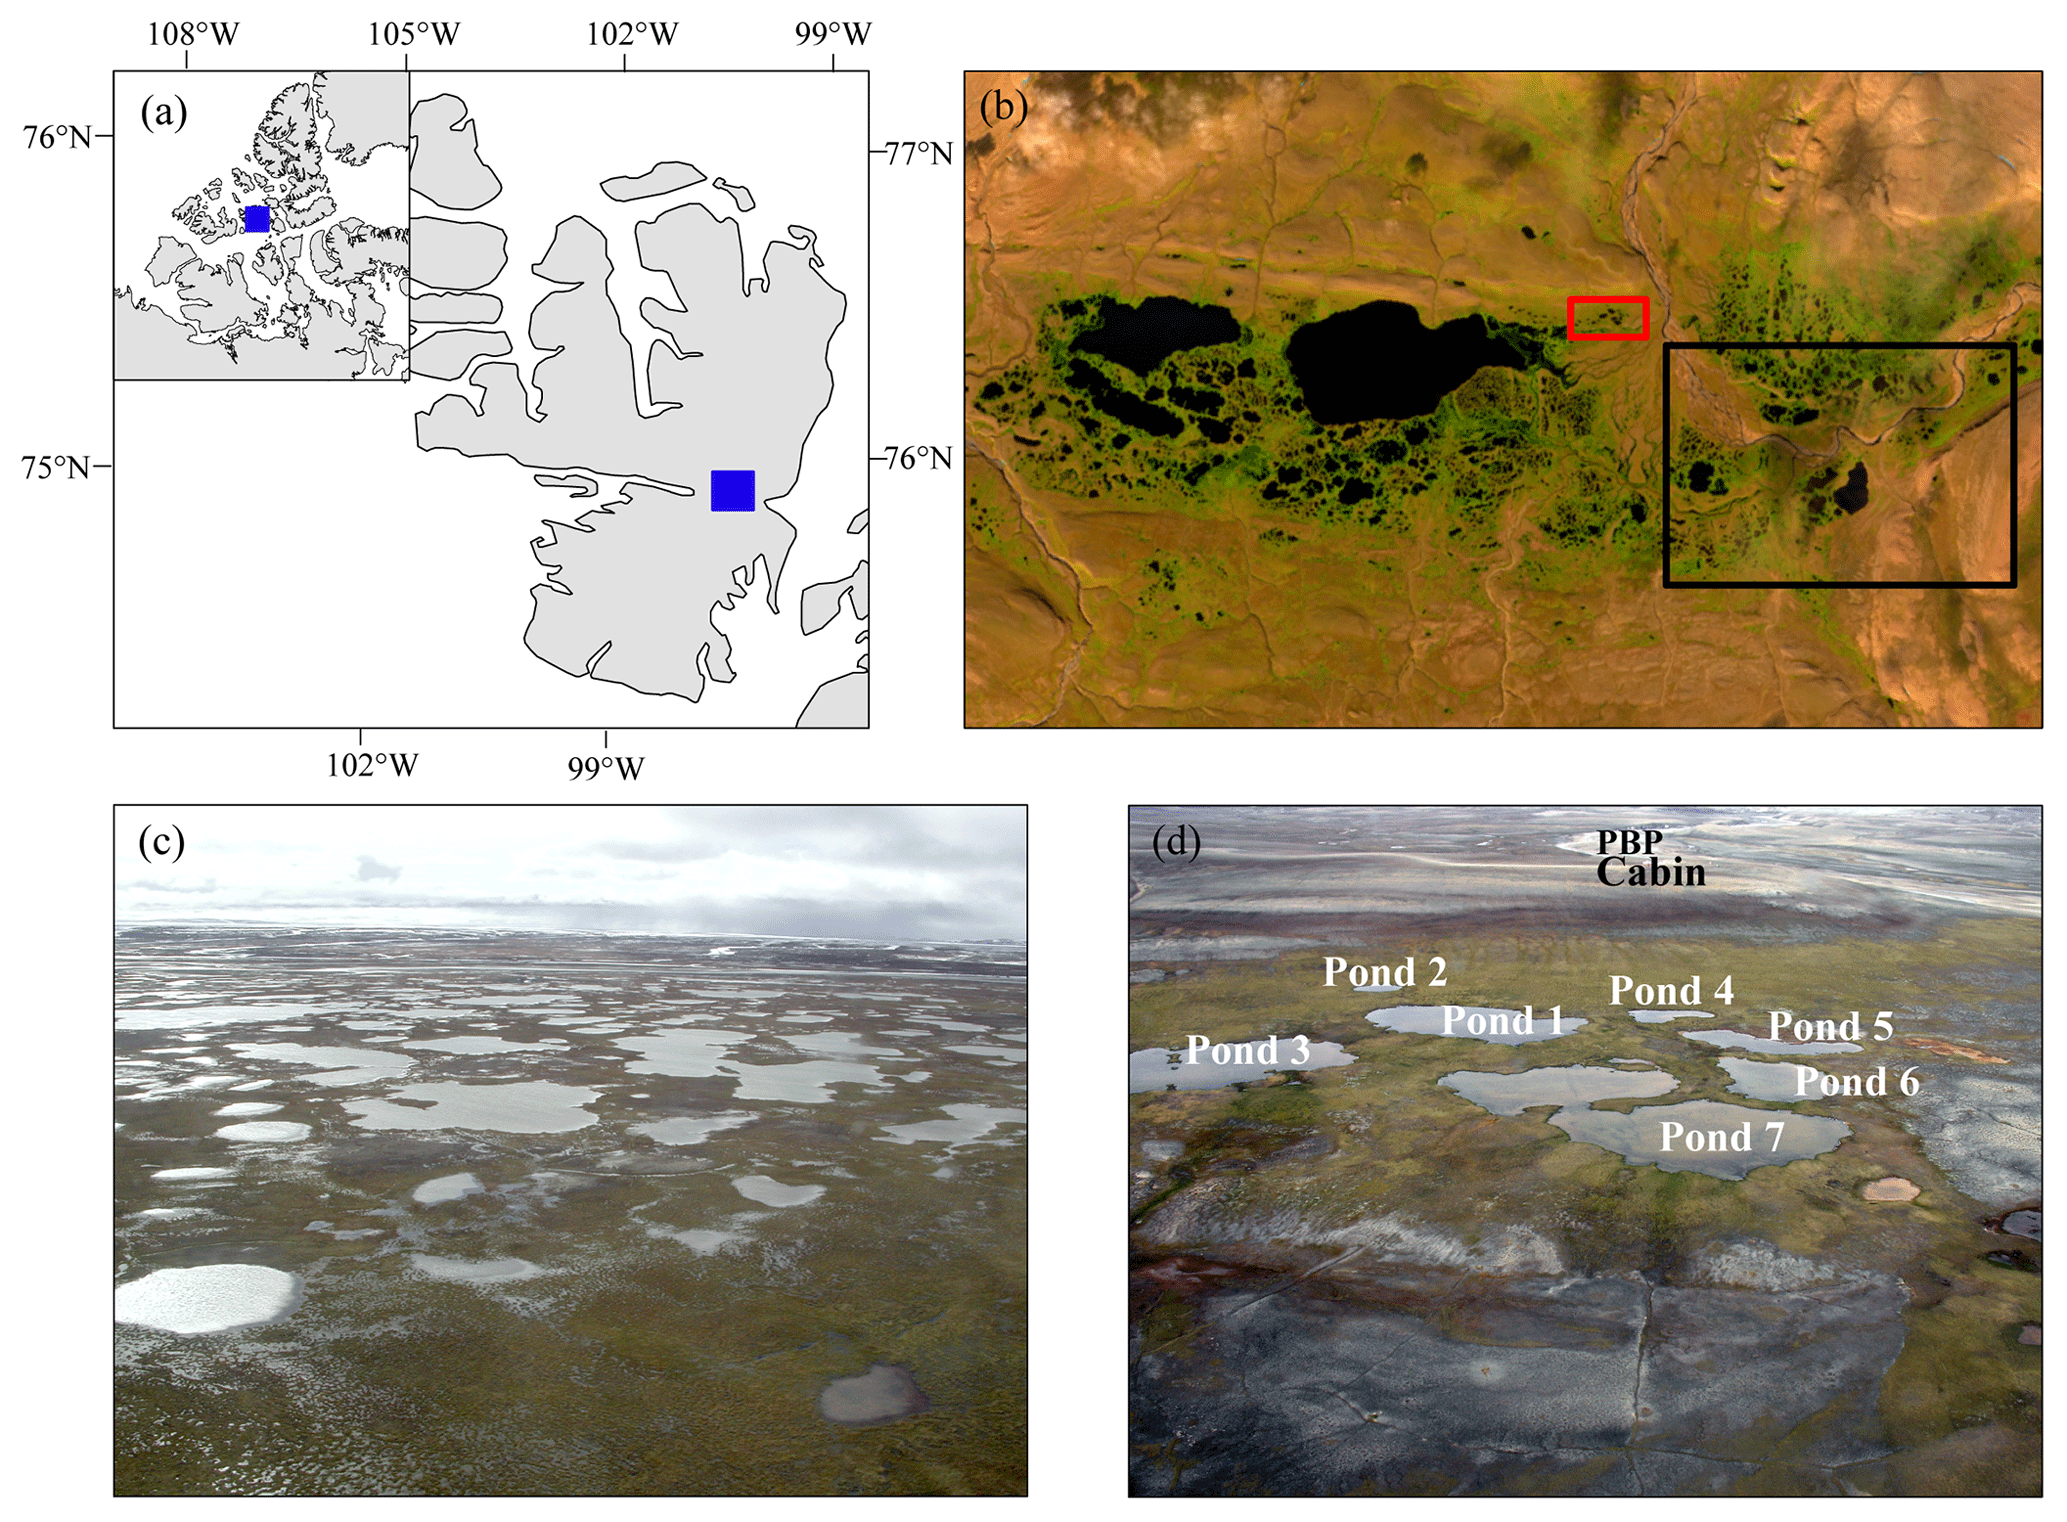
Figure 1(a) Location of the PBP catchment on Bathurst Island, Nunavut. (b) Satellite imagery of the eastern and central lowland area: an aerial photo showing the wetland with numerous ponds and upland areas. Panel (c) presents the area indicated by the black box in panel (b). (d) Aerial photo of the general area indicated by the red box in panel (b), showing the central ponds. The photo in panel (c) was taken on 10 July 2009, whereas the photo in panel (d) was taken on 16 July 2008. Satellite imagery was obtained from EOS LandViewer (https://eos.com, last access: 4 January 2023): Sentinel-2 Level 2A; bands 11, 8A, and 2; 6 September 2022.
We describe the thermal regime of selected ponds (small to large) across PBP: some centrally located ponds as well as other ponds situated at the eastern, western, and southern edges of the wetland. Some ponds are isolated (i.e., no apparent water sources feed into them), whereas other ponds are connected or temporarily connected to small creeks, other ponds, and/or meltwater from nearby late-lying snow beds (Abnizova et al., 2014). Ponds at PBP are defined as having a maximum water depth of <2.0 m (National Wetland Working Group, 1997; Woo, 2012). The pond substrate type varied: some pond bottoms were firm and light in color, whereas others had rocky or dark, soft organic beds (see Table S1 and Fig. S1). Water levels in the ponds were continuously monitored with Ecotone water level recorders (Remote Data Systems Inc., ±2.54 mm) or with HOBO water level sensors (±3 mm), which also measured temperature (±0.2 °C) on an hourly basis. These sensors were typically placed in the center of the pond in perforated, screened water wells (5.1 to 7.6 cm diameter) open to the atmosphere and secured into frozen ground. In ponds that were difficult to access due to a soft substrate, water wells and HOBO sensors were placed near the shoreline; these sensors were also occasionally placed on the pond bed, particularly in remote ponds. Moreover, HOBO water level sensors were placed in dry wells dug into wet meadow areas to monitor the atmospheric pressure. The difference in the pressure determined by HOBO water level sensors in the ponds and the atmosphere allowed pond water levels (mm) to be derived (see Rosenberry and Hayashi, 2013). Like other shallow Arctic ponds, the study ponds were generally well mixed, negating any concern about significant differences in the temperatures of the bed and the water column (Dyke and Sladen, 2022).
Manual measurements of water levels at centrally located ponds were made on a regular basis, usually every 1 to 2 d, with a measuring tape (±5 mm) to verify continuous measurements. Less-frequent manual measurements were made at distant ponds. Small HOBO temperature sensors (±0.1 °C) were also deployed in ponds to track hourly temperatures. Manual estimates of temperature and conductivity were made with a YSI conductivity meter (±0.2 °C, ±1 µS cm−1), while a Hanna pH meter provided an additional check on temperature (±0.2 °C) along with water pH (±0.2). In 2008, hourly estimates of water chemistry, including water level (m), temperature (±0.15 °C), conductivity (±1.0 µS cm−1), dissolved oxygen (%), and pH (±0.2), were made over several days in the selected ponds using a YSI 600 multiparameter sonde (Abnizova et al., 2014). In 2009, the YSI sonde was also used to obtain manual estimates of water chemistry in several centrally located ponds. In 2012, pH and conductivity were monitored in Pond 1 at an hourly interval over several days.
To examine generalized patterns of spatial and temporal trends between air and pond temperatures, Pearson correlations (r) of pond to air temperatures (2008 and 2009) were determined for daily mean temperatures >0 °C (Johnson et al., 2014). To investigate inter-site correlations, water temperatures at Pond 1 were evaluated in relation to other ponds. A Student t test (α=0.05) was used to compare means of pond water temperature (Tw), when appropriate, in the study (Bluman, 2006). We also utilize cumulative percentage diagrams and box plots to provide insights into the overall distribution, concentration, and variation of pond thermal data (see https://www150.statcan.gc.ca/n1/edu/power-pouvoir/ch10/5214864-eng.htm, last access: 24 August 2024).
Changes in ground thaw can alter drainage patterns and water storage in ponds (Young and Woo, 2003; Rehder et al., 2023). Thaw depth in ponds was measured by probing the ground with a metal rod (±10 mm) twice a week near water wells early in the season and then weekly once ground thaw slowed, providing a means of assessing active-layer development and refreeze (i.e., 2008 and 2009) (Abnizova et al., 2014). Climate data (e.g., air temperature) were obtained from the main automatic weather station located near the PBP cabin situated on the plateau above the wetland (for additional details on instrumentation, sensor siting, and frequency of monitoring, the reader is referred to Young and Labine, 2010; Young et al., 2013; Miller and Young, 2016). These data allowed us to examine the air temperature–pond response; they also allowed us to place our results in context of the variable spring and summer conditions over several years at PBP and to relate our findings to the nearest government weather station at Resolute Bay (Qausuittuq), Cornwallis Island (Nunavut; 74.72° N, 94.97° W), about 146 km to the southwest.
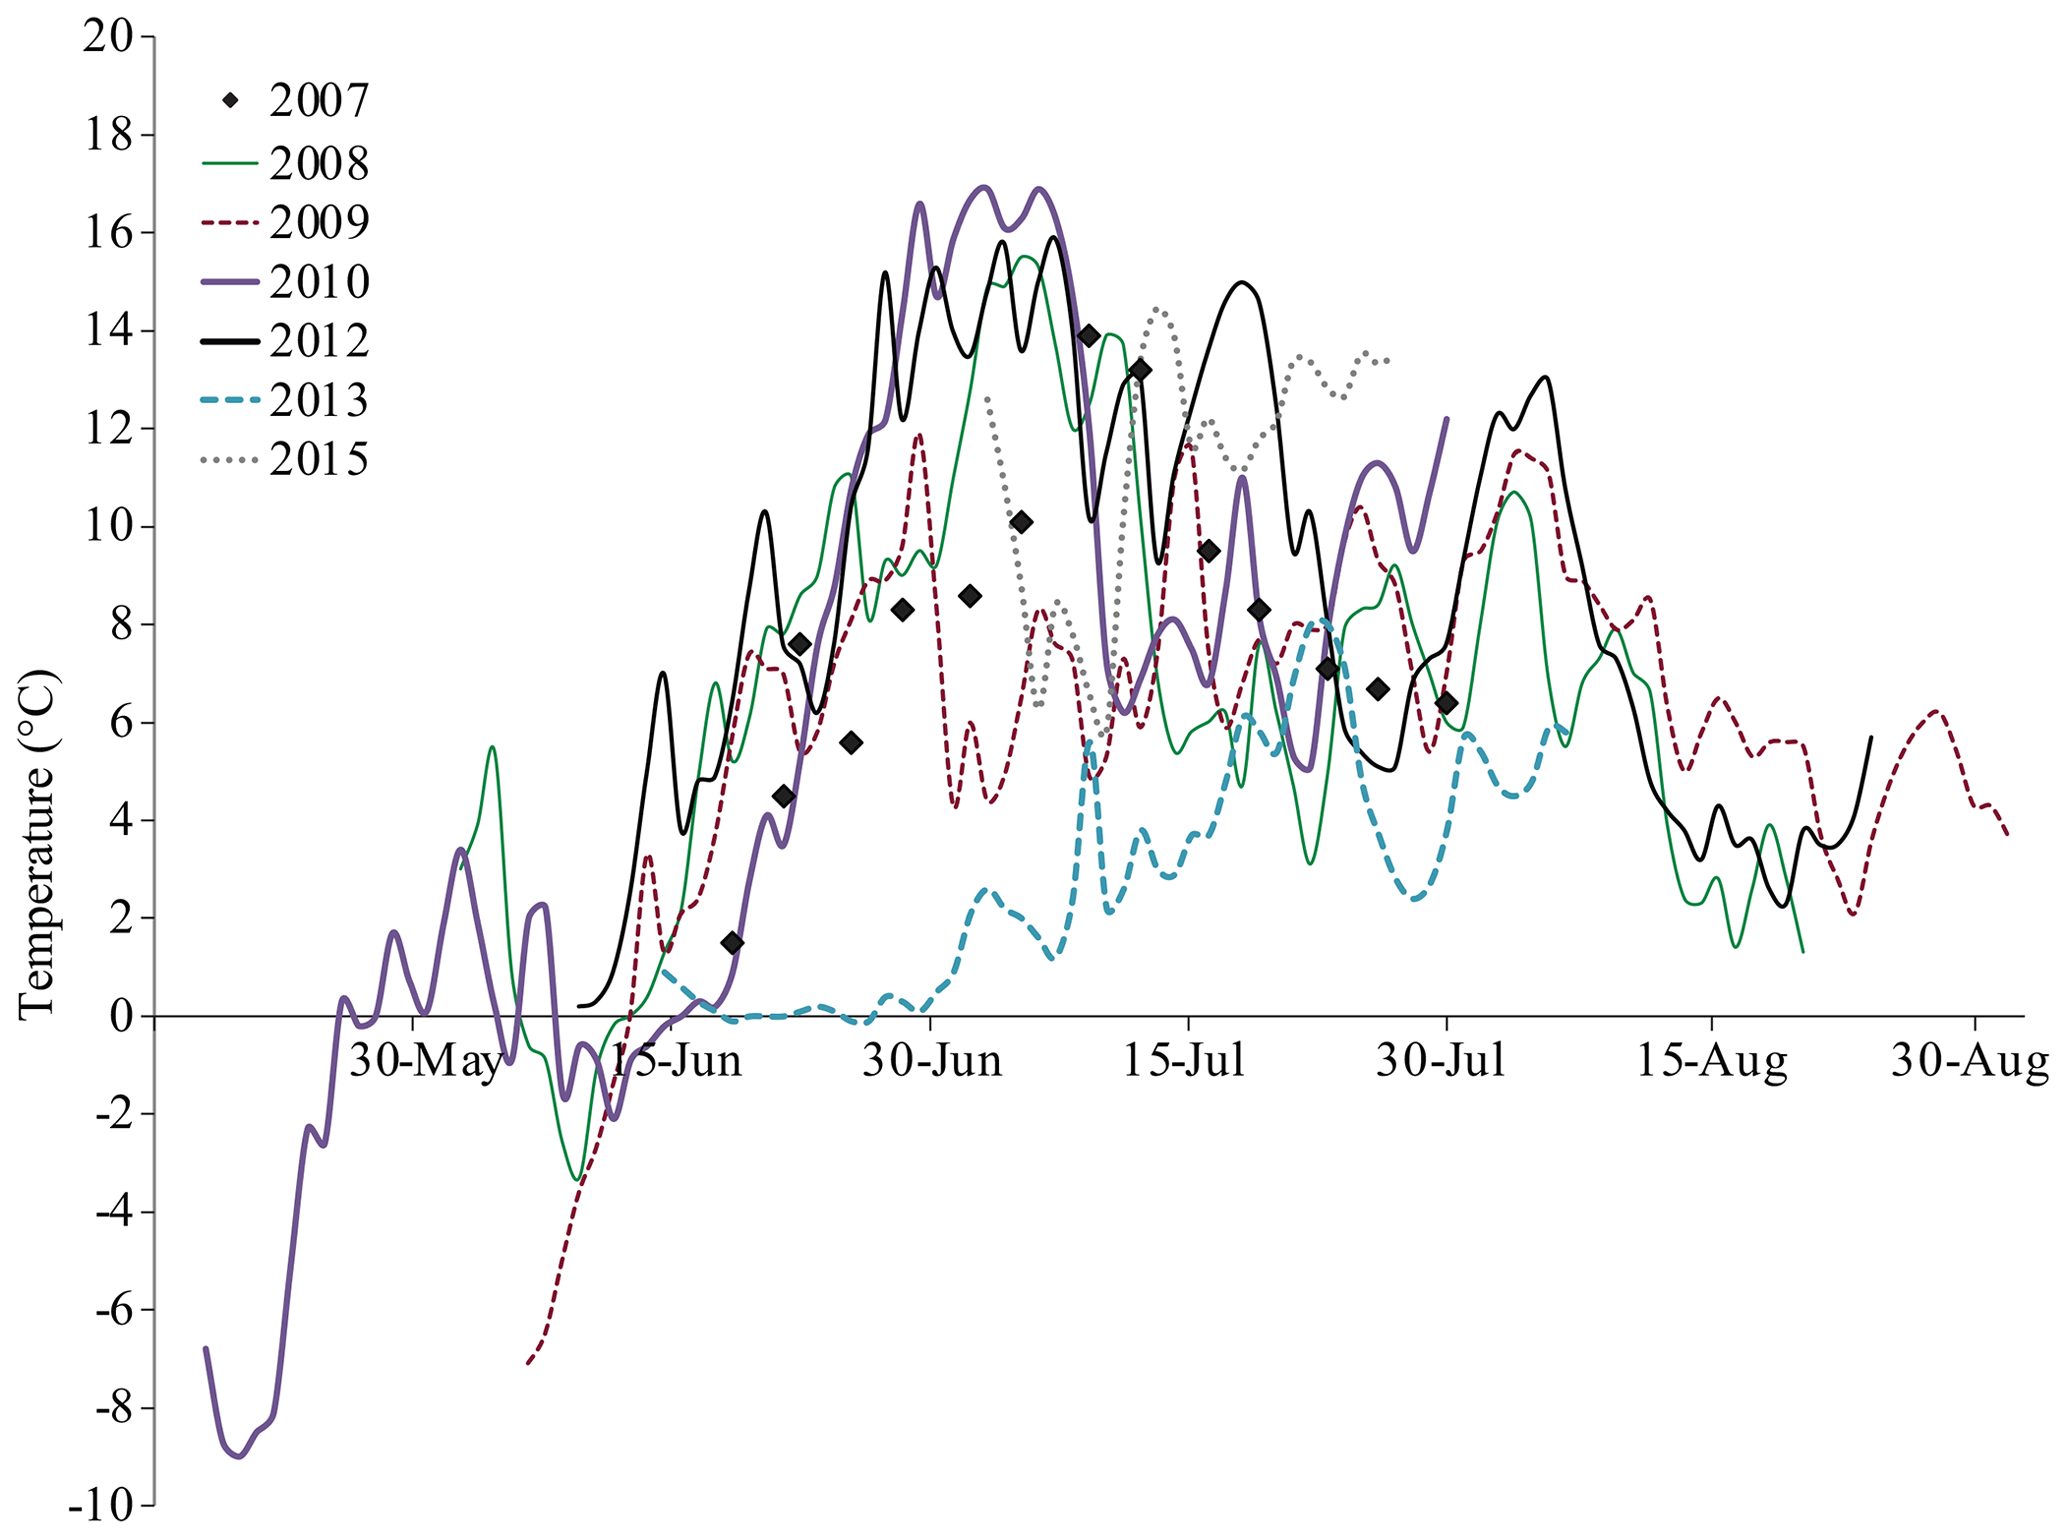
Figure 2Seasonal regime of water temperature (Tw) at Pond 1, PBP, from 2007 to 2015. Manual measurements for 2007 and daily averages for 2008–2015 are plotted.
4.1 Seasonal thermal regime
The seasonal regime of ponds at PBP over several years was explored using the detailed data from Pond 1 (2007–2015; Fig. 2). It is a medium-sized pond downslope of a wet meadow and lingering deep snow bed located in the lee of a hillslope (Young et al., 2017). The diagram also illustrates the range of pond temperatures during 2 extreme years (2012, warm, vs. 2013, cool). In warm years (e.g., 2010 and 2012), pond water temperatures warm rapidly by mid-June, with peak pond temperatures reaching about 15 °C for extended periods. There is considerable year-to-year variability, but the general trend is warming in June, elevated temperatures in July, and falling temperatures in August. In the context of Resolute air temperatures from 1948 to 2015 (Environment Canada (Resolute): https://weather.gc.ca, last access: 24 August 2024), the 2012 June–July–August (JJA) air temperature (4.6 °C) was the second highest on record, whereas the 2013 JJA average (0.9 °C) was one of the coolest (ranked 11th coolest, along with 3 other years) over a period of 68 years.
Figure 3 indicates that Pond 1 and the centrally located ponds show similar seasonal cycles. Pond temperatures (Tw) are generally higher than the air temperature during the thaw season, when temperatures are >0 °C, with most also trending with the air temperature signal. This pattern suggests well-mixed conditions, as noted for shallow ponds elsewhere in the Arctic (Dyke and Sladen, 2022). In 2009, the Pond 1 Tw correlated well with all pond temperatures (r>0.8 to >0.9), including those at the periphery of PBP (east, west, and south). In 2008, a similar pattern between Pond 1 and the other ponds across the wetland emerged (r>0.8 to >0.9), except for Meadow Pond (r=0.34, n=66, p=0.005). Meadow Pond is located in a small, elevated valley; unlike most ponds, it has deep residual snow beds lying on the adjacent slopes. The nearby Pingo Pond is not fed by the snow beds. Meltwater from lingering snow beds feeding Meadow Pond ensures that pond temperatures are dampened in comparison to more exposed and isolated wetland ponds. Others have observed this pattern on northeast Ellesmere Island (e.g., Smol and Douglas, 2007).
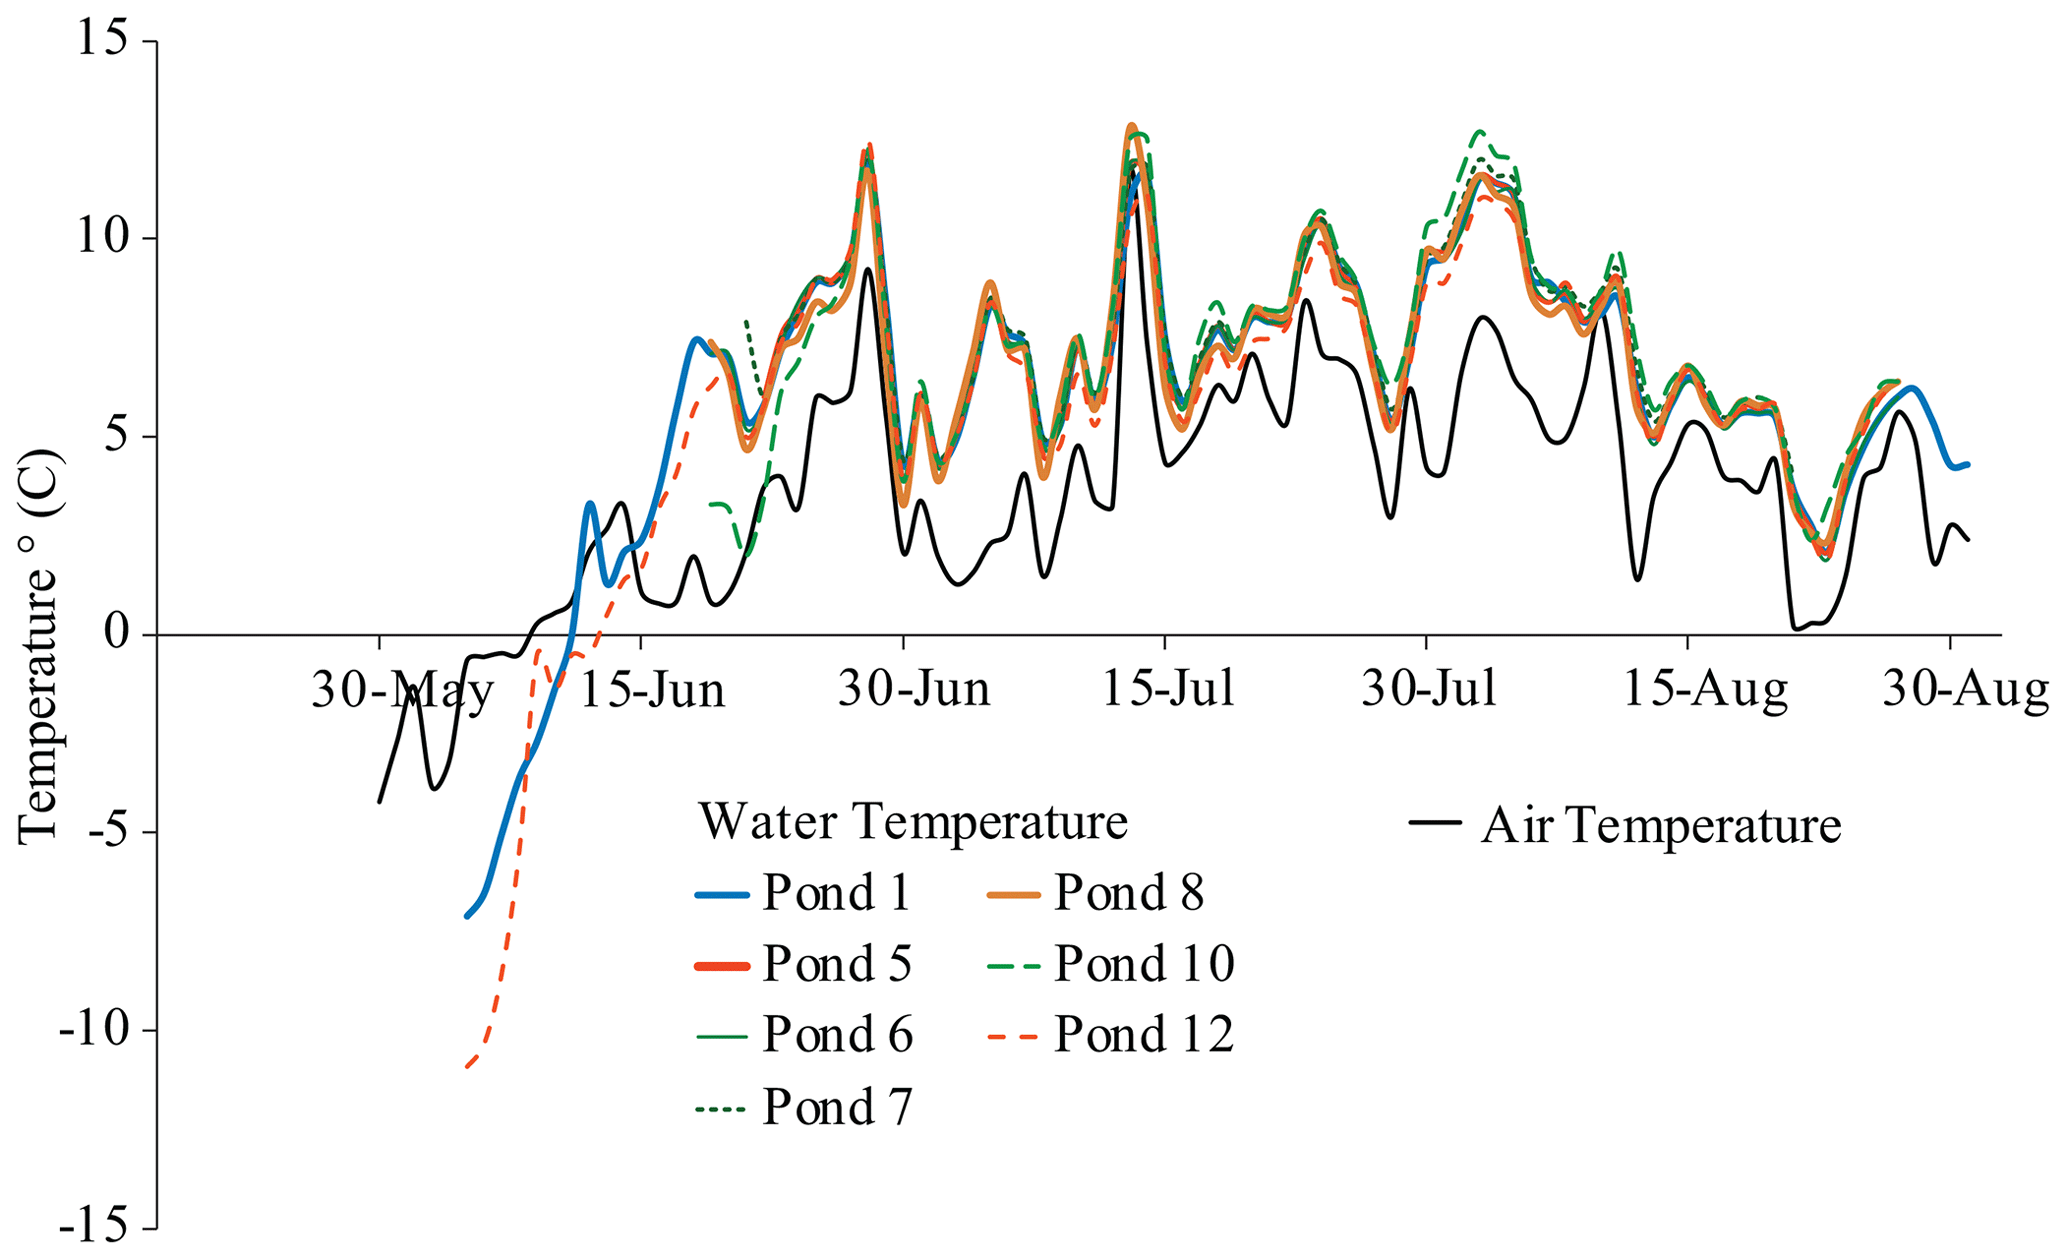
Figure 3Daily average water temperature of Pond 1 vs. other centrally located ponds at PBP in 2009. The daily average air temperature is also plotted.
Figure 4 illustrates the seasonal rhythm (2007, 2008, and 2009) of medium-sized ponds across PBP. Here, we select Pond 6 in the central cluster of ponds as representative of a medium-sized pond. In 2007, by 20 July, Pond 6 was slightly warmer than other two ponds, although the rhythms – peaks and troughs – of pond Tw remained similar. Warming is comparable to that seen to Fig. 2, where there is some year-to-year variation in Tw, although these ponds do not exceed 15 °C for prolonged periods. Young and Labine (2010) found that environmental conditions were slightly cooler in the eastern part of PBP owing to proximity to the Arctic Ocean, but the largest microclimatic discrepancies across PBP were related to differences in net radiation (surface albedo) and ground heat flux (substrate, vegetation, etc.). A Student t test (two-tailed, α=0.05) reveals that Pond 6's mean Tw (7.3 ± 2.3 °C, n=69) in 2008 was not significantly different from the East Medium Pond (7.6 ± 3.5 °C, n=68), but it was different from the West Medium Pond (6.6 ± 4.5 °C, n=77). In 2009, both the East Medium Pond (5.7 ± 3.8 °C, n=95) and the West Medium Pond (4.3 ± 5.5 °C, n=94) had significantly different mean water temperatures compared with Pond 6 (6.6 ± 4.5 °C, n=80).
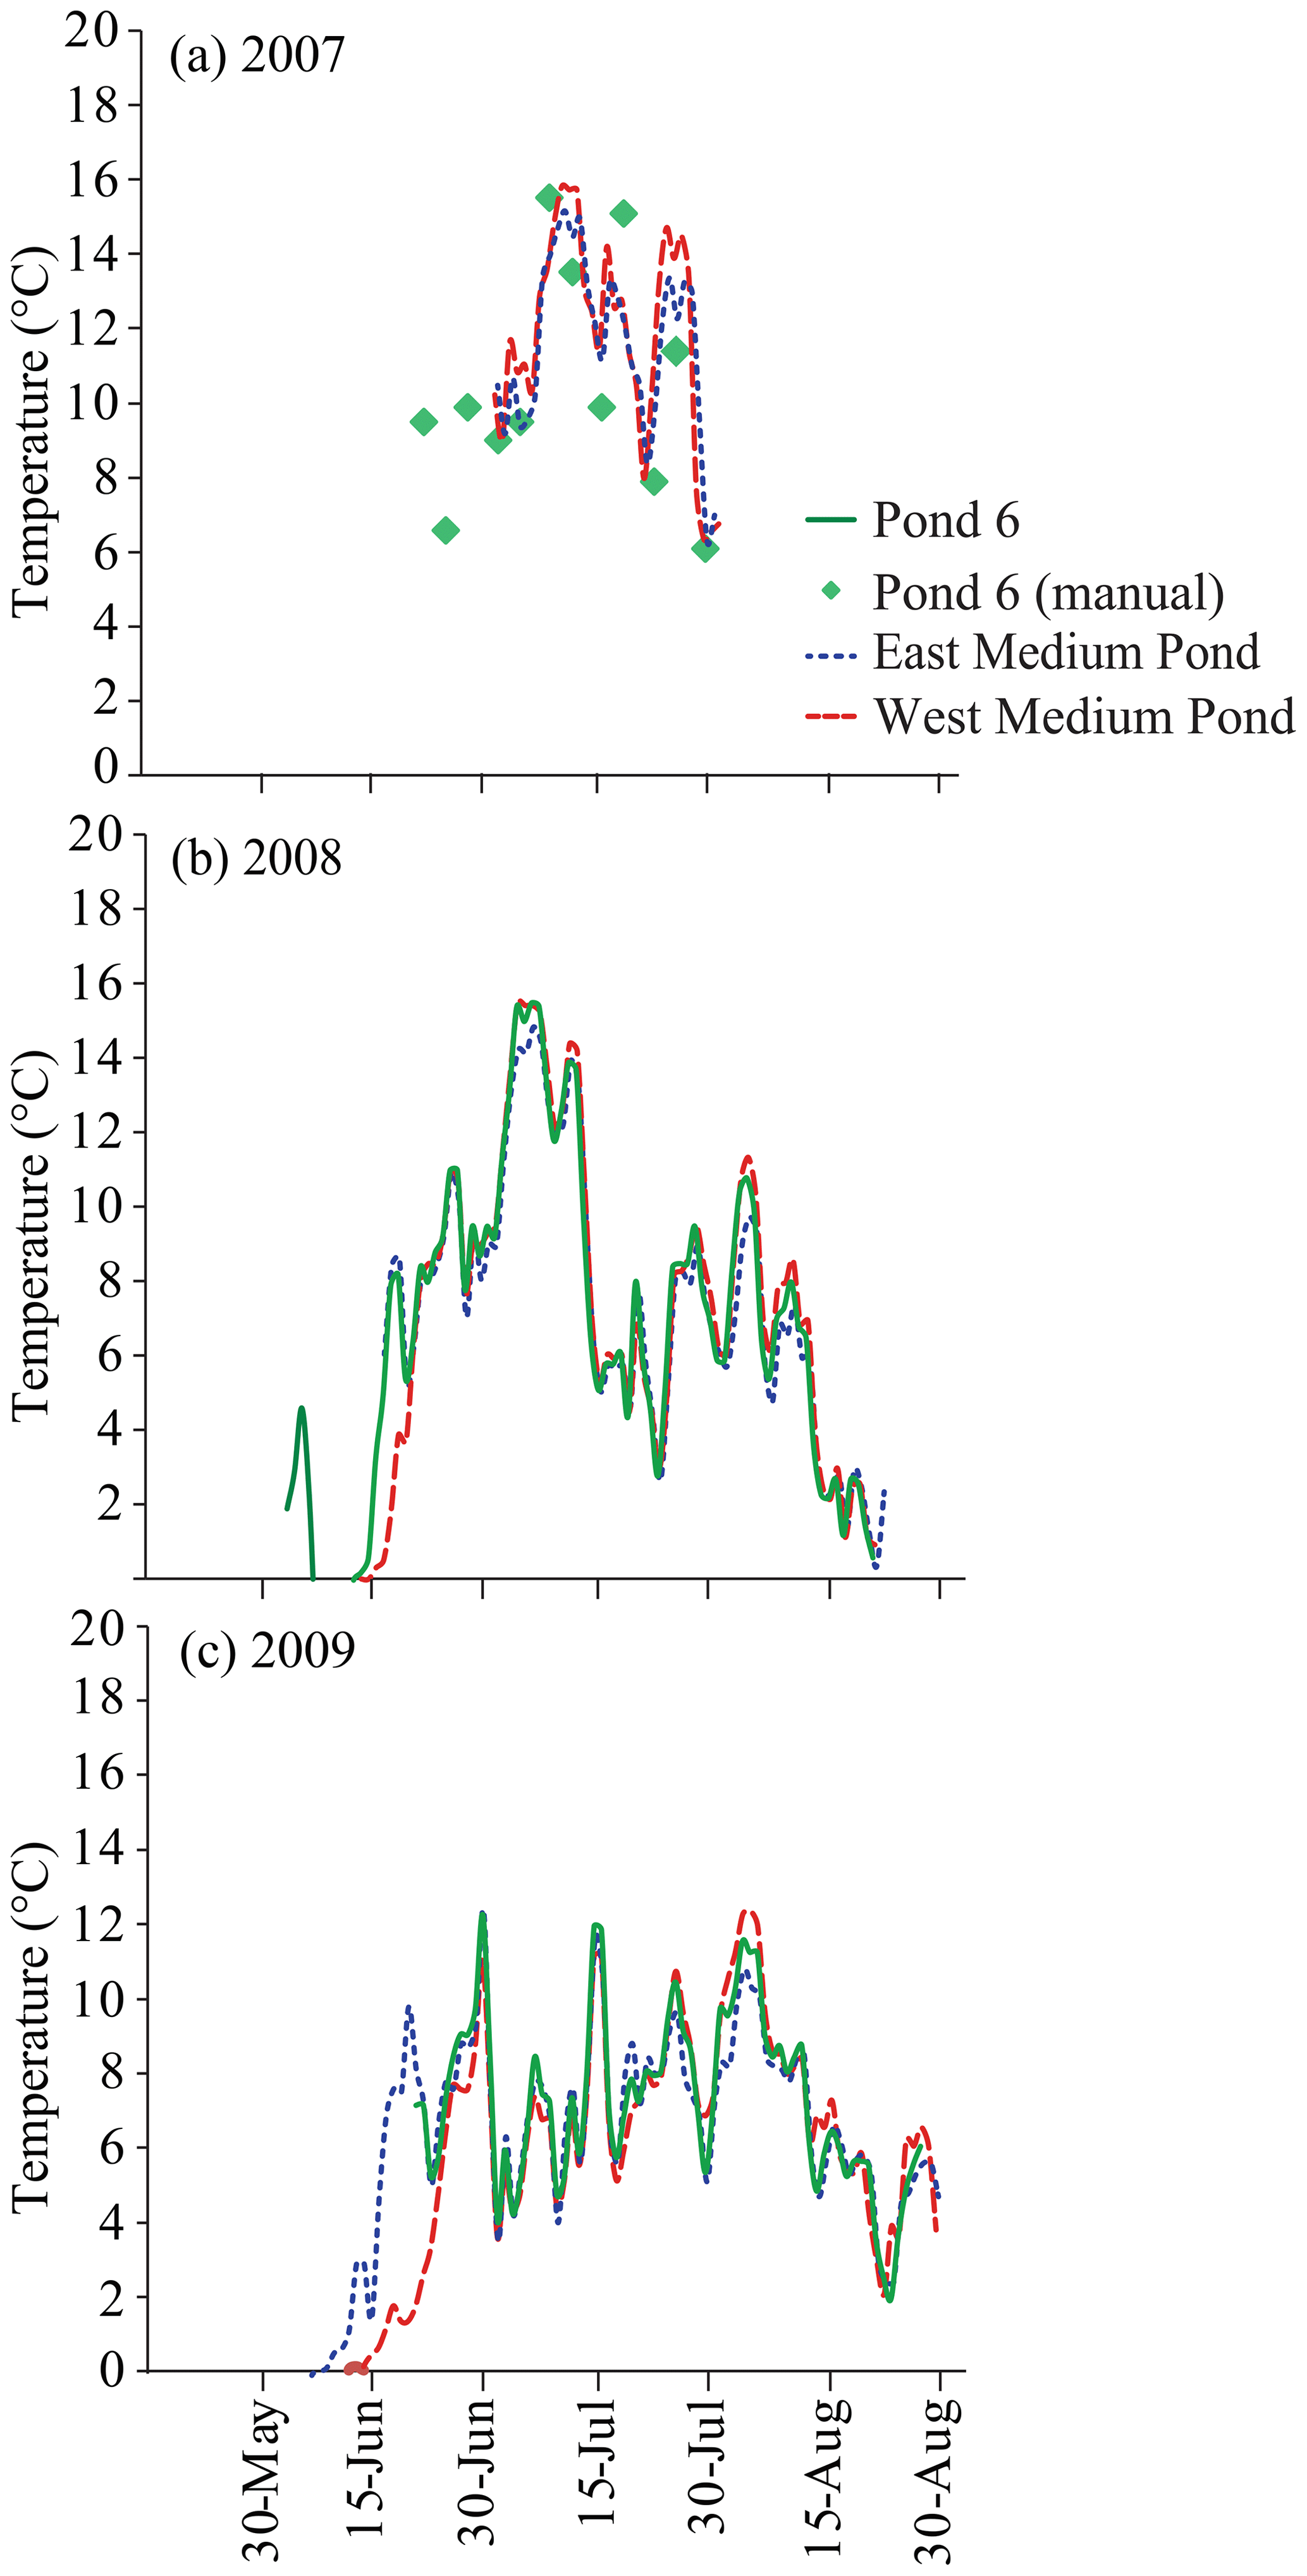
Figure 4Seasonal temperature regime of medium-sized ponds across PBP (2007–2009) based on manual (dots) and continuous (solid line) data from (a) 2007, (b) 2008, and (c) 2009.
4.2 Mean July temperature
Overall, the pond temperatures at PBP fall in the range found in other Arctic studies, although 2013 was much cooler due to a late spring and cold summer. Figure 5 plots the July mean temperatures of the central ponds at PBP, across the years. In addition, we also include July pond temperature data (11 °C, 2005) from Eastwind Lake, Ellesmere Island (Woo and Guan, 2006), and from Cape Bounty, Melville Island (7.2 °C, 2009; Croft, 2011).
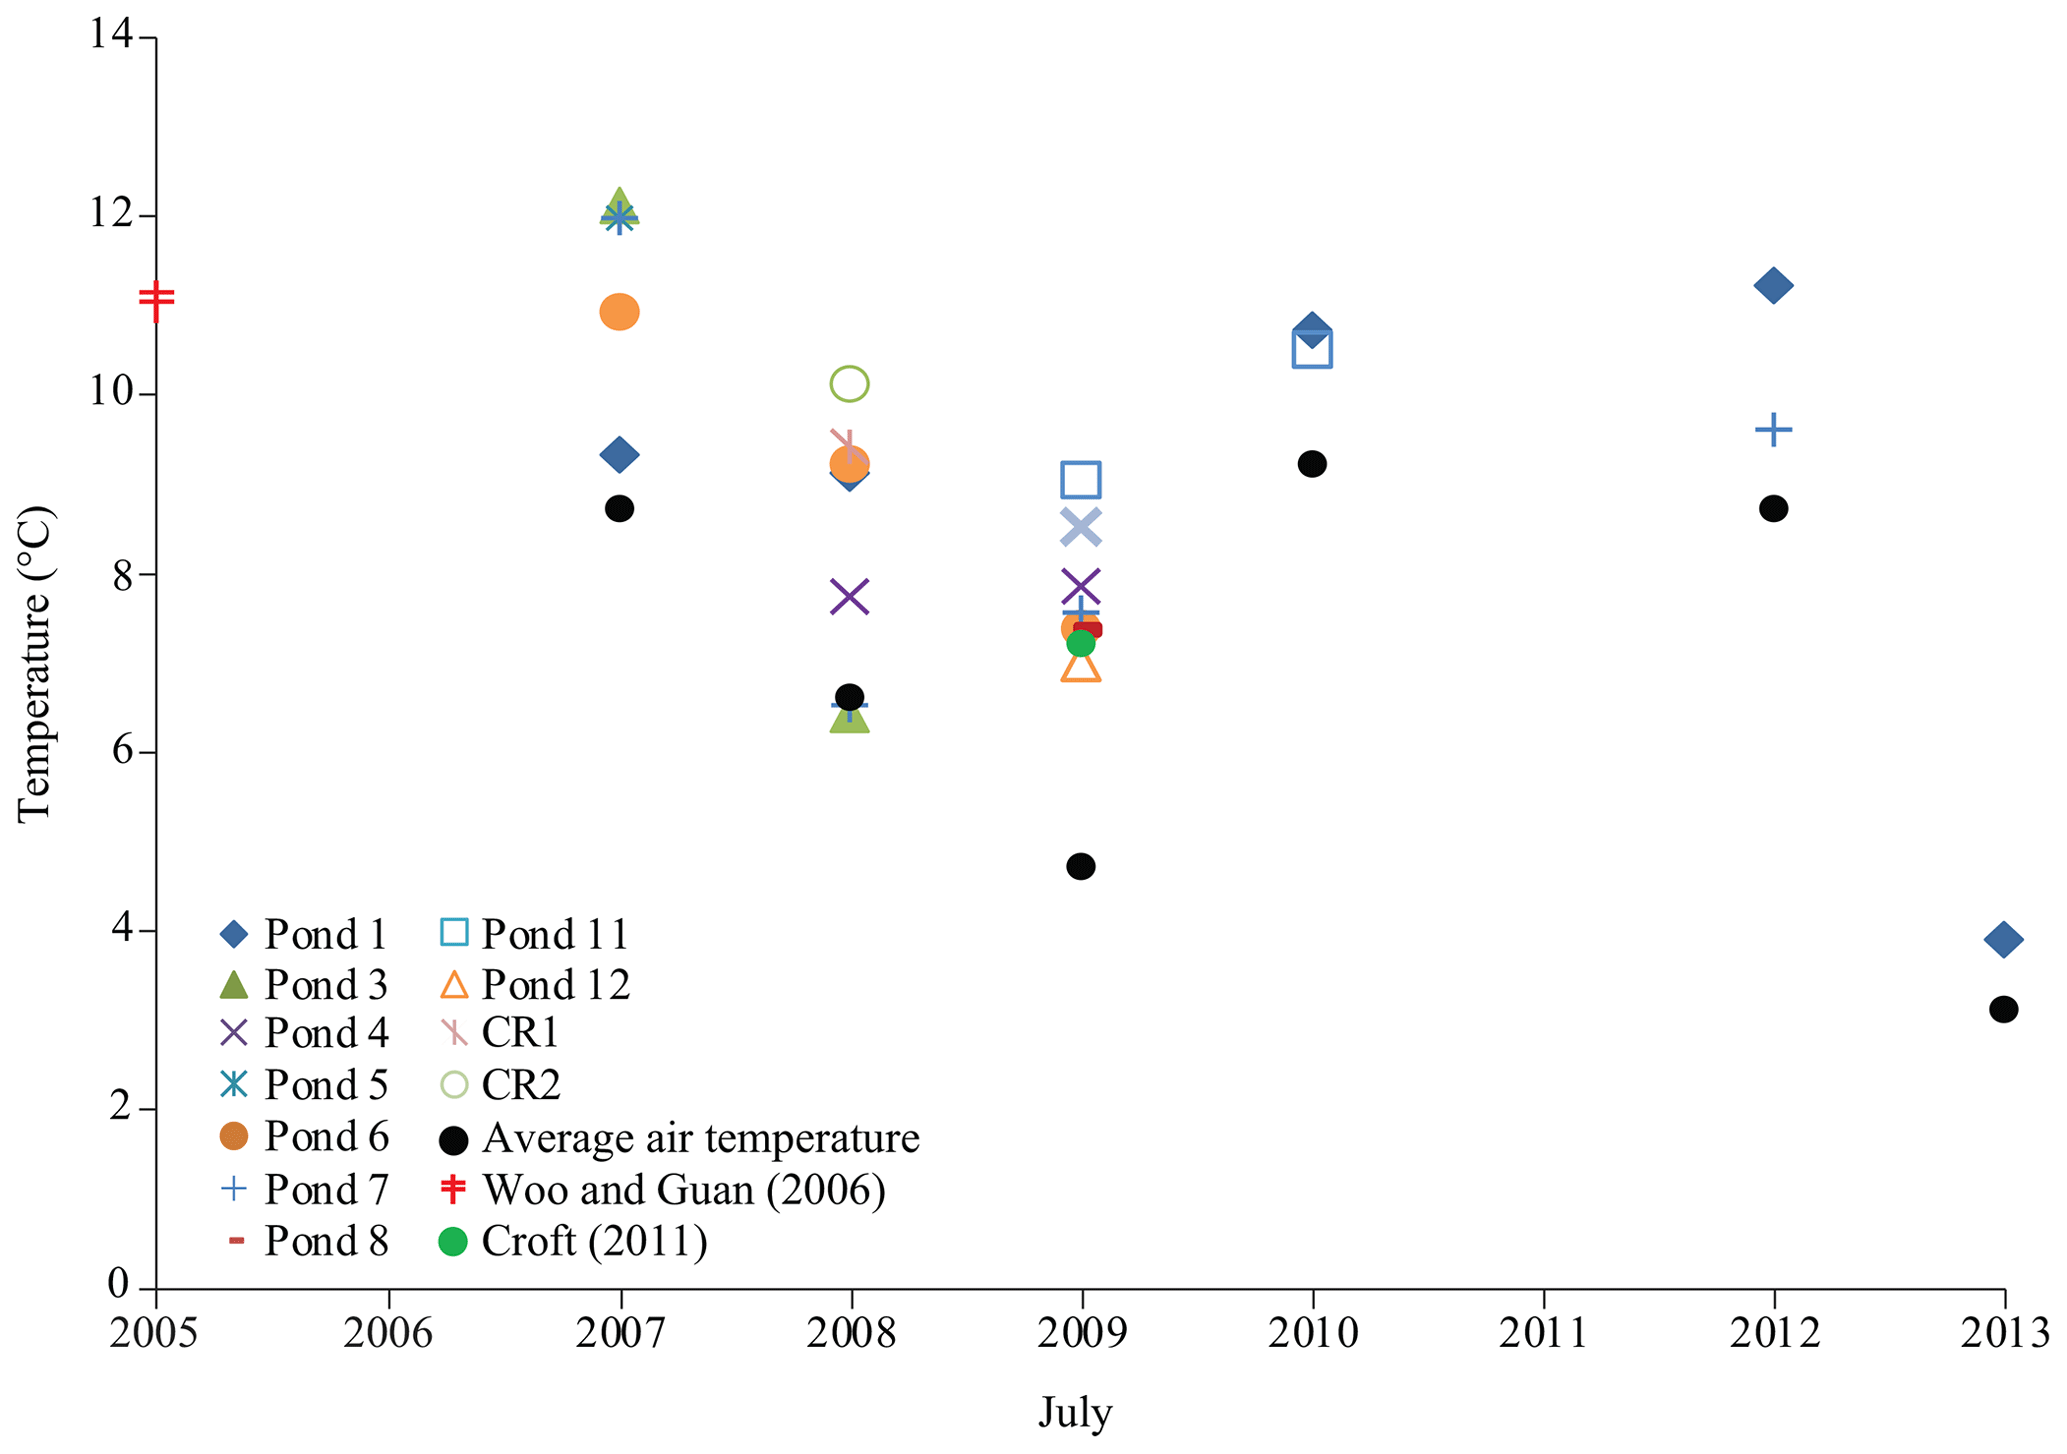
Figure 5Average July pond temperatures at the PBP ponds. Pond data from other Arctic studies are included here for comparison. Illness in 2011 prevented pond temperatures from being obtained at PBP.
4.3 Cumulative percentages and box plots of pond water temperatures
Cumulative percentages and box plots of Pond 1 from 2008 to 2013 (14 June to 30 July), based on continuous water temperature measurements, are plotted in Fig. 6. Comparable to Fig. 2, there is considerable year-to-year variability. In 2012, a warm season, pond Tw exceeded 11 °C about 50 % of the time, while it exceeded 14 °C about 15 % of the time; however, in 2013, a cool year, pond Tw only exceeded 2.5 °C about 50 % of the time and remained below 10 °C. Amongst the 3 years (2008, 2009, and 2010), Pond 1 was the warmest in 2010, but it showed the greatest variation according to the box plots (see Fig. 6).
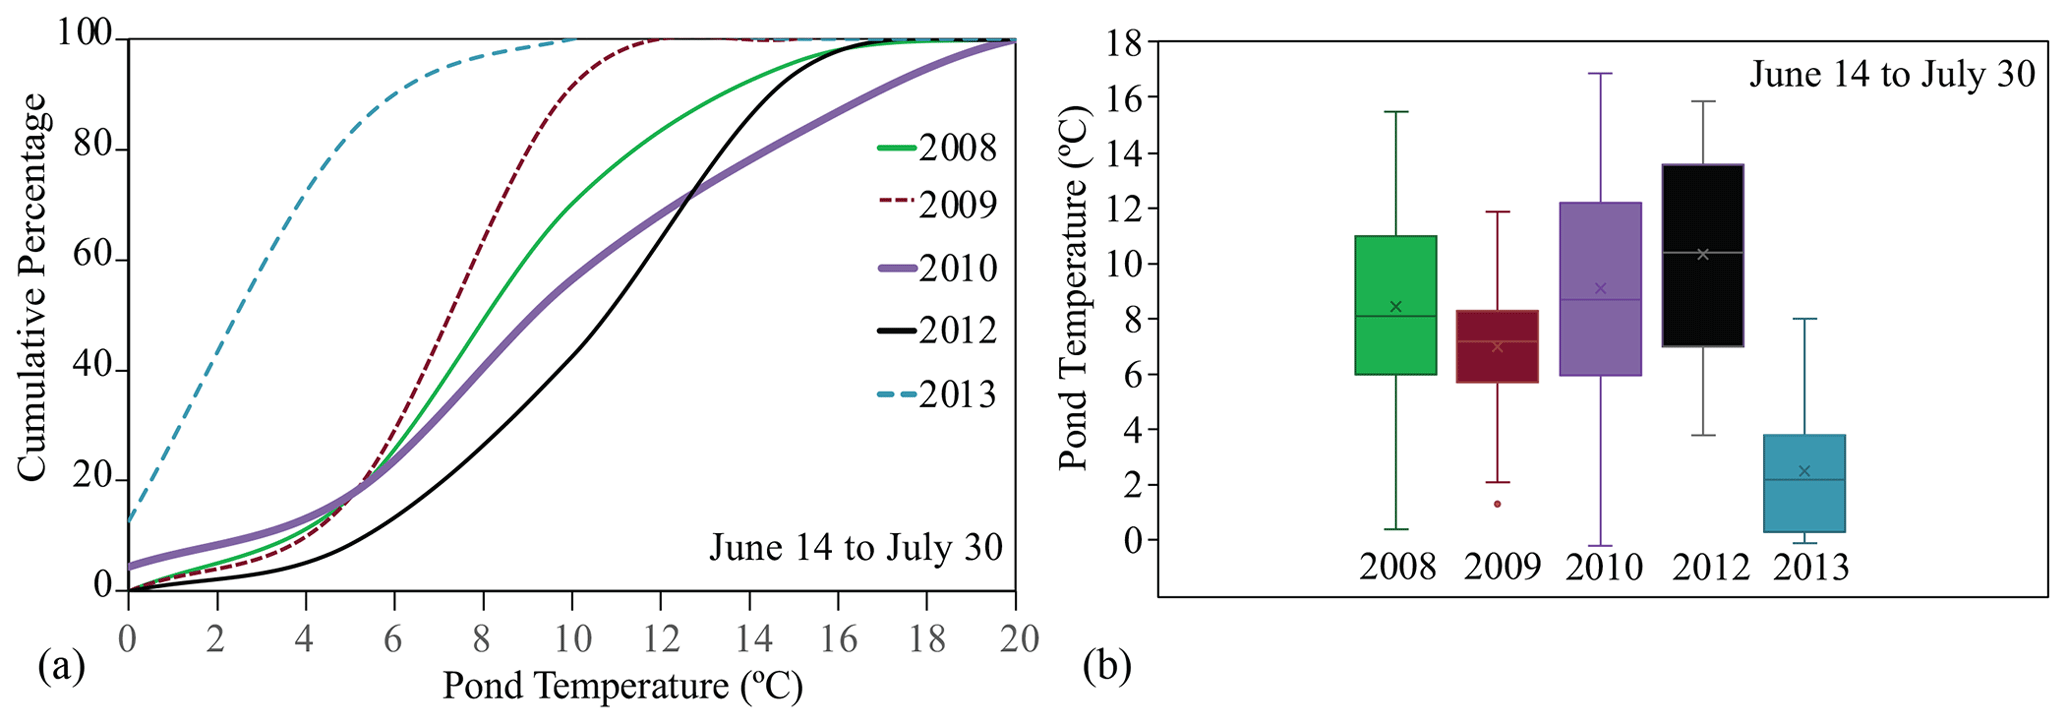
Figure 6The (a) cumulative percentages and (b) box plots of water temperatures (Tw) in Pond 1 from 2008 to 2013. The time frame selected for comparison is 14 June to 30 July. Box plots show the median (line in box); “×” indicates the average temperature.
Figure 7, based on continuous daily mean data in 2008 (22 June to 19 August) and 2009 (23 June to 20 August), shows the cumulative percentages and box plots of water temperature in the central ponds. The pattern of ponds in a year are similar to Pond 1 (see Fig. 6), but year-to-year variability and, occasionally, pond-to-pond variability do exist (e.g., ponds 2 and 6). Differences in pond water depth and water sources can impact water temperatures, not just air temperature. For instance, the Meadow Pond plot varies from the others, as it remains cooler for a longer duration. About 80 % of the time, the Tw here never exceeds 10 °C. As mentioned earlier, this is due to the pond's location, nestled in a small valley with adjacent late-lying snow beds that supply cool meltwater to it for a protracted time (see Fig. 8a and b). The Meadow Pond Tw does not increase until after the late-lying snow bed disappears. Median temperatures capture this effect as well.
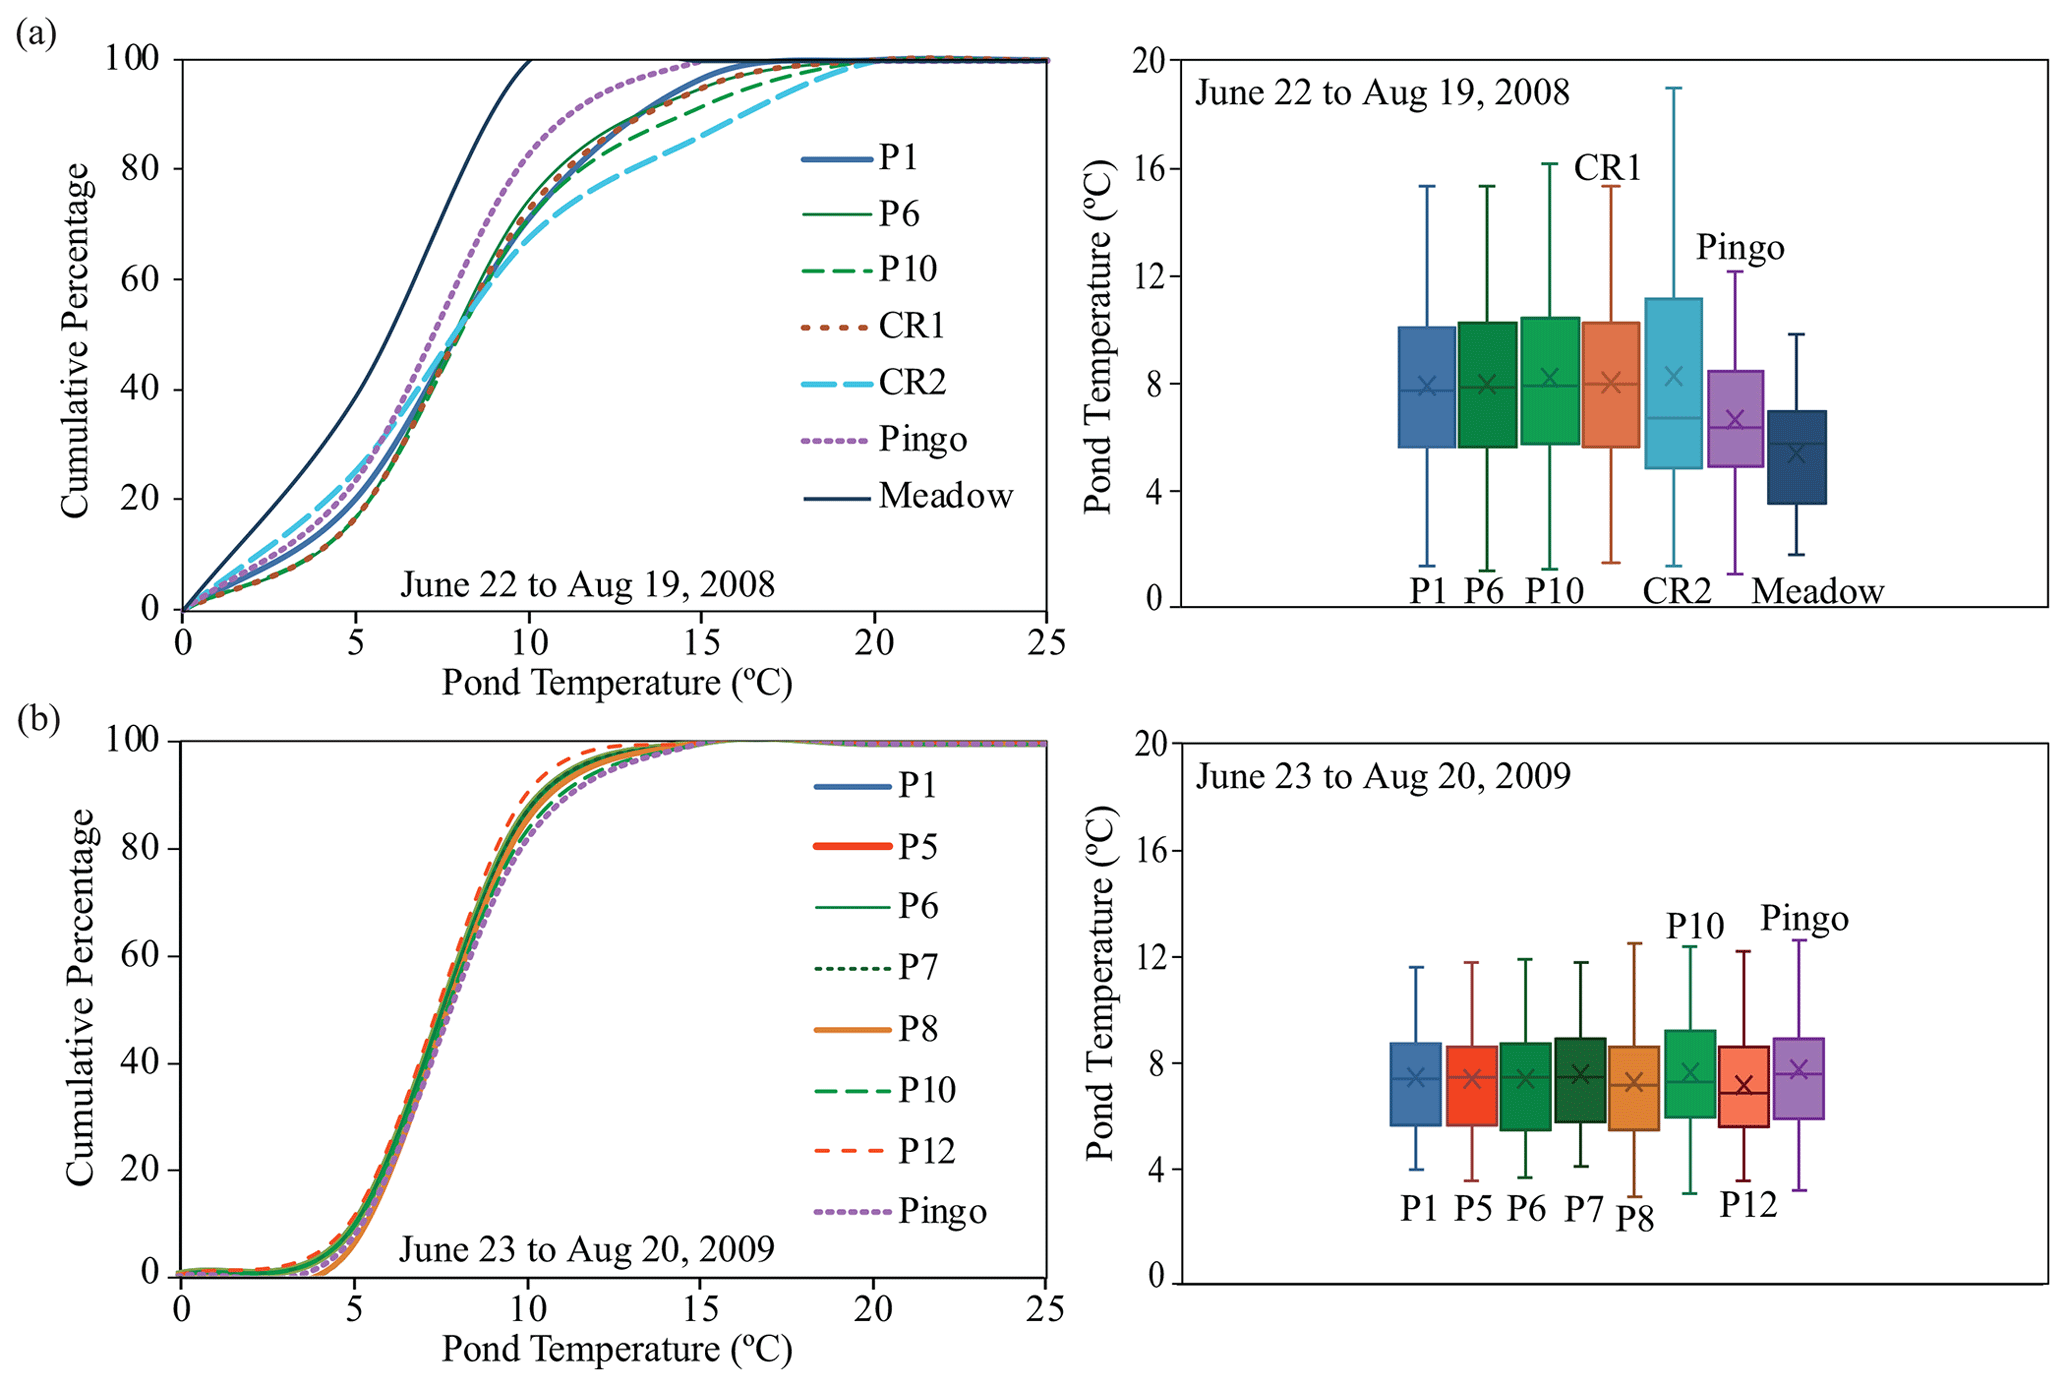
Figure 7The (a) cumulative percentages and (b) box plots of temperatures (Tw) of central ponds in 2008 (22 June to 19 August; top panels) and 2009 (23 June to 20 August; bottom panels) using continuous pond water temperatures.
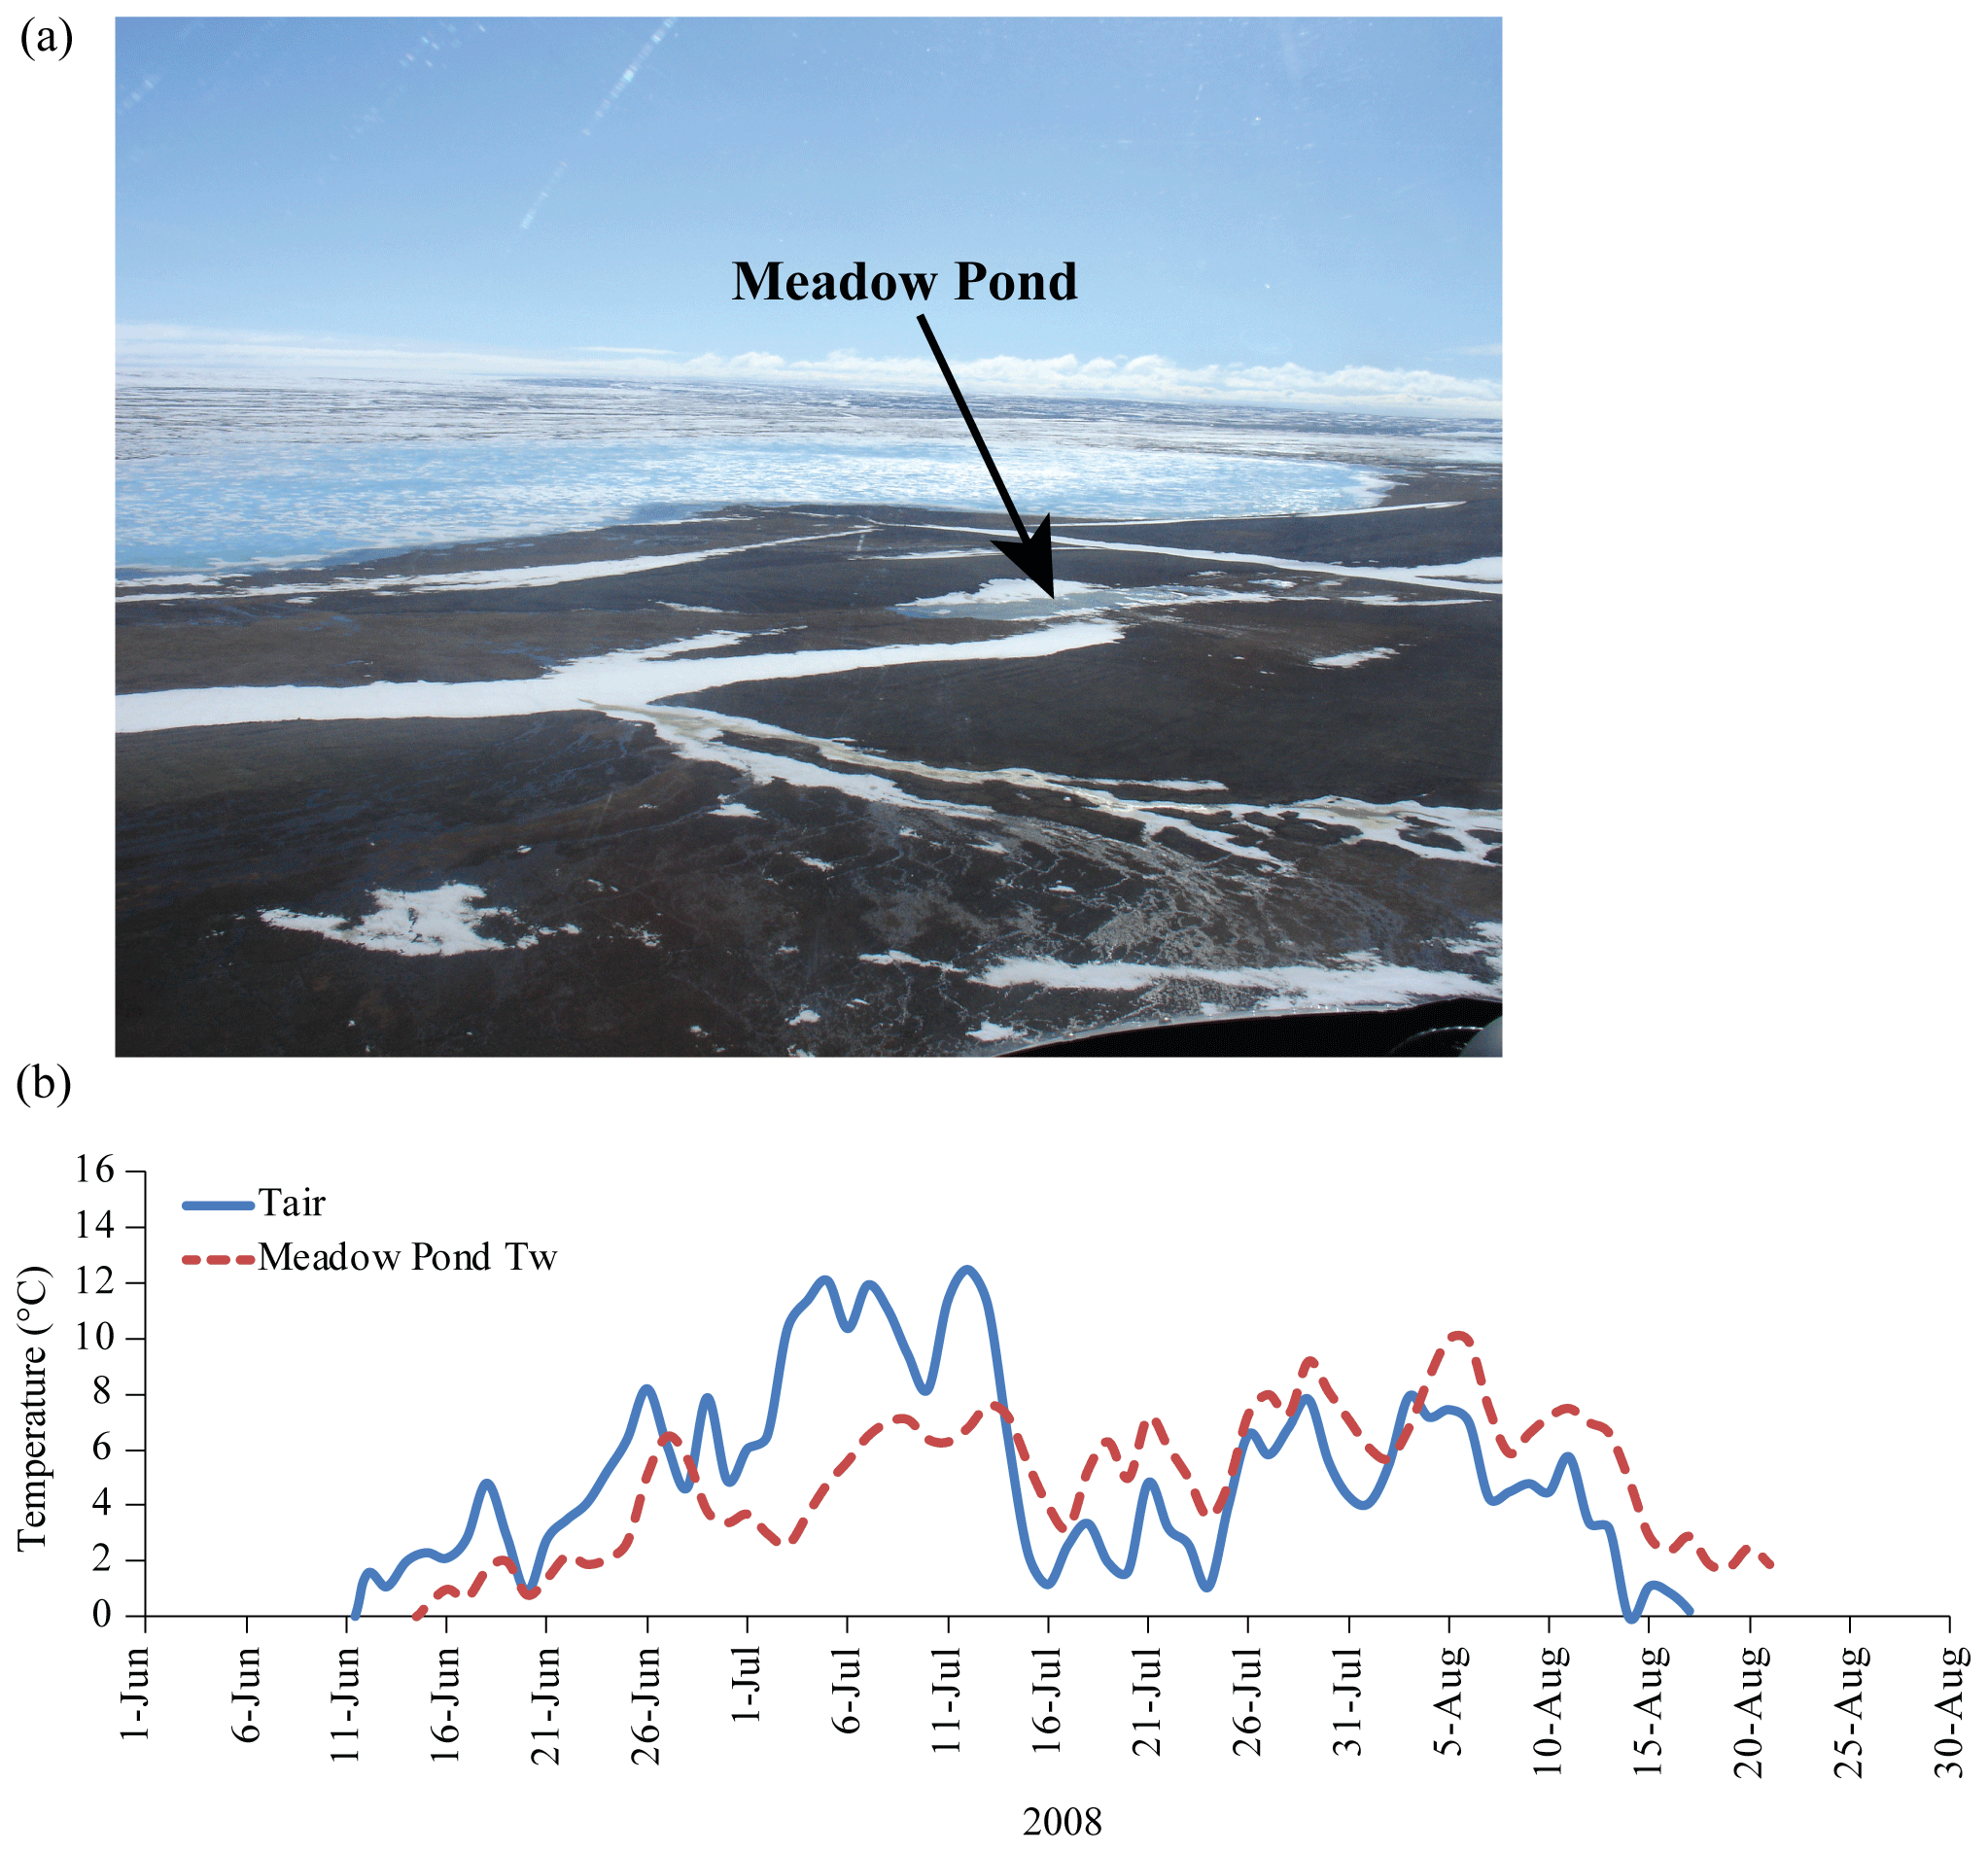
Figure 8(a) Photo of Meadow Pond taken on 15 June 2008; note the late-lying snow beds adjacent to Meadow Pond. (b) Air temperature vs. pond water Tw (Meadow Pond) in 2008.
4.4 Air temperature and pond water temperature response
Figure 9 shows the correlations between plateau air temperatures and pond water temperatures in 2008 (panel a) and 2009 (panel b) – the 2 years when continuous measurements were made until the end of August (International Polar Year). In 2008, the relationship between air temperature and pond water temperature is strong, when temperatures are >0 °C. Here, most ponds show a correlation of r>0.8 or >0.9. When points fall below the 1:1 line, it is a signal that there was an initial lag in pond warming due to ice-off (see Fig. 3). As mentioned earlier, the water temperature of Meadow Pond has a much weaker relationship with the air temperature. This is due to its location near melting late-lying snow beds, which help to delay pond warming (see Fig. 8).
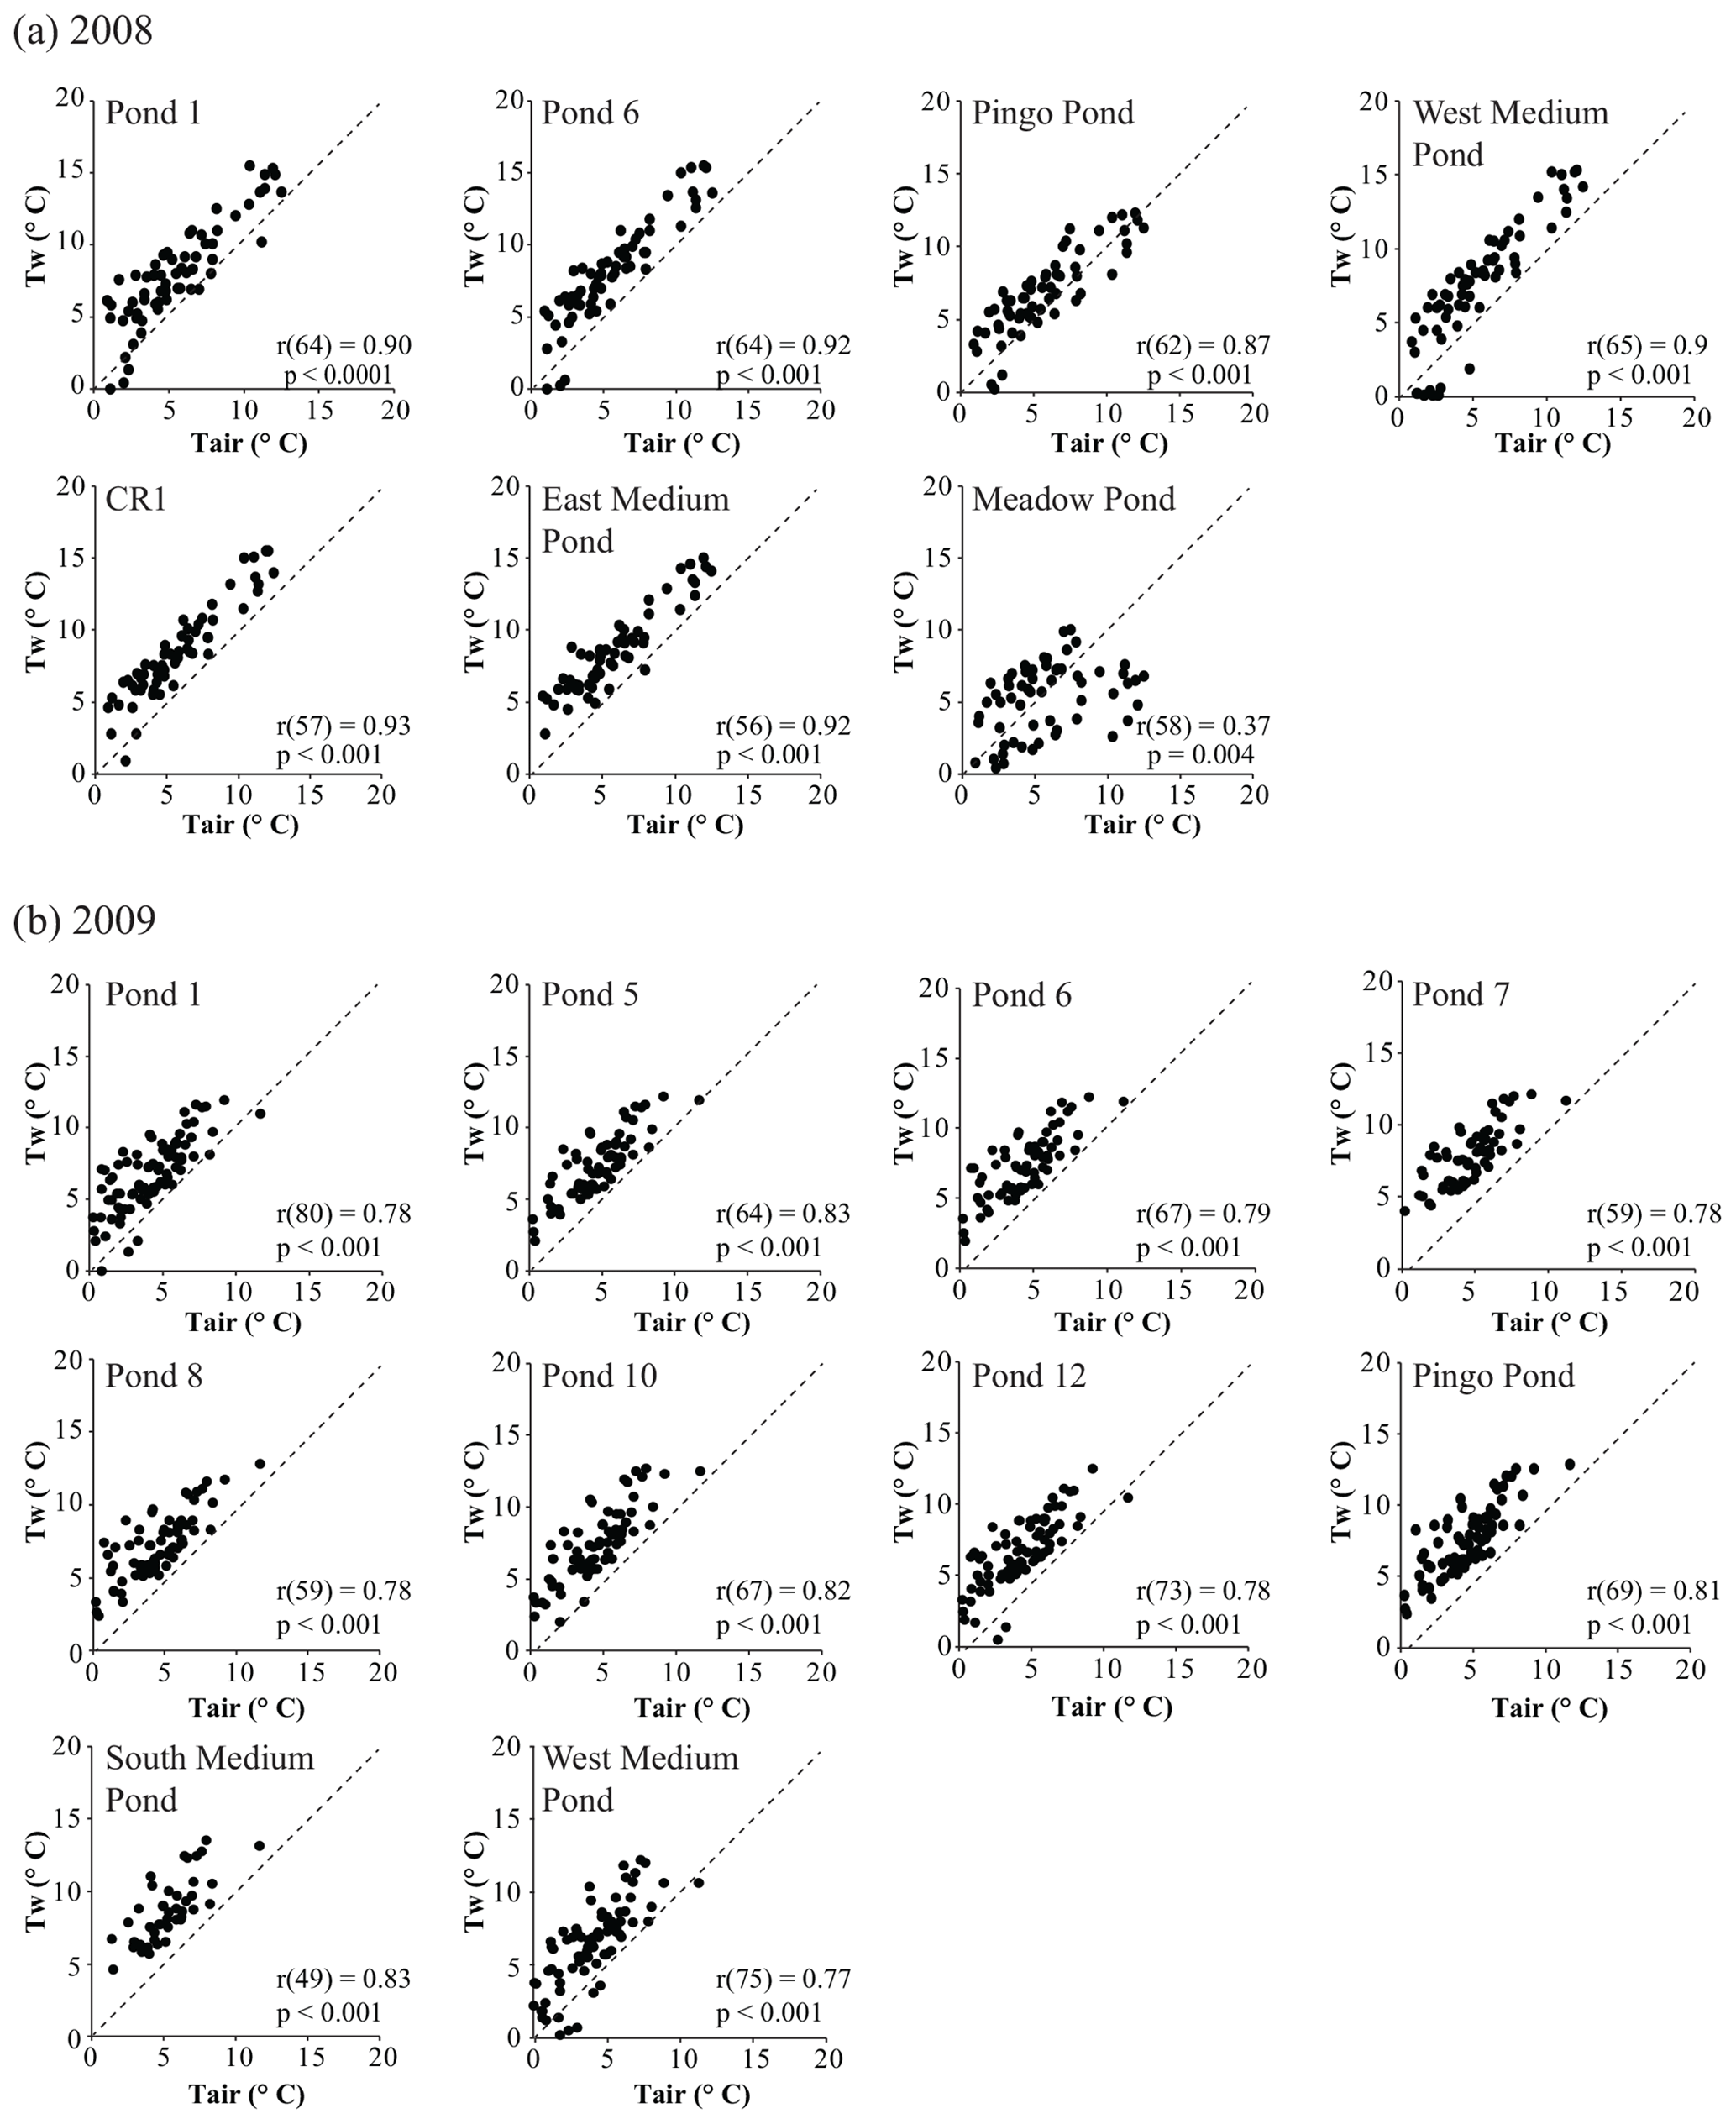
Figure 9Correlations (r) between plateau daily air temperatures and pond water temperatures (Tw >0 °C) for ponds in (a) 2008 and (b) 2009 using continuous water temperature data. The dashed black line in the plots is the 1:1 line, and sample size is contained in brackets.
4.5 Other environmental responses
4.5.1 Ground thaw
In 2007, it can be observed that there is considerable variation in the pond thaw depth (0.3 to >0.7 m; Fig. 10a). Pond 5 had a mucky organic bottom, which might be indicative of a high ice content that restrains ground thaw. Pond 10 exhibited a deep thaw of >0.6 m. It was a shallow pond with a rocky, blue-green algae (dark substrate) (see Table S1), which would be effective with respect to absorbing incoming radiation and accelerating ground thaw (Young and Woo, 2003; Young and Abnizova, 2011). Rapid thawing in the month of July can also be attributed to warm air temperatures (average Tair=7.4 °C).
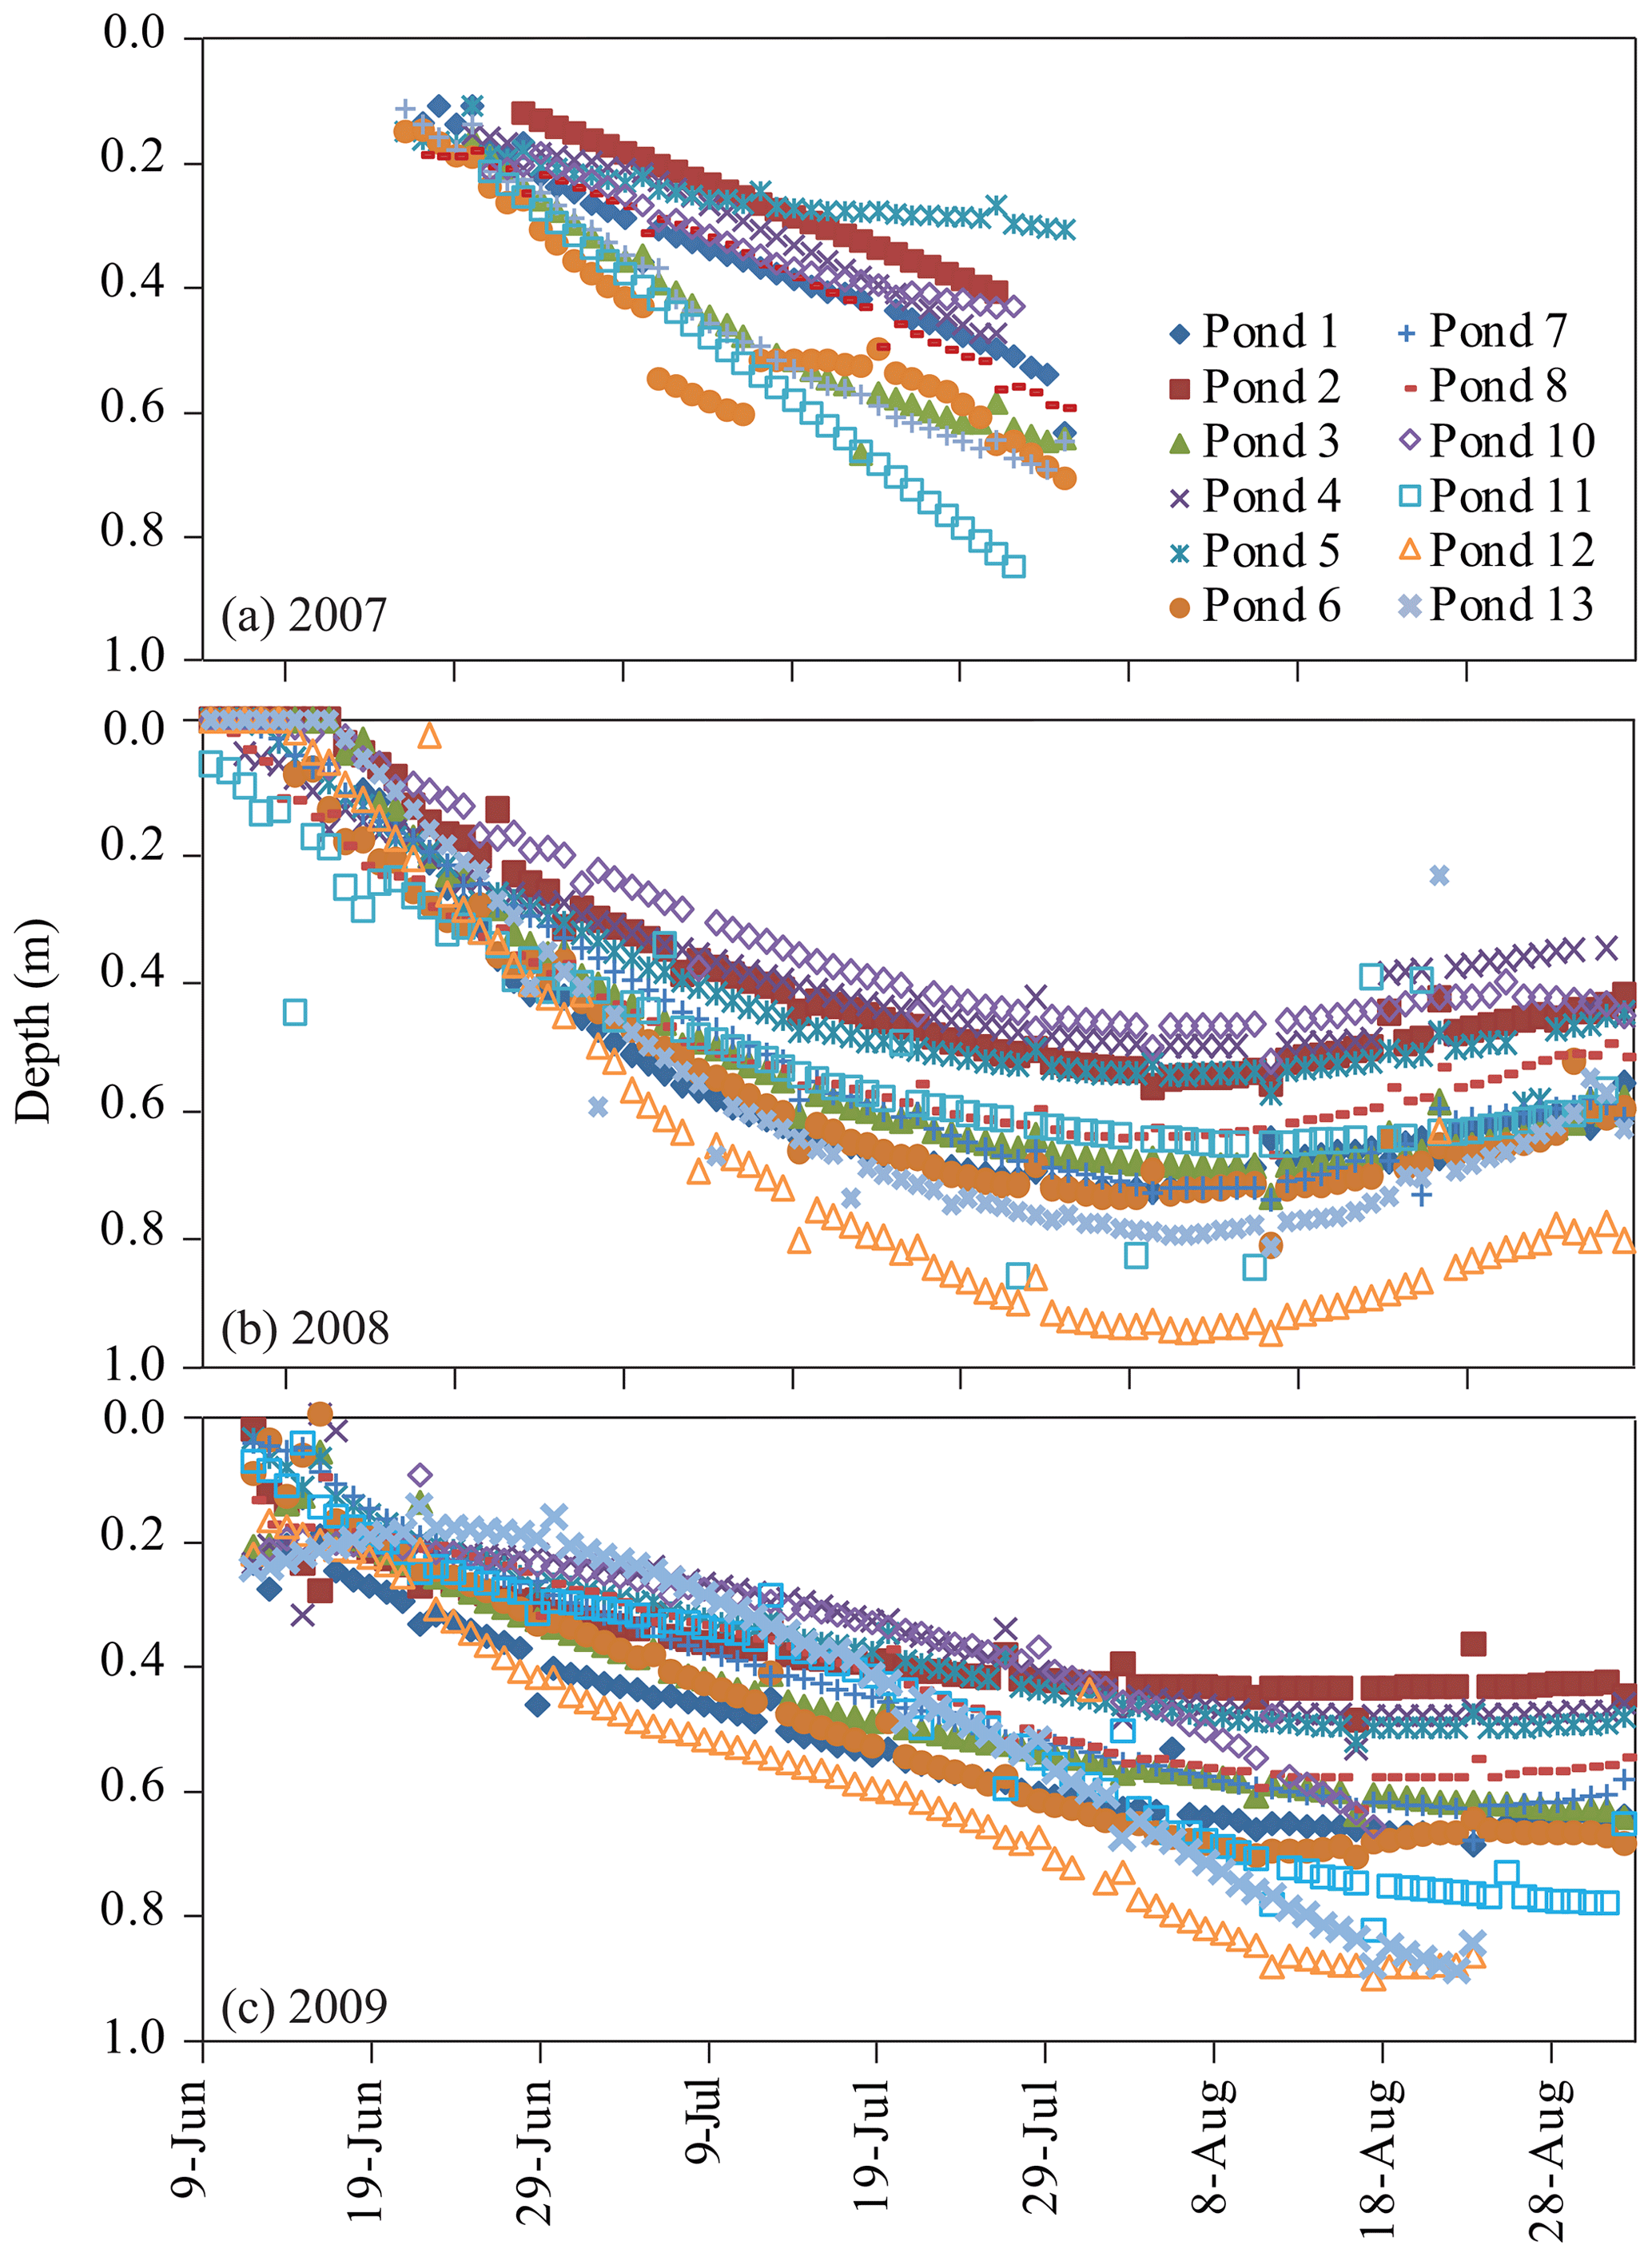
Frost table measurements continued until the end of August in both 2008 and 2009 (see Fig. 10b and c). Maximum frost table depths occurred around 28 July in 2008, whereas they occurred slightly later in 2009 (23 August). In 2008, the maximum depth reached in the ponds ranged from about 0.45 to 0.95 m; this was similar (0.42 to 0.95 m) in 2009, with Pond 12 exhibiting the deepest thaw in both years. The rate of frost table decline amongst ponds is similar in the early part of the 2008 season; however, a wider range in thaw then develops, with the maximum spread emerging around 18–23 July. The thaw pattern of ponds is similar in early 2009, but the pond thaw then shows variable depths by 29 July, which continues for the rest of the thaw period.
The well-defined freeze-back pattern is not as clear in 2009 as in 2008. While the rate and maximum frost table thaw in ponds might be different between the years owing to varying meteorological conditions, the thaw pattern of ponds is consistent; typically, Pond 5 exhibits a shallow thaw compared with Pond 11, which can reach deep thaw, particularly in 2007 and 2009, and sporadically in 2008. This regular pattern in frost table depths amongst the ponds was replicated in 2010 as well (data not shown here).
4.5.2 Pond water conductivity (µS cm−1)
There is considerable variation between ponds throughout the 2008 season, and the conductivity levels rise from ∼100 µS cm−1 to most ponds exceeding 250 µS cm−1 (Fig. 11a). Like water temperatures, meltwater from the nearby late-lying snow bed adjacent to Meadow Pond causes dilution, so the water conductivities are generally lower than other ponds. Pond 11, due to its rocky, blue-green substrate and deep ground thaw, exhibits the highest water conductivity, maintaining levels >400 µS cm−1 by early July 2008 (Fig. 11a). A similar pattern emerges in 2009. Pond 11's water conductivity reaches >400 µS cm−1 near the end of June and about 500 µS cm−1 at the end of August. Pond 11 is an irregularly shaped pond with a dark substrate. It was prone to drying, as was Pond 8. Like 2008, Meadow Pond has a lower water conductivity signal in early 2009 than other ponds. Later in the season, water conductivity levels start to rise at Meadow Pond due to the loss of meltwater from the nearby late-lying snow bed (Fig. 11b).
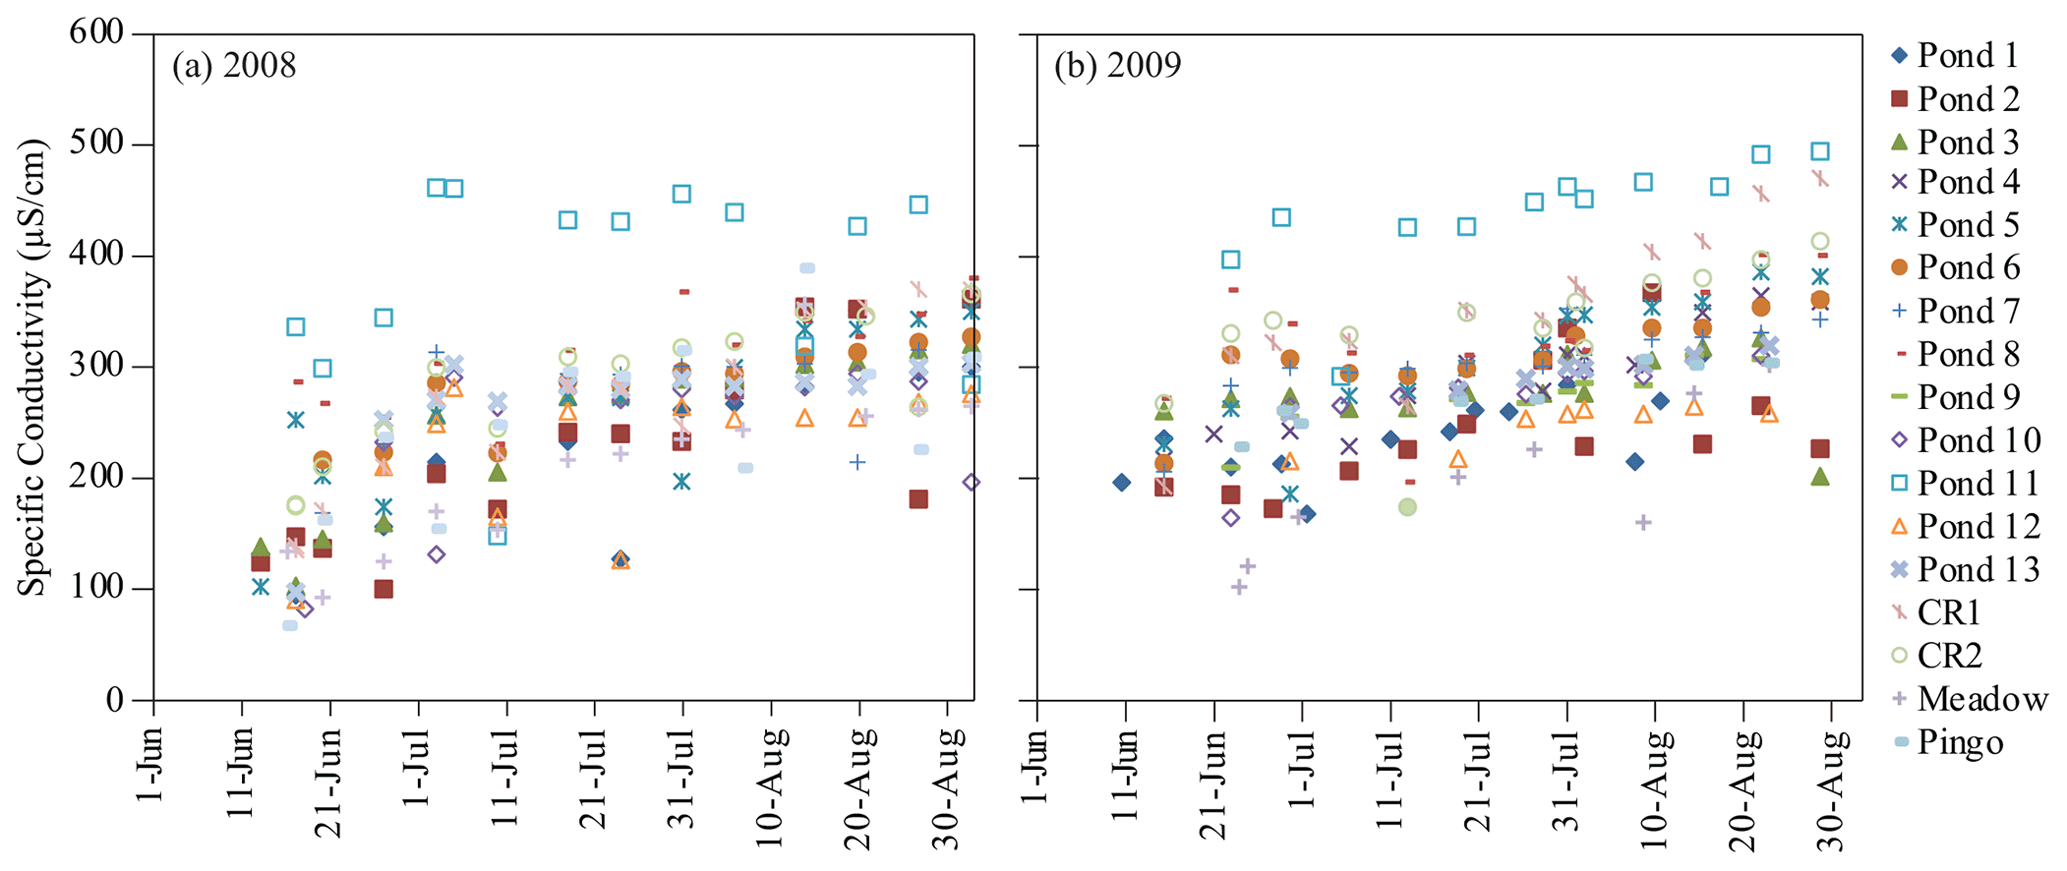
Figure 11Spot measurements of specific conductivity (µS cm−1) of ponds at PBP in (a) 2008 and (b) 2009.
Figure 12 provides an illustration of the impact of a warm season on the conductivity of pond water as measured by a YSI 600 multiparameter sonde. Figure 12a shows the hourly water temperature and conductivity of Pond 1 in the early summer of 2008 vs. the early summer of 2012. Pond temperatures do not vary that much in these 2 years during the aforementioned periods. Conductivity only reaches about 250 µS cm−1 in 2008 (mean Tair=4.39 °C, 1 June–31 July) but exceeds 400 µS cm−1 in 2012, a warmer season (mean Tair=6.43 °C, 1 June–31 July). Due to the warmer air temperatures in 2012, frost tables reached upwards of −0.45 m in the wet meadow upslope of Pond 1 by 27 June 2012 (field notes). In 2008, on 27 June, the frost table of the wet meadow well adjacent to Pond 1 was only −0.172 m, while the pond's frost table depth was 0.369 m. It was also drier in 2012: only 10.8 mm of rainfall was received by the end of June at PBP in 2012, whereas ∼19.5 mm was recorded by the end of June in 2008, followed by 44.1 mm in July 2008. Rainfall measured at Resolute in July 2012 was 30.7 mm.
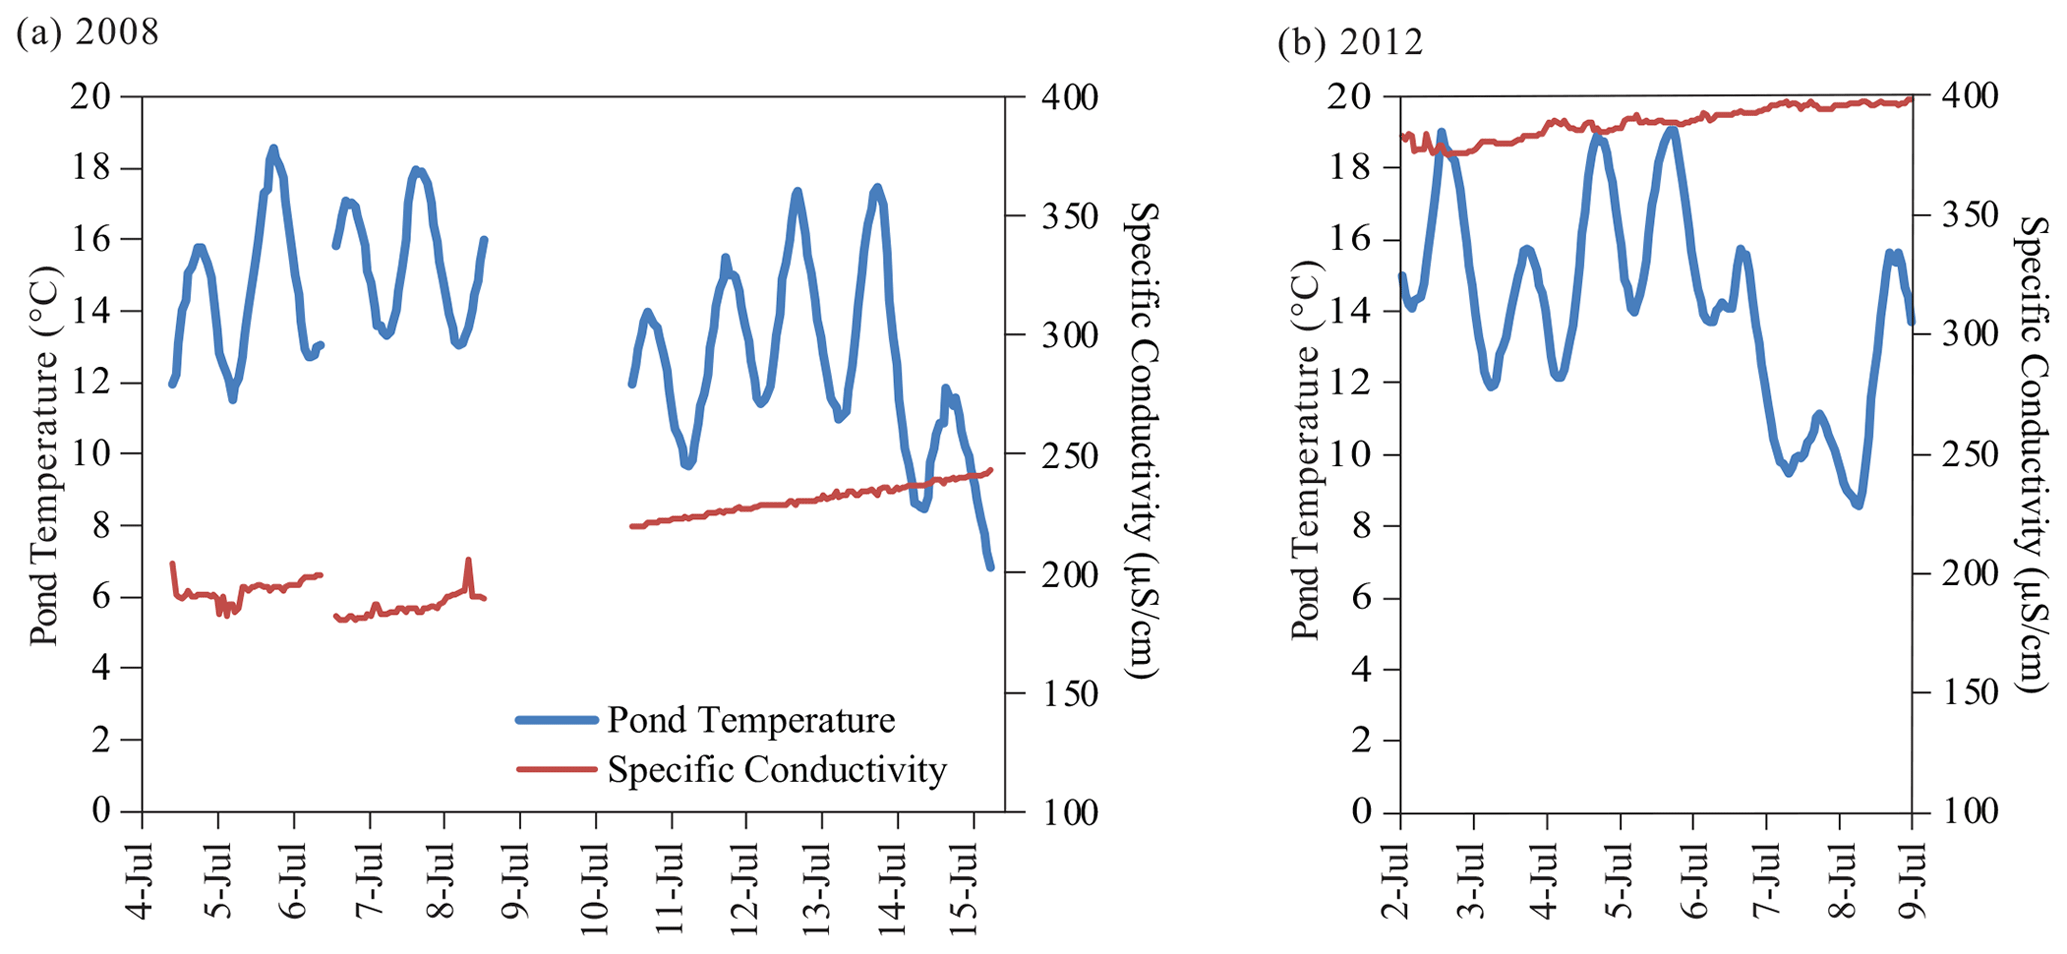
Figure 12Hourly estimates of pond temperature (blue line) and specific conductivity (µS cm−1; red line) for Pond 1 in (a) 2008 and (b) 2012.
5.1 Pond temperatures
Benyahya et al. (2007) and others (e.g., Dranga et al., 2017; Morison et al., 2023) indicate that water temperature is one of the most important parameters in ecosystem studies, as it can influence both chemical and biological processes. At PBP, limited monitoring of the thermal regime of ponds indicates that most ponds show a rapid warming in the spring following snowmelt, with the temperature of most ponds peaking in July. Then, pond water starts to cool in August. Average July temperatures are consistent with other pond studies across the Canadian High Arctic, including polar oasis regions (Woo and Guan, 2006). Like the work of McEwen and Butler (2018) in northern Alaska, temperatures in central ponds all correlate well with each other and, for the most part, with ponds across PBP. This indicates that these ponds are all responding to similar climatic conditions (warming temperatures), which is also supported by the strong correlations of pond temperatures with air temperature (>0 °C). In this study, 2008 correlations (pond Tw vs. Tair) were slightly higher than in 2009 (see Fig. 9). We do not have a good explanation for this difference. In addition, there are still slight differences in the ponds owing to their unique settings. Meadow Pond remains cooler than the other ponds owing to lingering meltwater from late-lying snow beds, which is also a pattern noted by others (e.g., northern Ellesmere Island – Smol and Douglas, 2007; Somerset Island – Young and Abnizova, 2011). The southern ponds are delayed with respect to warming relative to other ponds due to a regular and persistent snowpack: the southern part of PBP has a north-facing aspect that ensures later snowmelt and pond opening than the northern part of PBP (Young et al., 2013, 2018; Young, 2019). However, once ice-free, the area's pond temperatures quickly catch up to others (Fig. 9).
McEwen and Butler (2018) examined air temperature and water temperatures in an Arctic pond over 40 years on Alaska's Arctic Coastal Plain. They documented a 2.2 °C increase over a 42-year period (or roughly 0.5 °C per decade). They found that the average thaw temperature of the pond increased during the first 30 d of the growing season from 1971 to 2012. Figure 2 indicates that there is still much variability in climate and pond temperature response at PBP from year to year (e.g., 2012, warm, vs. 2013, cold). The anomalously warm summer of 2012 and cool summer of 2013 were a result of opposing NAO (North Atlantic Oscillation) phases. The summer of 2012 had a very negative NAO (resulting in warm temperatures and substantial snow and sea ice melt) (Overland et al., 2013), whereas the summer of 2013 had a positive NAO with anomalously low spring and summer temperatures through the Canadian North, becoming 1–3 °C cooler in the High Arctic relative to 2007–2012 (Overland et al., 2014).
5.2 Environmental response to pond warming
The effects of warming and permafrost thaw on Arctic freshwater ecosystems remain poorly understood (Lougheed et al., 2011). Generally, permafrost and the seasonal frost table maintain water levels in wetlands and ponds near the surface; however, with an increase in thaw, the water level can drop. As the permafrost thaws to deeper soil layers or is completely thawed, the perched water table may be lowered, resulting in drier surface soils; this can then lead to substantial carbon loss. However, in other areas, ground collapse can fill with water to form ponds and wetlands, enhancing methane losses (Moonmaw et al., 2018; Rehder et al., 2023).
Pond sediments at PBP have varying (small to large) ice contents depending on their texture and porosity characteristics (see Table S1 and Fig. S1). This can influence pond thawing rates and maximum thaw depths. Permafrost degradation can also cause expansion or shrinkage of wetland areas, and warming associated with permafrost thaw could also turn wetlands into sources of carbon, thereby increasing greenhouse gas emissions to the atmosphere (Moonmaw et al., 2018; Kreplin et al., 2021; Rehder et al., 2023). Wrona et al. (2016) argue that, while temperature is a key driver in ecological processes in tundra ecosystems, it is hydrological interactions that mediate the climate responses of these ecosystems.
While pond temperatures are generally similar across PBP, although they vary due to climatic conditions (cool vs. warm years), there are considerable differences in the ground thaw rates, which can be attributed to the physical characteristics (coarser vs. finer) and color of the sediments. Some ponds have darker substrates than others, which can lead to greater absorption of incoming solar radiation due to a lower albedo (Young and Abnizova, 2011). Warmer summers (e.g., 2007) vs. cooler ones (e.g., 2008) did lead to higher rates of pond evaporation (Young and Labine, 2010), but deeper thaw in warm, dry years also contributed to enhanced vertical pond seepage due to an increase in the active-layer storage capacity. This process most likely contributed to drying and pond shrinkage (Young and Abnizova, 2011). Pond thaw rates differ from pond to pond, but they are consistent from one year to the next, confirming the critical role played by the pond sediments (see Table S1 and Fig. S1).
A similar pattern emerges when evaluating pond water conductivity. Ponds that are shallow and subject to drying tend to have the greatest water conductivities in both cool and warm years. Here, shallow pond waters are in greater contact with thawing soil materials. Figure 12 also confirms that pond conductivities can rise substantially in the same pond from one year to another in response to warmer air temperatures and deeper ground thaw.
In the Old Crow Flats, Yukon, Roy-Leveillee and Burn (2017) found that near-shore taliks could develop in shallow (often less than 20 cm) lake pond water when warm summers increased the thawing degree days. Deep and early snowpacks near the shoreline also helped to keep lake bed temperatures above 0 °C, preventing permafrost aggradation.
5.3 Climate warming: what can we expect for PBP ponds?
Climate warming over the last century has been greatest in the Arctic and is projected to continue in the 21st century at a rate above the global average (Sim et al., 2019; Miner et al., 2022). Future hydrological changes, vegetation shifts, and degradation of permafrost have been identified as key areas of uncertainty in the prediction of permafrost carbon dynamics (Sim et al., 2019). So what can we expect for PBP? We will likely see continued warming, and if 2012 (a warm/dry season) is any indication of future climate warming, we can expect early snowmelt, an earlier opening of ponds, a prolonged thaw season, and extended periods of time during which pond temperatures exceed 15 °C. We can expect pond substrates to thaw earlier in the season and frost tables to deepen; thus, along with increases in evaporation loss, we may see pond water levels dropping below ground level, with some ponds drying out (see Fig. 13 – general schematic of pond response at PBP). This conclusion is supported by Dyke and Sladen (2022), whose modeling efforts notes deeper talik development under shallow ponds dotted on sub-Arctic peat plateau landscapes.
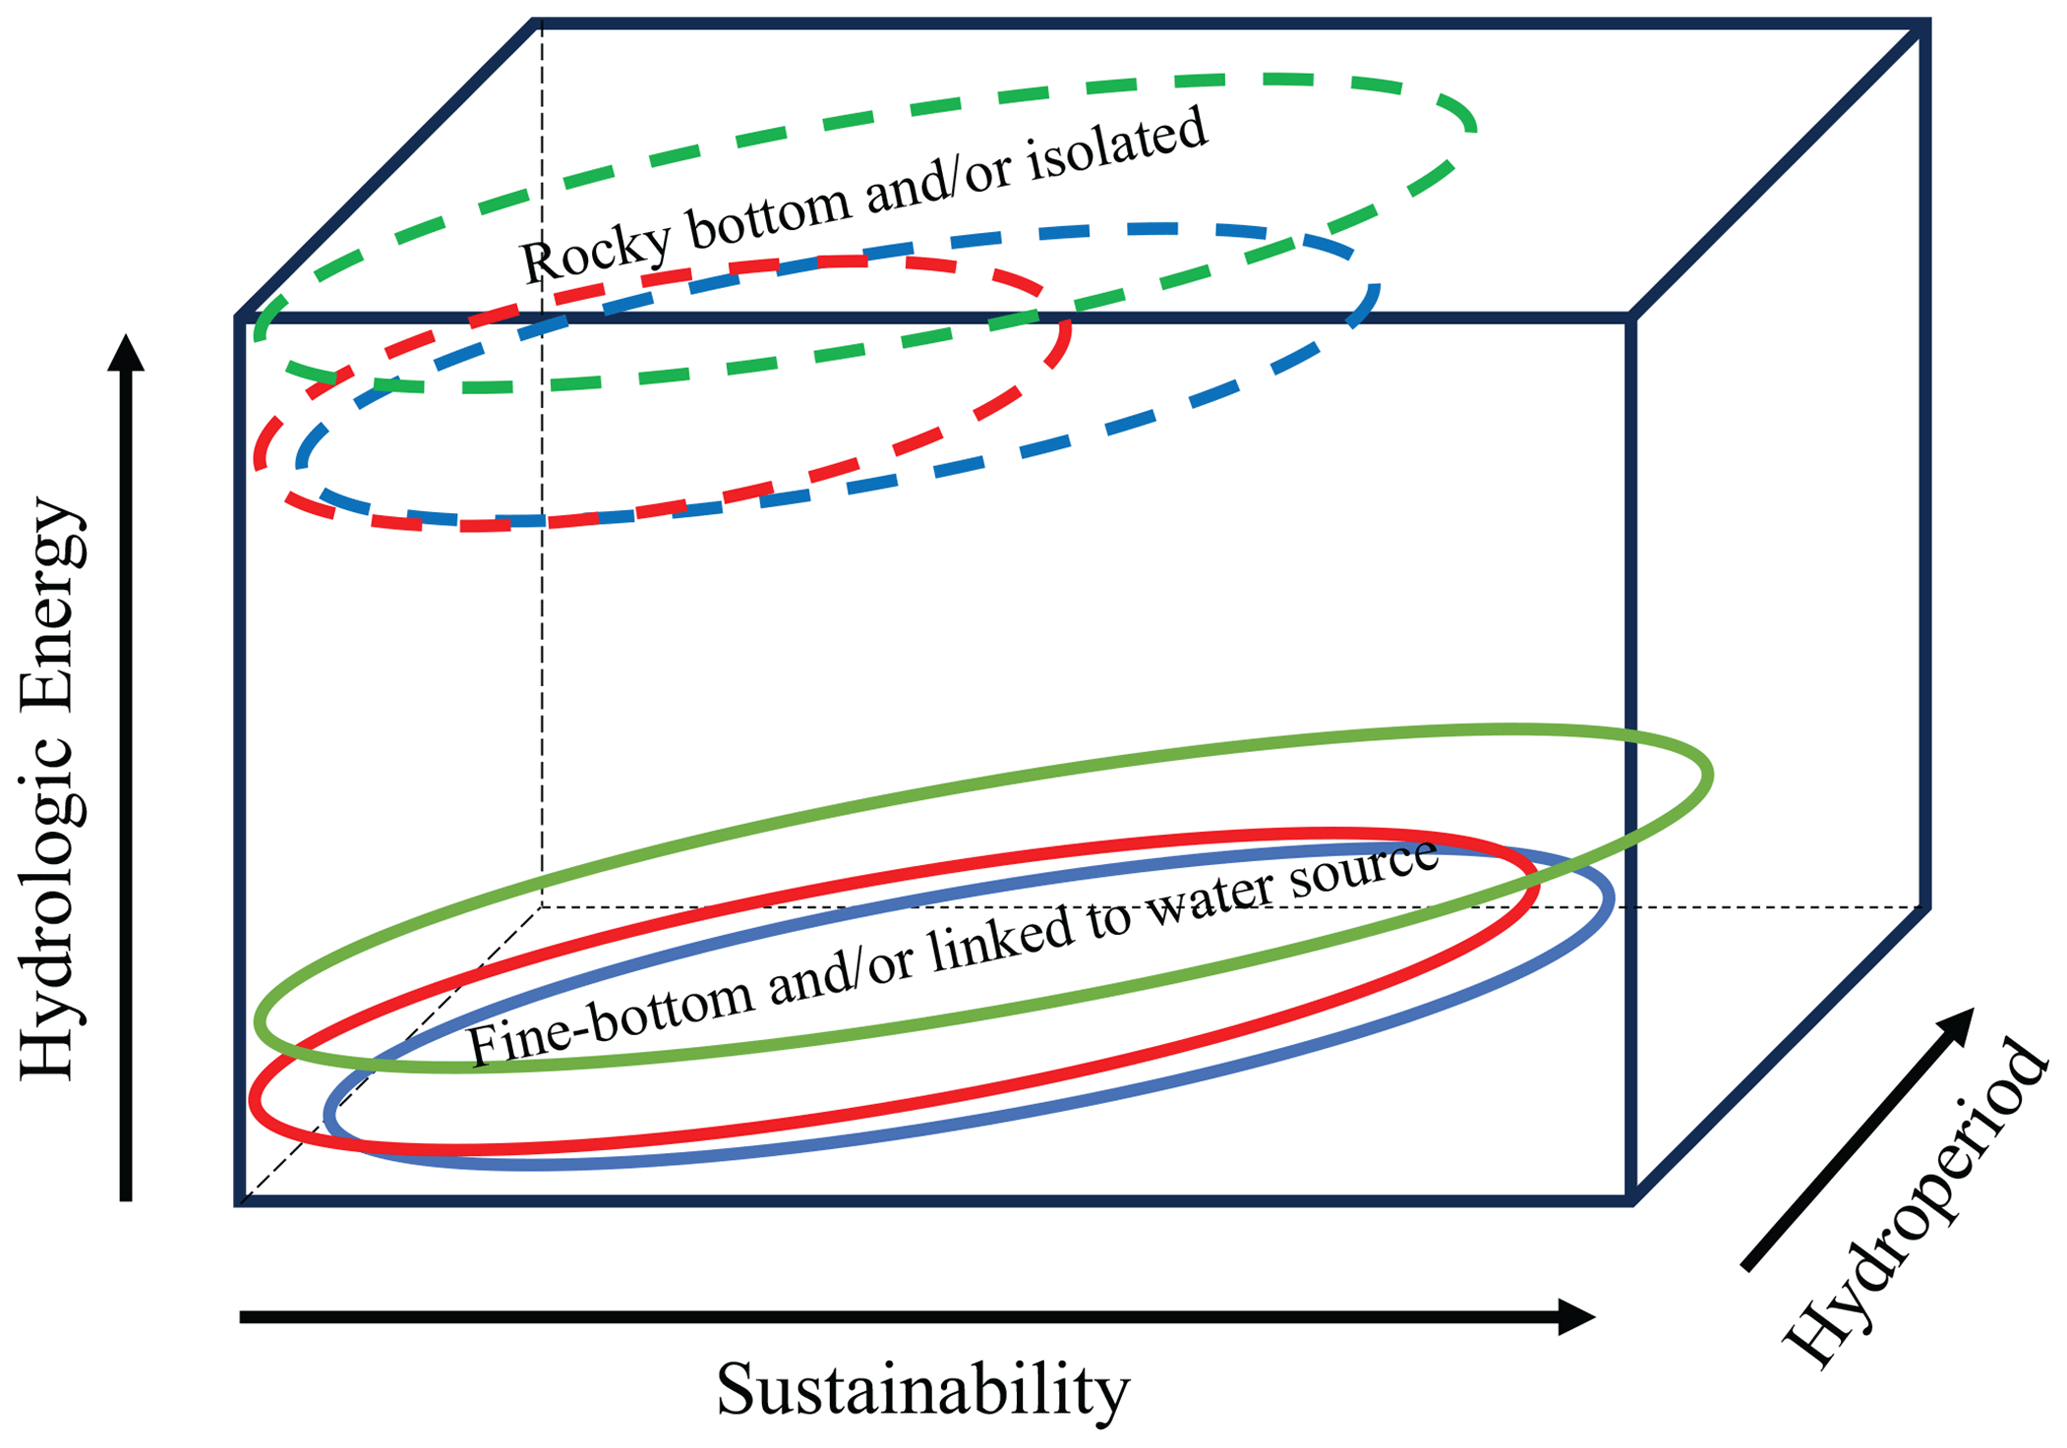
Figure 13Schematic showing the functional integrity of PBP ponds. Blue (solid and dashed) lines represent “present” conditions, red (solid and dashed) lines represent the pond response to “future warm/dry” conditions, and green (solid and dashed) lines represent the response to future “warm/wet” conditions. Hydrologic energy refers to the degree of fluctuation in the water level. Hydroperiod refers to the length of time that the pond contains water over the season. The diagram was adapted from Young and Abnizova (2011).
It is likely that hillslope streams, which now provide some ponds with a source of water for an extended time during the thaw season, may not be a water source for as long (Young, 2019). The current buffering of ponds due to high water temperatures and conductivities due to meltwater contributions of late-lying snow beds will also cease (Woo and Young, 2014). In the high Andes, ponds and wet meadows are now being sustained by meltwaters from melting glaciers, but they are predicted to diminish and disappear by the end of the century. These ponds and wet meadows will then dry out and ultimately disappear (Dangles et al., 2017). Moonmaw et al. (2018) also indicate that permafrost thaw can dramatically affect hydrology and that fen-like systems are vulnerable, as they rely on terrestrial water inputs (e.g., groundwater and streamflow). As these external water sources change or cease to exist, like the rapid loss of late-lying snow beds at PBP and elsewhere across the Arctic islands (Woo and Young, 2014), wetlands will be impacted. At PBP, many irregularly shaped and shallow ponds (e.g., ponds 8 and 11) have already been observed to dry out over summer seasons and vascular plants have been encroaching, suggesting that, in the long-term, certain ponds may transition into wet or dry meadow features (see Fig. 14), thereby eventually altering greenhouse gas emissions (Rehder et al., 2023), snow cover, and evaporation rates, as shifts in vegetation have done elsewhere (Morison et al., 2023).
Figure 14(a) A desiccated pond (Pond 8) on 23 July 2007. (b) Pond 8 on 19 August 2010, showing how Eriophorum scheuchzeri (white cottongrass) is encroaching.
Strong correlations between air temperature and pond Tw will persist, but departures will grow as pond water become warmer than the air temperatures, especially for shallow ponds with dark, rocky substrates (e.g., Pond 11). Lougheed et al. (2011) observed that establishing a direct relationship between air and water temperatures is complicated by wind, water depth, ice cover, and other physical processes that determine temperature in small tundra ponds <0.5 m at the International Biological Program (IBP) site, Barrow, Alaska. They noted that variability in temperature is higher in both the early and late part of the season, which is a pattern that is emerging for PBP ponds as well (see Figs. 2 and 3).
Linderholm et al. (2018) indicate that reanalysis data show an increasing trend in Arctic precipitation over the 20th century, but changes are not homogeneous across seasons or space. Possible increases in 21st-century Arctic late-autumn and winter precipitation counter increased pond evaporation losses to some extent. However, large uncertainties remain with respect to predicting future precipitation patterns (Sim et al., 2019). If there are a series of years in which fall rainfall fails to replenish pond storage deficits and little spring snowmelt occurs, it is likely that these ponds, especially the irregularly shaped and shallow ones, will dry out permanently and that vascular plants will encroach, as has happened to patchy wetlands on Cornwallis Island (Woo and Young, 2014) (see Fig. 14).
The thermal regime of High Arctic ponds was monitored over several years at PBP, a Ramsar wetland of international importance. Variability in pond temperatures occurs on a seasonal and inter-seasonal basis, with ponds responding to warm and cool spring and summer seasons. There is little variation in pond temperatures across the PBP, but linkages to other terrestrial sources besides rainfall and seasonal snowmelt remain important (e.g., Meadow Pond). Prolonged inputs of meltwater from late-lying snowpacks into adjacent ponds serves to dilute and dampen water temperatures for extended periods in the summer.
Ground thaw is variable in ponds, owing to substrate type, water depth, and ground ice content. In the future, an earlier start to ground thaw and deepening of frost tables may drain some shallow ponds, whereas others will be sustained (due to deep waters and abundant ground ice). Like frost table patterns, the water chemistry (i.e., specific conductivity), which reflects evapoconcentration processes, groundwater flow varied amongst these ponds. The rapid and sizable increases in water conductivity at Pond 1 in an extremely warm season (2012) highlight the large shifts in environmental responses that these ponds are now undergoing. Uncertainties about fall precipitation exist for High Arctic regions. If pond storage deficits persist for several years and cannot be augmented by seasonal snowmelt or linkages to other water sources (i.e., late-lying snow beds and streams), more ponds will disappear at PBP and may be replaced by larger wet or dry meadows. This will potentially have an impact on greenhouse gases and the feeding patterns of migratory birds. Finally, future research efforts should focus on the response of other large wetland areas in the Canadian High Arctic, including Alison Inlet (southwest coast of Bathurst) and Truelove Lowland, Devon Island, in order to investigate the response of ponds to future fluctuations in climate.
The data that support the findings of this study are available at https://doi.org/10.5683/SP3/KGRQDO (Young and Brown, 2024).
The supplement related to this article is available online at: https://doi.org/10.5194/hess-28-3931-2024-supplement.
KLY carried out fieldwork, analyzed the field data, and wrote the manuscript. LCB carried out fieldwork, finalized diagrams, and helped to edit the manuscript.
At least one of the (co-)authors is a member of the editorial board of Hydrology and Earth System Sciences. The peer-review process was guided by an independent editor, and the authors also have no other competing interests to declare.
Publisher's note: Copernicus Publications remains neutral with regard to jurisdictional claims made in the text, published maps, institutional affiliations, or any other geographical representation in this paper. While Copernicus Publications makes every effort to include appropriate place names, the final responsibility lies with the authors.
This article is part of the special issue “Northern hydrology in transition – impacts of a changing cryosphere on water resources, ecosystems, and humans (TC/HESS inter-journal SI)”. It is not associated with a conference.
First, we would like to thank the anonymous reviewers, who took the time to read our paper and provided valuable advice and insight. You have all greatly improved the paper. Secondly, we would like to acknowledge sabbatical funding from York University to Kathy L. Young in 2021, which allowed for these data to be analyzed and for a paper to be prepared. From 2006 to 2015, the Canadian government agency Polar Continental Shelf Program (PCSP) provided exceptional logistical support for our work at Polar Bear Pass. We are also grateful to the many undergraduate and graduate students who have worked at Polar Bear Pass to help obtain these environmental data. Jennifer Rausch, a wildlife ecologist with Environment Canada, kindly retrieved pond water temperature data in 2015. John R. Siferd kindly corrected our manuscript (with respect to grammar). Finally, Kathy L. Young presented some of these findings at the 23rd Northern Research Basins Symposium and Workshop held in Northern Sweden, 20–25 August 2023.
This paper was edited by Svetlana Stuefer and reviewed by four anonymous referees.
Abnizova, A.: Hydrology, Carbon Dynamics and Hydrochemical Properties of Ponds in an Extensive Low Gradient High Arctic Wetland, Polar Bear Pass, Bathurst Island, Nunvut, Canada, PhD thesis, Department of Geography, York University, Toronto, Ontario, Canada, OCLC Number: 1032921554, 256 pp., 2013.
Abnizova, A., Young, K. L., and Lafrenière, M.: Pond hydrology and dissolved carbon dynamics at Polar Bear Pass wetland, Bathurst Island, Nunvaut, Ecohydrology, 7, 73–90, 2014.
Andresen, C. G. and Lougheed, V. L.: Disappearing Arctic tundra ponds: Fine-scale analysis of surface hydrology in drained thaw lake basins over a 65 year period (1948–2013), J. Geophys. Res.-Biogeo., 120, 466–479, 2015.
Baker, J., Dupont, D., and Vasseur, L.: Exploring Canadian Ramsar sites ecosystem governance and sustainability, Wetlands, 41, 6, https://doi.org/10.1007/s13157-021-01417-6, 2021.
Benyahya, L., Caissie, D., St-Hilaire, A., Ouarda, T. B. M. J., and Bobée, B.: A review of statistical water temperature models, Can. Water Resour. J., 32, 179–192, 2007.
Bluman, A. G.: Elementary Statistics, McGraw-Hill, ISBN 10.0071220445, 2006.
Croft, A.: A Link between Benthic Macroinvertebrate Diversity and the Hydrology of High Arctic ponds in Polar Bear Pass, Bathurst Island, Nunavut and Cape Bounty, Melville Island, Nunavut, MSc thesis, Department of Geography, York University, Toronto, Ontario, Canada, 138 pp., https://central.bac-lac.gc.ca/.item?id=MR88635&op=pdf&app=Library&oclc_number=910983646 (last access: 24 August 2024), 2011.
Dangles, O., Rabatel, A., Kraemer, M., Zeballos, G., Soruco, A., Jacobsen, D., and Antheime, F.: Ecosystems sentinels for climate change? Evidence of wetland cover changes over the last 30 years in the tropical Andes, PLoS ONE, 12, 30175814, https://doi.org/10.1371/journal.pone.0175814, 2017.
Dranga, S. A., Hayles, S., and Gajewski, K.: Synthesis of limnological data from lakes and ponds across Arctic and Boreal Canada, Arctic Sci., 4, 167–185, 2017.
Dyke, L. D. and Sladen, W. D.: Modelling tundra ponds as initiators of peat plateau thaw, Northern Hudson Bay Lowland, Manitoba, Arctic, 75, 364–377, 2022.
Higgens, R. A. F., Chipman, J. W., Lutz, D. A., Culler, L. E., Virginia, R. A., and Ogden, L. A.: Changing lake dynamics indicate a drier Arctic in Western Greenland, J. Geophys. Res.-Biogeo., 124, 870–883, https://doi.org/10.1029/2019JG004879, 2019.
Johnson, M. F., Wilby, R. L., and Tonne, J. A.: Inferring air-water temperature relationships from river and catchment properties, Hydrol. Process., 28, 2912–2938, 2014.
Kreplin, H. N., Ferrerria, C. S. S., Destouni, G., Keesstra, S. D., Salvati, L., and Kalantari, Z.: Arctic wetland system dynamics under climate warming, WIRes Water, 8 31526, https://doi.org/10.1002/wat2.1526, 2021.
Lehnherr, I., St. Louis, V. L., Sharp, M., Garner, A. S., Smol, J. P., Schiff, S. L., Muir, D. C. G., Mortimer, C. A., Michelutti, N., Tarnocai, C., St. Pierre, K. A., Emerton, C. A., Wiklund, J. A., Köck, G., Lamoureux, S. F., and Talbot, H. : The world's largest High Arctic lake responds rapidly to climate warming, Nat. Commun., 9, 1290, https://doi.org/10.1038/s41467-018-03685-z, 2018.
Linderholm, H. W., Nicolle, M., Francus, P., Gajewski, K., Helama, S., Korhola, A., Solomina, O., Yu, Z., Zhang, P., D'Andrea, W. J., Debret, M., Divine, D. V., Gunnarson, B. E., Loader, N. J., Massei, N., Seftigen, K., Thomas, E. K., Werner, J., Andersson, S., Berntsson, A., Luoto, T. P., Nevalainen, L., Saarni, S., and Väliranta, M.: Arctic hydroclimate variability during the last 2000 years: current understanding and research challenges, Clim. Past, 14, 473–514, https://doi.org/10.5194/cp-14-473-2018, 2018.
Lougheed, V. L., Butler, M. G., McEwen, D. C., and Hobbie, J. E.: Changes in tundra pond limnology: Re-sampling Alaskan ponds after 40 years, Ambio, 40, 589–599, 2011.
McCrystall, M. M., Stroeve, J., Serrezze, M., Forbes, B. C., and Screen, J. A.: New climate models reveal faster and larger increases in Arctic precipitation than previously projected, Nat. Commun., 12, 6765, https://doi.org/10.1038/s41467-021-27031-y, 2021.
McEwen, D. C. and Butler, M. G.: Growing-season temperature change across four decades in an arctic tundra pond, Arctic, 71, 281–291, 2018.
Miller, E. A. and Young, K. L.: Evaluation of the presence of streambed vegetation on storage and runoff in hillslope streams in a High Arctic environment, Ecohydrology, 9, 719–737, 2016.
Miner, K. R., Turetsky, M. R., Malina, E., Bartsch, A., Tamminen, J., McGuire, D., Fix, A., Sweeney, C., Elder, C. D., and Miller, C. E.: Permafrost carbon emissions in a changing Arctic, Nature Reviews Earth and Environ., 3, 55–67, https://doi.org/10.1038/S43017-021-00230-3, 2022.
Moonmaw, W. R., Chmura, G. L., Davies, G. T., Finlayson, C. M., Middleton, B. A., Natali, S. M., Perry, J. E., Roulet, N., and Sutton-Grier, A. E.: Wetlands in a changing climate: Science, policy and management, Wetlands, 38, 183–205, 2018.
Morison, M., Casson, N. J., Mamet, S., Davenport, J., Livingston, T., Fishback, L. A., White, H., and Windsor, A.: Snow, ponds, trees, and frogs: how environmental processes mediate climate change impacts on four subarctic terrestrial and freshwater ecosystems, FACETS, 8, 1–15, 2023.
National Wetlands Working Group: The Canadian Wetland Classification System, 2nd edn., edited by: Warner, B. G. and Rubec, C. D. A., Wetlands Research Centre, University of Waterloo, Waterloo, ON, Canada, 68 pp., ISBN 0-662-25857-6, 1997.
Negandhi, K., Laurion, I., Whiticar, M. J., Galand, P. E., Xiu, X., and Lovejoy, C.: Small thaw ponds: An unaccounted source of methane in the Canadian High Arctic, PLoS ONE, 8, e78204, https://doi.org/10.1038/s41467-021-27031-y, 2013.
Overland, J., Key, J., Hanna, E., Hanssen-Bauer, I., Kim, B.-M., Kim, S.-J., Walsh, J., Wang, M., Bhatt, U., Liu, Y., Stone, R., Cox, C., and Walden, V.: Air temperature, atmospheric circulation, and clouds [in “State of the Climate in 2012”], B. Am. Meteorol. Soc., 94, S111–S113, 2013.
Overland, J., Key, J., Hanna, E., Hanssen-Bauer, I., Kim, B.-M., Kim, S.-J., Walsh, J., Wang, M., Bhatt, U., Liu, Y., Stone, R., Cox, C., and Walden, V.: The lower atmosphere: air temperature, clouds and surface radiation [in “State of the Climate in 2013”], B. Am. Meteorol. Soc., 95, S115–S120, 2014.
Rantanen, M., Karpenchko, A. Y., Lipponen, A., Nordling, K., Hyvarinen, O., Ruosteenoja, K., Vihamo, T., and Laaksonen, A.: The Arctic has warmed nearly four times faster than the globe since 1979, Nature Commun. Earth and Environ., 3, 168, https://doi.org/10.1038/s43247-022-00498-3, 2022.
Rehder, Z., Kleinen, T., Kutzbach, L., Stepanenko, V., Langer, M., and Brovkin, V.: Simulated methane emissions from Arctic ponds are highly sensitive to warming, Biogeosciences, 20, 2837–2855, https://doi.org/10.5194/bg-20-2837-2023, 2023.
Rosenberry, D. O. and Hayashi, M.: Assessing and measuring wetland hydrology, in: Wetland Technqiues, Foundations, Vol. 1, edited by: Anderson, J. T. and Davis, C. A., Springer Science, Dordrecht, 87–225, https://doi.org/10.1007/978-94-007-6860-4_3, 2013.
Roy-Leveillee, P. and Burn, C. R.: Near-shore talik development beneath shallow water in expanding thermokarst lakes, Old Crow Flats, Yukon, J. Geophys. Res.-Earth, 122, 1070–1089, https://doi.org/10.1002/2016JF004022, 2017.
Saros, J. E., Arp, C. D., Bouchard, F., Comte, J., Courture, R-M., Dean, J. F., Lafreniere, M., MacIntyre, S., McGowan, S., Rautio, M., Prater, C., Tank, S. E., Walvoord, M. A., Wickland, K., Antoniades, D., Ayala-Borda, P., Canario, J., Drake, T. W., Folhas, D., Hazukova, V., Kivila, H., Klanten, Y., Lamoureux, S., Laurion, I., Pilla, R. M., Vonk, J. E., Zolkos, S., and Vincent, W.: Sentinel responses of Arctic freshwater systems to climate: linkages, evidence, and a roadmap for future research, Arctic Sci., 9, 356–392, https://doi.org/10.1139/AS-2022-0021, 2023.
Sim, T. G., Swindles, G. T., Morris, P. J., Galka, M., Mullan, D., and Galloway, J. M.: Pathways for ecological change in Canadian High Arctic wetlands under rapid twentieth century warming, Geol. Res. Lett., 46, 4726–4737, 2019.
Smol, J. P. and Douglas, M. S. V.: Crossing the final ecological threshold in high Arctic ponds, P. Natl. Acad. Sci. USA, 104, 12395–12397, 2007.
Webb, E. E., Liljedahl, A. K., Cordeiro, J. A., Loranty, M. M., Witharana, C., and Lichstein, J. W.: Permafrost thaw drives surface water decline across lake-rich regions of the Arctic, Nat. Clim. Change, 12, 841–846, https://doi.org/10.1038/s41558-022-01455-w, 2022.
Woo, M. K.: Permafrost Hydrology, Springer, Heidelberg, https://doi.org/10.1007/978-3-642-23462-0, 2012.
Woo, M. K. and Guan, X. J.: Hydrological connectivity and seasonal storage change in a polar oasis environment, Canadian High Arctic, Permafrost Periglac., 17, 309–323, 2006.
Woo, M. K. and Young, K. L.: Disappearing semi-permanent snow in the High Arctic and its consequences, J. Glaciol., 60, 192–200, 2014.
Wrona, F. J., Johansson, M., Culp, J. M., Jenkins, A., Mård, J., Myers-Smith, I. H., Prowse, T. D., Vincent, W. F., and Wookey, P. A.: Transitions in Arctic ecosystems: Ecological implications of a changing hydrological regime, J. Geophys. Res.-Biogeo., 121, 650–674, 2016.
Young, K. L.: Swings in runoff at Polar Bear Pass: An extensive low-gradient wetland, Bathurst Island, Canada, Hydrol. Res., 50, 778–792, 2019.
Young, K. L. and Abnizova, A.: Hydrologic thresholds of ponds in a polar desert wetland environment, Somerset Island, Nunavut, Canada, Wetlands, 31, 535–549, 2011.
Young, K. L. and Brown, L. C.: Replication Data for: Thermal Regime of High Arctic Tundra Ponds, Nanuit Itillinga (Polar Bear Pass), Nunavut, Canada, Borealis [data set], V2, https://doi.org/10.5683/SP3/KGRQDO, 2024.
Young, K. L. and Labine, C.: Summer hydroclimatology of an extensive low-gradient wetland: Polar Bear Pass, Bathurst Island, Nunavut, Canada, Hydrol. Res., 44, 2–20, 2010.
Young, K. L. and Woo, M. K.: Frost table development beneath patchy wetlands in a continuous permafrost, High Arctic setting, in: Proc. of the 8th Inter. Conf. on Permafrost, 21–25 July 2003, Zurich, Switzerland, 1265–1270, 2003.
Young, K. L., Assini, J., Abnizova, A., and Miller, E.: Snowcover and melt characteristics of upland/lowland terrain: Polar Bear Pass, Bathurst Island, Nunavut, Canada, Hydrol. Res., 44, 2–20, 2013.
Young, K. L., Scheffel, H.-A., Abnizova, A., and Siferd, J.: Spatial and temporal dynamics of groundwater flow across a wet meadow, Polar Bear Pass, Bathurst Island, Nunavut, Permafrost Periglac., 28, 405–419, 2017.
Young, K. L., Brown, L., and Labine, C.: Snow cover variability at Polar Bear Pass, Nunavut, Arctic Sci., 4, 669–690, 2018.
Zandt, M. H., Liebner, S., and Welte, C. U.: Roles of thermokarst lakes in a warming world, Trends Microbiol., 28, 769–779, https://doi.org/10.1016/j.tim.2020.04.002, 2020.