the Creative Commons Attribution 4.0 License.
the Creative Commons Attribution 4.0 License.
 | 20 Aug 2024
An increase in the spatial extent of European floods over the last 70 years
Emanuele Bevacqua
Oldrich Rakovec
Jakob Zscheischler
Floods regularly cause substantial damage worldwide. Changing flood characteristics, e.g., due to climate change, pose challenges to flood risk management. The spatial extent of floods is an important indicator of potential impacts, as consequences of widespread floods are particularly difficult to mitigate. The highly uneven station distribution in space and time, however, limits the ability to quantify flood characteristics and, in particular, changes in flood extents over large regions. Here, we use observation-driven routed runoff simulations over the last 70 years in Europe from a state-of-the-art hydrological model (the mesoscale Hydrologic Model – mHM) to identify large spatiotemporally connected flood events. Our identified spatiotemporal flood events compare well against an independent flood impact database. We find that flood extents increase by 11.3 % on average across Europe. This increase occurs over most of Europe, except for parts of eastern and southwestern Europe. Over northern Europe, the increase in flood extent is mainly driven by the overall increase in flood magnitude caused by increasing precipitation and snowmelt. In contrast, the increasing trend in flood extent over central Europe can be attributed to an increase in the spatial extent of heavy precipitation. Overall, our study illustrates the opportunities to combine long-term consistent regional runoff simulations with a spatiotemporal flood detection algorithm to identify large-scale trends in key flood characteristics and their drivers. The detected change in flood extent should be considered in risk assessments as it may challenge flood control and water resource management.
- Article
(21059 KB) - Full-text XML
- BibTeX
- EndNote


River floods are a hazard that can endanger lives, damage properties, and seriously disrupt communities. Overall, river floods cause annual global losses of around USD 104 billion and have the largest population exposure compared to other natural hazards (United Nations Office for Disaster Risk Reduction, 2015). Due to large-scale weather conditions such as widespread precipitation extremes (Bevacqua et al., 2021) and certain landscape properties, when a river experiences a flood, the surrounding rivers might experience floods simultaneously (Berghuijs et al., 2019a). Such widespread river floods might cause overall impacts that could surpass the sum of individual localized flood events (Zscheischler et al., 2018, 2020), in particular when limits for emergency response, disaster rescue, and insurance payouts are exceeded (Kemter et al., 2020; Jongman et al., 2014). For instance, in July 2021, devastating floods induced by extreme rainfall swept through several countries across Europe, including Austria, Belgium, Croatia, Germany, Italy, Luxembourg, the Netherlands, and Switzerland. In total, the floods took over 200 lives and caused damages of more than USD 54 billion (Tradowsky et al., 2023). Events such as this illustrate the importance of assessing spatially connected river floods to improve risk analysis and flood risk management today and in the future.
So far, previous research has predominantly examined flood events based on a single basin or regional perspective. Studies focusing on flood extent are often confined to a limited number of events or regions (Blöschl et al., 2013; De Luca et al., 2017; Kundzewicz et al., 2013; Merz et al., 2018; Stadtherr et al., 2016), and approaches that allow for quantification of the spatial extent of floods across multiple basins or regions are limited (Berghuijs et al., 2019a). To fill this gap, Berghuijs et al. (2019a) proposed the concept of a “flood synchrony scale” to measure the spatial scale of cross-basin floods. Furthermore, Brunner et al. (2020) and Brunner and Fischer (2022) used “flood connectedness” to identify the spatial dependence of flood events over remote regions. Based on these concepts, factors and driving processes that influence the spatial synchrony scale and spatial dependence of floods could be explored. Localized conditions (e.g., topography, soil type) as well as driving mechanisms (e.g., rainfall-driven or snowmelt-induced floods) were found to influence the spatial extent and dependence of floods (Berghuijs et al., 2019a; Brunner and Fischer, 2022; Kemter et al., 2020).
Despite the advances revealed by these pioneering studies, their conclusions rely on observed data from station measurements. Consequently, their findings are constrained by the spatially uneven distribution of these stations, and they might miss important information in regions where data are scarce. This issue can be addressed by using grid-based runoff simulations (Alfieri et al., 2013; Kumar et al., 2013; Niu et al., 2011; Samaniego et al., 2010; Sutanudjaja et al., 2018). Grid-based runoff simulations enable the employment of spatiotemporal event detection algorithms, which have already been successfully applied to analyze extreme events such as heatwaves, droughts, and extreme events in the carbon cycle (Fang and Lu, 2020; Luo et al., 2022; Vogel et al., 2020; Zscheischler et al., 2013, 2014) and which can be used to study flood connectivity in space and time.
The occurrence and characteristics of floods have been observed to change over recent decades, potentially as a response to global warming, which affects flood generation processes (Berghuijs et al., 2019a; Blöschl et al., 2017, 2019; Jiang et al., 2022, 2024; Tarasova et al., 2023). For instance, flood magnitude and timing were revealed to change due to region-dependent shifting patterns of snowmelt, rainfall, and soil moisture (Berghuijs et al., 2019b; Blöschl et al., 2017, 2019). Similarly, changes in flood generation processes can influence the anomalies in the frequency of river floods, i.e., flood-rich or flood-poor periods (Blöschl et al., 2020; Lun et al., 2020; Tarasova et al., 2023). Regarding changes in flood extent, Berghuijs et al. (2019a) reported a general growth in the flood synchrony scale over Europe from 1960 to 2010. Kemter et al. (2020) further suggested a strong association between these changes in extent and shifts in flood magnitude. However, flood extent can potentially be influenced not only by changes in runoff magnitude, but also by changes in the spatial dependence of high-runoff events. For example, Bevacqua et al. (2021) attributed the change in the spatial extent of winter precipitation extremes to the change in precipitation magnitude and spatial dependence, and they further quantified their relative contributions.
In this study, we first apply a spatiotemporal event detection algorithm to state-of-the-art runoff simulations over the last 70 years over Europe to identify and characterize large connected flood events. We compare our identified floods against an independent flood impact database to evaluate our approach. We then quantify changes in key flood characteristics, e.g., the spatial extent, and attribute changes to changes in the flood generation processes as well as changes in flood magnitude and dependence.
2.1 Data
We use daily routed runoff simulations over Europe from the hydrological model (mesoscale Hydrologic Model, mHM; Kumar et al., 2013; Samaniego et al., 2010) driven by observational data (E-OBS, version: 25.0e, Cornes et al., 2018) for the period 1951–2020. The mHM routed runoff is available from the UFZ data portal (Rakovec et al., 2023). The spatial resolution of the routed runoff is 0.125°. The model setup is based on an earlier study (Rakovec et al., 2022) and was recently extensively evaluated against multipoint Integrated Carbon Observation System (ICOS) observations across Europe (Pohl et al., 2023). Here, we used the Hargreaves–Samani method (Hargreaves and Samani, 1985) to estimate daily potential evapotranspiration. For the spin-up of the mHM, the model was first initialized in 1950–1959, and then the restart file of 1959 was read as an initial condition in 1940 run until 1949. This means that, in total, 20 years were used to create steady-state conditions starting in 1950. A spatial mask is further applied to exclude catchments with headwater or contributing areas outside the E-OBS domain (Lehner et al., 2008).
To verify the robustness of our findings and to address model and forcing uncertainties, we use data from two additional gridded runoff simulations: the Global Flood Awareness System (GloFAS; https://www.globalfloods.eu/, last access: 20 September 2023, Grimaldi et al., 2022) and mHM simulations driven by the fifth generation of the European Centre for Medium-Range Weather Forecasts (ECMWF) atmospheric reanalysis datasets (ERA5, Hersbach et al., 2023). GloFAS spans from 1979 to 2020, with a spatial resolution of 0.05°, while the mHM simulation driven by ERA5 forcings extends from 1960 to 2020 with a resolution of 0.125°. Note that, to compare the results, we only consider the periods overlapping with mHM simulations driven by E-OBS data.
We further use precipitation and temperature from E-OBS and snowmelt and soil moisture derived from the mHM for flood event classification and trend attribution. To estimate population exposure to floods, we use version 4 of the Gridded Population of the World (GPWv4) for the year 2000 (Center for International Earth Science Information Network – CIESIN – Columbia University, 2018). We aggregated the population data by summing up the population at a 2.5 arcmin resolution within each 0.125° grid cell to match the resolution of the mHM simulations.
2.2 Model evaluation
To evaluate mHM performance, we use runoff stations from the Global Runoff Data Centre (GRDC) dataset (https://grdc.bafg.de/GRDC/EN/Home/homepage_node.html, last access: 1 November 2021). Specifically, we first map GRDC runoff stations to corresponding mHM grid cells by identifying stations and grid cells whose catchment areas differ by less than 10 %: there are 361 in total. The predictive accuracy of mHM simulations is accessed with the Nash–Sutcliffe efficiency (NSE) (Nash and Sutcliffe, 1970). Then, following Tarasova et al. (2023), we compare the simulated annual maximum runoff and peak timing with observations. In addition, we identify consecutive flood days at each grid cell (termed flood spells) and further evaluate the mHM's capability to replicate the spatiotemporal organization of runoff extremes by comparing the number and trends of flood spells that constitute flood events.
In addition to the grid-based model evaluation, we further compare the identified set of spatiotemporal flood events (see Sect. 2.3) against an impact-based European flood record (Natural Hazards in Europe, HANZE, Paprotny et al., 2018), spanning from 1870 to 2016. Here we compare the flood-affected regions provided by HANZE against the areas we have identified as flooded. An observed flood is regarded as detected in our dataset if the recorded flooding region overlaps with any identified floods within a ±3 d time window and vice versa. It is important to note that HANZE includes only destructive floods with significant damage to people or property, while our identified floods encompass hydrological extremes, which may not necessarily result in damage, e.g., in the case of little exposure and/or vulnerability. Note that the HANZE dataset is not used for formal validation of our flood events due to the large differences in the severity levels of floods between these two datasets. Instead, it serves more as a comparison to assess our flood detection algorithm's adequacy, particularly in capturing impactful floods, even with a relatively moderate detection threshold.
2.3 Identification and characterization of flood events
To identify the spatiotemporal evolution of flood events, we define flood days using the peak-over-threshold (POT) approach (Merz et al., 2016; Liu and Zhang, 2017). We consider a day to be a flood day when runoff surpasses the local 99th percentile based on the reference period of 1951–1980, and we construct flood events by concatenating spatiotemporally connected flood days (Fang and Lu, 2020; Vogel et al., 2020; Zscheischler et al., 2013, 2014). To this end, we first create spatially connected flood patches at each time step by grouping neighboring flood days if they share an edge or vertex (at least one of eight neighbors must be a flood day). We then calculate the overlap ratio between flood patches over two consecutive time steps. If the area ratios of the overlap region to both the previous and present patches are larger than 0.4, these two time steps are further combined to form a single event (Fang and Lu, 2020). Our results are not sensitive to the choice of this overlap ratio.
Once the flood event database is established, we proceed to quantify their characteristics, including extent, duration, intensity, and seasonality. Extent denotes the total area affected by the flood event. Duration measures the time between the first start and last end dates. Intensity is computed by summing the routed runoff exceedance relative to the detection threshold (99th percentile) over all the grid cells within a spatiotemporal event. Note that, to exclude non-riverine floods, our analysis focuses exclusively on flood events involving at least one grid cell of a main stream, i.e., a river with a catchment area larger than 1000 km2. The intensity calculation is limited to these mainstream grid cells. Additionally, we define the flood mean seasonality at each grid cell as follows: we first assign the first start date of flood events to each grid cell within the respective event and then average over all the start dates in a grid cell using circular statistics (Hall and Blöschl, 2018). When assessing spatial patterns, we assign the characteristics of spatiotemporal flood events to each grid cell within the event.
2.4 Classification of flood events
To explore the relationship between flood extent and flood drivers, we categorize flood events into two primary types: snowmelt-driven and rainfall-driven flood events. To this end, we adapted the classification method from Tarasova et al. (2023) to better align with our event-based classification approach. Specifically, we first define the contributing period at each grid cell within the spatiotemporal flood event as the time window starting from 6 d before the onset of the flood event (at the considered grid cell) to the end of the event. Then the total amount of precipitation and snowmelt within the contributing period is calculated and compared. If the ratio of snowmelt amount to total rainfall surpasses 0.7 (Tarasova et al., 2023), the flood is categorized as snowmelt-driven. Otherwise, it is regarded as rainfall-driven. Using different thresholds does not affect our conclusions.
2.5 Attribution of changes in flood extent
In general, the occurrence of a compound event is shaped by the multivariate probability density function (pdf) associated with the variables describing the event (François and Vrac, 2023; Singh et al., 2021; Zscheischler and Seneviratne, 2017). According to copula theory, a multivariate pdf can be decomposed into marginal pdfs and the copula describing the dependence between the individual variables (Sklar, 1973). Therefore, compound event changes can be shaped by changes in the marginal pdfs and changes in the dependence structure (Bevacqua et al., 2021; Zscheischler and Seneviratne, 2017). In our specific case, the marginal distributions describe the runoff at individual locations, while the dependence describes the dependence between the runoffs at different locations. Quantifying the contribution to the compound event changes from marginal distributions and dependencies is common in compound event research as it provides insights into the origins of changes (François and Vrac, 2023; Bevacqua et al., 2021, 2020a).
Here, we quantify the change in flood extent as , where Epast and Epres denote the average flood extent over the past period (1951–1980) and present period (1991–2020), respectively. Following Bevacqua et al. (2021), we further quantify the contribution to changes in flood extent from changes in (1) runoff magnitude and (2) spatial dependence in the runoff field. Specifically, for each grid cell, we estimate (1) as , where Emagn denotes the flood extent under the hypothetical condition that only the runoff magnitude changes without changes in dependence. Emagn is derived from flood events in a spatiotemporal field of river runoff obtained by transforming data at each grid cell as , where Rpast and are routed runoff and its empirical cumulative distribution function (ECDF), respectively, in the past period. Similarly, is the ECDF of the present-day Rpres. Note that this corresponds to adjusting the ECDF of runoff over the past period based on the ECDF of the present period using quantile mapping (Cannon et al., 2015). Based on this new hypothetical river runoff at each grid cell, we again identify spatiotemporally connected flood events, quantify their spatial extents, and assign the extents to each grid cell within the corresponding event to obtain Emagn. Accordingly, (2) is estimated as , where Edep denotes the flood extent under the hypothetical condition that only the dependence changes without changes in the runoff magnitude. To achieve this, we estimate flood extents Edep from the transformed runoff .
We tested the significance of the difference between the two periods with a Student's t test using a significance level of 0.05. The overall workflow of this paper is presented in Fig. 1.
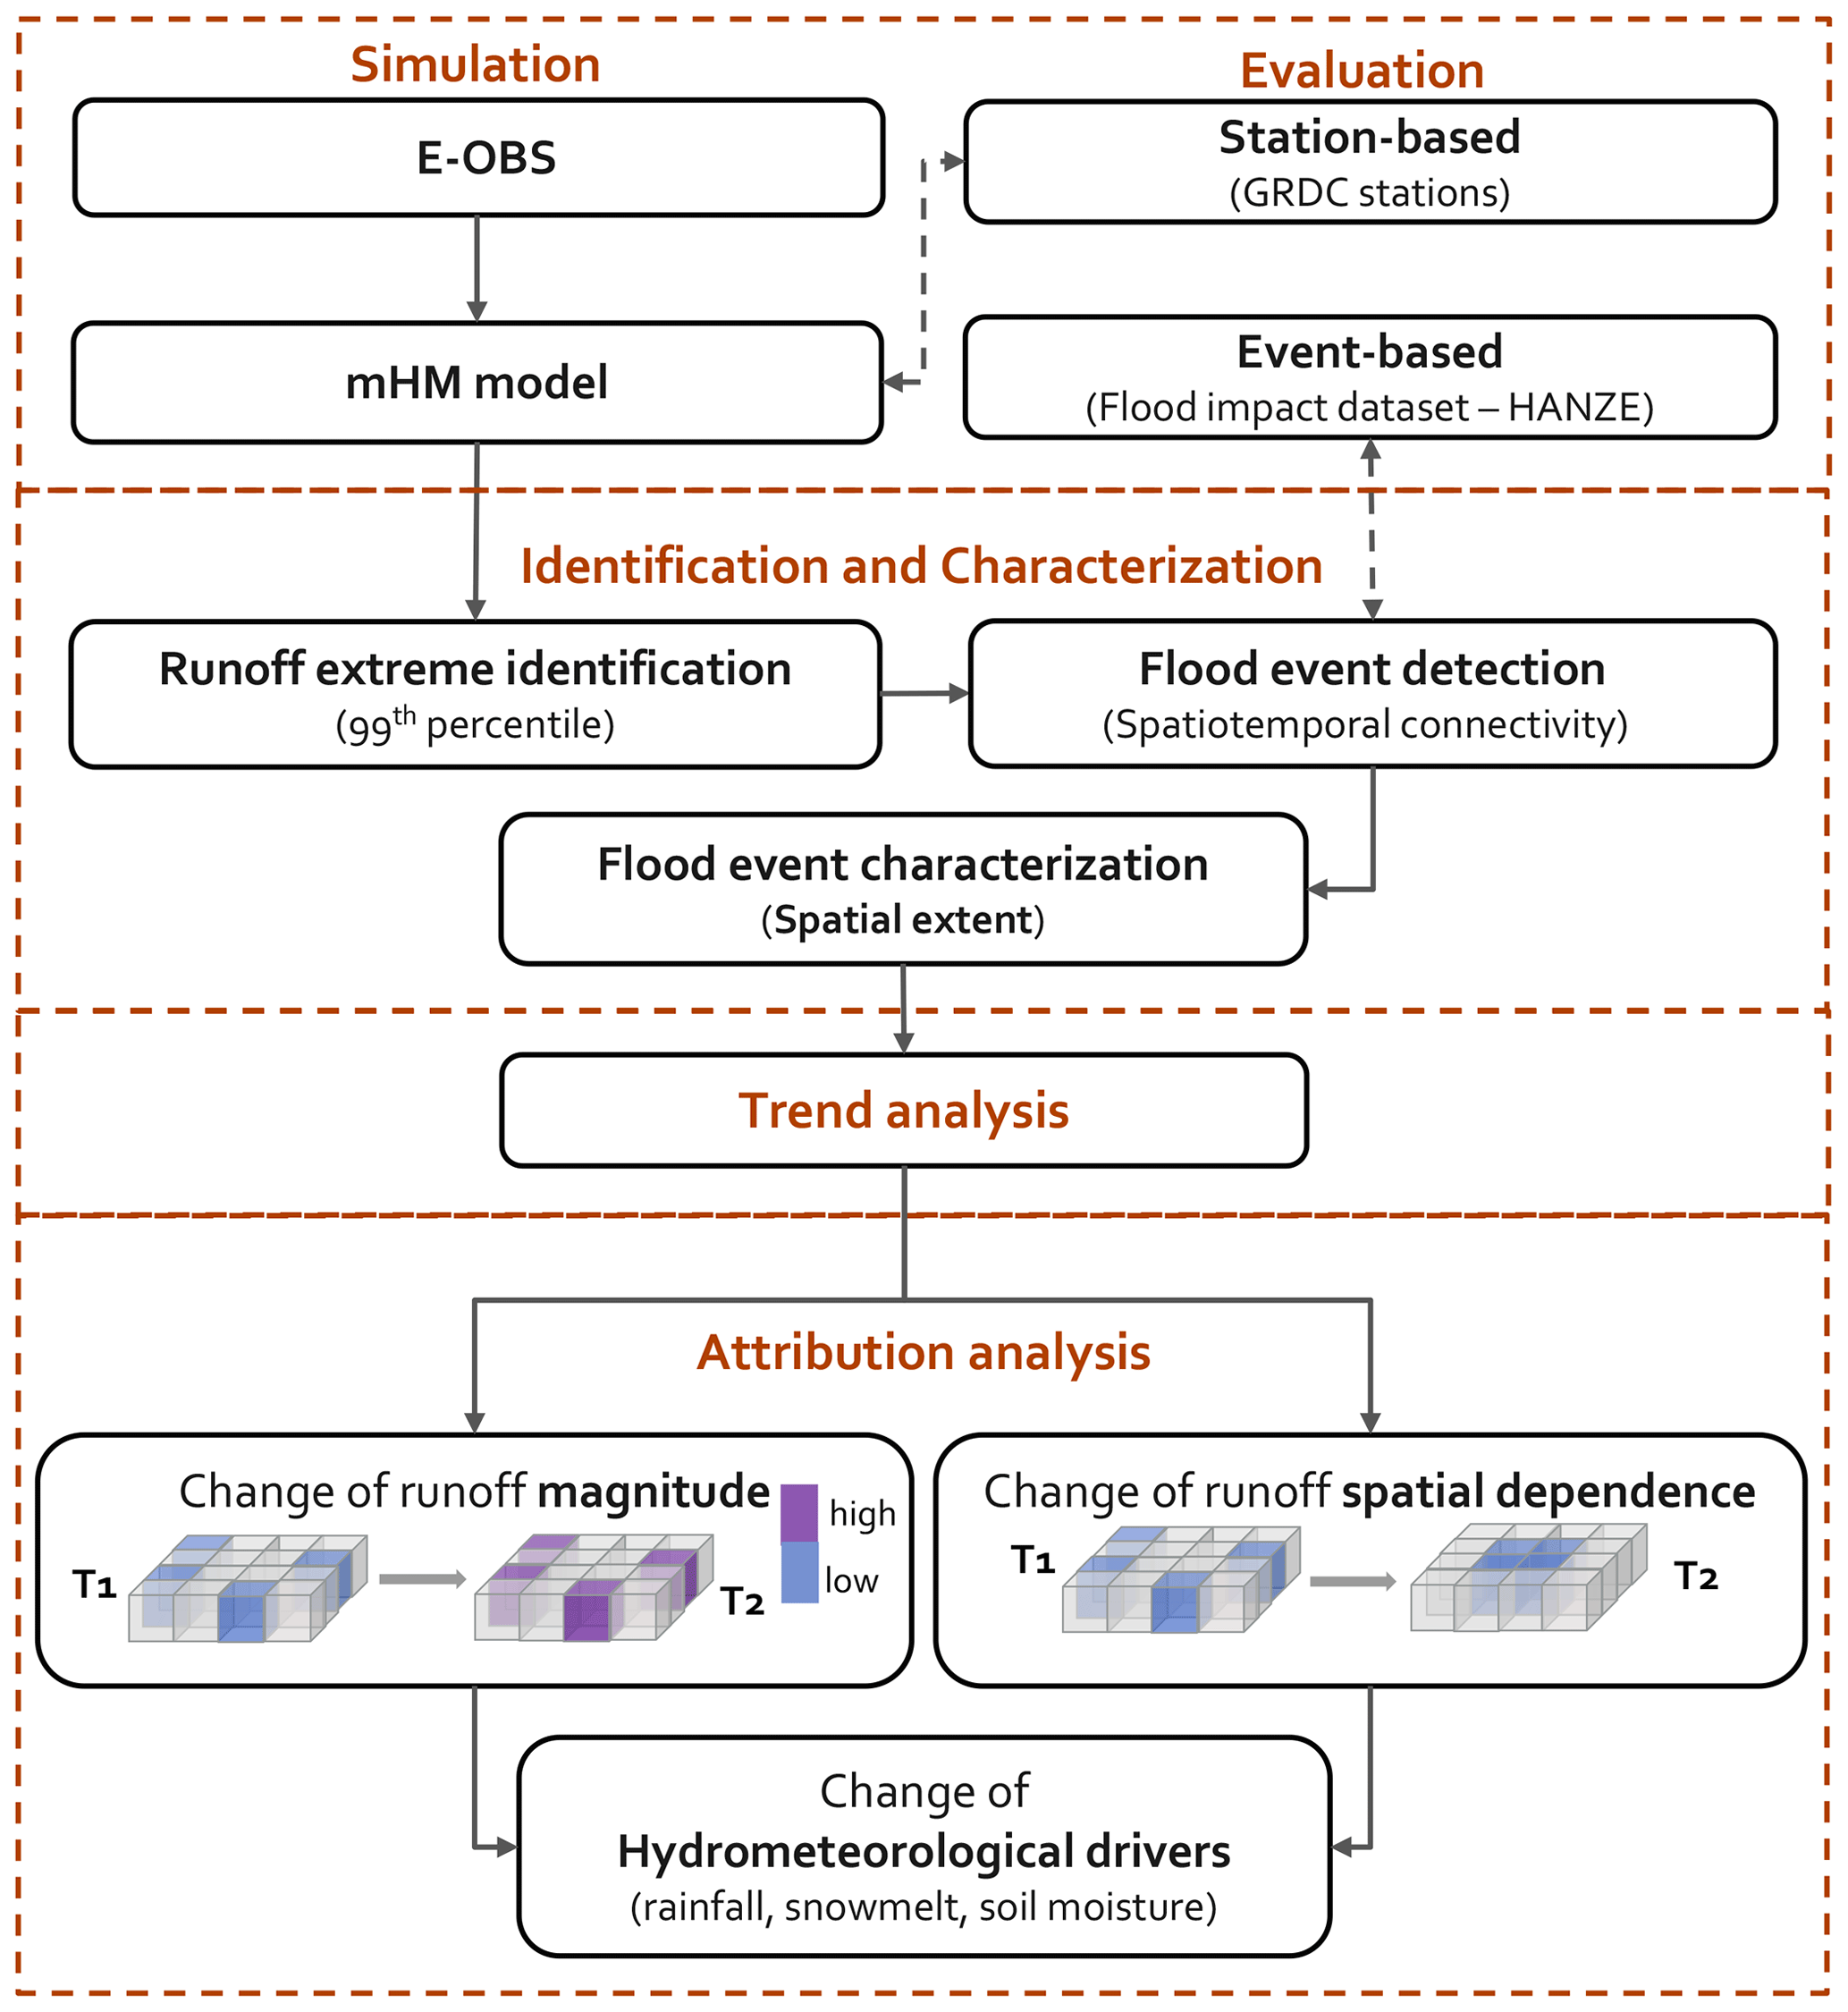
Figure 1Main workflow of the study. The figure outlines the main analysis steps undertaken in this paper. In addition to the mHM simulations driven by E-OBS data, we analyze and compare the results obtained against mHM simulation driven by ERA5 data and the GloFAS dataset.
3.1 Model and flood detection evaluation
The mHM generally performs satisfactorily in simulating routed runoff, with a NSE over half of the GRDC stations exceeding 0.5 (Fig. 2a). However, there are spatial variations in model performance. The mHM achieves its highest performance in parts of western Europe, including Germany and England, where the NSE reaches 0.8. In contrast, the model performs relatively poorly in northern Europe, particularly in lake-rich southern Finland. Note that, since our primary goal is to quantify the spatial extent of flood events accurately, we focus more on the model's ability to capture the spatiotemporal organization of runoff extremes rather than the absolute value of daily runoff.
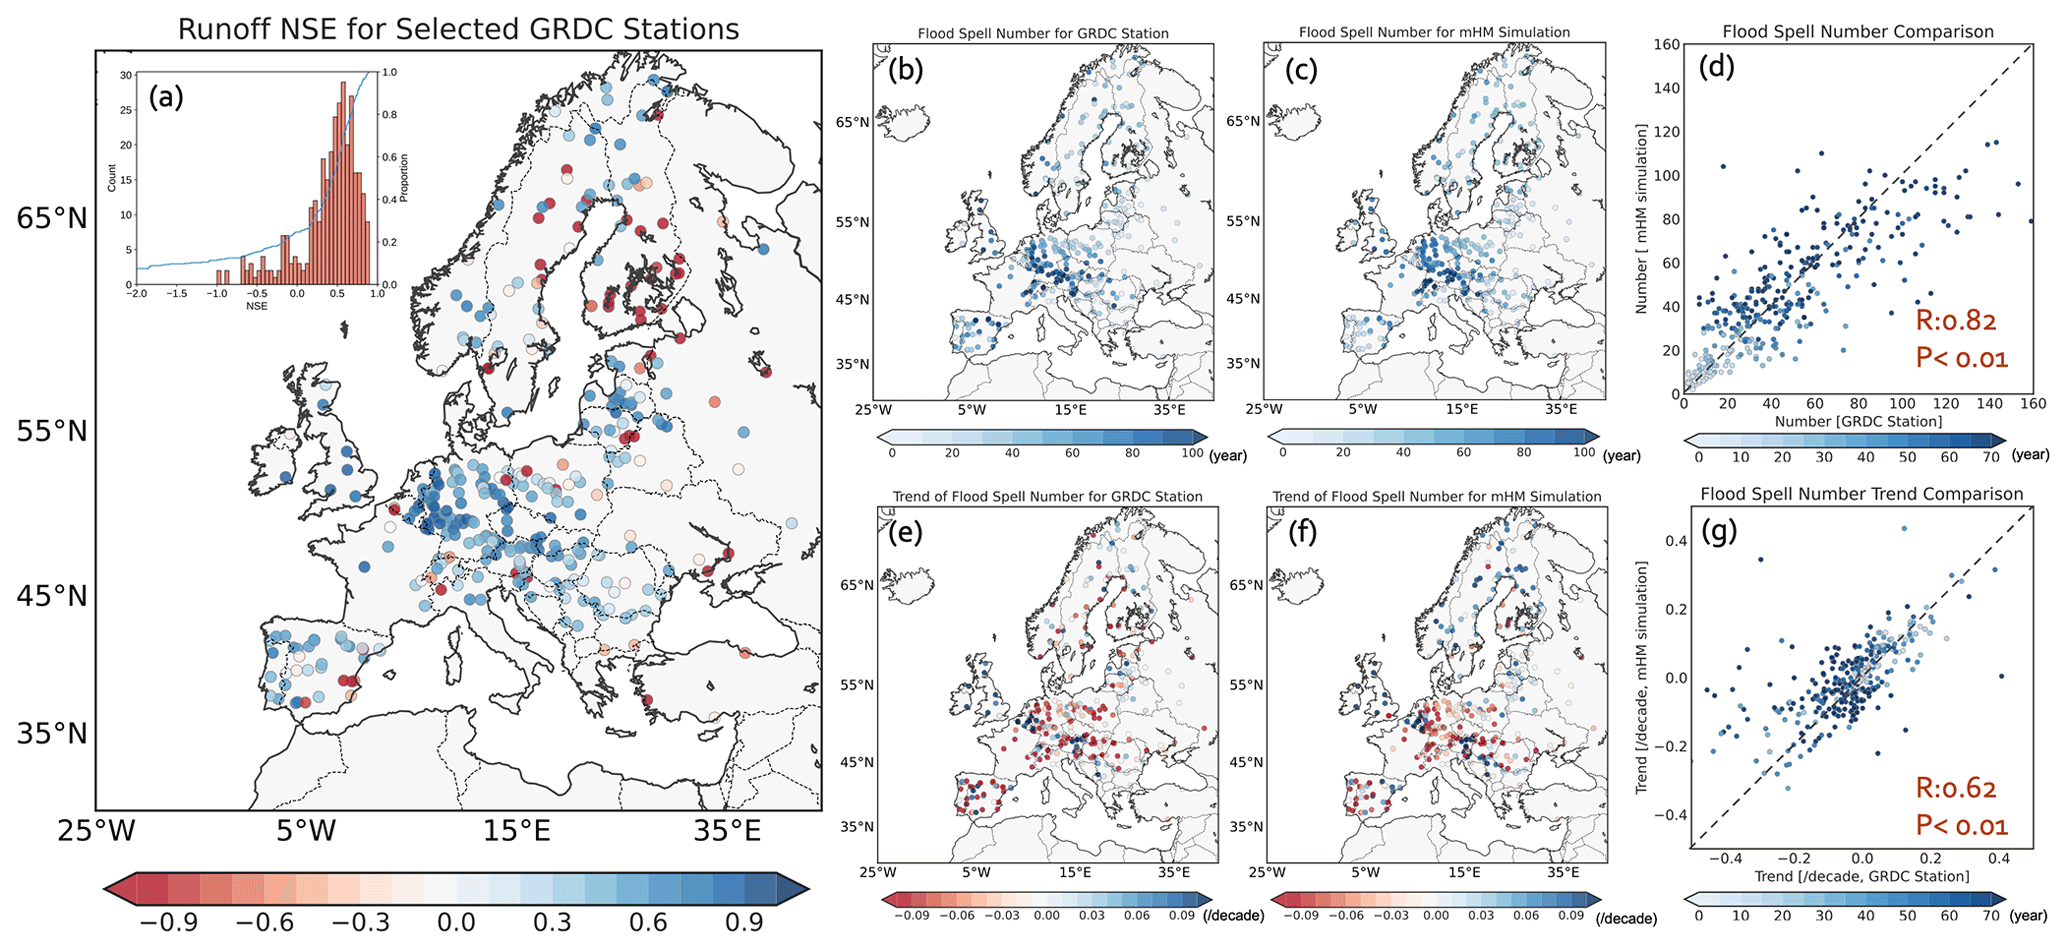
Figure 2Evaluation of routed mHM runoff simulations. (a) Nash–Sutcliffe efficiency (NSE) between routed runoff from GRDC stations and corresponding mHM grid cells. Number of flood spells for (b) GRDC stations and (c) mHM grid cells. Trend of flood spells for (e) GRDC stations and (f) mHM grid cells. Scatterplot of the (d) number and (g) trend of flood spells between GRDC stations and mHM grid cells. Color bars in panels (e) and (f) denote the trend of spells (unit: spells per decade). Color bars in panels (d) and (g) denote the data length (unit: years) for selected GRDC stations.
Hence, we further test the consistency between the number and trends of flood spells to evaluate model performance in reproducing the temporal structure of extreme streamflow. The mHM simulation shows largely consistent spatial patterns with GRDC stations for both the number and trends of flood spells, despite slightly overestimating trends in flood spells in northern Europe. The spatial correlations between the number and trends of simulated flood spells and the observed ones are 0.82 and 0.62, respectively. Additionally, the mHM shows decent performance in simulating the magnitude (correlation: 0.7) and timing of the annual maximum runoff (Fig. A1), which is comparable to other studies (Tarasova et al., 2023).
To further assess the suitability of our flood detection algorithm, we compare the identified flood events with the impact-based HANZE dataset (Fig. A2). Among the four types of recorded flood events in HANZE (i.e., river flood, flash flood, coastal flood, and compound flood), we only consider the first two types of flood in this study, as the mHM cannot simulate tide or storm surge. Our dataset successfully detects 75 % of river floods (349 out of 483) and 39 % of flash floods (244 out of 623) over the shared period of 1951–2016. The lower detection rate of flash floods can be attributed to its definition, i.e., river floods lasting less than 24 h. Consequently, flash floods are very short with a small spatial extent (Fig. A2c and d), making them more challenging to detect. Also, many flash floods are located in coastal regions, which might add to the difficulty of detection (Fig. A2b). Notably, our study only focuses on flood events involving grid cells with mainstreams, thereby potentially excluding certain small rivers.
Turning the comparison around, when focusing on the largest 100 detected spatiotemporal flood events, we find that 36 of those are documented in HANZE. Many of the largest floods detected in the mHM simulations occur in northern Europe, where the population density is rather low, leading to insignificant or limited impacts on human society (Fig. 3a). When flood intensity is weighed by population exposure, most of the top 100 floods occur in populated regions like western and central Europe, and the detection rate increases to 50 %. Overall, the consistency between our identified flood events and the HANZE dataset underscores the reliability of our data-driven flood database, rendering it suitable for further analysis.
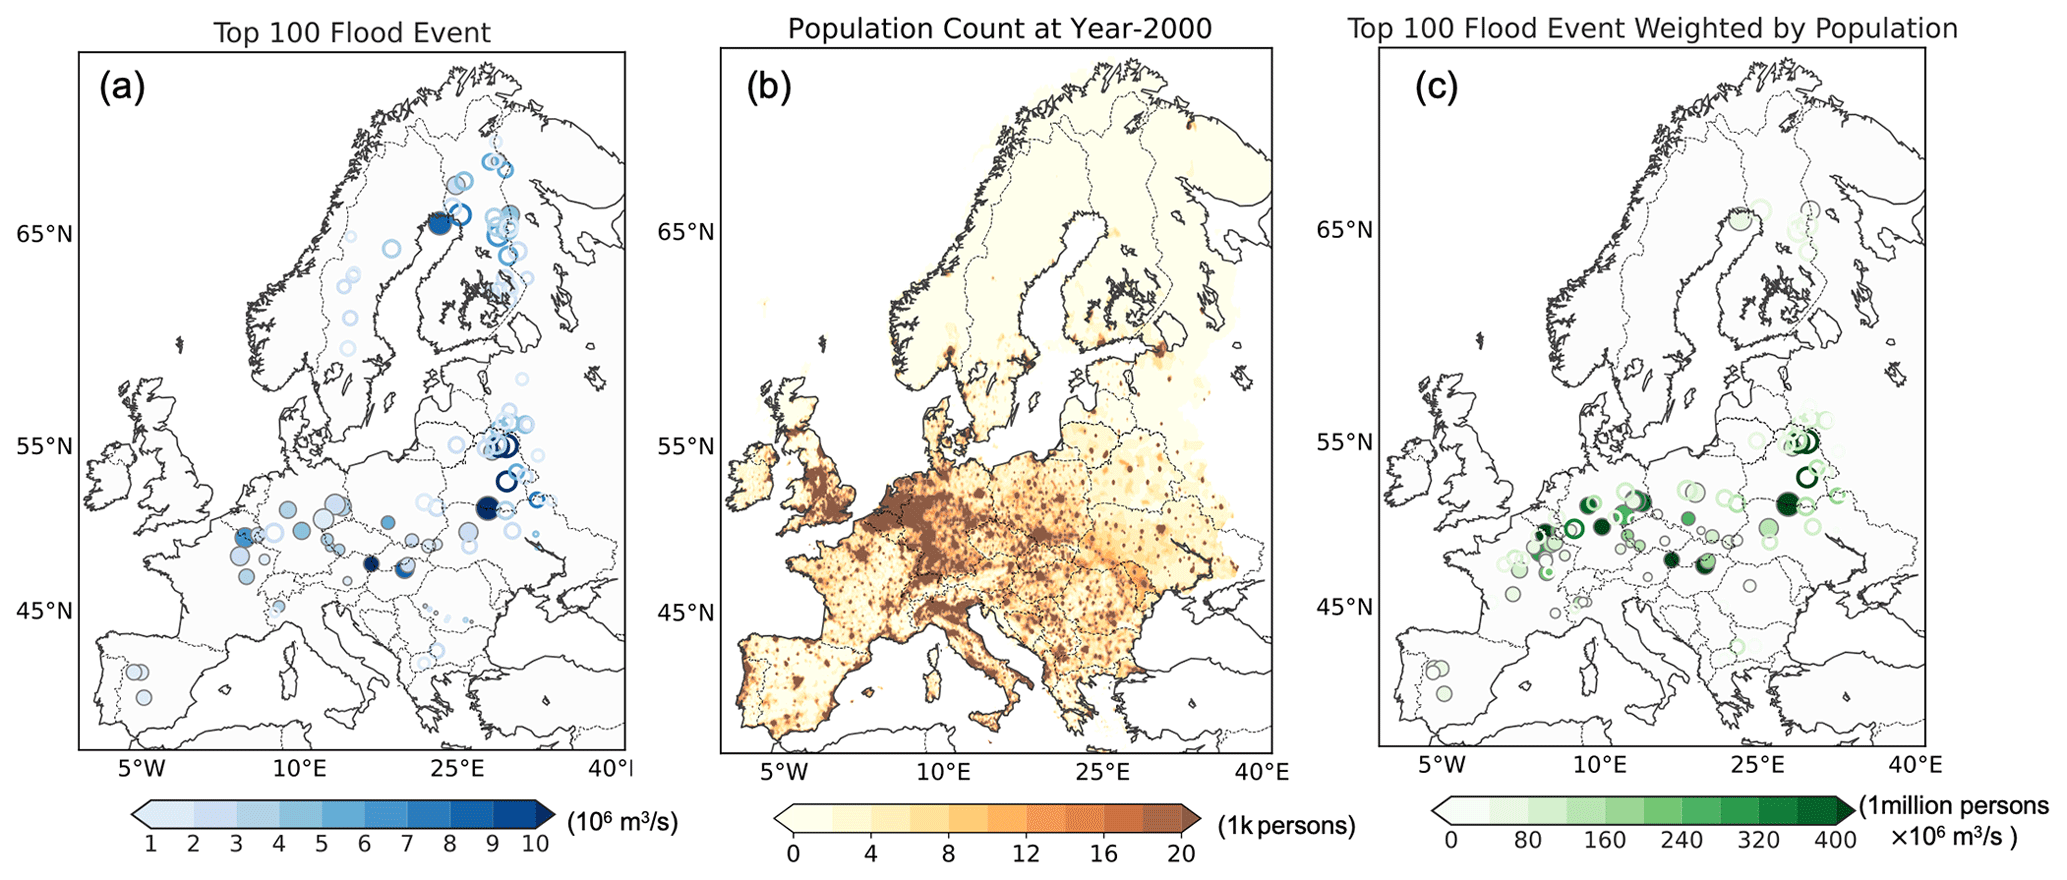
Figure 3(a) Identified top 100 flood events ranked by flood intensity (106 m3 s−1). (b) European population count (1000 persons). (c) Top 100 flood events ranked by flood intensity weighted by population exposure (1 million persons × 106 m3 s−1). The solid and hollow circles in panels (a) and (c) denote the flood events recorded and not recorded, respectively, in the HANZE database. The size and color of the circles denote the spatial extent and intensity, respectively, of the flood events (see Sect. 2.3).
3.2 Characteristics of large European floods
The mean flood extent over all the detected floods is 6814 km2. We assign the characteristics of spatiotemporal flood events to each grid cell within the event to study (changes in) spatial patterns. Note that, as larger events cover many more grid cells, cell-based statistics are therefore weighted towards larger floods compared to event-based statistics. Floods in the plain regions (e.g., central and eastern Europe) are more widespread than those in mountainous regions like the Alps and Italy (Fig. 4a). For example, the mean spatial extent of floods in eastern Europe, particularly along the Dnipro River, reaches up to 400 000 km2, while floods in the Alps or mountainous regions of Italy are much more localized, with an averaged spatial coverage smaller than 40 000 km2. Such a spatial pattern of the flood extent aligns closely with findings based on the flood synchrony scale from a station-based perspective (Berghuijs et al., 2019a). Land–sea distribution may affect flood extent. For instance, for regions like Italy, the surrounding sea may limit the potential for flood expansion. Since widespread floods typically last longer than more localized ones, the spatial distribution of flood duration mirrors the extent pattern (Fig. 4b). As a result, and given the same frequency of the total flood days across the study area (by definition, 1 % of the study period), certain regions in western Europe, such as England and France, are prone to experiencing more frequent (Fig. 4c) but shorter and smaller floods. In contrast, eastern Europe and northern Europe are characterized by less frequent but longer and larger floods.
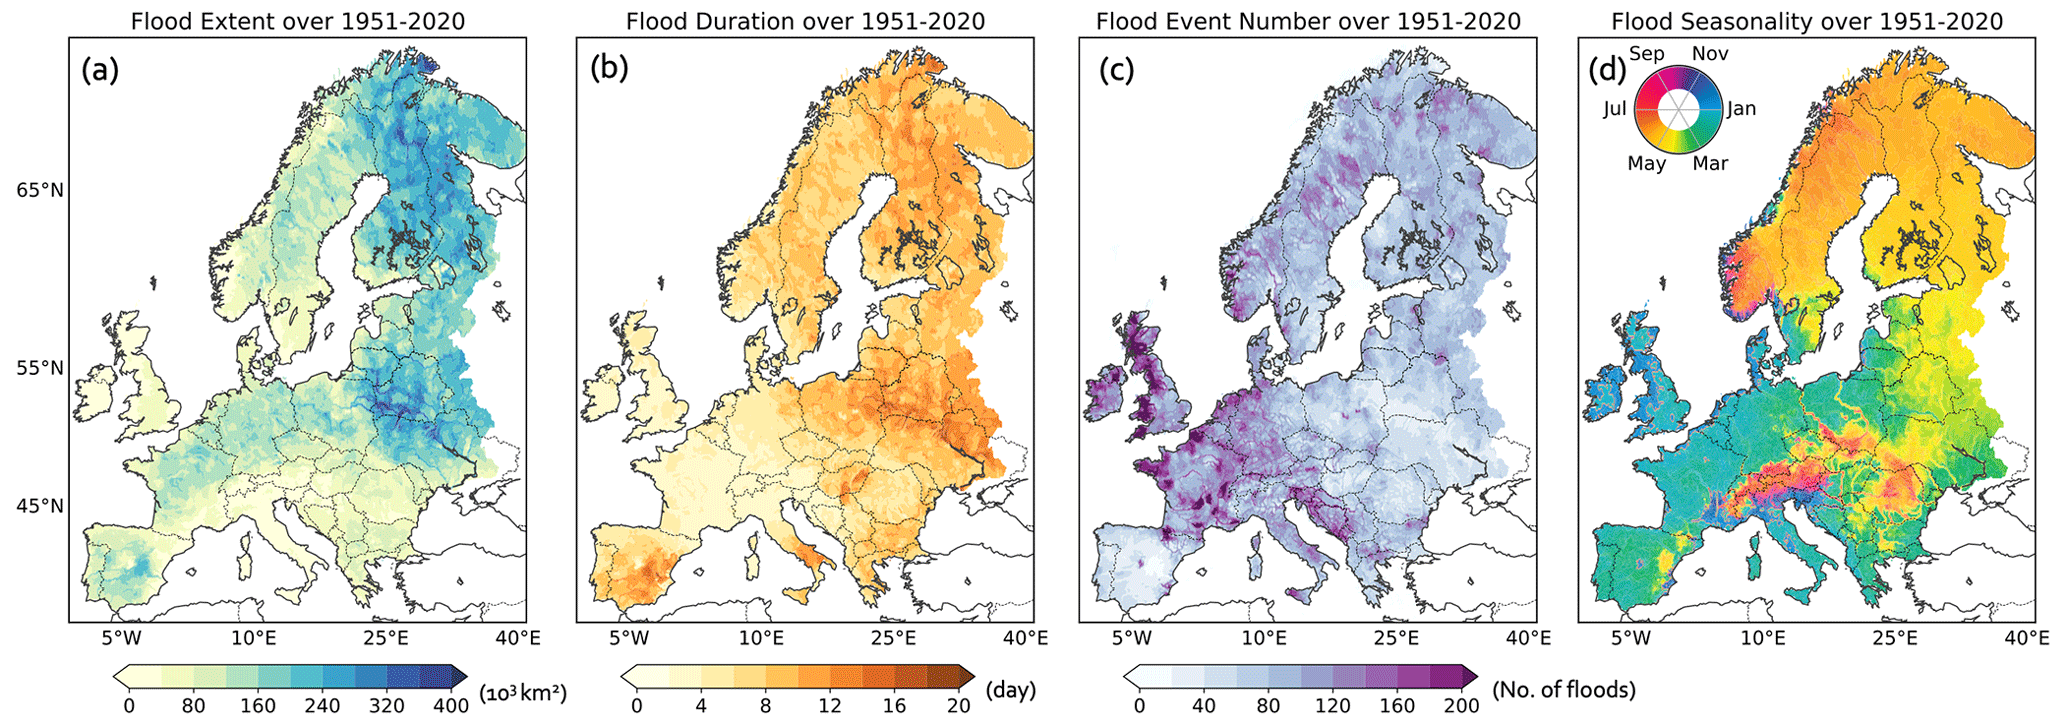
Figure 4Flood event number and characteristics over 1951–2020. (a) Mean flood extent (103 km2). (b) Mean flood duration (d). (c) Total number of flood events. (d) Flood seasonality, i.e., the averaged timing of the start dates of the flood events.
In the main paper, we report mean statistics, while the median and 90th percentiles are provided in Appendix A (Fig. A3). Mean statistics are strongly influenced by extreme values, given the skewed distribution of flood characteristics. All the statistics depend somewhat on the employed threshold for flood detection (i.e., the 99th percentile in this study).
The spatial distribution of flood extents is influenced not only by topography, but also by flood generation processes (Brunner and Fischer, 2022; Kemter et al., 2020). Inspired by the findings of Brunner and Fischer (2022), who highlighted that snow-influenced floods exhibit stronger spatial connectedness than rainfall-driven ones, we categorize our flood events as snow-driven and rainfall-driven floods to investigate the role of the flood generation process in modulating the flood extent. As expected, and consistent with prior studies (Jiang et al., 2022, 2024; Kemter et al., 2020), snow-driven floods dominate northern and eastern Europe (Fig. 5a) and typically occur in late spring (Fig. 4d). Other high-snow-fraction regions (Jiang et al., 2022), like the Alps and the Carpathian Mountains, are also dominated by snowmelt-induced floods, with a later flooding season in summer (Fig. 4d). In contrast, rainfall-driven floods prevail in western and southern Europe (Fig. 5c) and burst in winter (Fig. 4d). A relatively clear dividing line between these two regions with different driving processes stretches from the Carpathian Mountains to the north of Poland (Fig. 5a and c). Similar to Brunner and Fischer (2022), our findings indicate that snowmelt-driven floods tend to exhibit larger spatial expansion than precipitation-driven ones (Fig. 5b and d), with mean extents of 8018 and 6282 km2, respectively. Even within the same region, such as central and eastern Europe, the spatial extension of snowmelt-driven floods is nearly double that of rainfall-driven floods (Fig. 5c and d). This difference is likely related to the greater spatial homogeneity of snowmelt, which results from relatively uniform warming in spring, as opposed to the more localized heavy-precipitation events in winter (Brunner and Fischer, 2022). The presented results are robust under different thresholds for defining floods.
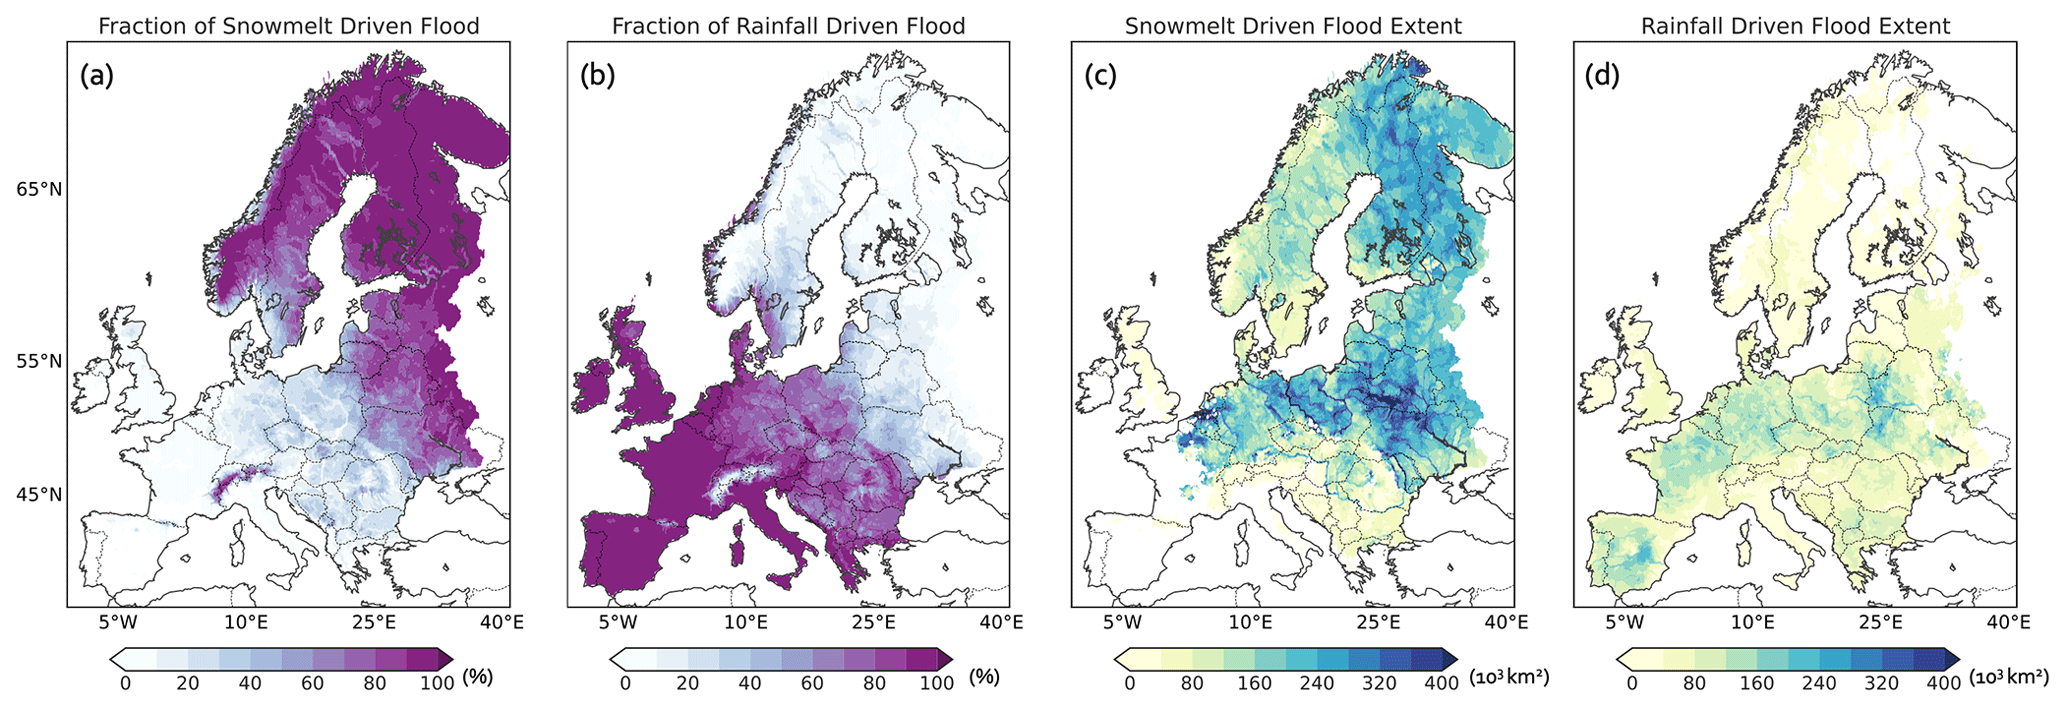
Figure 5Fraction (%) of snowmelt-driven (a) and rainfall-driven (b) floods over the period 1951–2020. The spatial extent of snowmelt-driven (c) and rainfall-driven (d) flood events (103 km2).
3.3 Increasing spatial extent of European floods
Averaged across Europe, both flood frequency and extent have increased over the past 7 decades (Fig. 6a). The extents have increased by 11.3 % (Fig. 6a), mostly related to the expansion of snowmelt-driven floods (Fig. 6b). To assess the spatial variations of these changes, we compare flood frequency and extent over two 30-year periods: 1951–1980 and 1991–2020. We find that flood events increased in frequency by ∼40 % across the snowmelt-driven flood regions, i.e., in northern Europe (Fig. 7a–c). Conversely, flood events decreased over parts of western (e.g., Germany), southern (e.g., Spain), and eastern Europe (e.g., Ukraine), except for many coastal areas (Fig. 7c). Large spatial variation is also observed in the change in the flood extent (Fig. 7d–f). Overall, 63.9 % of the study area exhibits an increase in the flood extent, and for 18 % of the increasing regions, the changes are statistically significant (Fig. 7f). Regions affected by an increase include parts of Norway and Finland in northern Europe, England, Denmark and Germany in western and central Europe, and Italy and Greece in southern Europe. In contrast, flood events in other regions tend to be more localized in the more recent decades, especially in parts of eastern Europe (e.g., Ukraine and Belarus) and southern Europe (e.g., Portugal and Spain).
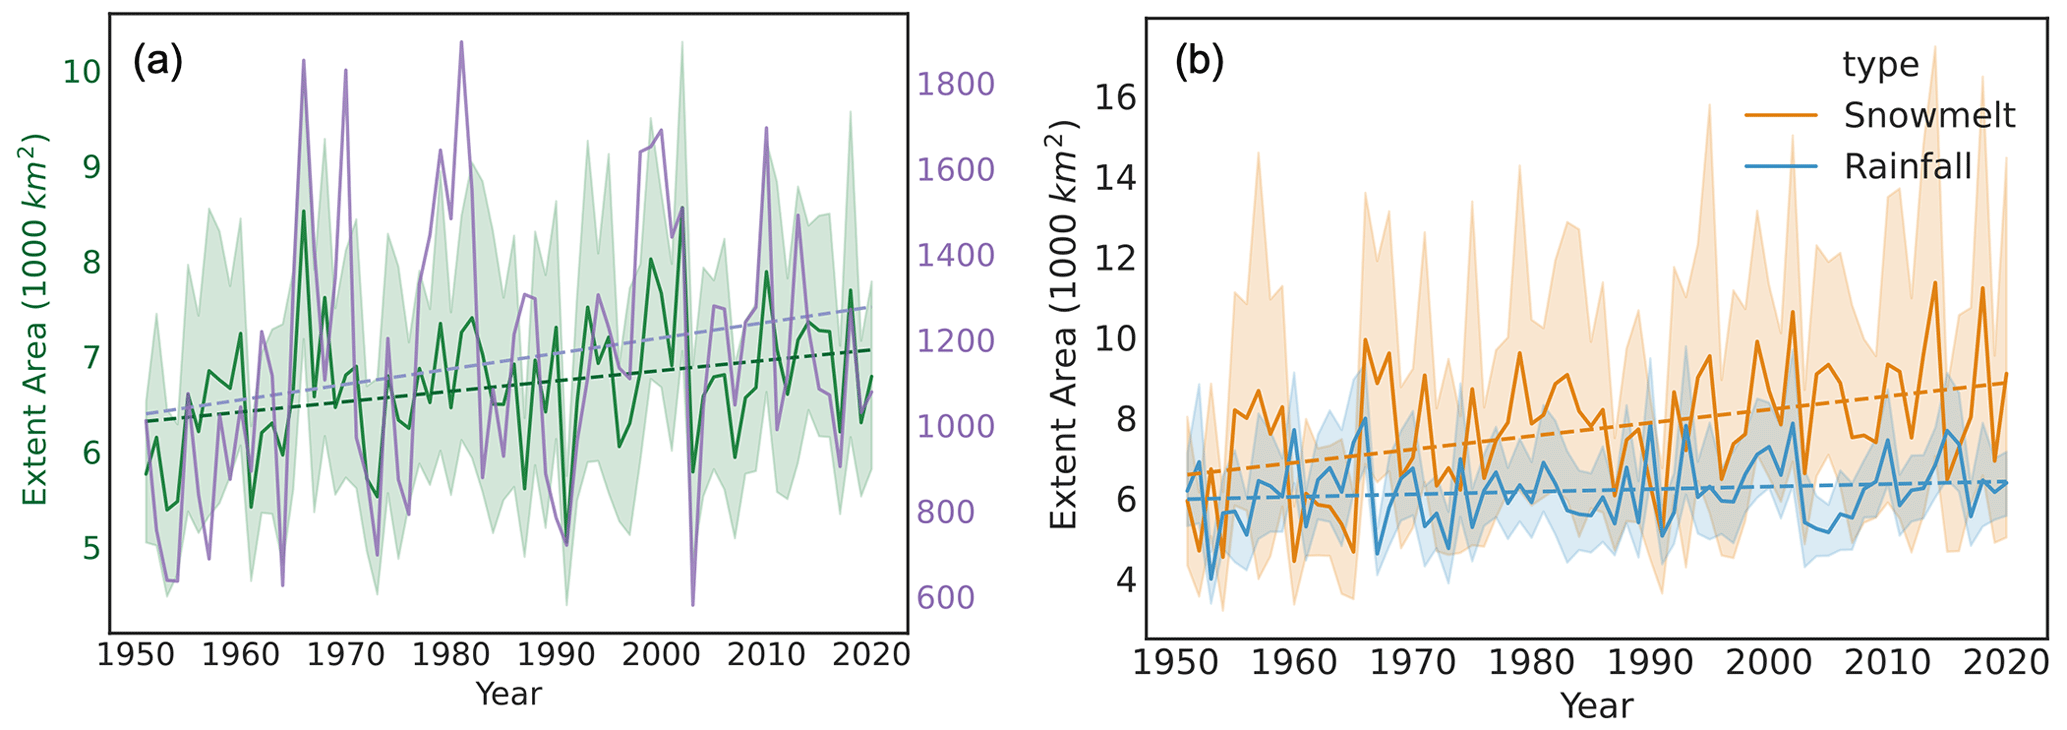
Figure 6(a) Interannual variation of flood extent and flood frequency over 1951–2020. (b) Interannual variation of flood extent for snowmelt-driven and rainfall-driven floods over 1951–2020. The shaded areas in panels (a) and (b) denote the 90 % confidence interval around the mean flood extent for each year.
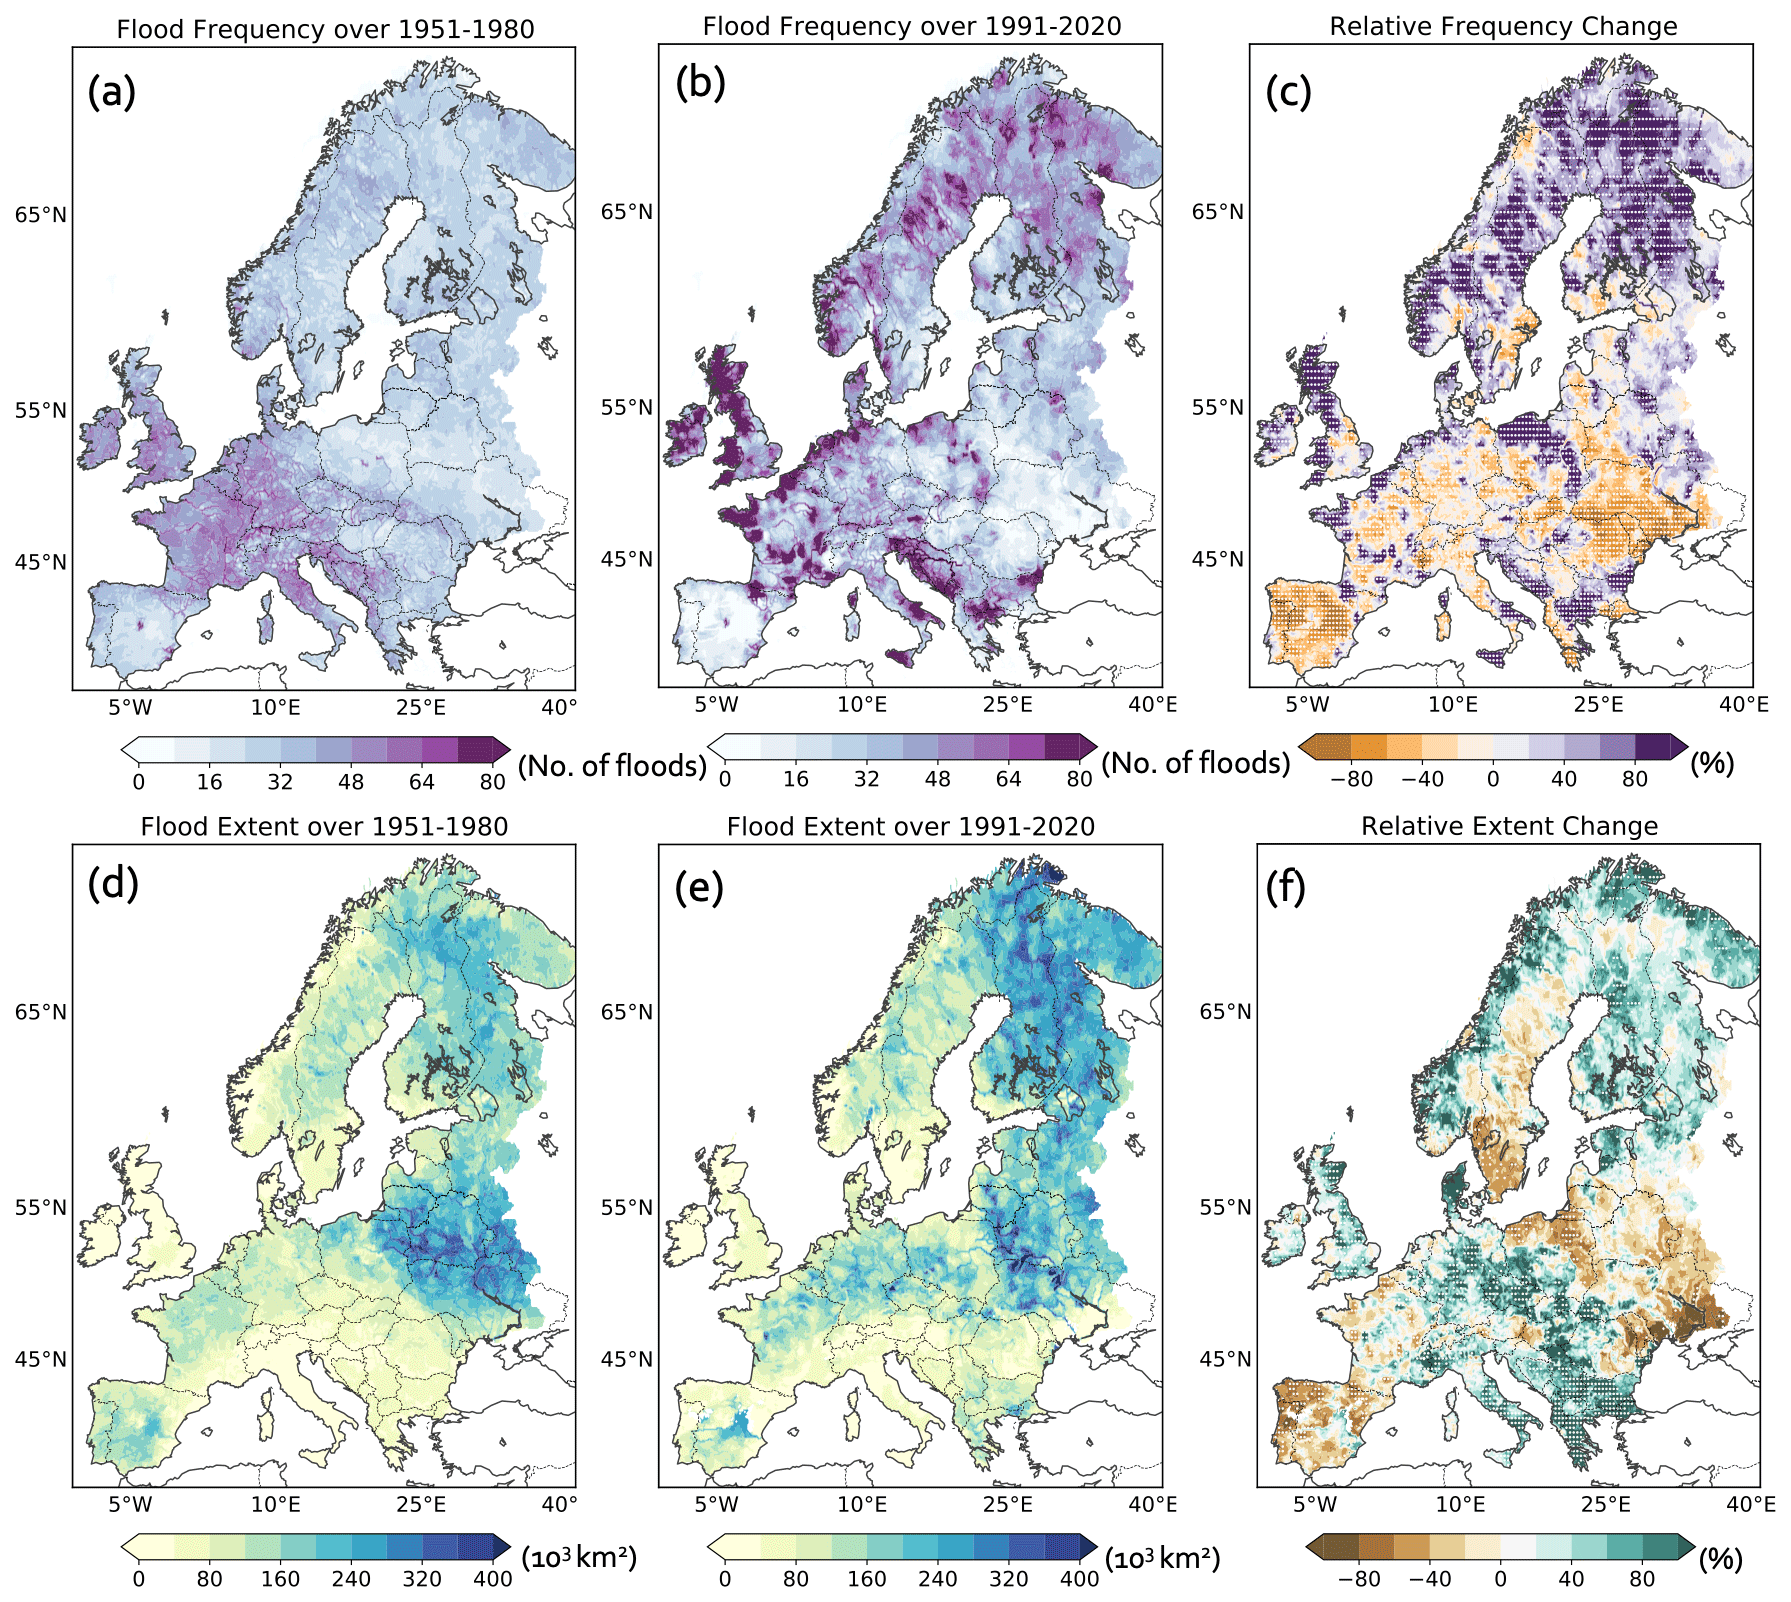
Figure 7Total number of flood events over the periods (a) 1951–1980 and (b) 1991–2020. Relative change (%) in the flood event number of 1991–2020 compared to 1951–1980. Spatial extent of flood events over the periods (d) 1951–1980 and (e) 1991–2020. Relative change (%) in the flood extent of 1991–2020 compared to 1951–1980. The white dots in panels (c) and (f) denote whether changes are significant under a Student's t test with a significance level of 0.05.
To validate the robustness of our results, we assess uncertainties in changes arising from hydrological modeling and input forcing by incorporating two additional grid-based routed runoff datasets, i.e., GloFAS and mHM–ERA5. These datasets exhibit similar spatial patterns of average flood extent with mHM–E-OBS, consistently showing more extensive flooding in plain regions compared to mountainous areas (Fig. A4). We also observe general consistency in the shifts in flood extent between the models. Specifically, for flood extent changes based on mHM–ERA5 and mHM–E-OBS over the periods 1961–1990 and 1991–2020, we identify an expansion in flood extent in parts of northern and western Europe, coupled with a reduction in eastern Europe and Spain. Similarly, when comparing the periods 1979–1999 and 2000–2020 for mHM–E-OBS and GloFAS, the reduction in flood extent over Germany, France, Spain, and southern Sweden and the expansion in other regions are supported by both models (Fig. A5). This overall consistency between results based on mHM–E-OBS and two other datasets that use different models or input forcing underscores the robustness of our conclusions.
3.4 Drivers of the changes in flood extent
The change in the flood spatial scale has been reported to be highly correlated with a change in flood magnitude by a previous study (Kemter et al., 2020). Nonetheless, the alteration in the spatial dependence of the runoff fields, which also potentially contributes to the trend of the flood extent, has received little attention. Therefore, building on previous studies (Bevacqua et al., 2021, 2020a; Zscheischler and Seneviratne, 2017), here we disentangle the contributions of both magnitude and spatial dependence changes to the changes in the flood spatial extent. Contributions from both sources exhibit significant spatial variability and dominate over distinct regions. In northern Europe, the expansion of the flood extent emerges primarily from increasing runoff magnitudes (Fig. 8a and d) due to intensified precipitation and snowmelt (Fig. 9a and b). In contrast, the change in the runoff spatial dependence contributes little, even slightly hindering the increase in the flood scale (Fig. 8b and d). An exception in southern Sweden is worth noting, where changes in the runoff spatial organization (i.e., dependence) lead to a reduction in the flood extent.
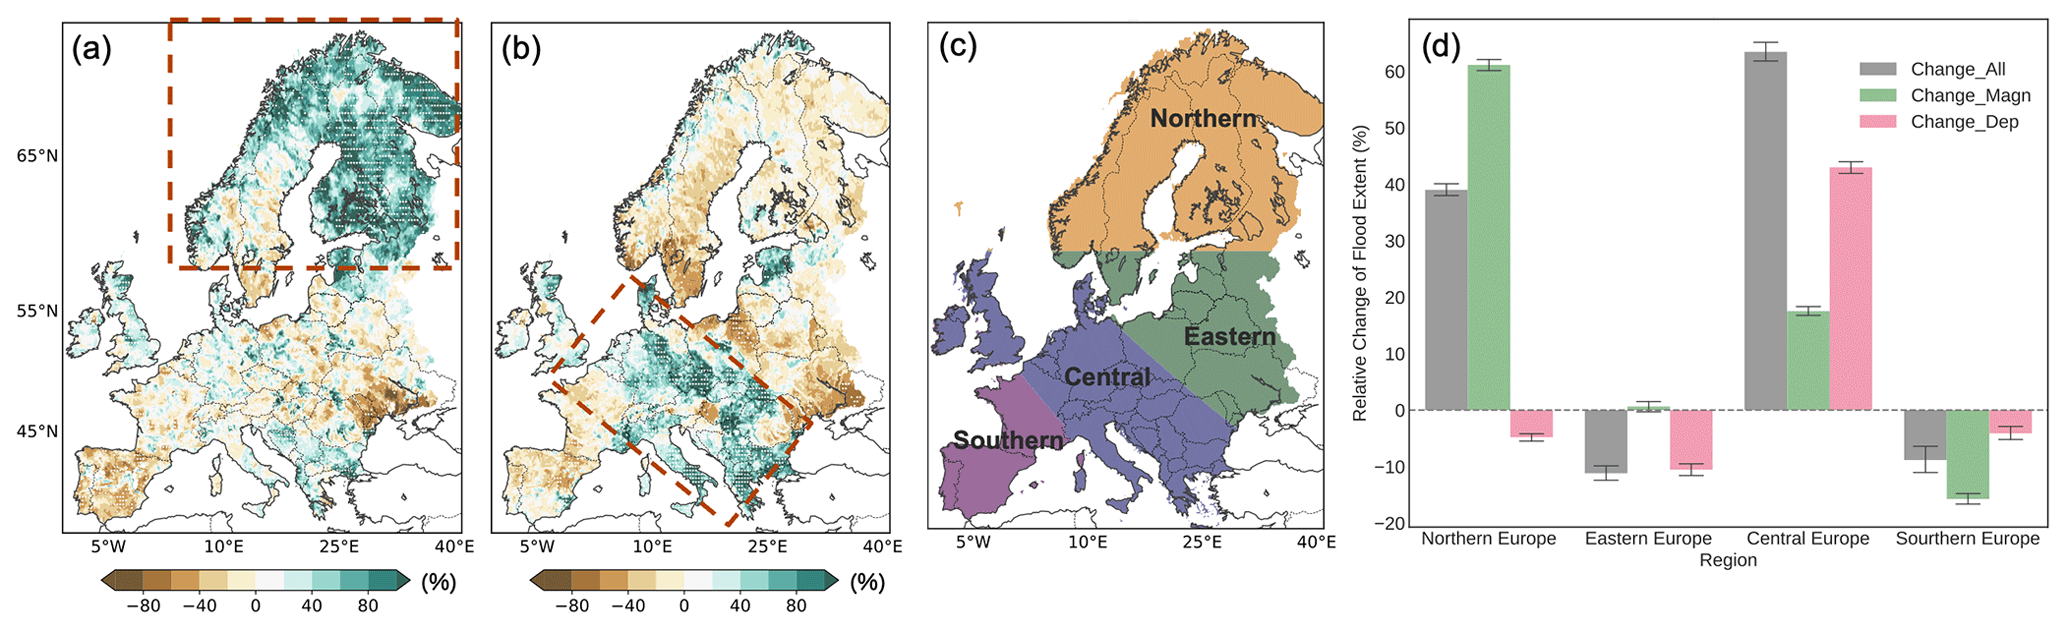
Figure 8Relative change (%) in flood extent caused by the change in (a) runoff magnitude and (b) spatial dependence between the two periods 1951–1980 and 1991–2020. The red boxes in panels (a) and (b) denote regions where the changes in runoff magnitude and spatial dependence, respectively, significantly enlarge the flood extent. (c) Four subregions of the study area, loosely based on the attribution results from panels (a) and (b). (d) Relative change in flood extent between 1951–1980 and 1991–2020 (“Change_All”) and its decompositions over the four subregions defined in panel (c). “Change_Magn” and “Change_Dep” refer to changes caused by the runoff magnitude and runoff spatial dependence, respectively. Bars show mean flood extents over four defined regions in panel (c), and uncertainty estimators denote the 99 % confidence interval around the regional mean flood extents.
In eastern European countries like Ukraine, Belarus, Lithuania, and northern Poland, changes in both runoff magnitude and its spatial dependence collectively contribute to a decrease in flood spatial extent, with the latter playing a more prominent role (Fig. 8b and d). We suppose that the reduction in snowmelt in areas where snowmelt is the main floods' driver (Fig. 9a) not only decreases runoff magnitude but also possibly shrinks the extent of flood events due to a smaller synchronization scale in snowmelt. The combined effect of the change in runoff magnitude and spatial dependence is also evident in the region dominated by rainfall-driven floods (see Fig. 5c). Particularly in England, changes in runoff magnitude and spatial dependence together increase flood extent. In contrast, both drivers strongly reduce flood extent over southern France, Portugal, and Spain (Fig. 8a and b). Overall, changes in soil moisture seem to play a relatively minor role in the detected changes in flood extent compared to rainfall and snowmelt (Fig. 9c). For instance, in Germany and France, although soil moisture decreases, flood extent increases due to more extensive heavy rainfall, highlighting the dominant role of rainfall compared to soil moisture. However, its impact can be substantial at the regional scale. For example, in the northern UK, a strong increase in soil moisture contributes to the increase in flood extent, while in northern Iberian Peninsula, the decrease in soil moisture is associated with a reduction in flood extent. These findings align with those of Blöschl et al. (2019) and Bertola et al. (2021), who revealed a similar role of soil moisture in influencing flood magnitude in these regions. Furthermore, in the Mediterranean Sea region, a decrease in flood extent is partly attributed to a decrease in soil moisture, generally aligning with the findings of Tarasova et al. (2023).
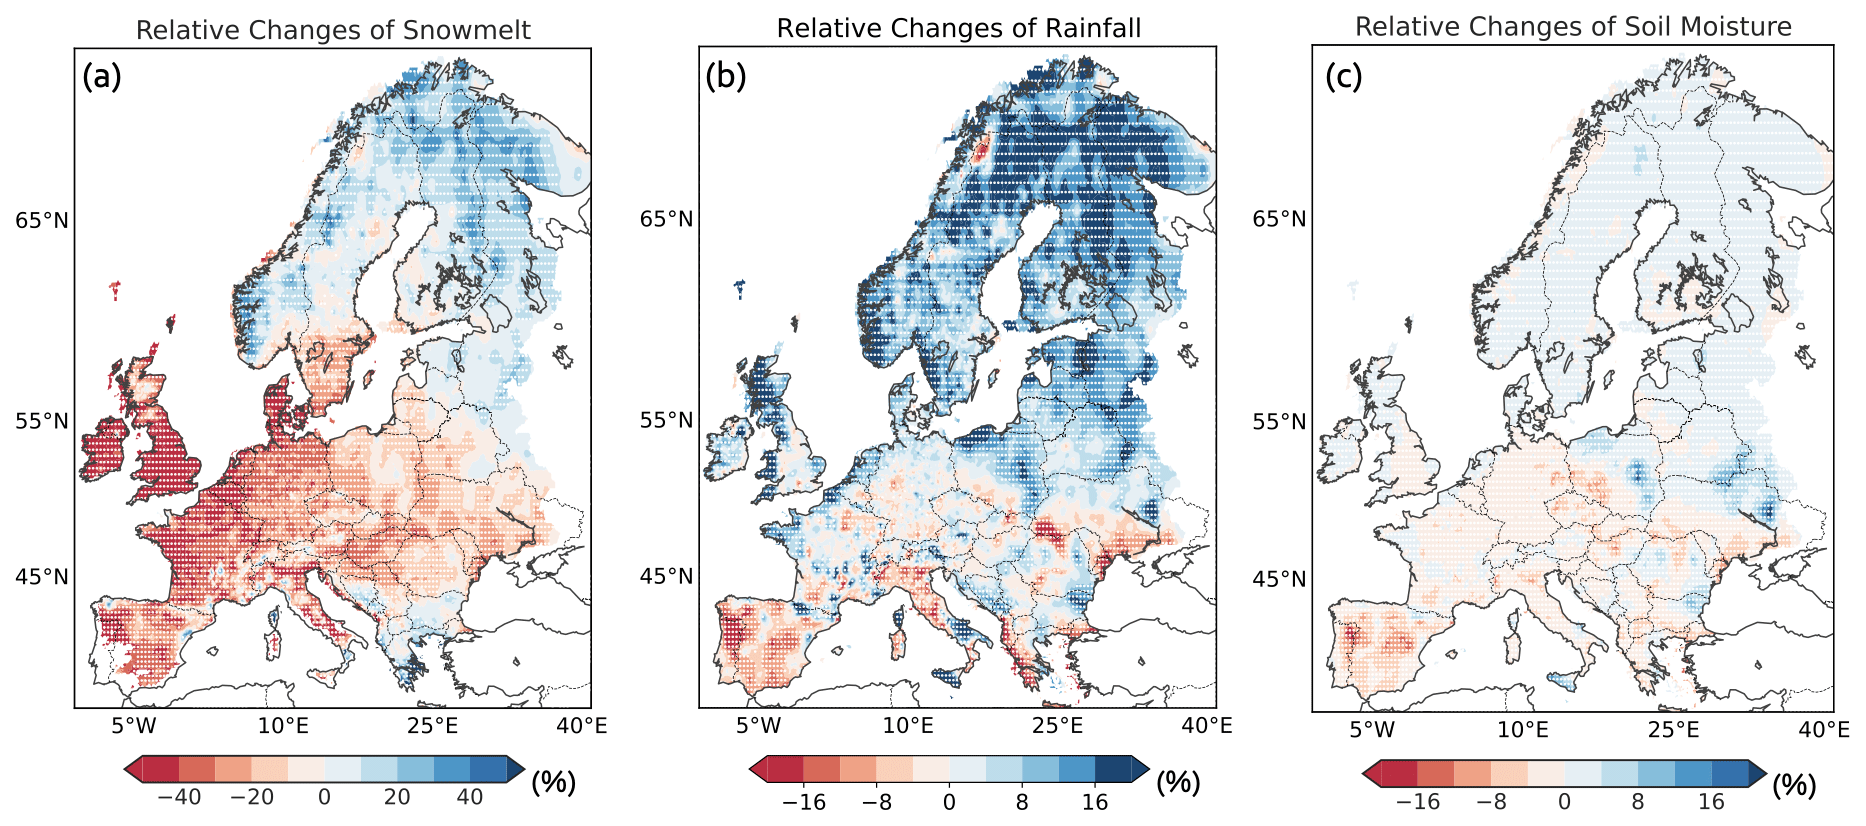
Figure 9Relative change in (a) snowmelt, (b) rainfall, and (c) soil moisture of all days over the period 1991–2020 compared to 1951–1980. White dots denote whether changes are significant under the Student's t test with a significance level of 0.05. In panel (a), only the grids with over 30 d of snowmelt larger than 2 mm are considered.
In contrast to the other regions, increases in runoff dependence increase flood extents by 40 % to 80 % across western, central, and southern Europe, notably affecting Germany, southern Poland, Italy, and Greece (Fig. 8b and d), whereas runoff magnitude changes play a minor role in these areas (Fig. 8a and d). This implies that, despite the negligible change in runoff magnitude, runoff extremes clustered in space more in the last 3 decades compared to 1951–1980, resulting in the observed expansion of flood events. As rainfall controls floods in these regions (see Fig. 5c), this enhanced clustering may stem from changes in the spatial organization of heavy rainfall. We therefore further assess changes in heavy-rainfall extent over these two 30-year periods.
Heavy-rainfall events are identified similarly to flood events but use the 80th percentile of wet days (precipitation >1 mm) as a threshold to include potentially contributing heavy but not only extreme rainfall. Moreover, we retain only the five most extensive spatiotemporally connected rainfall events for each year to improve alignment with flood occurrences. The spatial extent of heavy-rainfall events exhibits large spatial variability across Europe (Fig. 10a and b). Central Europe and eastern Europe, characterized by lower altitudes, experience the broadest heavy-rainfall extent, while the least extensive rainfall occurs in the mountainous regions of southern and northern Europe. This spatial pattern aligns with a similar pattern over the whole Northern Hemisphere found by Bevacqua et al. (2021), who posited that precipitation tends to be more widespread in flat terrains because of less topographic obstruction. Nevertheless, note that, since our analysis exclusively focuses on terrestrial rainfall events, the land–sea distribution also influences our spatial patterns.
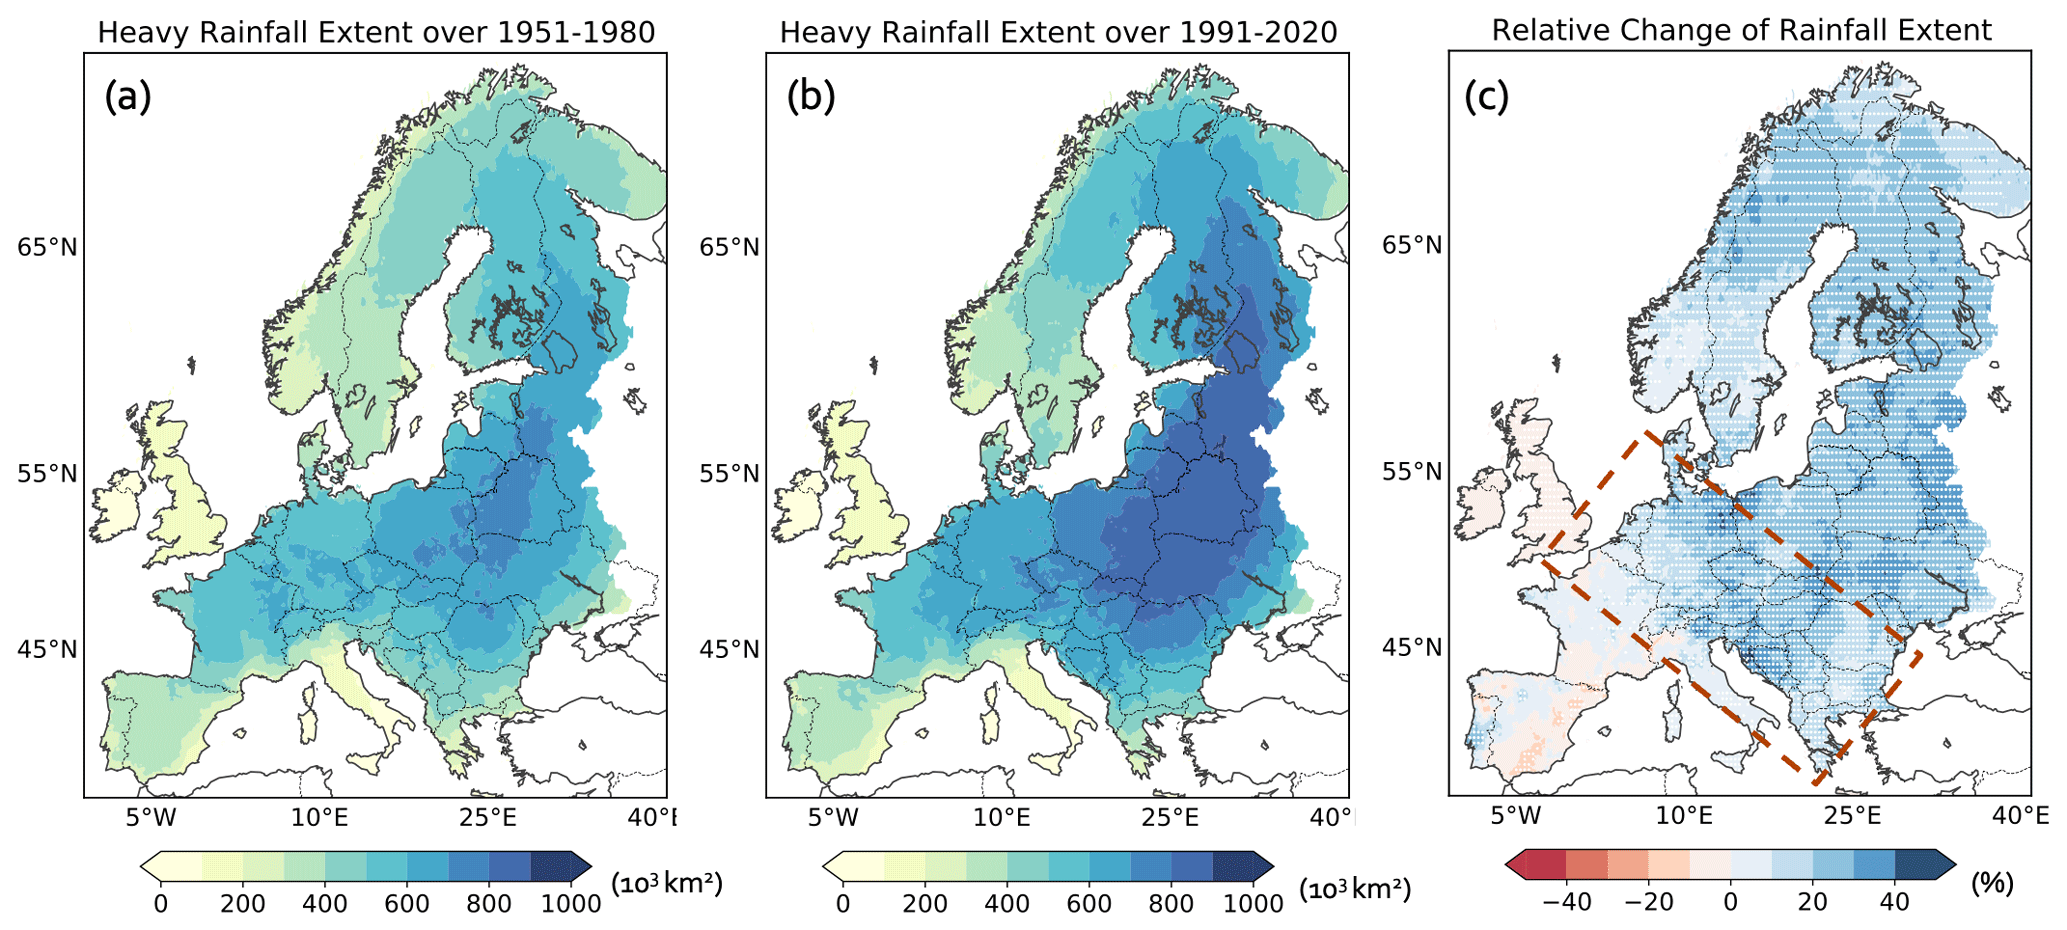
Figure 10Mean spatial extent of heavy rainfall over the periods (a) 1951–1980 and (b) 1991–2020 (1000 km2). Relative change (%) between these two periods (c). The red box is the same as in Fig. 8b.
When comparing the two periods 1991–2020 and 1951–1980, we find an overall increase in heavy-rainfall extents in most areas, except for parts of France, Spain, England, and Ireland (Fig. 10). In regions dominated by rainfall-driven floods (Fig. 5b), flood and rainfall extent are correlated (Fig. A6). This suggests that the change in runoff spatial dependence might be attributed to the change in heavy-rainfall extent in these regions. Specifically, in regions where the increase in the spatial dependence of runoff significantly increases the flood extent (as denoted by the red box in Fig. 8b, e.g., Germany and Greece), more widespread heavy rainfall results in more spatially connected runoff extremes, leading to spatially more extensive floods. Furthermore, consistent with the flood extent attribution results, the rise in the heavy-rainfall extent is also primarily driven by an increased spatial dependence of precipitation in the above regions (not shown). Conversely, in regions where the extent of heavy rainfall has substantially decreased, such as in southern France and Spain, the resulting reduction in the spatial dependence of runoff leads to more localized floods. A summary of these attribution results is provided in Fig. 11.
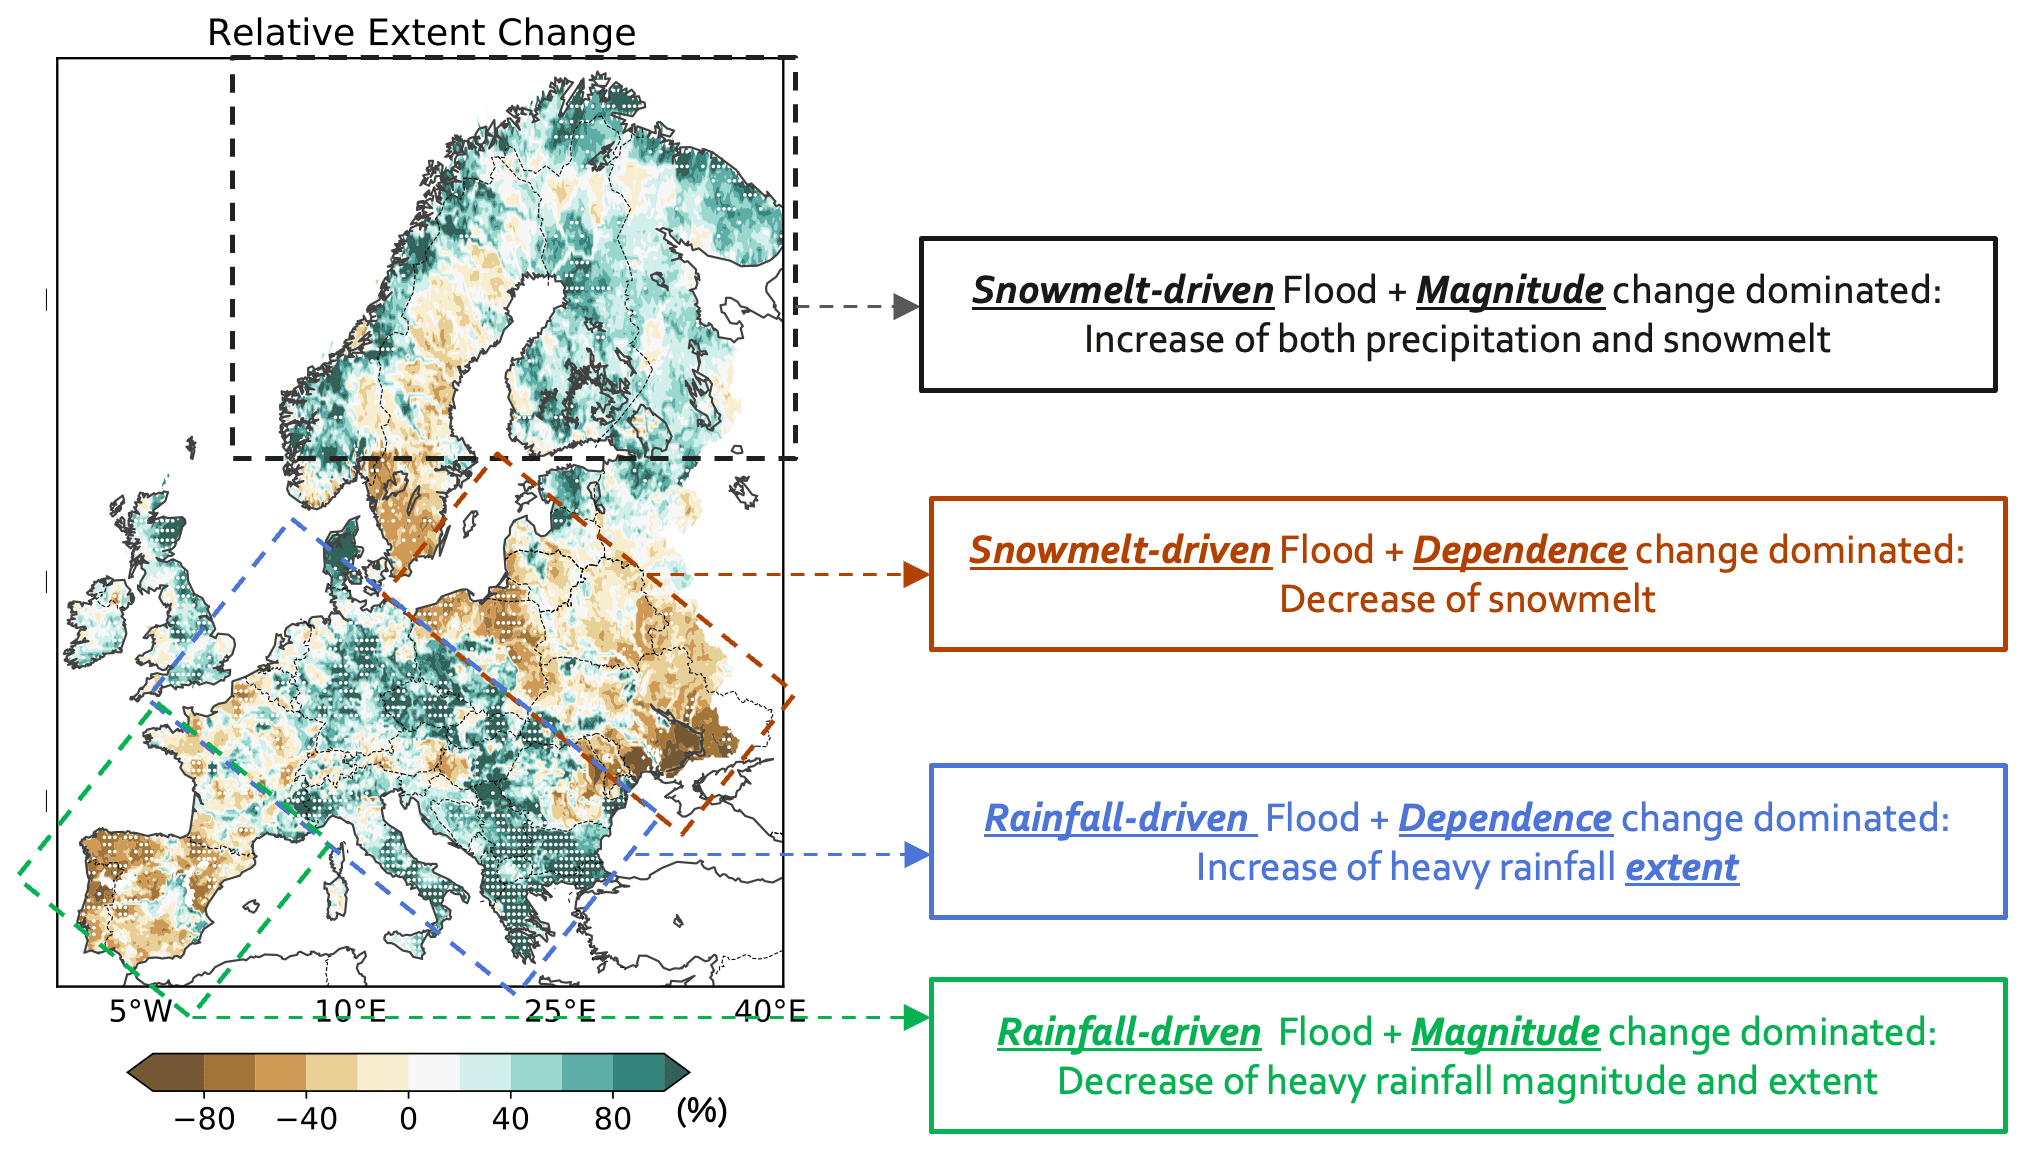
Figure 11Schematic summarizing the attribution results of the change in flood extent to changes in runoff spatial dependence and magnitude under different flood generation processes. This figure of the “Relative Extent Change” is the same as Fig. 7f.
3.5 Discussion
Based on routed runoff simulations, we find that flood extent in Europe is influenced by both topography and the flood generation process. Generally, flood tends to be more widespread in plains than mountainous regions, with snow-driven floods being more widespread than rainfall-driven ones. We reveal a significant increase in flood extent over Europe over the last 70 years, with notable spatial variations. Specifically, the significant expansion of snowmelt-driven floods in northern Europe is primarily attributed to increased runoff magnitude, possibly due to intensified rainfall and snowmelt. In contrast, a reduction in snowmelt contributes to decreased flood extent in eastern Europe. In regions dominated by rainfall-driven floods, the increases in rainfall extent over eastern and southeastern Europe result in more spatially connected runoff extremes, leading to more extensive floods. The decreases in heavy-rainfall magnitude and extent result in reduced flood coverage over parts of western and southern Europe, including France, Portugal, and Spain. While it is possible that these changes are driven by anthropogenic climate change, the observed large spatial variability in the changes in flood extent and the associated changes in flooding processes could also be a result of internal climate variability (Bevacqua et al., 2023).
Our results on the spatial patterns and trends in flood extents align well with the existing literature (Berghuijs et al., 2019a; Kemter et al., 2020), despite different studies employing different flood detection methods (peak over threshold vs. annual maxima) and datasets (grid-based simulation vs. station observations). However, some discrepancies do exist. For instance, in contrast to the findings of Jiang et al. (2022) and Tarasova et al. (2023), which suggest a significant decrease in snowmelt-induced flood events (defined by annual maxima) in northern Europe over the last 5 to 7 decades, our results indicate an overall increase in both their frequency and extent. We attribute these differences primarily to differences in the detection methods. In particular, in contrast to earlier studies, we analyze large spatiotemporal floods. We find that the increase in northern European floods is primarily driven by increases in rainfall and snowmelt magnitude (Fig. 9). This is supported by the finding that, when we keep runoff magnitude to past levels (1951–1980) and only shift the spatial dependence to the present level (1991–2020), we observe a decreasing effect in the snowmelt-driven flood extent stemming from changes in river runoff spatial dependence (Fig. 8).
The assessment of changes in flood extent across central and southeastern Europe (blue box in Fig. 11) reveals seemingly contradictory results during different periods (see Figs. 7f and A5f), particularly in Germany. Specifically, flood extent significantly increases during 1991–2020 compared to 1951–1980, while a small reduction is found when comparing the period 2000–2020 with the period 1979–1999. This implies that the expansion of flood events did not continuously occur over the last 7 decades but was more likely a result of decadal variability (Bevacqua et al., 2023). This is supported by Tarasova et al. (2023), who identified a short but pronounced flood-poor period in the Atlantic region during 1970–1980, followed by a flood-rich period from the late 1980s to the mid-2000s. Hence, the absence of a significant shift in the flood extent over two periods (2000–2020 vs. 1979–1999), which are both within the flood-rich period (1980s to 2000s), is not surprising. The substantial expansion of flood events during the flood-rich period compared to the flood-poor period also aligns with expectations. Furthermore, Merz et al. (2018) also reported a recent tendency of numerous catchments experiencing annual peak runoff simultaneously, indicating a stronger spatial coherence in flooding over Germany. In addition, the substantial increase in the 90th percentile of flood extent (Fig. A3) suggests more frequent widespread floods in recent decades in Germany and southeastern Europe (e.g., Greece).
A formal attribution of changes in flood extent to anthropogenic climate change is not the focus of this study. Nevertheless, insights into its role can be partly inferred from the changes in flood drivers. For instance, the warming climate induces both an increase and a decrease in snowmelt in northern and eastern Europe, contributing to the expansion and reduction of snow-driven flood extent over these two regions. This pattern aligns with findings by Stahl et al. (2012), who also highlight inconsistent trends in annual runoff in snow-dominant regions. In regions dominated by rainfall-driven floods, a general increase in extreme winter precipitation due to the increasing atmospheric water-holding capacity of warmer air (Blöschl et al., 2019; Stahl et al., 2012; Zolina, 2012) is found to be responsible for the expansion of flood events over western and central Europe (e.g., England, Germany). Conversely, in parts of southern Europe, decreasing or constant precipitation (Bevacqua et al., 2020b) combined with increased evapotranspiration due to higher temperatures led to a decrease in flood magnitude (Archer and Caldeira, 2008; Blöschl et al., 2019; Stahl et al., 2010) and flood extent. These hypotheses are in line with Gudmundsson et al. (2021), who attributed an observed overall increase in river runoff in northern Europe and a decrease in southern Europe to anthropogenic climate change.
When investigating the drivers of changes in flood extent, here we primarily focus on the changes in snowmelt and rainfall. In particular, we mainly attribute changes in rainfall-induced flood regions to shifts in precipitation extent. Another relevant driver, soil moisture, is not extensively explored here because of its relatively much smaller trend compared to the other drivers (Fig. 9c). Nevertheless, building on Tarasova et al. (2023), who report an increase in the frequency of “rain on wet” and “rain on dry” floods in the Atlantic and Mediterranean regions, we explored representative cases in Germany, England, Italy, and Greece to examine the associations between soil moisture, rainfall, and their contributions to shifts in flood extent (Fig. A7). Our findings largely align with Tarasova et al. (2023). Specifically, in the selected Atlantic region (i.e., England and Germany), the observed increase in flood extent is associated with higher precipitation and wetter soil conditions. Conversely, in the Mediterranean region (i.e., Italy and Greece), despite drier soil moisture (Fig. A7c and d), more widespread heavy-rainfall events still lead to an increase in the flood extent.
The reliability of our results heavily relies on the model's performance in simulating the spatiotemporal organization of runoff extremes. As noted in the model evaluation section (Sect. 3.1), the mHM generally performs well in simulating runoff extremes (e.g., annual maxima) and their spatiotemporal connectivity. Furthermore, the resulting flood event database aligns closely with an independent impact-based flood record database by capturing 75 % of recorded impactful river floods, providing a robust foundation for characterizing floods and attributing changes. However, it is important to recognize the spatial variability in the model's performance. For instance, the mHM exhibits limitations in simulating runoff over lake-dominated regions, leading to lower model performance in southern Finland. Additionally, there is an overestimation of flood spell trends in parts of northern Europe, potentially leading to an overestimation of flood extent trends in those areas. These spatial discrepancies should be considered when applying our findings to regions where the model's reliability may be lower. Furthermore, we note that no information on dam and reservoir constructions, which might change flood dynamics over time, is included in the model setup. We are unaware of a database that would harmonize such information across the entire European domain over time. Possibly even more crucial, bathymetric data, which would be needed for sedimentation processes, are not available.
Uncertainties in the simulations stem not only from the hydrological model, but also from the weather data input, here the E-OBS dataset. While E-OBS is a widely employed observation-based meteorological dataset, it has some limitations. In particular, the heterogeneity in station coverage across different regions can introduce spatial variations in temperature, precipitation, and, subsequently, runoff (Cornes et al., 2018). This issue is particularly evident in areas like the Mediterranean and eastern Europe, where lower station density may exaggerate flood extent values due to increased spatial smoothness (Rivoire et al., 2021). However, this issue is mitigated by focusing on regions where E-OBS reliability is not clearly compromised (see Sect. 2.1). Furthermore, the temporal evolution of the station density, with an increase from the 1950s to the 1990s and a subsequent decrease, can affect the temporal variability of runoff data. This, in turn, can potentially affect the accuracy of the trend analysis regarding flood extent. To address these uncertainties, we incorporated two additional routed runoff datasets, i.e., GloFAS and mHM–ERA5, to validate the robustness of our results. The general consistency observed in the spatial patterns of flood extent and its relative changes during the two selected periods provides confidence in our results.
We also acknowledge certain limitations inherent in our flood detection and classification algorithms. In our flood classification process, we limit our analysis to rainfall and snowmelt that occur directly within the spatial area, i.e., the same pixels of the flood events, while the precipitation and snowmelt falling outside the event but within the corresponding hydrological catchment are not considered. Nevertheless, the high coherence between flooding across grid cells within specific catchments and the outlet grid cells largely addresses this issue. Specifically, as shown in Fig. A8, if an outlet grid cell is experiencing flooding, there is a high probability of grid cells within the corresponding catchment also experiencing flooding. This suggests that, even though we do not consider the entire contributing catchment for each grid cell (which is often unfeasible), our event-based results remain plausible. Furthermore, the general alignment of our classification results with prior studies (Jiang et al., 2022; Kemter et al., 2020) underscores the robustness of our classification algorithm.
Previous research has predominantly examined flood events from the standpoint of individual stations or single regions. Despite the dangers associated with simultaneous floods across multiple rivers and regions, the quantification of the floods' spatial extent, a factor that largely shapes the total impact of flood events, has received limited attention. Therefore, this study employs a three-dimensional detection algorithm and routed runoff simulations derived from a state-of-the-art hydrological model to identify the spatiotemporally connected flood events, quantify their spatial extents along with other relevant characteristics, and inspect the drivers of changes. Our findings reveal that floods are more widespread in low-lying regions, such as parts of western and eastern Europe, than in high mountainous regions like the Alps. Furthermore, snowmelt-driven floods are more widespread than rainfall-induced floods, which can be attributed to the larger spatial coherence of snowmelt in the spring season across northern Europe, in contrast to more localized, intense winter precipitation in the Atlantic, North Sea, and Mediterranean regions.
Averaged across Europe, we identify an increase of 11.3 % in flood extent over the last 70 years. However, the trend is highly spatially variable. While there is a significant increase in flood extent in the northern European, North Sea, and Mediterranean regions, there is a significant decrease in eastern Europe, Portugal, and Spain. We attribute the increase in northern Europe to increased precipitation and snowmelt. Furthermore, by decomposing the change in flood extent into changes in runoff magnitude and spatial dependence, we find that an increase in runoff magnitude increases the flood extent in northern Europe, whereas a decrease in runoff magnitude reduces the flood extent in parts of southern Europe such as Portugal and Spain. In contrast, an increase in the spatial dependence of runoff extremes, likely a response from more widespread heavy rainfall, increases flood extents in parts of western Europe (including Germany), central Europe (including the Czech Republic), and southern Europe (including Italy and Greece).
Over the past 7 decades, the substantial expansion of flood extents in Europe has posed growing environmental and societal challenges. Concurrent floods across multiple regions and basins carry the potential for more extensive and severe impacts compared to localized floods. This calls for enhanced collaboration between multiregional and multinational government agencies responsible for water resource management and flood control to mitigate the compounding impacts of large river floods (Jongman et al., 2014). In a continuously warming climate, extreme rainfall will occur more frequently and cover wider spatial scales over large parts of Europe (Bevacqua et al., 2021), which may lead to an increase in the occurrence of widespread and devastating floods. We have shown that flood extent is influenced not only by runoff magnitude, but also by its spatiotemporal organization. Hence, even regions with relatively stable runoff or precipitation magnitude may experience changes in flood extent when the spatial dependence of runoff extremes changes.
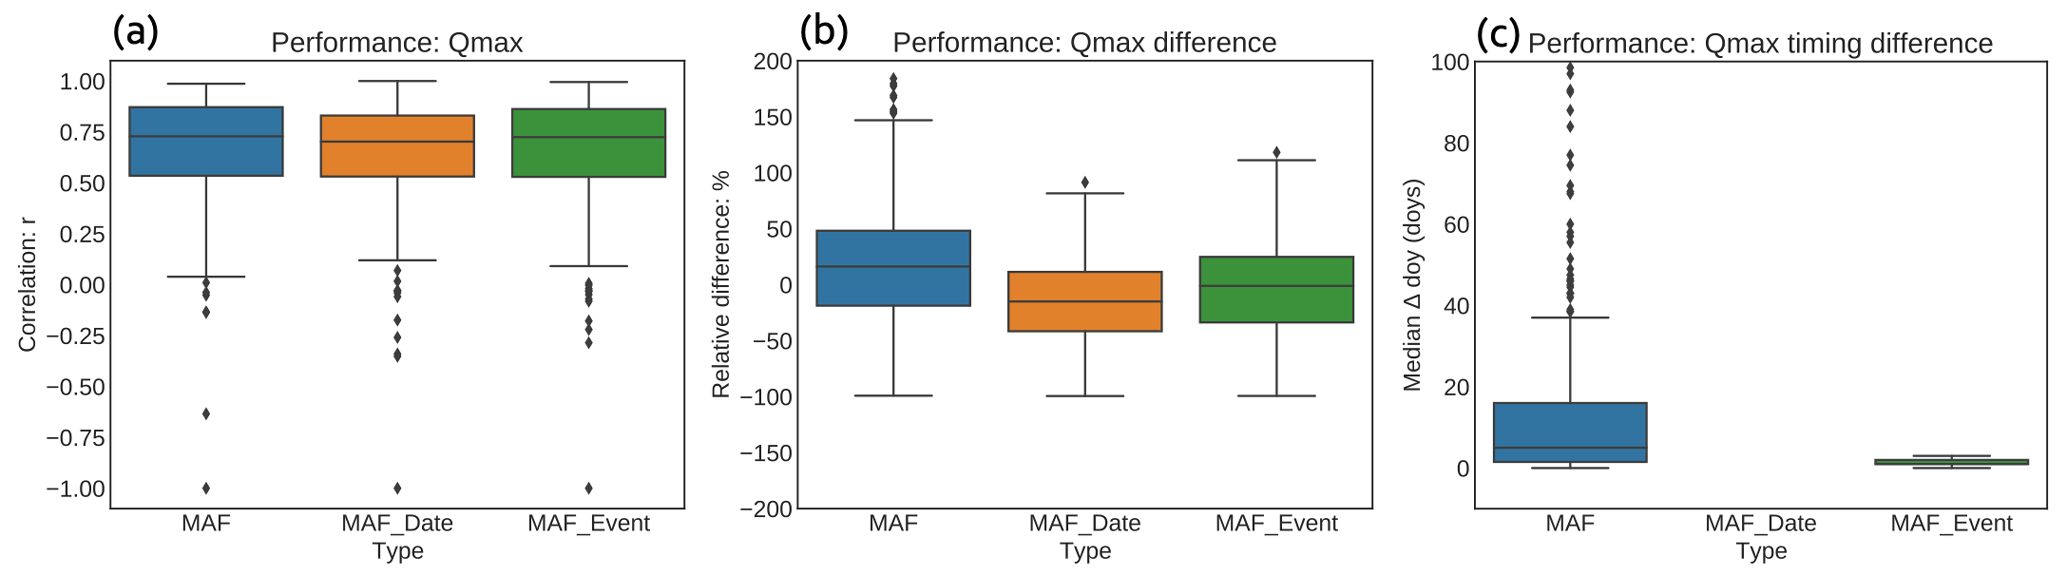
Figure A1Model performance in terms of the timing and magnitude of annual maximum floods under three comparison scenarios (Tarasova et al., 2023). Specifically, “MAF” compares observed and simulated maximum annual floods in terms of their discharge and day of occurrence, “MAF_Date” compares the observed and simulated discharge on the exact date of the observed annual floods, and “MAF_Event” compares observed discharge and the date of the maximum annual flood to the peak of the corresponding runoff event. More details about these three cases can be found in Tarasova et al. (2023). (a) Pearson correlation. (b) Relative difference between the magnitude of the simulated annual maximum runoff with observations from GRDC stations. (c) Relative difference in peak timing between simulated annual maximum runoff and observations from GRDC stations.
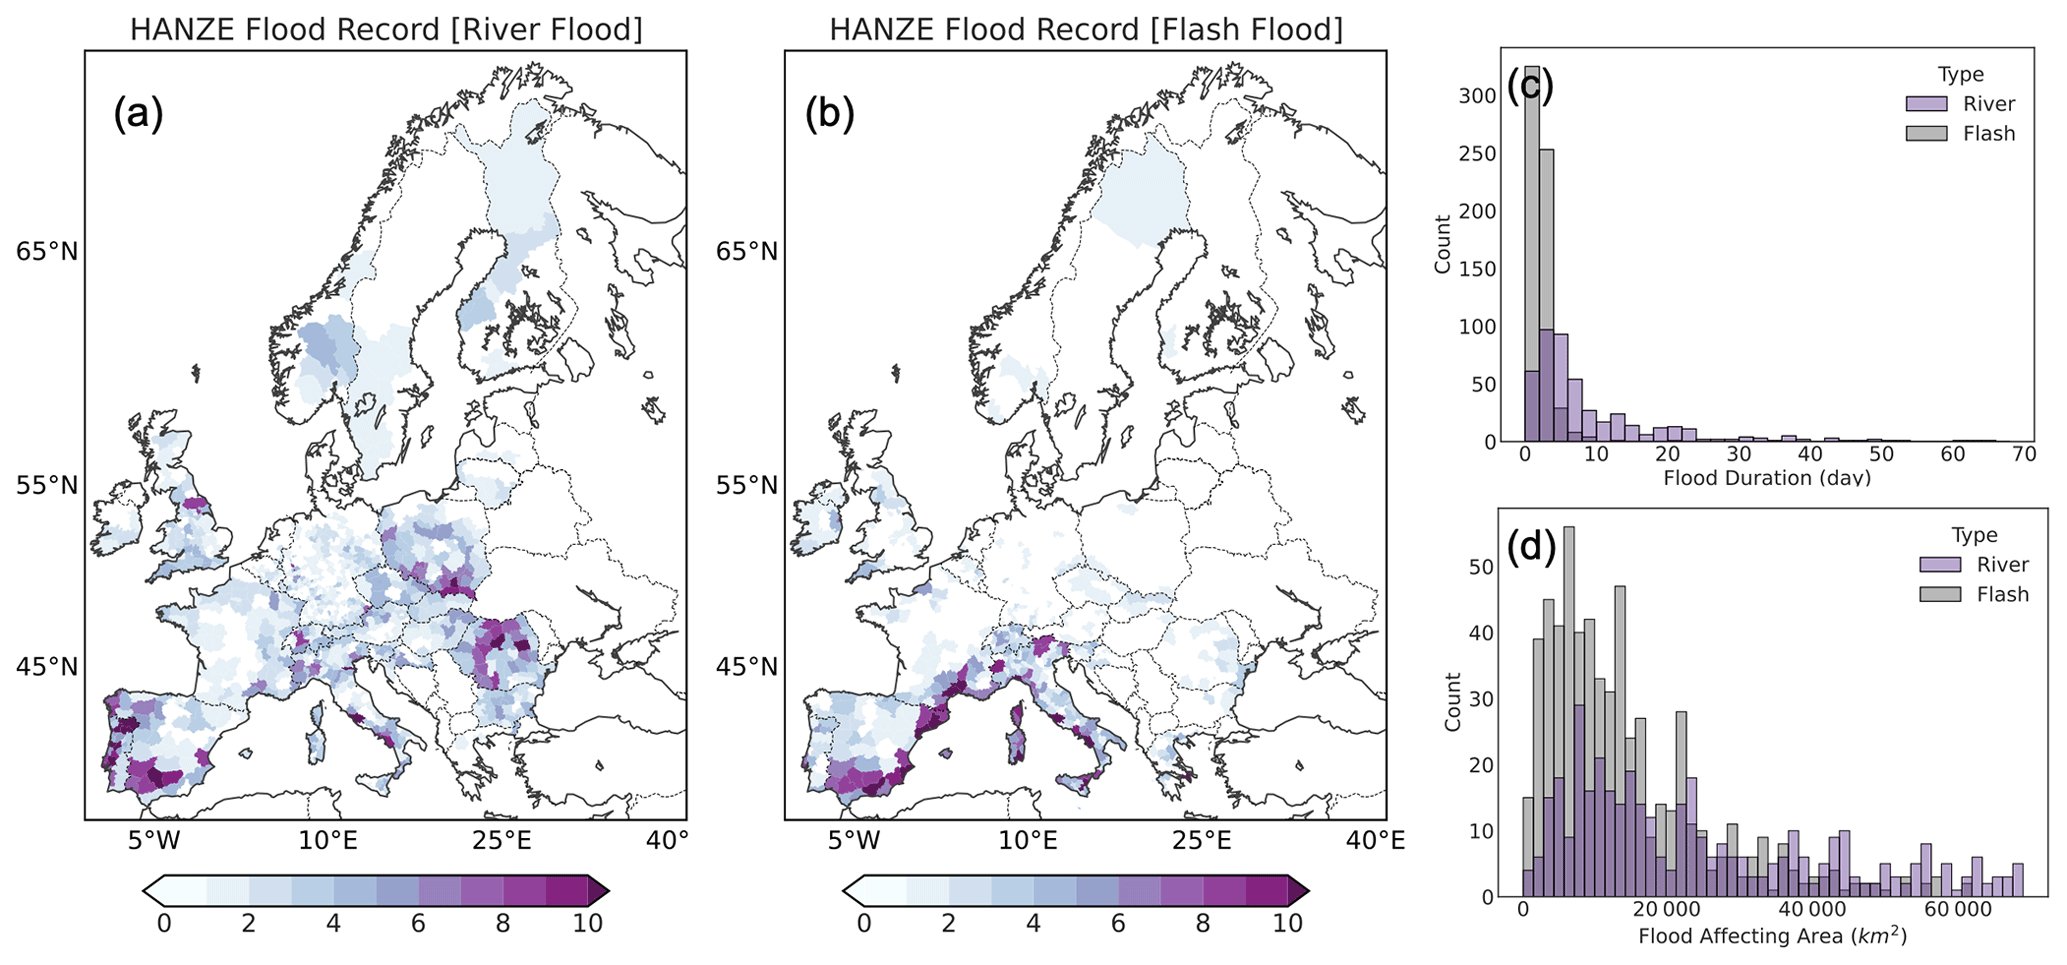
Figure A2Overview of the HANZE flood impact database. Spatial distribution of the number of (a) river floods and (b) flash floods during the period of 1951–2016 (NUTS3 (Nomenclature of Territorial Units for Statistics, Level 3) regions). (c) Duration (d) and (d) affected area (km2) for river floods and flash floods.
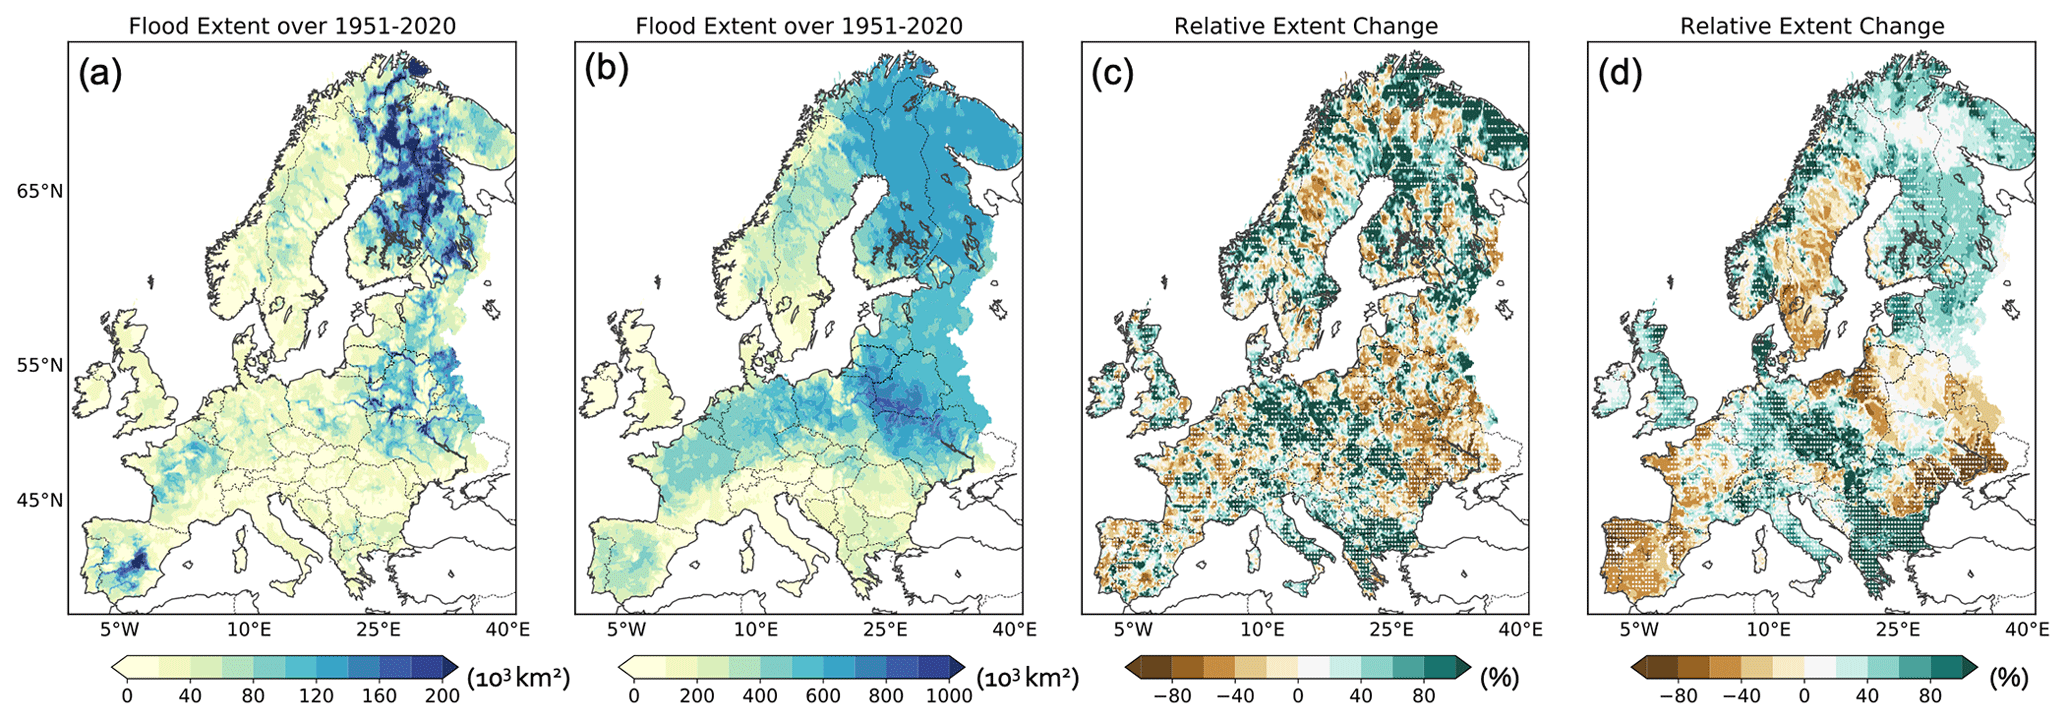
Figure A3Spatial extent (a, b) and changes in spatial extent (c, d) of flood events over the period 1951–2020. (a, c) Based on the median. (b, d) Based on the 90th percentile. Changes denote the relative difference (%) between 1991–2020 and 1951–1980. The white dots in panels (c) and (d) denote whether changes are significant based on the bootstrapping method with a significance level of 0.05.
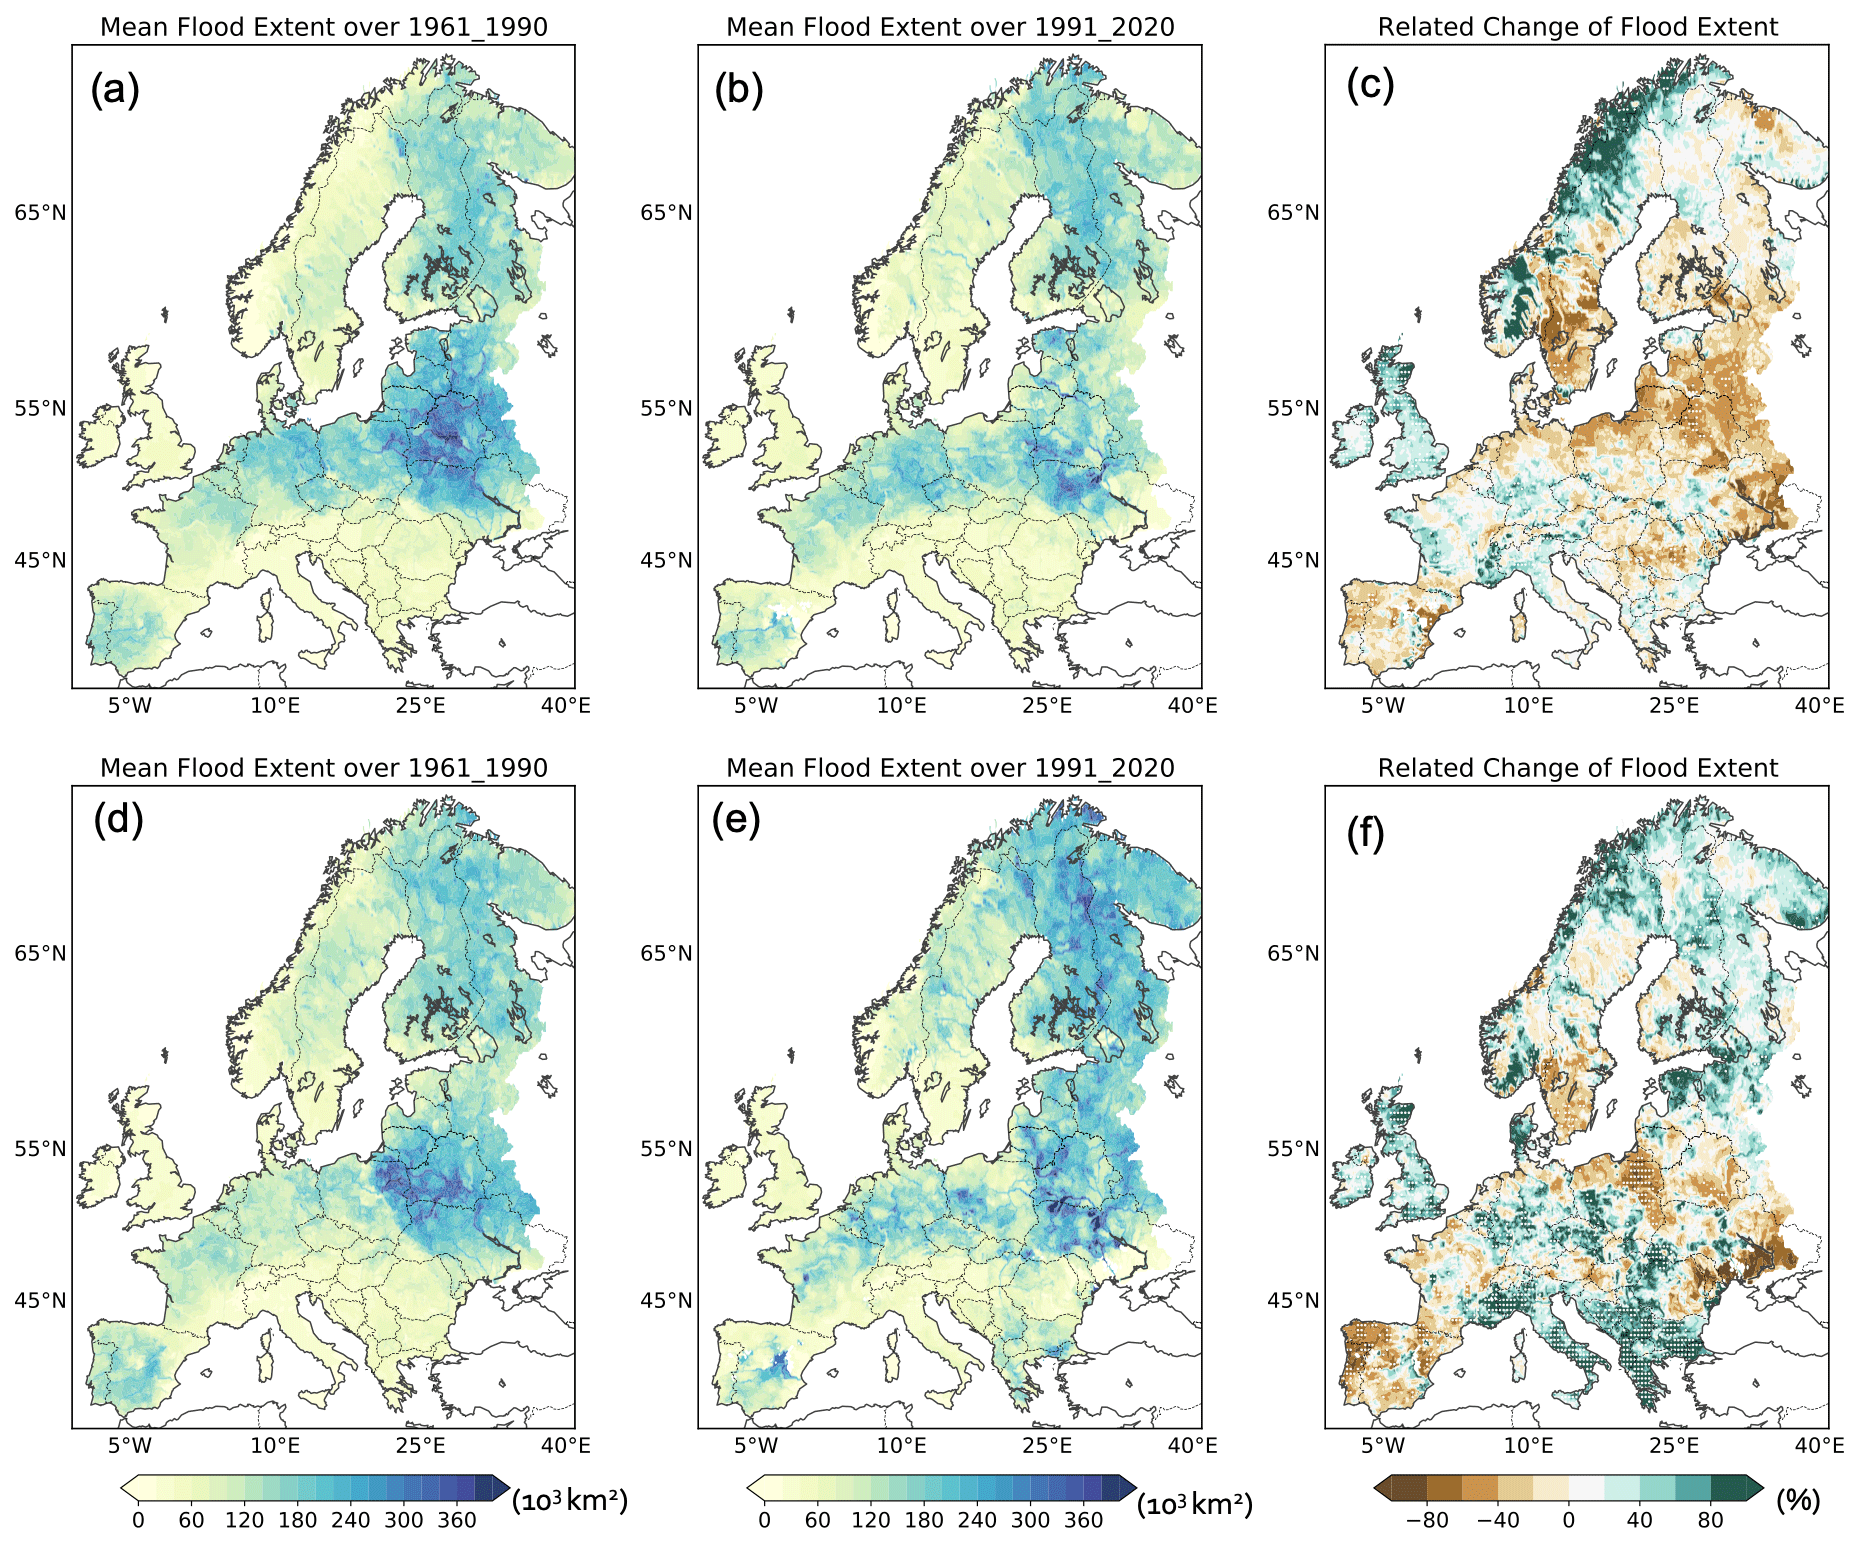
Figure A4Mean spatial extent of the flood event derived from the (a–c) mHM–E-OBS and (d–f) mHM–ERA5 datasets during (a, d) 1961–1990 and (b, e) 1991–2020 (103 km2). (c, f) Relative change (%) in flood extent over these two periods.
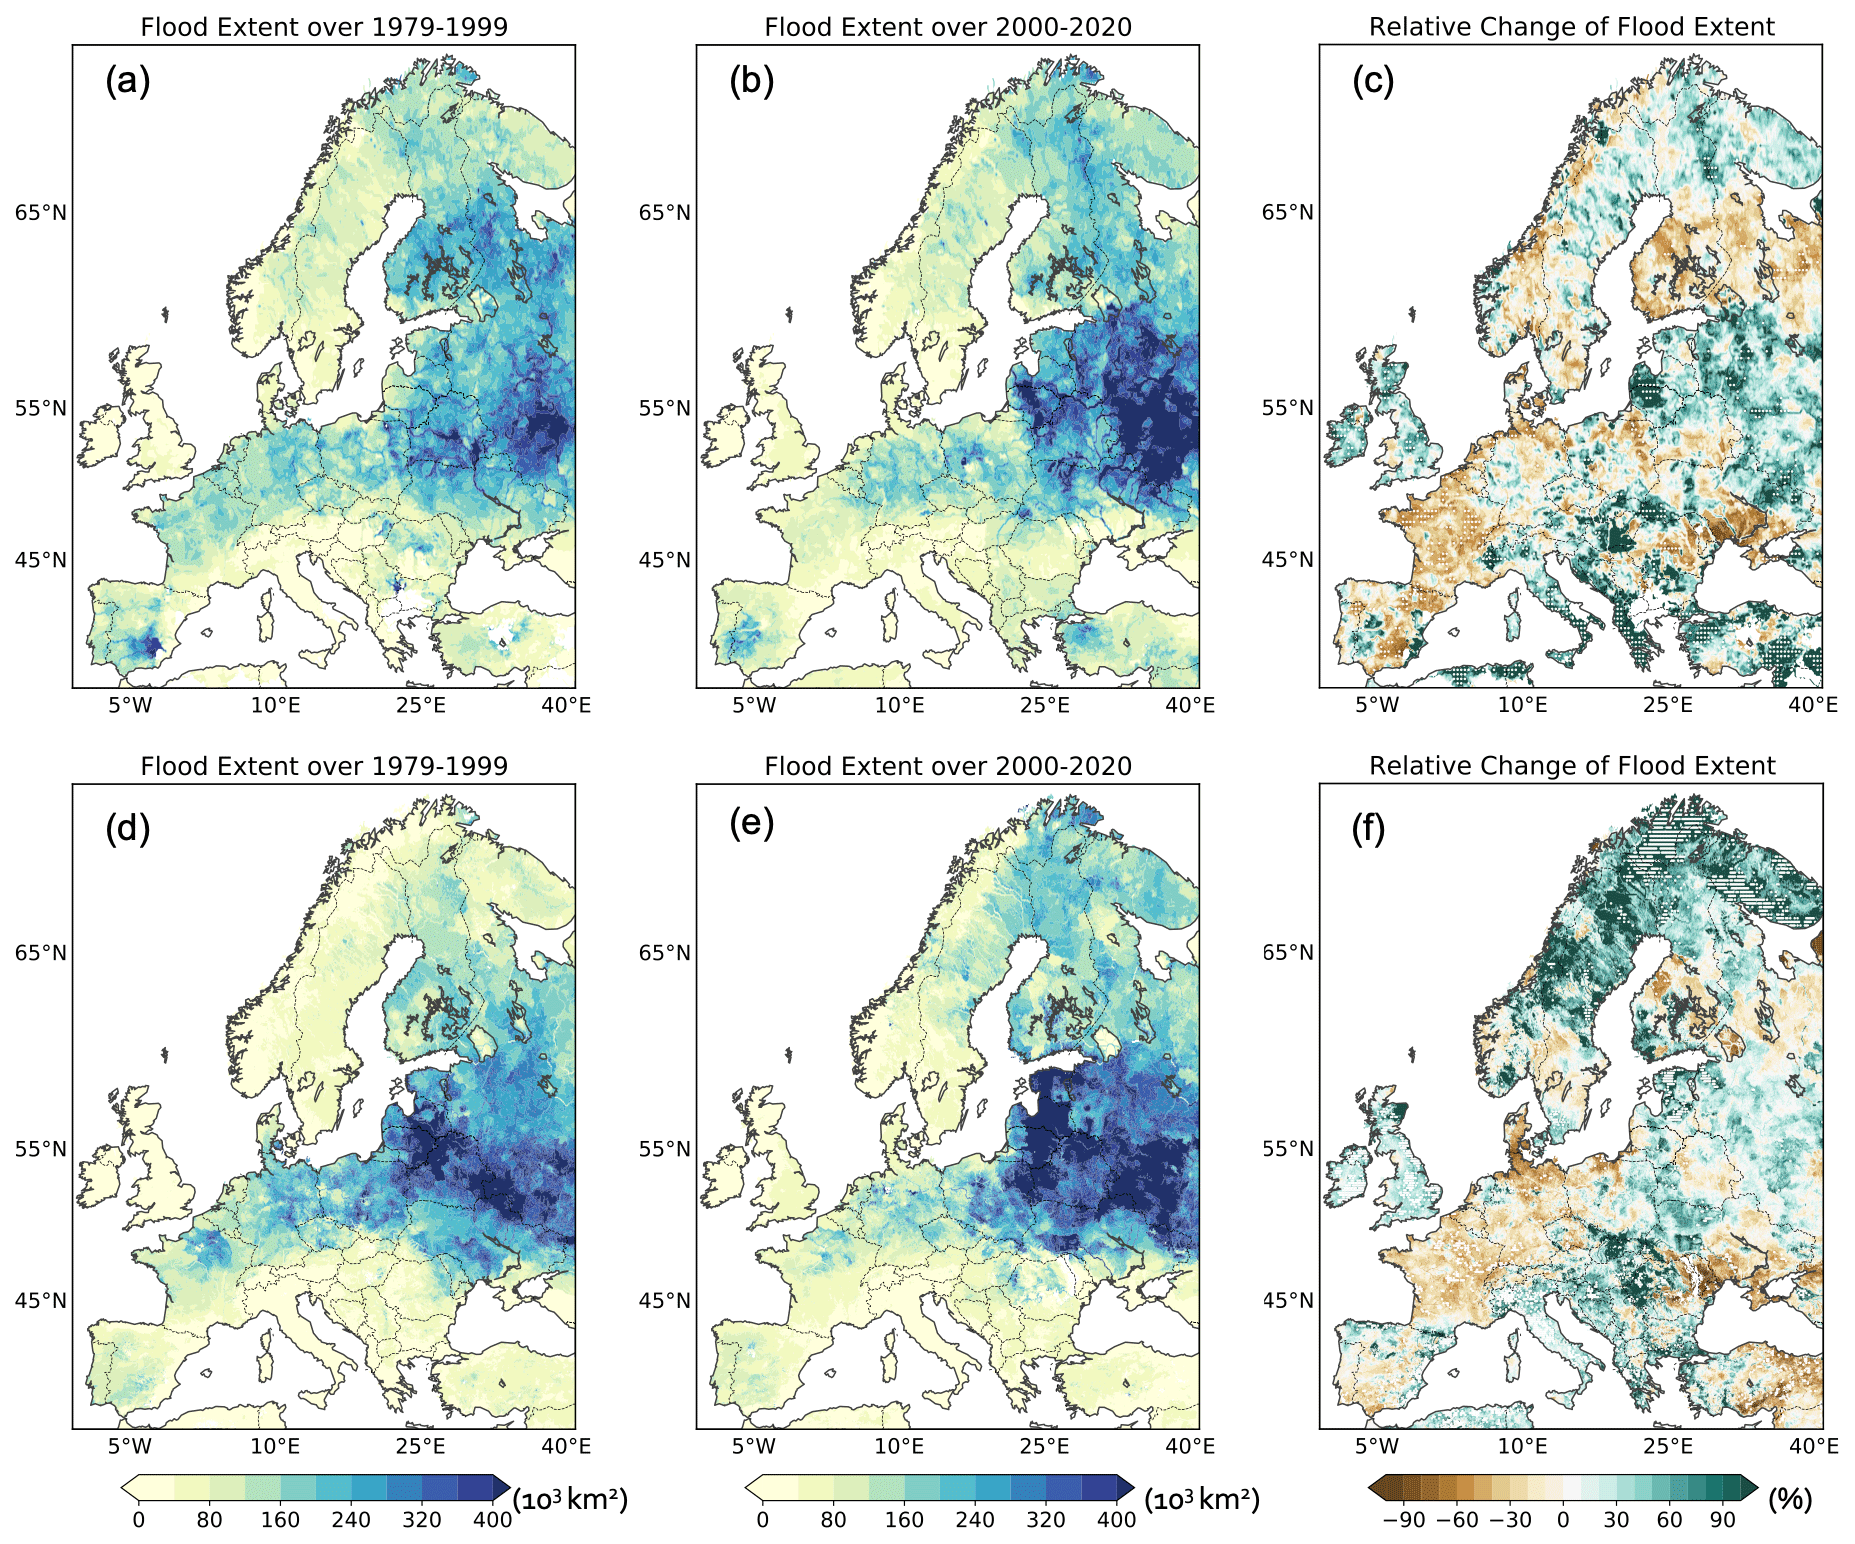
Figure A5Mean spatial extent of a flood event derived from the (a–c) mHM–E-OBS and (d–f) GloFAS datasets during (a, d) 1979–1999 and (b, e) 2000–2020 (103 km2). (c, f) Relative change (%) in flood extent over these two periods.
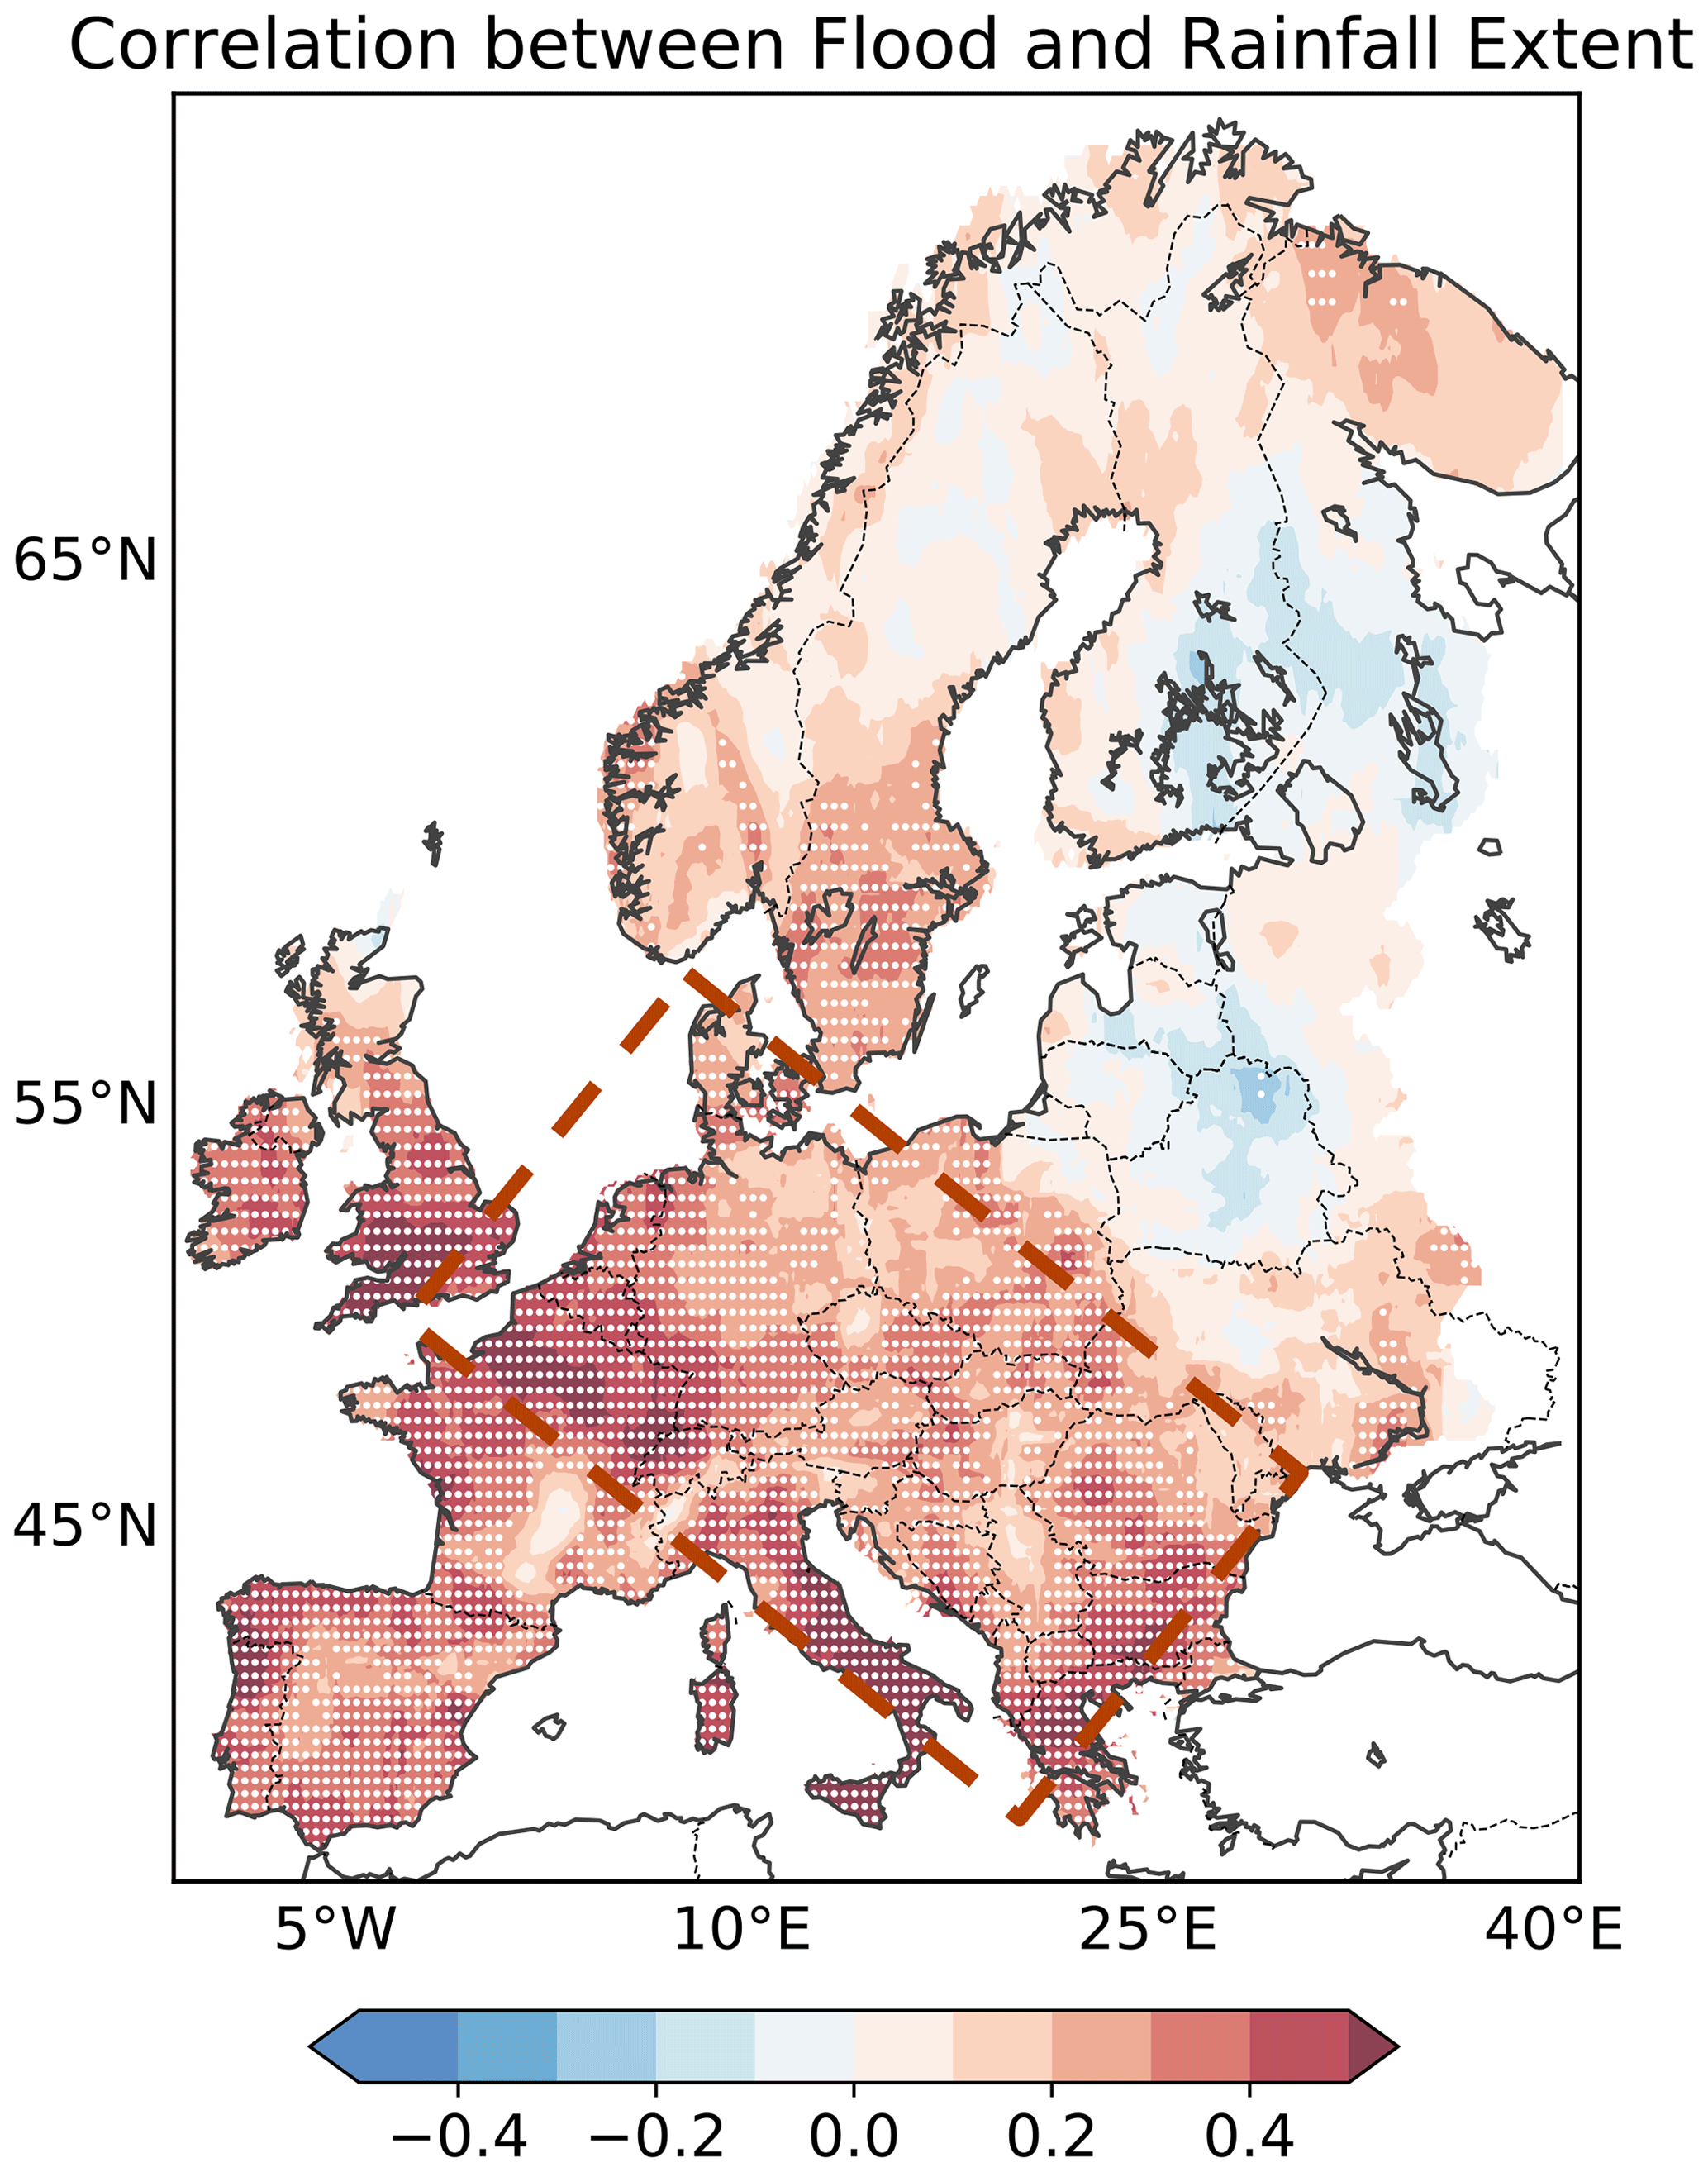
Figure A6Spearman correlation between the annual mean spatial extent of the flood and heavy-rainfall extent over the period of 1951–2020. The white dots denote the significantly correlated grids with p<0.05. The red box region is the same as in Fig. 8b.
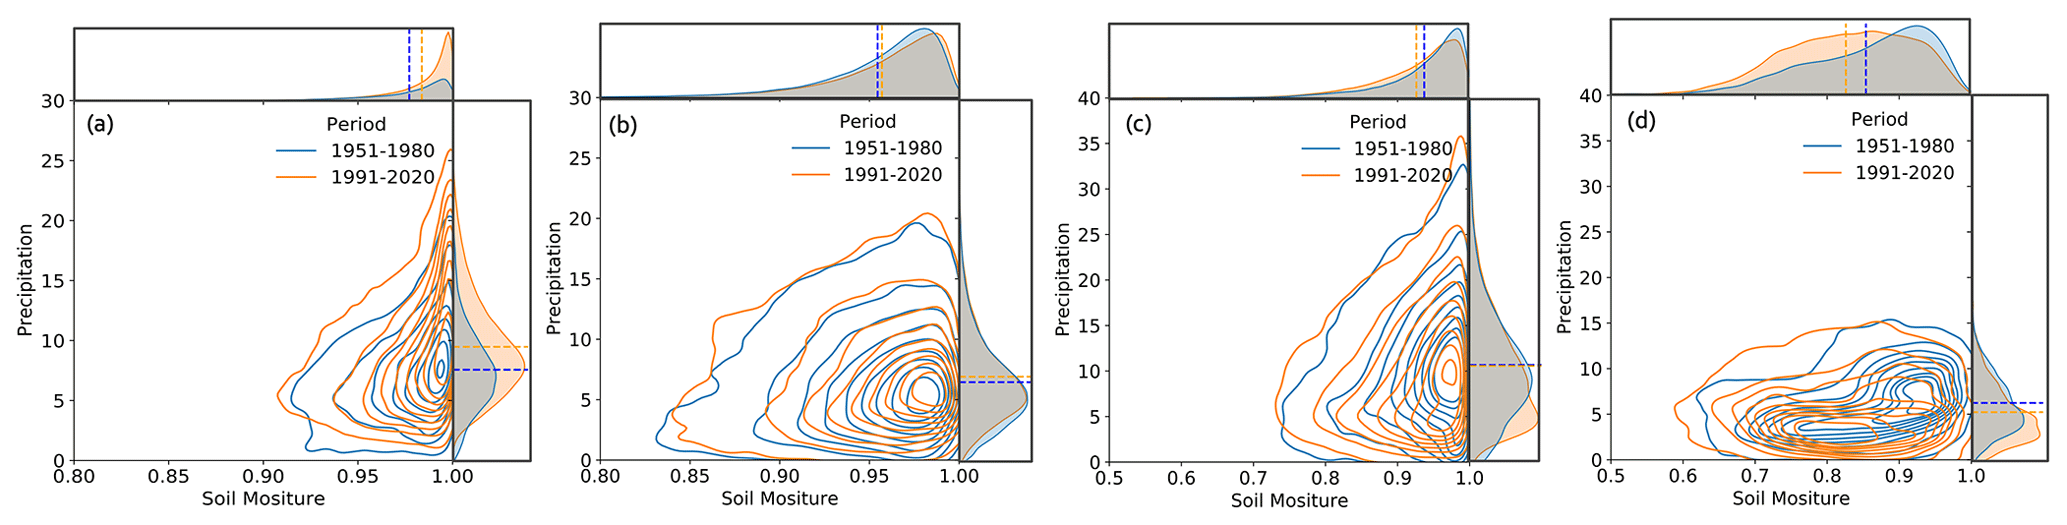
Figure A7Two-dimensional kernel density estimate (KDE) plot of soil moisture (mm3 mm−3) and precipitation (mm d−1) for identified events over four regions: (a) England, (b) Germany, (c) Italy, and (d) Greece based on the periods 1951–1980 and 1991–2020. The marginal distributions show a one-dimensional KDE for soil moisture and precipitation, respectively, over these two periods.
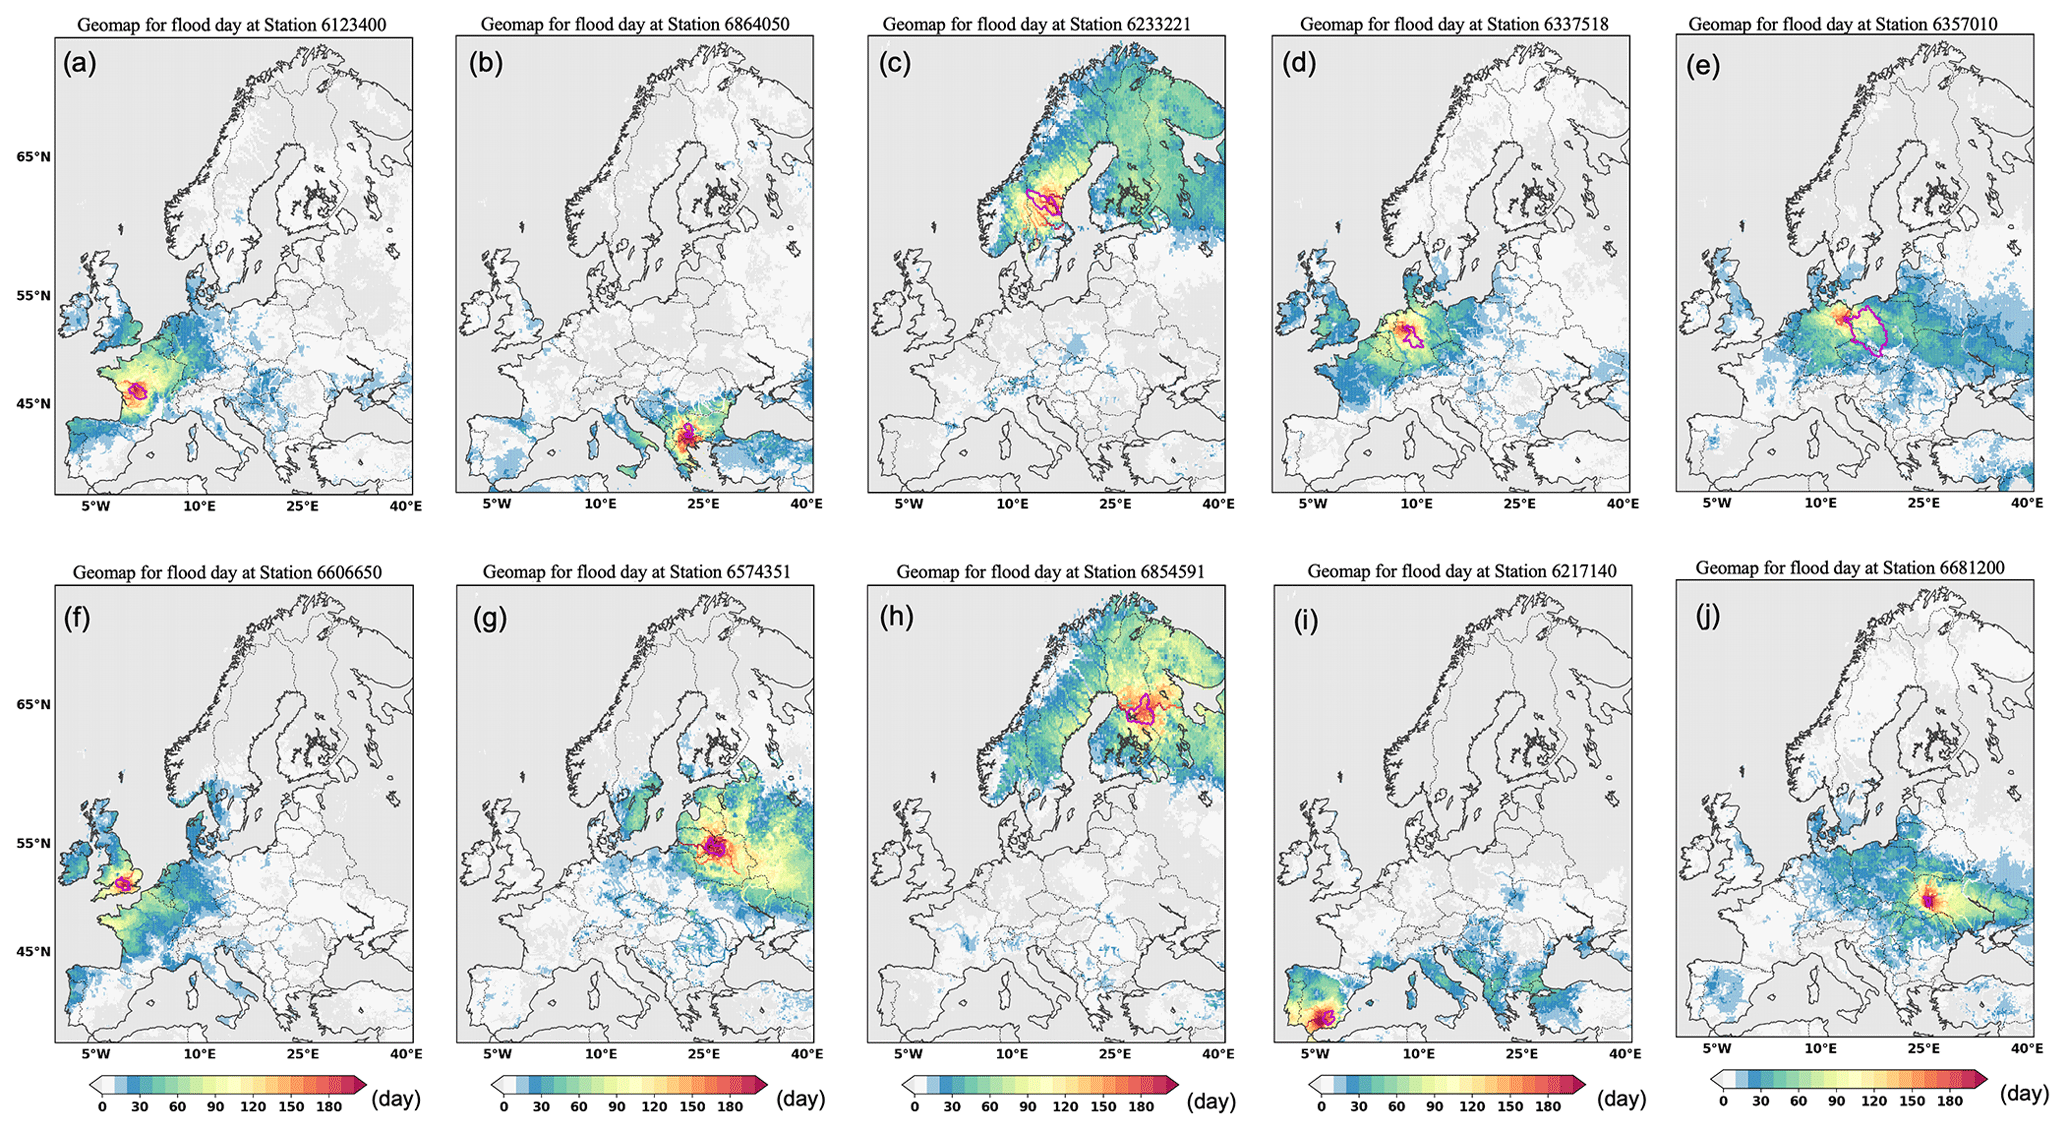
Figure A8Total number of flood days conditional on days when an outlet of a certain catchment (indicated in the titles of the panels) is flooding. The pink polygons denote the boundary of the catchment. The total number of flood days for the outlet grids is 256 d.
The mHM routed runoff is available from the UFZ data portal (https://doi.org/10.48758/ufz.14403, Rakovec et al., 2023). The E-OBS data are available from the European Climate Assessment and Dataset (ECA&D) website at https://www.ecad.eu/download/ensembles/download.php (ECA & D, 2022). The ERA5 data are available from the Copernicus Climate Data Store (https://cds.climate.copernicus.eu, Hersbach et al., 2023). The observed station runoff data collected in the paper can be requested from the Global Runoff Data Centre (GRDC), Federal Institute of Hydrology, Koblenz, Germany, at https://www.bafg.de/GRDC/EN/Home/homepage_node.html (Federal Institute of Hydrology, 2022). The GloFAS–ERA5 river discharge reanalysis is provided by the European Commission Copernicus Emergency Management Service (CEMS) and can be downloaded from https://cds.climate.copernicus.eu/cdsapp#!/dataset/cems-glofas-historical (Grimaldi et al., 2022). The historical population extracted from GPWv4 data can be downloaded from https://sedac.ciesin.columbia.edu/data/collection/gpw-v4 (Center for International Earth Science Information Network – CIESIN – Columbia University, 2018).
BF and JZ conceived the study. BF performed all the analyses and wrote the initial draft. EB contributed to the interpretation of the results. OR conducted the mHM simulations and helped with the interpretation. All the authors substantially contributed to the final draft.
The contact author has declared that none of the authors has any competing interests.
Publisher's note: Copernicus Publications remains neutral with regard to jurisdictional claims made in the text, published maps, institutional affiliations, or any other geographical representation in this paper. While Copernicus Publications makes every effort to include appropriate place names, the final responsibility lies with the authors.
Beijing Fang and Jakob Zscheischler acknowledge funding from the Helmholtz Initiative and Networking Fund (Young Investigator Group COMPOUNDX, grant agreement no. VH-NG-1537). Emanuele Bevacqua and Jakob Zscheischler acknowledge the European Union’s Horizon 2020 research and innovation program within project XAIDA: Extreme Events – Artificial Intelligence for Detection and Attribution under grant agreement no. 101003469. Emanuele Bevacqua received funding from the Deutsche Forschungsgemeinschaft (DFG) via the Emmy Noether Programme (grant no. 524780515).
The article processing charges for this open-access publication were covered by the Helmholtz Centre for Environmental Research – UFZ.
This paper was edited by Louise Slater and reviewed by three anonymous referees.
Alfieri, L., Burek, P., Dutra, E., Krzeminski, B., Muraro, D., Thielen, J., and Pappenberger, F.: GloFAS – global ensemble streamflow forecasting and flood early warning, Hydrol. Earth Syst. Sci., 17, 1161–1175, https://doi.org/10.5194/hess-17-1161-2013, 2013. a
Archer, C. L. and Caldeira, K.: Historical trends in the jet streams, Geophys. Res. Lett., 35, L08803, https://doi.org/10.1029/2008GL033614, 2008. a
Berghuijs, W. R., Allen, S. T., Harrigan, S., and Kirchner, J. W.: Growing spatial scales of synchronous river flooding in Europe, Geophys. Res. Lett., 46, 1423–1428, 2019a. a, b, c, d, e, f, g, h
Berghuijs, W. R., Harrigan, S., Molnar, P., Slater, L. J., and Kirchner, J. W.: The relative importance of different flood-generating mechanisms across Europe, Water Resour. Res., 55, 4582–4593, 2019b. a
Bertola, M., Viglione, A., Vorogushyn, S., Lun, D., Merz, B., and Blöschl, G.: Do small and large floods have the same drivers of change? A regional attribution analysis in Europe, Hydrol. Earth Syst. Sci., 25, 1347–1364, https://doi.org/10.5194/hess-25-1347-2021, 2021. a
Bevacqua, E., Vousdoukas, M. I., Zappa, G., Hodges, K., Shepherd, T. G., Maraun, D., Mentaschi, L., and Feyen, L.: More meteorological events that drive compound coastal flooding are projected under climate change, Communications Earth & Environment, 1, 47, https://doi.org/10.1038/s43247-020-00044-z, 2020a. a, b
Bevacqua, E., Zappa, G., and Shepherd, T. G.: Shorter cyclone clusters modulate changes in European wintertime precipitation extremes, Environ. Res. Lett., 15, 124005, https://doi.org/10.1088/1748-9326/abbde7, 2020b. a
Bevacqua, E., Shepherd, T. G., Watson, P. A., Sparrow, S., Wallom, D., and Mitchell, D.: Larger spatial footprint of wintertime total precipitation extremes in a warmer climate, Geophys. Res. Lett., 48, e2020GL091990, https://doi.org/10.1029/2020GL091990, 2021. a, b, c, d, e, f, g, h
Bevacqua, E., Suarez-Gutierrez, L., Jézéquel, A., Lehner, F., Vrac, M., Yiou, P., and Zscheischler, J.: Advancing research on compound weather and climate events via large ensemble model simulations, Nat. Commun., 14, 2145, https://doi.org/10.1038/s41467-023-37847-5, 2023. a, b
Blöschl, G., Nester, T., Komma, J., Parajka, J., and Perdigão, R. A. P.: The June 2013 flood in the Upper Danube Basin, and comparisons with the 2002, 1954 and 1899 floods, Hydrol. Earth Syst. Sci., 17, 5197–5212, https://doi.org/10.5194/hess-17-5197-2013, 2013. a
Blöschl, G., Hall, J., Parajka, J., Perdigão, R. A. P., Merz, B., Arheimer, B., Aronica, G. T., Bilibashi, A., Bonacci, O., Borga, M., Čanjevac, I., Castellarin, A., Chirico, G. B., Claps, P., Fiala, K., Frolova, N., Gorbachova, L., Gül, A., Hannaford, J., Harrigan, S., Kireeva, M., Kiss, A., Kjeldsen, T. R., Kohnová, S., Koskela, J. J., Ledvinka, O., Macdonald, N., Mavrova-Guirguinova, M., Mediero, L., Merz, R., Molnar, P., Montanari, A., Murphy, C., Osuch, M., Ovcharuk, V., Radevski, I., Rogger, M., Salinas, J. L., Sauquet, E., Šraj, M., Szolgay, J., Viglione, A., Volpi, E., Wilson, D., Zaimi, K., and Živković, N.: Changing climate shifts timing of European floods, Science, 357, 588–590, https://doi.org/10.1126/science.aan2506, 2017. a, b
Blöschl, G., Hall, J., Viglione, A., Perdigão, R. A. P., Parajka, J., Merz, B., Lun, D., Arheimer, B., Aronica, G. T., Bilibashi, A., Boháč, M., Bonacci, O., Borga, M., Čanjevac, I., Castellarin, A., Chirico, G. B., Claps, P., Frolova, N., Ganora, D., Gorbachova, L., Gül, A., Hannaford, J., Harrigan, S., Kireeva, M., Kiss, A., Kjeldsen, T. R., Kohnová, S., Koskela, J. J., Ledvinka, O., Macdonald, N., Mavrova-Guirguinova, M., Mediero, L., Merz, R., Molnar, P., Montanari, A., Murphy, C., Osuch, M., Ovcharuk, V., Radevski, I., Salinas, J. L., Sauquet, E., Šraj, M., Szolgay, J., Volpi, E., Wilson, D., Zaimi, K., and Živković, N.: Changing climate both increases and decreases European river floods, Nature, 573, 108–111, https://doi.org/10.1038/s41586-019-1495-6, 2019. a, b, c, d, e
Blöschl, G., Kiss, A., Viglione, A., Barriendos, M., Böhm, O., Brázdil, R., Coeur, D., Demarée, G., Llasat, M. C., Macdonald, N., Retsö, D., Roald, L., Schmocker-Fackel, P., Amorim, I., Bělínová, M., Benito, G., Bertolin, C., Camuffo, D., Cornel, D., Doktor, R., Elleder, L., Enzi, S., Garcia, J. C., Glaser, R., Hall, J., Haslinger, K., Hofstätter, M., Komma, J., Limanówka, D., Lun, D., Panin, A., Parajka, J., Petrić, H., Rodrigo, F. S., Rohr, C., Schönbein, J., Schulte, L., Silva, L. P., Toonen, W. H. J., Valent, P., Waser, J., and Wetter, O.: Current European flood-rich period exceptional compared with past 500 years, Nature, 583, 560–566, https://doi.org/10.1038/s41586-020-2478-3, 2020. a
Brunner, M. I. and Fischer, S.: Snow-influenced floods are more strongly connected in space than purely rainfall-driven floods, Environ. Res. Lett., 17, 104038, https://doi.org/10.1088/1748-9326/ac948f, 2022. a, b, c, d, e, f
Brunner, M. I., Gilleland, E., Wood, A., Swain, D. L., and Clark, M.: Spatial dependence of floods shaped by spatiotemporal variations in meteorological and land-surface processes, Geophys. Res. Lett., 47, e2020GL088000, https://doi.org/10.1029/2020GL088000, 2020. a
Cannon, A. J., Sobie, S. R., and Murdock, T. Q.: Bias correction of GCM precipitation by quantile mapping: how well do methods preserve changes in quantiles and extremes?, J. Climate, 28, 6938–6959, 2015. a
Center for International Earth Science Information Network – CIESIN – Columbia University: Gridded Population of the World, Version 4 (GPWv4): Population Count, Revision 11 [data set], https://doi.org/10.7927/H4JW8BX5, 2018. a, b
Cornes, R. C., van der Schrier, G., van den Besselaar, E. J., and Jones, P. D.: An ensemble version of the E-OBS temperature and precipitation data sets, J. Geophys. Res.-Atmos., 123, 9391–9409, 2018. a, b
De Luca, P., Hillier, J. K., Wilby, R. L., Quinn, N. W., and Harrigan, S.: Extreme multi-basin flooding linked with extra-tropical cyclones, Environ. Res. Lett., 12, 114009, https://doi.org/10.1088/1748-9326/aa868e, 2017. a
ECA & D: E-OBS gridded dataset, ECA & D [data set], https://www.ecad.eu/download/ensembles/download.php (last access: 1 November 2021), 2022. a
Federal Institute of Hydrology: Global Runoff Database, Global Runoff Data Centre [data set], https://portal.grdc.bafg.de/applications/public.html?publicuser=PublicUser (last access:1 November 2021), 2022. a
Fang, B. and Lu, M.: Heatwave and blocking in the Northeastern Asia: Occurrence, variability, and association, J. Geophys. Res.-Atmos., 125, e2019JD031627, https://doi.org/10.1029/2019JD031627, 2020. a, b, c
François, B. and Vrac, M.: Time of emergence of compound events: contribution of univariate and dependence properties, Nat. Hazards Earth Syst. Sci., 23, 21–44, https://doi.org/10.5194/nhess-23-21-2023, 2023. a, b
Grimaldi, S., Salamon, P., Disperati, J., Zsoter, E., Russo, C., Ramos, A., Carton De Wiart, C., Barnard, C., Hansford, E., Gomes, G., and Prudhomme, C.: River discharge and related historical data from the Global Flood Awareness System. v4.0, European Commission, Joint Research Centre (JRC) [data set], https://cds.climate.copernicus.eu/cdsapp#!/dataset/cems-glofas-historical (last access: 20 September 2023), 2022. a, b
Gudmundsson, L., Boulange, J., Do, H. X., Gosling, S. N., Grillakis, M. G., Koutroulis, A. G., Leonard, M., Liu, J., Schmied, H. M., Papadimitriou, L., Pokhrel, Y., Seneviratne, S. I., Satoh, Y., Thiery, W., Westra, S., Zhang, X., and Zhao, F.: Globally observed trends in mean and extreme river flow attributed to climate change, Science, 371, 1159–1162, https://doi.org/10.1126/science.aba3996, 2021. a
Hall, J. and Blöschl, G.: Spatial patterns and characteristics of flood seasonality in Europe, Hydrol. Earth Syst. Sci., 22, 3883–3901, https://doi.org/10.5194/hess-22-3883-2018, 2018. a
Hargreaves, G. H. and Samani, Z. A.: Reference crop evapotranspiration from temperature, Appl. Eng. Agric., 1, 96–99, 1985. a
Hersbach, H., Bell, B., Berrisford, P., Biavati, G., Horányi, A., Muñoz Sabater, J., Nicolas, J., Peubey, C., Radu, R., Rozum, I., Schepers, D., Simmons, A., Soci, C., Dee, D., and Thépaut, J-N.: ERA5 hourly data on single levels from 1940 to present, Copernicus Climate Change Service (C3S) Climate Data Store (CDS) [data set], https://doi.org/10.24381/cds.adbb2d47, 2023. a, b
Jiang, S., Bevacqua, E., and Zscheischler, J.: River flooding mechanisms and their changes in Europe revealed by explainable machine learning, Hydrol. Earth Syst. Sci., 26, 6339–6359, https://doi.org/10.5194/hess-26-6339-2022, 2022. a, b, c, d, e
Jiang, S., Tarasova, L., Yu, G., and Zscheischler, J.: Compounding effects in flood drivers challenge estimates of extreme river floods, Science Advances, 10, eadl4005, https://doi.org/10.1126/sciadv.adl4005, 2024. a, b
Jongman, B., Hochrainer-Stigler, S., Feyen, L., Aerts, J. C., Mechler, R., Botzen, W. W., Bouwer, L. M., Pflug, G., Rojas, R., and Ward, P. J.: Increasing stress on disaster-risk finance due to large floods, Nat. Clim. Change, 4, 264–268, 2014. a, b
Kemter, M., Merz, B., Marwan, N., Vorogushyn, S., and Blöschl, G.: Joint trends in flood magnitudes and spatial extents across Europe, Geophys. Res. Lett., 47, e2020GL087464, https://doi.org/10.1029/2020GL087464, 2020. a, b, c, d, e, f, g, h
Kumar, R., Samaniego, L., and Attinger, S.: Implications of distributed hydrologic model parameterization on water fluxes at multiple scales and locations, Water Resour. Res., 49, 360–379, 2013. a, b
Kundzewicz, Z. W., Pińskwar, I., and Brakenridge, G. R.: Large floods in Europe, 1985–2009, Hydrolog. Sci. J., 58, 1–7, 2013. a
Lehner, B., Verdin, K., and Jarvis, A.: New global hydrography derived from spaceborne elevation data, Eos T. Am. Geophys. Un., 89, 93–94, 2008. a
Liu, J. and Zhang, Y.: Multi-temporal clustering of continental floods and associated atmospheric circulations, J. Hydrol., 555, 744–759, 2017. a
Lun, D., Fischer, S., Viglione, A., and Blöschl, G.: Detecting flood-rich and flood-poor periods in annual peak discharges across Europe, Water Resour. Res., 56, e2019WR026575, https://doi.org/10.1029/2019WR026575, 2020. a
Luo, M., Lau, N.-C., Liu, Z., Wu, S., and Wang, X.: An observational investigation of spatiotemporally contiguous heatwaves in China from a 3D perspective, Geophys. Res. Lett., 49, e2022GL097714, https://doi.org/10.1029/2022GL097714, 2022. a
Merz, B., Nguyen, V. D., and Vorogushyn, S.: Temporal clustering of floods in Germany: Do flood-rich and flood-poor periods exist?, J. Hydrol., 541, 824–838, 2016. a
Merz, B., Dung, N. V., Apel, H., Gerlitz, L., Schröter, K., Steirou, E., and Vorogushyn, S.: Spatial coherence of flood-rich and flood-poor periods across Germany, J. Hydrol., 559, 813–826, 2018. a, b
Nash, J. E. and Sutcliffe, J. V.: River flow forecasting through conceptual models part I–A discussion of principles, J. Hydrol., 10, 282–290, 1970. a
Niu, G.-Y., Yang, Z.-L., Mitchell, K. E., Chen, F., Ek, M. B., Barlage, M., Kumar, A., Manning, K., Niyogi, D., Rosero, E., Tewari, M., and Xia, Y.: The community Noah land surface model with multiparameterization options (Noah-MP): 1. Model description and evaluation with local-scale measurements, J. Geophys. Res.-Atmos., 116, D12109, https://doi.org/10.1029/2010JD015139, 2011. a
Paprotny, D., Morales-Nápoles, O., and Jonkman, S. N.: HANZE: a pan-European database of exposure to natural hazards and damaging historical floods since 1870, Earth Syst. Sci. Data, 10, 565–581, https://doi.org/10.5194/essd-10-565-2018, 2018. a
Pohl, F., Rakovec, O., Rebmann, C., Hildebrandt, A., Boeing, F., Hermanns, F., Attinger, S., Samaniego, L., and Kumar, R.: Long-term daily hydrometeorological drought indices, soil moisture, and evapotranspiration for ICOS sites, Scientific Data, 10, 281, https://doi.org/10.1038/s41597-023-02192-1, 2023. a
Rakovec, O., Samaniego, L., Hari, V., Markonis, Y., Moravec, V., Thober, S., Hanel, M., and Kumar, R.: The 2018–2020 multi-year drought sets a new benchmark in Europe, Earths Future, 10, e2021EF002394, https://doi.org/10.1029/2021EF002394, 2022. a
Rakovec, O., Kumar, R., and Samaniego, L.: Mesoscale Hydrologic Model based historical streamflow simulation over Europe at degree, https://doi.org/10.48758/ufz.14403, 2023. a, b
Rivoire, P., Martius, O., and Naveau, P.: A comparison of moderate and extreme ERA-5 daily precipitation with two observational data sets, Earth and Space Science, 8, e2020EA001633, https://doi.org/10.1029/2020EA001633, 2021. a
Samaniego, L., Kumar, R., and Attinger, S.: Multiscale parameter regionalization of a grid-based hydrologic model at the mesoscale, Water Resour. Res., 46, W05523, https://doi.org/10.1029/2008WR007327, 2010. a, b
Singh, H., Najafi, M. R., and Cannon, A. J.: Characterizing non-stationary compound extreme events in a changing climate based on large-ensemble climate simulations, Clim. Dynam., 56, 1389–1405, 2021. a
Sklar, A.: Random variables, joint distribution functions, and copulas, Kybernetika, 9, 449–460, 1973. a
Stadtherr, L., Coumou, D., Petoukhov, V., Petri, S., and Rahmstorf, S.: Record Balkan floods of 2014 linked to planetary wave resonance, Science Advances, 2, e1501428, https://doi.org/10.1126/sciadv.1501428, 2016. a
Stahl, K., Hisdal, H., Hannaford, J., Tallaksen, L. M., van Lanen, H. A. J., Sauquet, E., Demuth, S., Fendekova, M., and Jódar, J.: Streamflow trends in Europe: evidence from a dataset of near-natural catchments, Hydrol. Earth Syst. Sci., 14, 2367–2382, https://doi.org/10.5194/hess-14-2367-2010, 2010. a
Stahl, K., Tallaksen, L. M., Hannaford, J., and van Lanen, H. A. J.: Filling the white space on maps of European runoff trends: estimates from a multi-model ensemble, Hydrol. Earth Syst. Sci., 16, 2035–2047, https://doi.org/10.5194/hess-16-2035-2012, 2012. a, b
Sutanudjaja, E. H., van Beek, R., Wanders, N., Wada, Y., Bosmans, J. H. C., Drost, N., van der Ent, R. J., de Graaf, I. E. M., Hoch, J. M., de Jong, K., Karssenberg, D., López López, P., Peßenteiner, S., Schmitz, O., Straatsma, M. W., Vannametee, E., Wisser, D., and Bierkens, M. F. P.: PCR-GLOBWB 2: a 5 arcmin global hydrological and water resources model, Geosci. Model Dev., 11, 2429–2453, https://doi.org/10.5194/gmd-11-2429-2018, 2018. a
Tarasova, L., Lun, D., Merz, R., Blöschl, G., Basso, S., Bertola, M., Miniussi, A., Rakovec, O., Samaniego, L., Thober, S., and Kumar, R.: Shifts in flood generation processes exacerbate regional flood anomalies in Europe, Communications Earth & Environment, 4, 49, https://doi.org/10.1038/s43247-023-00714-8, 2023. a, b, c, d, e, f, g, h, i, j, k, l, m
Tradowsky, J. S., Philip, S. Y., Kreienkamp, F., Kew, S. F., Lorenz, P., Arrighi, J., Bettmann, T., Caluwaerts, S., Chan, S. C., De Cruz, L., de Vries, H., Demuth, N., Ferrone, A., Fischer, E. M., Fowler, H. J., Goergen, K., Heinrich, D., Henrichs, Y., Kaspar, F., Lenderink, G., Nilson, E., Otto, F. E. L., Ragone, F., Seneviratne, S. I., Singh, R. K., Skålevåg, A., Termonia, P., Thalheimer, L., van Aalst, M., Van den Bergh, J., Van de Vyver, H., Vannitsem, S., van Oldenborgh, G. J., Van Schaeybroeck, B., Vautard, R., Vonk, D., and Wanders, N.: Attribution of the heavy rainfall events leading to severe flooding in Western Europe during July 2021, Climatic Change, 176, 90, https://doi.org/10.1007/s10584-023-03502-7, 2023. a
United Nations Office for Disaster Risk Reduction: Global Assessment Report on Disaster Risk Reduction 2015: Making Development Sustainable: The Future of Disaster Risk Management, Tech. rep., United Nations Office for Disaster Risk Reduction (UNDRR), https://www.undrr.org/publication/global-assessment-report-disaster-risk-reduction-2015 (last access: 25 March 2024), 2015. a
Vogel, M. M., Zscheischler, J., Fischer, E. M., and Seneviratne, S. I.: Development of future heatwaves for different hazard thresholds, J. Geophys. Res.-Atmos., 125, e2019JD032070, https://doi.org/10.1029/2019JD032070, 2020. a, b
Zolina, O.: Changes in intense precipitation in Europe, in: Changes in flood risk in Europe, edited by: Zbigniew, W., IAHS Press Special Publ., 97–119, https://doi.org/10.1201/b12348, 2012. a
Zscheischler, J. and Seneviratne, S.: Dependence of drivers affects risks associated with compound events, Science Advances, 3, e1700263, https://doi.org/10.1126/sciadv.1700263, 2017. a, b, c
Zscheischler, J., Mahecha, M. D., Harmeling, S., and Reichstein, M.: Detection and attribution of large spatiotemporal extreme events in Earth observation data, Ecol. Inform., 15, 66–73, 2013. a, b
Zscheischler, J., Mahecha, M. D., von Buttlar, J., Harmeling, S., Jung, M., Rammig, A., Randerson, J. T., Schölkopf, B., Seneviratne, S. I., Tomelleri, E., Zaehle, S., and Reichstein, M.: A few extreme events dominate global interannual variability in gross primary production, Environ. Res. Lett., 9, 035001, https://doi.org/10.1088/1748-9326/9/3/035001, 2014. a, b
Zscheischler, J., Westra, S., van den Hurk, B. J. J. M., Seneviratne, S. I., Ward, P. J., Pitman, A., AghaKouchak, A., Bresch, D. N., Leonard, M., Wahl, T., and Zhang, X.: Future climate risk from compound events, Nat. Clim. Change, 8, 469–477, https://doi.org/10.1038/s41558-018-0156-3, 2018. a
Zscheischler, J., Martius, O., Westra, S., Bevacqua, E., Raymond, C., Horton, R. M., van den Hurk, B., AghaKouchak, A., Jézéquel, A., Mahecha, M. D., Maraun, D., Ramos, A. M., Ridder, N. N., Thiery, W., and Vignotto, E.: A typology of compound weather and climate events, Nature Reviews Earth & Environment, 1, 333–347, https://doi.org/10.1038/s43017-020-0060-z, 2020. a