the Creative Commons Attribution 4.0 License.
the Creative Commons Attribution 4.0 License.
 | 07 Aug 2024
High-resolution operational soil moisture monitoring for forests in central Germany
Ivan Vorobevskii
Thi Thanh Luong
Rico Kronenberg
Rainer Petzold
The forests of central Germany (Saxony, Saxony-Anhalt, and Thuringia) are vital components of the local ecosystems, the economy, and recreation. However, in recent years, these forests have faced significant challenges due to prolonged climate-change-induced droughts, causing water shortages, tree stress, and pest outbreaks. One of the key components of the forests' vitality and productivity is the availability of soil moisture. Given the anticipated increase in the frequency and severity of drought events, there is a growing demand for accurate and real-time soil moisture information. This underscores the need for development of an appropriate monitoring tool to make forest management strategies more effective.
The article introduces an operational high-resolution soil moisture monitoring framework for the forests in central Germany. The key components of this system include the advanced LWF-BROOK90 1D water balance model, a large database of the National Federal Forest Inventory, high-resolution forest soil maps, real-time climate data from the German Meteorological Service, and a web information platform for the presentation of daily updated results. This system informs the public and empowers forest managers and other decision-makers to take targeted, local measures for sustainable forest management, aiding in both drought mitigation and long-term forest health in the face of climate change. The validation of the system using soil moisture measurements from 51 stations with various sensor depths (up to 100 cm) showed an overall good agreement (0.76 median Pearson correlation), which was found to be higher for deciduous rather than coniferous forests. Finally, the framework is discussed against the background of the main limitations of existing monitoring systems and how operational soil moisture measurements contribute to better interpretation of simulations.
- Article
(14711 KB) - Full-text XML
- BibTeX
- EndNote


The forests of central Germany (Saxony, Saxony-Anhalt, and Thuringia) are of ecological, economic, and recreational importance in the region. In recent years, climate changes, particularly prolonged droughts in 2018, 2019, 2020, and 2022 (Meusburger et al., 2022; Obladen et al., 2021; Patacca et al., 2023; Spiecker and Kahle, 2023), have significantly affected the forest ecosystem. These droughts not only led directly to water shortages and the associated stress on trees and thus the whole forest ecosystem (Buras et al., 2020), but they also caused indirect damage through pest outbreaks, such as of the bark beetle (Hlásny et al., 2021). Moreover, it was found that, especially under drought conditions, the weakened trees are less resistant to such pests (Vindstad et al., 2019). From 2018 to 2022, pest calamity and droughts caused a loss of 500 000 ha of forests in Germany, requiring EUR 900 million for climate-adapted forest management (Bundesministerium für Ernährung und Landwirtschaft, 2023). The quick spread of the insect infestation and other associated (and non-associated) forest damage (i.e. windfall) combined with the potential increase in the drought stress due to climate change highlights the urgency of the situation and the need to develop effective countermeasures for both short- and long-term management strategies (Albrich et al., 2020; Schuldt et al., 2020).
The vitality and productivity of forests are highly dependent on the amount of water available in the soil (Spiecker and Kahle, 2023; Zang et al., 2014). Under changing climate conditions, drought events and extreme weather conditions are likely to become more frequent and severe (Hanel et al., 2018; Orth et al., 2016; Zhou et al., 2019), and it is essential to have reliable estimations of soil water availability in forests (Meusburger et al., 2022). Up-to-date soil moisture information influences a wide range of forestry decisions, from routine forest management and risk assessment to specific mitigation measures at sensitive sites (Sharma et al., 2022; Zweifel et al., 2023). For example, it plays a major role in planning the planting and trimming actions based on current soil moisture conditions (Scholz et al., 2023). In addition, these real-time data help with risk management, such as assessing the risks of wildfires during dry periods, the growth of associated pathogens, and treefall of stressed and vulnerable trees in wet periods. In ecologically sensitive forest areas, operational data help to make an appropriate choice of specialized technologies to maintain forest health and resilience. Thus, a precise real-time monitoring system of soil moisture can offer not only effective measures to mitigate drought vulnerability of forests, but also a crucial tool for sustainable forest management in the future.
Currently, few initiatives exist, e.g. in north-western Switzerland (https://www.bodenmessnetz.ch, last access: 5 August 2024) or the Cosmic-ray soil moisture network in the UK (https://cosmos.ceh.ac.uk, last access: 5 August 2024) on a local national scale and the International Soil Moisture Network (https://ismn.earth/en/dataviewer, last access: 5 August 2024, Dorigo et al., 2021) on a global international scale, which provide data on in situ point-based soil moisture measurements. However, all these networks are still limited by their spatial and temporal coverage due to the very high operational costs. In this context, site-specific operational water balance modelling, especially in combination with climate change scenarios, is gaining attention over the measurement-based information platforms. At present, two nationwide platforms exist for this purpose in Germany. The German Drought Monitor (https://www.ufz.de/index.php?en=37937, last access: 5 August 2024, Zink et al., 2016) has a resolution of 4 km and demonstrates simulation results from the Mesoscale Hydrological Model statistically converted to a specific soil moisture index representing moisture anomalies for the topsoil and dull soil column, which however do not account for different forest types. The German Meteorological Service Soil Moisture Viewer (https://www.dwd.de/DE/fachnutzer/landwirtschaft/appl/bf_view/_node.html, last access: 5 August 2024) utilizes the AMBAV agricultural and LWF-BROOK90 hydrological models parameterized for a 1 km grid size and shows the plant-available water for three types of short vegetation and four tree species. However, despite the big potential of these systems for national-scale soil moisture assessment, they possess certain limitations in terms of their precision and interpretation scope. Despite advances in the development of process-oriented hydrological models for the forests and the availability of the high-resolution datasets for their parameterization in recent years (Hoermann and Meesenburg, 2000), these systems do not fully utilize their potential. Furthermore, they lack the ability to account properly for the small-scale variability of soil, land use, and weather factors.
This motivates us to come up with a high-resolution point soil moisture monitoring system that is updated daily and that takes into account important local site information such as aspect, slope, soil type, and profile. Thus, these site-specific data allow forest managers and decision-makers to take targeted local-scale measures for sustainable forest management. In addition, a daily update enables timely detection of anomalies or emerging droughts, allowing for quick adaptation measures. The decisive value of our approach stems from the integration of existing inventory systems, in particular the Federal Forest Inventory, which provides detailed, site-specific, and integrated information on the forests of central Germany. Combining these datasets with operational meteorological data, the effects of different tree species on the changes in soil moisture for a local scale can be better understood.
In this paper, we present an operational soil moisture monitoring system for central Germany that addresses the shortcomings of existing monitoring products and that uses the current state-of-the-art forest hydrological modelling techniques, providing results in real time for forest practitioners or interested users using a web platform. We focused on a detailed and transparent technical description of the system architecture and the data representation on the website. Special attention is given to the qualitative and quantitative analysis of the operational meteorological data used for the model forcing.
2.1 Central German region
Historically, the central German region (Fig. 1) covers three states (approximately 55 000 km2) – Saxony (SN), Saxony-Anhalt (SA), and Thuringia (TN). The topography of the region ranges from the lowlands (0–200 m) in the north of SN and SA to the mountainous regions in the south of SN (up to 1200 m) and TN (up to 1000 m). Prominent-elevation geographical features are the Ore Mountains on the border with the Czech Republic, the Harz Mountains in the western part of SA, and the Thuringian Forest in the south of TN.
The climate conditions of central Germany are characterized by a moderate continental climate. According to the Köppen–Geiger climate classification (Kottek et al., 2006), all three states have a predominantly Dfb (hemiboreal) climate type, meaning warm summers and cold winters, with occasional heat spells and typical frost-free periods of 3–5 months. The mean annual air temperature increases from +3–5 °C in the southern elevated parts to +10–12 °C in the flatlands. Pronounced annual cycles introduce a high variability between the summer and winter months as well as between day and night temperatures. Maximum daily values could reach up to +35 °C, while minimum daily temperatures can go far below +0 °C (up to −21 °C in the Ore Mountains). Due to orographic lifting effects, variations in the annual precipitation amounts are high as well. Mountainous regions of TN and SN receive 1100–1500 mm annually, while lowlands in the north get only 500–700 mm yr−1. Typically, around 70 % of annual precipitation falls from May to September, and the driest month is October.
According to Copernicus Global Land Service: Land Cover 100 m (Buchhorn et al., 2020), the total forest coverage of the region is about 36.9 % (Fig. 1), from which evergreen needleleaf forests prevail and occupy 17.7 %, deciduous broadleaf forests cover 7.6 %, and the rest are mixed forests (11.6 %). The coniferous needleleaf forests are dominated by Norway spruce (Picea abies), Scots pine (Pinus sylvestris), and European larch (Larix decidua). The deciduous forests are dominated by European beech (Fagus sylvatica) and pedunculate oak (Quercus robur).
Soil types in the forests of central Germany are highly variable, depending on the topography, underlying geology, and forest type. In general, in the mountainous regions of TN and SN, Podzols and brown soils are common for the forests, and in the lowlands, gleys (or pseudogleys) appear along with the abovementioned types as well (Krug, 2000). Typically, forest soils are characterized by rich humus horizons that result from decades of accumulation of deciduous and coniferous litter. In deciduous forests, especially those dominated by beech and oak, the soils are often loamy, with a high humus content that promotes fertility. Coniferous forests, especially those dominated by spruce, often have pale podsolic loamy (or sandy loam) soils. These are typically more acidic and much less fertile than in deciduous forests. Mixed forests could combine the soil properties of deciduous and coniferous forests, although the specific properties are highly variable, depending on the dominant tree species and site conditions.
2.2 Forest monitoring data
2.2.1 Data from the German National Federal Forest Inventory
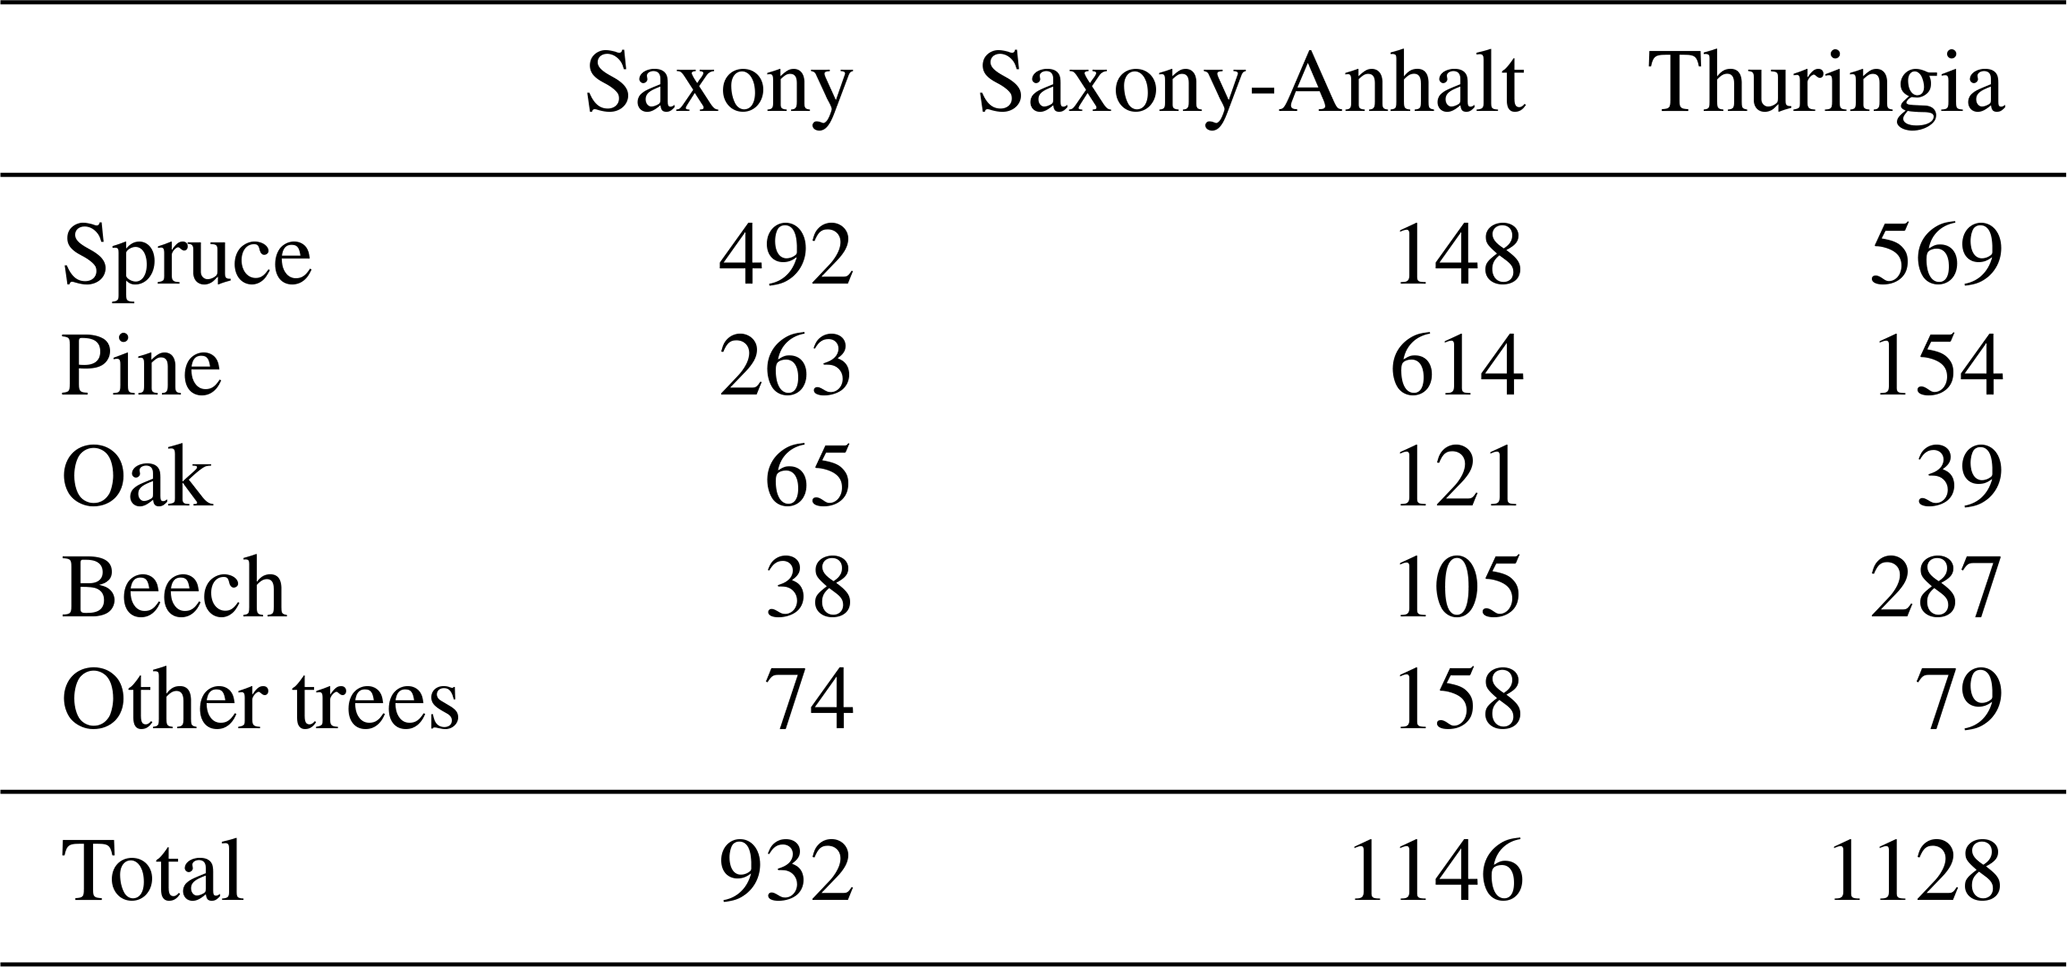
The National Federal Forest Inventory (NFI) is a long-term national German project aiming to collect and store information on forested areas in the country (“Bundeswaldinventur” or “BWI” in German). It not only provides a comprehensive overview of the condition of Germany's forests, but it also integrates important soil information. Every 10 years, field observations are conducted to record tree species changes and growth data and to update soil profile data and other relevant forest and soil information. To allow intercomparison between inventories, observations are made on the same plots and using the standardized procedure. Due to the secrecy of the real plot coordinates, the NFI rounds coordinates of the plots for publishing, thus forming square or triangle shapes (tract corners, further referred to as NFI sites) with a side of 1 km within which the real inventory plots lie. The third round of the NFI, whose data are open-source and were used in this study, took place in 2012 (https://www.bundeswaldinventur.de, last access: 5 August 2024, Bundesministerium für Ernährung und Landwirtschaft, 2014). The fourth round started in 2021 and was completed by the end of 2022. However, the data processing is not finished yet (publication is planned for the end of 2024). The data provide insights into forest management, tree species composition, timber use, and soil conditions. In particular, the soil data collection and update are essential for determining the nutrient availability and water-holding capacity, which directly affect forest health and growth. They also help to assess carbon sequestration and are key indicators of forest health and resilience to environmental stress. By linking forest and soil data to climate and site information, profound analyses of the effects of different environmental factors on forests can be carried out. An overview of the selected NFI sites and a summary of the dominant tree species are presented in Fig. 1 and in Table 1.
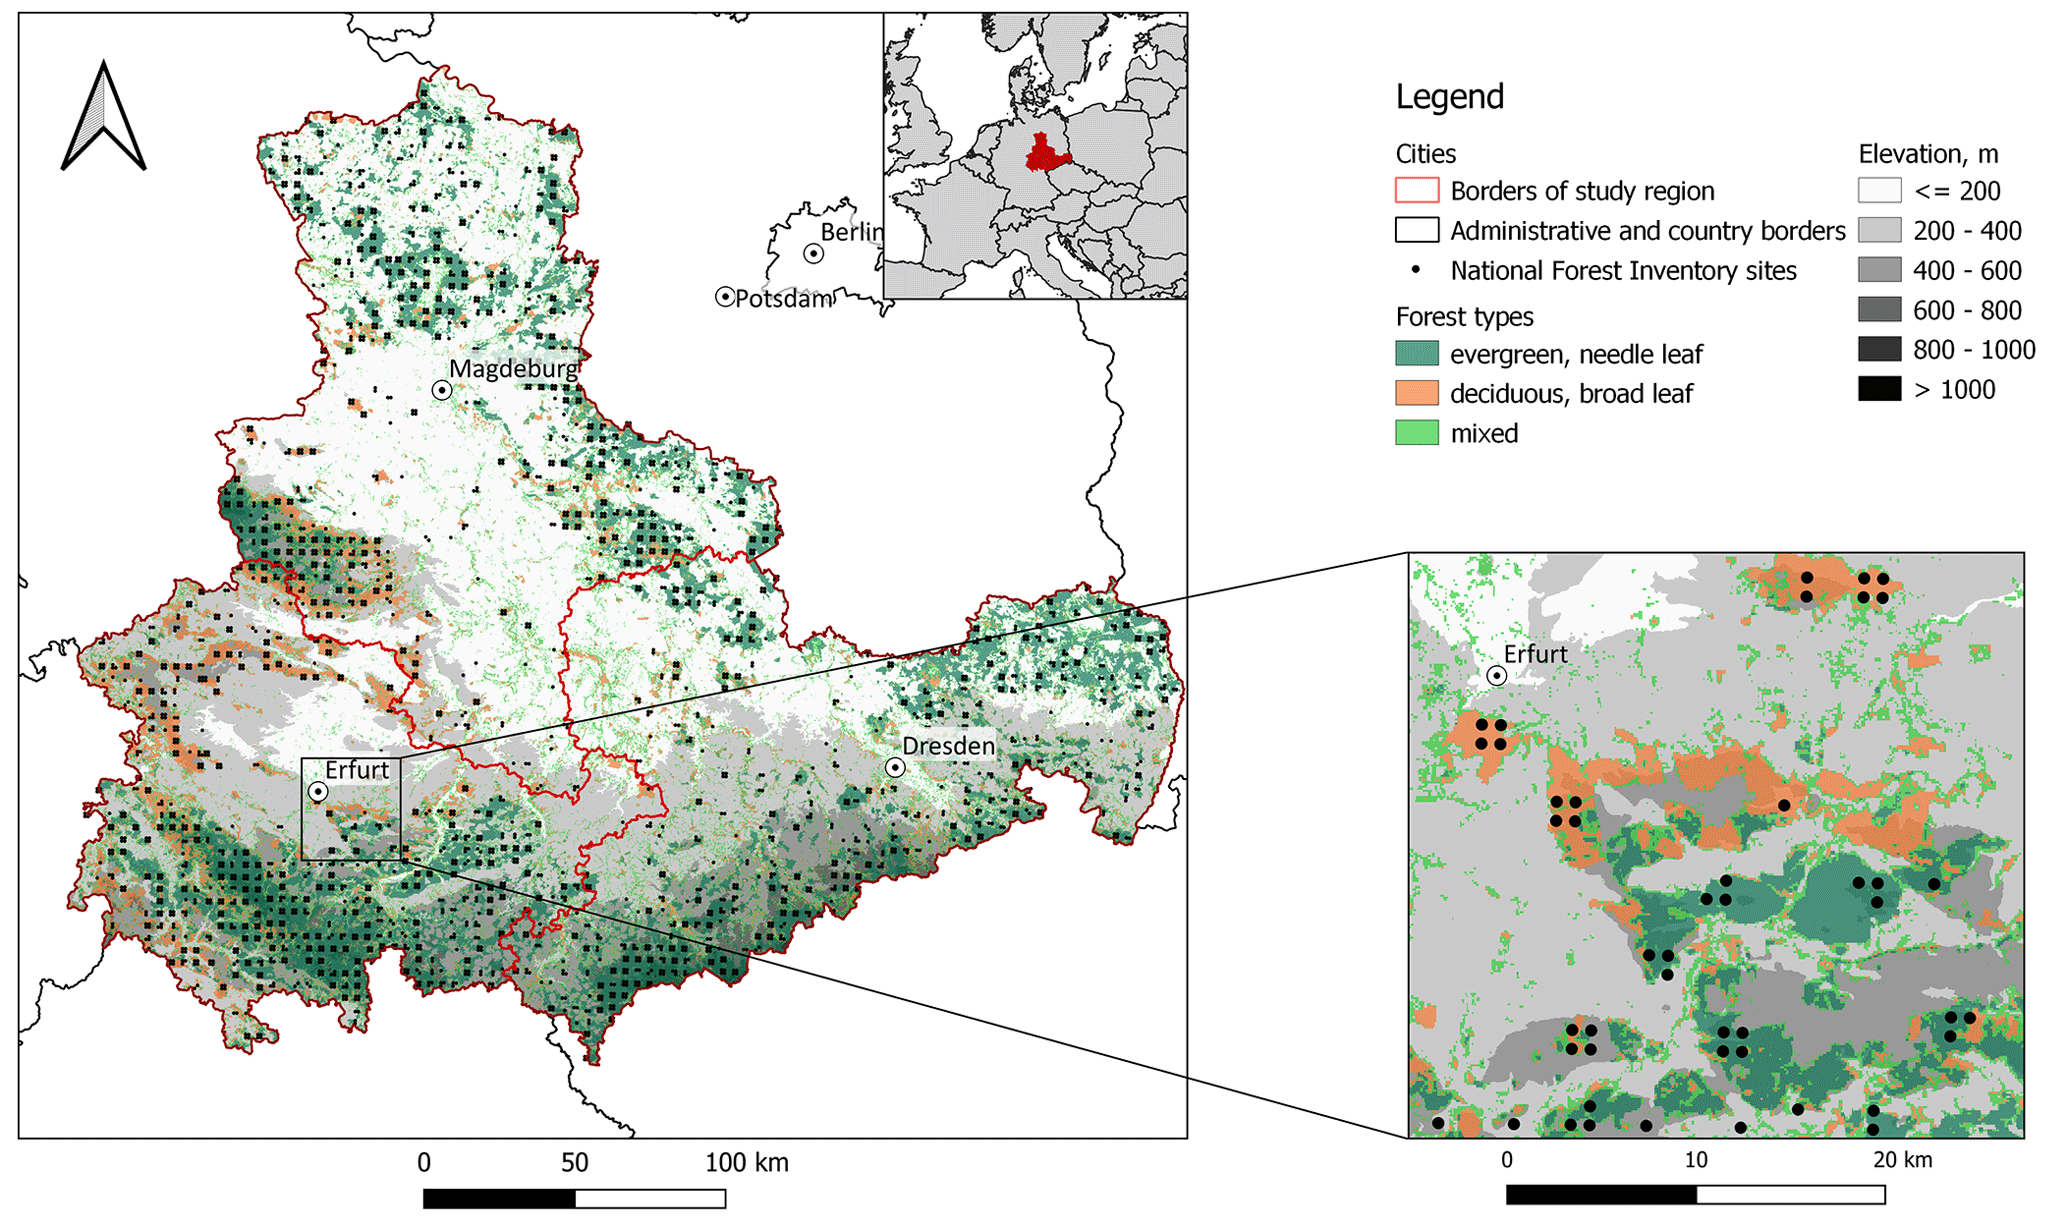
Figure 1Overview of the study region and the selected National Federal Forest Inventory forest monitoring sites.
Table 1Summary of the dominant tree species from the selected NFI sites.
2.2.2 Local soil form map for the forested areas
The state authorities of SN (Forestry of Saxony or Sachsenforst in German), SA (State Forestry Centre of Saxony-Anhalt or Landeszentrum Wald Sachsen-Anhalt in German), and TN (Forestry of Thuringia or Thüringerforst in German) provided us with the outcome of a long-term soil field campaign which resulted in a high-resolution local soil form (Lokalbodenformen in German) map for the forests (Petzold et al., 2016). The local soil form is a sub-division of the (main) soil type that takes into account finer differences in the substrate, the deposition features, and the horizon arrangement. Additional criteria for their identification can include nutrient and humus ratios, which have significance for tree species selection and soil treatment. To distinguish these soil forms, local place names are typically added in front of the main soil type. For example, for the main soil type “Gneiss Brown Soil”, the local form “Ölsengrunder Gneiss Brown Soil” could be identified. This allows the creation of a high-resolution soil map (1:10 000, where the smallest area-mapping unit is about 0.5 ha). This dataset is based on the soil profile excavation data as well as NFI data and covers almost all the forested area in the study region. The joint map from the three states consists of approximately 363 000 polygons containing more than 2500 unique local soil forms. For technical reasons (interactive web representation of the results), a shape-based map was converted to a point-based dataset using a geometric centroid function (nevertheless ensuring that the point falls within the polygon boundaries). Finally, for each node, the dominant forest type was identified based on the new high-resolution (10 m) “Dominant tree species for Germany” dataset (Blickensdörfer et al., 2022).
2.2.3 Forest climate stations
Other sources of the monitoring data are the local forest authorities. Currently, Forestry of Saxony provides access to the operational information from 21 forest climate stations (“Waldklimastationen” in German). All the stations are located inside or directly on the edges of the forest areas (see Sect. 2.2.3 and Appendix A – Table A1). The provided data include not only standard meteorological parameters, but also soil moisture under grass vegetation at 30 cm depth of a daily timescale. These grass soil moisture measurements are also important to the foresters, since they help to predict the changes in moisture conditions in the forest stands before they occur, since grass vegetation typically has a faster reaction to the changing meteorological conditions than forests have. The REST-API (Application Programming Interface that conforms to the design principles of the REpresentational State Transfer architectural style) access to the data is provided via OpenSensorHub (https://sh-rekis.hydro.tu-dresden.de/, last access: 5 August 2024) under cooperation with Pykobytes GmbH.
2.2.4 Soil moisture measurements
The soil moisture observations (soil water content using the time domain reflectometry method) used for the framework evaluation were collected from Forestry of Saxony, Forestry of Thuringia, the Integrated Carbon Observation System (ICOS) portal (Bernhofer et al., 2024a, b, c; Knohl et al., 2024; Rebmann et al., 2024), and the FLUXNET portal (Pastorello et al., 2020) (Fig. 2 and Appendix A – Table A1). In total, 51 stations and 245 sensors with daily time series covered all the studied vegetation types as well as the different geographical conditions in the region (except for Saxony-Anhalt, where data from only one station were found). The elevations of the stations range from approximately 100 m in the lowlands (northern parts of Saxony) up to 850 m in the Ore Mountains. The mean annual precipitation sums (1991–2020) vary from 600 mm in the northern region up to 1200 mm for the elevated southern parts. Of the total number, 22 stations are located under grass vegetation (primarily in Saxony), 10 under spruce, 3 under pine, 6 under oak, and 9 under beech (primarily in Thuringia) forests. The most common soil types include variations of brown soils, Gleysols, and Podzols. All the stations (except for the forest climate stations under grass in Saxony) conduct measurements on multiple soil horizons (within a range from 5 cm up to 100 cm); some of the stations have multiple plots (up to six). The time series length for each station as well as for each horizon and sensor is highly variable. The majority of the time series have a length of 2–8 years (median 5.2 years), and some go up to 25 years.
Raw time series were superficially checked for doubtful or low-quality values. We did not perform in-depth analyses and advanced corrections or filtering. In a very few cases, data from several sensors were removed manually after personal communication from the data providers. These cases include clear outliers, soil moisture sensor change and movement, and animal or tree root disruptions.
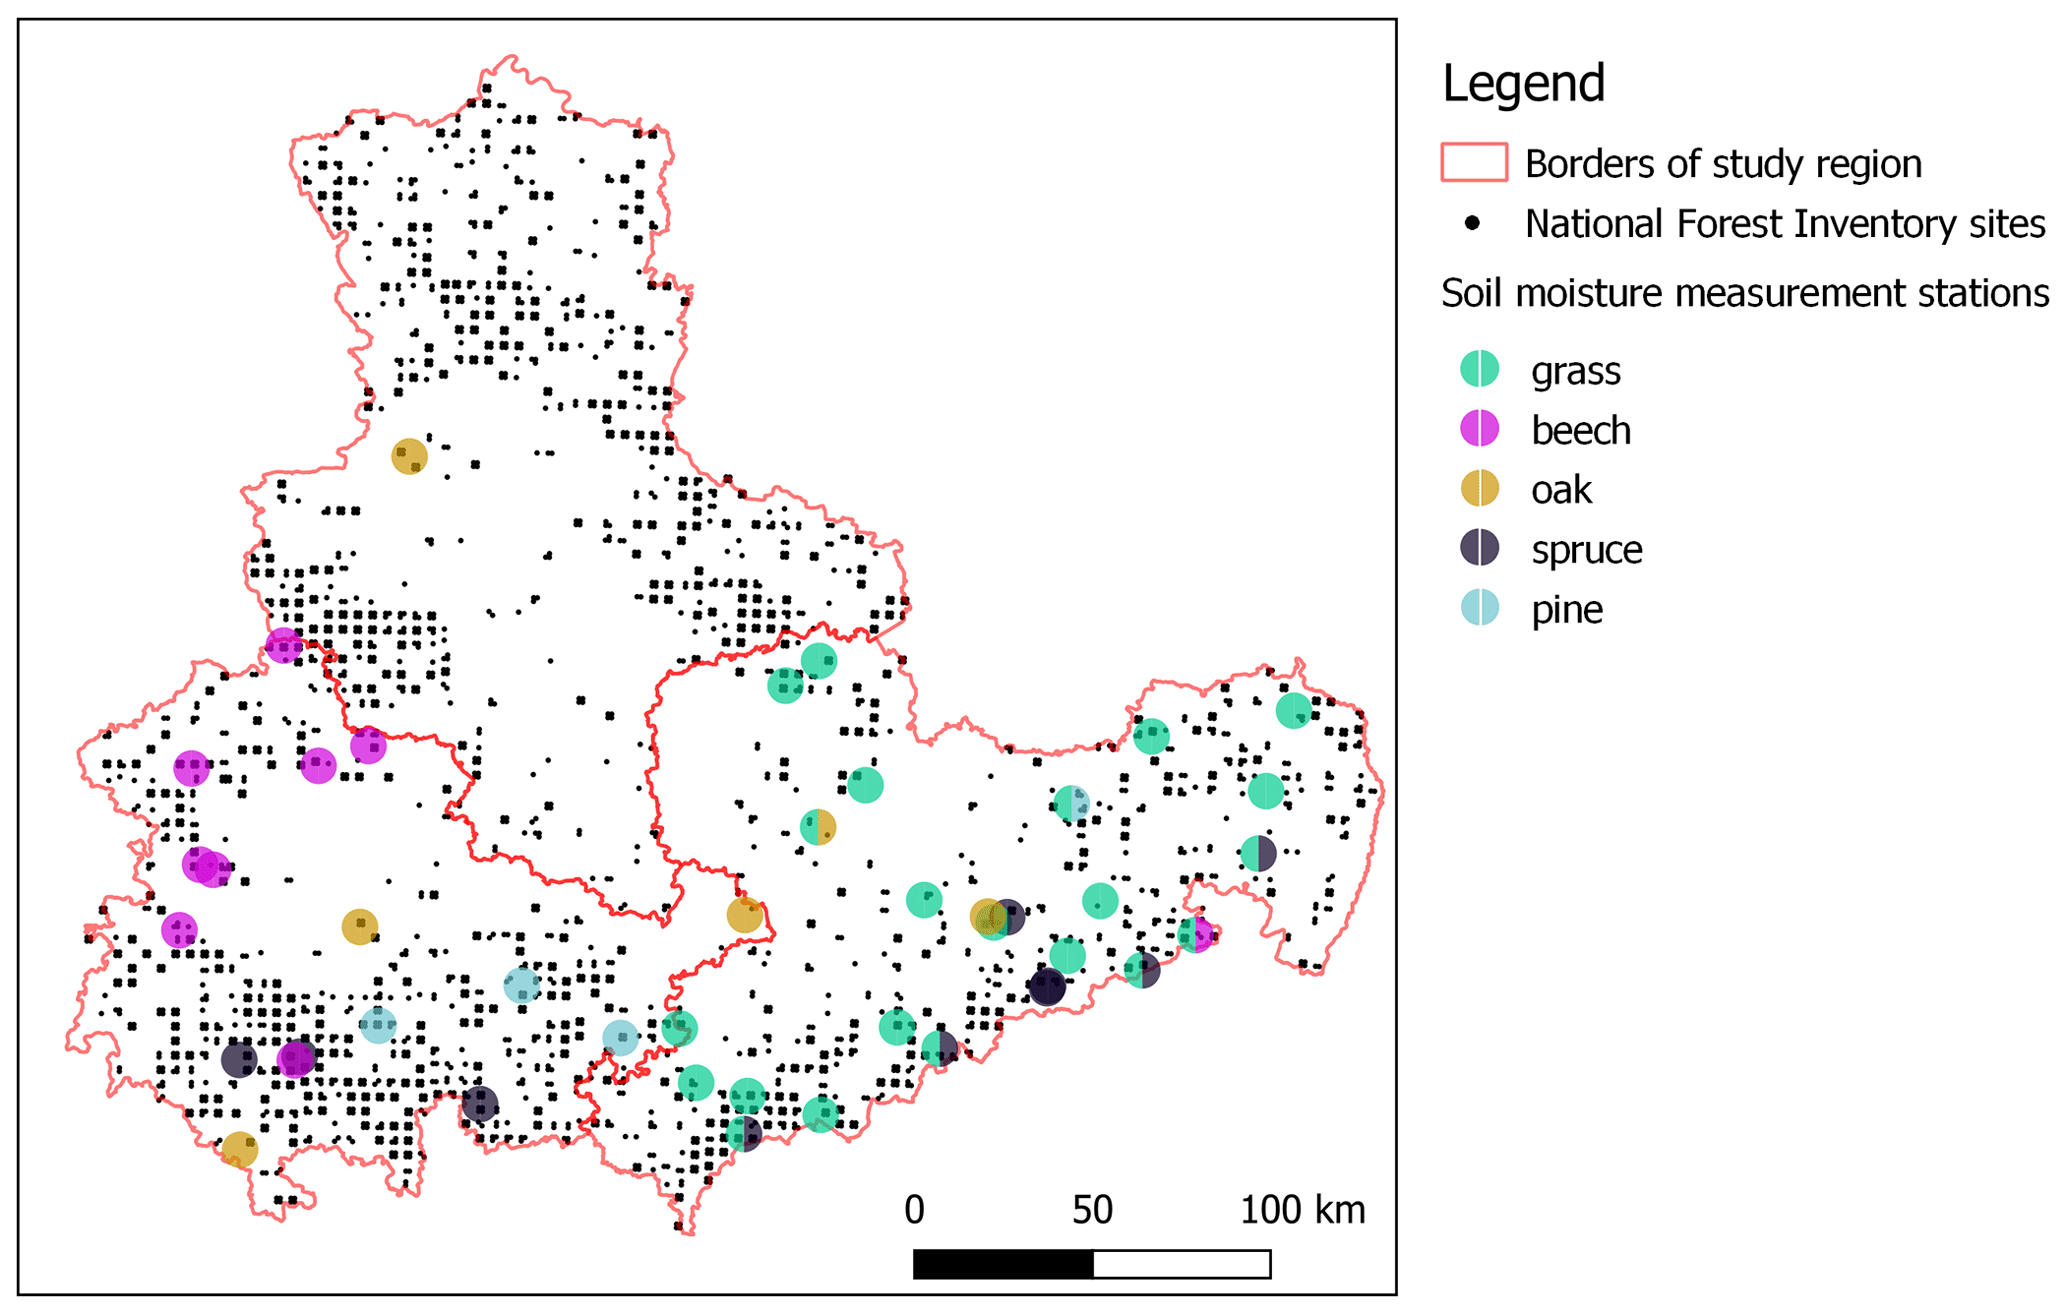
Figure 2Overview of the soil moisture measurement stations (see also Appendix A – Table A1). Note that, for some stations in Saxony, the dominating vegetation symbol is split in two due to the map scale (the same station with grass and forest measurements).
2.3 Framework description
2.3.1 One-dimensional physically based water balance model (LWF-BROOK90) and its parameterization
The LWF-BROOK90 water balance model (Hammel and Kennel, 2001) focuses on detailed atmosphere–plant–soil water exchange on a 1D scale and is well known for its accurate representation of evaporation and vertical soil water movement processes. “LWF” stands for the Bayerische “Landesanstalt für Wald und Forstwirtschaft” (Bavarian State Institute of Forestry), where the original model was first modified. The model is a branch of the BROOK90 model originally developed by Federer et al. (2003) and recently adopted in the R package LWFBrook90R (Schmidt-Walter et al., 2020). As its ancestor, the LWF-BROOK90 model applies a modification of the Penman–Monteith approach by Shuttleworth and Wallace (1985) which allows separation of an evaporation process into its components: interception, transpiration, and bare soil (or snow) evaporation. This approach uses a “single big leaf” concept and two layers separating canopy and soil. The soil profile could be represented with multiple layers. The water movement within the soil column could be divided into matrix and macropore bypass flows. It is controlled by matrix potential as well as potential evaporation and is described with the Darcy–Richards equations using the Mualem–van Genuchten hydraulic parameterization (van Genuchten, 1980) instead of Clapp and Hornberger (1978) used in BROOK90. Additionally, LWF-BROOK90 is capable of including dynamic temperature-based vegetation characteristics (i.e. bud burst and leaffall timings as well as leaf-area-index variations).
For the study, a set of land cover parameters was created to represent mature beech, oak, spruce, and pine forests commonly widespread in the region (Appendix B – Table B1). Additionally, grassland cover was considered as a reference. This parameter set represents site topographical conditions, a plant stand with its stem, leaf coverage, and root parameters. The set is based on the standards for temperate deciduous broadleaf and evergreen coniferous forests and grasslands proposed by Federer et al. (1996) with adaptation to the site-specific conditions of central Germany. Site aspect and slope were calculated from the SRTM30 (NASA JPL, 2019) digital elevation model. Forest height was set according to the GEDI dataset (Potapov et al., 2021). The main plant parameters like reflectivity, conductivity and stomatal behaviour, roughness, interception, and roots were assigned based on existing extensive reports on the model application for forests in Germany (Weis et al., 2023; Wellbrock et al., 2016), Level-II data from forest monitoring plots (https://bwi.info/Download/, last access: 5 August 2024), and measured and calibrated BROOK90 parameters for FLUXNET towers in Saxony (Vorobevskii et al., 2022). The vegetation phases are determined dynamically using the vegperiod package (Orlowsky et al., 2008), which incorporates several methods for seasonal variations of foliage growth. Budburst timing is based on the method of Menzel (1997) that is applicable for various tree species. For that, the cumulative heat sum (starting from February of the current year) is estimated from the daily temperature and tree-specific “heat” threshold (3–6 °C). Then, the critical budburst temperature is calculated from the number of “chill” days (starting from November of the previous year) using another tree-specific chill threshold (7–9 °C). Budburst day is assigned to the day, when the heat sum exceeds the estimated critical temperature. For the leaffall phase, the von Wilpert (1990) method was used. It is based on the 7 d moving averages of daily mean temperature and assigns leaffall to a day, where at least 5 previous days had temperatures under 10 °C. Additionally, it “restarts” the vegetation period if the moving average temperatures of more than 5 consecutive days are over 10 °C. Finally, if no cold period fulfilling the first criterion was found, a default leaffall date is assigned as 5 October. The seasonal course of the leaf area index (LAI) is then determined from the maximum annual LAI, budburst, and leaffall dates and duration using the integrated “b90” model. It uses budburst and leaffall dates and duration, together with maximum (assumed to be constant for the vegetation period) and winter LAI (as a fraction of the maximum value) values, to create daily time series using a simple linear model. The root distribution over the soil profile is controlled by betamodel, which calculates the relative root length densities from the cumulative proportion of roots derived by the model following Gale and Grigal (1987). For that, it uses maximum length, depths of roots, and curve shape parameters (Appendix B – Table B1), which were assigned following Weis et al. (2023). It should be pointed out that long-term vegetation changes (i.e. tree ageing) are not considered in the presented operational-mode framework.
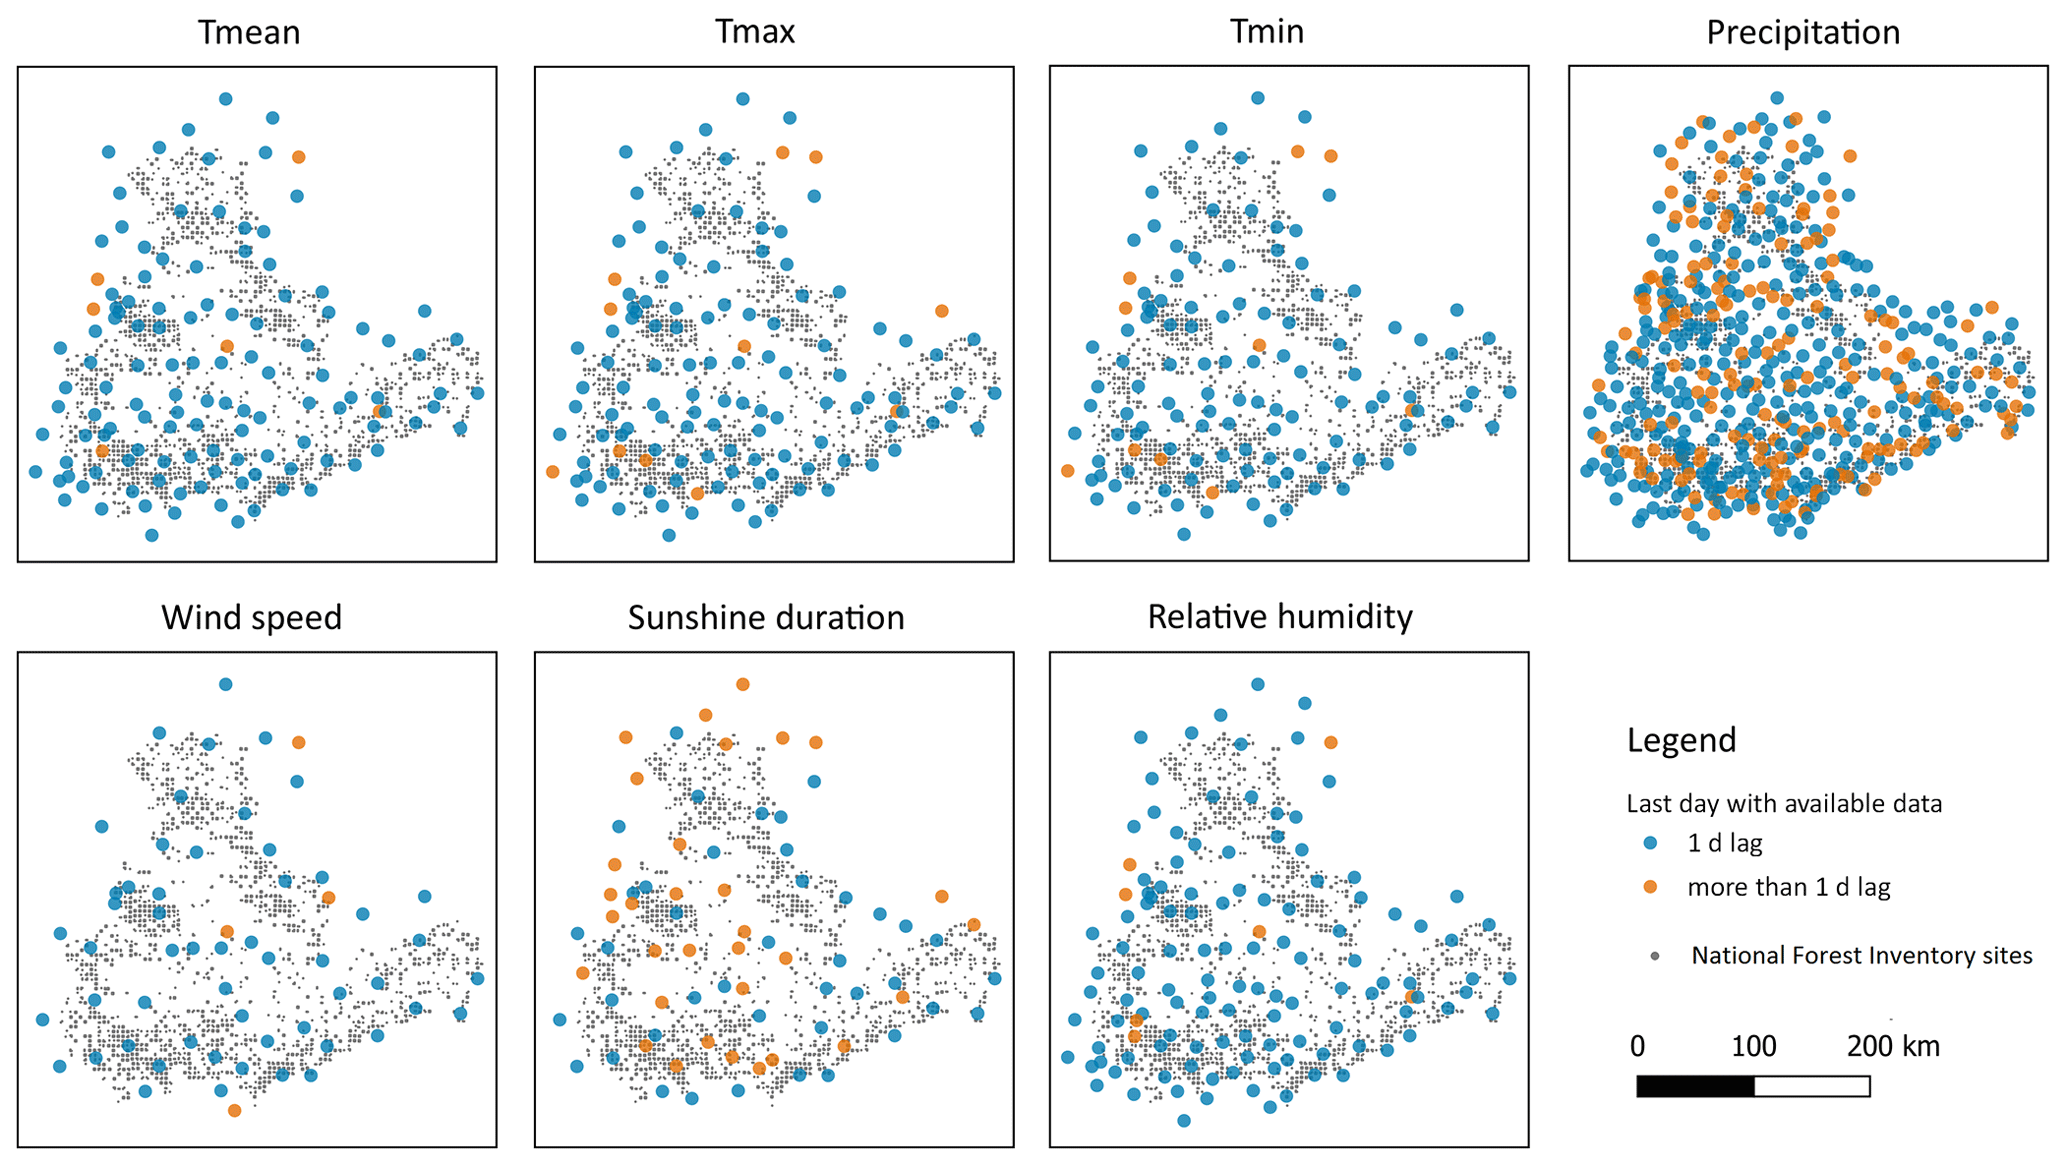
Figure 3Real-time meteorological station data availability for different variables for the study area on a daily scale: last date with non-missing data (retrieved from the File Transfer Protocol server of the German Meteorological Service at 12:00 CEST on 20 September 2023).
The soil parameters for the model were taken from the NFIWADS database specifically created for NFI plots (Schmidt-Walter et al., 2019). Physical soil properties (layers, depth, texture, bulk density, and coarse fragments) were obtained from the NFI soil profile database (Petzold and Benning, 2017). This database contains the predominant soil types for the inventory plots, based on the area within a 20 m radius of the centre of a plot. These soil types are linked to detailed soil profiles compiled by federal soil experts and based on the best available data in federal soil information systems for the NFI plots. Typically, all the soil profiles contain information to a depth of at least 2 m, unless the subsoil (bedrock) appears before. Based on these data, the hydraulic properties of the mineral soils, which are needed for Mualem–van Genuchten parameterization of water retention curve and conductivity functions (van Genuchten, 1980), were determined using the Wessolek et al. (2009) pedotransfer function. The shape of the water retention curve thereafter could be determined using the following Eq. 1:
where ΘΨ, ΘR, and ΘS are the volumetric soil moisture contents for the current, residual, and saturated matrix potentials respectively; the n parameter is a measure of the pore size distribution; and the α parameter is related to the inverse of the air entry, saturation conductivity, and tortuosity parameters related to the pore connectivity. The unsaturated water conductivity could be determined as follows (Eq. 2):
where KΨ and KS are the hydraulic conductivities for the current and saturated matrix potentials respectively, and x is the tortuosity parameter.
Due to the absence of data about forest floor horizons, a uniform root-free floor horizon (6 cm) was added to profiles to provide uniform soil evaporation conditions. For the organic soil horizons, retention and conductivity parameters were taken from Wösten et al. (1999). The depth of the soil profile was organized by dividing it into layers of increasing thickness.
2.3.2 Meteorological data
Meteorological data needed to force the LFW-BROOK90 model are collected from an open-access database – the German Meteorological Service (Deutscher Wetterdienst – DWD) File Transfer Protocol (FTP) server (https://www.dwd.de/DE/leistungen/klimadatendeutschland/statliste/statlex_html.html;jsessionid=79348C8F2179C2D75DEE0ED4F3DE61ED.live11041?view=nasPublication&nn=16102, last access: 5 August 2024). The following variables are used on a daily scale: minimum, maximum, and mean air temperature, precipitation, wind speed, relative humidity, and sunshine duration. At first, the summary table on all available meteorological stations in Germany provided and regularly updated by the DWD (“Stationslexikon”) was filtered and reduced based on spatial (study region plus a 30 km buffer zone) and temporal (data availability starting from 2010) principles. In total, 147 climate and 619 precipitation stations matched the criteria (Appendix A – Fig. A1). According to FTP metadata, meteorological data for the last day are added to the files between 09:00 and 10:00 of the current day. However, our tests revealed that, usually, real updates inside the files happen 1 or 2 h later. Furthermore, station data are split into parts: “historical” and “recent” (data from the current year).
In reality, available meteorological data which could be found and retrieved from the DWD FTP server significantly vary from the selected station shortlist (Fig. 3). Up-to-date (1 d lag) air temperature and relative humidity data are available from around 115 stations, and sunshine duration and wind data could be retrieved from 31 and 54 stations respectively. Finally, precipitation measurements are represented with 330 up-to-date stations. Still, the spatial coverage of meteorological data for all the variables in the study area can be considered good and homogeneous. Although the exact number of available stations with up-to-date data vary from day to day, tests of the meteorological data retrieval for 10-year simulations during the June–October 2023 period did not show large deviations in station data availability (<5 % of the total station number).
Figure 4 summarizes the availability of actual (1 d lag) meteorological data with regards to the distances to the NFI plots. The median distance to the nearest station with temperature and relative humidity is about 11 km, while for the less dense wind and radiation measurements the closest station is on average 15 km away. Precipitation stations due to higher density are typically found at much shorter distances of approximately 5 km. At first sight, for several reasons, these relatively far distances do not necessarily dictate the output resolution of the presented framework. At first, it should be taken into account that variables such as temperature and solar radiation do not typically possess large spatial heterogeneity within the resulting average distances, which could have a significant influence on the modelling results. Further, for each simulated point within the same NFI plot, the meteorological input will be different due to the different distances to the stations, even if the filtered meteorological stations are the same.
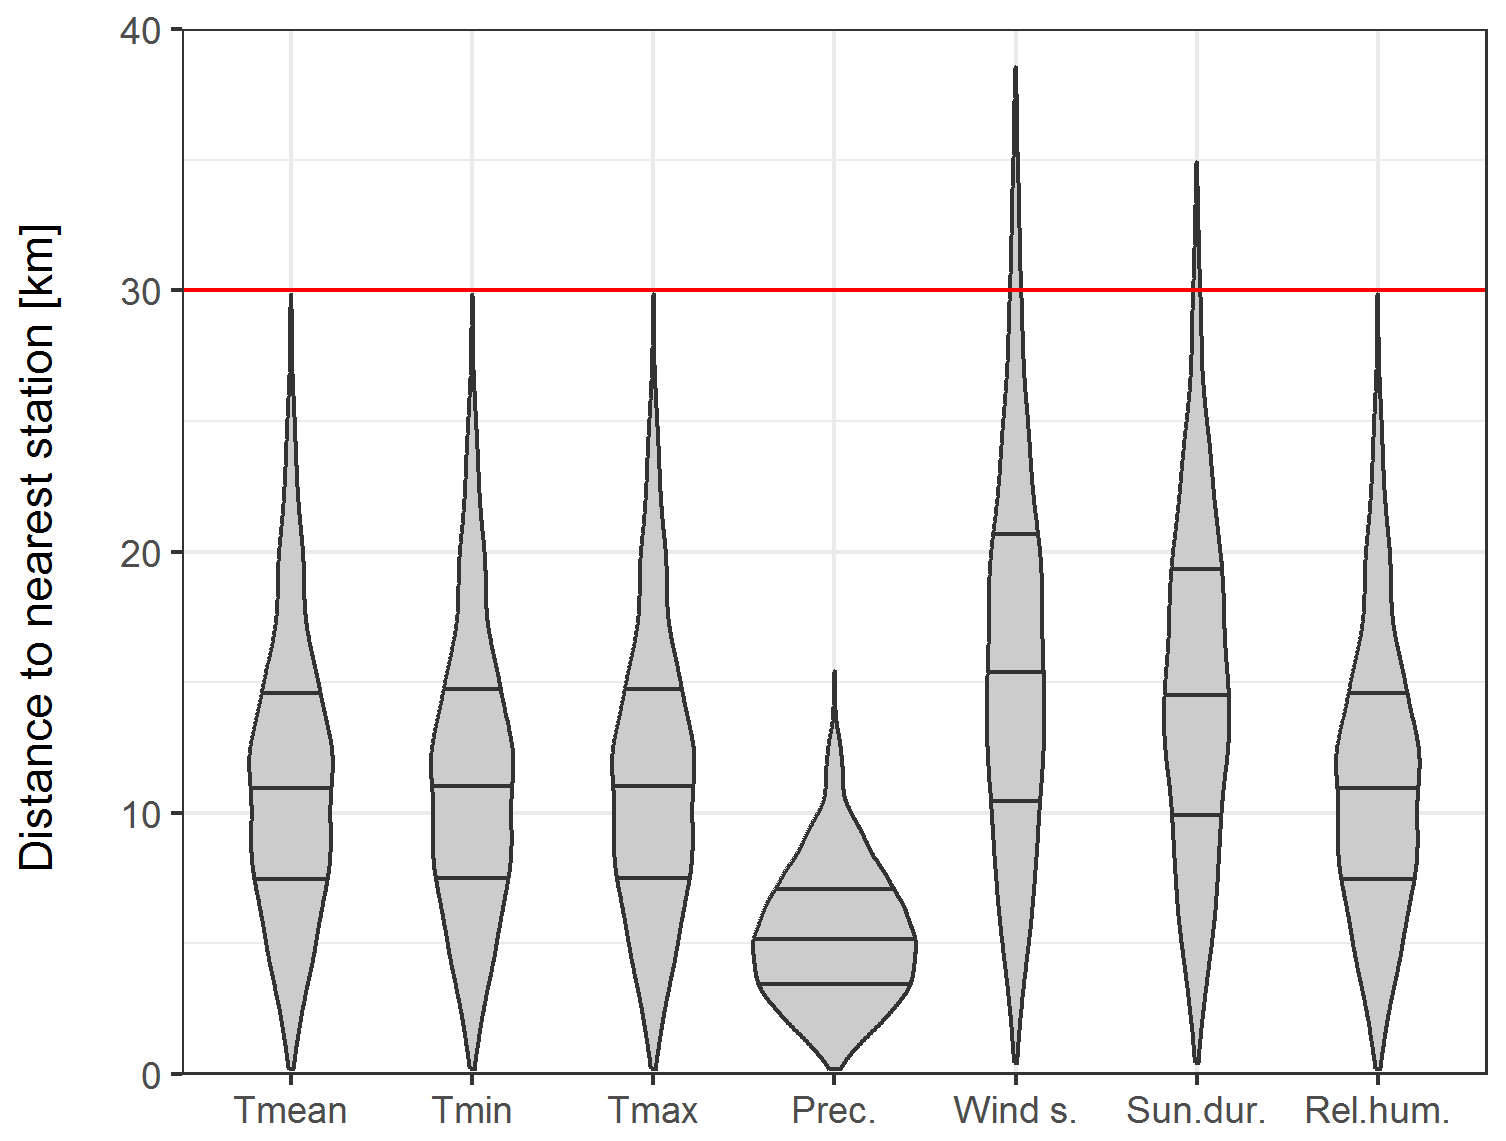
Figure 4Distances to the nearest meteorological stations with available 1 d lag data for the National Federal Forest Inventory plots. The red line represents the chosen 30 km buffer zone. The horizontal lines inside the respective violin plots represent the 25th, 50th, and 75th quartiles.
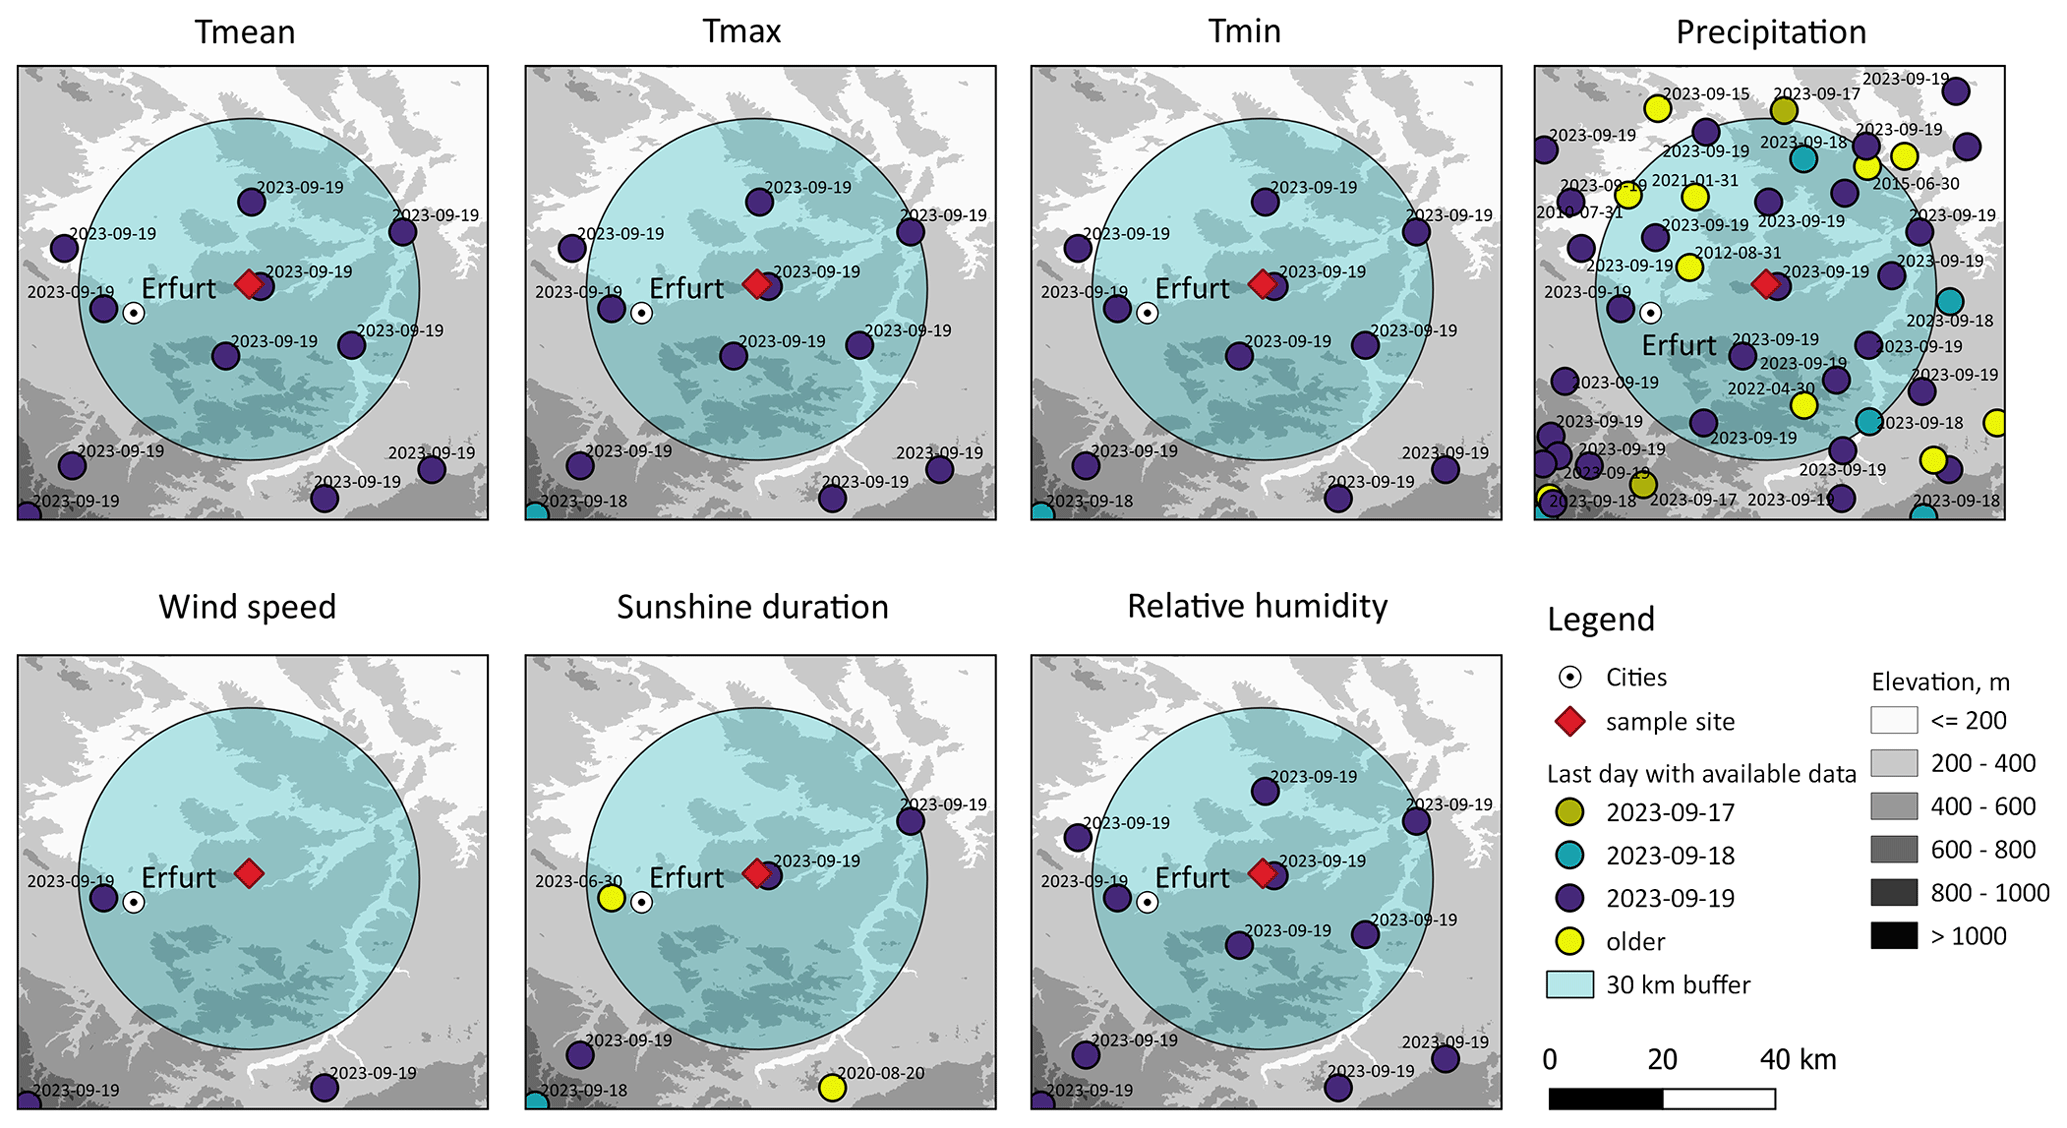
Figure 5Subset of available meteorological data for a selected National Federal Forest Inventory site (retrieved from the File Transfer Protocol server of the German Meteorological Service at 12:00 on 20 September 2023).
For each NFI site, the meteorological input data to force the model are prepared in the following way. For all the necessary variables separately, the framework scans for the nearest stations with available data within the 30 km buffer zone (Fig. 5). Filtered stations are then checked for real data availability. Stations with more than 5 % of missing data (within the simulation time period) are not considered further. Afterwards, the inverse-distance-weighted mean is applied to create one time series from filtered station data. In the case where no station was found within the default buffer zone (e.g. some wind speed and sun duration data for some of the plots) or if 1 d lag data are not presented in any of the filtered stations, the framework expands its buffer to take the next nearest station, which matches the data criteria. To avoid too much smoothing of local weather patterns in the case of too many stations being available around the point (which is especially important for precipitation), the maximum number of stations which are considered is limited to the seven nearest ones. Temperature and wind speed data are thereafter used directly as model input. Sunshine duration is converted to global radiation using the site latitude and day of year according to the Angstrom equation (Angstrom, 1924). The vapour pressure deficit is calculated from relative humidity and mean air temperature using the Magnus equation (Alduchov and Eskridge, 1996). Precipitation values are corrected for the systematic measurement error (i.e. drifting, wetting, and evaporation) using mean air temperature, day of year, and “well-protected” station-shielding type using the Richter equation (Richter, 1995). Finally, the framework checks whether any missing values appear in the prepared time series. So far, we have not experienced such a case, since typically the procedure mentioned above should preserve all possible missing value appearances. Nevertheless, if missing values are still found in the prepared data (i.e. they can happen for wind or sunshine duration data, as the station network is sparse or there is an update failure by certain DWD stations), they are filled with monthly-mean values.
LWF-BROOK90 uses precipitation input on a daily scale as the default and disaggregates the data into hourly resolution internally using the pdur parameter (average duration of the daily precipitation event in hours for each month, 4 h for each by default). Therefore, to improve correct separation between canopy interception, overland flow, and infiltration, it was decided to estimate this parameter more accurately based on real data from meteorological stations in the area. For that, three meteorological stations located in all three study area states with hourly precipitation time series (1995–2022) were picked: Erfurt-Weimar (ID no. 1270), Magdeburg (ID no. 3126), and Dresden-Klotzsche (ID no. 1048). The resulting monthly duration values averaged over the three stations were found to be 3 h in all months, except for November (4 h).
2.3.3 Operational mode and website
The first pilot version of Soil Moisture Traffic Light was released in 2022 (Kronenberg et al., 2022). The setup was successfully validated using soil moisture measurements from eight grassland sites and three forest sites for the 2006–2019 time period (Luong et al., 2023). The novel framework, initially developed and tested for Saxony, was upgraded in its architecture and improved by handling of the meteorological input and model parameterization, and it has been expanded spatially in this paper.
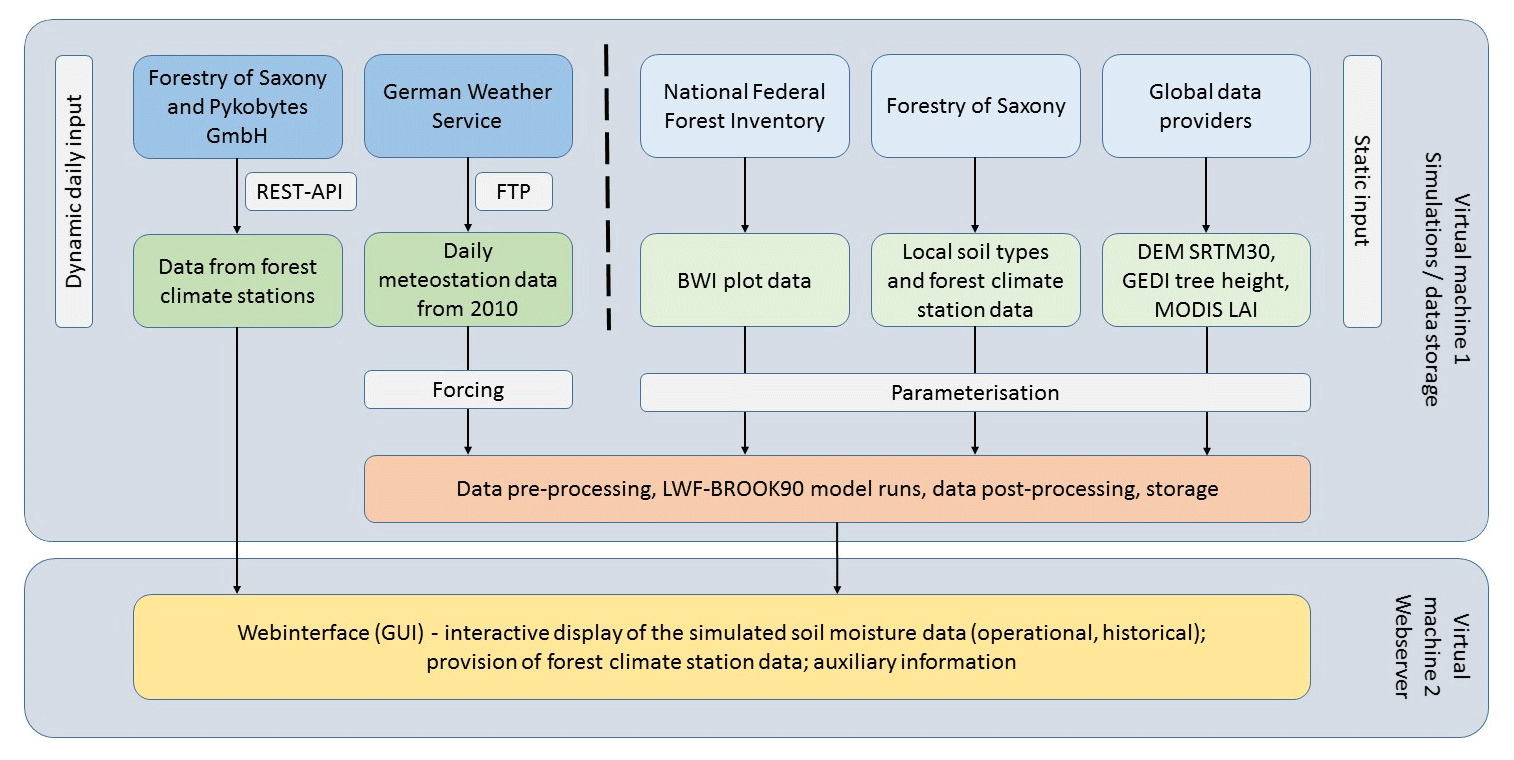
The presented upgraded framework for the three German regions functions in an operational automatic mode with a 24 h update time (Fig. 6). It starts each day at 11:00 with the download and pre-processing of 1 d lag meteorological data, which last about 3 min. Afterwards, the simulations for each NFI site (with four dominant tree types and grassland, resulting in 3206 plots ⋅ 5 vegetation type model runs) and forest climate stations (with grassland for 21 stations) are run for a 10-year period using parallel processing, which takes approximately 40 min with 48 cores and could be potentially reduced by applying more cores. Despite the fact that the tree species composition at each NFI site is known, in some of the cases it is rather a mixed forest with no clear predominant tree type. Moreover, forest managers requested that the results should be presented for each of the selected tree species in each plot. For the local soil types, the results were assigned from the neighbouring NFI plots based on the dominant forest and soil types. Raw model runs are post-processed and stored in csv and geojson files that can be downloaded from the website. Additionally, the model was run for a longer rime period (January 1990–April 2024). Results were used for the framework validation, analysis of the water balance components, and determination of the soil water content quantiles.
Soil moisture conditions are represented with the plant-available water (PAW) coefficient (Eq. 3), which is calculated for each presented soil layer and which indicates the amount of water left in the soil that is accessible to the plant before it starts to wilt:
where ΘΨ, Θwp, and Θfc are volumetric soil moisture contents for current, wilting point, and field capacity matrix potentials respectively. Here, the soil moisture at the wilting point and the field capacity is derived from Eq. (1) using pressure heads of −1585 and −6.3 kPa respectively (Schmidt-Walter et al., 2019; Wessolek et al., 2009). Values of PAW greater than 1 indicate oversaturation (soil moisture is higher than field capacity), and values lower than 0 represent the situation when the soil water content is below the plant-extractable threshold (i.e. water remains only in the smallest pores and as films or is chemically bonded to soil particles).
The final product of the Soil Moisture Traffic Light can be accessed online at https://life.hydro.tu-dresden.de/BoFeAm/dist_bfa_kk/index.html (last access: 5 August 2024). It was developed using the Node Package Manager in conjunction with the Javascript runtime environment Node.js using the OpenLayers and ApexCharts Java libraries. These enable the web display of geodata and various data visualizations. As the main stakeholders are German authorities, the website's main version is in German. However, to make the product more attractive and usable for the international community, an English version is available as well. The framework uses two virtual machines provided and managed by the Center for Information Services and High-performance Computing (ZIH) of the TU Dresden.
2.4 Framework validation scheme
One of the most important parts in the validation is the selection of an appropriate NFI site from the framework for each measurement station, since the system is not designed to simulate these exact locations including all local specifics (topography, soil properties, and vegetation). At first, all the available information on the tree composition from each station (whose amount and quality are variable for different sites) was summarized and upscaled to a dominant species (i.e. all variations of beech trees were reduced to the “beech” type), resulting in the same number of vegetation classes as for the simulated NFI sites. Then, the local soil form for each station was derived from the available map (see Sect. 2.2.3), since the original station metadata do not include this information. Afterwards, for each station the nearest corresponding NFI site was selected based on the match of local soil form and soil type in the 10 km radius (Fig. 7, left side). For the majority of the stations, the respective NFI sites were found within a 1–2 km radius.
Further, for each soil moisture sensor, the corresponding layers from the associated NFI soil profile were selected. Various possible combinations were constructed to account for possible uncertainties due to sensor positioning relative to the available soil layers and vertical footprint of the measurements (Fig. 7, right side). Here, for example, sensor 2 with 50 cm depth was compared to six time series from the simulated soil moisture from layers 2, 3, and 4 and their weighted mean (by layer thickness) combinations.
As a metric to compare observed and simulated soil moisture, the Pearson correlation coefficient on a daily scale was considered. Additionally, the absolute bias values and the Kling–Gupta efficiency (KGE) were evaluated. To aggregate the results from different sensors, plots, and stations for the various domains (e.g. the same sensor depths, stations, vegetation, or the whole framework), a weighted mean (by data length) was calculated due to the very heterogeneous lengths of the available time series.
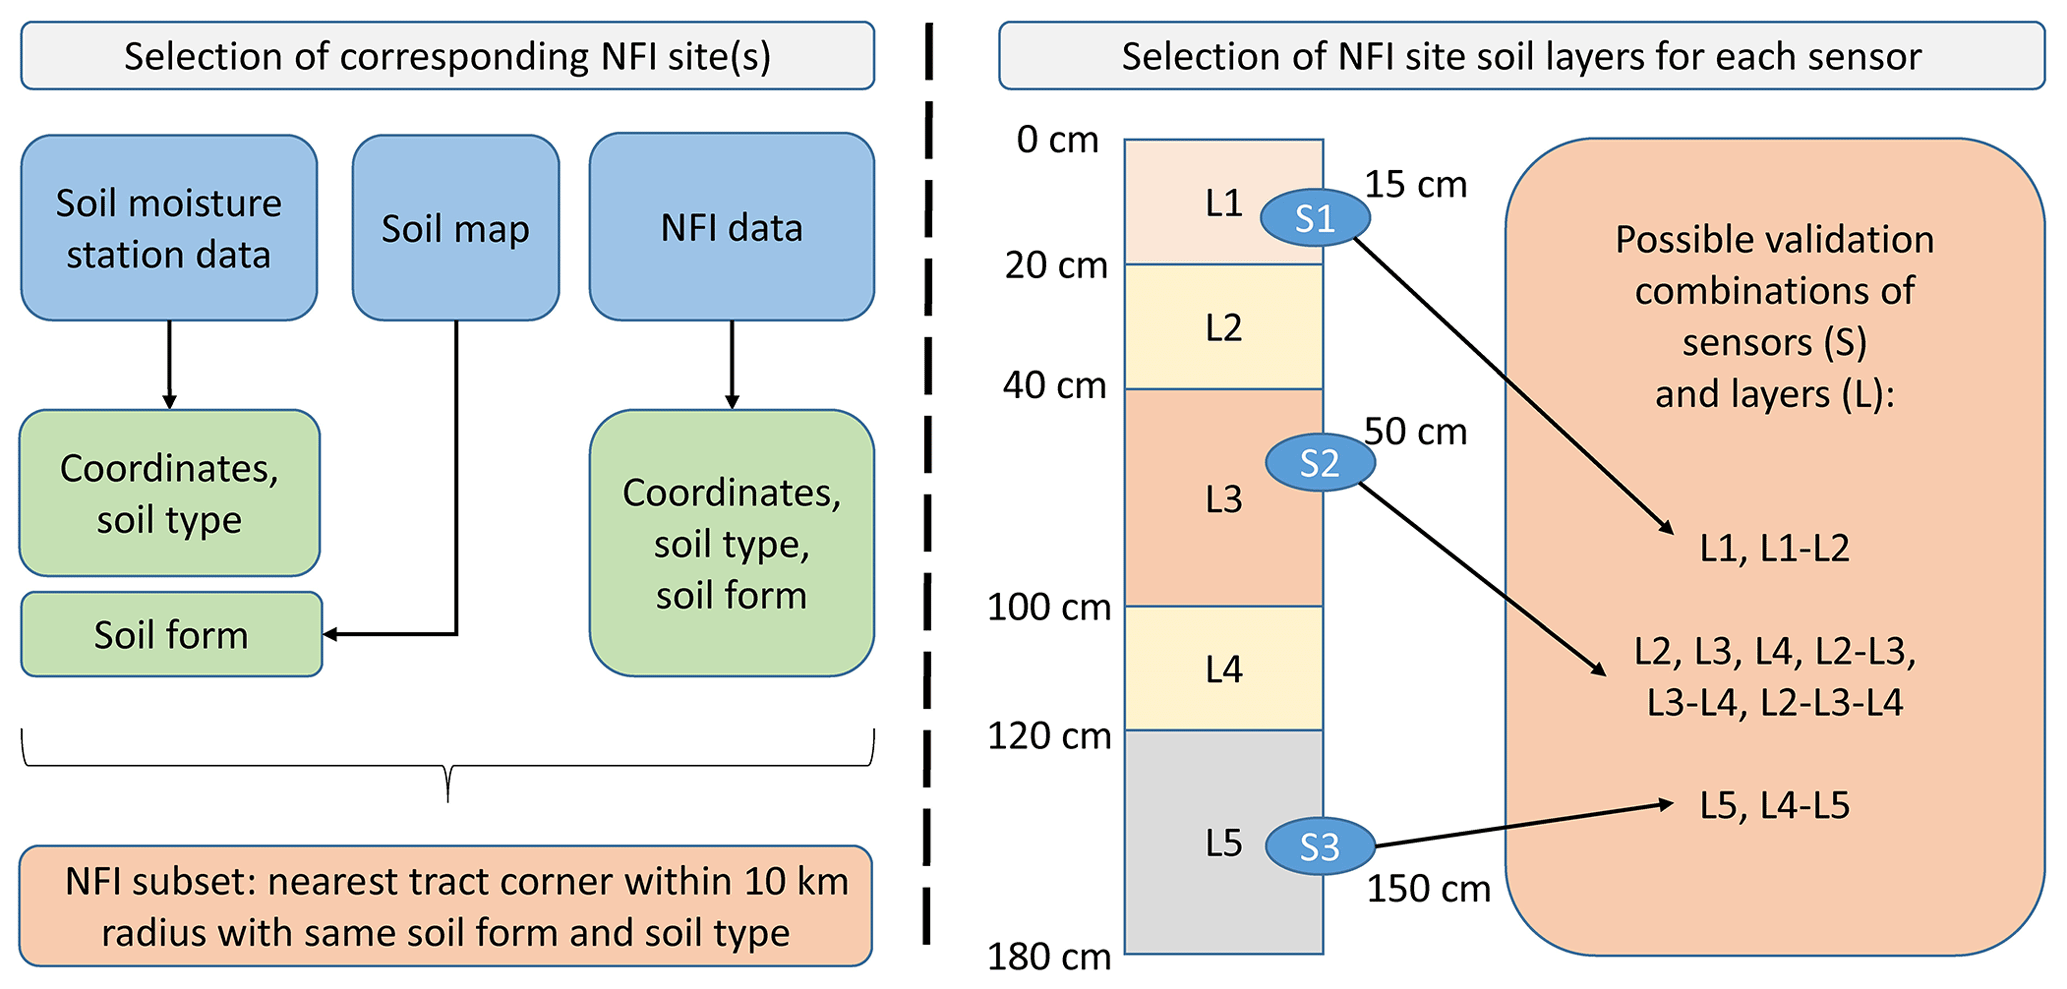
Figure 7Selection of the corresponding NFI site(s) and soil layer(s) for each soil moisture sensor.
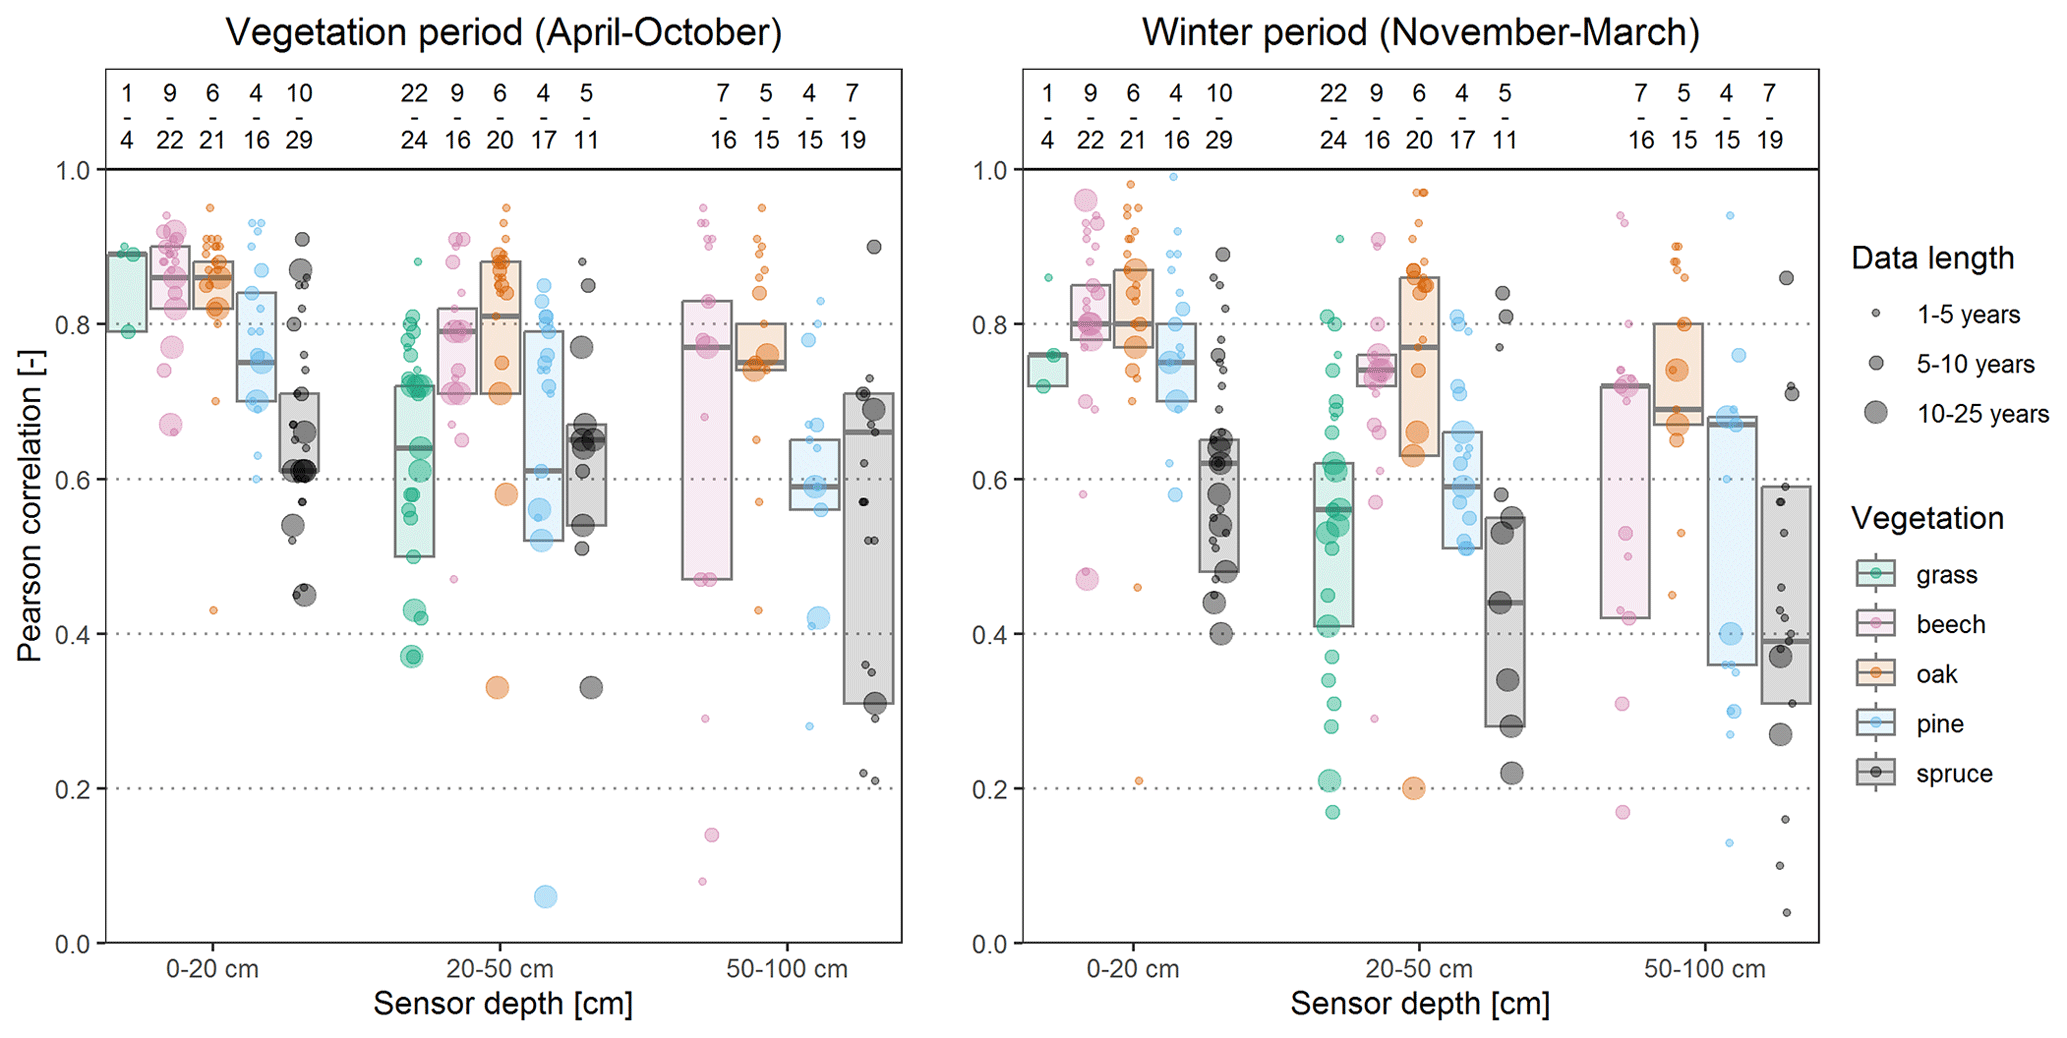
Figure 8Pearson correlation between the simulated and observed soil moisture for all the stations and sensors (daily scale). Boxplots without whiskers represent the 25 %–75 % quantile range and the median calculated from weighted values (after data length). The numbers above state the number of stations (numerator) and sensors (denominator).
3.1 Comparison of measured and simulated soil water content for the forest and grass sites
The framework performance for all 51 stations is presented in Fig. 8. The validation results for each station and sensor can be found in the Supplement (Vorobevskii, 2024). Here the results are summarized for three soil depth categories (0–20, 20–50, and 50–100 cm), two different time periods (April–October as the growing season and November–March as the winter season), five vegetation classes, and three classes of the available data length (1–5 years, 5–10 years, and 10–25 years). The validation showed a discernible seasonal variation in the correlation coefficients, with higher values observed during the vegetation period (median 0.76) and lower values observed during the winter period (median 0.71). The reduced correlations during the winter months can be attributed to increased uncertainties in both the simulations and observations, especially for frozen soils and snow cover as the quality of the sensors might be compromised, as well as to the lack of soil frost accounting in the model. Further, the performance of the framework has significant variations among the presented vegetation types. It was found to be better for deciduous forests (medians of 0.81 and 0.86 for beech and oak respectively) than for coniferous forests (medians of 0.74 and 0.64 for pine and spruce respectively). The results suggest a need to re-evaluate the spruce parameters, since the systematically worse performance was detected for most of the spruce stations and sensor depths. The bandwidth (the space between the 25th and 75th quantiles) of the obtained correlations in general increases with the soil depth. With regards to the profile depth, validation showed a better agreement (median 0.83) of the modelled and observed soil moisture in the upper horizon (0–20 cm), while in the lower horizons (20–50 and 50–100 cm) the model performance was found to be lower (medians of 0.74 and 0.64 respectively). Results for the different plots and sensors aggregated by station have shown that the obtained median correlation coefficients vary more for the grass (0.31–0.86) and spruce (0.41–0.82) vegetation types, while the lowest variation was found for the beech stations (0.71–0.83). The best and worst performances were found for two grass stations in Saxony: 0.31 in Olbernhau and 0.86 in Graupa. The best performances for the forest stations were found for beech and oak stands (e.g. 0.83 in the Harz and Hohes Holz).
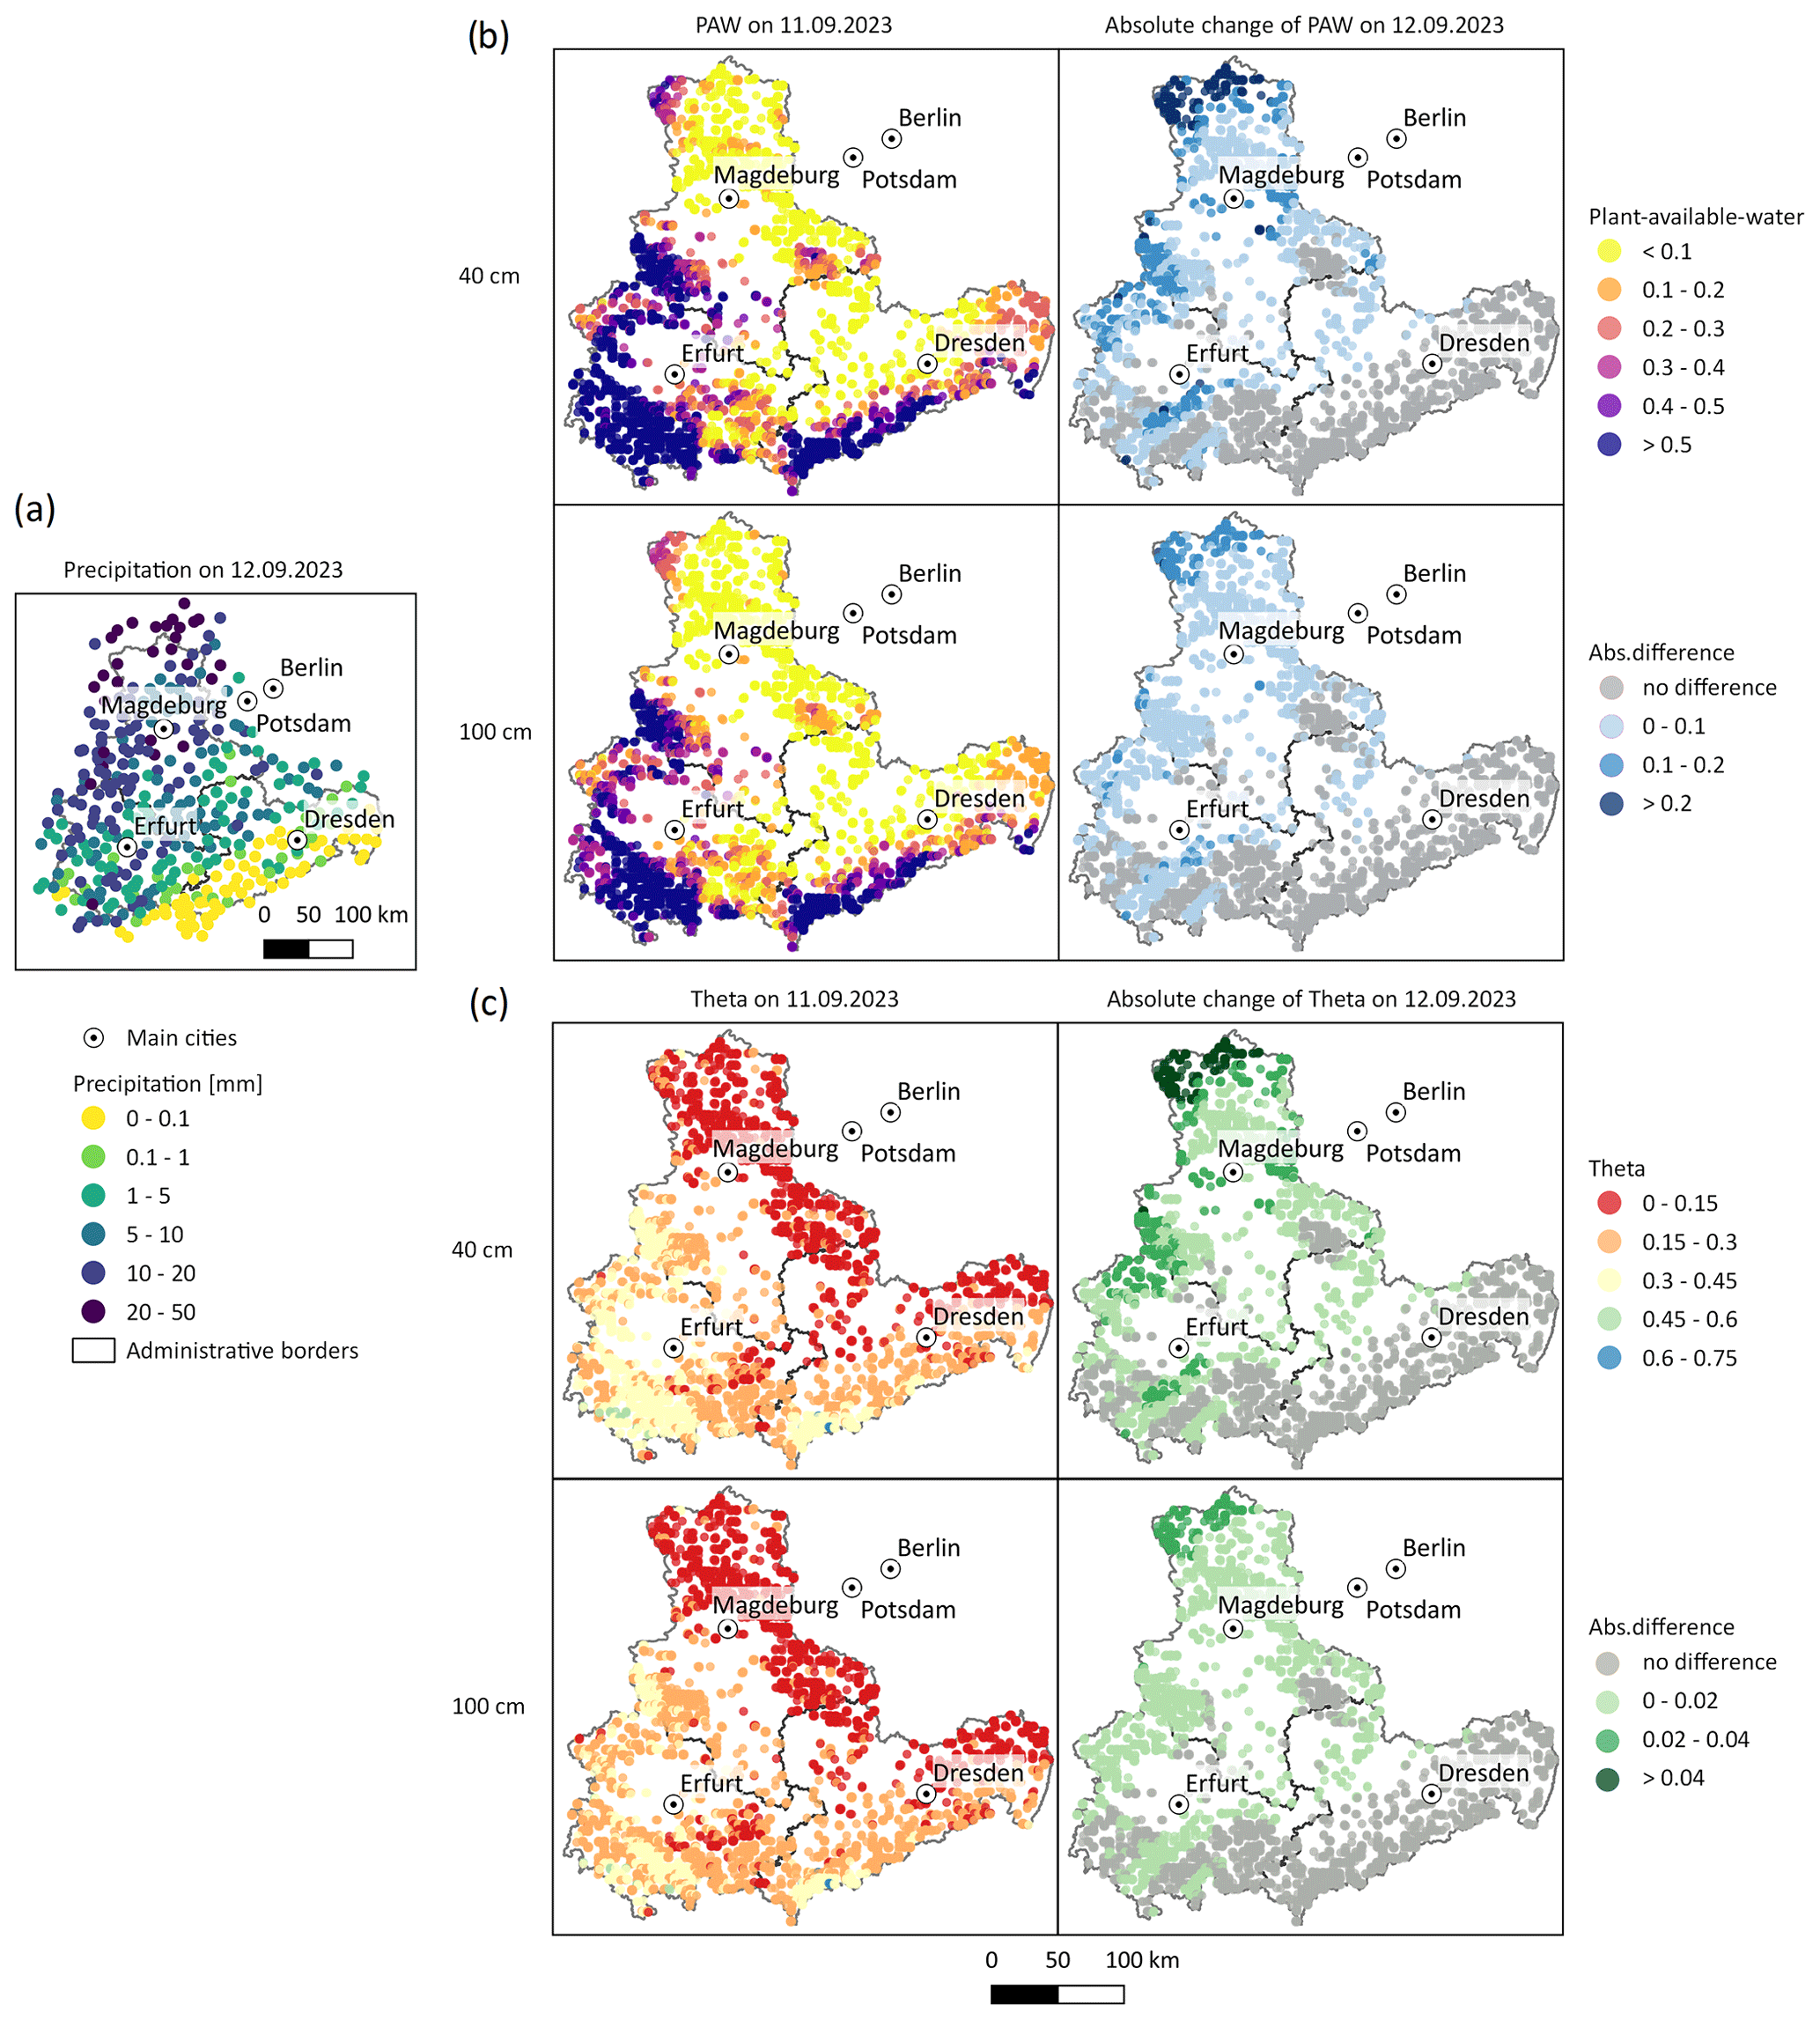
Figure 9Spatial effect of 1 d rainfall (a) after a dry week on the plant-available water (b) and the volumetric soil moisture content (c) in spruce forests for the 40 and 100 cm profile depths.
The analysis of the obtained Pearson correlation coefficients with regards to site characteristics (Appendix C – Fig. C2) did not reveal consistent trends for sensor depth, soil type, soil form, or distance to the NFI plot used for the evaluation. However, it was found that the model performance was slightly worse in the mountainous regions, where the site elevation was higher than 600 m and the annual precipitation was over 1000 mm. Furthermore, we discovered that longer data records have a positive feedback on the model fit. Finally, the framework performance was found to be noticeably better for the stations in Thuringia than for those in Saxony.
Evaluation of the KGE values (Appendix C – Fig. C1) showed that, for the majority of the stations (except for four spruce and three grass sites), the values lie above the critical value of −0.41 (Knoben et al., 2019), and thus the modelled soil moisture is better than the mean of the observed one. In general, a low KGE from soil moisture evaluation is associated with bias and variance ratio errors (up to 200 %), which were found to be systematically overestimated in the topsoil and underestimated in the lowest horizons. Here, the highest KGE values for the forests were found for the topsoil horizon under the pine stand (0.56), while the lowest values were shown by the spruce stand for the 50–100 cm depth (−0.57).
Overall, the obtained validation results are fairly consistent with the previous studies of Boeing et al. (2022) and Xia et al. (2014), who extensively validated soil moisture simulations from different hydrological models used for drought monitoring in Germany and the USA. However, it should be noted that, in comparison to the other studies, we evaluated raw time series that did not undergo any post-processing (e.g. ranked, deseasonalized, or anomaly-corrected). These transformations, which are typically advised for the validation of grid-based soil moisture simulations with point measurements (Crow et al., 2012), were intentionally not applied in the study in order to assess and demonstrate the extent of the ability of a point-based framework to explain the original and non-modified variability of soil moisture.
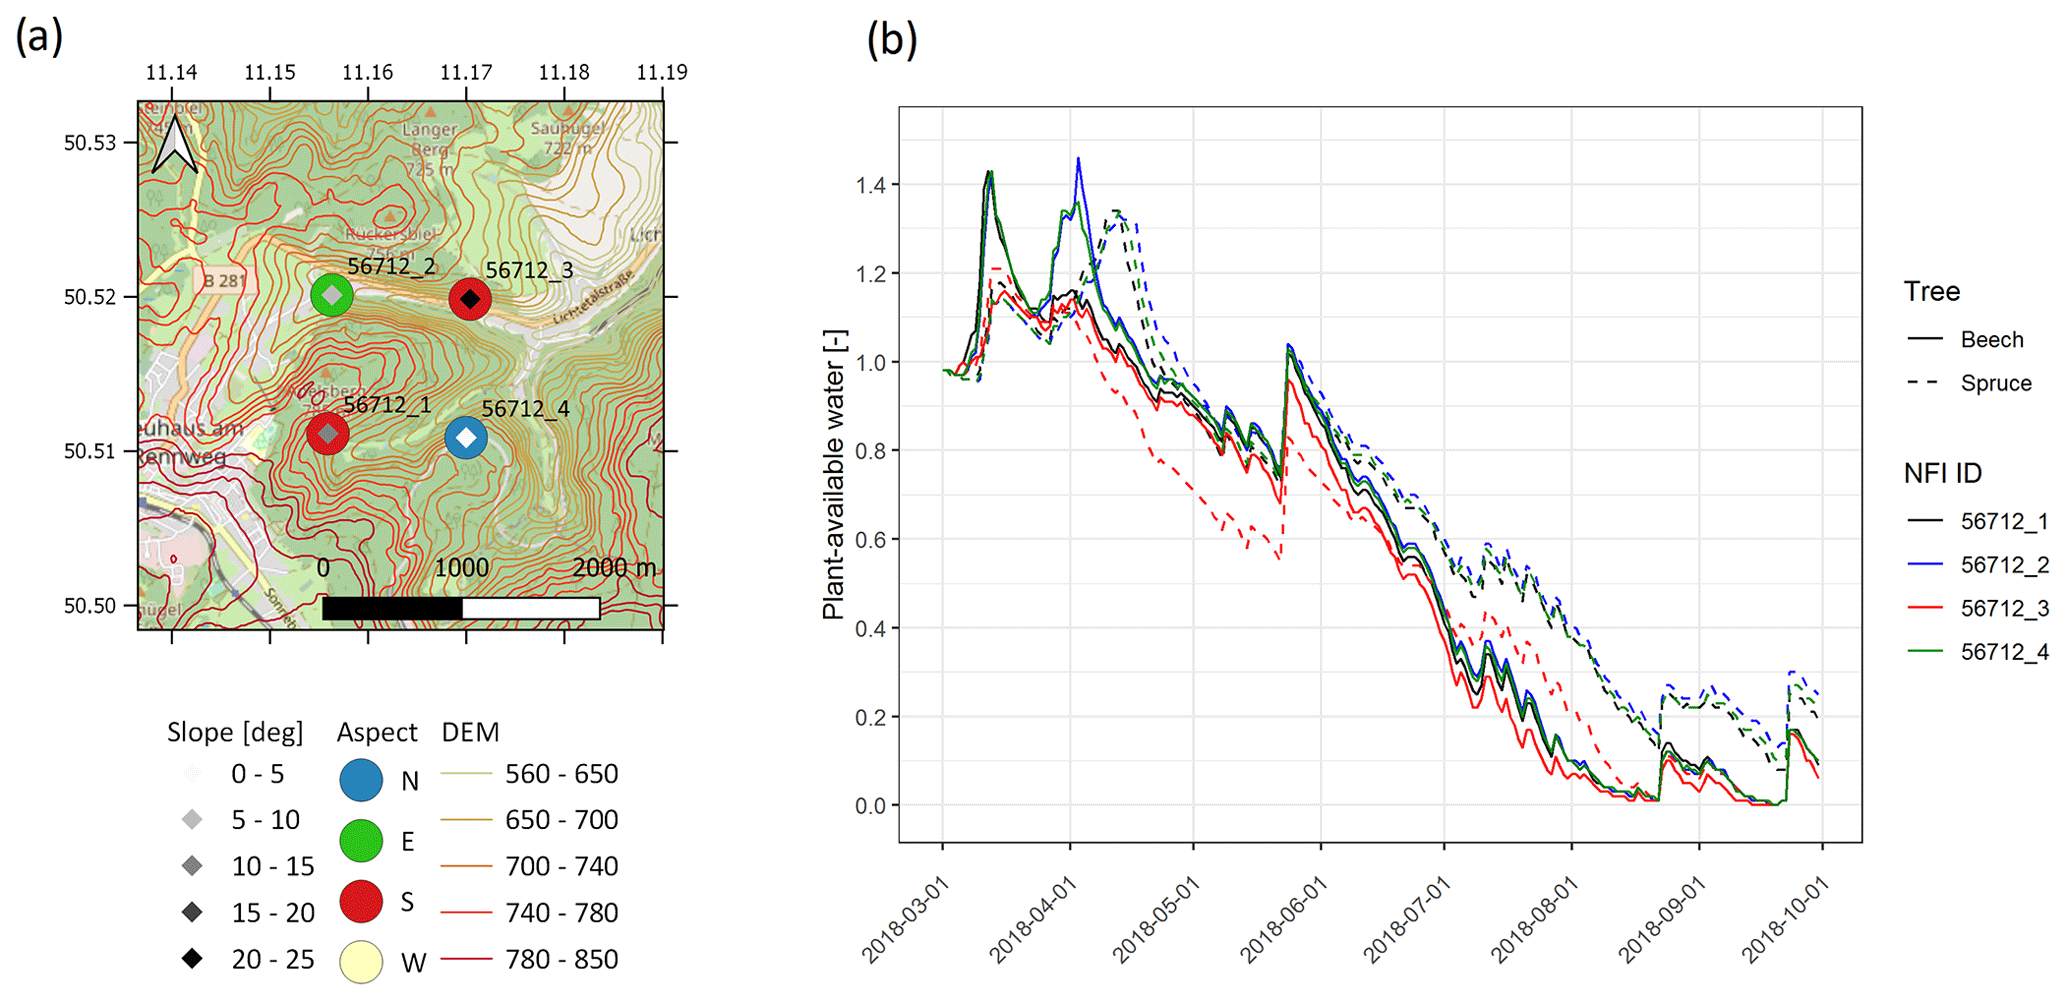
Figure 10Effect of the slope and aspect (a) of the NFI plot (no. 56712, near Apelsberg, Thuringia) on the simulated plant-available water values (up to 100 cm depth) in spruce and beech forests for the drought propagation phase in 2018 (b).
3.2 Effect of the local scale on the soil moisture under drought conditions
To illustrate the advantages of the point-based framework, two examples were chosen. Local-scale effects of the precipitation front which occurred after a dry week (no recorded precipitation for almost all the meteorological stations) over the study region on the soil moisture are shown in Fig. 9. It can be seen (Fig. 9a) that the daily precipitation sums on the autumn day of 12 November 2023 decrease from 20–30 mm in the north-west (some stations recorded up to 48 mm) to 0.1–1 mm in the south-east (about 60 stations mostly located in the Ore Mountains did not record any precipitation on that day). The soil moisture situation in spruce forests for the major parts of the region before the rain event can be expressed as a drought condition, as the precipitation sums for August and the beginning of September were below the climate means, while the potential evaporation was still high. PAW values (Fig. 9b) in the lowlands were mostly below 0.1, while in the mountainous regions enough plant-available water (PAW > 0.6) was simulated, which correlates well with the topography and soil texture distribution. This soil moisture situation is also confirmed by the absolute values of the volumetric water content (Fig. 9c). Thus, low PAW values correspond to 4 %–15 % of the water content, while normal and wet conditions (PAW > 0.4) showed a general volumetric soil moisture content of between 15 % and 30 %. As expected, under the conditions of severely depleted water storage in the soils in the lowlands, even a considerable amount of precipitation did not result in a significant improvement of the drought conditions for the plants or soil water storage recharge. The NFI sites located near the meteorological stations, which registered more than 10 mm, showed an average 0.1–0.15 PAW (or 4 %–6 % volumetric moisture) increase, while for the rest the change was on average less than 0.05. Overall, all the local changes for 12 November 2023 followed the precipitation patterns. By comparison of the two selected depths, it could be concluded that the upper soil layers (up to 40 cm) showed a more distinct reaction to the rain event. The lower horizons (up to 100 cm), which on 11 November 2023 had a lower mean soil moisture content (especially for sites with PAW > 0.3), were almost not affected by the event. Here, the volumetric soil moisture increased on average by only 1 %–2 %, even in the north-western parts. This could be explained by the fact that, under general drought conditions, infiltration of even substantial rainfall amounts into deeper horizons was prevented in the topsoil by root uptake and thereafter transpiration processes.
The effect of the local-scale topography on the depletion of the soil moisture storage in the beginning of the 2018–2019 drought period is shown in Fig. 10. Here, both slope and aspect influence the net radiation and downslope flow, thus affecting the potential evaporation and the soil column outflow rate respectively. Thus, the south-oriented site (no. 56712_3) with an almost 25° slope (Fig. 10a) showed up to 20 % lower PAW values than the northern or western sites with flat slopes, especially in the drought propagation phase (Fig. 10b). Moreover, different tree species exhibited varying reactions and sensitivities to changes in soil moisture based on the topographical features. During the growing season (spring 2018), this impact was notably pronounced in deciduous forests owing to the higher available soil water resulting from reduced transpiration and interception rates. However, during the summer period, the influence of slope and aspect became more significant in spruce forests due to the elevated total evaporation rates (which are indicated by larger leaf area and stem area indexes compared to beech forests).
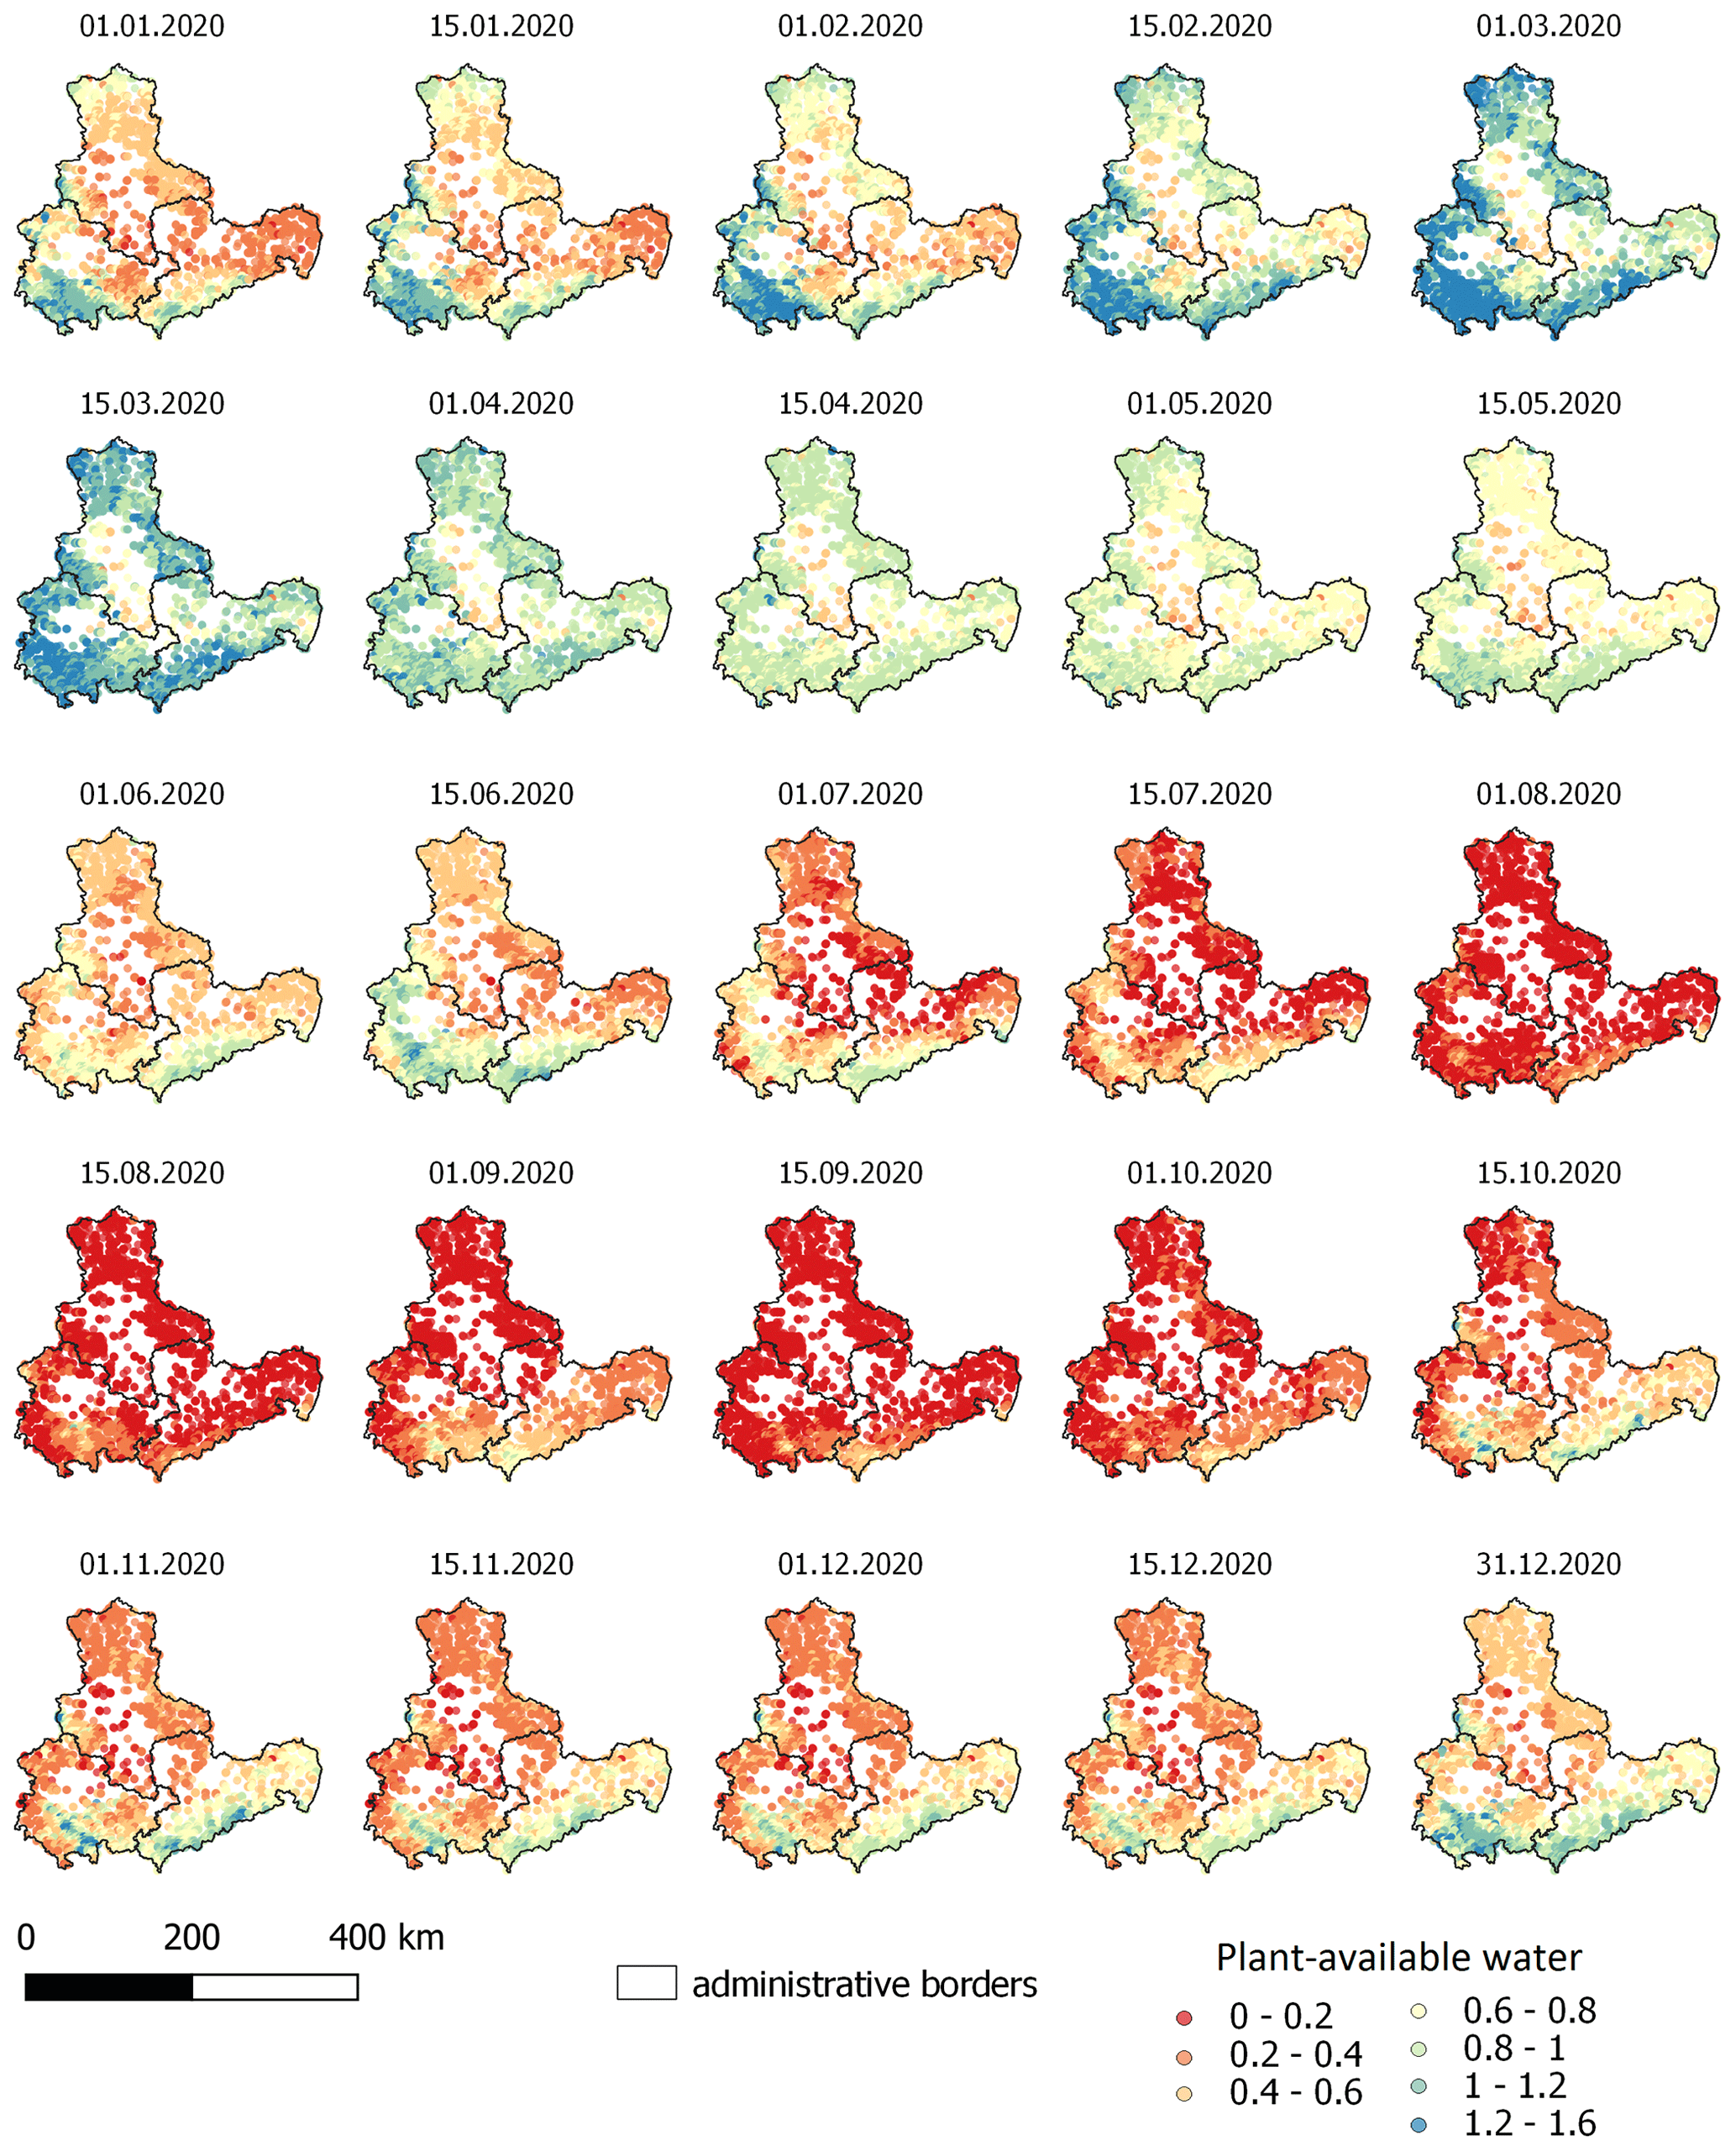
Figure 11Seasonal changes in plant-available water (up to 100 cm depth) in beech forests in 2020.
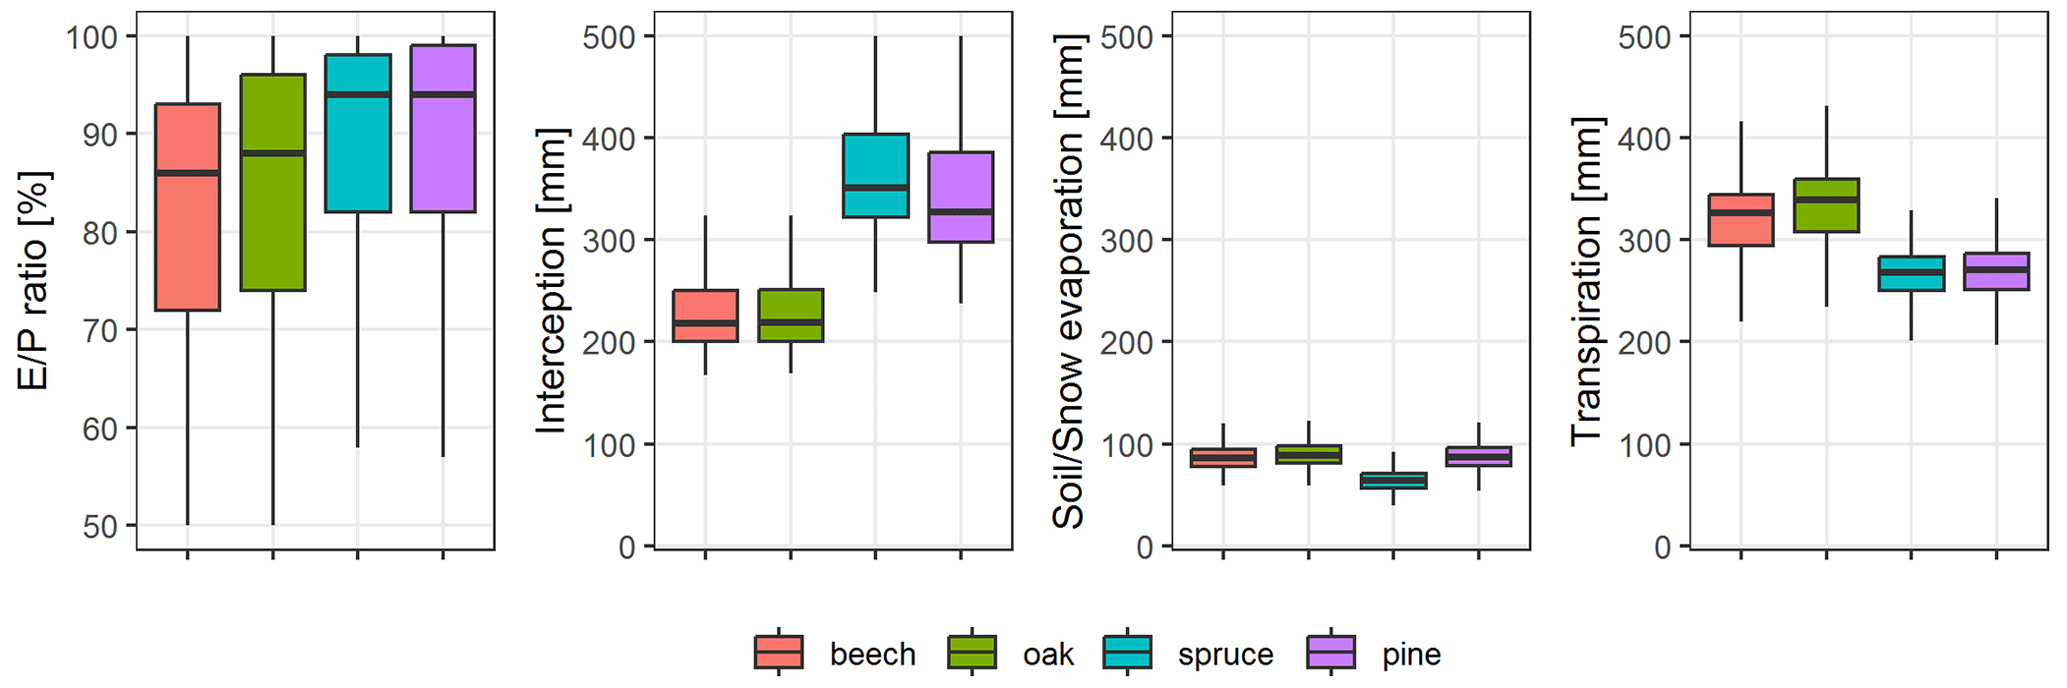
Figure 12Mean annual evaporation components in different forest types for the 1991–2020 period.
3.3 Accounting for seasonality in soil moisture changes during the vegetation period
As the study region has heterogeneous topographical, climatological, and landscape features, they all have a strong influence on the seasonal course of soil moisture. As an example, fortnightly changes in PAW up to 1 m depth under beech forests for the “normal” (climatologically, meaning not abnormally dry or wet) year of 2020 are presented (Fig. 11). In January, soil moisture in the central and northern parts is still not recovered from the dry season of 2019, especially in the eastern parts of Saxony, where the PAW values were around 0.2. Starting from February until the end of March, precipitation amounts and snowmelt combined with low evaporation rates (deciduous forest, thus mainly causing only stem interception and soil or snow evaporation) refilled the soil with moisture up to its maximum annual values. High-elevation areas in the south of Thuringia and Saxony as well as the western and northern parts of Saxony-Anhalt therefore had oversaturated soils (PAW > 1.2) for more than 1 month, while the middle part of the area still remained unsaturated (PAW < 0.6). Thereafter, in the beginning of the vegetation period (growing phase in April–May), soil moisture mostly remained in a normal, stable condition (0.6 < PAW < 1), while constantly but slowly increasing evaporation values were still compensated for by relatively high precipitation input. Starting from June and till the end of September, transpiration clearly dominated among the evaporation processes and, coupled with the typically lower rainfall sums, let the soil water storage quickly deplete and remain in an almost empty state (PAW < 0.2). Thus, in this time period, almost all the precipitation input was immediately consumed by the forest and did not contribute to the refilling of the soil profile. The situation started to straighten out in the middle of October with the leaffall and thus a reduction in the total evaporation, so that the fallen rainfall was finally able to recharge the depleted soil water storage. Due to the typically higher precipitation amounts in the mountainous regions, this process started and was more clearly visible exactly in the southern parts of the study area, while in the middle and northern typically flat and drier parts, the moisture refill was much slower and less effective. Thus, by the end of December, the spatial distribution of the soil moisture under the beech forests looked similar to what it had started with in January 2020.
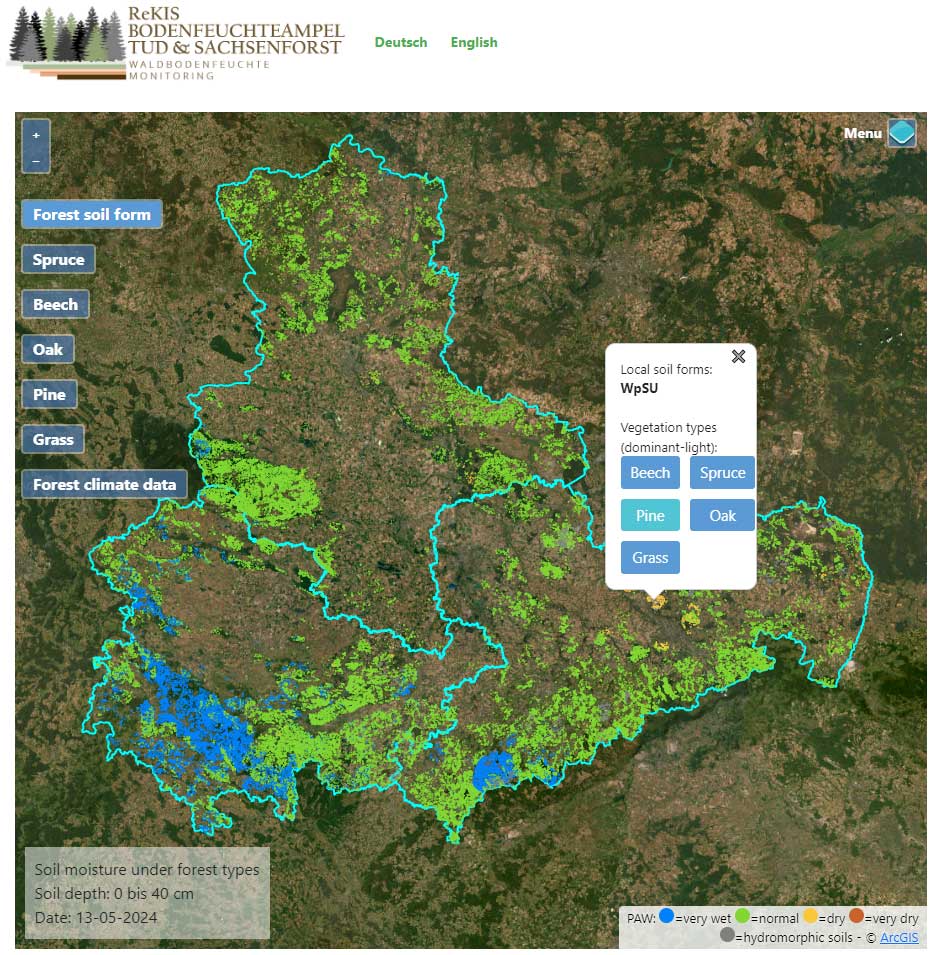
Figure 13Overview of the Soil Moisture Traffic Light main page – plant-available water for the combined forest types and soil form maps (13 May 2024, 40 cm depth).
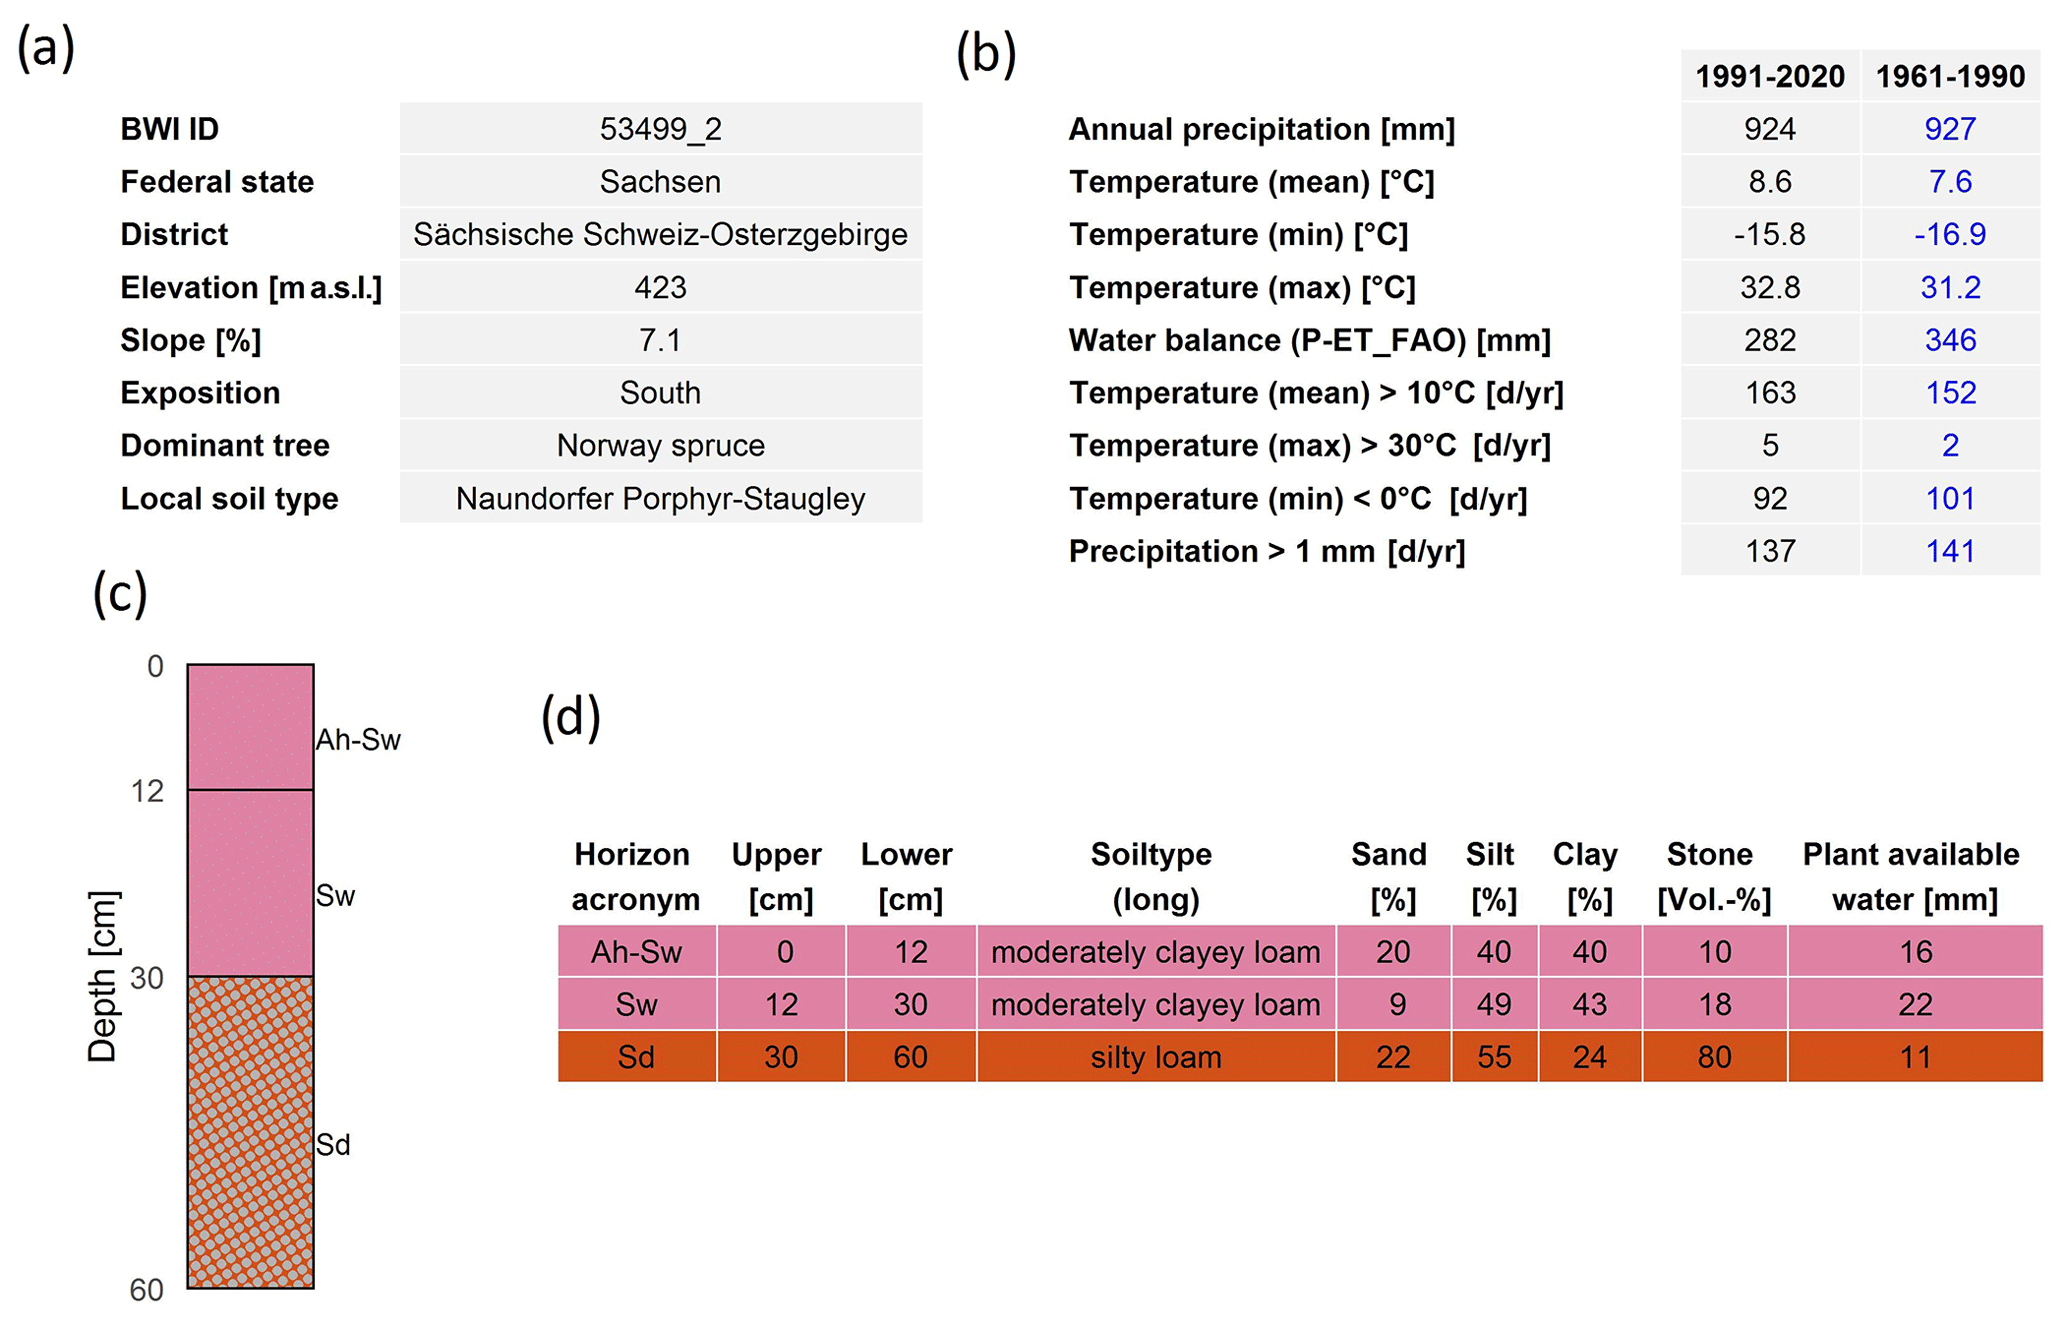
Figure 14Summary information for the selected NFI site (no. 53499_2, Tharandter Wald, Saxony): general information (a), climate data (b), soil profile (c), and soil characteristics (d).
3.4 Influence of forest composition on the evaporation and its components
Redistribution of precipitation input into evaporation and runoff components as well as their sub-components is crucial for correct representation of in situ soil moisture. Long-term simulation data (30 years, 1991–2020) for the NFI plots revealed that the evaporation–precipitation ratio (Fig. 12) in deciduous forests is lower (85 % median) than in coniferous forests (95 % median) and has a greater range (almost 50 %). The highest values were found in the central and northern dry flatland areas. Evaporation of intercepted rain and snow is a substantial part of mature forests and possesses large spatial heterogeneity. It is estimated to be higher for spruce (median 350 mm yr−1) and pine (median 330 mm yr−1) forests, while deciduous forests showed much lower interception amounts (median 220 mm yr−1). Transpiration, on the other hand, was found to be higher for oak (median 350 mm yr−1) and beech (median 320 mm yr−1) forests, while coniferous forests transpire about 270 mm yr−1. Soil evaporation is the smallest part of total evaporation (about 20 %) and remains almost stable with regards to spatial scale and vegetation cover (median 80–90 mm yr−1).
Although the bandwidth of the obtained ratios for forests does cover a very wide range (0.5–1), high median ratios (above 0.8) do not correspond well to other studies. For example, in the study of Renner et al. (2014), it was found that, according to watershed-based evaporation estimations (discharge subtracted from precipitation), the ratio for small forest-dominated catchments in Saxony typically lay in the range of 0.3–0.7 for the 1950–2009 time period. It was however mentioned that actual evaporation has tended to consistently increase in the last 2 decades. In another study by Vorobevskii et al. (2022), different BROOK90 frameworks were applied to simulate FLUXNET sites within Saxony. It was found that the ratios in forest stands based on measurements (0.50 for Tharandt, 0.41 for Oberbärenburg, and 0.65 for Hetzdorf) could not be reached with standard model parameterization without calibration, especially for coniferous forests, where the modelled ratios were found to be up to 0.8. These facts reveal the importance and sensibility of the model parameterization, especially regarding the interception component, which should be addressed more in depth in further studies.
3.5 Soil Moisture Traffic Light – informative web platform for forest managers
The website homepage (Fig. 13) shows a map with the soil moisture conditions for the forests in Thuringia, Saxony, and Saxony-Anhalt. It was derived as a combination of the four tree-specific simulations conducted for each of 3206 NFI tract corners and a high-resolution soil form map. For each respective polygon (i.e. centroid) of the soil map, where the identified dominant forest is one of the four simulated ones (spruce, pine, oak, or beech), the framework searches for the nearest NFI site (the radius is limited to 5 km), which has the same soil form and which assigns simulated PAW values accordingly. Additionally, the simulation results for each NFI site for the four tree species as well as grassland are presented separately. For easier communication of the results to non-expert stakeholders, current moisture states are divided into four colour categories: very wet (PAW > 1), normal (0.4 < PAW < 1), dry (0.2 < PAW < 0.4), and very dry (PAW < 0.2). Intuitive buttons allow the user to switch between the different vegetation types (spruce, oak, beech, pine, and grass) and the different soil profile depths (0–40, 0–80, and 0–100 cm). There is also an option to customize the background maps with Google Maps or OpenStreetMap. On the right side, the user will find supporting information on what each colour means in terms of vegetation feedback.
The expert mode offers deeper insights into the soil moisture condition of each NFI plot. By clicking on a specific point on a map (or menu bar), the user gets detailed information (Fig. 14) on the selected plot (name and ID, soil profile data, forest type, and climate overview). Furthermore, on the right side, two interactive graph panels appear. The upper panel (Fig. 15a) shows a temporal PAW course up to a depth of 40 cm for the current year with different quantiles and median values as a background, calculated from 30-year historical simulations. The lower panel (Fig. 15b) gives an overview of the annual PAW developments for different soil depths up to 100 cm. In addition, the expert mode provides the possibility of downloading raw data from each of the shown panels. Further, the simulations and observations from the forest climate stations are available (currently only for Saxony). Besides presentation of the up-to-date main climate elements, the soil moisture measurements (under grass) could be used as an indirect validation of the framework. Further, the website has an FAQ section and a glossary which explain the main methods and terms behind the framework. Finally, a citizen-science approach was implemented using the “Feedback-survey” button on the starting page to continuously optimize the application.
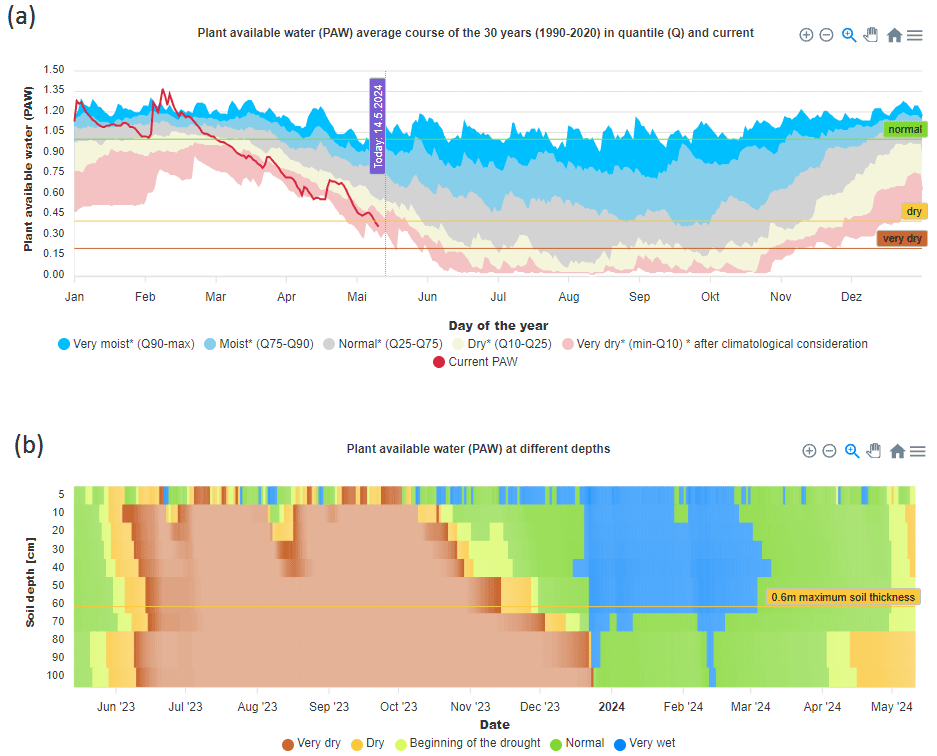
Figure 15Overview of the expert mode of the Soil Moisture Traffic Light for a selected NFI site (no. 53499_2, Tharandter Wald, Saxony) and spruce forest: topsoil (<40 cm) plant-available water for the current year in comparison to quantiles derived from the 30-year historical period (a); plant-available water for all soil profile layers for the current year (b).
4.1 On the benefits and shortcomings of the developed framework and its placement among other existing systems
Soil moisture monitoring frameworks typically utilize a grid- or point-based data presentation mode. The choice of one method over another relies on the system setup: model, input datasets, and user orientation and requirements.
The main difference between grid-based and point simulations is in accounting for local conditions. Raster-based setups are capable of covering the whole domain of interest without spatial gaps. However, due to high computational costs, the local scale (<500 m) has not been reached so far (Vorobevskii et al., 2022). Thus, point-based setups could still be superior when it comes to the local scale, since here differences in geographical conditions could be taken into account more easily. During the development phase of the presented framework, we were in direct contact with forest managers. Their feedback showed us that the actual data availability at the point (particularly detailed soil information and its near-real-time as well as retrospective hydrological behaviour) is much more useful than the generalized grid-based information, claiming everything else to often be redundant. Foresters stated that the existing systems were too coarse in resolution, which was the main intention of the development of this point-based modelling system with point-based soil information data from the National Federal Forest Inventory and the high-resolution local soil map (1:10 000) rather than generalized soil maps of coarser resolution (1:1 000 000). Raster-based simulation at these fine resolutions will require a grid of approximately 10 m, which is implausible for the implementation due to the computational power requirement and the technical problems of the results' representation (in an interactive and not just raster-based way). From a soil hydrology perspective, it is always advantageous to map the high spatio-temporal heterogeneity of soil moisture, which is largely controlled by the local variability of physical soil properties, topography, and vegetation (Kemppinen et al., 2023; Kirchen et al., 2017; Seltmann et al., 2021). Further, point modelling has the advantage that we can update point information (input parameters) and/or add new points (soil profiles) easily and at any time without having to dismantle the entire model concept. This approach therefore offers an open-space room for continuous improvement. Point display might have practical advantages as well, since additional information from the site (soil profile and soil properties, climate summary, topography information) fits into the display, not forgetting the helpful background (e.g. satellite images, topographic and soil maps). On the other hand, grid-based simulations are easy for post-processing in comparison to other similar system outputs as well as for visualization and integration into web tools. In comparison to fully distributed modelling, the utilized 1D LWF-BROOK90 model cannot adequately represent lateral flows (especially inflow) on the sloped terrain and does not account for groundwater flow (only bucket-type retention storage, which does not contribute in any way to soil moisture). This could be a critical point for correct soil moisture estimation in places with high slopes and elevated groundwater levels. However, according to data from the foresters, approximately 75 % of forest floors (at least in Saxony) are characterized by predominant vertical top-down seepage water movement and are not affected by seasonal or permanent groundwater table variations. The few NFI plots with an identified potential groundwater influence (by the appearance of specific soil horizons in the profile) are marked with grey in the website layout. Further, for correct representation of the lateral inflows and outflows (which are an undeniable advantage of grid-based models), a good-quality terrain model is desired. In central Europe, digital elevation models (and therefore streamflow networks) are massively covered with artefacts due to the strong anthropogenic influence (bridges, forest roads, mining traces, dams, culverts, ditches) and would have to be extensively cleaned up in order to actually achieve the alleged accuracy of soil moisture modelling, which is problematic for dense vegetation like forests. Finally, accurate correction for tree height to produce a high-resolution digital terrain model is possible only with laser or drone scans due to the high heterogeneity of the forest stand. With regards to the “change-of-support” problem (Allocca et al., 2023; Gelfand et al., 2001), the presented system itself does not introduce contradictions into the scale mismatch: both the input (meteorological, soil, and land cover data) and output of the framework are point-based products. However, in comparison to grid-based modelling, this solution could thereafter imply difficulties in the correct interpretation and possible extrapolation of results, as these tasks are then on the shoulders of the end-users, who in our case are mostly experts with profound knowledge of forests and local soil specifics. Therefore, our approach was to link the data available at the plot level to the best available model parameters and modelling techniques at the same spatial scale.
At the present time, two other soil monitoring systems in Germany, which were mentioned in the Introduction section, use more or less the same meteorological input (with differences in quality-control and interpolation techniques of the data).
The German Drought Monitor uses the distributed hydrological model, which accounts for lateral flow and groundwater processes but possesses limitations with regards to evaporation representation. The original setup had a resolution of 4 km; its update in the 2022 version (Boeing et al., 2022) increased this to 0.98–1.23 × 1.7 km (variable grid). This framework includes simplified forest classes (coniferous, deciduous, and mixed) from a satellite-based land cover map and soil characteristics based on a 2 km resolution map. Furthermore, soil profile depths are discretized into two layers (0–25 cm and the remaining depth). For a soil moisture indicator, the soil moisture index (Zink et al., 2016) for the total soil column and topsoil and plant-available water are presented in the raster (daily update) and partly in GIF format (2-week temporal developments). In summary, the absence of additional site (in this case, grid) information, the non-interactive presentation of the results, and the general coarse resolution of the output product generated from medium-resolution soil maps make the practical application of this product in forestry difficult (Meusburger et al., 2022; Speich, 2019).
The Soil Moisture Viewer from the German Meteorological Service uses the LWF-BROOK90 and AMBLAV models for forests and agriculture respectively. The “forest” part of the system was added in February 2024 and is currently in test mode. The setup and parameterization of the model are similar to those presented here. However, the resolution of the utilized soil map is 10 km, and local soil forms are not taken into account. For standardization, the soil profile depth is fixed to 200 cm and the layer discretization is fixed to 10 cm. The interactive output map presents rastered plant-available water at a resolution of 1 km for different vegetation classes as well as for the combined prevailing land use. Additionally, each pixel contains information on the soil moisture developments for the past month and soil profile data from the soil map. The output resolution and the gapless, non-transparent raster-based presentation mode make navigation difficult for end-users and make it impossible to identify the respective forest borders and to get specific and detailed information for smaller forest areas.
4.2 Usefulness of the operational soil moisture observations
The incorporation of operational soil moisture measurements in an operational modelling framework is a big challenge and can lead to both beneficial and confusing outcomes. Here we are referring to station-based measurements only. Rapidly developing remote-sensing products based on satellite brightness temperatures (e.g. SMAP, Das et al., 2019) have regular updates (2–3 d) but a typical depth of up to 5 cm on the clear ground, and they probably do not account for the difference in humus and mineral horizon physical properties and therefore are not useful for the forests.
The first problems are the station data themselves. Here, typical issues might include inadequate spatial representability (station distribution and sensor number, limited vegetation variability, heterogeneity of soils), data quality (raw data post-processing for systematic and random errors, changes in measurement setups), and data access (negotiation of the data accessibility with the authorities, stability and time lag of the updates). A second difficulty arises from merging simulated and observed data and thereafter interpreting the results. Due to the very high heterogeneity of soils in both the horizontal and vertical dimensions and its influence on the soil moisture, direct one-to-one comparison of the time series is impossible unless one parameterizes and models the exact same soil profile, which was excavated before the soil sensors were installed. Moreover, the depth of a certain sensor placement typically does not correspond well to the simulated soil profile layering: in the best case, it appears in the middle of one relatively thin horizon. Meanwhile, the actual footprint (vertical bandwidth) of the measured moisture for this sensor could be wider. Yet another important impact factor here is vegetation. Even advanced water balance models typically do not account for the exact positioning of the plant and spatial heterogeneity of the foliage, branches, and root distribution. In reality, though, sensors with the same depth but installed from e.g. both sides of a tree will often show different moisture values.
Mismatches (or perfect matches) of simulations and measurements from the operative framework should be treated with caution. Conclusions from a non-expert point of view could be especially misleading. Therefore, the comparison and interpretation of the differences should be associated with expert knowledge and should consider the factors mentioned above, despite every operational system being able to profit from coupling its simulations with observations. This brings the option of validating the framework on the fly directly and at the same time detecting potential measurement errors from the soil moisture sensors. Furthermore, in the long term, this helps to adjust and improve the model parameterization.
The article highlights the need for high-resolution operational soil moisture monitoring in the forests of central Germany. Existing soil moisture monitoring products possess various practice-oriented limitations, including spatial coverage and resolution issues. The presented operational point-based framework addresses major shortcomings of the existing systems by taking into account local information, including meteorological (station) and geographical (i.e. aspect, slope, forest type, and specific soil profile data) point data. This system allows forest managers to take targeted, local-scale measures for sustainable forest management.
The framework's technical details and its architecture are described in detail, including all its core elements, e.g. the LWF-BROOK90 water balance model, the meteorological data and their processing techniques, and the land cover and soil parameterization based on the National Federal Forest Inventory datasets. The framework was successfully validated using soil moisture observations from 51 stations, which resulted in a summarized median Pearson correlation of 0.74. The performance was found to be highly variable, depending on the vegetation cover and soil depth. The operational mode and the website as the end-product through which the results are presented to end-users are outlined. We highlighted the effect of the local scale on understanding soil moisture dynamics, illustrating the impacts of a single precipitation event and local geographical conditions on soil moisture conditions. Further, the seasonal dynamics of soil water storage in different regions were demonstrated. Additionally, we showed the influence of different tree species on the redistribution of the main water balance components. The Results section was concluded with the introduction and showcasing of the Soil Moisture Traffic Light web information platform, which represents a significant advance in the dissemination of information about soil moisture for the three German regions to forest managers and stakeholders, providing an intuitive and informative tool for more effective monitoring and management of forest ecosystems. The limitations and advantages of the presented framework were discussed from an end-user perspective and compared to other existing systems. Finally, a critical outlook was given on an integration of operational soil moisture measurements into the framework.
Since the pilot release in 2022, we have continued to develop the Soil Moisture Traffic Light, and the framework frequently receives new upgrades. In the future, these updates could include the following features.
-
The model parameterization itself could be improved, especially the representation of the LAI as one of the most sensitive model parameters. Incorporation of dynamic annual values using the Coupmodel (Jansson and Karlberg, 2004) method (built into the LWF-BROOK90 R package) based on MODIS satellite data will improve the evaporation estimations.
-
The operational mode of the framework could be expanded to a seasonal forecast timescale by getting access to the German Meteorological Service's long-term meteorological forecast data.
-
Other tree species could be included, based on the availability of appropriate parameterization sets. The framework in general could be set up for other vegetation types. This could be of especially great interest in the case of simulations for various crops and thus advancement of agricultural management.
-
Extension of the framework to the whole of Germany is possible, as the NFI database and climate data are available. For that, the computational costs will be higher and need to be advanced.
-
As a 1D model, LWF-BROOK90 is not suited to simulating stagnant and groundwater-influenced sites in a satisfactory manner. Therefore, other models (e.g. the SWAP model, Kroes et al., 2017) or model couplings are needed in these cases.
Table A1Summary table of the soil moisture measurement stations.
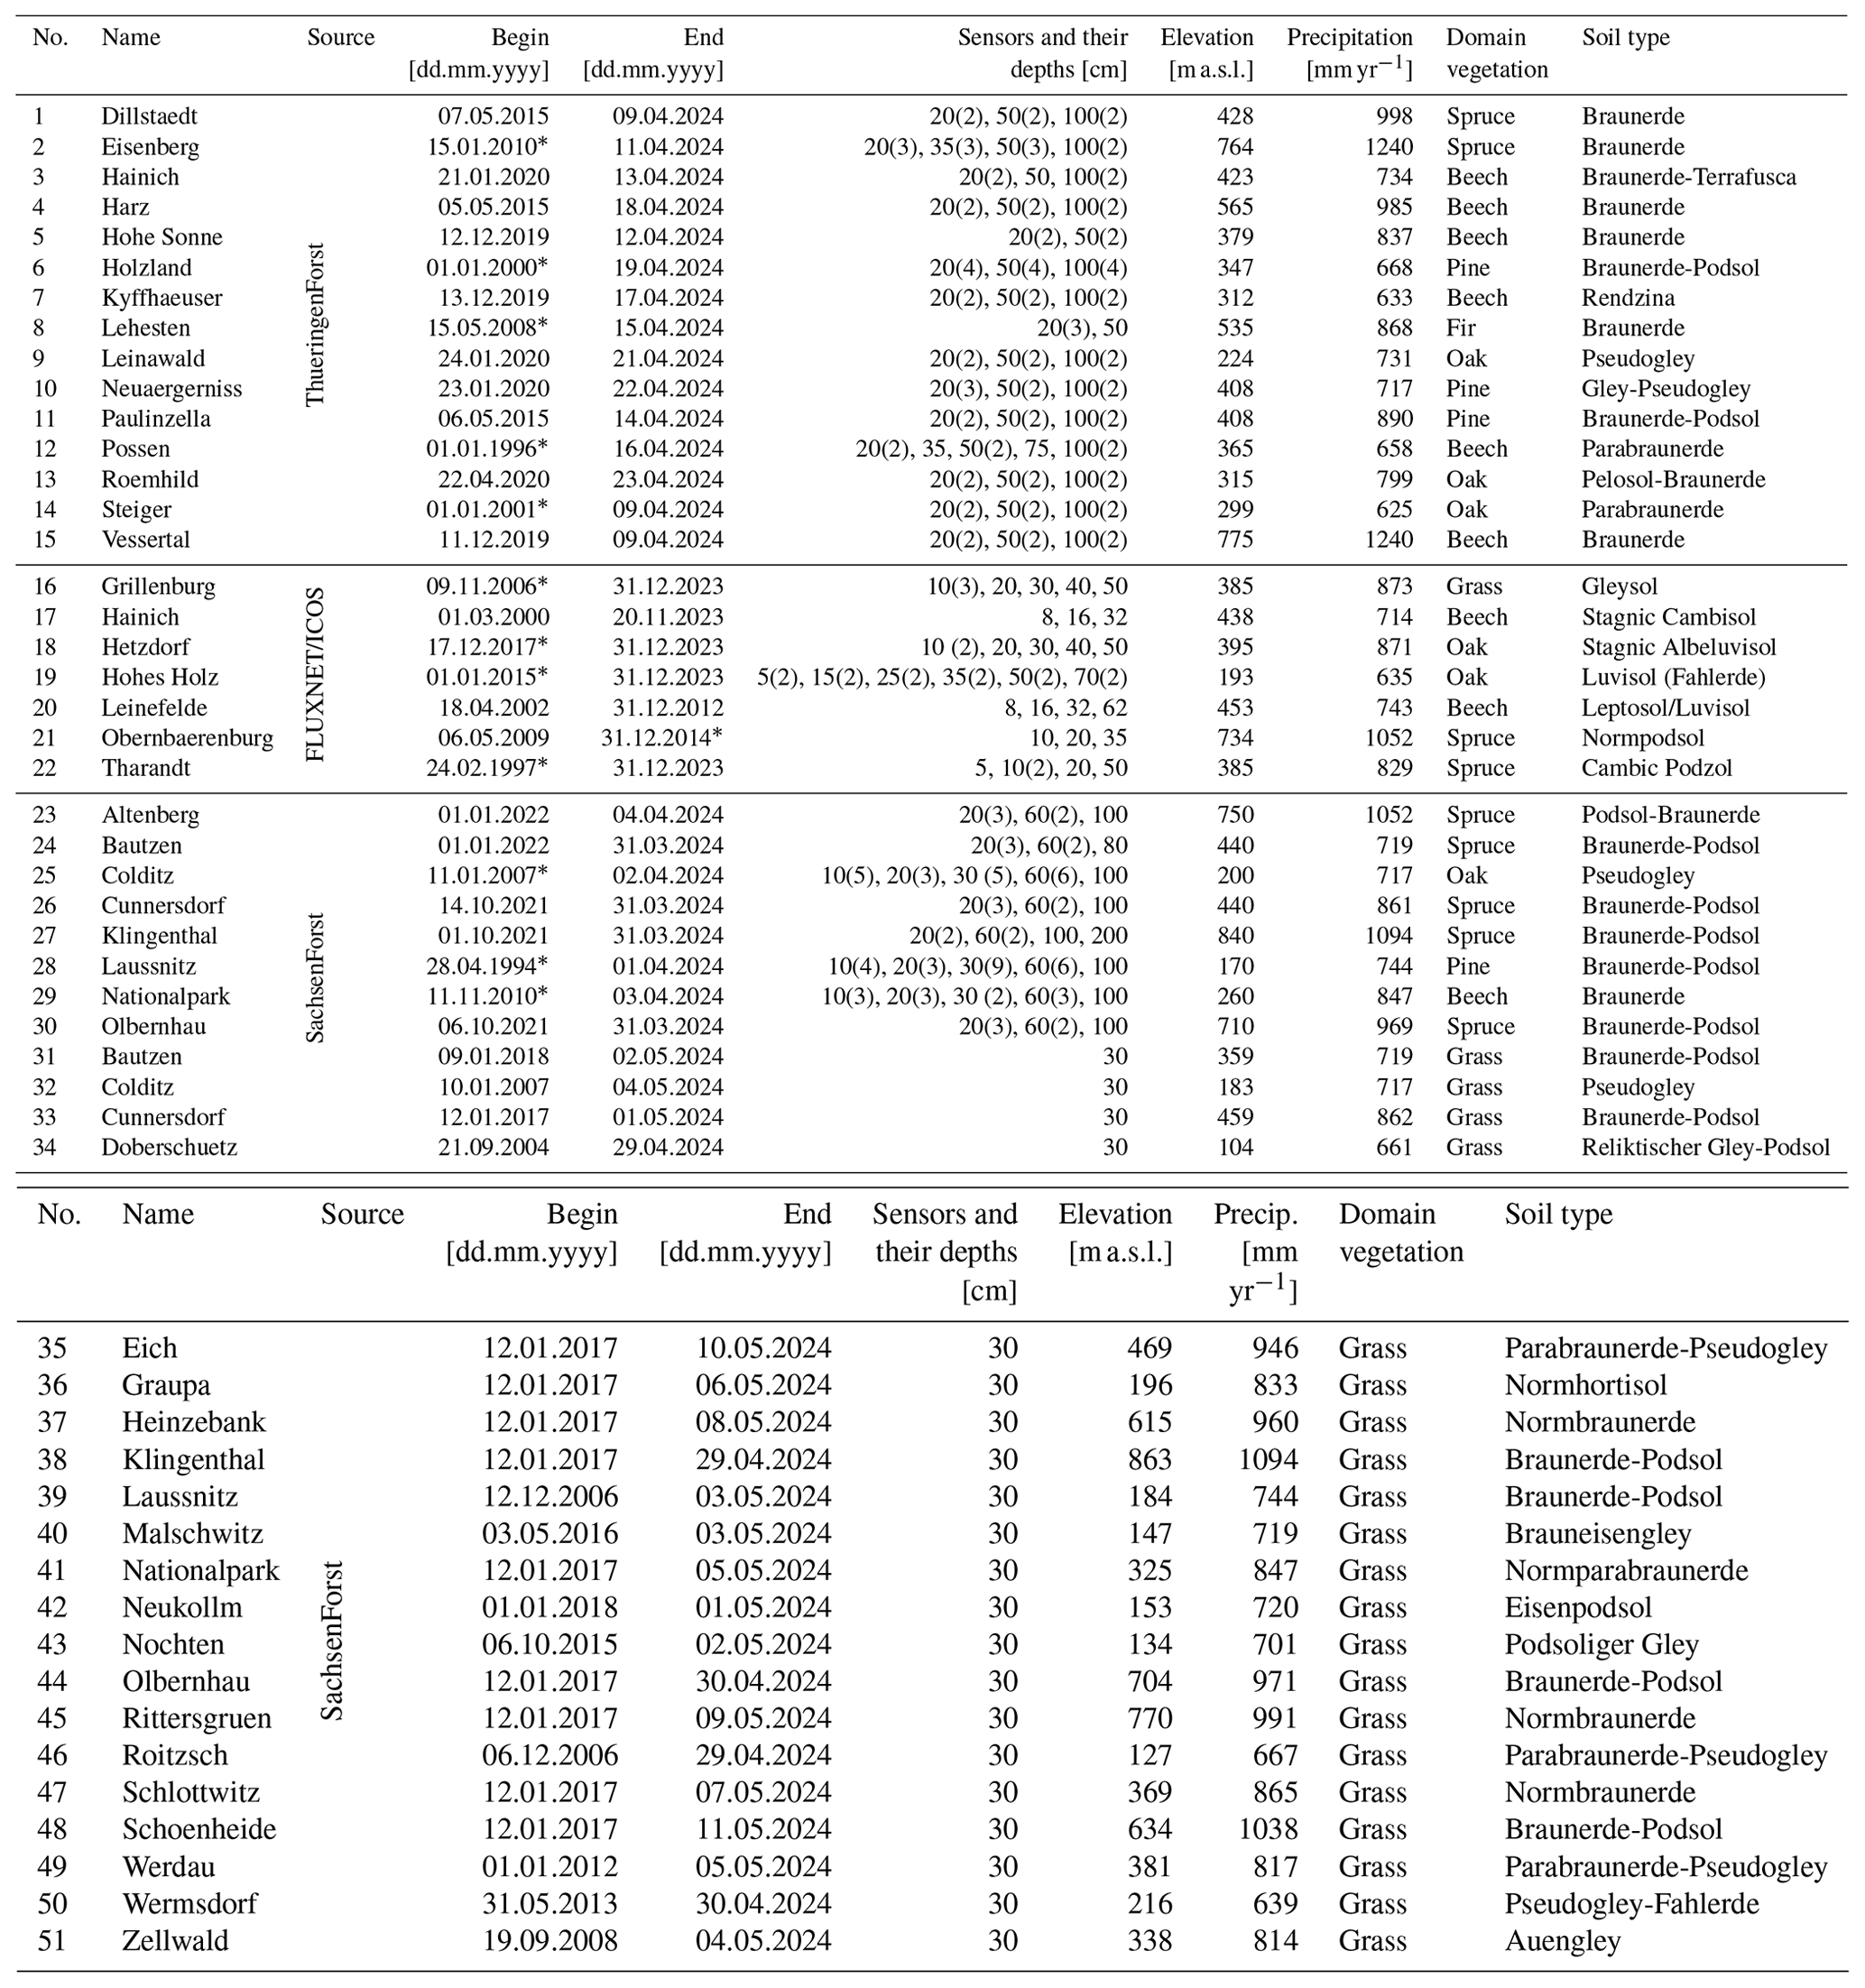
* The start and end periods of the measurements vary significantly for the different moisture sensors.
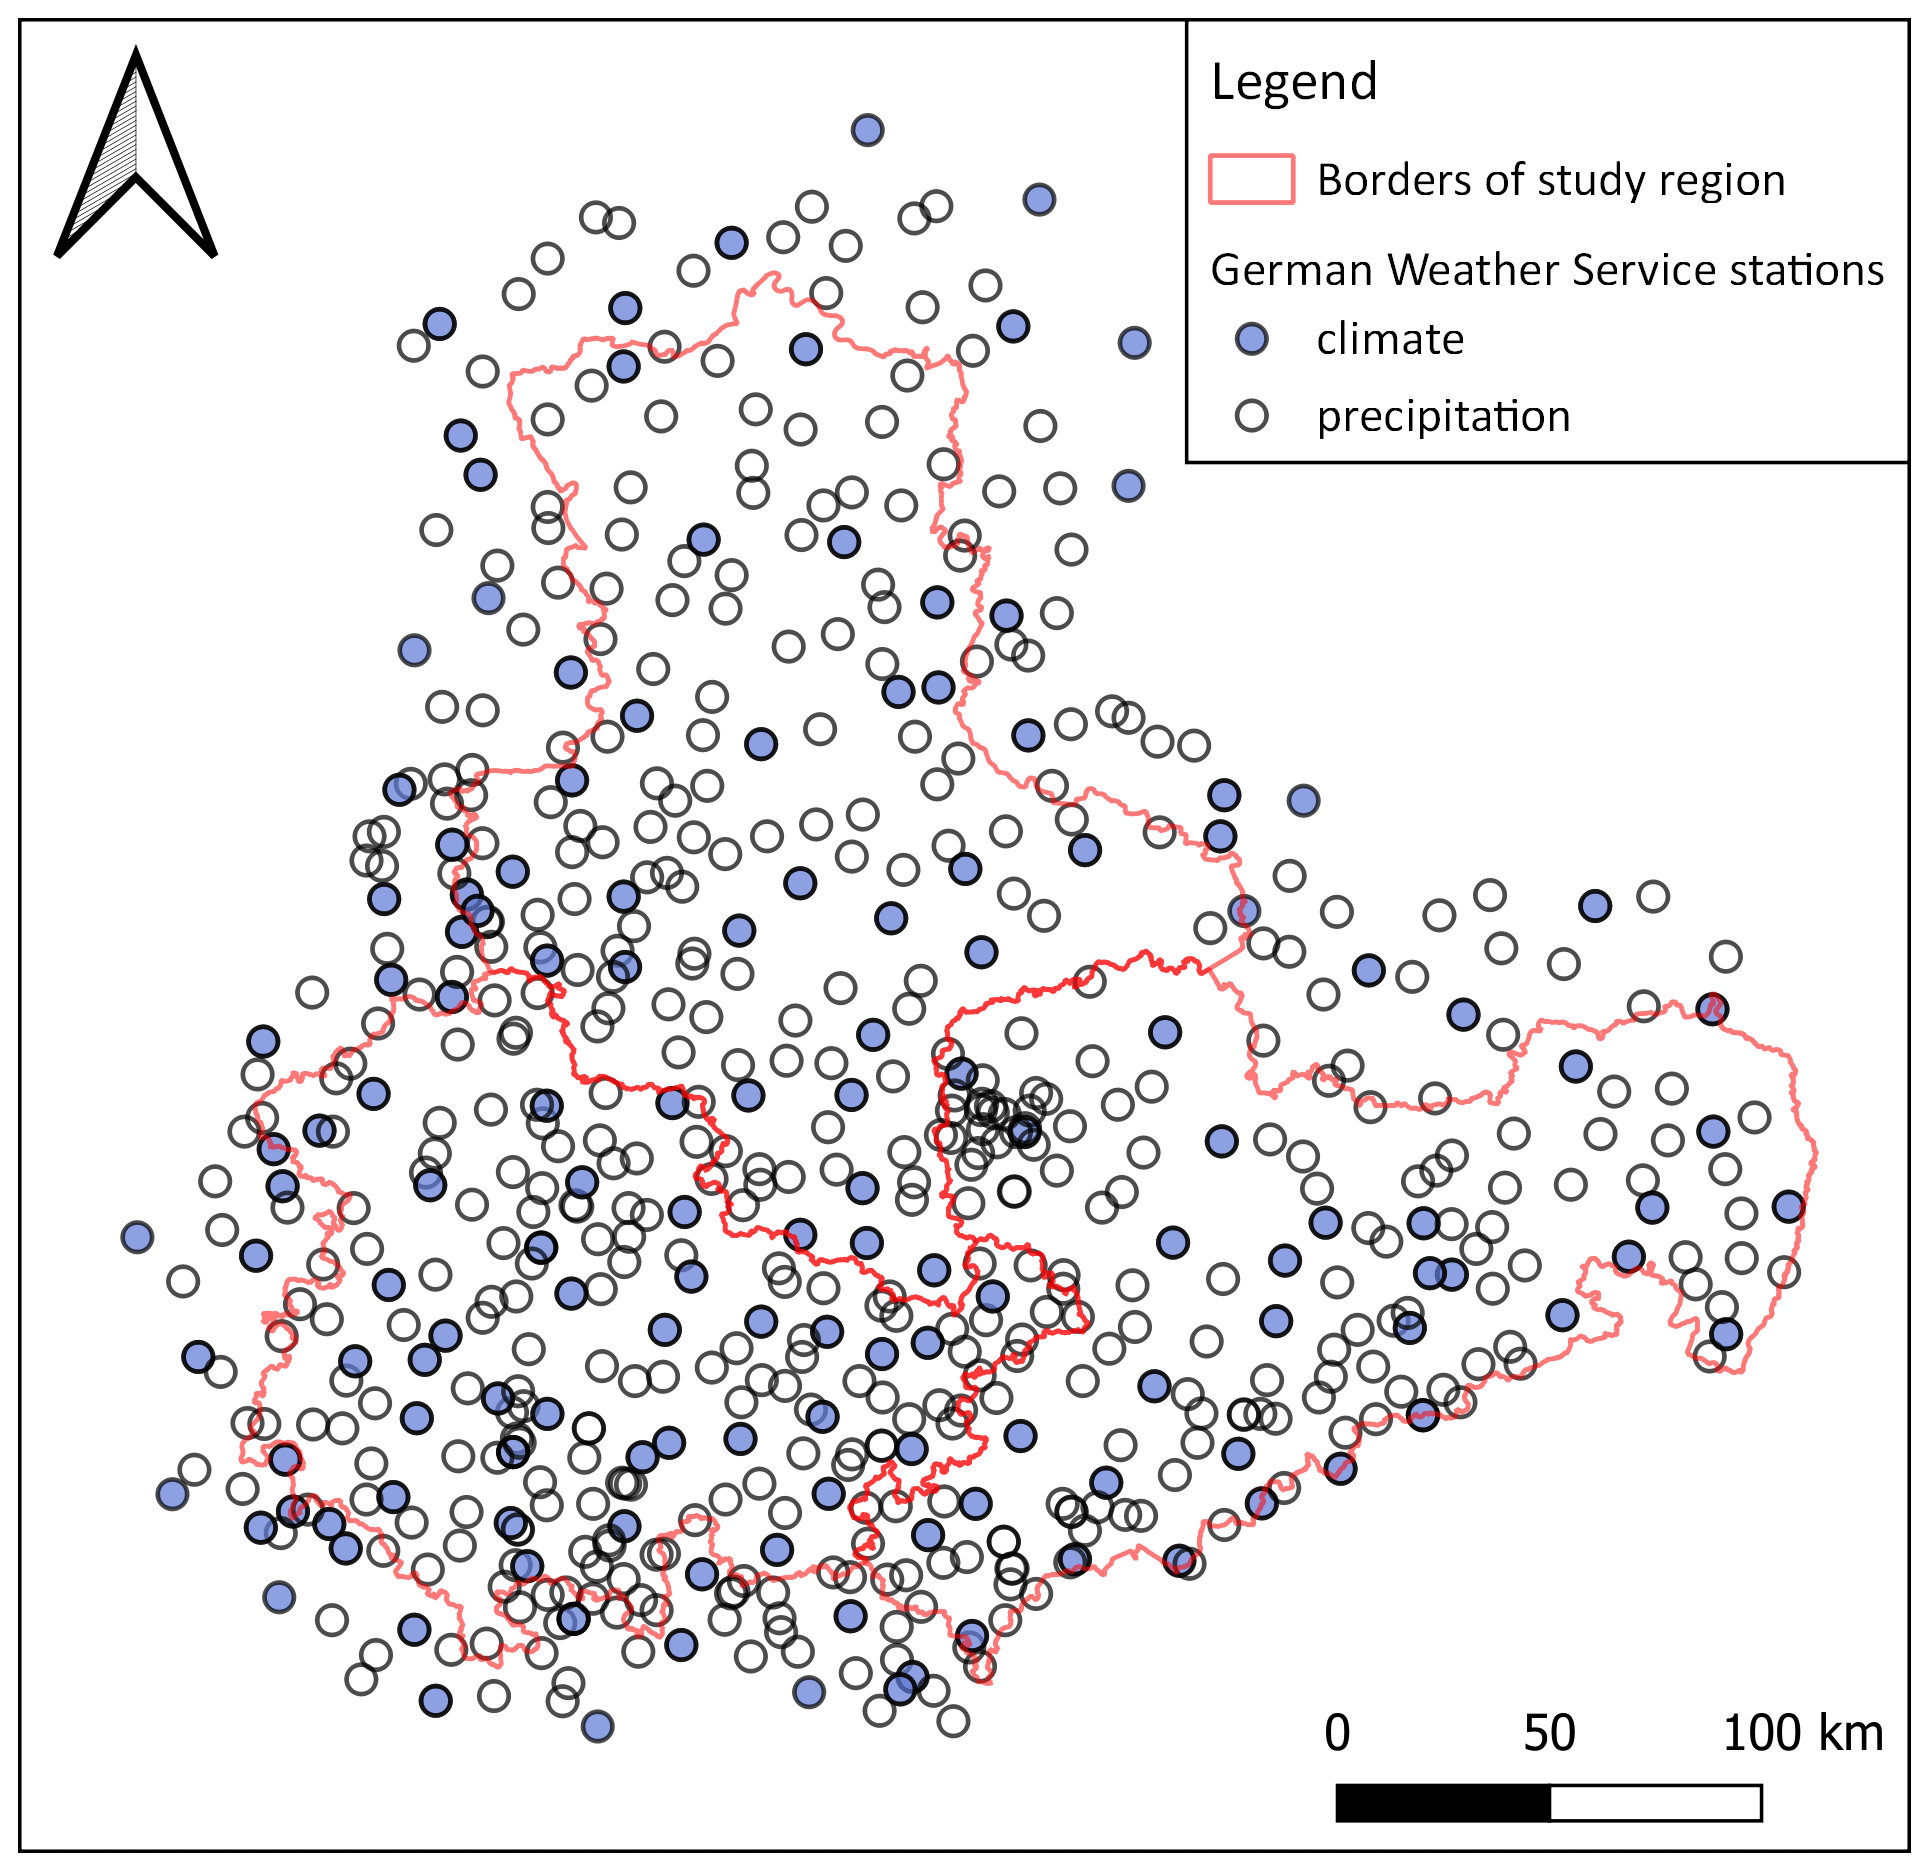
Figure A1Potential availability of the meteorological data from the German Meteorological Service for the last 10 years.
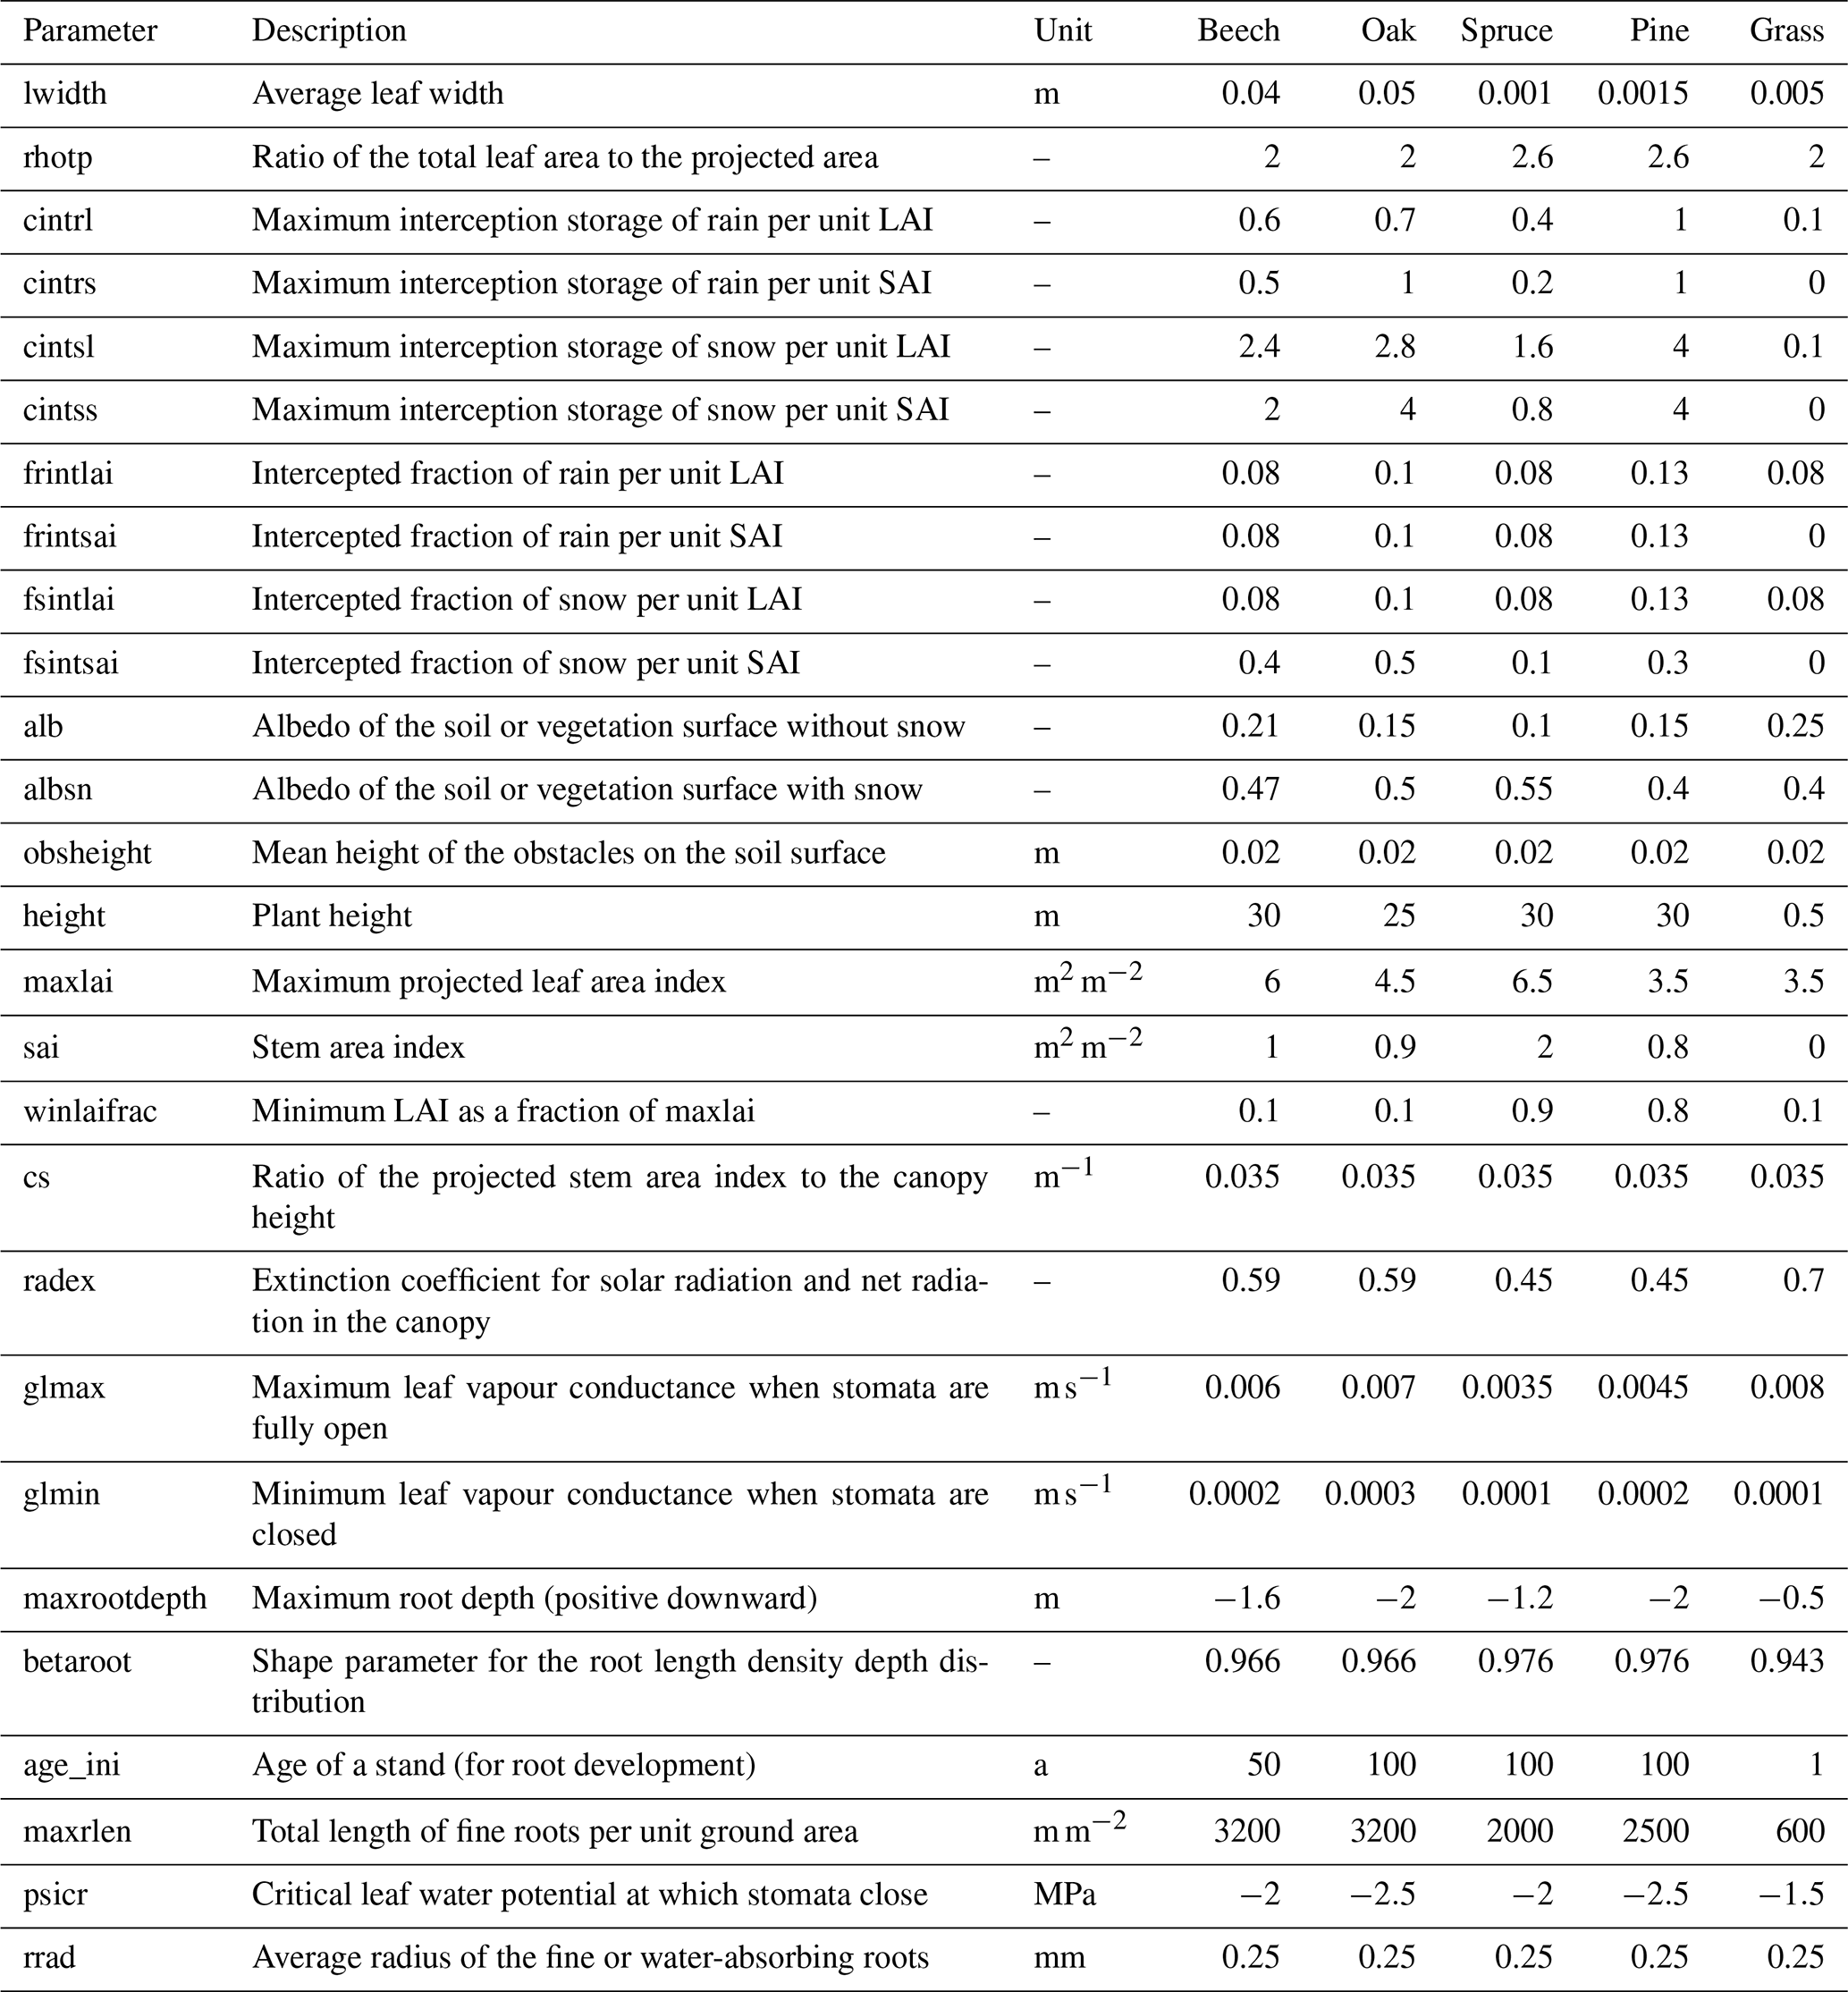
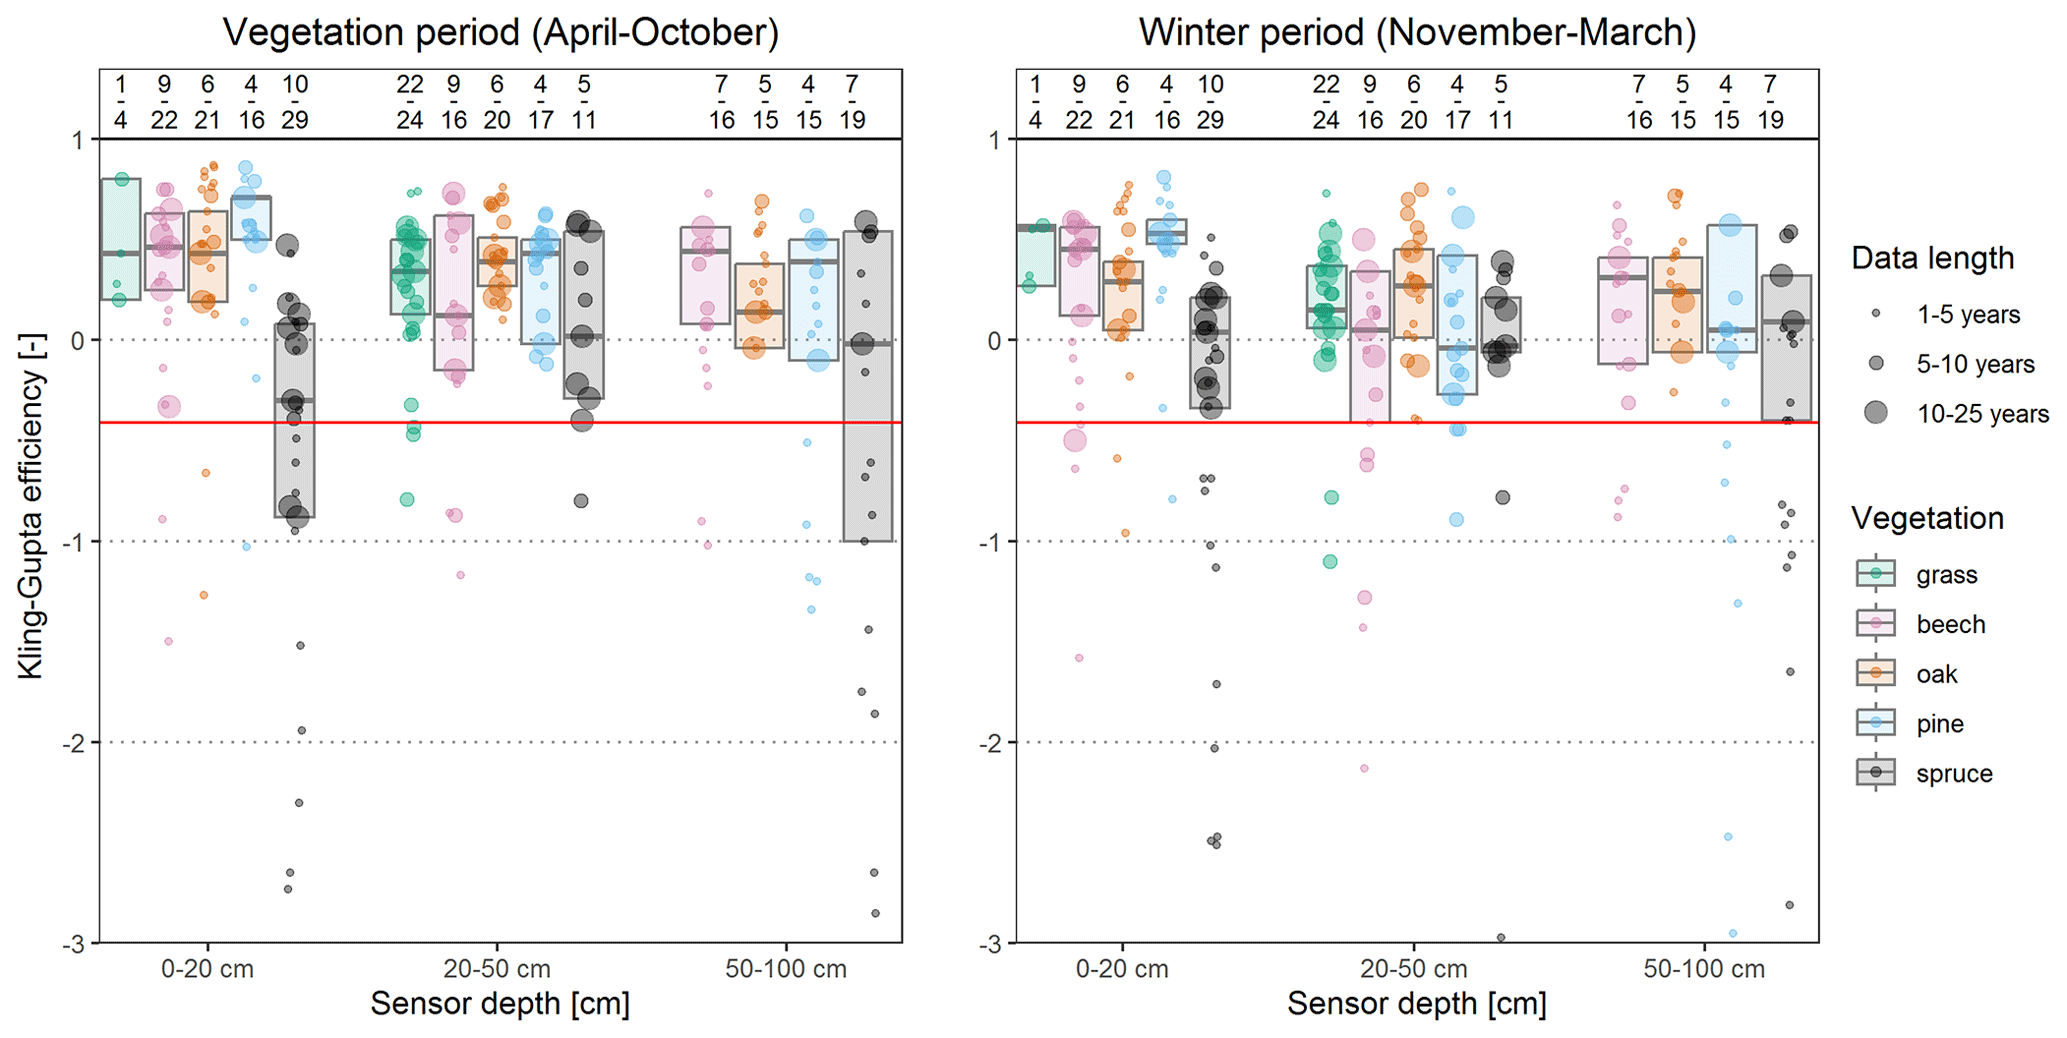
Figure C1Daily Kling–Gupta efficiency between the simulated and observed soil moisture for all the stations and sensors. Boxplots without whiskers represent the 25 %–75 % quantile range and the median calculated from the weighted values (after the data length). The red line with KGE = −0.41 represents the critical value below which the modelled time series are not better than the mean value. The numbers above each category state the number of stations (numerator) and sensors (denominator).
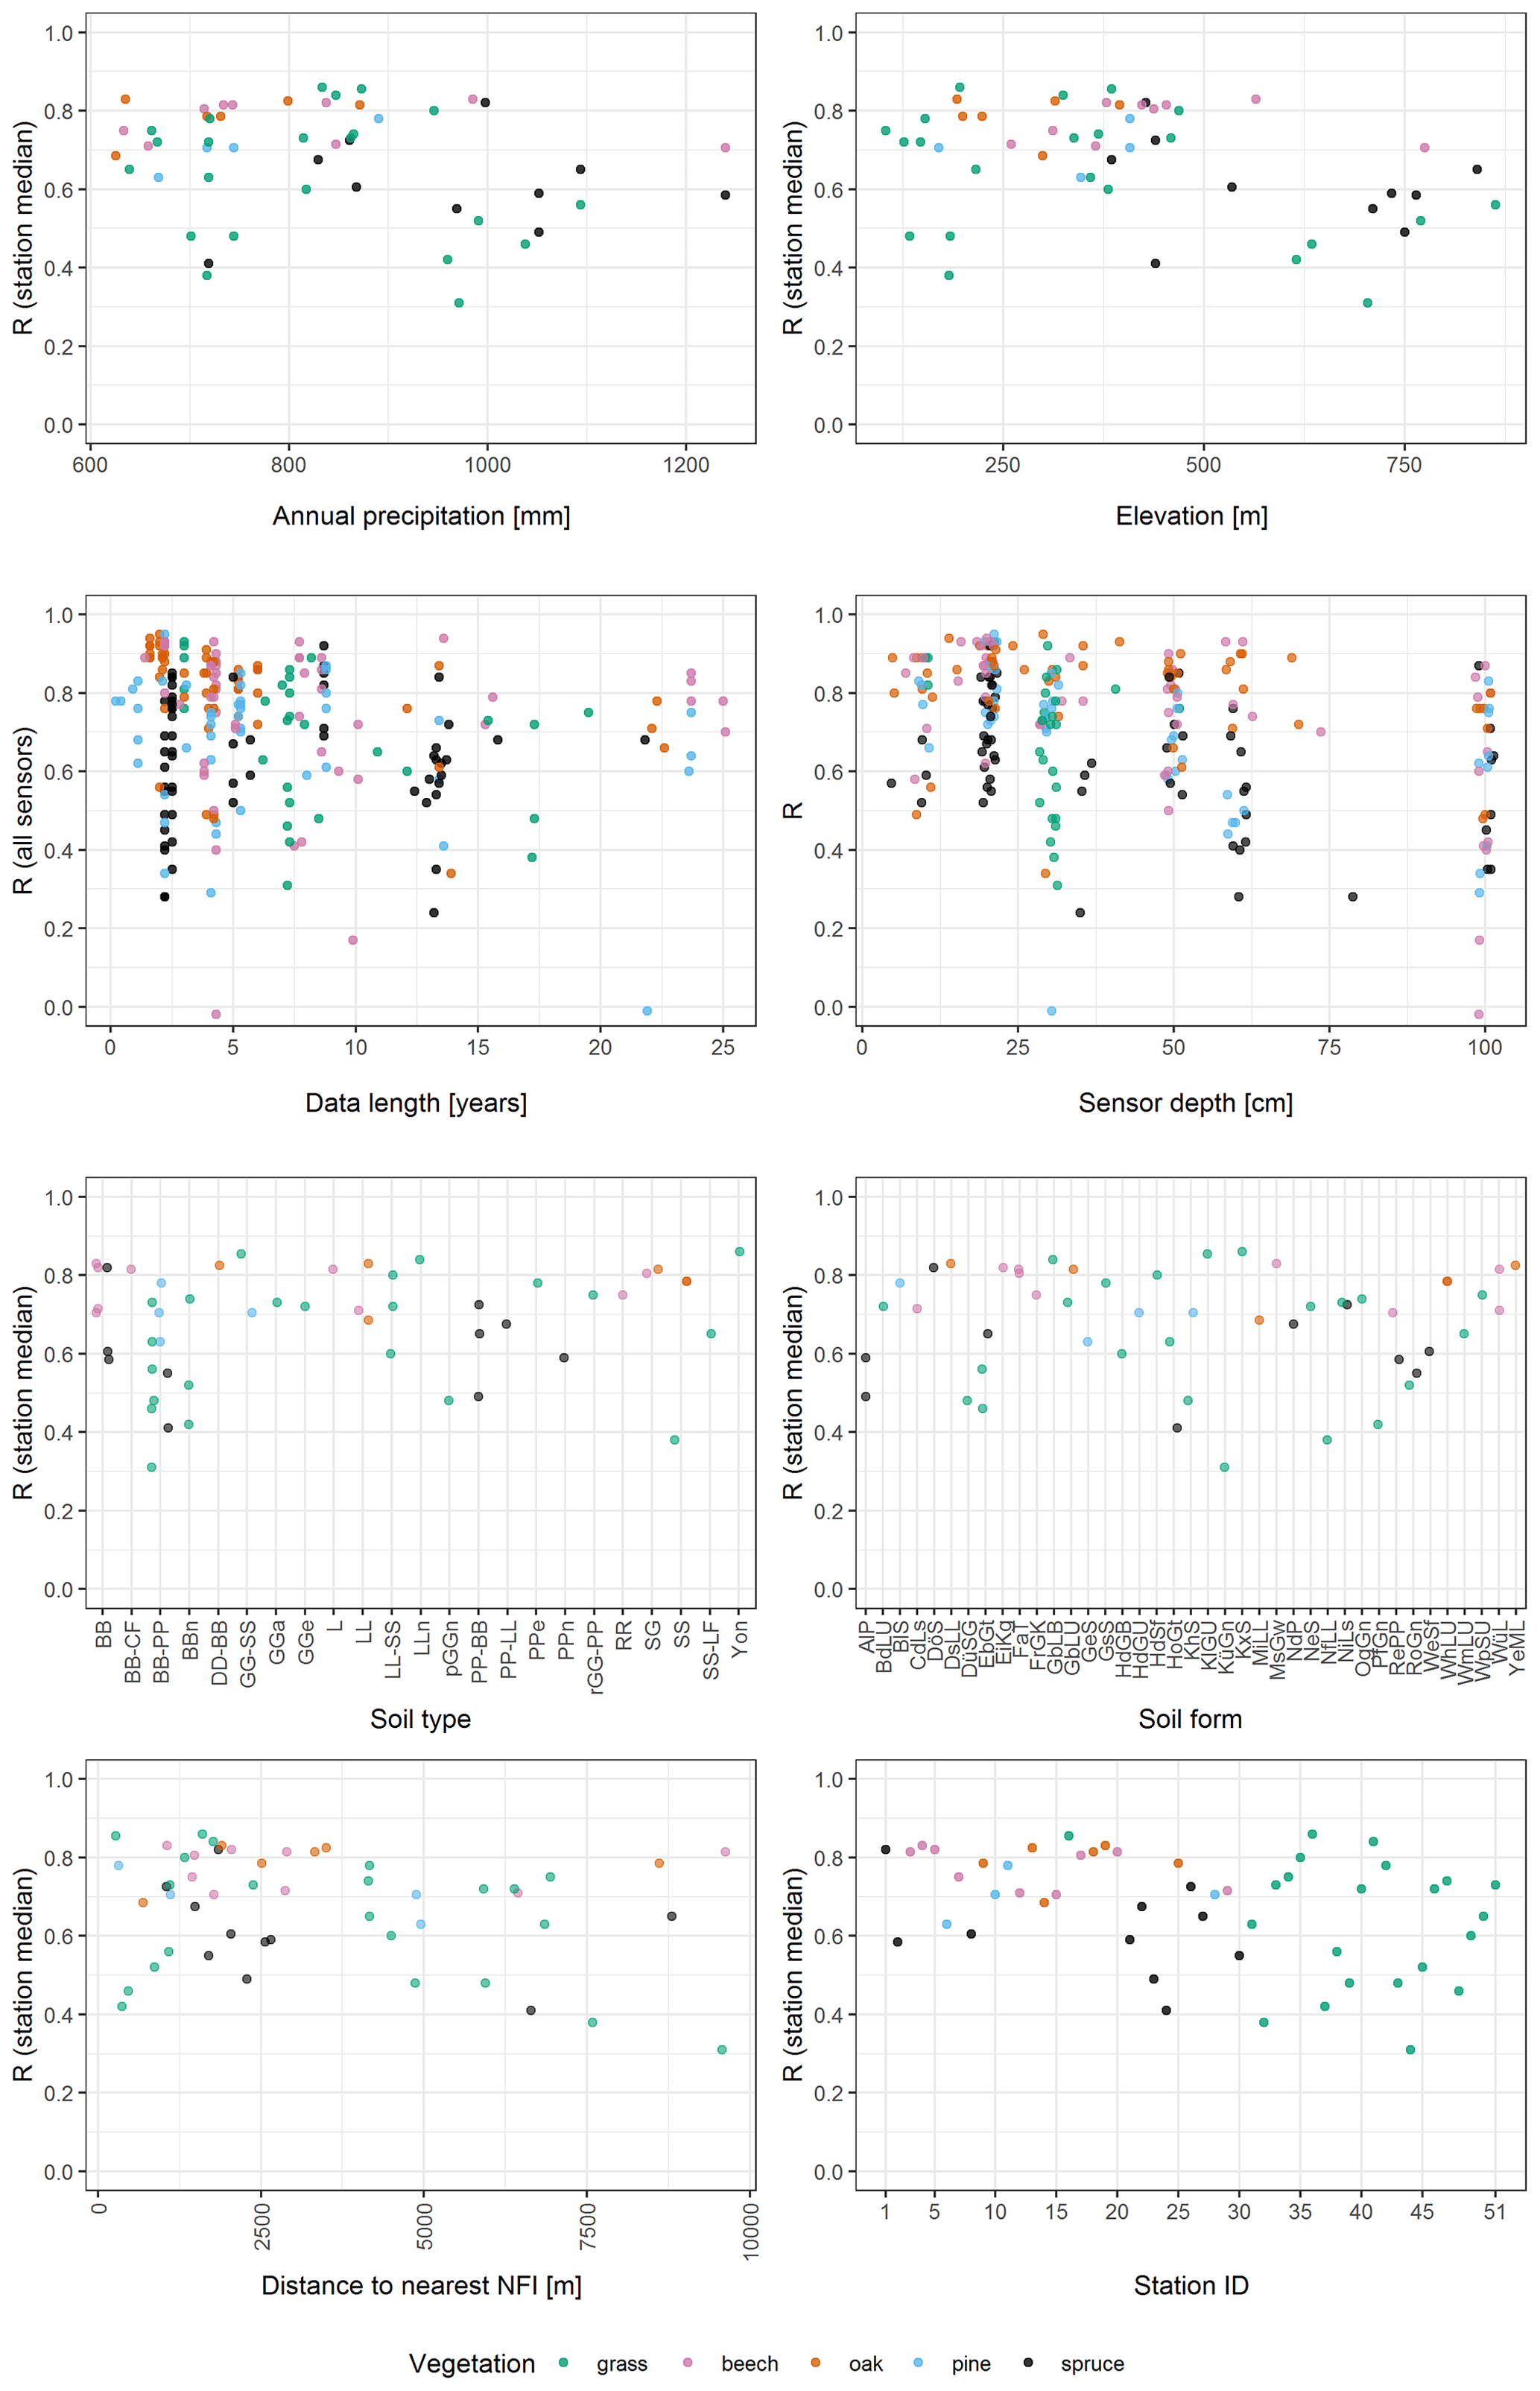
Figure C2Pearson correlation between the simulated and observed soil moisture for all the stations and sensors (daily scale) against the site characteristics.
The Soil Moisture Traffic Light web platform is accessible at https://life.hydro.tu-dresden.de/BoFeAm/dist_bfa_kk/index.html (Vorobevskii et al., 2024a).
Raw data used in the platform (with daily updates) can be accessed at https://life.hydro.tu-dresden.de/bfa_out/ (Vorobevskii et al., 2024b).
Historical simulations (1 January 1990–14 April 2024) containing water balance components are available from the HydroShare repository (https://doi.org/10.4211/hs.2418c392ccd3466b80b9191baa95d 744, Vorobevskii, 2024). Soil moisture measurement data and raw validation results can be provided upon request.
Conceptualization: IV, TTL, and RK; data curation: IV, TTL, and RP; formal analysis: IV; methodology: IV and TTL; visualization: IV; writing – original draft preparation: IV and TTL; writing – review: RK and RP.
The contact author has declared that none of the authors has any competing interests.
Publisher’s note: Copernicus Publications remains neutral with regard to jurisdictional claims made in the text, published maps, institutional affiliations, or any other geographical representation in this paper. While Copernicus Publications makes every effort to include appropriate place names, the final responsibility lies with the authors.
The authors would like to express their great thanks to Thomas Grünwald (TU Dresden), Alexander Peters (SachsenForst), and Merten Sven (ThüringenForst) for providing the soil moisture measurement data.
This research was funded by the German Federal Ministry of Education and Research (FKZ 01LR 2005A, funding measure “Regional Information on Climate Action” (RegIKlim), section (a) “Model Regions”).
This open access publication was financed by the Saxon State and University Library Dresden (SLUB Dresden).
This paper was edited by Nunzio Romano and reviewed by Luca Brocca and one anonymous referee.
Albrich, K., Rammer, W., and Seidl, R.: Climate change causes critical transitions and irreversible alterations of mountain forests, Glob. Change Biol., 26, 4013–4027, https://doi.org/10.1111/gcb.15118, 2020.
Alduchov, O. A. and Eskridge, R. E.: Improved Magnus Form Approximation of Saturation Vapor Pressure, J. Appl. Meteorol. Climatol., 35, 601–609, https://doi.org/10.1175/1520-0450(1996)035<0601:IMFAOS>2.0.CO;2, 1996.
Allocca, C., Castrignanò, A., Nasta, P., and Romano, N.: Regional-scale assessment of soil functions and resilience indicators: Accounting for change of support to estimate primary soil properties and their uncertainty, Geoderma, 431, 116339, https://doi.org/10.1016/j.geoderma.2023.116339, 2023.
Angstrom, A.: Solar and terrestrial radiation. Report to the international commission for solar research on actinometric investigations of solar and atmospheric radiation, Q. J. Roy. Meteor. Soc., 50, 121–126, https://doi.org/10.1002/qj.49705021008, 1924.
Bernhofer, C., Eichelmann, U., Grünwald, T., Hehn, M., Mauder, M., Moderow, U., and Prasse, H.: ETC L2 ARCHIVE, Grillenburg, https://hdl.handle.net/11676/gzbFF86Vn3j8R9KZ-6sYllwQ (last access: 5 August 2024), 2024a.
Bernhofer, C., Grünwald, T., Hehn, M., Mauder, M., Moderow, U., and Prasse, H.: ETC L2 ARCHIVE, Hetzdorf, https://hdl.handle.net/11676/H0EeFK3khmCPjWU_KCW-6Do1 (last access: 5 August 2024), 2024b.
Bernhofer, C., Eichelmann, U., Grünwald, T., Hehn, M., Mauder, M., Moderow, U., and Prasse, H.: ETC L2 ARCHIVE, Tharandt, https://hdl.handle.net/11676/sK3B_d3_VIWH8ZJkScV9zGZ_ (last access: 5 August 2024), 2024c.
Blickensdörfer, L., Oehmichen, K., Pflugmacher, D., Kleinschmit, B., and Hostert, P.: Dominant Tree Species for Germany (2017/2018), https://doi.org/10.3220/DATA20221214084846, 2022.
Boeing, F., Rakovec, O., Kumar, R., Samaniego, L., Schrön, M., Hildebrandt, A., Rebmann, C., Thober, S., Müller, S., Zacharias, S., Bogena, H., Schneider, K., Kiese, R., Attinger, S., and Marx, A.: High-resolution drought simulations and comparison to soil moisture observations in Germany, Hydrol. Earth Syst. Sci., 26, 5137–5161, https://doi.org/10.5194/hess-26-5137-2022, 2022.
Buchhorn, M., Smets, B., Bertels, L., De Roo, B., Lesiv, M., Tsendbazar, N. E., Linlin, L., and Tarko, A.: Copernicus Global Land Service: Land Cover 100 m: Version 3 Globe 2015–2019: Product User Manual, Zenodo, Geneve, Switzerland, September 2020, https://doi.org/10.5281/zenodo.3938963, 2020.
Bundesministerium für Ernährung und Landwirtschaft: Der Wald in Deutschland – ausgewählte Ergebnisse der dritten Bundeswaldinventur, https://www.bmel.de/SharedDocs/Downloads/DE/Broschueren/bundeswaldinventur3.pdf?__blob=publicationFile&v=6 (last access: 5 August 2024), 2014.
Bundesministerium für Ernährung und Landwirtschaft: Massive Schäden – Einsatz für die Wälder, Bundesministerium für Ernährung und Landwirtschaft, https://www.bmel.de/DE/themen/wald/wald-in-deutschland/wald-trockenheit-klimawandel.html (last access: 5 August 2024), 2023.
Buras, A., Rammig, A., and Zang, C. S.: Quantifying impacts of the 2018 drought on European ecosystems in comparison to 2003, Biogeosciences, 17, 1655–1672, https://doi.org/10.5194/bg-17-1655-2020, 2020.
Clapp, R. B. and Hornberger, G. M.: Empirical equations for some soil hydraulic properties, Water Resour. Res., 14, 601–604, https://doi.org/10.1029/WR014i004p00601, 1978.
Crow, W. T., Berg, A. A., Cosh, M. H., Loew, A., Mohanty, B. P., Panciera, R., de Rosnay, P., Ryu, D., and Walker, J. P.: Upscaling sparse ground-based soil moisture observations for the validation of coarse-resolution satellite soil moisture products, Rev. Geophys., 50, RG2002, https://doi.org/10.1029/2011RG000372, 2012.
Das, N., Entekhabi, D., Dunbar, R. S., Chaubell, M. J., Colliander, A., Yueh, S., Jagdhuber, T., Chen, F., Crow, W., O'Neill, P. E., Walker, J. P., Berg, A., Bosch, D. D., Caldwell, T., Cosh, M. H., Collins, C. H., Lopez-Baeza, E., and Thibeault, M.: The SMAP and Copernicus Sentinel 1A/B microwave active-passive high resolution surface soil moisture product, Remote Sens. Environ., 233, 111380, https://doi.org/10.1016/j.rse.2019.111380, 2019.
Dorigo, W., Himmelbauer, I., Aberer, D., Schremmer, L., Petrakovic, I., Zappa, L., Preimesberger, W., Xaver, A., Annor, F., Ardö, J., Baldocchi, D., Bitelli, M., Blöschl, G., Bogena, H., Brocca, L., Calvet, J.-C., Camarero, J. J., Capello, G., Choi, M., Cosh, M. C., van de Giesen, N., Hajdu, I., Ikonen, J., Jensen, K. H., Kanniah, K. D., de Kat, I., Kirchengast, G., Kumar Rai, P., Kyrouac, J., Larson, K., Liu, S., Loew, A., Moghaddam, M., Martínez Fernández, J., Mattar Bader, C., Morbidelli, R., Musial, J. P., Osenga, E., Palecki, M. A., Pellarin, T., Petropoulos, G. P., Pfeil, I., Powers, J., Robock, A., Rüdiger, C., Rummel, U., Strobel, M., Su, Z., Sullivan, R., Tagesson, T., Varlagin, A., Vreugdenhil, M., Walker, J., Wen, J., Wenger, F., Wigneron, J. P., Woods, M., Yang, K., Zeng, Y., Zhang, X., Zreda, M., Dietrich, S., Gruber, A., van Oevelen, P., Wagner, W., Scipal, K., Drusch, M., and Sabia, R.: The International Soil Moisture Network: serving Earth system science for over a decade, Hydrol. Earth Syst. Sci., 25, 5749–5804, https://doi.org/10.5194/hess-25-5749-2021, 2021.
Federer, C. A., Vörösmarty, C., and Fekete, B.: Intercomparison of Methods for Calculating Potential Evaporation in Regional and Global Water Balance Models, Water Resour. Res., 32, 2315–2321, https://doi.org/10.1029/96WR00801, 1996.
Federer, C. A., Vörösmarty, C., and Fekete, B.: Sensitivity of Annual Evaporation to Soil and Root Properties in Two Models of Contrasting Complexity, J. Hydrometeorol., 4, 1276–1290, https://doi.org/10.1175/1525-7541(2003)004<1276:SOAETS>2.0.CO;2, 2003.
Gale, M. R. and Grigal, D. F.: Vertical root distributions of northern tree species in relation to successional status, Can. J. Forest Res., 17, 829–834, https://doi.org/10.1139/x87-131, 1987.
Gelfand, A. E., Zhu, L., and Carlin, B. P.: On the change of support problem for spatio-temporal data, Biostatistics, 2, 31–45, https://doi.org/10.1093/biostatistics/2.1.31, 2001.
Hammel, K. and Kennel, M.: Charakterisierung Und Analyse Der Wasserverfügbarkeit Und Des Wasserhaushalts von Waldstandorten in Bayern Mit Dem Simulationsmodell BROOK90, ISBN 3-933506-16-6, 2001.
Hanel, M., Rakovec, O., Markonis, Y., Máca, P., Samaniego, L., Kyselý, J., and Kumar, R.: Revisiting the recent European droughts from a long-term perspective, Sci. Rep., 8, 94–99, https://doi.org/10.1038/s41598-018-27464-4, 2018.
Hlásny, T., Zimová, S., Merganičová, K., Štěpánek, P., Modlinger, R., and Turčáni, M.: Devastating outbreak of bark beetles in the Czech Republic: Drivers, impacts, and management implications, Forest Ecol. Manag., 490, 119075, https://doi.org/10.1016/j.foreco.2021.119075, 2021.
Hoermann, G. and Meesenburg, H.: Calculation and modelling of forest water budgets for Level II plots in Germany – a comparison of soil water models; Die Erfassung und Modellierung des Wasserhaushaltes im Rahmen des Level II-Programms in der Bundesrepublik Deutschland, Forstarchiv, 71, 70–75, 2000.
Jansson, P.-E. and Karlberg, L.: Coupled heat and mass transfer model for soil-plant-atmosphere systems, Royal Institute of Technology, Department of Civil and Environmental Engineering, https://www.coupmodel.com/ (last access: 5 August 2024), 2004.
Kemppinen, J., Niittynen, P., Rissanen, T., Tyystjärvi, V., Aalto, J., and Luoto, M.: Soil Moisture Variations From Boreal Forests to the Tundra, Water Resour. Res., 59, e2022WR032719, https://doi.org/10.1029/2022WR032719, 2023.
Kirchen, G., Calvaruso, C., Granier, A., Redon, P.-O., Van der Heijden, G., Bréda, N., and Turpault, M.-P.: Local soil type variability controls the water budget and stand productivity in a beech forest, Forest Ecol. Manag., 390, 89–103, https://doi.org/10.1016/j.foreco.2016.12.024, 2017.
Knoben, W. J. M., Freer, J. E., and Woods, R. A.: Technical note: Inherent benchmark or not? Comparing Nash–Sutcliffe and Kling–Gupta efficiency scores, Hydrol. Earth Syst. Sci., 23, 4323–4331, https://doi.org/10.5194/hess-23-4323-2019, 2019.
Knohl, A., Tiedemann, F., Klosterhalfen, A., Markwitz, C., and Siebicke, L.: ETC L2 ARCHIVE, Hainich, https://hdl.handle.net/11676/HraNB_GeItn8UdBmcpeZBfV4 (last access: 5 August 2024), 2024.
Kottek, M., Grieser, J., Beck, C., Rudolf, B., and Rubel, F.: World Map of the Köppen-Geiger climate classification updated, Meteorol. Z., 15, 259–263, https://doi.org/10.1127/0941-2948/2006/0130, 2006.
Kroes, J. G., Van Dam, J. C., Bartholomeus, R. P., Groenendijk, P., Heinen, M., Hendriks, R. F. A., Mulder, H. M., Supit, I., and Van Walsum, P. E. V.: SWAP version 4; Theory Description and User Manual, Wageningen Environmental Research, Wageningen University and Research, Wageningen, The Netherlands, ISSN 1566-7197, 2017.
Kronenberg, R., Thành, T. L., Müller, M., Andreae, H., and Petzold, R.: Die Bodenfeuchteampel – Ein webbasiertes Informationssystem für die tagaktuelleBewertung der Wasserverfügbarkeit in Wäldern, Waldökologie, Landschaftsforschung und Naturschutz – Forest Ecology, Landscape Research and Nature Conservation, https://www.afsv.de/images/download/literatur/waldoekologie-online/waldoekologie-online_heft-21-2.pdf (last access: 5 August 2024), 2022.
Krug, D.: Soil Map of Germany at scale 1:200 000 (BÜK200), https://www.bgr.bund.de/EN/Themen/Boden/Projekte/Informationsgrundlagen_laufend/BUEK200/BUEK200_en.html (last access: 5 August 2024), 2000.
Luong, T. T., Vorobevskii, I., Kronenberg, R., Jacob, F., Peters, A., Petzold, R., and Andreae, H.: Toward reliable model-based soil moisture estimates for forest managers, Meteorol. Z., 32, 143–164, https://doi.org/10.1127/metz/2023/1155, 2023.
Menzel, A.: Phänologie von Waldbäumen unter sich ändernden Klimabedingungen – Auswertung der Beobachtungen in den Internationalen Phänologischen Gärten und Möglichkeiten der Modellierung von Phänodaten, München, ISSN 0174-1810, 1997.
Meusburger, K., Trotsiuk, V., Schmidt-Walter, P., Baltensweiler, A., Brun, P., Bernhard, F., Gharun, M., Habel, R., Hagedorn, F., Köchli, R., Psomas, A., Puhlmann, H., Thimonier, A., Waldner, P., Zimmermann, S., and Walthert, L.: Soil–plant interactions modulated water availability of Swiss forests during the 2015 and 2018 droughts, Glob. Change Biol., 28, 5928–5944, https://doi.org/10.1111/gcb.16332, 2022.
NASA JPL: NASA Shuttle Radar Topography Mission Global 1 arc second, NASA EOSDIS Land Processes DAAC [data set], https://doi.org/10.5067/MEaSUREs/SRTM/SRTMGL1.003, 2019.
Obladen, N., Dechering, P., Skiadaresis, G., Tegel, W., Keßler, J., Höllerl, S., Kaps, S., Hertel, M., Dulamsuren, C., Seifert, T., Hirsch, M., and Seim, A.: Tree mortality of European beech and Norway spruce induced by 2018–2019 hot droughts in central Germany, Agr. Forest Meteorol., 307, 108482, https://doi.org/10.1016/j.agrformet.2021.108482, 2021.
Orlowsky, B., Gerstengarbe, F.-W., and Werner, P. C.: A resampling scheme for regional climate simulations and its performance compared to a dynamical RCM, Theor. Appl. Climatol., 92, 209–223, https://doi.org/10.1007/s00704-007-0352-y, 2008.
Orth, R., Vogel, M. M., Luterbacher, J., Pfister, C., and Seneviratne, S. I.: Did European temperatures in 1540 exceed present-day records?, Environ. Res. Lett., 11, 114021, https://doi.org/10.1088/1748-9326/11/11/114021, 2016.
Pastorello, G., Trotta, C., Canfora, E., Chu, H., Christianson, D., Cheah, Y.-W., Poindexter, C., Chen, J., Elbashandy, A., Humphrey, M., Isaac, P., Polidori, D., Reichstein, M., Ribeca, A., van Ingen, C., Vuichard, N., Zhang, L., Amiro, B., Ammann, C., Arain, M. A., Ardö, J., Arkebauer, T., Arndt, S. K., Arriga, N., Aubinet, M., Aurela, M., Baldocchi, D., Barr, A., Beamesderfer, E., Marchesini, L. B., Bergeron, O., Beringer, J., Bernhofer, C., Berveiller, D., Billesbach, D., Black, T. A., Blanken, P. D., Bohrer, G., Boike, J., Bolstad, P. V., Bonal, D., Bonnefond, J.-M., Bowling, D. R., Bracho, R., Brodeur, J., Brümmer, C., Buchmann, N., Burban, B., Burns, S. P., Buysse, P., Cale, P., Cavagna, M., Cellier, P., Chen, S., Chini, I., Christensen, T. R., Cleverly, J., Collalti, A., Consalvo, C., Cook, B. D., Cook, D., Coursolle, C., Cremonese, E., Curtis, P. S., D'Andrea, E., da Rocha, H., Dai, X., Davis, K. J., Cinti, B. D., Grandcourt, A. de, Ligne, A. D., De Oliveira, R. C., Delpierre, N., Desai, A. R., Di Bella, C. M., Tommasi, P. di, Dolman, H., Domingo, F., Dong, G., Dore, S., Duce, P., Dufrêne, E., Dunn, A., Dušek, J., Eamus, D., Eichelmann, U., ElKhidir, H. A. M., Eugster, W., Ewenz, C. M., Ewers, B., Famulari, D., Fares, S., Feigenwinter, I., Feitz, A., Fensholt, R., Filippa, G., Fischer, M., Frank, J., Galvagno, M., et al.: The FLUXNET2015 dataset and the ONEFlux processing pipeline for eddy covariance data, Sci. Data, 7, 225, https://doi.org/10.1038/s41597-020-0534-3, 2020.
Patacca, M., Lindner, M., Lucas-Borja, M. E., Cordonnier, T., Fidej, G., Gardiner, B., Hauf, Y., Jasinevičius, G., Labonne, S., Linkevičius, E., Mahnken, M., Milanovic, S., Nabuurs, G.-J., Nagel, T. A., Nikinmaa, L., Panyatov, M., Bercak, R., Seidl, R., Ostrogović Sever, M. Z., Socha, J., Thom, D., Vuletic, D., Zudin, S., and Schelhaas, M.-J.: Significant increase in natural disturbance impacts on European forests since 1950, Glob. Change Biol., 29, 1359–1376, https://doi.org/10.1111/gcb.16531, 2023.
Petzold, R. and Benning, R.: Standortskartierung – Wissen von gestern?, AFZ-DerWald, 15, 25–28, https://tu-dresden.de/bu/umwelt/forst/boden/ressourcen/dateien/publikationen/afz-15-17-wp-ks-kw-petzold-und-benning?lang=en (last access: 5 August 2024), 2017.
Petzold, R., Burse, K., Benning, R., and Gemballa, R.: Die Lokalbodenform im System der forstlichen Standortserkundung im Mittelgebirge/Hügelland und deren bodenphysikalischer Informationsgehalt, Waldökologie, Landschaftsforschung und Naturschutz, 29–33, https://doi.org/urn:nbn:de:0041-afsv-01641, AFSV-Schriftenreihe “Waldökologie, Landschaftsforschung und Naturschutz”, 2016.
Potapov, P., Li, X., Hernandez-Serna, A., Tyukavina, A., Hansen, M. C., Kommareddy, A., Pickens, A., Turubanova, S., Tang, H., Silva, C. E., Armston, J., Dubayah, R., Blair, J. B., and Hofton, M.: Mapping global forest canopy height through integration of GEDI and Landsat data, Remote Sens. Environ., 253, 112165, https://doi.org/10.1016/j.rse.2020.112165, 2021.
Rebmann, C., Dienstbach, L., Schmidt, P., Wiesen, R., Meis, J., Feldmann, I., Garcia Quiros, I., Gimper, S., and Paasch, S.: ETC L2 ARCHIVE, Hohes Holz, https://hdl.handle.net/11676/8xpZ1HKDA9ZQ16MPwQYjBSEM (last access: 5 August 2024), 2024.
Renner, M., Brust, K., Schwärzel, K., Volk, M., and Bernhofer, C.: Separating the effects of changes in land cover and climate: a hydro-meteorological analysis of the past 60 yr in Saxony, Germany, Hydrol. Earth Syst. Sci., 18, 389–405, https://doi.org/10.5194/hess-18-389-2014, 2014.
Richter, D.: Ergebnisse methodischer Untersuchungen zur Korrektur des systematischen Meßfehlers des Hellmann-Niederschlagsmessers von Dieter Richter, Deutscher Wetterdienst, Offenbach am Main, ISBN 978-3-88148-309-4, Deutscher Wetterdienst, 1995.
Schmidt-Walter, P., Ahrends, B., Mette, T., Puhlmann, H., and Meesenburg, H.: NFIWADS: the water budget, soil moisture, and drought stress indicator database for the German National Forest Inventory (NFI), Ann. For. Sci., 76, 39, https://doi.org/10.1007/s13595-019-0822-2, 2019.
Schmidt-Walter, P., Trotsiuk, V., Meusburger, K., Zacios, M., and Meesenburg, H.: Advancing simulations of water fluxes, soil moisture and drought stress by using the LWF-Brook90 hydrological model in R, Agr. Forest Meteorol., 291, 108023, https://doi.org/10.1016/j.agrformet.2020.108023, 2020.
Scholz, H., Lischeid, G., Ribbe, L., and Grahmann, K.: Differentiating between crop and soil effects on soil moisture dynamics, EGUsphere [preprint], https://doi.org/10.5194/egusphere-2023-1115, 2023.
Schuldt, B., Buras, A., Arend, M., Vitasse, Y., Beierkuhnlein, C., Damm, A., Gharun, M., Grams, T. E. E., Hauck, M., Hajek, P., Hartmann, H., Hiltbrunner, E., Hoch, G., Holloway-Phillips, M., Körner, C., Larysch, E., Lübbe, T., Nelson, D. B., Rammig, A., Rigling, A., Rose, L., Ruehr, N. K., Schumann, K., Weiser, F., Werner, C., Wohlgemuth, T., Zang, C. S., and Kahmen, A.: A first assessment of the impact of the extreme 2018 summer drought on Central European forests, Basic Appl. Ecol., 45, 86–103, https://doi.org/10.1016/j.baae.2020.04.003, 2020.
Seltmann, C. T., Wernicke, J., Petzold, R., Baumann, M., Münder, K., and Martens, S.: The relative importance of environmental drivers and their interactions on the growth of Norway spruce depends on soil unit classes: A case study from Saxony and Thuringia, Germany, Forest Ecol. Manag., 480, 118671, https://doi.org/10.1016/j.foreco.2020.118671, 2021.
Sharma, M., Rastogi, R., Arya, N., Akram, S. V., Singh, R., Gehlot, A., Buddhi, D., and Joshi, K.: LoED: LoRa and edge computing based system architecture for sustainable forest monitoring, Int. J. Eng. Trends Technol., 70, 88–93, https://doi.org/10.14445/22315381/ijett-v70i5p211, 2022.
Shuttleworth, W. J. and Wallace, J. S.: Evaporation from sparse crops-an energy combination theory, Q. J. Roy. Meteor. Soc., 111, 839–855, https://doi.org/10.1002/qj.49711146910, 1985.
Speich, M.: Quantifying and modeling water availability in temperate forests: a review of drought and aridity indices, iForest, 12, 1–16, https://doi.org/10.3832/ifor2934-011, 2019.
Spiecker, H. and Kahle, H.-P.: Climate-driven tree growth and mortality in the Black Forest, Germany—Long-term observations, Glob. Change Biol., 29, 5908–5923, https://doi.org/10.1111/gcb.16897, 2023.
van Genuchten, M. Th.: A Closed-form Equation for Predicting the Hydraulic Conductivity of Unsaturated Soils, Soil Sci. Soc. Am. J., 44, 892–898, https://doi.org/10.2136/sssaj1980.03615995004400050002x, 1980.
von Wilpert, K.: Die Jahrringstruktur von Fichten in Abhängigkeit vom Bodenwasserhaushalt auf Pseudogley und Parabraunerde: ein Methodenkonzept zur Erfassung standortsspezifischer Wasserstressdisposition, Selbstverlag des Instituts für Bodenkunde und Waldernährungslehre, ISSN 0344-2691, 1990.
Vindstad, O. P. L., Jepsen, J. U., Ek, M., Pepi, A., and Ims, R. A.: Can novel pest outbreaks drive ecosystem transitions in northern-boreal birch forest?, J. Ecol., 107, 1141–1153, https://doi.org/10.1111/1365-2745.13093, 2019.
Vorobevskii, I.: Supplement materials for publication: High-resolution operational soil moisture monitoring for forests in the Middle Germany, HydroShare, http://doi.org/10.4211/hs.2418c392ccd3466b80b9191baa95d744, 2024.
Vorobevskii, I., Luong, T. T., Kronenberg, R., Grünwald, T., and Bernhofer, C.: Modelling evaporation with local, regional and global BROOK90 frameworks: importance of parameterization and forcing, Hydrol. Earth Syst. Sci., 26, 3177–3239, https://doi.org/10.5194/hess-26-3177-2022, 2022.
Vorobevskii, I., Kronenberg, R., and Luong, T. T.: The Soil Moisture Traffic Light – web platform, https://life.hydro.tu-dresden.de/BoFeAm/dist_bfa_kk/index.html, last access: 5 August 2024a.
Vorobevskii, I., Kronenberg, R., and Luong, T. T.: The Soil Moisture Traffic Light – raw data outputs, https://life.hydro.tu-dresden.de/bfa_out/, last access: 5 August 2024b.
Weis, W., Ahrends, B., Böhner, J., Falk, W., Fleck, S., Habel, R., Klemmt, H.-J., Meesenburg, H., Müller, A.-C., Puhlmann, H., Wehberg, J.-A., Wellpott, A., and Wolf, T.: Standortsfaktor Wasserhaushalt im Klimawandel, Zentrum Wald Forst Holz Weihenstephan, ISBN 3-933506-55-7, 2023.
Wellbrock, N., Bolte, A., and Flessa, H.: Dynamik und räumliche Muster forstlicher Standorte in Deutschland. Ergebnisse der Bodenzustandserhebung im Wald 2006 bis 2008, Thünen Institut, 550 pp., ISBN 978-3-86576-161-3, 2016.
Wessolek, G., Kaupenjohann, M., and Renger, M.: Bodenphysikalische Kennwerte und Berechnungsverfahren für die Praxis, Technische Universität Berlin, Berlin, 2009.
Wösten, J. H. M., Lilly, A., Nemes, A., and Bas, C. L.: Development and use of a database of hydraulic properties of European soils, Geoderma, 90, 169–185, https://doi.org/10.1016/S0016-7061(98)00132-3, 1999.
Xia, Y., Sheffield, J., Ek, M. B., Dong, J., Chaney, N., Wei, H., Meng, J., and Wood, E. F.: Evaluation of multi-model simulated soil moisture in NLDAS-2, J. Hydrol., 512, 107–125, https://doi.org/10.1016/j.jhydrol.2014.02.027, 2014.
Zang, C., Hartl-Meier, C., Dittmar, C., Rothe, A., and Menzel, A.: Patterns of drought tolerance in major European temperate forest trees: climatic drivers and levels of variability, Glob. Change Biol., 20, 3767–3779, https://doi.org/10.1111/gcb.12637, 2014.
Zhou, S., Zhang, Y., Williams, A. P., and Gentine, P.: Projected increases in intensity, frequency, and terrestrial carbon costs of compound drought and aridity events, Sci. Adv., 5, eaau5740, https://doi.org/10.1126/sciadv.aau5740, 2019.
Zink, M., Samaniego, L., Kumar, R., Thober, S., Mai, J., Schäfer, D., and Marx, A.: The German drought monitor, Environ. Res. Lett., 11, 074002, https://doi.org/10.1088/1748-9326/11/7/074002, 2016.
Zweifel, R., Pappas, C., Peters, R. L., Babst, F., Balanzategui, D., Basler, D., Bastos, A., Beloiu, M., Buchmann, N., Bose, A. K., Braun, S., Damm, A., D'Odorico, P., Eitel, J. U. H., Etzold, S., Fonti, P., Freund, E. R., Gessler, A., Haeni, M., Hoch, G., Kahmen, A., Körner, C., Krejza, J., Krumm, F., Leuchner, M., Leuschner, C., Lukovic, M., Martínez-Vilalta, J., Matula, R., Meesenburg, H., Meir, P., Plichta, R., Poyatos, R., Rohner, B., Ruehr, N., Salomón, R. L., Scharnweber, T., Schaub, M., Steger, D. N., Steppe, K., Still, C., Stojanović, M., Trotsiuk, V., Vitasse, Y., Arx, G. von, Wilmking, M., Zahnd, C., and Sterck, F.: Networking the forest infrastructure towards near real-time monitoring – A white paper, Sci. Total Environ., 872, 162167, https://doi.org/10.1016/j.scitotenv.2023.162167, 2023.