the Creative Commons Attribution 4.0 License.
the Creative Commons Attribution 4.0 License.
 | 26 Jul 2024
Flood drivers and trends: a case study of the Geul River catchment (the Netherlands) over the past half century
Athanasios Tsiokanos
Martine Rutten
Ruud J. van der Ent
Remko Uijlenhoet
In July 2021, extreme precipitation caused devastating flooding in Germany, Belgium and the Netherlands, particularly in the Geul River catchment. Such precipitation extremes had not been previously recorded and were not expected to occur in summer. This contributed to poor flood forecasting and, hence, extensive damage. Climate change was mentioned as a potential explanation for these unprecedented events. However, before such a statement can be made, we need a better understanding of the drivers of floods in the Geul and their long-term variability, which are poorly understood and have not been recently examined. In this paper, we use an event-based approach to identify the dominant flood drivers in the Geul. We also employ (1) a multi-temporal trend analysis to investigate their temporal variability and (2) a novel methodology to detect the dominant direction of any trend. Results suggest that extreme 24 h precipitation alone is typically insufficient to cause floods. The joint probability of extreme and prolonged rainfall combined with wet initial conditions (compound event) determines the chances of flooding. Flood-producing precipitation shows a consistent increase in the winter half-year, a period in which more than 70 % of extremely high flows have historically occurred. While no consistent trend patterns are evident in the majority of precipitation and extreme flow trends in the summer half-year, an increasing direction is visible in the recent past.
- Article
(4176 KB) - Full-text XML
-
Supplement
(1991 KB) - BibTeX
- EndNote


In July 2021, western Europe was struck by extreme precipitation, leading to disastrous flooding in Germany, Belgium and the Netherlands (Journée et al., 2023; Kreienkamp et al., 2021). This event ranked among the most devastating natural disasters to hit Europe in the past 50 years, resulting in at least 220 deaths and causing an estimated economic damage of EUR 46 billion (MunichRe, 2022; Mohr et al., 2023). In the Netherlands, the Geul River catchment (344 km2) was the most impacted, with the economic damage of the floods in this area estimated to have exceeded EUR 200 million, constituting approximately 50 % of the total estimated flood damage in the country (Task Force Fact Finding hoogwater, 2021). The event revealed weaknesses in flood risk management. Flood risks were poorly communicated to the inhabitants (Slager, 2023). The flood forecasting system for the Geul was under maintenance; however, even if it had been operational, predictions would not have been accurate (according to the responsible authorities) due to the poor representation of flood-generating processes (Task Force Fact Finding hoogwater, 2021). The Geul catchment is considered to be quite an exceptional and atypical catchment for the Netherlands due to its steep topography (elevations range from 40 to nearly 400 m) and deep soils (tens of meters). A proper understanding of flood drivers in the area is considered to be an important stepping-stone in mitigating risk in the future.
Floods in a catchment are caused by the interaction of meteorological, river system and catchment characteristics (Andrés-Doménech et al., 2015). Hydrological catchment properties can regulate streamflow response (Sharma et al., 2018), for example, extreme precipitation does not always result in floods in various basins around the world (Wasko and Nathan, 2019; Nanditha and Mishra, 2022; Berghuijs et al., 2019). Among the catchment characteristics, antecedent conditions (e.g., soil moisture) can play a crucial role in driving high flows (Bertola et al., 2020; Woldemeskel and Sharma, 2016). Many locations around the world have experienced the effects of wet antecedent conditions on flood risk (e.g., Garg and Mishra, 2019; Bischiniotis et al., 2018; Ivancic and Shaw, 2015; Cao et al., 2019). Especially in lowland catchments, the discharge response can be strongly influenced by the catchment wetness, due to shallow groundwater and its effects on rainfall flow paths (Brauer et al., 2018). As a result, determining the relative contributions of antecedent wetness conditions and extreme precipitation to high river flows is critical.
The identification of the drivers of observed flood events has received increasing attention in the recent literature (e.g., Blöschl et al., 2019; Bertola et al., 2020). Examining relations between trends or seasonality in flood peaks and factors such as extreme precipitation or soil moisture to define flood drivers is well established (Blöschl et al., 2019; Do et al., 2017; Tramblay et al., 2021; Wasko et al., 2020). However, to enhance our knowledge of flood dynamics, an event-based approach has been suggested (Nanditha and Mishra, 2022; Tramblay et al., 2021; Berghuijs et al., 2019). This approach entails identifying the specific drivers behind individual flood events or extremely high flow occurrences. By analyzing the characteristics and circumstances surrounding these events, one can gain valuable insights into the mechanisms and factors that contribute to their intensity and occurrence (Nanditha and Mishra, 2022).
A proper understanding of flood drivers not only includes their identification but also their long-term change. Investigating the changes in variables that can cause a hazard is crucial for managing risk in an effective way (Yang et al., 2021) and can facilitate the planning of reliable and meaningful interventions. Making a critical assessment of the past and current states and providing the long-term trends in hydroclimatic variables play a key role in future projections (Squintu et al., 2021). Trends and changes in the time series of hydrological and climatological data have received attention in catchments and areas across the world (e.g., Blöschl et al., 2017; Do et al., 2017; Hannaford et al., 2021; Murphy et al., 2020).
However, most of the existing trend tests are limited, as they are conducted within fixed time frames, which may fail to accurately capture historical variability. The significance and magnitude of trends can vary considerably based on the chosen study period and duration. To deal with this limitation, multi-temporal trend approaches have been leveraged (e.g., Hannaford et al., 2021; Murphy et al., 2020), considering all possible combinations of start- and end-year periods. Although these analyses have helped to identify temporal variability, a research gap remains in determining the main trend direction, such as consistency or stability, across all studied time frames. Łupikasza (2010) developed criteria for expressing trend stabilities using a fixed 30-year moving window; however, this approach did not fully consider all of the variability (multi-temporal analysis) and, instead, utilized an overlapping period, which can be misleading. As each 30-year window overlaps with the previous and subsequent windows, trends can be missed or misinterpreted because the overlapping periods can obscure them. Thus, using only overlapping periods can lead to artificially smooth trends that do not represent the true (long-term) variability in the data. In addition, the length of the selected moving window might introduce bias in the analysis. Trends over longer periods and with different combinations of start- and end-year periods expressing the full historical variation should also be taken into account in the calculation of the main direction. To address these limitations, our study builds on the multi-temporal approach and develops a methodology capable of identifying and assessing trend consistency in multi-temporal analyses, considering the complete range of variability. This new method is anticipated to deepen our understanding of flood driver trends in the Geul River catchment, with potential applicability across broader contexts.
In summary, the Geul River catchment is an interesting example of a hilly catchment in northwestern Europe, with unique hydrological characteristics that are shaped by the underlying geology, topography and land use. The recent floods have shown that there is a need for further research into the drivers of flooding in the area, particularly in the context of climate change. Specifically, the role of extreme precipitation and antecedent conditions as potential flood drivers and their long-term variability remain to be examined. Therefore, our objective is to detect the primary drivers of high-flow/flood events in the Geul River catchment and analyze their long-term trends. To achieve these objectives, we address the following scientific questions that are crucial for our understanding of floods in the Geul River catchment:
- a.
What are the dominant flood drivers in the Geul River catchment in different seasons?
- b.
What are the trends (temporal variability and consistency) in the flood-producing precipitation and extreme discharges in the catchment?
To identify the dominant flood drivers, we use an event-based approach. In addition, we utilize a multi-temporal trend analysis to investigate the temporal variabilities in the trends and introduce a new methodology to detect the dominant direction (i.e., consistency) of a trend. Although our study focuses on the Geul area, it is essential to highlight that our combined approaches (integrating an event-based approach with multi-temporal analyses) and proposed trend consistency method are applicable beyond this specific case. Thus, our aim is to offer valuable insights for the Geul area while avoiding constraining the scope of our methods and findings to a singular case study.
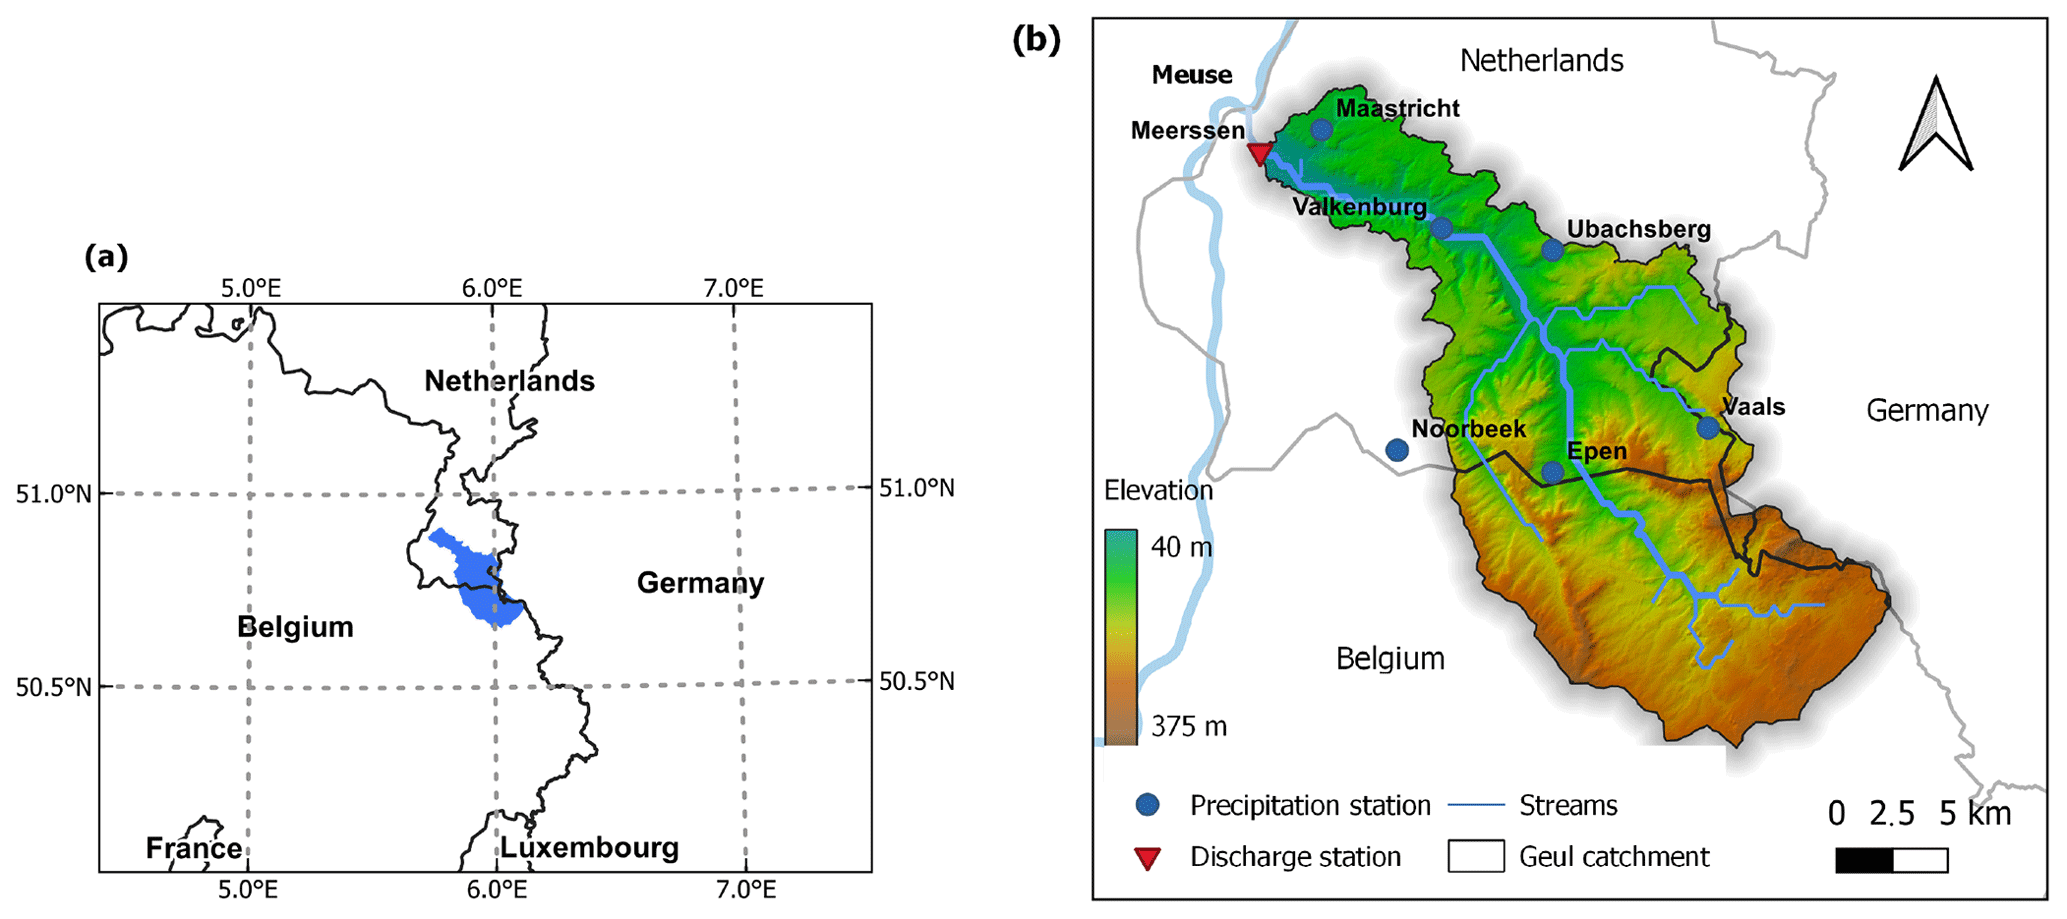
Figure 1(a) Location of the Geul River catchment (shaded blue area) and (b) elevation map of the study catchment, including the location of precipitation stations and the discharge observation station at the outlet.
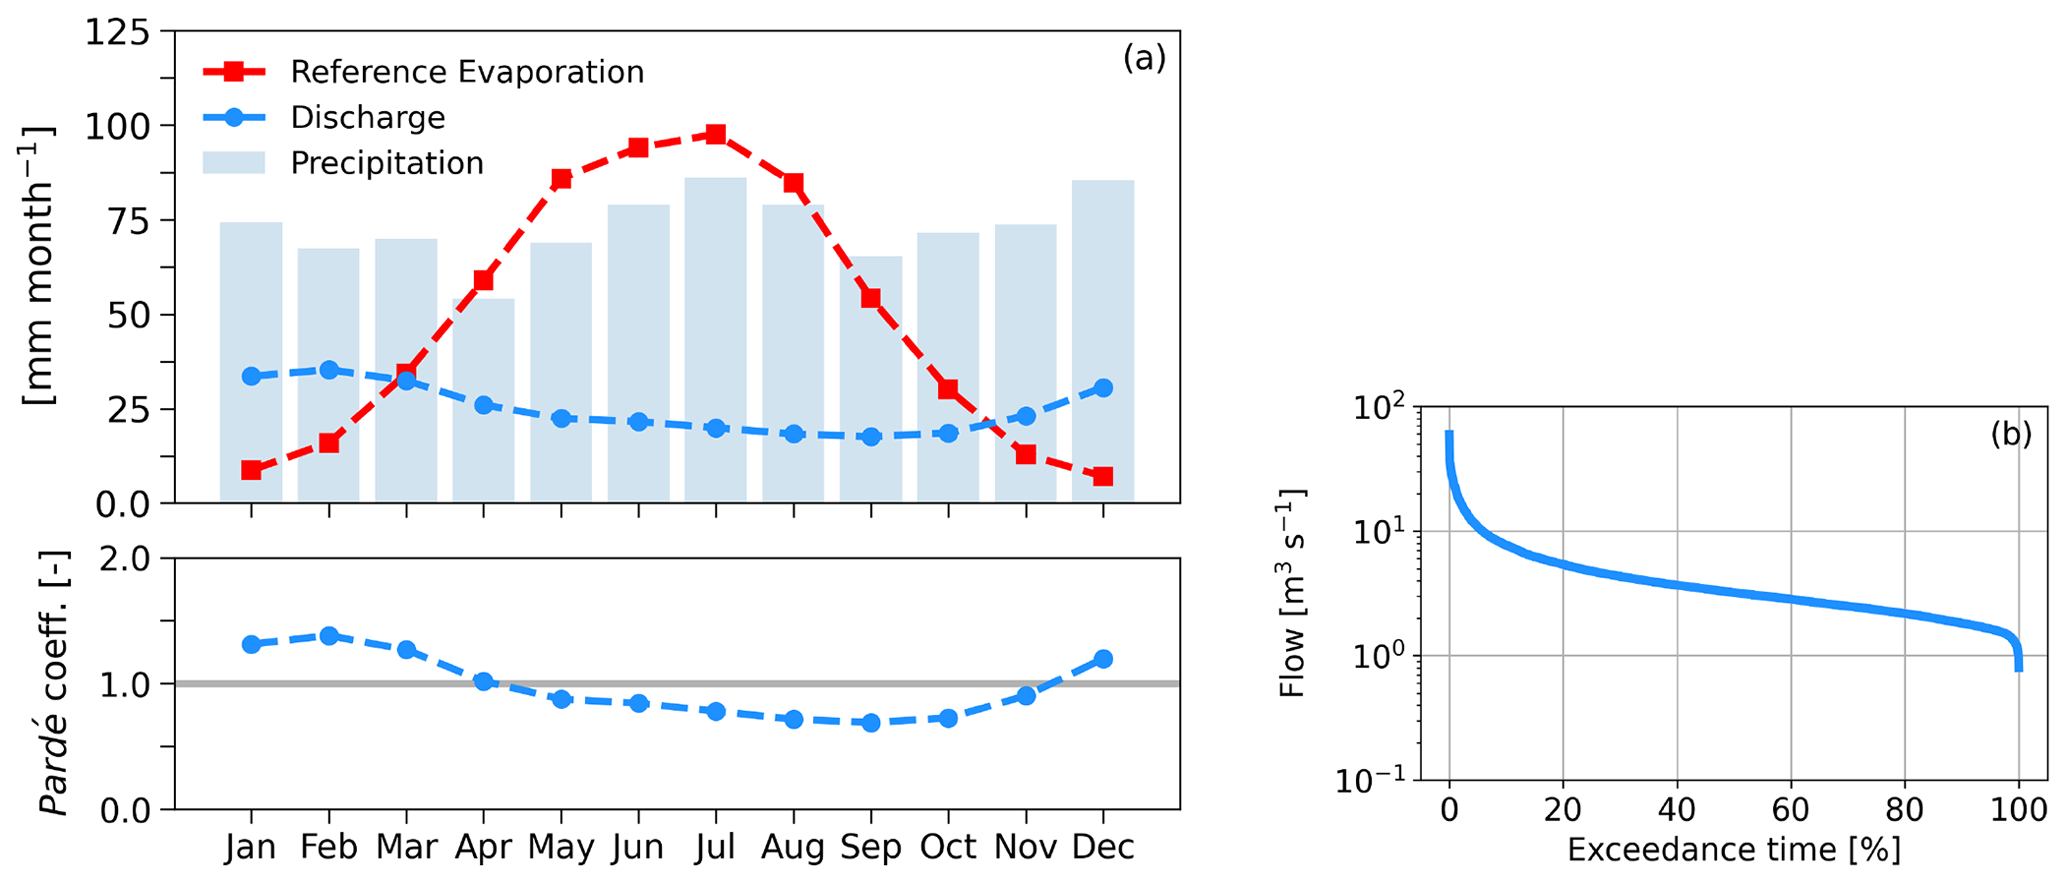
Figure 2The upper subpanel of panel (a) shows the monthly averages for precipitation (averaged using Thiessen polygons), reference (Makkink) evaporation (obtained from the Maastricht meteorological station) and discharge in the Geul catchment; the lower subpanel presents flow regimes of the Geul based on the Pardé coefficient, defined as the ratio of the average monthly discharge to the average annual discharge. Panel (b) shows a flow duration curve along the Geul based on the mean daily discharge. All graphs are produced using time series from 1970 to 2021.
2.1 Study area
The Geul River is an important tributary of the Meuse and is located in the Netherlands, Belgium and part of Germany, close to the three-border region (Fig. 1). The total area of the Geul catchment is approximately 344 km2. The Geul drops about 250 m over approximately 60 km, making it one of the few steeply sloping rivers in the Netherlands. The Geul River has an average discharge of approximately 3.2 m3 s−1 (at the outlet of the catchment) and is mainly rain-fed. As a consequence, its discharge can change dramatically during flood and drought events (e.g., ranging from 1 m3 s−1 during drought periods to more than 40 m3 s−1 during floods). The response time of the catchment is in the order of 1–2 d (Asselman et al., 2022). The annual average precipitation is approximately 870 mm yr−1 and is rather uniformly distributed over the year (see Fig. 2a). Average annual discharge at the outlet of the catchment and potential evaporation are about 307 and 585 mm yr−1, respectively, based on time series from 1970 to 2021. The flow regimes in the Geul do not show large variations (Fig. 2). On average, the equal distribution of runoff in the Geul throughout the year is due to the effect of groundwater storage provided by large chalk aquifers in the catchment (Tu, 2006). The long-term evaporative index is approximately 0.67 and the runoff ratio is 0.35.
2.2 Data sets
Streamflow time series at the outlet of the catchment (Meerssen station), were made available by the local water authority, Waterschap Limburg, including 15 min measurements from 1970 up to August 2021. From 1970 to 2011, measurements were taken using a measuring weir; however, since 2011, discharges have been measured using acoustic Doppler current profilers (ADCPs) (van der Deijl, 2023). Historical flood event data (i.e., date of occurrence) are based on Thewissen (2022), who performed a local newspaper search using Delpher, a Dutch database containing digitized texts from newspapers, books and magazines. These collections are curated by scientific organizations, libraries and heritage institutions. Thewissen (2022) obtained the data through an iterative process that involved optical character recognition (OCR) and manual scanning. In this research, a flood is defined as surpassing the bankfull capacity. For detailed information about the search methodology, please refer to Thewissen (2022).
Records of 24 h precipitation from five stations located in (or near) the Geul River catchment are used (see Fig. 1). The data used in this study come from the Royal Netherlands Meteorological Institute (KNMI) manual rain gauge network. Volunteer observers operate the rain gauges on a 24 h basis (daily, from 08:00 until 08:00 UTC the following day). In addition to the volunteer KNMI stations, daily (calendar day) measurements from the automated meteorological station at Maastricht are used. Data from automated stations are also available on an hourly basis; however, the daily scale is used in order to have the same resolution for each station. The time series are complete (except for 3 missing months at Noorbeek) and are considered to be of high quality, as KNMI performs regular quality tests (Buishand et al., 2013). Days with extremes were checked, and it was found that all of them occurred during well-known high-precipitation or flood events.
The available precipitation record periods slightly differ between the selected stations and mainly start in the 1950s, except the new Epen station, which has a record from 1981 onward. Specifically, stations at Vaals, Valkenburg and Noorbeek have a record from 1951 onward, while the available time series at the Maastricht and Ubachsberg stations start from 1958 and 1955, respectively. Due to its shorter available period, Epen station is excluded from the analysis. The precipitation stations located in the uppermost regions of the catchment in Belgium were not taken into account due to their limited temporal coverage, lack of alignment with the discharge (and KNMI) data and unsuitability for trend analysis.
Another important factor to consider when analyzing meteorological time series, and especially trends, is data (in)homogeneity. Trends represent the long-term changes in the data over time caused by natural/climate variability, while inhomogeneities represent changes in the data that are not part of the underlying trend. There are several types of modifications that can occur and can cause significant non-climatic alternations (inhomogeneities) in the data, especially in long time series, such as changes in the location of the measuring station, differences in the manner and the procedures (e.g., measuring frequency), or changes in the instruments or tools. Performing statistical tests for homogeneity on precipitation data measured at daily frequencies is challenging or practically infeasible (Łupikasza, 2010). This can be attributed to the fact that daily time series show strong random variations. For this reason, the precipitation time series were aggregated to monthly sums and then tested using two well-known homogeneity tests: the standard normal homogeneity test (SNHT) (Alexandersson, 1986; Alexandersson and Moberg, 1997) and Buishand's U test (Buishand, 1984). Both tests were applied at a significance level of 5 % (α = 0.05). The test results showed that the data time series were free of significant errors and that no inhomogeneities were detected.
2.3 Flood driver detection
2.3.1 Extreme indicators
Hydrological years are used instead of calendar years to ensure a more accurate representation of the frequency and intensity of extreme events that may occur within a particular hydrological regime. Similarly to Tu (2006) and Sperna-Weiland et al. (2015), we define a hydrological year from November to October, for the study area. Half-year hydrological winter (from November to April) and summer (from May to October) are also considered.
Two types of flood data time series are used: annual maxima (denoted as Qmax), including winter and summer yearly maxima (denoted as QW,max and QS,max, respectively), and extremely high flows using the peaks-over-threshold (POT) method (Haan, 2002). The maximum daily discharge is taken from the 15 min discharge data, and hydrological years with over 20 % missing daily values are omitted from the analysis. Consequently, the years 1971, 1974 and 1990 have been excluded from the Qmax times series. For identifying extremely high flows, we use the 99th percentile threshold (denoted as Q99; Nanditha and Mishra, 2022) extracted from the maximum daily discharge time series from 1970 to 2021, excluding daily missing values. We use only extremely high events separated by a time frame of 5 d to ensure that the selected high flows are independent and do not belong to the same flood wave.
Floods are generally caused by a combination of initial moisture conditions and precipitation. To explore the probable causes of high-flow episodes, we employ six indicators to assess precipitation and antecedent soil moisture levels: extreme precipitation (denoted as P99), multiday precipitation (denoted as PMD), wet antecedent conditions (denoted as PWAC), P99 combined with PWAC (denoted as Compound I), PMD combined with PWAC (denoted as Compound II), and P99 and PMD combined with PWAC (denoted as Compound III). These indicators allow us to examine the relative role of extreme precipitation; prolonged, heavy rainfall; extreme soil moisture conditions; and compound extremes in generating high flows.
We estimate P99 as the events that exceed the 99th percentile of wet days (days with more than 1 mm of precipitation) (Nanditha and Mishra, 2022). We define PMD events using the 95th percentile of all k-day accumulated (rolling sum) precipitation time series (Nanditha and Mishra, 2022). To clarify the PMD definition, we ensure that the 95th percentile of multiday rainfall consistently surpasses the 99th percentile of the 24 h rainfall on wet days, aiding in distinguishing between P99 and PMD. In this way, usually more than 2 d of precipitation are necessary to exceed the k-day 95th percentile and trigger PMD, allowing the assumption that PMD can be used as a proxy for heavy, prolonged events. As we use the 95th percentile of all k-day accumulated (rolling sum) precipitation to define PMD and employ “daily” values, this threshold is expected to be exceeded in prolonged events irrespective of the selected duration, indicating that we have prolonged (multiday) heavy events (larger than the 95th percentile of the selected k-day accumulations), although not as extreme as the 24 h P99, which helps us examine the relative contributions of extreme precipitation and prolonged, heavy rainfall in generating high flows. However, in rare cases, 24 h precipitation can simultaneously trigger both P99 and PMD especially for the lower k-day accumulation periods, which is unavoidable. Thus, for each of the five precipitation stations considered, we calculated the PMD 95th percentile for different durations. It was found that a duration longer than 4 d is required for this percentile to surpass the 99th percentile used in defining P99. Finally, to determine the most suitable k-day PMD duration for k ≥ 4, we evaluate the PMD probability preceding high flows across multiday precipitation durations of up to 10 d (see Sect. 3.1.1).
Furthermore, we use the antecedent precipitation index (API; the ratio of the 30 d pre-event precipitation to the long-term average for the same period), as developed by Marchi et al. (2010), to assess the initial catchment wetness and get an estimate of the initial (soil) conditions. Marchi et al. (2010) classifies antecedent moisture conditions as follows: (1) dry, 0 < API ≤ 0.5; (2) normal, 0.5 < API ≤ 1.5; and (3) wet, API > 1.5. PWAC corresponds to API values higher than 1.5 (Marchi et al., 2010). The API's effectiveness in assessing initial soil wetness conditions has been documented, for instance, by Marchi et al. (2010), who demonstrated its strong agreement with predictions from a continuous soil moisture accounting hydrological model (Norbiato et al., 2008). However, as the index is based solely on precipitation, its sensitivity to evaporation is further discussed in Sect. 3.1.5. This is done by computing the 30 d pre-event effective rainfall, which entails subtracting reference evaporation obtained from the Maastricht station from the precipitation measurements.
2.3.2 Monthly distribution of extremes
In order to get a rough indication of the effects of extreme rainfall on high flows, we estimate the monthly distribution of P99, PMD, annual maximum precipitation (denoted as Pmax) and high flow extremes (i.e., Q99 and Qmax) as well as past flood events (as defined in Sect. 2.2). Despite the fact that the monthly distribution of PWAC events cannot be directly related to the monthly distribution of high flow extremes, as PWAC events indicate wetter-than-average conditions any time of the year, their relative frequencies can provide useful insights. For this reason, we also calculate the monthly frequencies of PWAC events. To achieve this, each daily time step in the precipitation series is treated as an individual event. This involves summing the precipitation amount for each day over the previous 30 d and then dividing this sum by the 30 d long-term average for the same period across the entire time series. In this way, an API index per day is obtained.
The use of all-day percentiles for discharge (Q99) and wet-day percentiles for rainfall (P99) may lack statistical robustness, primarily because there could be a potential increase in the number of wet days over the study period (Schär et al., 2016). To address the potential issue, a trend test with respect to the number of wet days per year and station was conducted using the nonparametric Mann–Kendall (M–K) (Kendall, 1955; Mann, 1945) test at a significance level of 0.05. The analysis did not reveal any significant trends in the number of wet days.
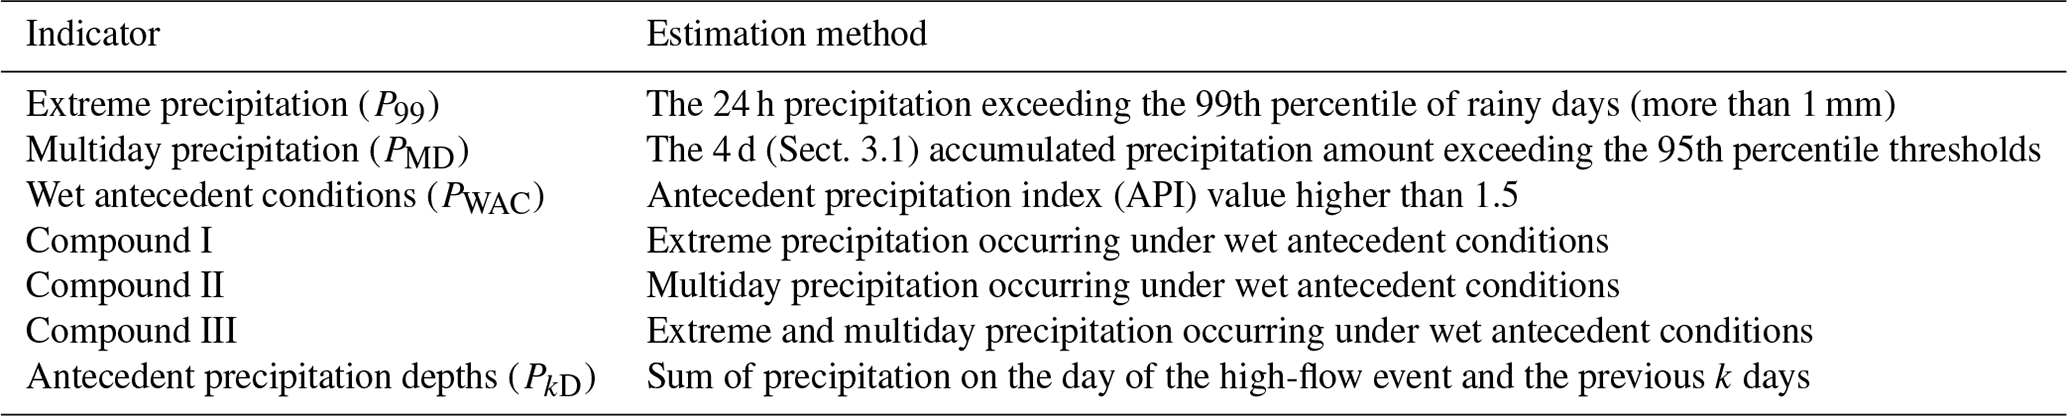
Table 1Extreme indicators used to identify the main flood drivers. The initial six indicators are used to calculate probabilities preceding high-flow episodes, whereas the last indicator is correlated with high flows.
2.3.3 Event-based analysis
After the seasonal assessment of the extreme indicators and high-flow events, an event-based approach is followed to detect the predominant flood driver(s) in the catchment. Specifically, we calculate the likelihood of the six precipitation indicators (i.e., P99, PMD, PWAC, Compound I, Compound II and Compound III) preceding selected high-flow episodes (i.e., Qmax) in order to determine the primary flood cause. We use the Qmax events instead of the Q99, as they are better defined for identifying flood drivers including all major flood events, also considering that the P99 is calculated from a significantly longer data series than the Q99. We conduct a comprehensive analysis of each high-flow event, examining the frequency of occurrence for each indicator before a Qmax event. Specifically, we determine how many times an indicator occurred in relation to the total number of Qmax events, effectively calculating its likelihood of contributing to such occurrences. For instance, if P99 is the main flood cause in the catchment, then P99 is highly likely to occur during the duration of the flood (precipitation amount on the same day) or within 1 d before the commencement of the event. Here, we use a 2 d interval (i.e., precipitation on the same or previous day of the flood event) for two main reasons: (1) the lag time of the catchment and (2) to eliminate errors due to the use of daily values (e.g., a high-flow event may occur early in the morning due to P99 from the previous day). For Compound-I events (P99 under PWAC), we verify whether the P99 under PWAC occurred either on the event day itself or 1 d prior to the event. This approach guarantees that the P99 consistently occurs under preexisting wet conditions. Thus, we establish the requirement for a P99 to appear under PWAC for a compound event, thereby preventing scenarios in which a P99 occurring 1 d prior to the Qmax under normal circumstances could increase the API on the day of the Qmax, leading to PWAC. In a similar manner, we calculate the probability of Compound III preceding the Qmax events: PMD and P99 under PWAC on the day of the event or 1 d before. For the remaining indices, PMD and PWAC, we simply verify whether these indicators are present on the day of the event.
As we directly compare the likelihood of each indicator leading to Qmax, it is important to note that the comparison among different flood drivers may be affected by the rarity of certain events. The total number of flood indicators varies, particularly for the most extreme ones, such as P99, Compound I and Compound III. For instance, in some years, a P99 event might not occur; therefore, it cannot precede Qmax. To account for this effect, the reverse scenario is also considered: given that a driver has occurred, what is the relative frequency of it being followed by a Qmax event. Thus, we calculate the number of separate hydrological years in which a driver is observed and determine how often Qmax is also observed within these instances. Additionally, we provide general information about the frequency of the different drivers occurring, regardless of whether Qmax has occurred, along with their corresponding discharge values. In this reverse extreme-precipitation-based analysis, the highest discharge is extracted either on the day of the indicator or the next day for P99, Compound I and Compound III, while the discharge value on the day of the event is taken for other indices to ensure alignment with the extreme-discharge-event-based analysis.
Antecedent catchment wetness and precipitation depths are crucial factors for floods in terms of magnitudes and volumes. In addition to the aforementioned flood indicators, we delve deeper into this relationship by employing the nonparametric Spearman rank-order correlation method to correlate the half-year maximum discharge time series (QW,max and QS,max) with their k-day antecedent precipitation depth (denoted as PkD, where k = 1, 3, 5, 7, 10, 15, 30 and 40 d; Tu, 2006). The antecedent precipitation depths are computed by summing the precipitation on the day of the high-flow event and the previous k days (Tu, 2006). Table 1 provides an overview of all of the different flood indicators used in this study as well as their corresponding definitions.
One crucial concern is the timing difference in the measured daily values, i.e., calendar days for discharges and 24 h sums from 08:00 UTC for precipitation. The reported time/date in the precipitation time series (for the manual rain gauge network; Valkenburg, Ubachsberg, Noorbeek and Vaals stations) is the end time of observation. For this reason, the time of occurrence of the max daily discharge is checked: if the time of the maximum 15 min discharge values is observed to be between 00:00 and 08:00 UTC, the calendar day of this event is reported; otherwise, the next day is considered to be the date of occurrence of the event for the (manual rain gauge) precipitation time series. In this way, we ensure the agreement between the precipitation and discharge time series.
2.4 Trend analysis
The temporal variability and the trends in the aforementioned potential flood drivers (i.e., P99, PMD and PkD) are investigated. Trends in PkD are based on the highest k-day total precipitation per year (a summation moving window with different lengths is applied over the whole time series from the 1950s to 2021, and the annual maxima are extracted). In contrast to the definition of P99 in Sect. 2.3.1, we use the 95th percentile, as events that exceed the 99th percentile are extremely rare and result in many zero values in the time series, especially in winter periods, making the trend analysis unstable. The new index is denoted as P95 and represents the annual total precipitation from days exceeding the 95th percentile. Similarly to P99, the 95th percentile is calculated using the whole range of the time series and only wet days. Finally, the PMD trends are investigated by summing the annual amount of 4 d accumulated precipitation that exceeds the 95th percentile thresholds (of the 4 d rolling sum). The used precipitation trend indices are similar to those defined by ETCCDI (Expert Team on Climate Change Detection and Indices) and have been frequently applied (Klein Tank et al., 2002; Dunn et al., 2020). The aforementioned precipitation indices are calculated for winter and summer periods. In addition, trends in the half-year maximum discharges (QW,max and QS,max) are examined in order to detect possible consequences of extreme precipitation on extreme streamflows. We use the nonparametric M–K test to detect significant trends. To this end, a Python package that contains all of the types/modifications of the M–K test, as developed by Hussain and Mahmud (2019), is used. The original M–K test is employed on both the precipitation indices and discharge time series, instead of a modified M–K version that accounts for the influence of serial correlation on trend calculations. This choice is guided by the assumption that the precipitation time series exhibit no significant serial correlation and that the annual maximum discharge values are typically considered to be uncorrelated by construction.
The statistical significance and direction of the trends in the multi-temporal approach are used in order to determine the temporal consistency of a trend for each precipitation index. We express consistency as the percentage of time (t) during which trends are statistically significant. Trends that are significant at α = 0.2 (Łupikasza et al., 2011) are defined as statistically significant trends. As precipitation is characterized by strong temporal and spatial variation, the statistical significance levels can be lower compared with other climatic variables (Łupikasza et al., 2011). In addition, the large number of calculated trends (more than 850 for most stations) allows the use of lower significance levels for expressing stabilities or consistencies. In a multi-temporal approach, it is preferable to focus on the direction and intensity of the trends, rather than whether they surpass a strictly predetermined and somewhat arbitrary level of significance (Hannaford et al., 2013). A trend in an index is considered to be inconsistent, weakly consistent, consistent or strongly consistent according to the following criteria: (1) inconsistent, 0 % < t ≤ 15 % or the numbers of significant increasing and decreasing trends are similar (i.e., the percentage of significant trends in the same direction ranges between 40 % and 60 %); (2) weakly consistent, 15 % < t ≤ 25 % and more than 60 % of significant trends are in the same direction; (3) consistent, 25 % < t ≤ 45 % and more than 60 % of significant trends are in the same direction; and (4) strongly consistent, t > 45 % and more than 60 % of significant trends are in the same direction.
3.1 Identification of the dominant flood driver
3.1.1 Selection of the PMD duration
In this section, we explore the sensitivity of the probability of PMD (95th percentile of all k-day accumulated time series; see Sect. 2.3.1) occurrences before high flows (i.e., Qmax) with respect to the duration of multiday precipitation. Our analysis reveals that a 4 d duration is the most suitable for defining PMD, as the average relative frequency of Qmax preceded by this duration is the highest compared with other accumulation periods (i.e., PMD durations of 5, 6, 7, 8, 9 and 10 d; Table 2). This finding aligns with the hydrological behavior of the catchment, as documented by Asselman et al. (2022). Additionally, we observe that the average relative probability of PMD decreases by approximately 10 % when the duration increases from 4 to 5 d. However, for durations longer than 5 d, the frequency of PMD preceding high flows remains relatively stable. In light of these results, the 4 d duration is utilized as the standard for PMD definition.
Table 2Mean relative frequencies (for all stations) of high-flow events preceded by multiday precipitation (PMD) for different accumulation periods.
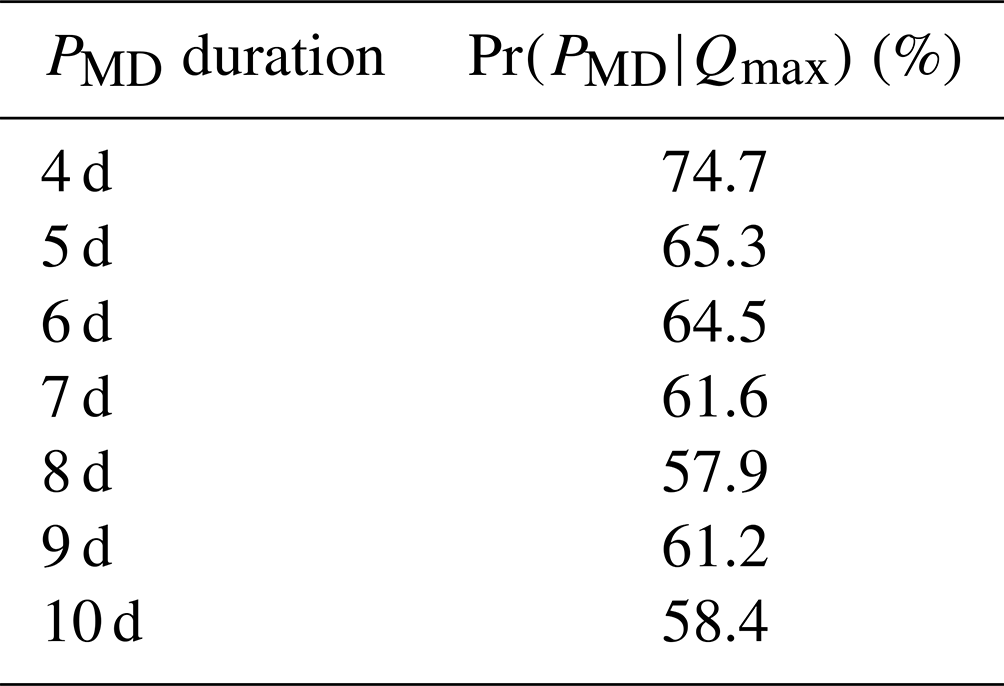
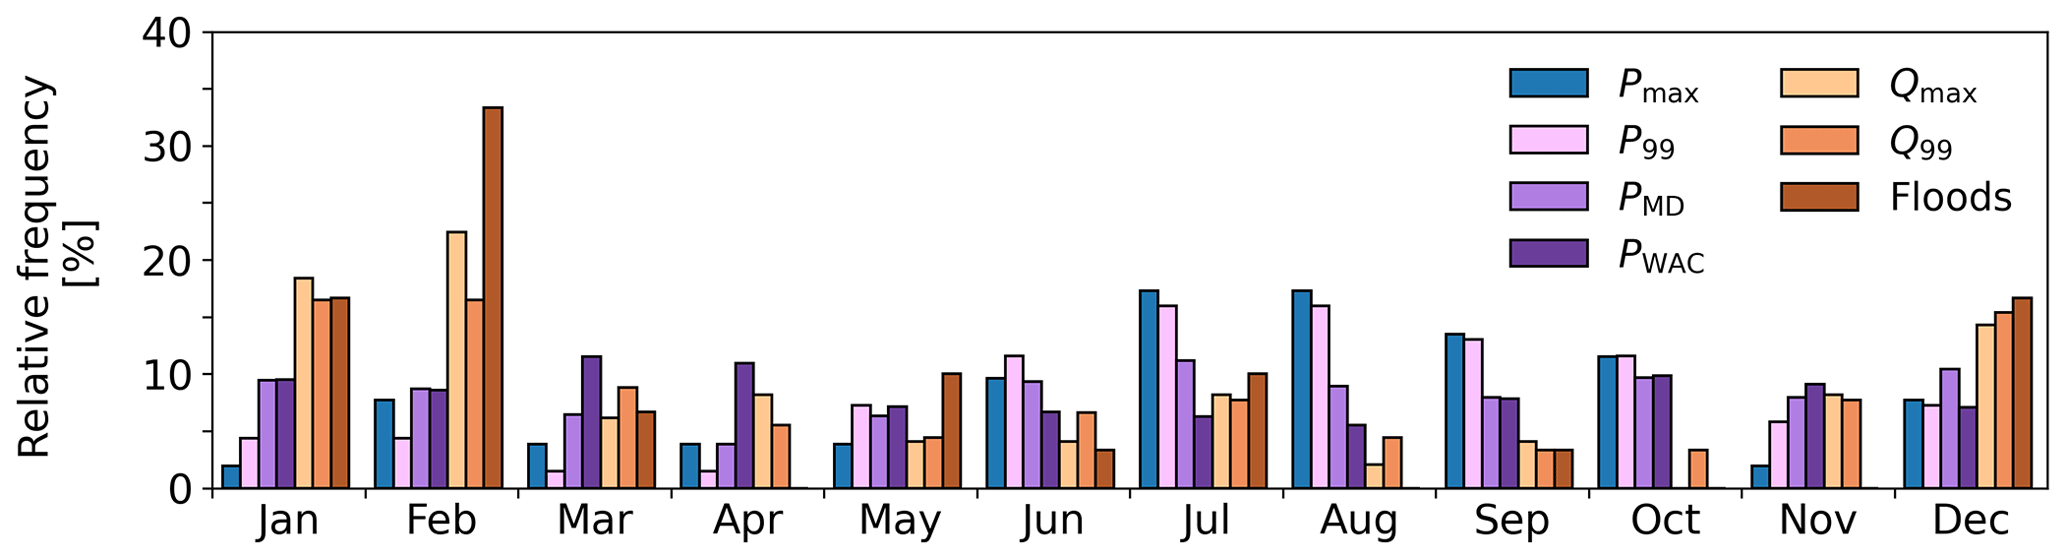
Figure 3Monthly distribution of annual maximum precipitation (Pmax), extreme precipitation (P99), multiday precipitation (PMD) and wet antecedent condition events (PWAC) at the Vaals station as well as annual maximum discharge (Qmax), extremely high flows (Q99) and past flood events in the Geul.
3.1.2 Seasonality of extreme indicators
The seasonal distributions of extreme precipitation, high-flow events and flood drivers indicate that extreme precipitation, although more frequent during summer months, does not consistently coincide with high-flow events (Fig. 3). Specifically, Fig. 3 shows the seasonal distribution of extreme precipitation (P99; 69 events – about 0.4 % of the daily time series from 1970 to 2021), annual maximum precipitation (Pmax; 52 events), multiday precipitation (PMD; 933 events – 5 % of the 4 d accumulated time series from 1970 to 2021) and wet antecedent condition events (PWAC; 2705 events – 14 % of the 30 d accumulated time series from 1970 to 2021) at the Vaals station, as an example, as well as high-flow events (Qmax and Q99; 49 and 91 events, respectively) and past flood events (30 events) in the catchment. General information on the frequency of the flood drivers, averaged for all rainfall stations, is provided in Table 5. An opposing seasonality is visible between extreme precipitation and high-flow events. The relative frequencies of P99 and Pmax in half-year summer periods are 75 % and 73 %, respectively, while these percentages are only 22 % and 29 %, for the Qmax and Q99 events, respectively. This pattern is also verified by the past flood events: only 26 % of them occurred during half-year summers. PMD appears to occur with relatively similar frequencies throughout the year. Similar to PMD, PWAC shows an equal distribution over all seasons, as expected. As precipitation is rather uniformly distributed all over the year (see Fig. 2a), wetter-than-average conditions can occur in any season, and the monthly distribution of PWAC cannot be directly linked to the seasonal distribution of high flows. However, wetter conditions (indicated by higher API values) are expected to have different effects on high flows, and a closer examination of the specific condition before every high-flow event is necessary. Overall, our findings indicate that extreme 24 h precipitation is not the most critical driver of high flows. Although extreme precipitation events tend to occur more frequently during the summer months, high-flow and flood events do not align with these periods. Factors such as antecedent soil moisture conditions and the timing, duration and intensity of rainfall events may exert a more significant influence on high-flow generation in the catchment. Therefore, greater attention is required with respect to understanding these factors.
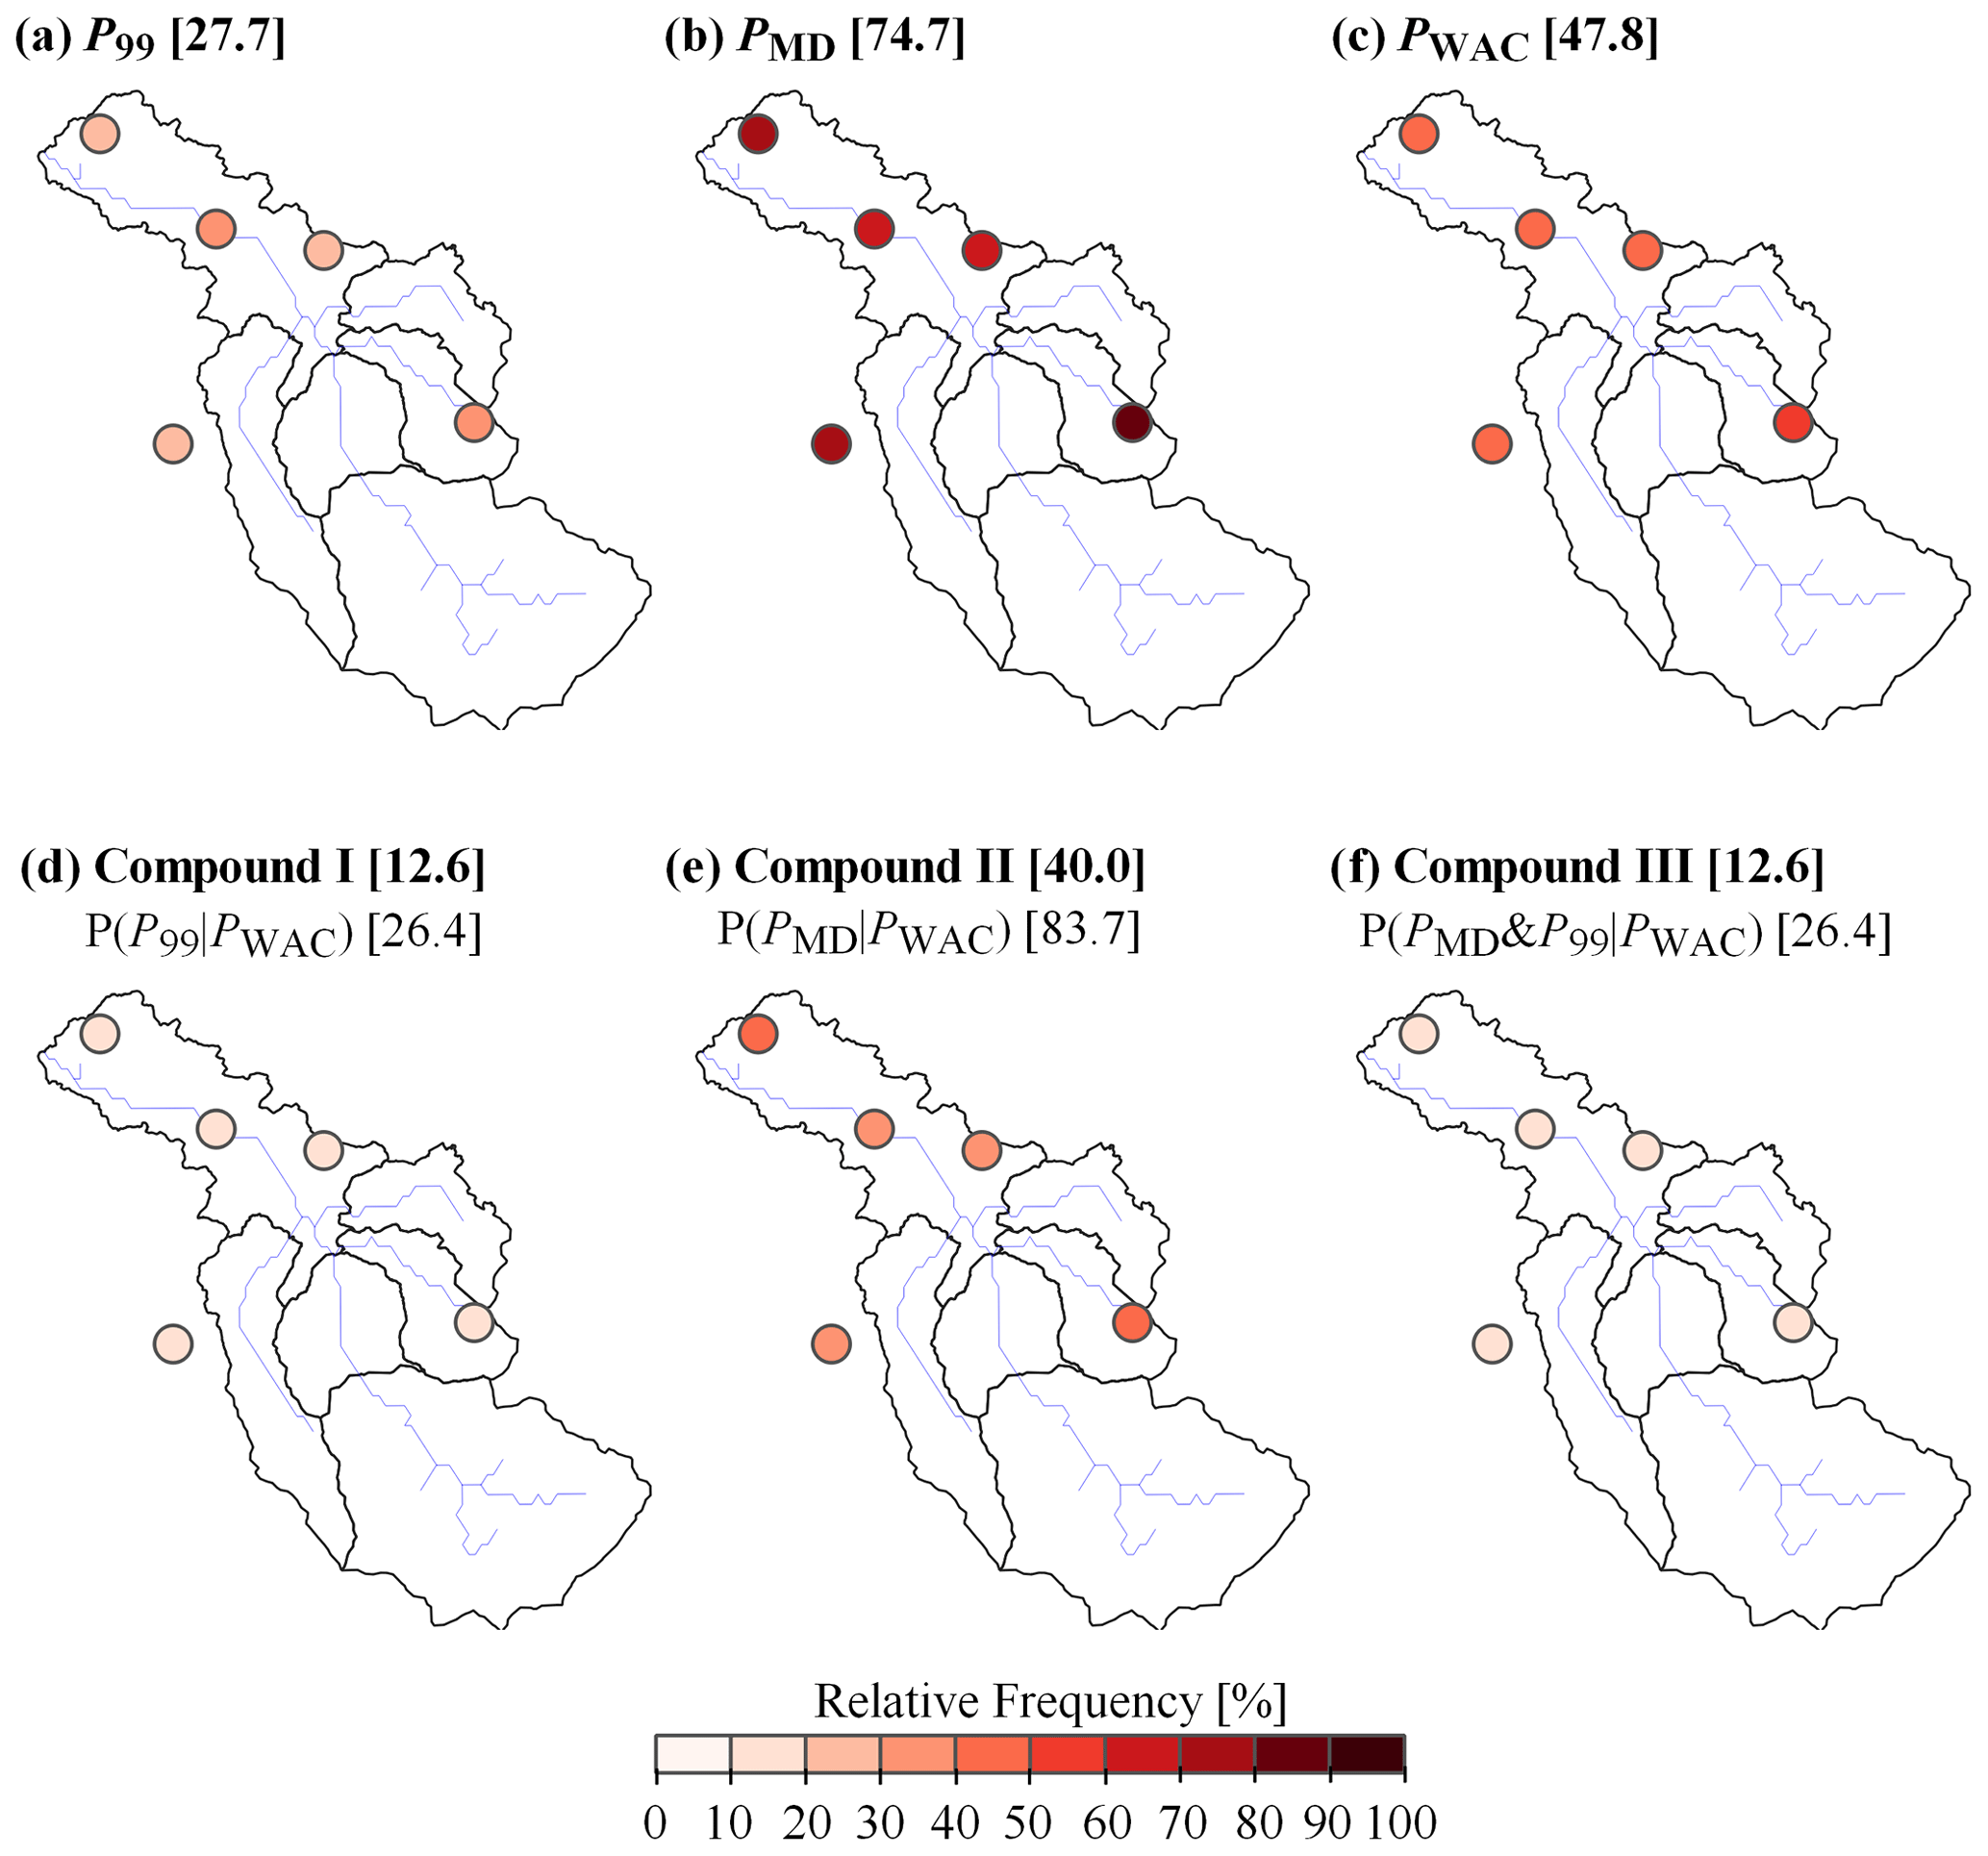
Figure 4Relative frequencies of Qmax being preceded by (a) extreme precipitation (P99), (b) multiday precipitation (PMD), (c) wet antecedent conditions (PWAC), (d) extreme precipitation under wet antecedent conditions (Compound I), (e) multiday precipitation under wet antecedent conditions (Compound II) and (f) extreme and multiday precipitation under wet antecedent conditions (Compound III), with respect to the total Qmax events (count of a driver leading to Qmax in the Qmax cases divided by the total number of cases). The mean relative frequency (in %) for all rainfall stations is reported in brackets. The mean conditional probabilities of P99 and/or PMD preceding Qmax given that PWAC precedes Qmax are also reported per compound indicator.
3.1.3 Extreme-discharge-event-based analysis
Figure 4 illustrates the relative frequencies of the introduced indicators (see Table 1) preceding high-flow episodes (i.e., Qmax), as described in Sect. 2.3.3. In approximately 75 % of the Qmax cases, a PMD precedes high-flow events (Fig. 4b), while the corresponding percentage for PWAC is approximately 48 % (Fig. 4c). In most cases, PWAC should be followed by PMD in order to generate high flows (similar percentages between PWAC, as seen in Fig. 4c, and Compound II, as seen in Fig. 4e). This is also visible in the calculation of the conditional probability of PMD preceding Qmax given that PWAC precedes Qmax, which is approximately 84 % (Fig. 4e). In other words, given that PWAC precedes Qmax, there is an 84 % chance that PMD will be followed by Qmax. The percentages between Compound-I and Compound-III events (Fig. 4d and f, respectively) are the same, showing that each time a Qmax is preceded by P99, it also preceded by PMD. This effect, in most cases, is caused by the high amount of precipitation that fell on the day of the event or the previous day (definition of P99), which also increases the 4 d precipitation (higher than the PMD 95th percentile).
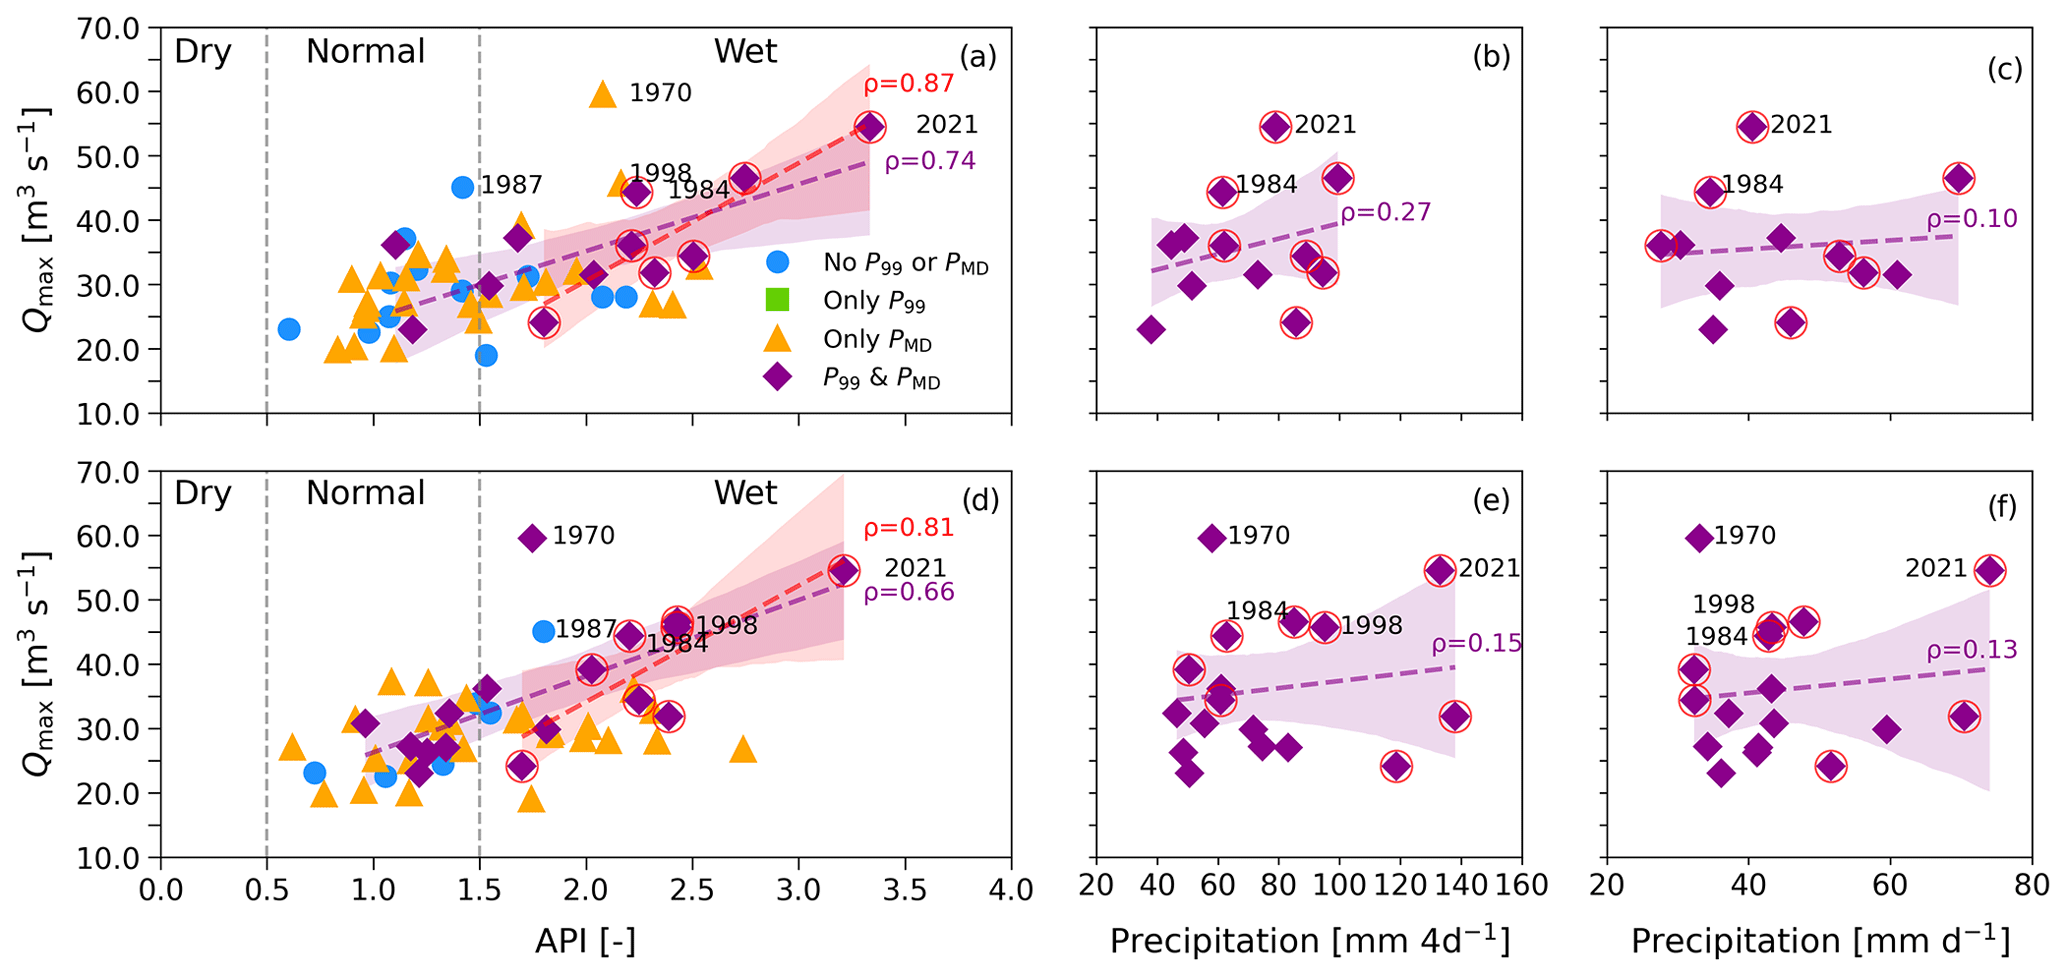
Figure 5Annual maxima events (Qmax) and their antecedent precipitation index (API) values at Maastricht (a) and Vaals (d), including their preceding extreme indicators. Orange markers denote events preceded solely by PMD, green markers indicate events preceded exclusively by P99, purple markers represent events preceded by both P99 and PMD (thus classified as both P99 and PMD in Fig. 4), and blue markers signify events without any extreme precipitation indicator preceding them. Purple and orange markers within the “Wet” classification, along with PWAC, P99 and/or PMD classifications, are also classified as Compound-II events in Fig. 4. Discharge events preceded by Compound III (and thus Compound I and II) are indicated with red circles. The top five floods during the study period are shown with their year of occurrence. The dashed purple line represents the linear fit, using the least-squares approach, between the API of the high-flow events preceded by P99 and PMD and their respective Qmax values, while the red dashed line represents the linear fit between the API of the Compound-III events and their Qmax. The total 4 d precipitation versus Qmax is presented for these events at Maastricht (b) and Vaals (e); the highest 24 h precipitation (highest of the two P99 amounts on the day of the event or the previous day) versus Qmax at Maastricht (c) and Vaals (f) is also shown. The shaded area shows the 95 % confidence intervals for the fits, and the Pearson correlation coefficients (ρ) are also reported.
Figure 5 shows the Qmax events plotted against their API values, including their preceding precipitation indicators (i.e., P99 and PMD) at the Maastricht and Vaals stations. This figure actually presents how the different events are classified based on the previously defined indicators (Table 1), emphasizing the influence of wet conditions on high flows and exploring correlations between Qmax and associated precipitation amounts (P99 or PMD). For example, all PMD markers (both orange and purple markers), irrespective of their wetness (API), are classified as PMD and, thus, used to calculate the relative frequencies of Qmax being preceded by PMD in Fig. 4b. Furthermore, Fig. 5 reveals overlapping event classifications, where one event can align with multiple indicators at the same time, e.g., a Compound-III event is classified as PWAC, P99, PMD, Compound I and Compound II, while a P99 event can concurrently be PMD. A Qmax event preceded by P99 may appear in the “Wet” classification without being classified as Compound I. This is because we specify that P99 should occur under existing PWAC to be classified as Compound I. This condition is imposed to prevent a P99 event from inflating the API the day before the event, potentially leading to an API > 1.5 on the day of the event (see Sect. 2.3). For example, the 1970 event at Vaals (Fig. 5d), which is preceded by P99, PMD, PWAC and Compound II, is not classified as Compound I or Compound III.
Table 3Top five floods that occurred in the catchment during the study period, their rainfall accumulations and an estimate of their initial conditions based on the API. The day with the highest recorded discharge is considered to be the date of occurrence of the event. The different precipitation sums (and subsequently API values) are based on daily precipitation records at the Maastricht (first value) and Vaals (second value) stations.
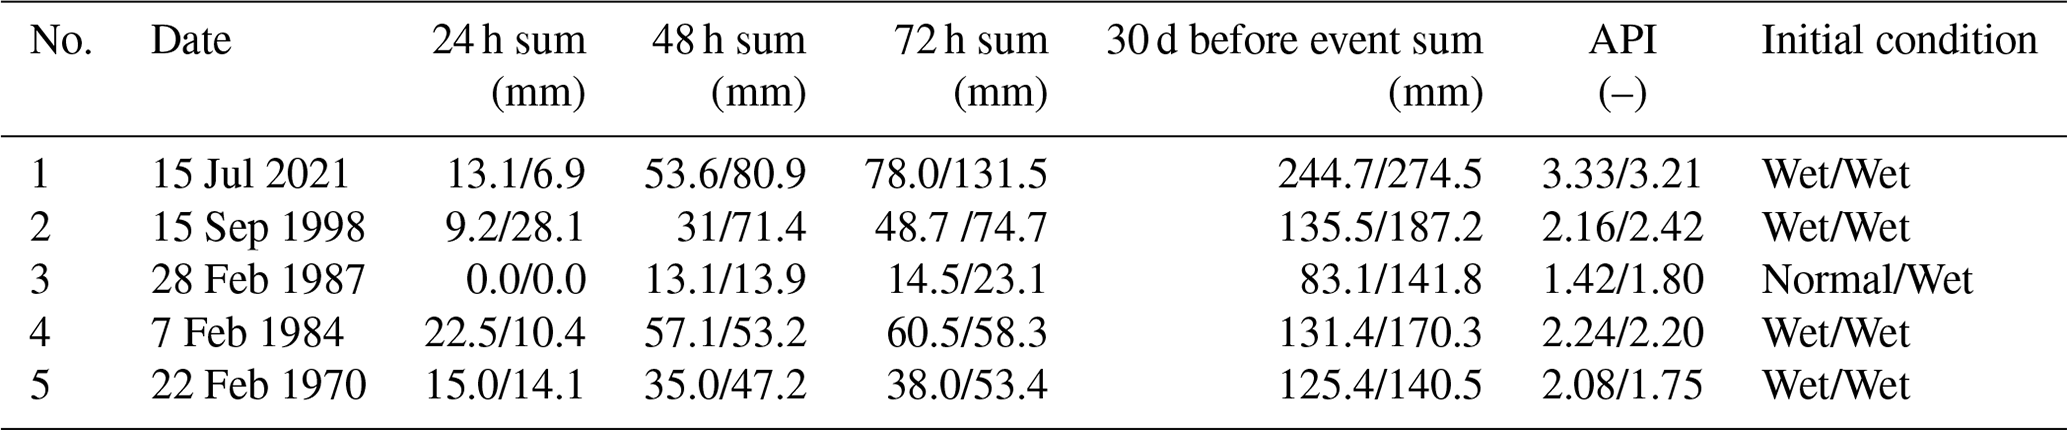
All high-flow events appear to happen under normal or wet conditions (Fig. 5). Most extreme events are caused by a combination of P99 and PMD or just PMD. Antecedent conditions also play a crucial role in translating precipitation extremes to high flows. We observe that higher API values (higher wet initial conditions) lead to higher peak discharges, especially for events preceded by compound and P99 events, where a strong correlation between Qmax and the API is observed, while a very weak correlation between Qmax and the total event PMD or P99 precipitation is reported (see Fig. 5). PWAC makes the difference between a “regular high flow” and a flood event. This is also evident in the initial conditions of the top five floods that occurred in the catchment during the study period (see Fig. 5 and Table 3). Details about these events (i.e., date of occurrence, different rainfall accumulations and an estimate of their initial conditions) are presented in Table 3 based on the precipitation records at Maastricht and Vaals. Examining the preceding conditions for the major past floods, it appears that, in most of these cases, although the precipitation events spanning 1–3 d were heavy, the overall precipitation over the 30 d preceding the events was also substantial. This extended period of precipitation likely played a critical role in saturating the catchment, making it more susceptible to flooding. The combination of intense rainfall over shorter durations and continuous precipitation over the 30 d period seemed to collectively contribute to the formation of wet initial conditions, ultimately increasing the risk and eventually resulting in flooding. It is also important to note that the large discrepancies in rainfall accumulations between the two stations found in Table 3 are caused mainly by the different time intervals that they include, i.e., calendar days for the Maastricht station and 24 h sums from 08:00 UTC for the Vaals station, as well as the spatial variability.
The absence of green markers in Fig. 5 (only P99 events) indicates again that, for days preceding Qmax, the probability of a PMD event given that P99 occurs equals 1 (Pr(PMD|(P99 and Qmax)) = 1). In the way that we defined P99 (2 d interval), we observe that the P99 events preceding a Qmax usually also coincide with PMD. For very extreme 24 h events, the 4 d 95th percentile used for the PMD definition can be exceeded and concurrently cause both PMD and P99, which is unavoidable. However, in longer accumulation periods for PMD (i.e., 5, 6, 7, 8, 9 and 10 d), the corresponding 95th percentile increases, as the moving/accumulated period is extended and becomes much larger than the 99th percentile used for the definition of P99. In these cases, irrespective of the duration, the mean relative frequencies of high flows preceded by Compound II and Compound III remain stable (see the Supplement for the analysis). This implies that rainfall events (whether heavy or not) probably preceded P99 for these events as well (at least for less extreme ones), potentially resulting in wet conditions and consequently high discharges, highlighting the correlation among the different drivers used and how they can be converted to compounds. Thus, while it is found that Qmax is preceded by PMD 75 % of the time, some of the PMD events could be forced or even caused by P99. However, the definition of PMD still holds significance, as it denotes an extended period of heavy rainfall.
Table 4Correlation coefficients between the winter half-year discharge maxima and their antecedent k-day precipitation depths.
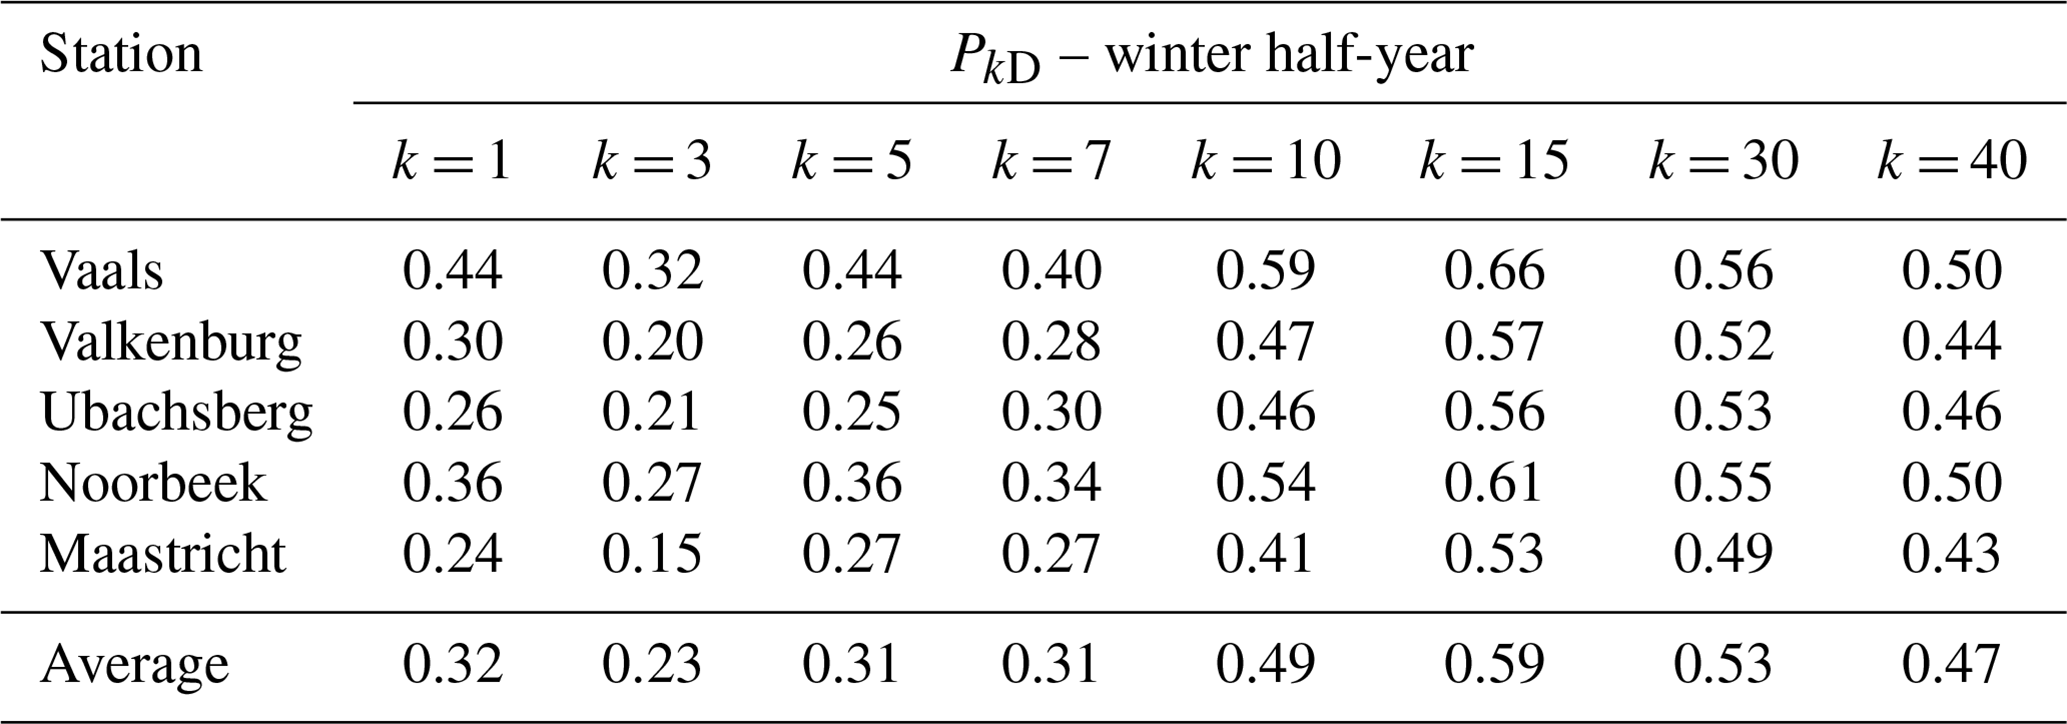
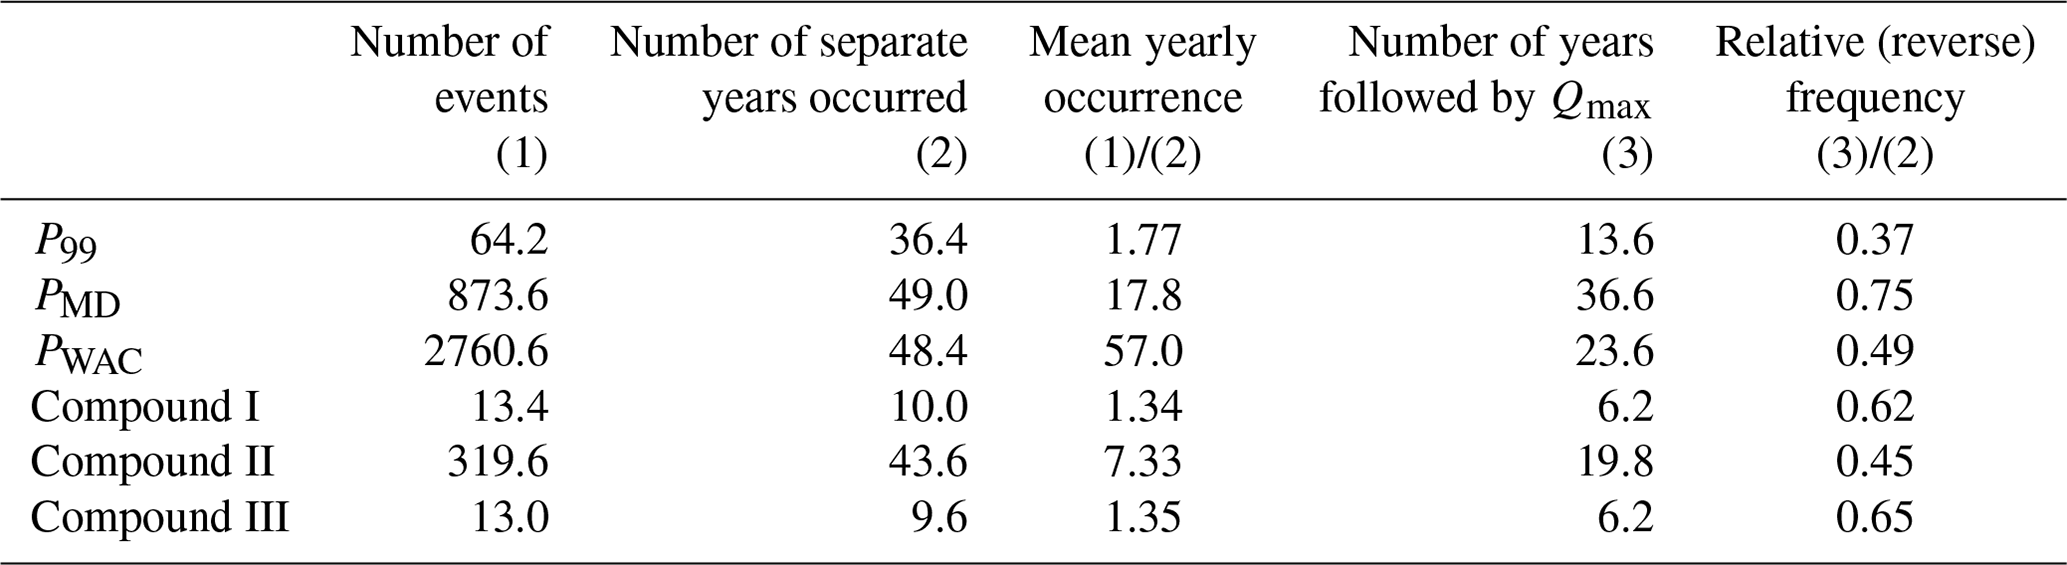
Table 5General information, averaged for all rainfall stations, regarding the frequency of the different drivers occurring, regardless of Qmax having occurred, in the Qmax period (hydrological years from 1970 to 2021, excluding 1971, 1974 and 1990).
Finally, we also explore the effect of antecedent precipitation depths on high flows, as an indicator of antecedent catchment wetness. Table 4 reports the correlation coefficients of the QW,max time series with their k-day (k = 1, 3, 5, 7, 10, 15, 30 and 40) antecedent depths per rainfall station. Results are only presented for the winter half-year, as approximately 80 % of Qmax occurred in this period (Fig. 3). Thus, QS,max time series contains mainly low discharge values (most of them lower than 20 m3 s−1; see Fig. 10a) with meaningless correlations. Peak half-year winter discharges in the Geul appear to be closely related to antecedent 10–40 d precipitation depths on wet soils (e.g., correlation coefficient of 0.66 in Vaals for the duration of 15 d). The effect of wet antecedent conditions is also reflected here. These results seem reasonable considering the opposing seasonality observed in the catchment (Fig. 3). The July 2021 flood event is consistent with these results, as there is evidence that the wetness of the catchments was much higher than usual for the time of the year (see Fig. 5 and Table 3).
3.1.4 Extreme-precipitation-based analysis
In this section, we approach the problem from an inverse perspective compared with Sect. 3.1.3. Table 5 shows the frequency of the potential flood drivers actually leading to extreme discharge. P99, Compound I and Compound III are rare events compared with the other drivers, and there are years in which they are not observed at all (see Table 5). In the separate years when a P99 event occurs, it is followed by a Qmax event in about 37 % of those cases, while these numbers are approximately 65 % for Compound I and Compound III, respectively (Table 5). Compound-I and Compound-III events are extremely rare events (approximately 13 recorded events per station); however, in most cases, when they appear, they lead to Qmax. This observation suggests that when extreme precipitation P99 occurs under wet antecedent conditions, it leads to high flows; however, alone, it is typically insufficient to cause floods.
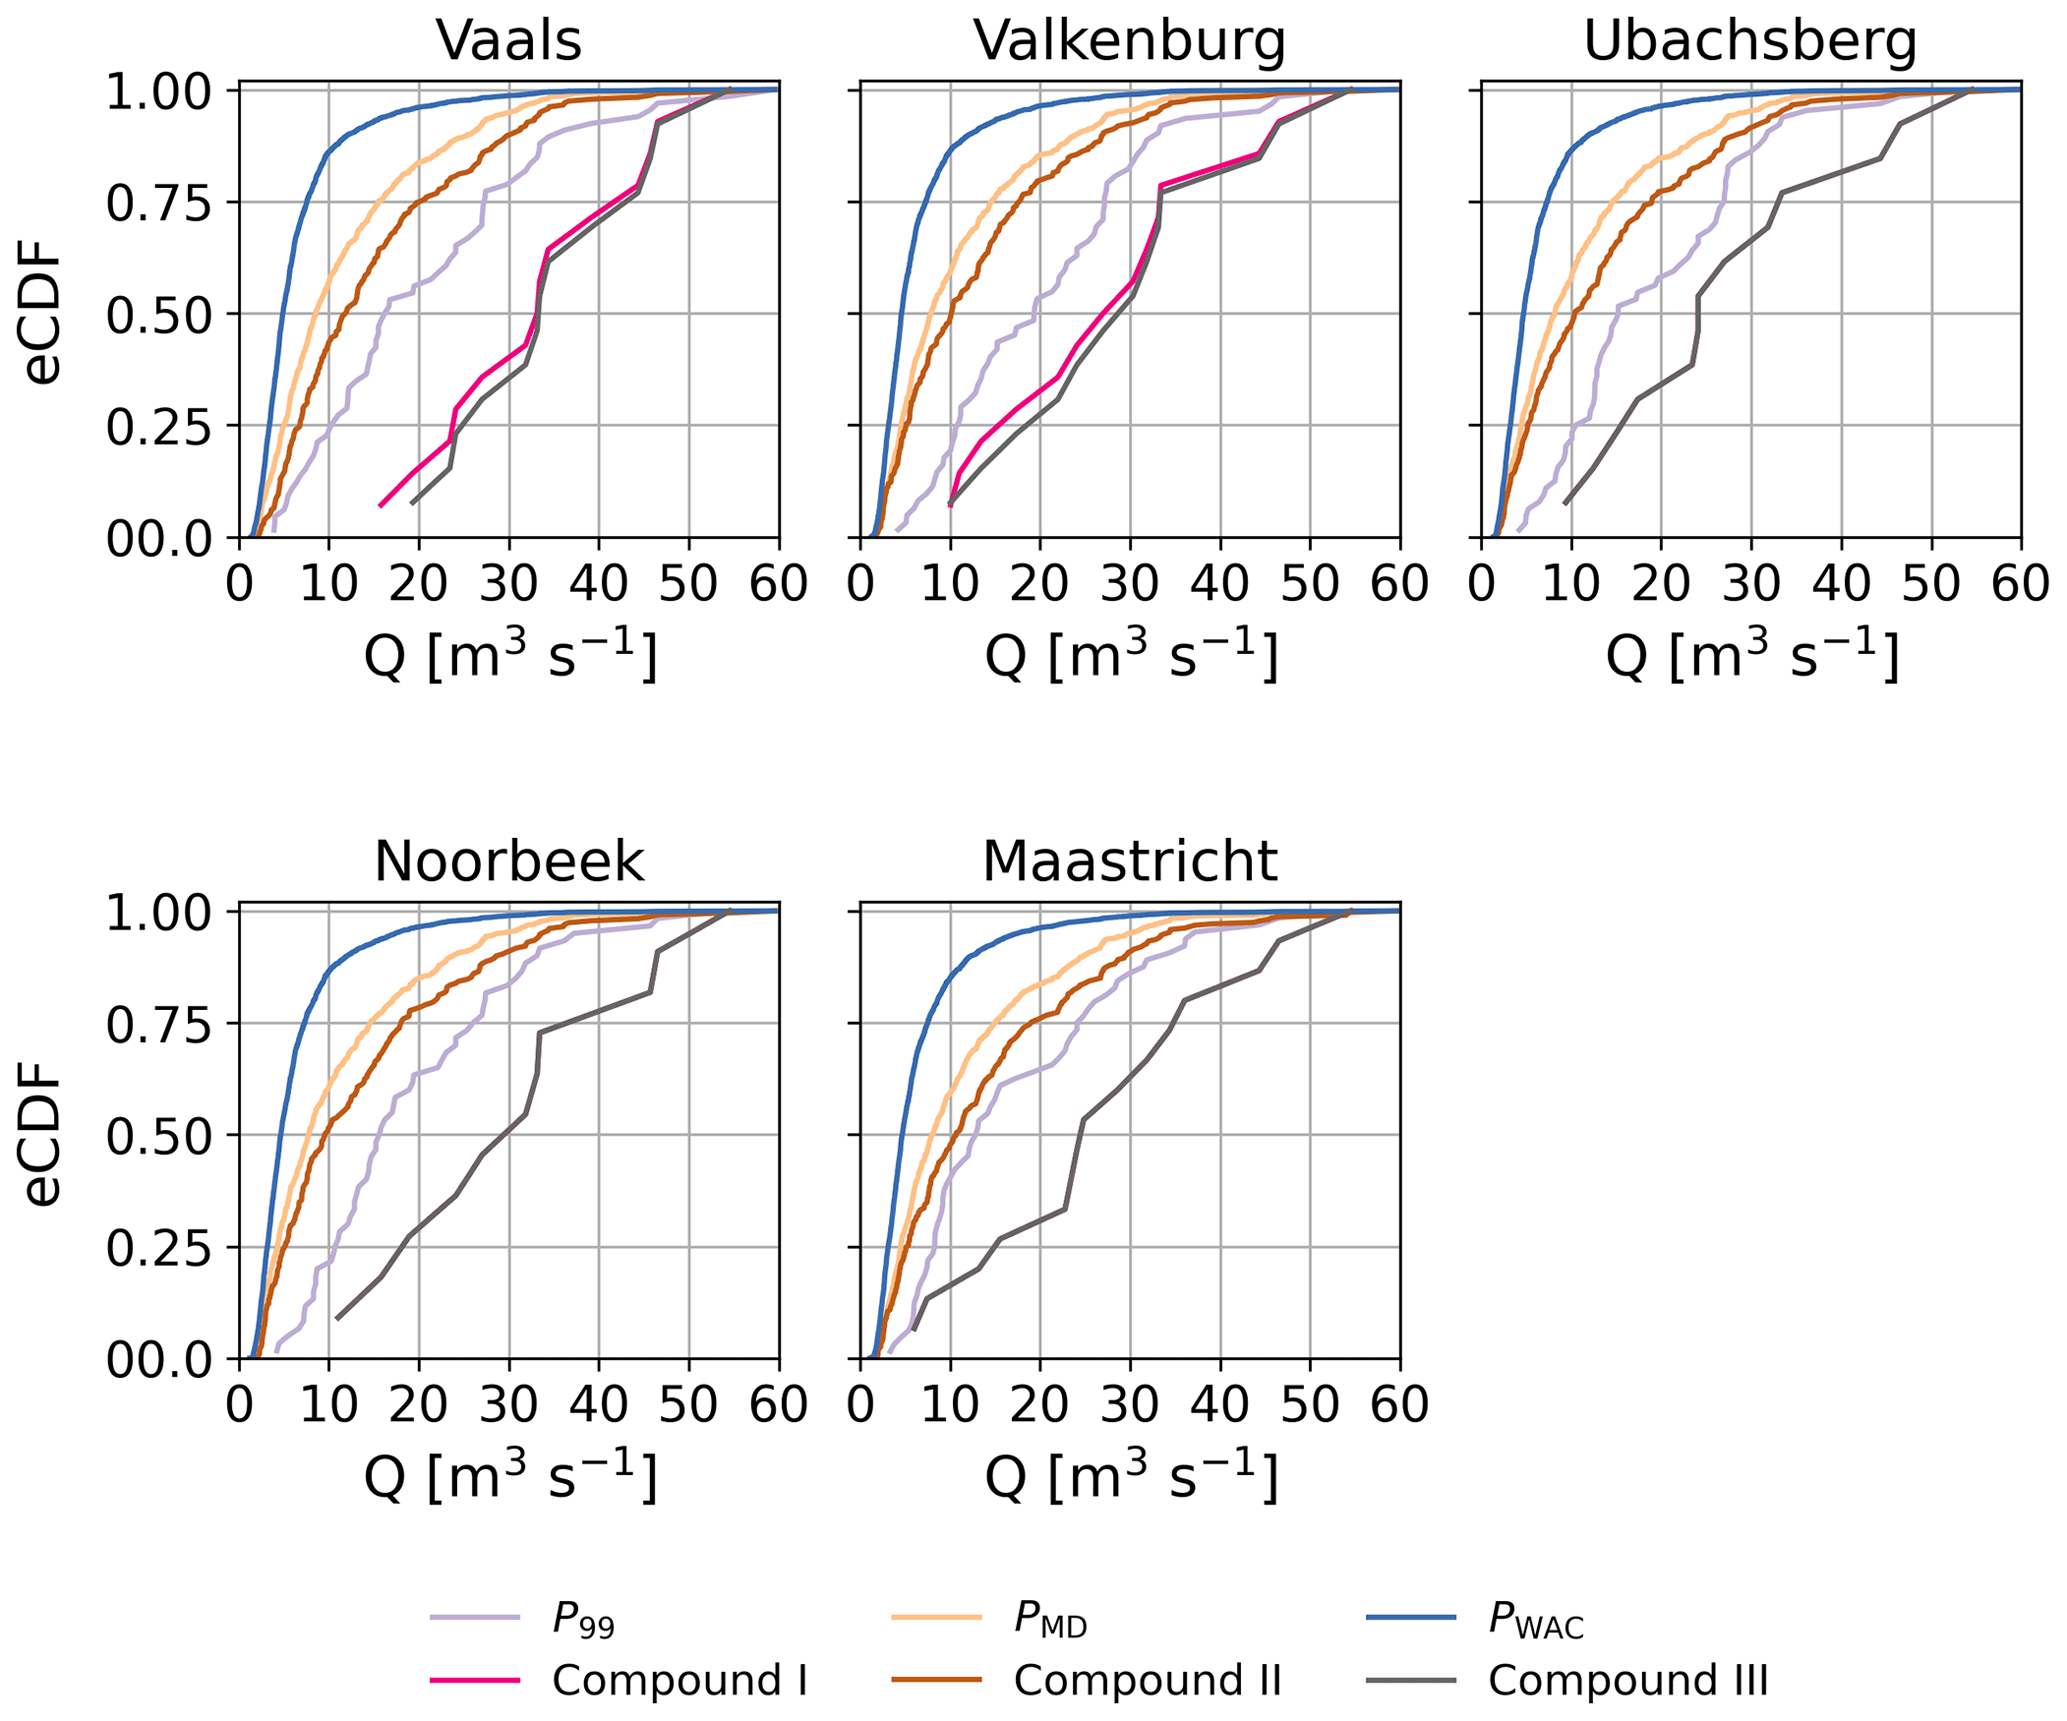
Figure 6Empirical cumulative distribution functions (eCDFs) of discharge caused by the extreme precipitation indicators for all stations, based on the number of events from Table 5.
It appears that flooding is rarely caused by a single mechanism. Figure 6 shows the discharge empirical cumulative distribution functions for every station caused by every extreme precipitation indicator, for the number of events reported in Table 5. According to the local water authorities, a discharge exceeding approximately 40 m3 s−1 could lead to flooding of the first houses, while a discharge greater than 30 m3 s−1 could result in the inundation of floodplains, particularly concerning upstream locations within the catchment area (Klein et al., 2024). These thresholds are often crossed during Compound-I and Compound-III events, particularly in extreme events at the Vaals station, indicating a stronger correlation with discharges compared with other locations. It is important to note that these discharge thresholds pertain to the upstream sections of the catchment, not the outlet at Meerssen. However, most of the water originates from the Belgian part, while the contribution of the remaining tributaries is minor (Klein, 2022). Overall, it seems that single processes are not likely to cause floods, whereas compound events do. Moreover, it is again clear that P99 in isolation is much less likely to cause floods, compared with when it is combined with wet antecedent conditions and PMD.
3.1.5 Sensitivity of the API to evaporation
The exclusion of evaporative processes in the API used for evaluating initial catchment conditions could potentially pose significant concerns, as the index is solely based on antecedent precipitation depths. An important aspect to consider is whether the API reliably reflects soil wetness consistently throughout the year in our study region or if its interpretation is influenced by the strong seasonal variations (reference evaporation is low in winter and high in summer; see Fig. 2). To investigate this, the effective rainfall (precipitation minus reference evaporation from the Maastricht station) 30 d before an event is calculated instead of the API, and Fig. 5 is reproduced.
The results suggest that no significant biases occurred due to the exclusion of evaporation. Larger offsets are visible in the summer half-year events and the overall correlation is low (as in the regular API; Fig. 5); however, the high correlation between the P99 and PMD events and the Qmax (purple markers and reported correlation value) is maintained (Fig. 7), which is in line with the API results. Only 7 of 49 Qmax events occurred in summer, and 6 of these 7 summer Qmax events are in the P99 and PMD events; as a result, the calculated correlation includes them. In addition, the top five floods remain “higher” compared with other events.
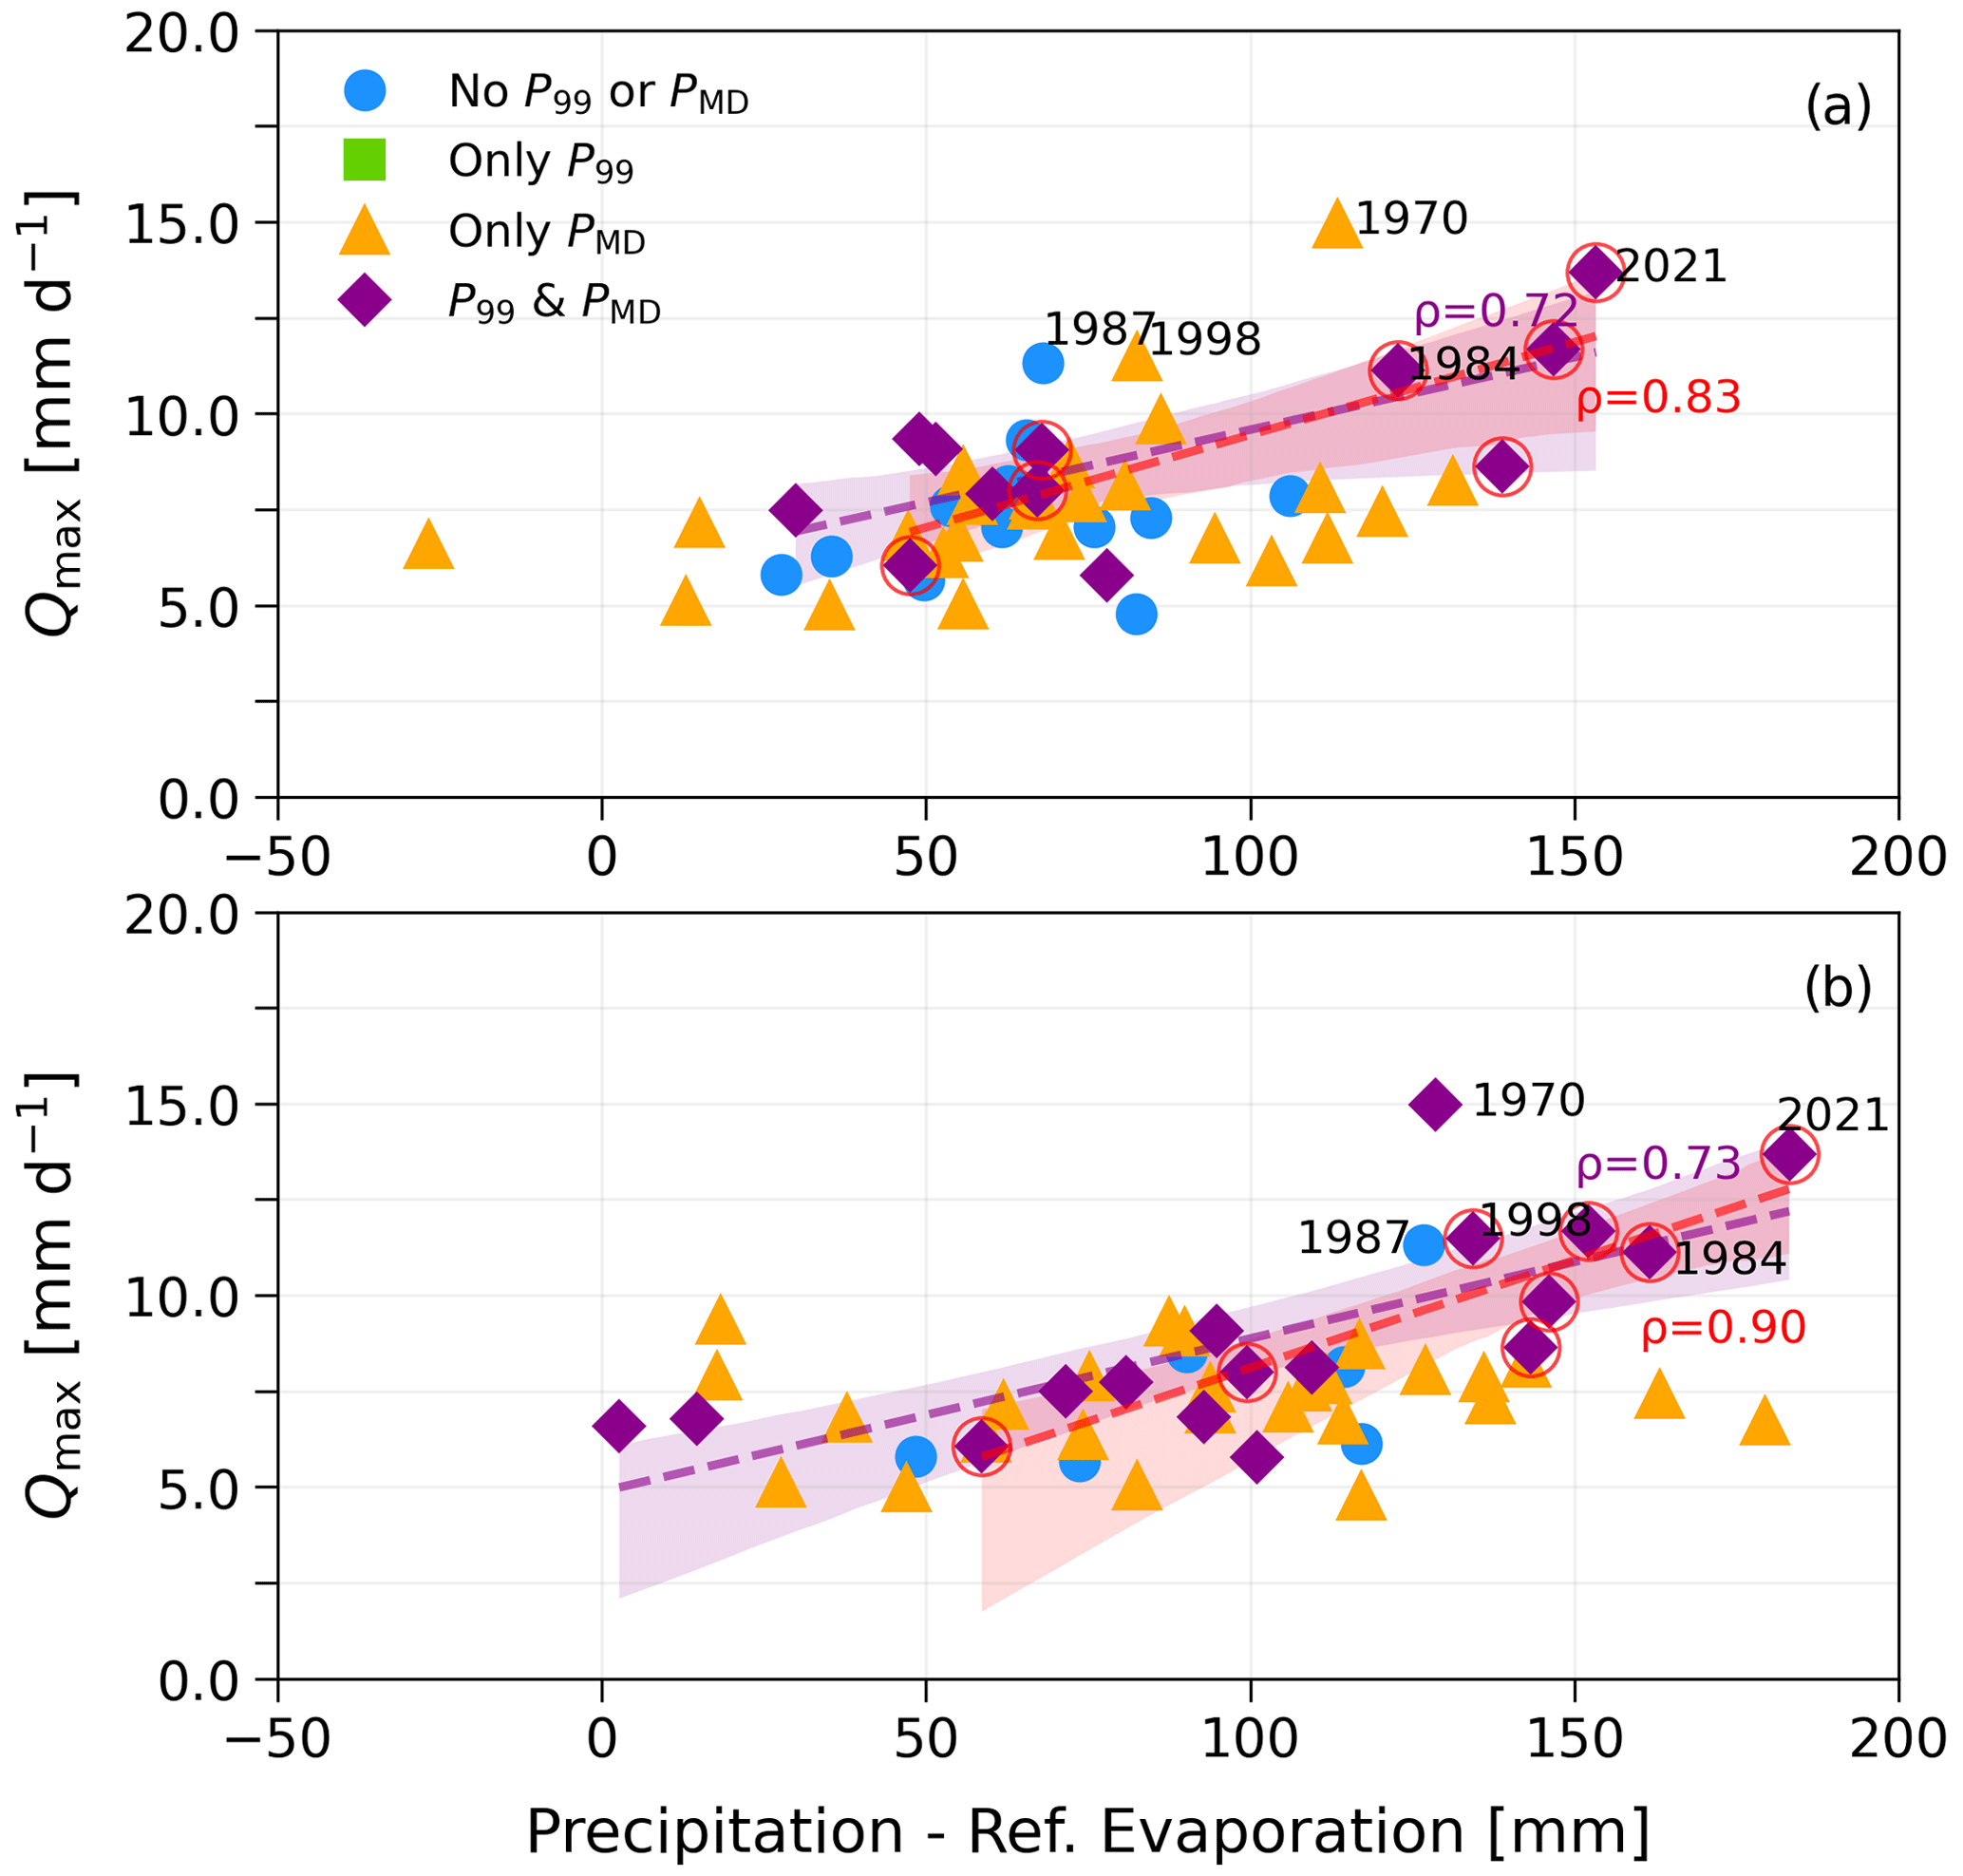
Figure 7Annual maxima events (Qmax) and their 30 d pre-event effective rainfall at Maastricht (a) and Vaals (b), including their preceding extreme indicators. The top five floods during the study period are shown with their year of occurrence. The dashed purple line represents the linear fit, using the least-squares approach, between the effective rainfall of the high-flow events preceded by P99 and PMD and their respective Qmax values, while the red dashed line represents the linear fit between the effective rainfall of the Compound-III events and their Qmax. The shaded areas show the 95 % confidence intervals for the fits, and the Pearson correlation coefficients (ρ) are also reported.
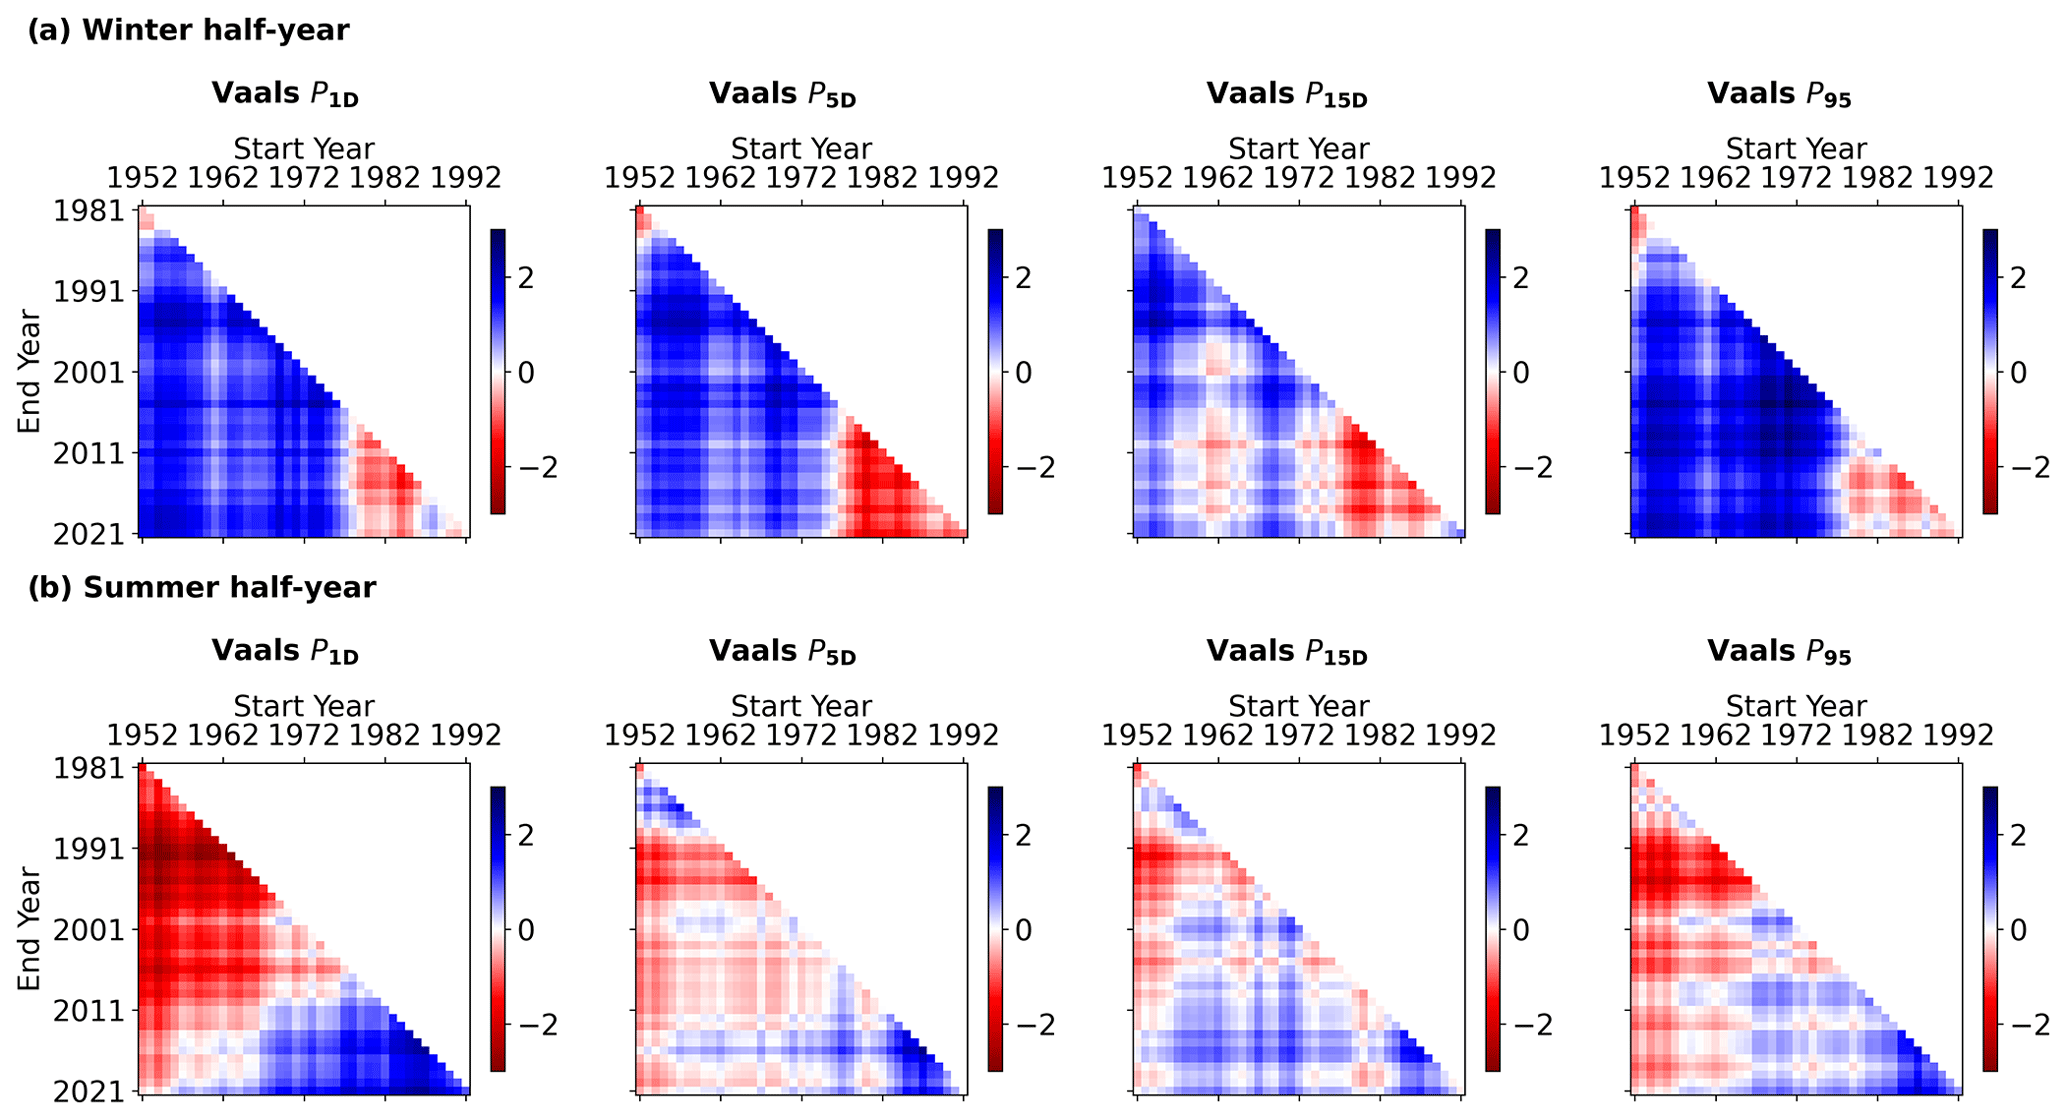
Figure 8Multi-temporal trend analysis for P1D, P5D, P15D and P95 at Vaals for the (a) winter half-year and (b) summer half-year. Each pixel presents a fixed single period (minimum window length of 30 years) of the start and end year. For each period, the M–K test is applied, and the color indicates the Z-statistic value of the test (the same definitions apply to the subsequent figures). Blue colors indicate increasing trends, whereas red colors indicate decreasing trends; the darker the color, the more significant the trend. Statistically significant trends are considered to be those with Z-statistic values higher than 1.28 (or smaller than −1.28 for downward trends) corresponding to the defined significance level of 0.2 (see Sect. 2.4).
3.2 Trend analysis
3.2.1 Flood driver trends
Figure 8 illustrates the multi-temporal trend analysis for several precipitation indices for the Vaals station, for half-year periods, as an example. The multi-temporal analysis for Vaals, which has a record from 1952 to 2021, results in 861 trends. In the winter half-year, statistically significant increasing trends are found for the longest periods in all indices at Vaals. However, a decreasing, mainly insignificant, pattern is visible in the recent past (trends starting after the 1980s). In summer (Fig. 8b), negative trends are visible for the longest periods, while this changes to positive trends in the recent past for k ≤ 5 d. Summer trends for k > 5 d are rather mixed: generally insignificant trends are found, with shifts between positive and negative tendencies. For the full multi-temporal analysis per index and station, the reader is referred to the Supplement.
Figure 9 shows the consistency in statistically significant trends in each precipitation index per rainfall station. In winter, only increasing trends are visible, with the exception of the P15D index at Ubachsberg. The decreasing tendency in the recent past detected at Vaals is very strong and statistically significant at Ubachsberg for most indices (Fig. S3), causing this inconsistent decrease. Consistent and strongly consistent increases are observed for at least one station per index. For the P7D index, four out of five stations show consistent or strongly consistent increases. For k ≤ 10 d, most stations have strongly consistent or consistent upward directions. With increasing k (15,…,40 d), the increase becomes weaker (inconsistent) for the majority of the stations; however, two out of five stations (located inside the catchment) still show increases. Indices for k ≤ 10 d show strongly consistent increases, while a consistent increase is visible for k > 10 d at the Valkenburg station. In addition, three out of five stations show strongly consistent or consistent increasing trends in the P95 and PMD indices. Overall, the trend analysis in winter for the Geul catchment shows a consistent increase in very wet days (P95) and maximum k-day precipitation sums. The rise in severe precipitation is caused mostly by more rain on already wet days. Multiday precipitation extremes are consistently increasing. This is a crucial finding, as the effects of prolonged, heavy storms in combination with wet antecedent conditions appear to be the dominant flood drivers in the Geul catchment.
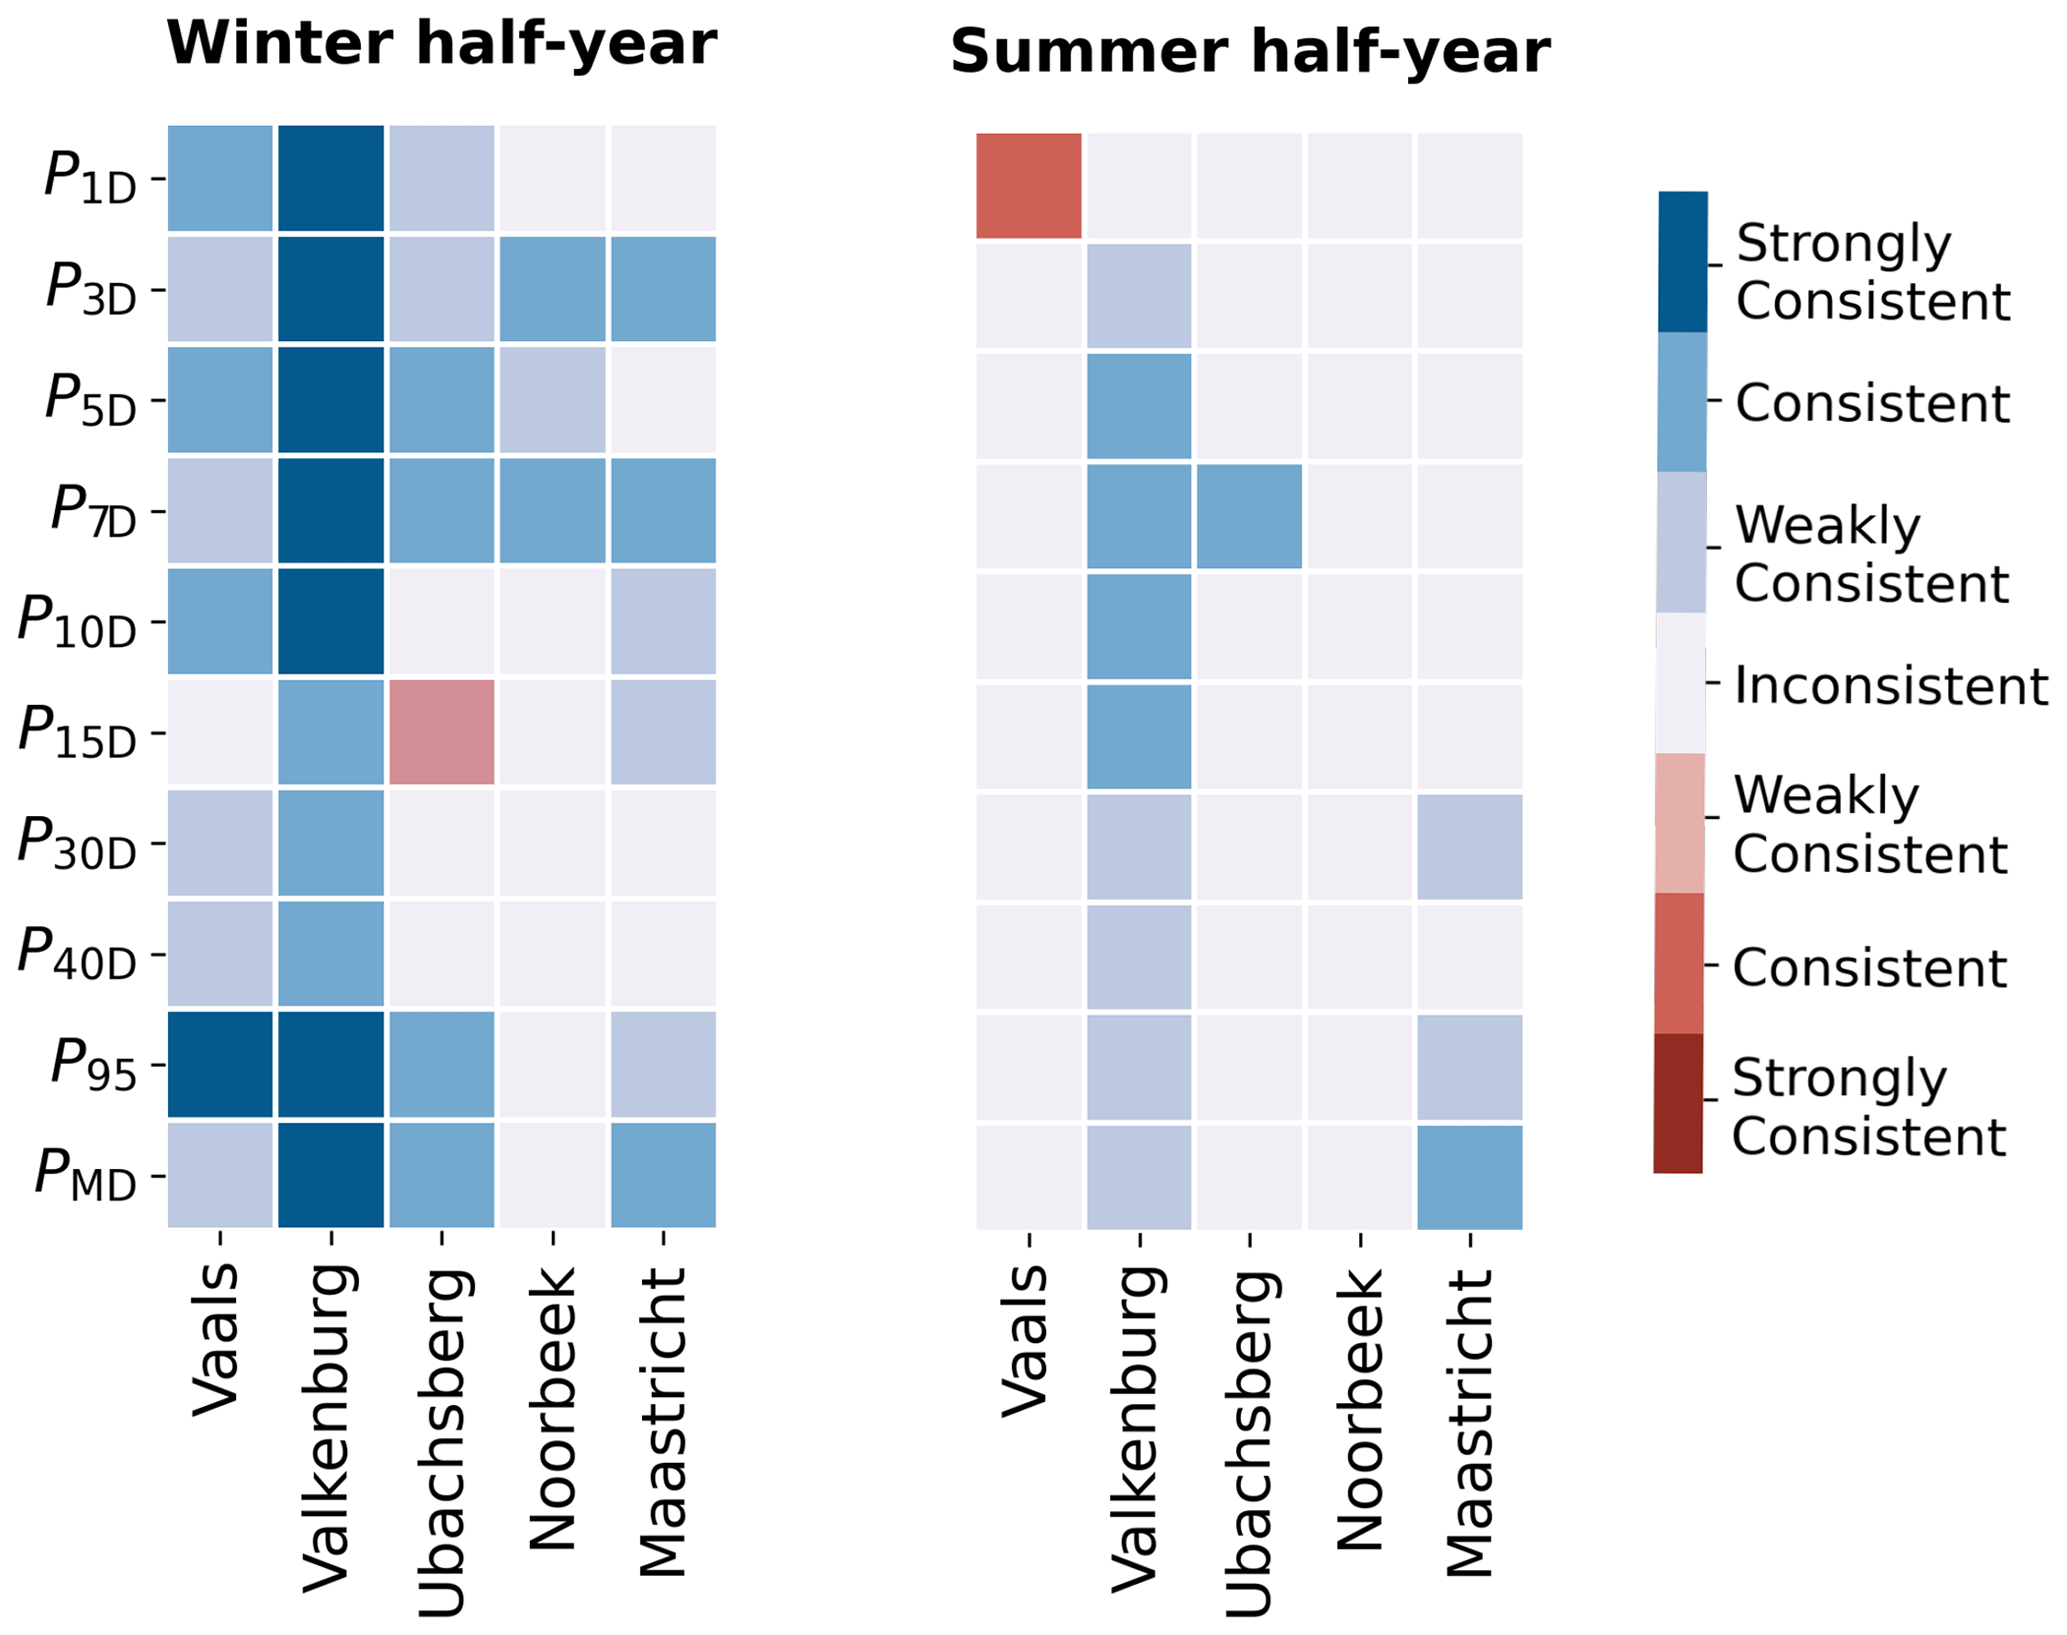
Figure 9Temporal consistency of precipitation trend indices for the winter and summer half-years. Blue colors indicate upward trends, whereas red colors indicate downward trends.
Trends in summer periods show variability across the different stations. The majority of the summer half-year k-day and P95 indices are subject to inconsistent trends. Most stations show generally insignificant trends, with changes between positive and negative tendencies. The only consistent trends are mainly increasing and are found at the Valkenburg station for k = 5, 7, 10 and 15 d; at Ubachsberg for k = 7 d; and at Maastricht (i.e., PMD ). In addition, the P30D and P95 indices at Maastricht show strong and statistically significant increasing trends in the majority of tested cases, resulting in weakly consistent trends. As mentioned, despite the fact that the difference between significant increasing and decreasing trends in the summer half-year is not clear, the statistically significant increasing trends in the recent past, mainly for k ≤ 3 d, are strong and should be taken into account (Figs. S6–S10). In addition, the consistent increasing trends at Valkenburg reveal a direction towards more wet conditions in the summer half-year.
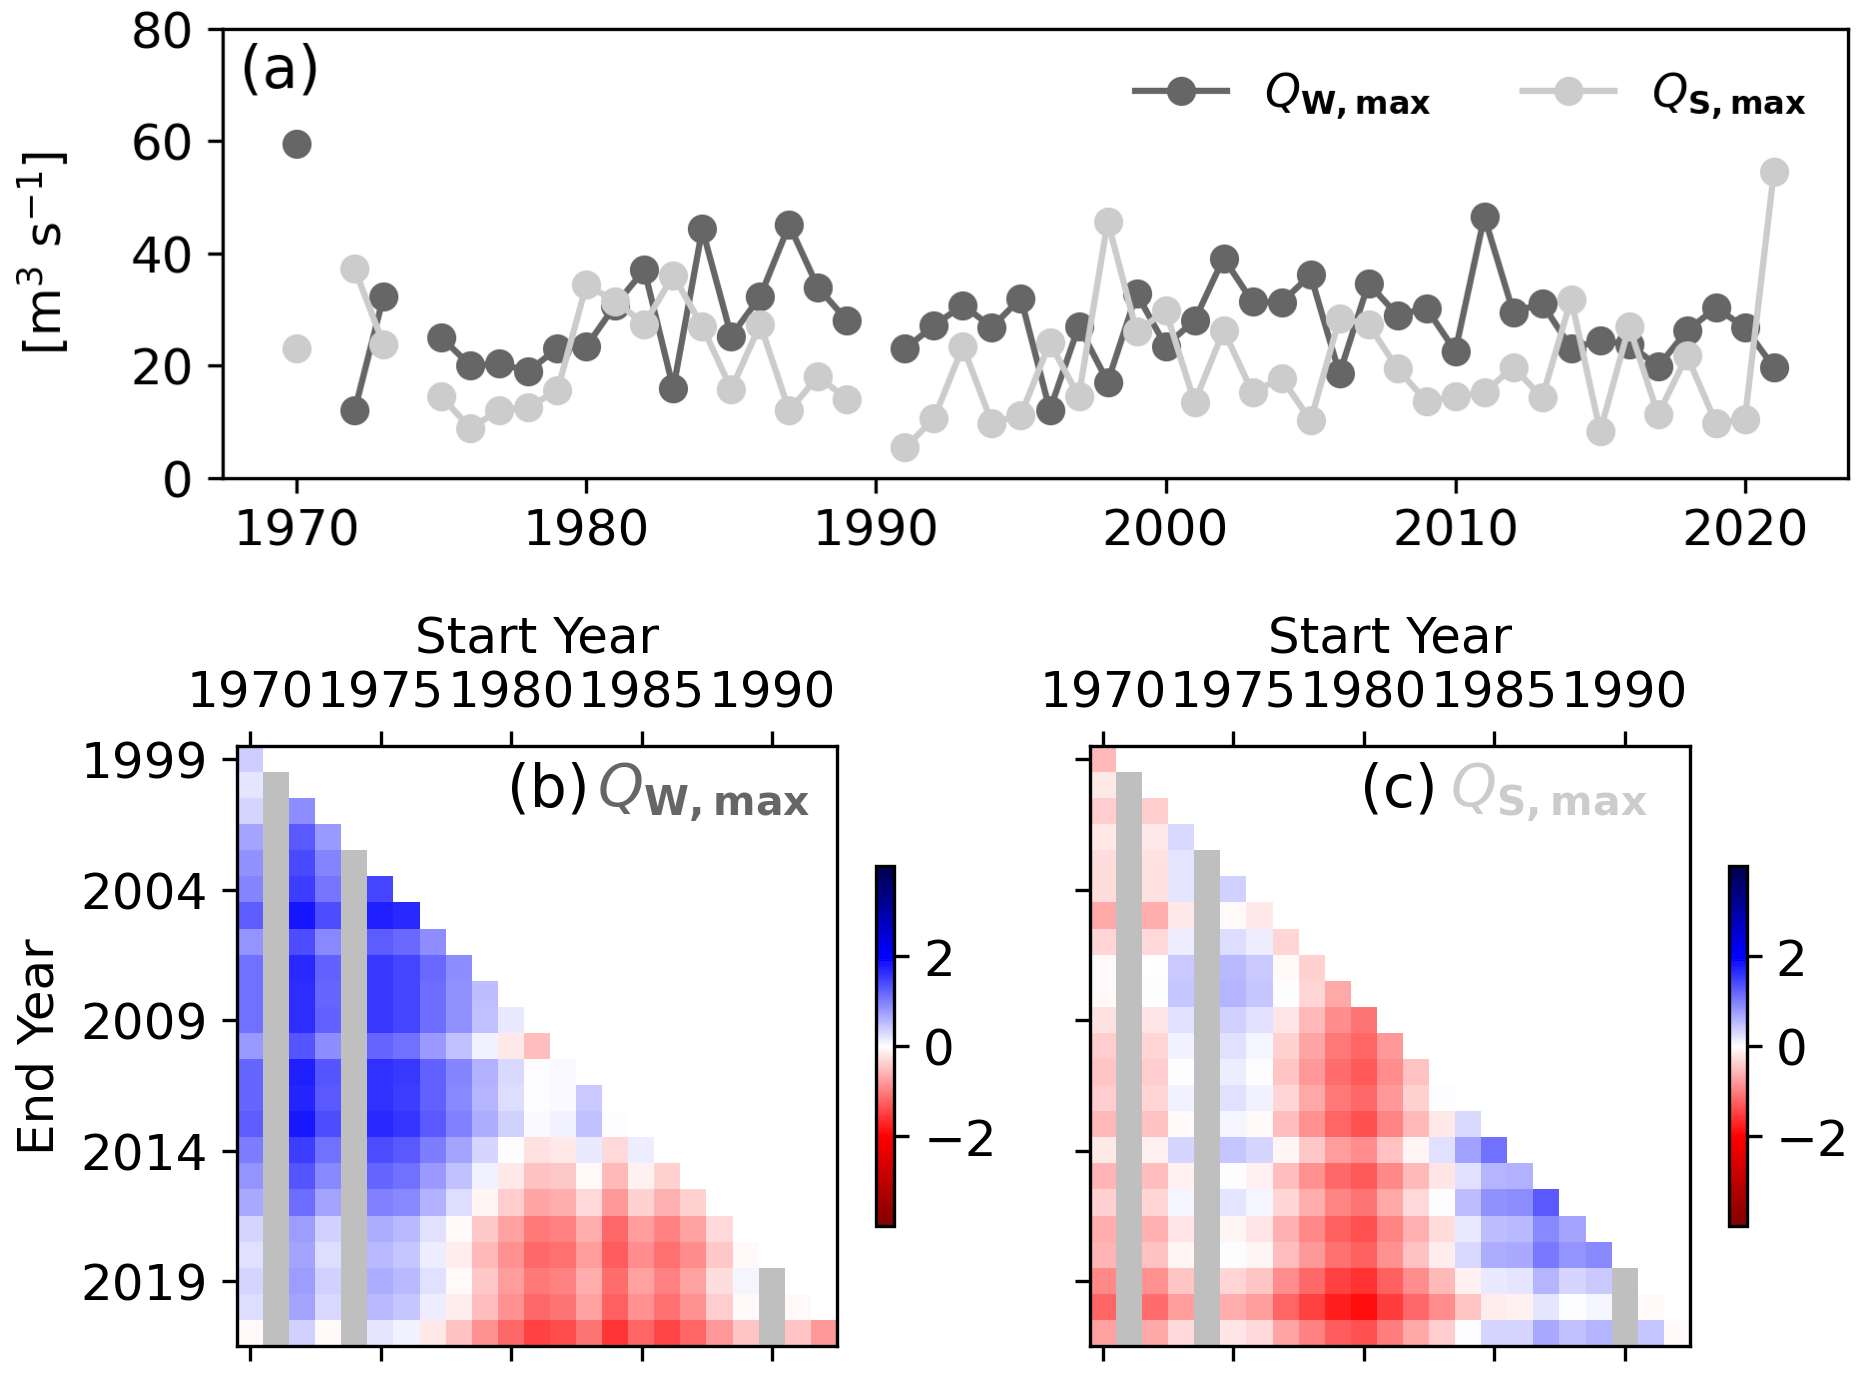
Figure 10Half-year yearly maxima time series (a) and multi-temporal trend analysis for the (b) winter half-year yearly maxima (QW,max) and the (c) summer half-year yearly maxima (QS,max). The gray stripes in the heatmaps indicate the excluded hydrological years (i.e., 1971, 1974 and 1990).
3.2.2 Discharge trends
The results of the multi-temporal analysis for the QW,max and QS,max time series are shown in Fig. 10. It can be observed that the maximum flows show variability over the two half-year periods. Increasing trends are found in the longest periods for the winter half-year, but this seems to have changed in the recent past to statistically insignificant decreasing tendencies. Overall, the increase in the QW,max is considered to be consistent when accounting for the missing hydrological years of 1971, 1974 and 1990. This pattern is in agreement with the extreme precipitation trends in the area for winter, as large similarities are observed in terms of magnitude, direction and variability. For example, QW,max trend variability is quite similar to the P95 index in winter at Vaals (see Fig. 8a): statistically stronger increasing trends are found over longer periods (from 1970 to 2021), with a weak decreasing direction in the recent past (trends starting from the 1980s).
Mixed and statistically nonsignificant trends are observed in the summer half-year (Fig. 10c), as expected, considering that the trends in extreme precipitation in the same period are inconsistent and their strength is (statistically) insignificant. For some cases, QS,max trends shift between negative and positive tendencies in similar periods with extreme summer precipitation; however, this match is not as clear as in the winter period. The increasing direction of extreme precipitation in the recent past for summer starts also becoming visible in the QS,max direction (see positive values for trends starting after 1985). In general, the effect of the considerable increase in evaporation in the area in summer (Tsiokanos, 2022) and the large soil moisture deficits should be taken into account when translating extreme precipitation to extreme streamflows, and subsequently discussing correspondences and differences between discharge and precipitation trends.
4.1 Data uncertainty
Records of 24 h precipitation from the KNMI manual rain gauge network are employed. The used precipitation time resolution may be considered low for flood analysis; however, the response time (i.e., longer than a day; see Sect. 2.1) of the catchment allows for the application of this resolution. In addition, the main goal of this paper is to investigate the role of P99, PMD and PWAC as potential flood drivers. The use of a 24 h resolution can affect the defined P99, whereas the applied resolution does not have a major impact on the definitions and meaning of PMD and PWAC. For this reason, allowances were made with respect to the way that we defined a P99 day (i.e., precipitation amount on the same or previous day with respect to the high-flow event; see Sect. 2.3.3).
Long precipitation time series may have been influenced by instrumental modifications and station relocations throughout the recording period. As mentioned in Sect. 2.2, the data are considered to be of high quality, as KNMI performs regular quality tests. In addition, two homogeneity tests were applied to monthly sums. In general, it is assumed that the analyzed precipitation time series in this research are not affected by instrument or location alterations, so the trends that are found can be attributed to climate and not to human interventions.
It must be acknowledged that the produced discharge results are subject to significant uncertainty (Di Baldassarre and Montanari, 2009). Estimations during extremely high flows are very inaccurate. For example, the recorded discharge during the July 2021 flood was 55 m3 s−1, whereas it is estimated that it actually exceeded 80 m3 s−1 (van Heeringen et al., 2022). However, our main findings regarding the role of compound events in generating high flows remain valid. In addition, periods of transition; changes in gauge position, equipment and monitoring frequencies; and stage–discharge relations can cause sudden variations in flow rates. These changes can be more visible in mean flow trends, the values of which are low in contrast to the high flows used in this paper. The long-term measurements at the Meerssen station at the outlet of the catchment are considered reliable in terms of homogeneity (Agor, 2003). The high-flow trends are found to be similar to the direction and significance of the extreme precipitation trends, indicating that the results are likely not affected.
4.2 Implications
For the Geul, it is found that extreme daily precipitation alone is typically insufficient to cause floods. However, wet antecedent soil conditions are a crucial factor determining the probability of flooding. In this respect, the finding that heavy, prolonged precipitation frequently preceded high flows in the Geul seems reasonable, as multiday precipitation can also serve as a proxy for heavy precipitation occurring under wet antecedent circumstances (Nanditha and Mishra, 2022). Most of the flood events are observed in winter periods, when the catchment tends to be very wet, with shallow groundwater tables. In summer periods, most of the extreme (intense) precipitation events are not translated to high-flow peaks, due to large soil moisture deficits. The most devastating flood in the area (i.e., July 2021) was aggravated by rainfall events in the preceding days and weeks. The role of wet antecedent (soil) conditions in driving floods is well established; however, to date, the focus has tended to be on larger catchments (Wasko et al., 2020). Information about the initial (wet) conditions of the catchment is deemed essential, particularly for flood forecasting, as the local water authority does not currently monitor soil moisture. In addition, the geology of the Geul region can significantly control the runoff response, as there is a thick unsaturated chalk zone that can store much water (Klein, 2022). Therefore, the (geo)hydrological properties and characteristics of the catchments should receive more attention in the flood forecasting system (Zanon et al., 2010; Douinot et al., 2022). Our findings are also expected to help with understanding flood mechanisms in other lowland or chalk catchments around the world. In addition, the event-based approach followed in this work can be exploited in other catchments to examine the relative role of wet antecedent soil moisture conditions and precipitation characteristics preceding high flows, especially in areas where (long-term) soil moisture data are not available.
The statistical results obtained in Sect. 3.2.1 demonstrate some intriguing variations in the Geul catchment's precipitation regimes across the studied periods. The most notable change is the consistent and strong increase in critical precipitation during the winter half-year. During this period, various indices representing heavy, prolonged events, such as PkD for k ≥ 3 d and/or PMD, as well as 24 h extreme indices, like P1D and P95, show mostly consistent increases. These combinations of indicators can contribute to the saturation of the catchment, thereby increasing the risk of flooding. In addition, it appears that a portion of the rise in severe precipitation stems from increased rainfall on already wet days, as evidenced by consistent (or strongly consistent) rises in P3D, P5D, P7D and PMD across the majority of stations. All of these findings are crucial, as heavy and prolonged storms in combination with wet antecedent conditions have impacted the catchment and caused floods, mainly in winter. Although it cannot be concluded that climate change had a significant impact on the July 2021 flood event in the Geul region, as there are no apparent consistent patterns in most summer precipitation trends, a concerning increasing direction in the recent past (mainly after the 1980s) is visible. This finding is important, as it shows that (except for the intense showers in summer) the effects of heavy storms in combination with wet antecedent conditions should be taken into account. At the same time, it is critical to consider the substantial increase in summer potential evaporation rates (due to increases in temperature and radiation) in the area (Tsiokanos, 2022) that may lead to soil moisture deficits, when translating extreme precipitation events into potential extreme flows. According to the recently published KNMI scenarios, wetter winters and increased extreme summer showers are projected for the Netherlands (KNMI, 2023). These projections suggest that the number of heavy showers with significant precipitation is expected to rise, with a shift from light to heavier (more rain falls from the shower) and more intense (more rain falls in a certain period of time) showers (KNMI, 2023). These climate scenarios are in line with the trends found in this study. Overall, the long-term trends in the critical precipitation are also visible in the runoff patterns. Thus, the effect of climate change should be seriously considered in the area and should be incorporated into flood designs; moreover the effects of agro-economic developments, such as land-use changes, should also be taken into account. Furthermore, our findings from the precipitation and discharge trend analyses can serve as a valuable reference for assessing the impact of climate change on precipitation and discharge patterns in regions other than the Geul. In addition, the use of a multi-temporal approach, including the consistency criteria, appears useful and is recommended for identifying variability, recent directions and long-term trends.
We used an event-based approach to detect the main flood drivers in the Geul River catchment and a multi-temporal trend analysis to investigate their temporal variability and consistency. Our results indicate that heavy multiday precipitation can have a notable impact on high flows, preceding them approximately 75 % of the time (using a 4 d precipitation duration; Fig. 4). Nevertheless, wet antecedent conditions play a crucial role in translating extreme precipitation events into extreme flows and make the difference between a “regular high flow” and a flood event. Extreme 24 h precipitation without wet antecedent conditions, which mainly occurs in summer, has never independently led to floods in the past (see Fig. 5 and Table 3). The joint probability of extreme (prolonged) rainfall and wet initial conditions (which can be seen as a compound event) determines the chances of flooding. As a result, prolonged, heavy rainfall and wet antecedent wetness appear to be the primary factors contributing to extreme discharge events, and they should be used as flood indicators, rather than extreme precipitation alone. Flood-producing precipitation shows a consistent increase in the winter half-year, a period in which more than 70 % of extremely high flows have historically occurred. Heavy, prolonged storms in combination with wet antecedent conditions can cause large floods, and these conditions are becoming more frequent during winter. This rise is also reflected in the winter half-year maximum discharges, which are increasing in terms of magnitude. Although the majority of precipitation and flow trends do not exhibit consistent patterns in the summer half-year, a notable and concerning upward direction has become evident in the recent past. This observation underscores the necessity to account for the effect of compound events in addition to intense summer showers. The extreme flood event in July 2021, along with the observed increase in flood drivers, emphasizes the importance of incorporating compound events into flood risk assessment.
Precipitation data used in this study were obtained from the Royal Netherlands Meteorological Institute (KNMI). Time series for the manual rain gauge network can be downloaded from https://www.knmi.nl/nederland-nu/klimatologie/monv/reeksen (Royal Netherlands Meteorological Institute, 2023a). Time series for the meteorological station at Maastricht are available from https://daggegevens.knmi.nl/klimatologie/daggegevens (Royal Netherlands Meteorological Institute, 2023b). Discharge time series at Meerssen were provided by the water authority Waterschap Limburg, and requests for access to these data should be directed to them (https://www.waterschaplimburg.nl/, Waterschap Limburg, 2023).
The supplement related to this article is available online at: https://doi.org/10.5194/hess-28-3327-2024-supplement.
All authors contributed to the study conception and design. AT performed data curation, software development, and formal analysis. AT wrote the original draft of the manuscript. MR, RvdE, and RU reviewed and edited the manuscript. All authors read and approved the final manuscript.
The contact author has declared that none of the authors has any competing interests.
Publisher's note: Copernicus Publications remains neutral with regard to jurisdictional claims made in the text, published maps, institutional affiliations, or any other geographical representation in this paper. While Copernicus Publications makes every effort to include appropriate place names, the final responsibility lies with the authors.
The authors would like to thank the Royal Netherlands Meteorological Institute (KNMI) and Waterschap Limburg for providing all of the data used in this work. We would also like to thank Deltares for supporting parts of this research.
This research was financially supported by the EMfloodResilience project (project no. EMR228), which was carried out within the context of Interreg V-A Euregio Meuse–Rhine and is partially funded by the European Regional Development Fund.
This paper was edited by Nadav Peleg and reviewed by Rory Nathan and two anonymous referees.
Agor, M. L. C.: Assessment of the long-term rainfall runoff relation of the Geul catchment, Masters thesis, UNESCO – IHE Institute for Water Education, the Netherlands, https://ihedelftrepository.contentdm.oclc.org/digital/collection/masters2/id/43685/rec/7 (last access: 7 November 2023), 2003. a
Alexandersson, H.: A homogeneity test applied to precipitation data, J. Climatol., 6, 661–675, 1986. a
Alexandersson, H. and Moberg, A.: Homogenization of Swedish temperature data. Part I: Homogeneity test for linear trends, Int. J. Climatol., 17, 25–34, 1997. a
Andrés-Doménech, I., García-Bartual, R., Montanari, A., and Marco, J. B.: Climate and hydrological variability: the catchment filtering role, Hydrol. Earth Syst. Sci., 19, 379–387, https://doi.org/10.5194/hess-19-379-2015, 2015. a
Asselman, N., van Heeringen, K.-J., de Jong, J., and Geertsema, T.: Juli 2021 overstroming en wateroverlast in Zuid-Limburg: Eerste bevindingen voor Valkenburg, Geulmonding, Roermonding en Eygelshoven, Tech. rep., report 11207700-000-ZWS-0019, Deltares, the Netherlands, https://www.waterschaplimburg.nl/publish/pages/7013/juli_2021_overstroming_en_wateroverlast_in_zuid-limburg.pdf (last access: 7 November 2023), 2022. a, b
Berghuijs, W. R., Harrigan, S., Molnar, P., Slater, L. J., and Kirchner, J. W.: The relative importance of different flood-generating mechanisms across Europe, Water Resour. Res., 55, 4582–4593, 2019. a, b
Bertola, M., Viglione, A., Lun, D., Hall, J., and Blöschl, G.: Flood trends in Europe: are changes in small and big floods different?, Hydrol. Earth Syst. Sci., 24, 1805–1822, https://doi.org/10.5194/hess-24-1805-2020, 2020. a, b
Bischiniotis, K., van den Hurk, B., Jongman, B., Coughlan de Perez, E., Veldkamp, T., de Moel, H., and Aerts, J.: The influence of antecedent conditions on flood risk in sub-Saharan Africa, Nat. Hazards Earth Syst. Sci., 18, 271–285, https://doi.org/10.5194/nhess-18-271-2018, 2018. a
Blöschl, G., Hall, J., Parajka, J., Perdigão, R. A. P., Merz, B., Arheimer, B., Aronica, G. T., Bilibashi, A., Bonacci, O., Borga, M., Čanjevac, I., Castellarin, A., Chirico, G. B., Claps, P., Fiala, K., Frolova, N., Gorbachova, L., Gül, A., Hannaford, J., Harrigan, S., Kireeva, M., Kiss, A., Kjeldsen, T. R., Kohnová, S., Koskela, J. J., Ledvinka, O., Macdonald, N., Mavrova-Guirguinova, M., Mediero, L., Merz, R., Molnar, P., Montanari, A., Murphy, C., Osuch, M., Ovcharuk, V., Radevski, I., Rogger, M., Salinas, J. L., Sauquet, E., Šraj, M., Szolgay, J., Viglione, A., Volpi, E., Wilson, D., Zaimi, K., and Živković, N.: Changing climate shifts timing of European floods, Science, 357, 588–590, 2017. a
Blöschl, G., Hall, J., Viglione, A., Perdigão, R. A. P., Parajka, J., Merz, B., Lun, D., Arheimer, B., Aronica, G. T., Bilibashi, A., Boháč, M., Bonacci, O., Borga, M., Čanjevac, I., Castellarin, A., Chirico, G. B., Claps, P., Frolova, N., Ganora, D., Gorbachova, L., Gül, A., Hannaford, J., Harrigan, S., Kireeva, M., Kiss, A., Kjeldsen, T. R., Kohnová, S., Koskela, J. J., Ledvinka, O., Macdonald, N., Mavrova-Guirguinova, M., Mediero, L., Merz, R., Molnar, P., Montanari, A., Murphy, C., Osuch, M., Ovcharuk, V., Radevski, I., Salinas, J. L., Sauquet, E., Šraj, M., Szolgay, J., Volpi, E., Wilson, D., Zaimi, K., and Živković, N.: Changing climate both increases and decreases European river floods, Nature, 573, 108–111, 2019. a, b
Brauer, C., van der Velde, Y., Teuling, A., and Uijlenhoet, R.: The hupsel brook catchment: Insights from five decades of lowland observations, Vadose Zone J., 17, 1–8, 2018. a
Buishand, T. A.: Tests for detecting a shift in the mean of hydrological time series, J. Hydrol., 73, 51–69, 1984. a
Buishand, T. A., De Martino, G., Spreeuw, J., and Brandsma, T.: Homogeneity of precipitation series in the Netherlands and their trends in the past century, Int. J. Climatol., 33, 815–833, 2013. a
Cao, Q., Mehran, A., Ralph, F. M., and Lettenmaier, D. P.: The role of hydrological initial conditions on Atmospheric River floods in the Russian River basin, J. Hydrometeorol., 20, 1667–1686, 2019. a
Di Baldassarre, G. and Montanari, A.: Uncertainty in river discharge observations: a quantitative analysis, Hydrol. Earth Syst. Sci., 13, 913–921, https://doi.org/10.5194/hess-13-913-2009, 2009. a
Do, H. X., Westra, S., and Leonard, M.: A global-scale investigation of trends in annual maximum streamflow, J. Hydrol., 552, 28–43, 2017. a, b
Douinot, A., Iffly, J. F., Tailliez, C., Meisch, C., and Pfister, L.: Flood patterns in a catchment with mixed bedrock geology and a hilly landscape: identification of flashy runoff contributions during storm events, Hydrol. Earth Syst. Sci., 26, 5185–5206, https://doi.org/10.5194/hess-26-5185-2022, 2022. a
Dunn, R. J. H., Alexander, L. V., Donat, M. G., Zhang, X., Bador, M., Herold, N., Lippmann, T., Allan, R., Aguilar, E., Barry, A. A., Brunet, M., Caesar, J., Chagnaud, G., Cheng, V., Cinco, T., Durre, I., de Guzman, R., Htay, T. M., Wan Ibadullah, W. M., Bin Ibrahim, M. K. I., Khoshkam, M., Kruger, A., Kubota, H., Leng, T. W., Lim, G., Li-Sha, L., Marengo, J., Mbatha, S., McGree, S., Menne, M., de los Milagros Skansi, M., Ngwenya, S., Nkrumah, F., Oonariya, C., Pabon-Caicedo, J. D., Panthou, G., Pham, C., Rahimzadeh, F., Ramos, A., Salgado, E., Salinger, J., Sané, Y., Sopaheluwakan, A., Srivastava, A., Sun, Y., Timbal, B., Trachow, N., Trewin, B., van der Schrier, G., Vazquez-Aguirre, J., Vasquez, R., Villarroel, C., Vincent, L., Vischel, T., Vose, R., and Bin Hj Yussof, M. N. A.: Development of an updated global land in situ-based data set of temperature and precipitation extremes: HadEX3, J. Geophys. Res.-Atmos., 125, e2019JD032263, https://doi.org/10.1029/2019JD032263, 2020. a
Garg, S. and Mishra, V.: Role of extreme precipitation and initial hydrologic conditions on floods in Godavari river basin, India, Water Resour. Res., 55, 9191–9210, 2019. a
Haan, C. T.: Statistical methods in hydrology, in: 2nd Edn., Wiley-Blackwell, ISBN 13:978-0813815039, 2002. a
Hannaford, J., Buys, G., Stahl, K., and Tallaksen, L. M.: The influence of decadal-scale variability on trends in long European streamflow records, Hydrol. Earth Syst. Sci., 17, 2717–2733, https://doi.org/10.5194/hess-17-2717-2013, 2013. a
Hannaford, J., Mastrantonas, N., Vesuviano, G., and Turner, S.: An updated national-scale assessment of trends in UK peak river flow data: how robust are observed increases in flooding?, Hydrol. Res., 52, 699–718, 2021. a, b
Hussain, M. and Mahmud, I.: pyMannKendall: a python package for non parametric Mann Kendall family of trend tests, Journal of Open Source Software, 4, 1556, https://doi.org/10.21105/joss.01556, 2019. a
Ivancic, T. J. and Shaw, S. B.: Examining why trends in very heavy precipitation should not be mistaken for trends in very high river discharge, Climatic Change, 133, 681–693, 2015. a
Journée, M., Goudenhoofdt, E., Vannitsem, S., and Delobbe, L.: Quantitative rainfall analysis of the 2021 mid-July flood event in Belgium, Hydrol. Earth Syst. Sci., 27, 3169–3189, https://doi.org/10.5194/hess-27-3169-2023, 2023. a
Kendall, M. G.: Rank Correlation Methods, Hafner Publishing Company, New York, 196 pp., 1955. a
Klein, A.: Hydrological Response of the Geul Catchment to the Rainfall in July 2021, Masters thesis, Delft University of Technology, Delft, the Netherlands, http://resolver.tudelft.nl/uuid:ee25d687-70af-4aca-ae41-78e3f83943bf (last access: 7 November 2023), 2022. a, b
Klein, A., Rutten, M. M., van Heeringen, K.-J., and Uijlenhoet, R.: Reconstruction of the hydrological response of the Geul catchment to the extreme rainfall in July 2021, in preparation, 2024. a
Klein Tank, A. M. G., Wijngaard, J. B., Können, G. P., Böhm, R., Demarée, G., Gocheva, A., Mileta, M., Pashiardis, S., Hejkrlik, L., KernHansen, C., Heino, R., Bessemoulin, P., Müller-Westermeier, G., Tzanakou, M., Szalai, S., Pálsdóttir, T., Fitzgerald, D., Rubin, S., Capaldo, M., Maugeri, M., Leitass, A., Bukantis, A., Aberfeld, R., van Engelen, A. F. V., Forland, E., Mietus, M., Coelho, F., Mares, C., Razuvaev, V., Nieplova, E., Cegnar, T., Antonio López, J. A., Dahlström, B., Moberg, A., Kirchhofer, W., Ceylan, A., Pachaliuk, O., Alexander, L. V., and Petrovic, P.: Daily dataset of 20th-century surface air temperature and precipitation series for the European Climate Assessment, Int. J. Climatol., 22, 1441–1453, 2002. a
KNMI: KNMI'23 klimaatscenario's voor Nederland, Tech. rep., KNMI – Royal Netherlands Meteorological Institute, https://cdn.knmi.nl/system/data_center_publications/files/000/071/901/original/KNMI23_klimaatscenarios_gebruikersrapport_23-03.pdf (last access: 10 October 2023), 2023. a, b
Kreienkamp, F., Philip, S. Y., Tradowsky, J. S., Kew, S. F., Lorenz, P., Arrighi, J., Belleflamme, A., Bettmann, T., Caluwaerts, S., Chan, S. C., Ciavarella, A., Cruz, L. D., de Vries, H., Demuth, N., Ferrone, A., Fischer, E. M., Fowler, H. J., Goergen, K., Heinrich, D., Henrichs, Y., Lenderink, G., Kaspar, F., Nilson, E., Otto, F. E. L., Ragone, F., Seneviratne, S. I., Singh, R. K., Skålevåg, A., Termonia, P., Thalheimer, L., van Aalst, M., den Bergh, J. V., de Vyver, H. V., Vannitsem, S., van Oldenborgh, G. J., Van Schaeybroeck, B., Vautard, R., Vonk, D., and Wanders, N.: Rapid attribution of heavy rainfall events leading to the severe flooding in Western Europe during July 2021, WWA – World Weather Attribution, https://www.worldweatherattribution.org/wp-content/uploads/Scientific-report-Western-Europe-floods-2021-attribution.pdf (last access: 7 November 2023), 2021. a
Łupikasza, E.: Spatial and temporal variability of extreme precipitation in Poland in the period 1951–2006, Int. J. Climatol., 30, 991–1007, 2010. a, b
Łupikasza, E. B., Hänsel, S., and Matschullat, J.: Regional and seasonal variability of extreme precipitation trends in southern Poland and central-eastern Germany 1951–2006, Int. J. Climatol., 31, 2249–2271, 2011. a, b
Mann, H. B.: Nonparametric tests against trend, Econometrica, 13, 245–259, 1945. a
Marchi, L., Borga, M., Preciso, E., and Gaume, E.: Characterisation of selected extreme flash floods in Europe and implications for flood risk management, J. Hydrol., 394, 118–133, 2010. a, b, c, d
Mohr, S., Ehret, U., Kunz, M., Ludwig, P., Caldas-Alvarez, A., Daniell, J. E., Ehmele, F., Feldmann, H., Franca, M. J., Gattke, C., Hundhausen, M., Knippertz, P., Küpfer, K., Mühr, B., Pinto, J. G., Quinting, J., Schäfer, A. M., Scheibel, M., Seidel, F., and Wisotzky, C.: A multi-disciplinary analysis of the exceptional flood event of July 2021 in central Europe – Part 1: Event description and analysis, Nat. Hazards Earth Syst. Sci., 23, 525–551, https://doi.org/10.5194/nhess-23-525-2023, 2023. a
MunichRe: Hurricanes, cold waves, tornadoes: Weather disasters in USA dominate natural disaster losses in 2021, Europe: Extreme flash floods with record losses, https://www.munichre.com/en/company/media-relations/media-information-and-corporate-news/media-information/2022/natural-disaster-losses-2021.html (last access: 7 November 2023), 2022. a
Murphy, C., Wilby, R. L., Matthews, T. K. R., Thorne, P., Broderick, C., Fealy, R., Hall, J., Harrigan, S., Jones, P., McCarthy, G., MacDonald, N., Noone, S., and Ryan, C.: Multi-century trends to wetter winters and drier summers in the England and Wales precipitation series explained by observational and sampling bias in early records, Int. J. Climatol., 40, 610–619, 2020. a, b
Nanditha, J. S. and Mishra, V.: Multiday Precipitation Is a Prominent Driver of Floods in Indian River Basins, Water Resour. Res., 58, e2022WR032723, https://doi.org/10.1029/2022WR032723, 2022. a, b, c, d, e, f, g
Norbiato, D., Borga, M., Degli Esposti, S., Gaume, E., and Anquetin, S.: Flash flood warning based on rainfall thresholds and soil moisture conditions: An assessment for gauged and ungauged basins, J. Hydrol., 362, 274–290, 2008. a
Royal Netherlands Meteorological Institute: Daily precipitation time series for the manual rain gauge network in the Netherlands, https://www.knmi.nl/nederland-nu/klimatologie/monv/reeksen (last access: 30 September 2023), 2023a. a
Royal Netherlands Meteorological Institute: Time series for the meteorological stations in the Netherlands, https://daggegevens.knmi.nl/klimatologie/daggegevens (last access: 30 September 2023), 2023b. a
Schär, C., Ban, N., Fischer, E. M., Rajczak, J., Schmidli, J., Frei, C., Giorgi, F., Karl, T. R., Kendon, E. J., Klein Tank, A. M. G., O'Gorman, P. A., Sillmann, J., Zhang, X., and Zwiers, F. W.: Percentile indices for assessing changes in heavy precipitation events, Climatic Change, 137, 201–216, 2016. a
Sharma, A., Wasko, C., and Lettenmaier, D. P.: If Precipitation Extremes Are Increasing, Why Aren't Floods?, Water Resour. Res., 54, 8545–8551, 2018. a
Slager, K.: Gevolgen overstromingen Limburg: Inventarisatie en duiding, Tech. rep. 11207700-007-ZWS-0011, Deltares, the Netherlands, https://publications.deltares.nl/11207700_007_0011.pdf (last access: 7 November 2023), 2023. a
Sperna-Weiland, F., Hegnauer, M., Bouaziz, L., and Beersma, J.: Implications of the KNMI'14 Climatescenarios for the Discharge of the Rhine and Meuse: Comparison with Earlier Scenario Studies, Deltares, https://cdn.knmi.nl/system/data_center_publications/files/000/069/856/original/1220042000zws0004rimplications_of_the_knmi14_climate_scenarios_for_the_discharge_of_the_rhine_and_meuse_definitief3.pdf?1495622005 (last access: 7 November 2023), 2015. a
Squintu, A. A., van der Schrier, G., van den Besselaar, E., van der Linden, E., Putrasahan, D., Roberts, C., Roberts, M., Scoccimarro, E., Senan, R., and Klein Tank, A. M. G.: Evaluation of trends in extreme temperatures simulated by HighResMIP models across Europe, Clim. Dynam., 56, 2389–2412, 2021. a
Task Force Fact Finding hoogwater: Hoogwater 2021: Feiten en Duiding, Tech. rep., Expertise Netwerk Waterveiligheid, https://doi.org/10.4233/uuid:06b03772-ebe0-4949-9c4d-7c1593fb094e (last access: 7 November 2023), 2021. a, b
Thewissen, A.: Flood event of July 2021: How extreme were the floods in the Ahr, Vesdre and Geul?, Masters thesis, Delft University of Technology, the Netherlands, http://resolver.tudelft.nl/uuid:a7436524-e11b-4922-8637-6a74a1868f04 (last access: 7 November 2023), 2022. a, b, c
Tramblay, Y., Villarini, G., El Khalki, E. M., Gründemann, G., and Hughes, D.: Evaluation of the drivers responsible for flooding in Africa, Water Resour. Res., 57, e2021WR029595, https://doi.org/10.1029/2021WR029595, 2021. a, b
Tsiokanos, A.: Investigation of the Impacts of Climate Variability and Land Use Changes on the Hydrology of the Geul River Catchment, Masters thesis, Delft University of Technology, the Netherlands, http://resolver.tudelft.nl/uuid:bf03fedd-88a1-4cb0-a72a-1487dcf56402, (last access: 7 November 2023), 2022. a, b
Tu, M.: Assessment of the effects of climate variability and land use change on the hydrology of the Meuse river basin, PhD dissertation, Vrije Universiteit Amsterdam, the Netherlands and UNESCO-IHE Institute for Water Education, the Netherlands, https://research.vu.nl/ws/portalfiles/portal/80382579/complete+dissertation.pdf (last access: 7 November 2023), 2006. a, b, c, d
van der Deijl, E.: Validatie hoogwater Maas juli 2021, Tech. rep., report 11208053-002-ZWS-0006, Deltares, the Netherlands, https://publications.deltares.nl/11208053_002_0006.pdf (last access: 7 November 2023), 2023. a
van Heeringen, K.-J., Asselman, N., Overeem, A., Beersma, J., and Philip, S.: Analyse overstroming Valkenburg. Watersysteemevaluatie Waterschap Limburg, Tech. rep., report 11207700-000-ZWS-0014, Deltares, the Netherlands, https://www.waterschaplimburg.nl/actueel/nieuws/@7103/resultaten-case-studies-vier/, (last access: 7 November 2023), 2022. a
Wasko, C. and Nathan, R.: Influence of changes in rainfall and soil moisture on trends in flooding, J. Hydrol., 575, 432–441, 2019. a
Wasko, C., Nathan, R., and Peel, M. C.: Changes in antecedent soil moisture modulate flood seasonality in a changing climate, Water Resour. Res., 56, e2019WR026300, https://doi.org/10.1029/2019WR026300, 2020. a, b
Waterschap Limburg: https://www.waterschaplimburg.nl/ (last access: 19 July 2024), 2024. a
Woldemeskel, F. and Sharma, A.: Should flood regimes change in a warming climate? The role of antecedent moisture conditions, Geophys. Res. Lett., 43, 7556–7563, 2016. a
Yang, L., Yang, Y., Villarini, G., Li, X., Hu, H., Wang, L., Blöschl, G., and Tian, F.: Climate more important for Chinese flood changes than reservoirs and land use, Geophys. Res. Lett., 48, e2021GL093061, 2021. a
Zanon, F., Borga, M., Zoccatelli, D., Marchi, L., Gaume, E., Bonnifait, L., and Delrieu, G.: Hydrological analysis of a flash flood across a climatic and geologic gradient: The September 18, 2007 event in Western Slovenia, J. Hydrol., 394, 182–197, 2010. a