the Creative Commons Attribution 4.0 License.
the Creative Commons Attribution 4.0 License.
 | 25 Jul 2024
Impact of reservoir evaporation on future water availability in north-eastern Brazil: a multi-scenario assessment
Gláuber Pontes Rodrigues
Arlena Brosinsky
Ítalo Sampaio Rodrigues
George Leite Mamede
José Carlos de Araújo
The potential effects of climatic changes on water resources are crucial to be assessed, particularly in dry regions such as north-east Brazil (1 million km2), where water supply is highly reliant on open-water reservoirs. This study analyses the impact of evaporation (by the Penman method) on water availability for four scenarios based on two regional climatic models (Eta-CanESM2 and Eta-MIROC5) using the Representative Concentration Pathways (RCPs) 4.5 and 8.5. We compared the water availability in the period of 2071–2100 with that of the historical period (1961–2005). The scenarios derived from the Eta-CanESM2 model indicate an increase in the dry-season evaporative rate (2 % and 6 %, respectively) by the end of the century. Unlike the above scenarios, the ones derived from the Eta-MIROC5 model both show a change in the dry-season evaporative rate of −2 %. Consequently, for a 90 % reliability level, the expected reservoir capacity to supply water with high reliability is reduced by 80 %. It is reasonable to state that both patterns of future evaporation in the reservoirs may prove to be plausible. Because model-based projections of climate impact on water resources can be quite divergent, it is necessary to develop adaptations that do not need quantitative projections of changes in hydrological variables but rather ranges of projected values. Our analysis shows how open-water reservoirs might be impacted by climate change in dry regions. These findings complement a body of knowledge on the estimation of water availability in a changing climate and provide new data on and insights into water management in reservoir-dependent drylands.
- Article
(7327 KB) - Full-text XML
-
Supplement
(802 KB) - BibTeX
- EndNote


The increasing atmospheric concentration of greenhouse gases is changing the Earth's climate more rapidly than ever before (Konapala et al., 2020). Expected changes in climate variables, such as rainfall and temperature, may result in alterations in the hydrological cycle and, thus, the necessity of adaptations of current reservoir management strategies (Minville et al., 2010). As climate changes, it is imperative to identify its impact on the water supply, especially with respect to open-water reservoirs located in drylands.
As stated by Adrian et al. (2009), lakes, reservoirs and other inland open-water surfaces are likely to serve as good sentinels of current climate change because (1) aquatic ecosystems are well defined and are studied in a continuous way; (2) they respond directly to climate change and also incorporate the effects of climate-driven changes occurring within the catchment; (3) they integrate responses over time, which can filter out random noise; and (4) they are distributed worldwide and, as such, can act as sentinels in many different geographic locations and climatic regions, capturing different aspects of climate change (e.g. rising temperature, glacier retreats, and permafrost melting). Indeed, several investigations worldwide have highlighted the impact of climate change on water resources. Reservoirs are essential infrastructures for the economic and social development of the region, and their evaporation losses are significant for the water system and can severely impact water availability and allocation (Malveira et al., 2012; Mamede et al., 2012; Peter et al., 2014).
In hydrology and in studies relating to water availability, free-surface evaporation plays an important role. However, despite numerous approaches developed over the last 200 years to estimate evaporation (McMahon et al., 2016), there are still uncertainties within concerning evaporation assessment, and the main reasons for this are the high cost of maintaining the equipment (including personnel training), the numerous parameters needed to apply the equations, and the use of databases located far from the respective waterbodies (for instance, class-A pans or meteorological stations). Additionally, remote sensing tools can assist in monitoring evaporation (Cui et al., 2019) and water volume loss in general (Zhang et al., 2021). As stated by Su (2002), conventional techniques that employ point measurements to estimate the components of energy balance are representative only of local scales and cannot be extended to large areas because of the heterogeneity of land surfaces and the dynamic nature of heat transfer processes. Remote sensing is probably the only technique which can provide representative measurements of several relevant physical parameters on a scale from a point to a continent. Techniques using remote sensing information to estimate atmospheric turbulent fluxes are therefore essential when dealing with processes that cannot be represented by point measurements only.
Climate change plays a critical role in the planning of water resources: the water cycle is expected to be accelerated because of the temperature increase; in warm climates, climate change is expected to worsen water shortage episodes. Investigations show the sensitivity of inland waterbodies as physical, chemical, and biological water properties respond rapidly to climate-related changes (Adrian et al., 2009; Rosenzweig et al., 2007). Climate change is studied using global circulation models, usually with a coarse spatial resolution of hundreds of kilometres, disregarding regional factors in the process of modelling (Chou et al., 2014; Navarro-Racines et al., 2020), hence the importance of regional climate models (RCMs), which have a finer resolution (usually tens of kilometres) and consider local factors such as topography, land cover, and land use. One of the issues addressed refers to the resilience of metropolitan areas to climate change, where major problems may be related to rapid changes in water supply among others (Lyra et al., 2018).
The metropolitan region of Fortaleza (MRF) has a population of over 4 million inhabitants (IBGE, 2022) is one of the most densely populated areas in Brazil. Its water supply is highly dependent on an extensive network of open-water reservoirs almost entirely located in the semiarid region (Mamede et al., 2018; Peter et al., 2014). Despite the well-known sensitivity of dry regions to changes in climate, little is yet known about the impacts on water resources in this region and how water availability may be affected by climate change. With this investigation, we intend to increase the amount of information that currently exists on the potential impacts of climate change on water resources in north-east Brazil. After several studies in this region have focused on temperature variation (Marengo et al., 2009) and precipitation (Almagro et al., 2020), our analysis will contribute to the growing body of knowledge on surface water reservoirs and how they respond to climate change.
More specifically, the objective of this research was to analyse the impact of climate change on reservoir evaporation and consequently on water availability in the MRF, a densely populated urban area located in north-eastern Brazil. To achieve this goal, we (i) assessed historical and present evaporation by means of a weather station and remote sensing calculations, (ii) compared them to historical and future simulations based on four climate change scenarios, and (iii) investigated the impact of evaporation change on water availability using stochastic modelling.
The state of Ceará is situated in the north-eastern region of Brazil (Fig. 1), which is mostly semiarid (BSh according to Köppen classification), a dryland where various studies on the impacts of climate change have shown susceptibility to severe climate extremes and, more prominently, droughts (Alvalá et al., 2019; Marengo et al., 2017, 2022). The average rainfall in the region ranges from 500 to 800 mm yr−1 (of which 80 % occurs between January and April) and the average annual temperature is 26 °C (INMET – Brazilian National Institute of Meteorology, 2019; Rodrigues et al., 2021a). This region has high water vulnerability resulting from irregular rainfall associated with ephemeral rivers, high potential evaporation rates exceeding 2000 mm yr−1, and shallow soils over crystalline basement (de Araújo and Piedra, 2009; Medeiros and de Araújo, 2014). This soil feature allows for limited storage of water (Alvalá et al., 2019), which, when present, is often salty because of the prevalence of fissural aquifers in crystalline bedrock.
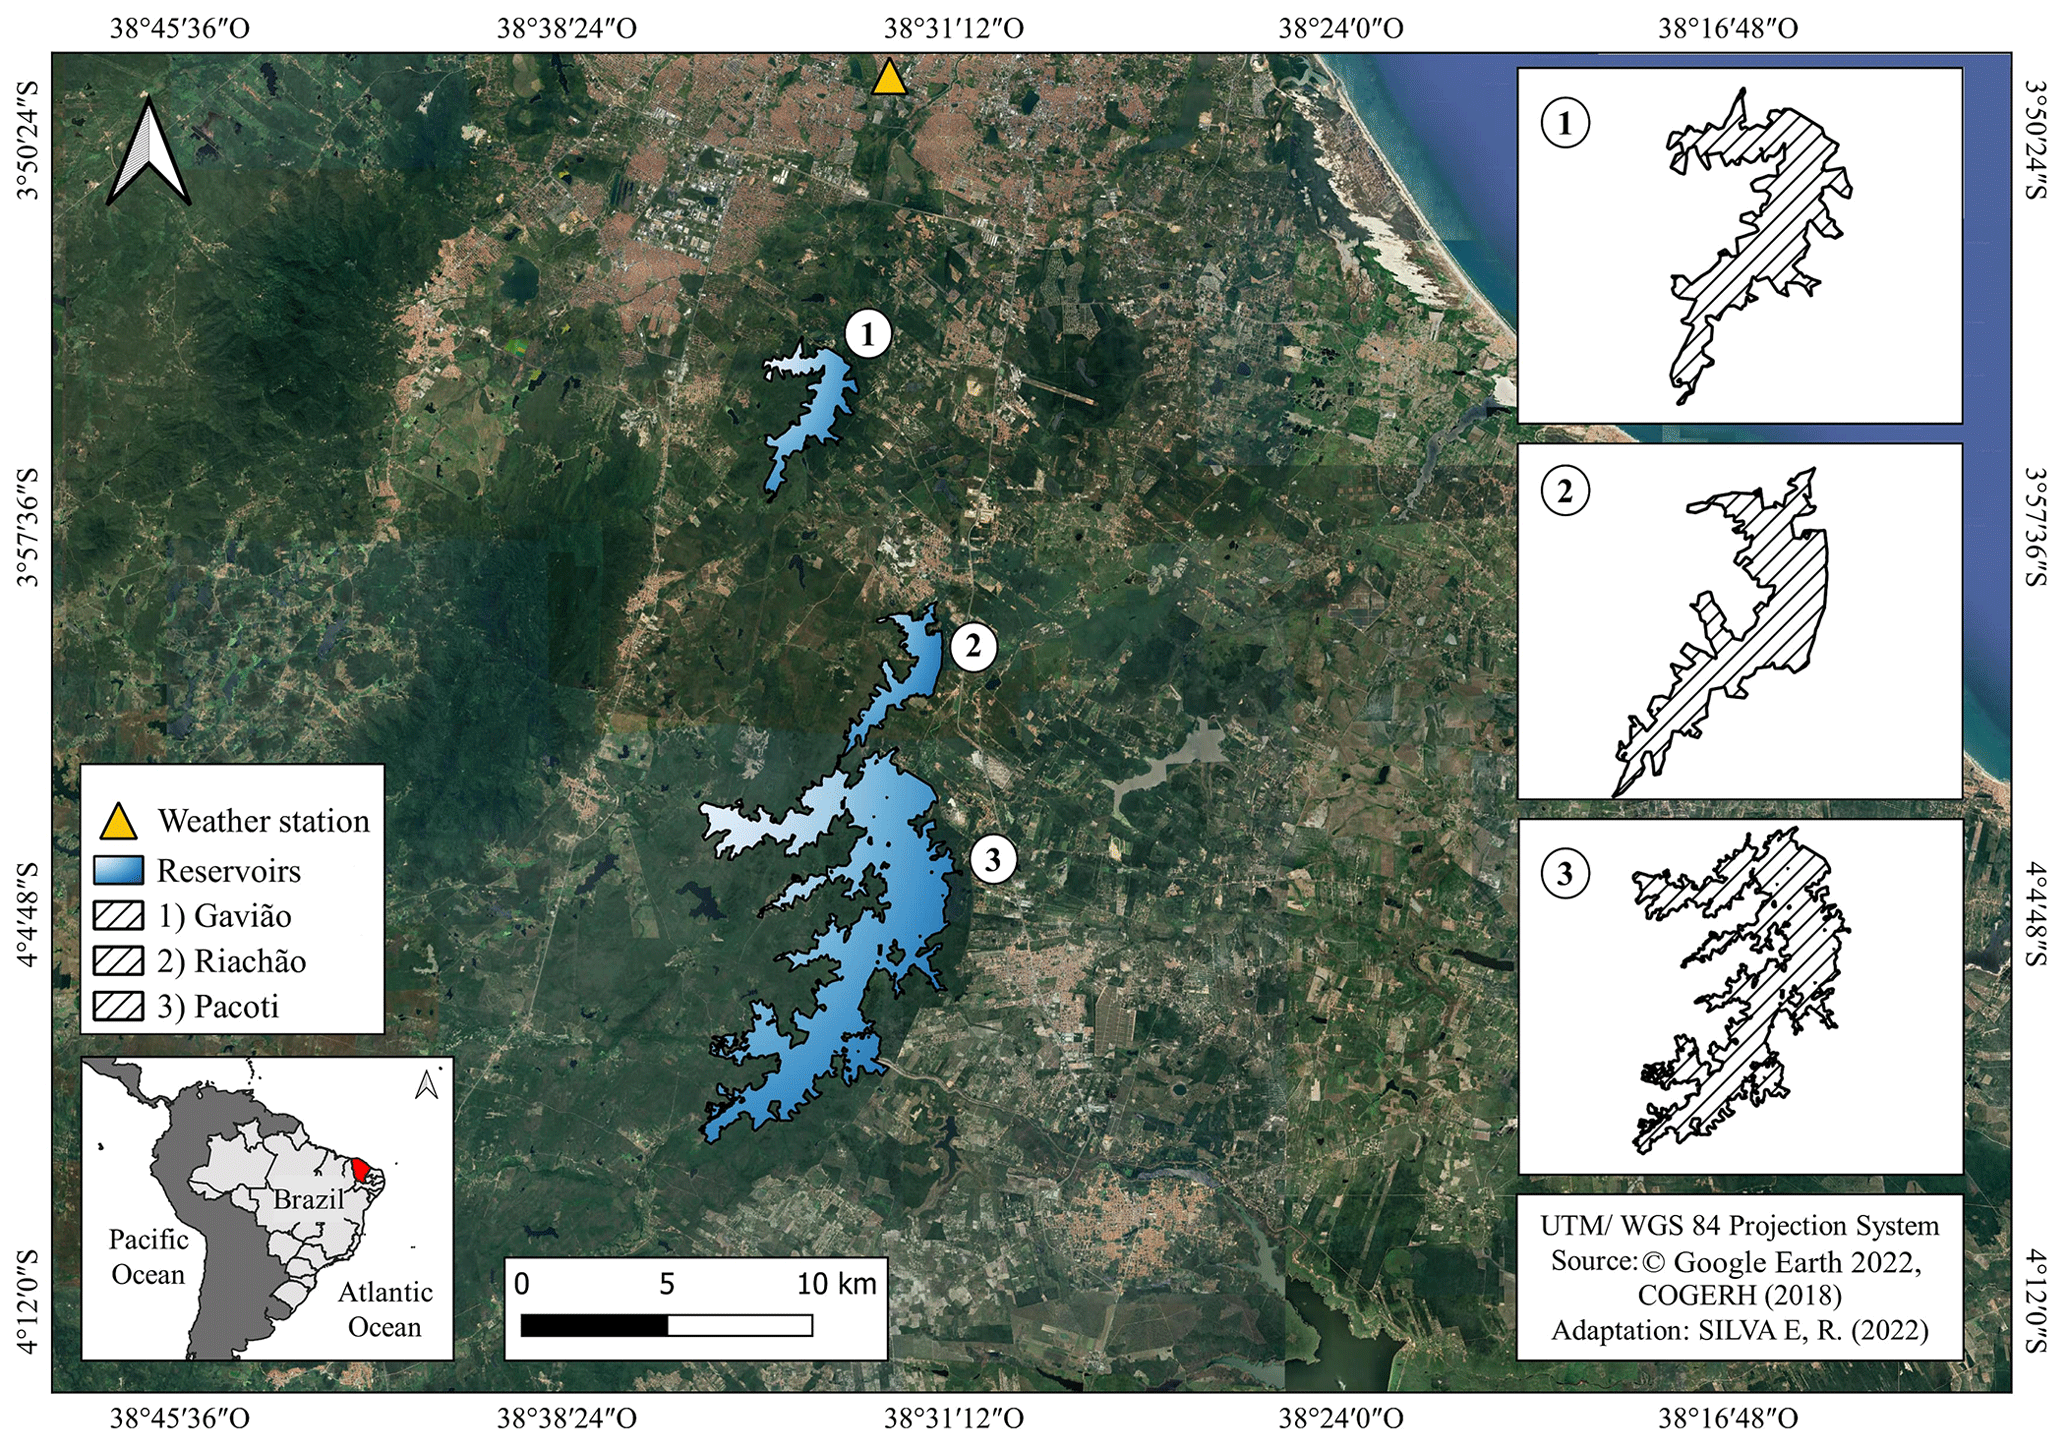
Figure 1Location of the state of Ceará (bottom left) and the major reservoirs that supply the metropolitan region of Fortaleza, the hydrographic network, and the INMET (Brazilian National Institute of Meteorology) weather station. Daily meteorological observed variables from the station were used, spanning 1961 to 2005.
The reservoirs studied in this research are located in a tropical coastal area whose climate is slightly different from the predominant semiarid condition described above (rainfall of 1600 mm yr−1 and relative humidity of 78 %); however, they are supplied by a water system from the drylands.
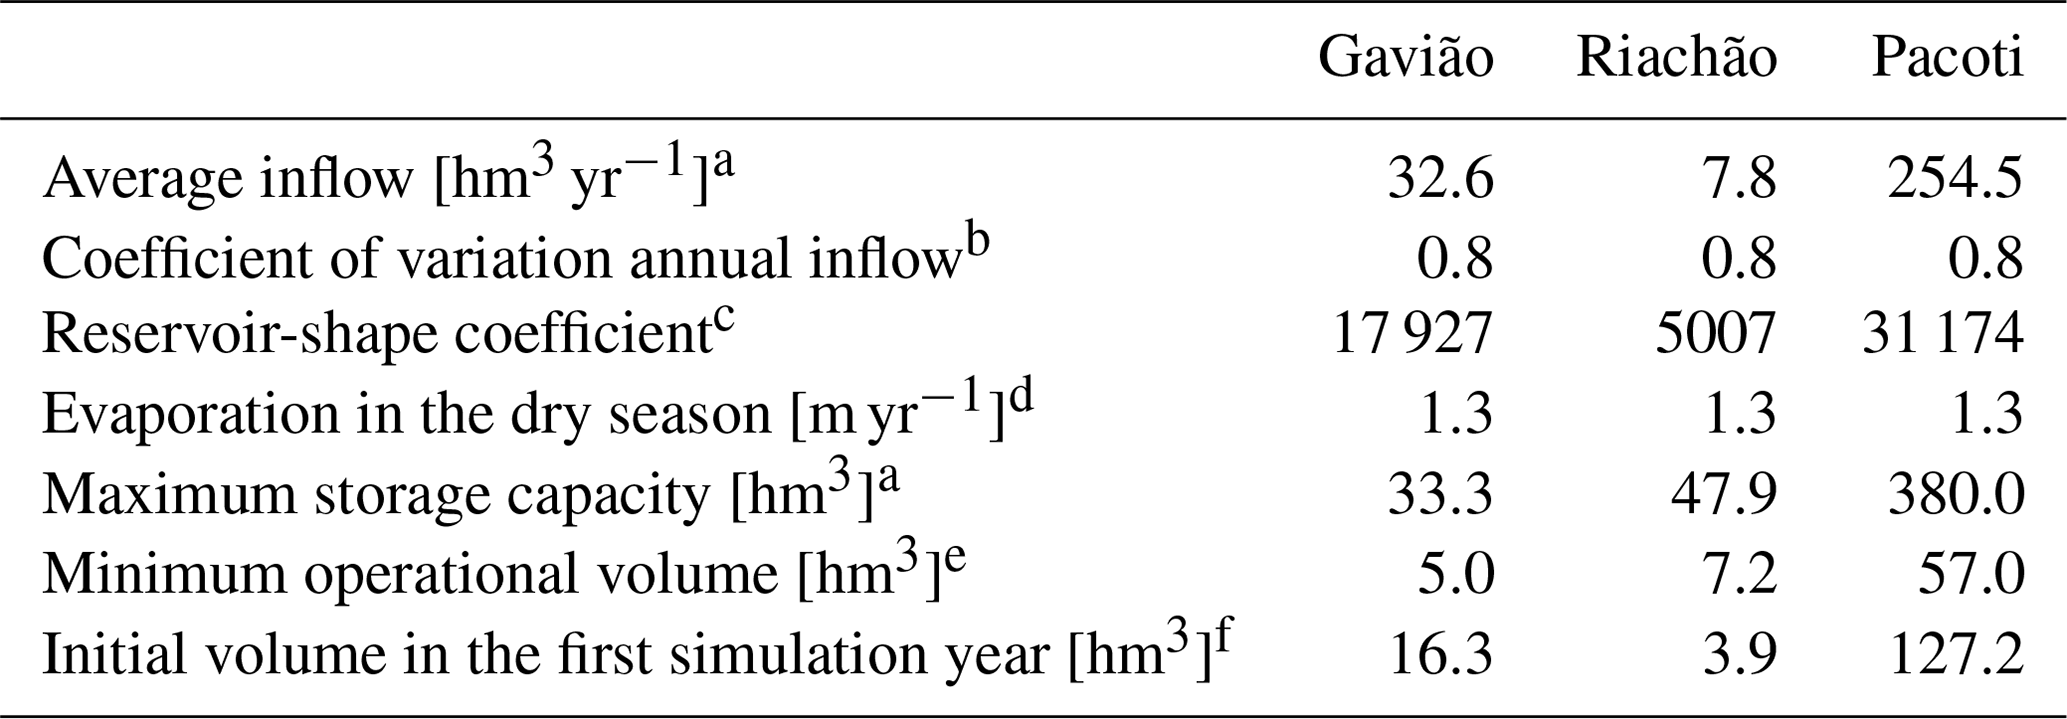
The reservoirs under analysis (Pacoti, Riachão, and Gavião; see Table 1 and Fig. 1) are responsible for supplying water to the 4.2 million inhabitants of the MRF region and comprise the downstream sector of a network of reservoirs located in the sub-humid area. Unlike the reservoirs that supply them, the water level of the three reservoirs does not substantially decrease during the dry season due to an interbasin transfer that provides water.
Table 1Technical characteristics of Pacoti, Riachão, and Gavião reservoirs.
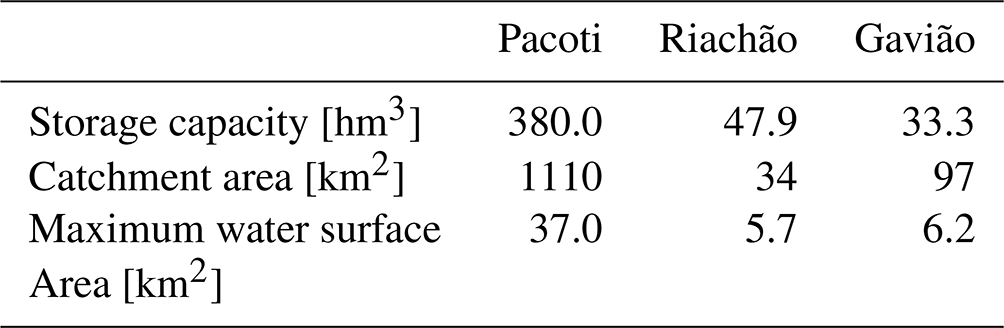
Source: Ceará State Secretariat for Water Resources (2022).
We used the regional Eta model (Mesinger et al., 2012) nested in two global circulation models (CanESM-2 and MIROC5) with Representative Concentration Pathways (RCPs) 4.5 and 8.5. The investigation was performed in three phases: the first consisted of the simulation of the regional evaporation pattern with bias correction; the second consisted of the combined application of remote sensing and on-site measurements to assess open-water evaporation; and on the third, we analysed the impact of evaporation changes on water availability for four scenarios. For ease and convenience, the four scenarios are hereafter referred to as C4 (model Eta-CanESM2 and Pathway 4.5), C8 (model Eta-CanESM2 and Pathway 8.5), M4 (model Eta-MIROC5 and Pathway 4.5), and M8 (model Eta-MIROC5 and Pathway 8.5). The methodological framework is presented in Fig. 2. All climate projections set time slices as follows: historical (1961–2005), near-term (2006–2040), mid-term (2041–2070), and long-term (2071–2099).
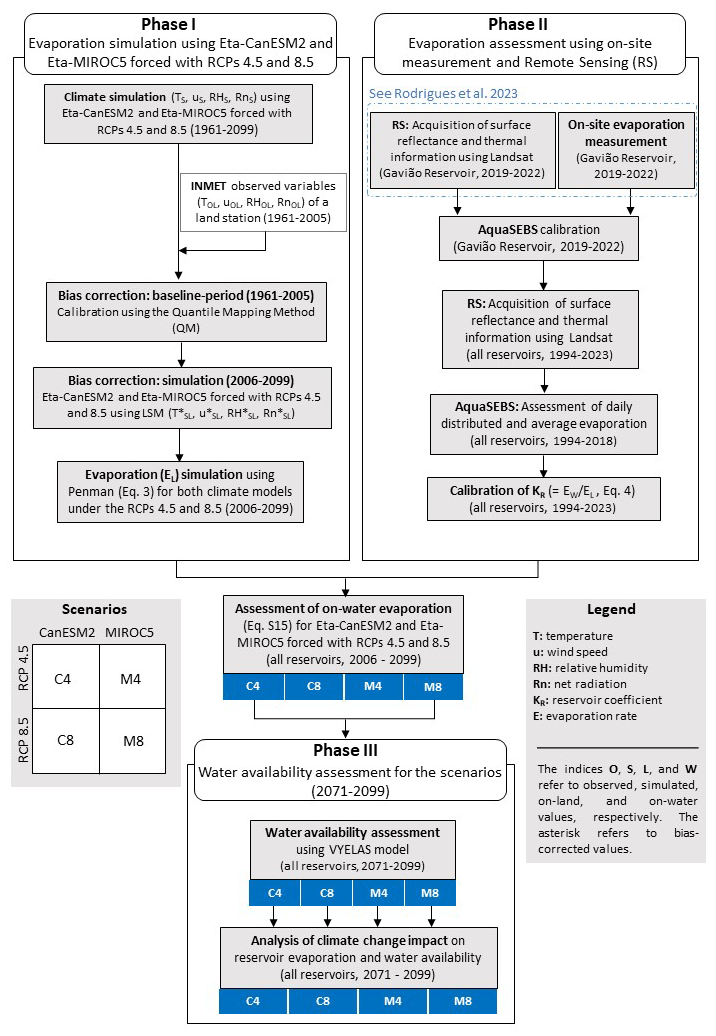
Figure 2Methodological flowchart for the simulation of evaporation with climate models and assessment of water availability.
It is outside the scope of this work to study the effects on the general hydrology of the MRF, but we rather focus on a single hydrological process which is a major cause of water losses in the whole region.
3.1 Phase I: evaporation simulation forced with RCPs 4.5 and 8.5
The database used in this research is provided by the Brazilian National Institute for Space Research (INPE) on the PROJETA platform (see https://doi.org/10.57810/lattesdata/WAVGSL, Tavares et al., 2023). That is the official source of downscaled climate data for the Brazilian territory with the Eta regional model (Mesinger et al., 2014). The latest version of the platform provides parameters downscaled from three global circulation models (CanESM-2, MIROC5, and HadGEM2-ES) forced with the Eta model, with a spatial resolution of 20 km for the study area. The Representative Concentration Pathways available on the platform are Pathway 4.5 and Pathway 8.5. According to Chou et al. (2014), the Brazilian model has been used operationally at INPE since 1997 for weather forecasts and since 2002 for seasonal climate forecasts.
Since the Fifth Assessment Report (AR5) from the Intergovernmental Panel on Climate Change (IPCC, 2014), the greenhouse gas concentration scenarios have been based on the Representative Concentration Pathways (RCPs), which are expressed in terms of radiative forcing toward the end of the 21st century. In this study, the downscaled products were simulated based on RCP4.5 and RCP8.5. The first provides a climate forcing that reaches 4.5 W m−2 by 2050, with further stabilisation; the latter provides continued growth of the radiative forcing to reach 8.5 W m−2 by 2100 (Bjørnæs, 2013).
Outputs from regional climate models are often prone to systematic errors (biases); therefore, bias correction is recommended (Graham et al., 2007) for simulation reliability purposes (Teutschbein and Seibert, 2012). To correct bias, we applied the quantile mapping method, which is widely used in climate and hydrological modelling (Thrasher et al., 2012; Teutschbein and Seibert, 2012) to improve the accuracy and reliability of model simulations, particularly in regions or variables where models exhibit systematic biases. It is a flexible and computationally efficient method that can be applied to a wide range of climate-related variables and datasets.
3.2 Phase II: evaporation assessment using on-site measurement and remote sensing
3.2.1 On-land (EL) evaporation assessment
Daily meteorological observed variables from a station of the Brazilian National Institute of Meteorology (INMET) were used for bias correction of the climate model for the period from 1961 to 2005 (station code 82397, Fortaleza). The station was chosen due to two aspects: it is the nearest weather station to the reservoirs (15 km away) and it boasts a relatively extensive historical dataset dating back to 1961, exhibiting fewer flaws compared to neighbouring stations. To assess on-land evaporation, we used Eq. (1) of Penman (1948):
In Eq. (3), EL is the open-water evaporation rate (mm d−1), Rn is the net radiation at the water surface (MJ m−2 d−1), Δ is the slope of the saturation vapour pressure curve (kPa °C−1) at air temperature, es−ea is the difference between saturation and partial water vapour pressure (kPa), γ is the psychrometric coefficient, ρ is the density of water (1000 kg m−3), and λv is the latent heat of vaporisation. The procedure to obtain γ and λ is described in Annex 2 of the Food and Agriculture Organisation (FAO) of the United Nations protocol no. 56 (Allen et al., 1998). In Eq. (1), f(u) is a function used to account for the advective drying effects of wind (mm d−1 kPa−1). In Eq. (2), u is the wind speed at 2 m height (m s−1). We have adopted the Penman (1956) form of the wind function.
A trend analysis was performed using the Mann–Kendall method (Kendall, 1975; Mann, 1945), applied to both the calculated and the simulated Penman evaporation. The null hypothesis is that there is no trend in the series. The three hypotheses evaluated are (i) no trend, (ii) positive trend, and (iii) negative trend. A significance level of p= 0.05 was adopted. The magnitude of the changes was evaluated by the nonparametric Sen's slope and Kendall's tau (τ) coefficient which describes the relationship between variables.
3.2.2 On-water (EW) evaporation assessment
The on-water evaporation rate was estimated with the remote sensing algorithm AquaSEBS (Surface Energy Balance of Fresh and Saline Waters; see Abdelrady et al., 2016). The algorithm is a modification of Su (2002) and was developed to estimate the heat fluxes by integrating satellite data and hydro-meteorological field data. It has been validated on the study region (Rodrigues et al., 2021a, b) and requires three sets of data as input: (i) remote sensing data, including emissivity, surface albedo and surface temperature; (ii) meteorological data; and (iii) radiative forcing parameters (Abdelrady et al., 2016), such as downward short-wave and long-wave radiations. For the temporal estimation of evaporation, the following were used: bands 1 to 5 (reflectance) and band 6 (thermal) from Landsat 5 (Thematic Mapper – TM) and bands 1 to 7 (reflectance) and band 10 (thermal) from Landsat 8 (Optical Land Imager – OLI). Due to the technical characteristics of the sensors (radiometric, spectral, and thermal band spatial resolutions), methodological adjustments were necessary to acquire some parameters in the model application (see Sect. S1 in the Supplement titled “AquaSEBS overview”).
AquaSEBS uses energy balance to calculate instantaneous latent heat flux of evaporation (Eq. 3); thus, evaporation is calculated for each pixel of the image. The energy balance of the water surface can be expressed as follows:
In Eq. (3), Rn is the net radiation at the water surface, Gw is the water (or ground for land surfaces) heat flux, and H is the sensible heat flux to the air. All terms are expressed in watts per square metre. Detailed information about the algorithm and the meteorological input is in the Supplement of this paper. To assess the on-water evaporation rate (EW) in the scenarios, we used Eq. (4), in which EL is the on-land evaporation rate and KR is a coefficient. EL refers to a value provided by the models Eta-CanESM2 and Eta-MIROC5, whose bias was corrected using data from an on-land meteorological station. The coefficient KR was calibrated using AquaSEBS to assess EW and the Penman equation to estimate EL based on data from the INMET station.
For calibration purposes, AquaSEBS used images spanning from 1994 to 2023 containing the three studied reservoirs. A total of 35 scenes were used, 18 from Landsat 5 and 17 from Landsat 8 (Fig. 3), all acquired from the United States Geological Survey portal (https://earthexplorer.usgs.gov/, last access: 10 March 2024). We used images exclusively from the dry season (June to December) due to the following reasons: (i) cloud-free images are easier to obtain in these months; (ii) the water availability model (Phase III) only considers evaporation of the dry period; and (iii) this is the period when evaporation is more intense and, thus, more relevant to water management purposes.
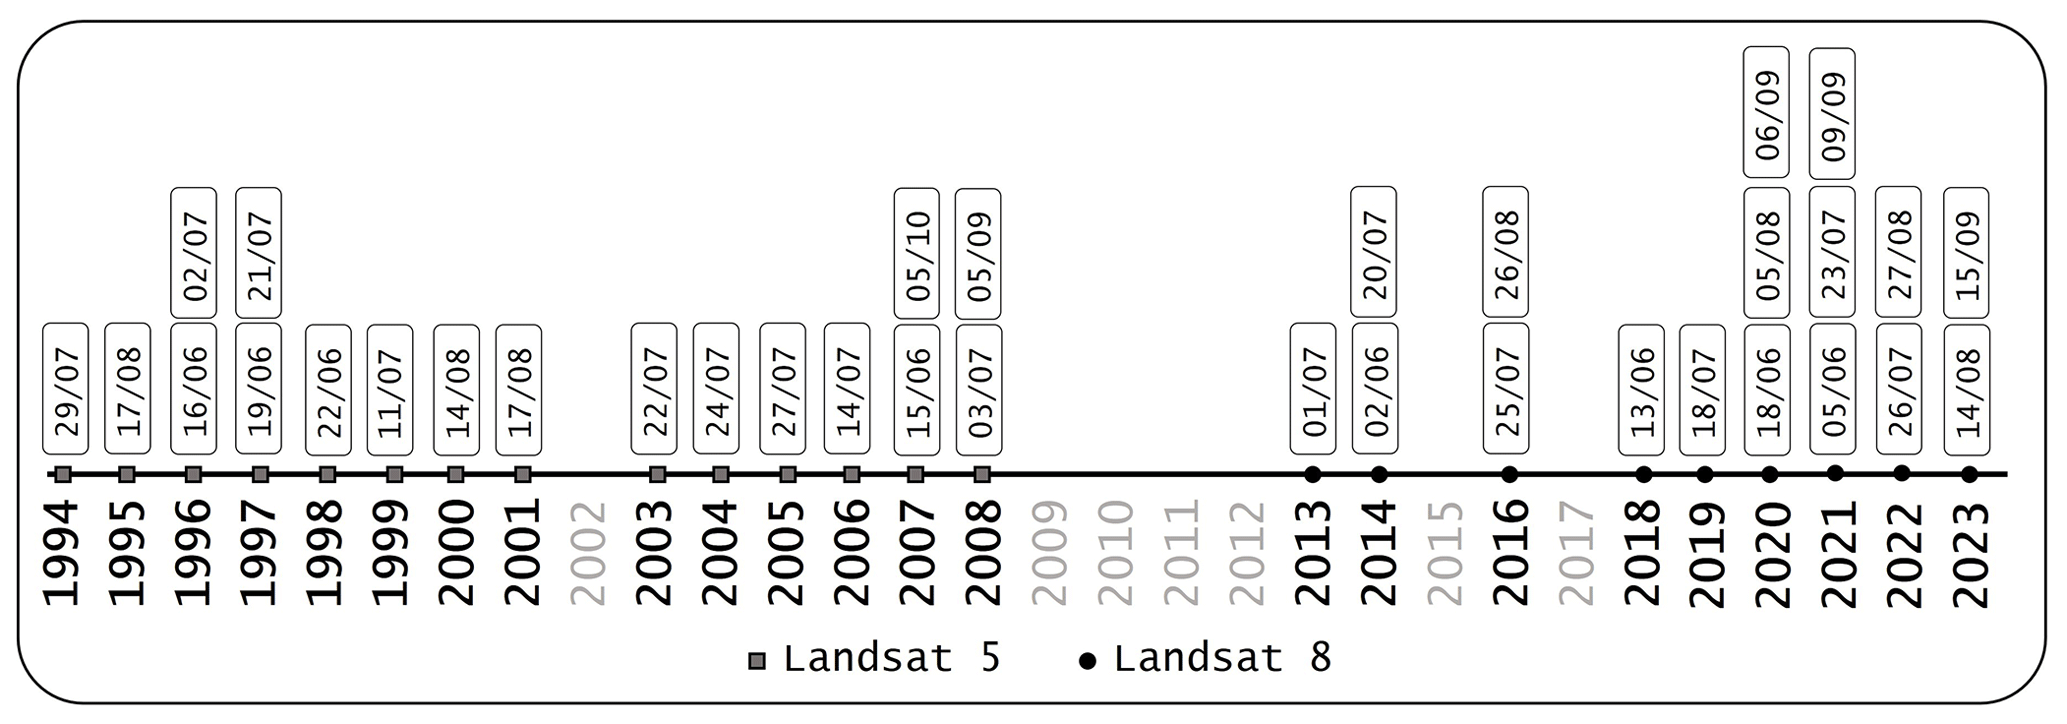
Figure 3Temporal distribution of Landsat images used to assess on-water evaporation with the AquaSEBS algorithm and, thus, to calibrate the KR coefficient. Years shown in grey did not have cloud-free images.
3.3 Phase III: water availability assessment for the scenarios in the long-term future (2071–2099)
The VYELAS model (Volume–Yield–Elasticity, as in de Araújo et al., 2006) was applied to simulate water availability. River inflow to the reservoir is generated by a stochastic procedure using the inverse of the two-parameter gamma probability density function (see McMahon and Mein, 1986; and Campos, 2015). The parameters of the distribution were derived from the average and standard deviation of historical annual inflow to the reservoir. A 10 000-year synthetic series was generated for each of the three reservoirs, which reproduced the historical average and the coefficient of variation in annual inflow as given in Table 2. VYELAS simulates the reservoir water balance for a large synthetic series, corresponding to the number of annual water balance simulations (Eq. 5). Each set of simulations is associated with a withdrawal discharge (Qw). The model calculates the annual reliability level (G), which corresponds to the annual probability of providing the target withdrawal discharge and is given by , where NS is the number of successful years and N the total number of years in the simulation (Campos, 2010; McMahon and Mein, 1986). In this context, a successful year is one in which the target water withdrawal can be integrally met without leading the reservoir reserve below the minimum operational volume (de Araújo et al., 2018). Campos (2010) states that the water balance of reservoirs in semiarid environments is approximately
In Eq. (5), V is the water storage volume in the reservoir, t represents time, Qin is the inflow from the river network into the reservoir, QE,dry is the water loss due to evaporation in the dry season, QS is the reservoir outflow over the spillway, and Qw is the water withdrawal from the reservoir (all variables are in hm3 yr−1). The model operates under the assumption that the combined water input from rainfall directly onto the reservoir surface and groundwater discharge into the reservoir is offset by wet season evaporation and outflow resulting from seepage, thus rendering rainfall negligible in its overall impact. VYELAS demands data of seasonal water inflow (average and standard deviation), precipitation, evaporation, storage capacity (SC), alert volume1, and morphological parameter α (SC =α ⋅ y3, where y is the maximum water depth) (Campos, 2010).
Table 2Input data for the VYELAS model for the three reservoirs.
Source for the data is a COGERH – Water Resources Management Company of Ceará (2020). b de Macêdo (1981). c Feitosa et al. (2021). d Calculated in this study. e The minimum operational volume was assumed to be 15 % of the reservoir storage capacity (de Araújo et al., 2018). f The initial volume is the smallest value between half of the maximum storage capacity and half of the annual average inflow (Campos, 2010).
The evaporation rates simulated for the long-term future (last 30 years of the century) of the two models were adjusted by the KR coefficient (see Eq. 4) and used as input in the VYELAS model. The input data required to run the model are listed in Table 2.
To assess how water availability varies with evaporation rate changes, we use the concept of elasticity (ε, as in de Araújo et al., 2006, 2018), represented by Eq. (6), in which Q90 is the water availability with 90 % annual reliability and E is the evaporation rate. Therefore, the higher the elasticity, the more significant the impact of evaporation on water availability. The asterisk refers to the reference values.
The VYELAS model has been used in hydrological studies that assess the effects of water quality on evaporation (Mesquita et al., 2020), reservoir operating rules (de Araújo et al., 2018), reservoir water balance (Feitosa et al., 2021), and reservoir silting (de Araújo et al., 2006).
4.1 Spatialised evaporation rate in the reservoirs with AquaSEBS (EW)
Figure 4 shows the spatialised evaporation in the Gavião, Pacoti, and Riachão reservoirs. Within-reservoir variability cannot be seen very clearly in the chosen range, which was selected to make a better comparison between acquisitions over the years. It is noticeable that over the last few decades of monitoring, lower evaporation rates (greenish tones) have occurred more frequently. The highest evaporation rates are found from 1994 to 2000, which would suggest a declining evaporative pattern in the reservoirs over the last few decades. However, we cannot affirm that this apparent decrease represents the reality of the reservoirs since there are, on average, only two cloud-free Landsat images per year and there is a degree of uncertainty in the extrapolation of the satellite passage time (instantaneous evaporation) for 24 h evaporation. From the year 2000 onwards, one can notice scenes where the evaporation rate is low (about 3 mm d−1), as in the scene obtained in the year 2004. This comes as a result of atypically rainy years in the Ceará state (Medeiros and de Araújo, 2014; Medeiros and Sivapalan, 2020), as the abovementioned year when the historical average rainfall (800 mm yr−1) was exceeded by over 40 % (FUNCEME – Ceará Meteorology and Water Resources Foundation, 2020). While the images were captured during the dry season when cloud cover was minimal, it is important to acknowledge that variations in surface temperature and relative humidity could have influenced the algorithm's results.
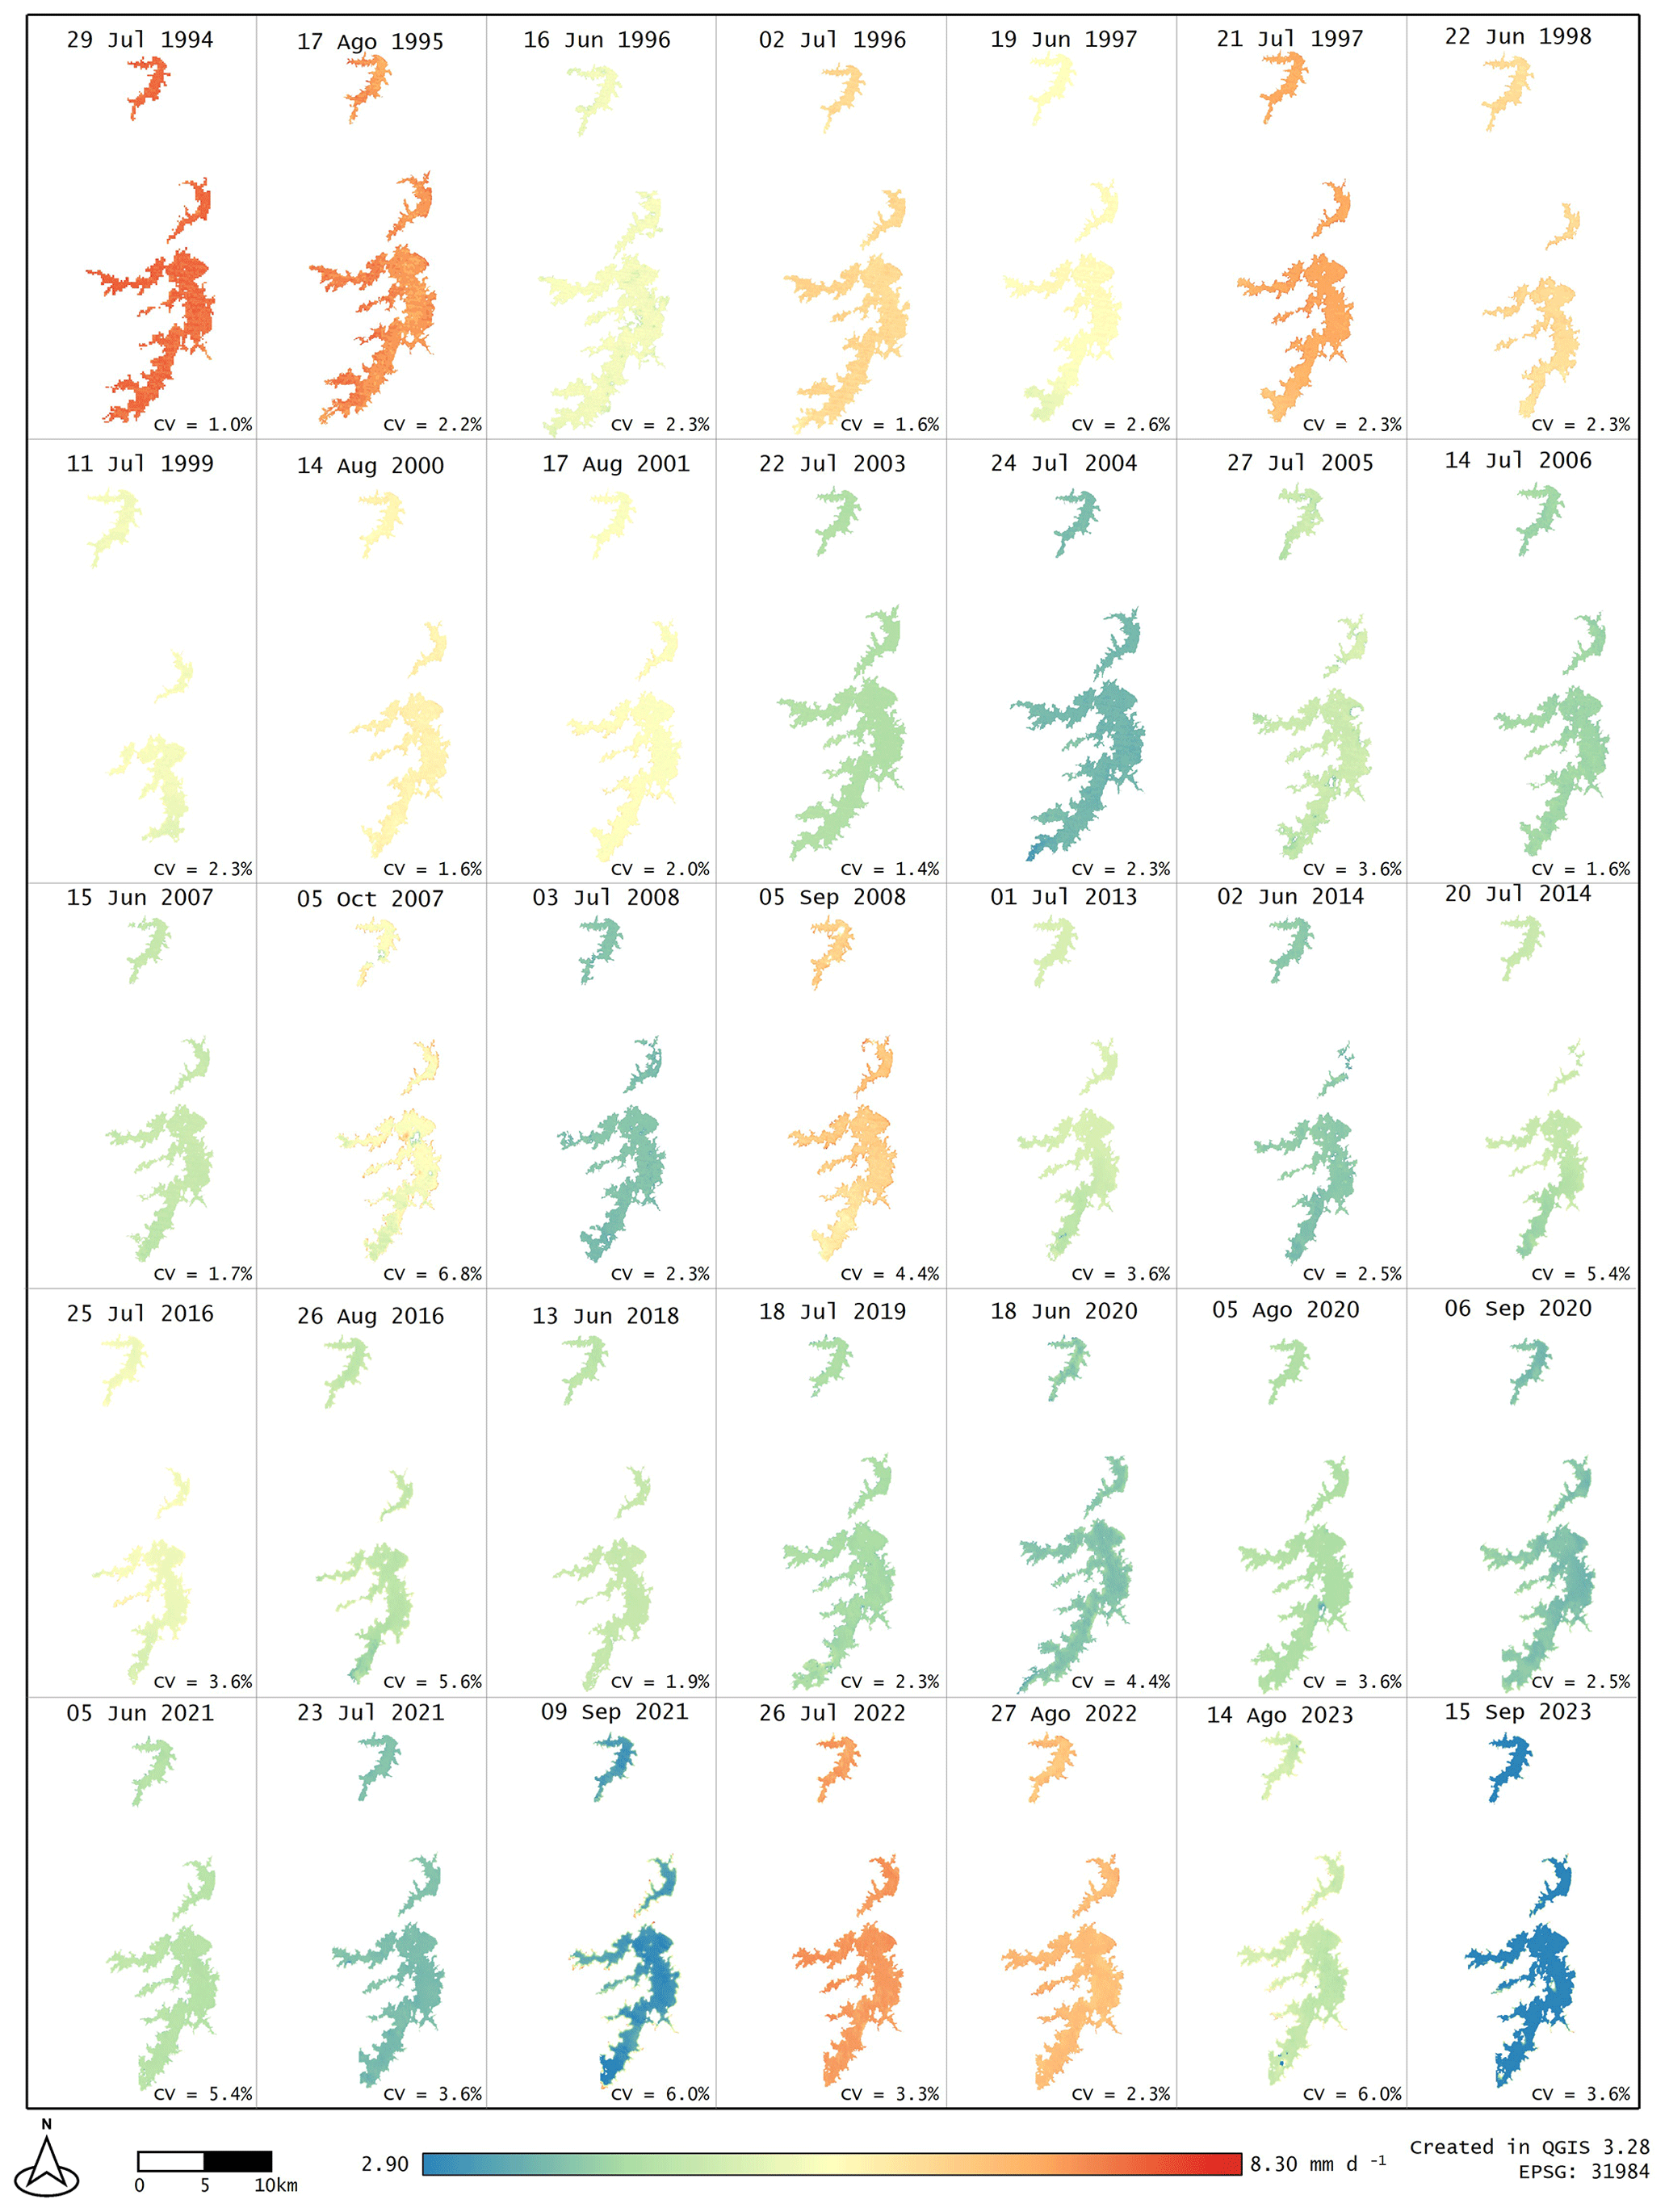
Figure 4Evaporation rates in the Fortaleza metropolitan region reservoirs (Gavião, Riachão, and Pacoti) obtained with the AquaSEBS algorithm for 35 individual days in the period 1994–2023.
Different reservoirs have different evaporation rates due to several drivers, such as depth, surface area, and water transparency. The first two factors influence the change in water heat storage and the phase lag between energy and evaporation rate; the latter is directly related to the albedo, which depends on the water quality and changes the reflection properties of the surface (Mesquita et al., 2020; McMahon et al., 2016). However, after evaluating the reservoir pixels with AquaSEBS, we observed that the daily evaporation rates and the coefficient of variation (see Fig. 4) did not differ substantially regardless of whether the reservoir evaporation were assumed separately or as a single raster. Thus, we assumed that the reservoirs are subject to the same evaporation rate. Regarding the spatial variability in evaporation within the waterbodies, it is necessary to highlight the uncertainty in the result related to the water-only pixels. This is caused by the presence of aquatic plants or exposed soil on some of the banks of the reservoirs, which are captured by the Landsat pixels (spatial resolution of 30 m), thus hindering the accuracy of the assessment.
4.2 Comparison between on-land evaporation (EL) and remotely sensed evaporation assessment
Table 3 shows the comparison between the on-land (EL) and on-water (EW) evaporation rates. In general, the average daily evaporation rates differ by 27 %, with the on-land evaporation rate constantly higher than the on-water evaporation rate: EW averages 5.10 mm d−1 against an average EL of 7.04 mm d−1 (Fig. 5); while the correction value, KR, averages 0.73. We also examined the data in order to detect a possible correlation of KR values with the period of the year when evaporation rates were estimated (for example, higher ratios at the end of the dry season). However, no correlation was found between the coefficient and the period of assessment. Most of the highest KR values (above 0.85) were registered in the first years of monitoring; six of the seven ratios at this threshold are from before 1999. Future investigations may investigate the correlation of this fact with factors not addressed in this paper, such as features on the satellite sensor, for instance.
Table 3Evaporation in Gavião, Riachão, and Pacoti reservoirs (1994–2023): comparative results of on-water (EW) and on-land (EL) daily rates. The lower part of the table shows statistical parameters.
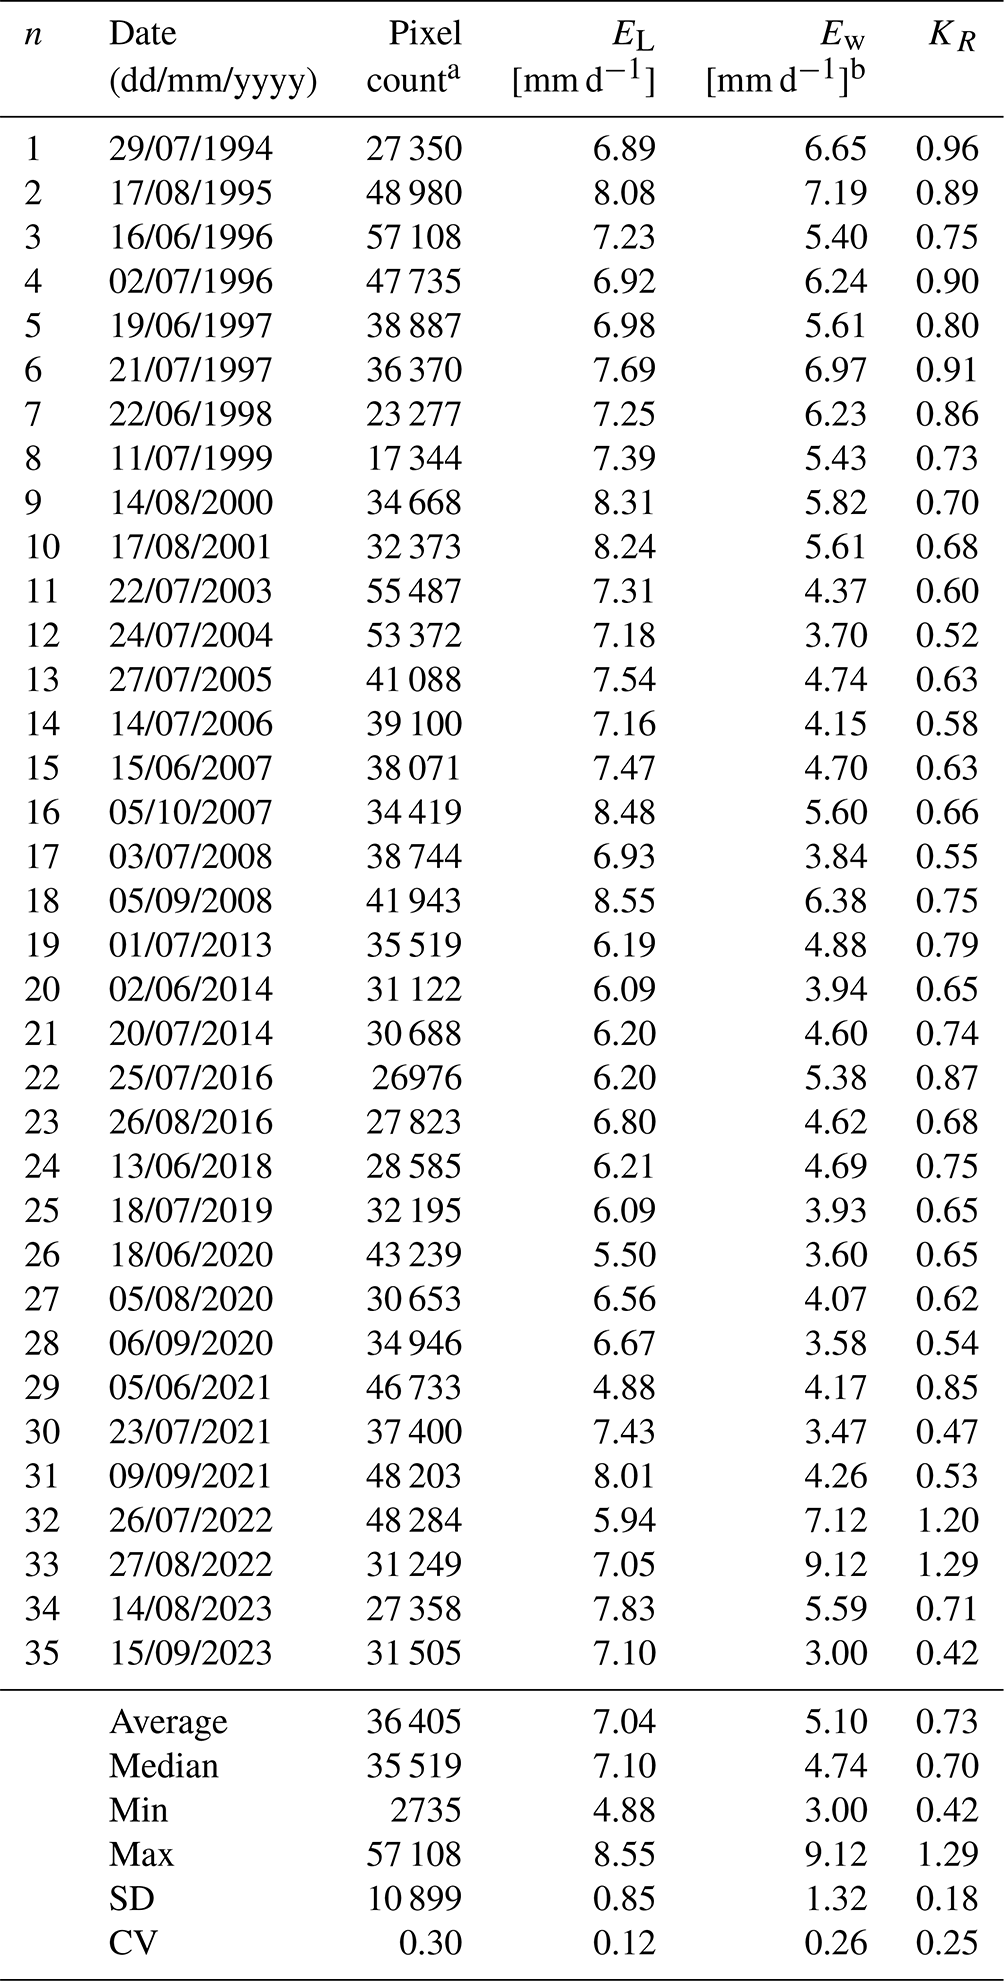
a Number of reservoir pixels in the raster. b Each value refers to the average of the pixels in the three reservoirs.
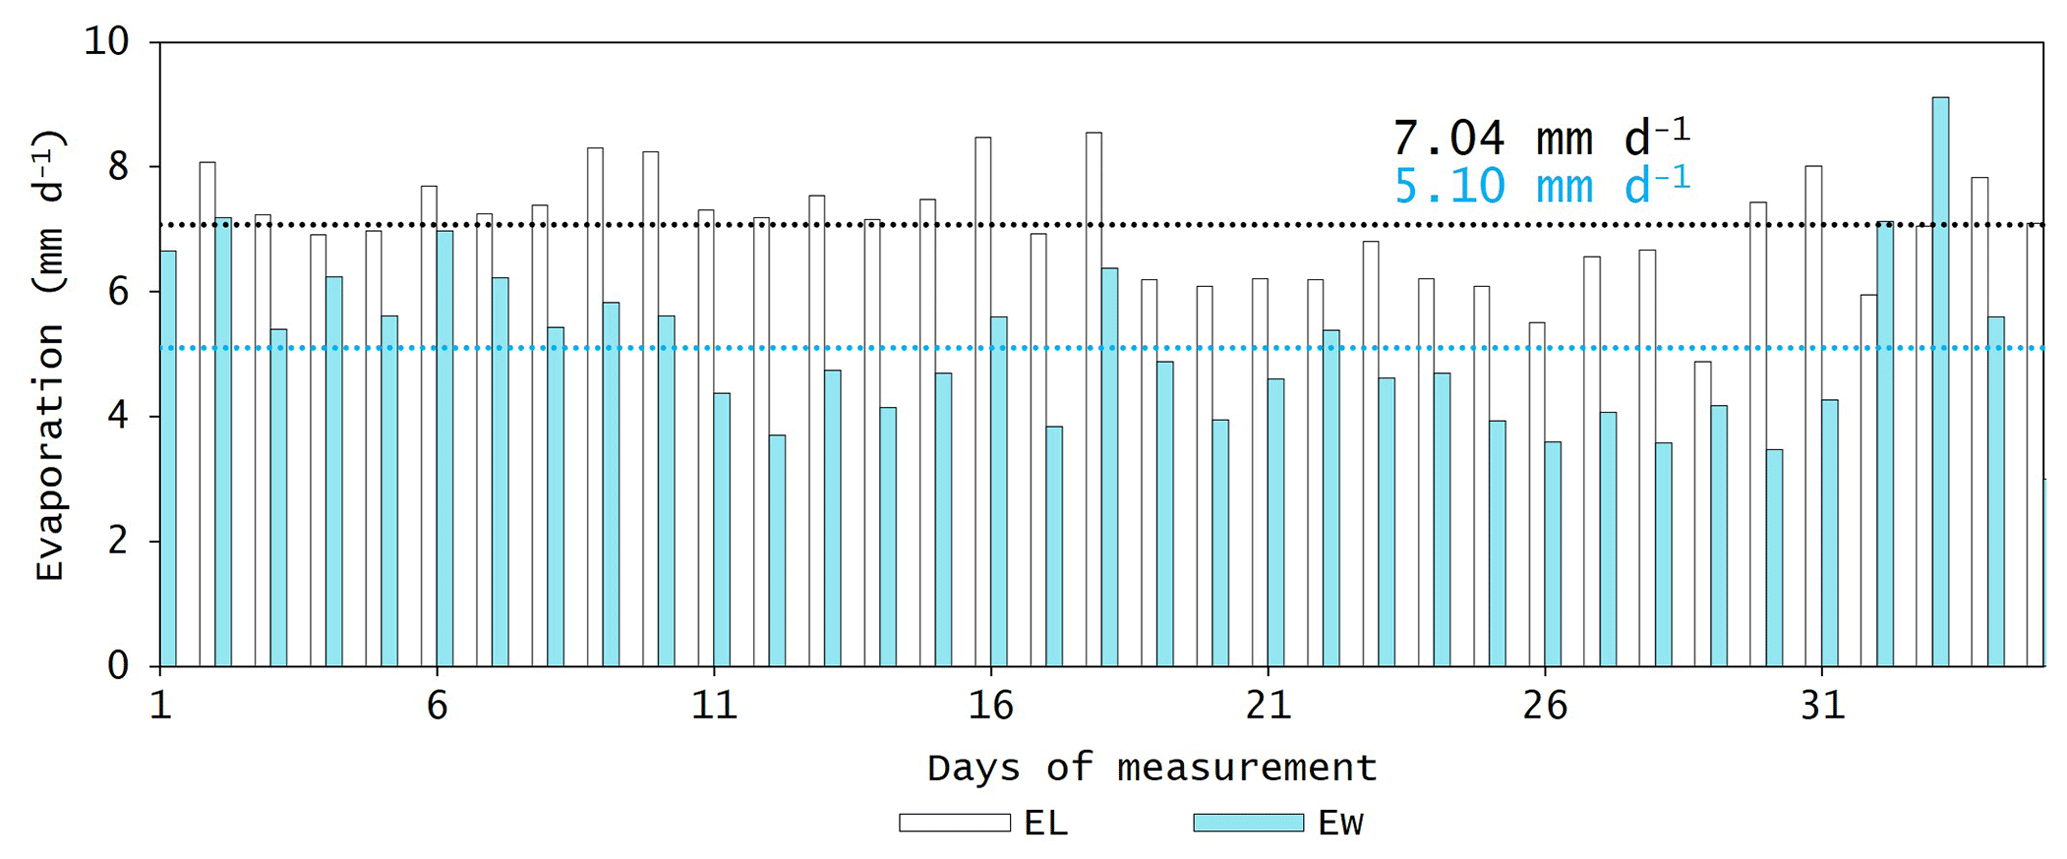
Figure 5Daily evaporation estimated with the AquaSEBS algorithm (EW) and calculated based on variables obtained from the INMET station (EL). The analysed period is from 1994–2023, with 35 d of measurement.
4.3 Evaporation simulation under four climate change scenarios
Figure 6 shows the behaviour of monthly evaporation rates for the four temporal slices: historical (1961–2005), near-term (2006–2040), mid-term (2041–2070), and long-term (2071–2099). The two scenarios derived from the Eta-MIROC5 model (M4 and M8) presented similar behaviour, varying only in the magnitude of the evaporation rates. In summary, both scenarios predict a reduction in the evaporative rate in the first 2 months of the year, stability until the middle of the dry season, and a reduction in the last 2 months of the year. April was the only month that showed a consistent increase in the evaporative rate of 3 % and 4 % for the scenarios M4 and M8, respectively. The months of November and December show the greatest expected reduction in evaporation, ranging from −3 % to −10 %, respectively.
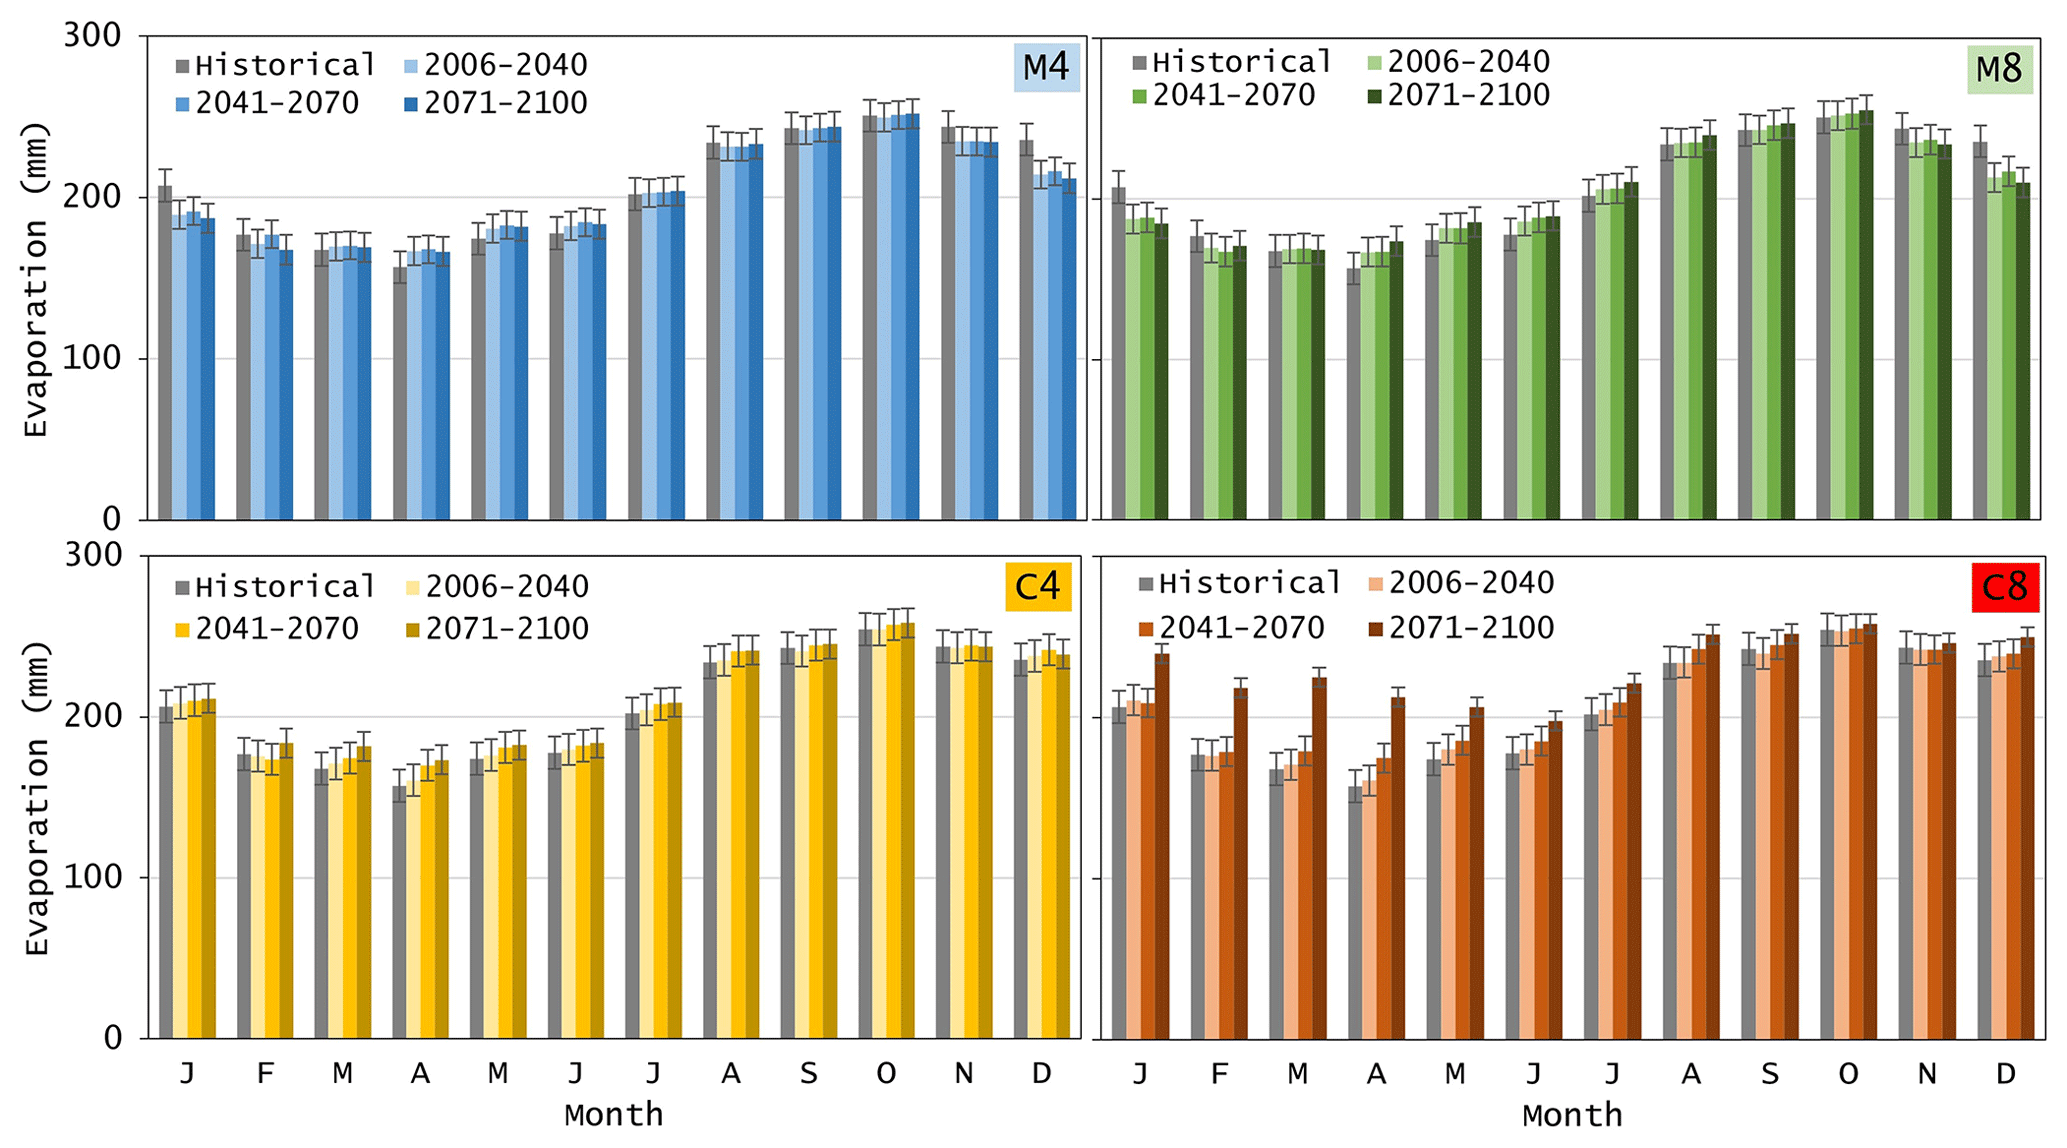
Figure 6Scenarios of monthly evaporation rates for the historical (1961–2005) and RCP (2006–2099) periods on the metropolitan region of Fortaleza. The rates refer to on-water evaporation (EW). The bars represent the standard error.
The scenarios derived from the Eta-CanESM2 model (C4 and C8) show a possible increase in the evaporation rate throughout the whole year. However, the greatest increment is expected in the rainy season for the long-term future (2071–2099) under the C8 scenario. The largest absolute variations are expected in March and April of the long-term future (8 % and 10 % increase, respectively). The C4 scenario shows stability for the near future (2006–2040) in the dry season (from −1 % in September to 1 % in December) and in the wet season (−1 % in February and 2 % in March and April). The C8 scenario also shows the largest absolute variations in March and April, with an increase of 34 % and 35 %, respectively, for the long-term future. The differing evaporation patterns between seasons may be attributed to a combination of factors, such as the decrease in relative humidity and the rise in temperature during the rainy season (Qin et al., 2021). Alternatively, or in conjunction with, this behaviour could also be influenced by a reduction in the frequency of rainy days or cloud cover. Moreover, the downscaling done by the regional models for the C4 and C8 scenarios indicate that the wind speed is expected to increase in the rainy season and decrease in the summer season. The decrease in relative humidity occurs systematically throughout the year but is more pronounced in the rainy season.
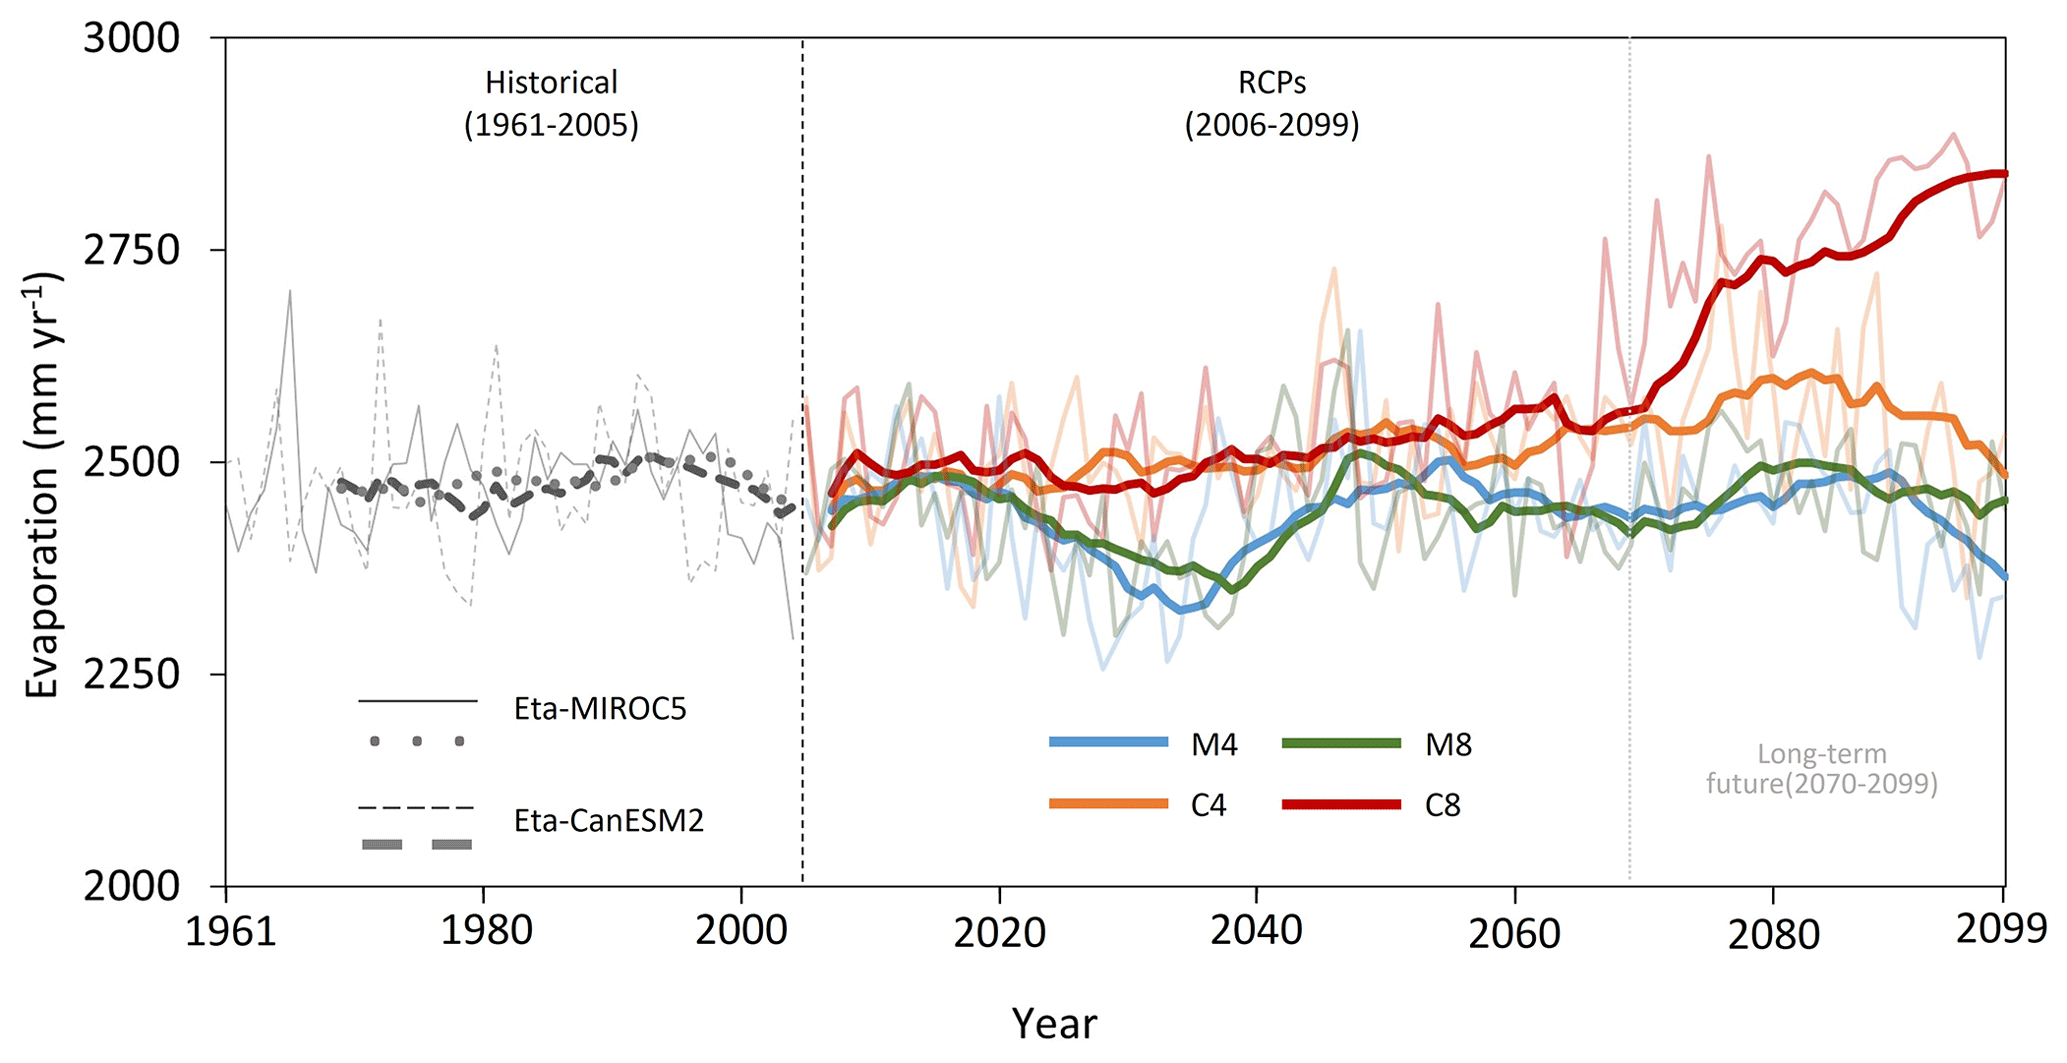
Figure 7Simulated annual on-water evaporation for the metropolitan region of Fortaleza. The dashed lines represent the simulated historical (1961–2005) period, and the bold lines refer to the 10-year moving averages.
Figure 7 shows an overview of the annual evaporation rates for the modelled historical periods and the four climate change scenarios. A distinct pattern of the models is evident if the 10-year average is considered: scenario C8 indicates an upward behaviour, whereas C4, M4, and M8 show a stabilisation followed by a decrease. From Fig. 7, one can depict that there is an increasing behaviour for all scenarios in the beginning of the 2010s. Afterwards, a downward trend is observed for the M4 and M8 scenarios. Except for C8 (which shows a substantial increase), all scenarios tend to maintain the evaporation rate in the long-term future. Over the last decade of simulation (the 2090s), the M4 scenario presents a more abrupt decrease, while M8 and C4 remain steady.
Table 4 presents the statistical metrics related to the trend analyses of evaporation for all scenarios in the historical and RCP experiments. The results indicate no statistically significant variation for the historical simulation of both models (p value > 0.05). The M8, C4, and C8 scenarios envisage an increase in the evaporation rate of the reservoirs in the period from 2006 to 2099. However, the Mann–Kendall test detected significant variation simulated only by Eta-CanESM2: +0.40 mm yr−1 for the C4 scenario and +4.30 mm yr−1 for C8. The M4 scenario is the only one that projects a decrease (−0.01 mm yr−1) in evaporation but with no significant trend.
Table 4Mann–Kendall statistics for annual evaporation projected by the regional models for historical (1961–2005; n= 45) and RCP (2006–2099; n= 93) experiments. Bold numbers are statistically significant (p value < 0.05). The p values were determined using a two-sided Kendall τ test (Kendall and Gibbons, 1990).
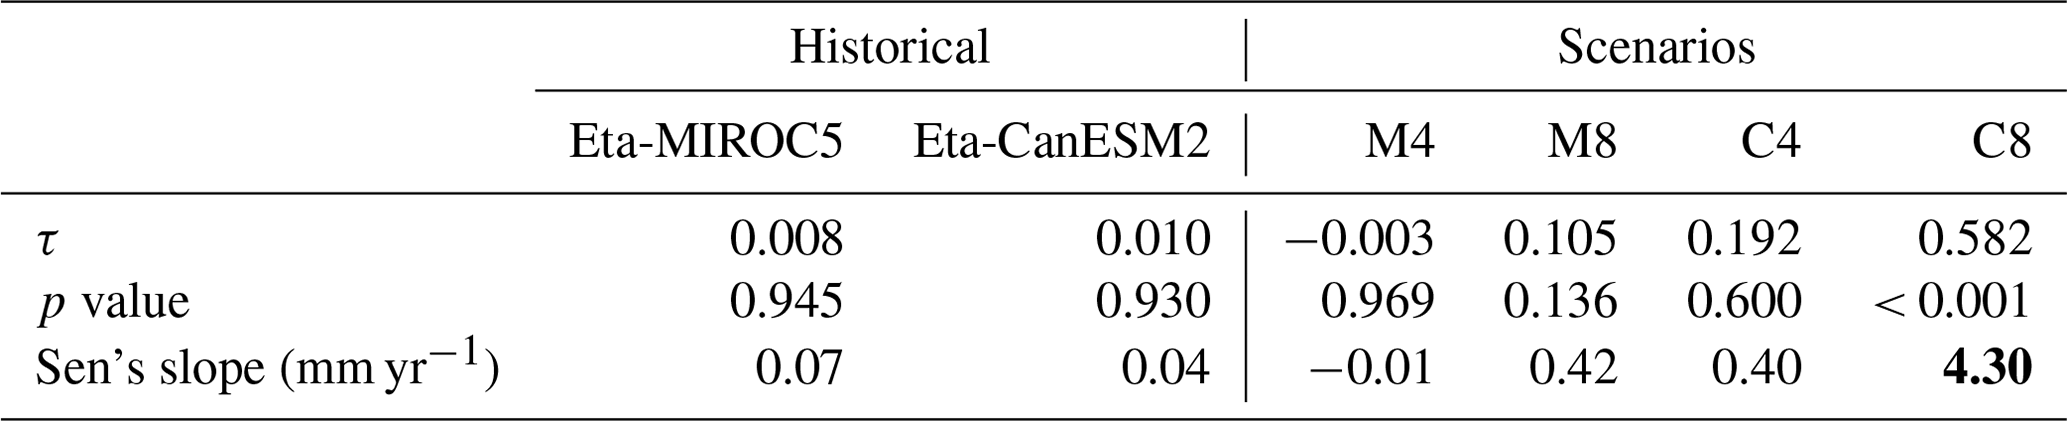
Based on the above findings, we can therefore state that the worst-case scenario in terms of evaporative rate is scenario C8 (+6 %) since it increases the evaporative rate in the dry season in the Fortaleza metropolitan region. It is worth noting that these rates change when the average annual evaporation, i. e. including both rainy and dry seasons, is considered: −1 % for the M4 scenario and +12 % for C8.
4.4 Water availability assessment for the period 2071–2100
Figure 8 depicts the relation among water yield with their respective annual reliability for the investigated reservoirs in the long-term future. The dashed line refers to the current water availability of the Gavião–Riachão–Pacoti system, whose water yield with 90 % annual reliability (Q90) is 128 hm3 yr−1. For the scenario C4, Q90 is 119 hm3 yr−1, and for C8, it is 116 hm3 yr−1, which shows a reduction of 6 % and 9 %, respectively. On the other hand, for scenario M4,
Q90 increases to 129 hm3 yr−1, resulting in a 1 % increase in the water availability of the reservoir system. Scenario M8 projects no change in the future evaporation rate; hence, it is not displayed. It is also noteworthy in Fig. 7 that there is less variation in water availability between the scenarios for higher reliability levels (e.g. 99 %), while for smaller reliability levels (e.g. 75 %), the differences become more pronounced. That means that the impact of evaporation is greater in regimes of reduced water reliability.
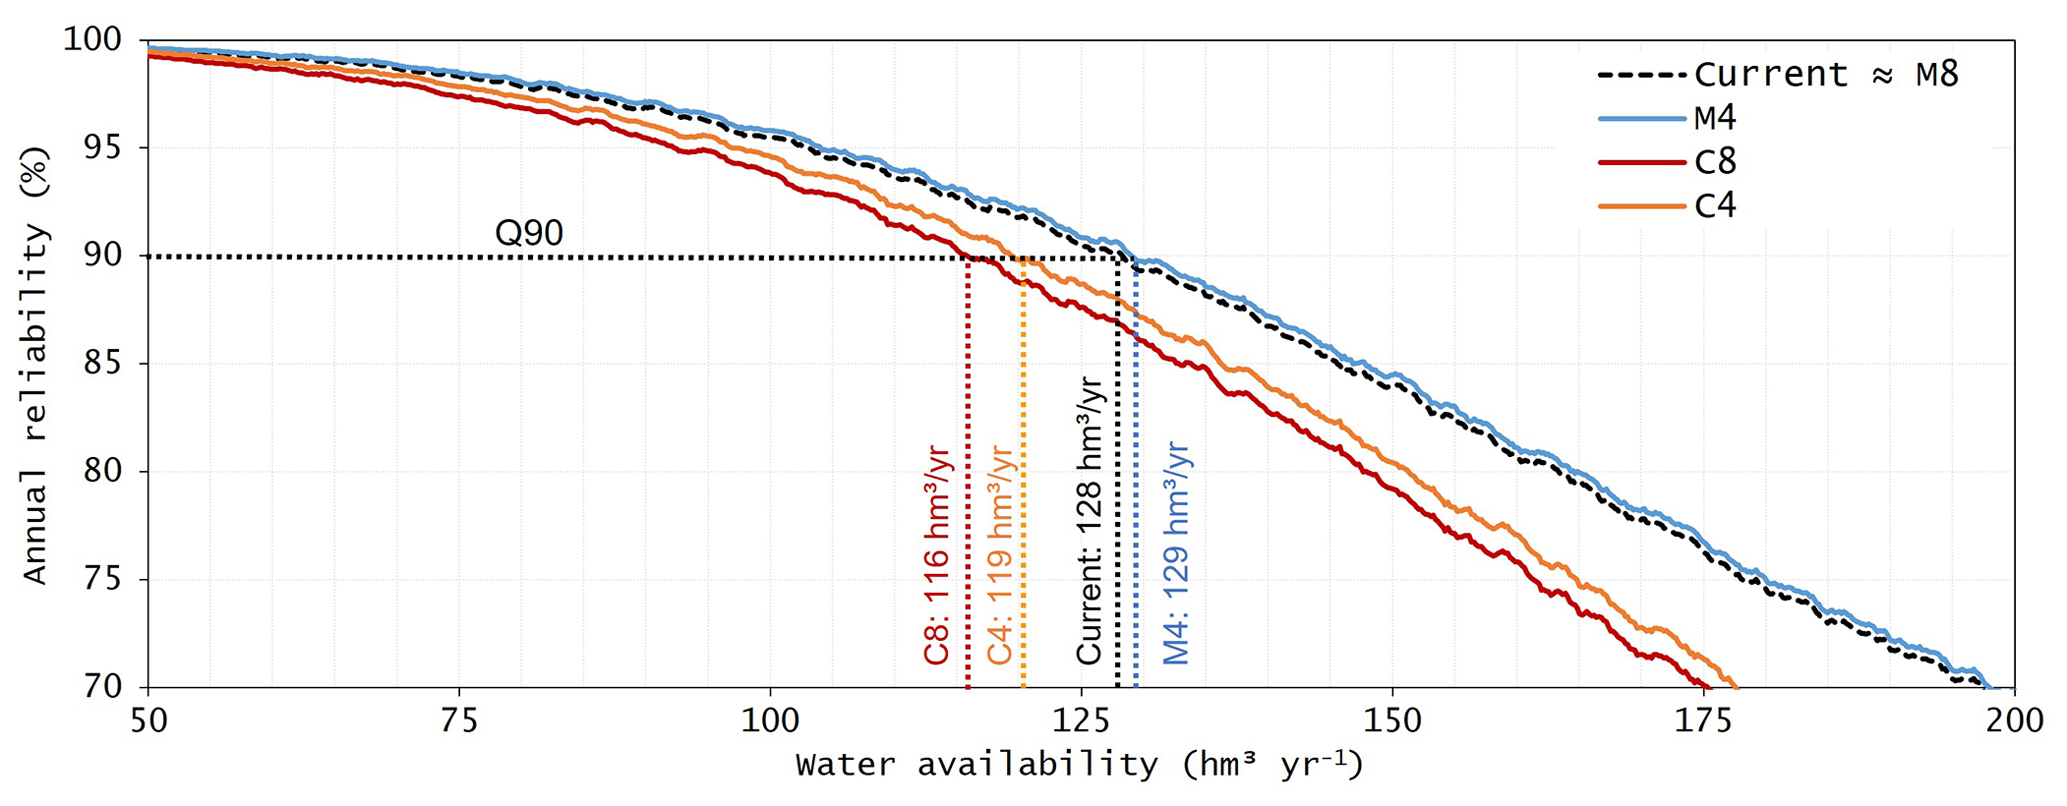
Figure 8Water availability as a function of annual reliability level for the Gavião, Riachão, and Pacoti reservoirs. Each curve represents a different evaporation rate: the current (1961–2005) historical average and the four climate change scenarios (M4, M8, C4, and C8) at the end of the 21st century.
It is noteworthy in Fig. 8 that although the C8 scenario reports a +6 % change in evaporation rate and the M4 scenario reports −2 %, the water availability does not respond linearly to such variations. Table 5 shows the influence of evaporation on water availability for the case of the Fortaleza metropolitan region reservoirs. The results suggest that evaporation significantly influences water availability in the region depending on the scenario. Consequently, the reservoir capacity to supply water with high reliability is reduced. It is relevant to stress that global average elasticity is −0.83, and this value is comparable to siltation impacts observed in reservoirs of the semiarid region (−0.80, as found by de Araújo et al., 2006).
Table 5Elasticity (ε) for the current conditions of water availability in the metropolitan region of Fortaleza and for the climatic scenarios in the period 2070–2099. The lower part of the table shows the average elasticity.
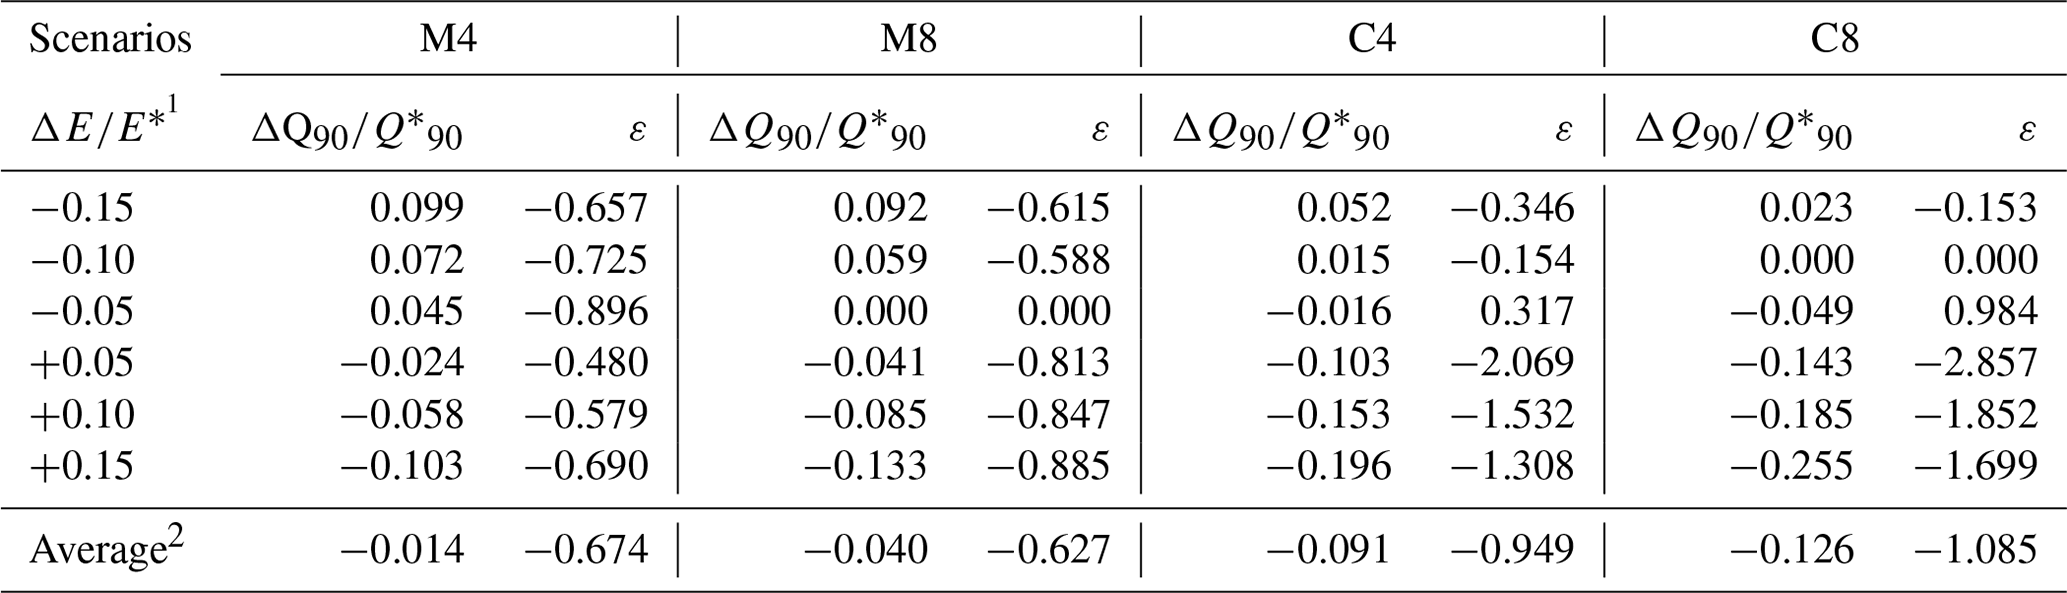
1 The asterisk refers to the reference values. E* is 977 in M4, 997 in M8, 1016 in C4, and 1052 in C8 (all values in mm yr−1). is 136 in M4, 134 in M8, 119 in C4, and 116 in C8 (all values in hm3 yr−1). 2 The global average is −083.
5.1 Uncertainties addressed in measurement and modelling
In this research, observed evaporation was assessed in two manners: by the Penman (1948) equation with data from a weather station and by remote sensing. The station, used to correct the bias in simulated data and to calculate evaporation, is 15 km away from the reservoirs. In most cases, meteorological data are obtained from stations distant from the waterbody, which are sometimes tens of kilometres away. Feitosa et al. (2021) compared measurements conducted on a reservoir (using a floating raft) with a station located on land at a distance of 30 km. Their results showed overestimation (71 %) of open-water evaporation when using data from the on-land station. Mays (2011) warns that neglecting the impact of reservoir evaporation can result in considerable overestimation of water availability and consequent underestimation of the storage capacity required to support water management decisions. Rodrigues et al. (2023) found results supporting this statement: measurements made directly with sensors in a reservoir showed lower averages than historical measurements or previous studies for the same area (Fortaleza metropolitan region). The authors recommend monitoring evaporation based on information obtained from meteorological stations as close as possible to the waterbody when direct measurements cannot be done.
Since the late 1990s, remote sensing tools have contributed to the monitoring of water losses (Bastiaanssen et al., 1998; Bastiaanssen, 2000); however, the application to lakes and reservoirs is more recent, and this is particularly true for north-eastern Brazil. Except for the investigation of evaporation trends in Brazilian tropical reservoirs by Rodrigues et al. (2021a) and the assessment of spatial variability and impact of riparian vegetation by Rodrigues et al. (2021b) there are no applications like the one in this research for monitoring open-water evaporation with remote sensing. In the present study, we also show the limitations of monitoring evaporation during the rainy season: the use of satellite imagery is impractical since cloudiness impedes visualisation of the surface. Adding to the limitations in the temporal resolution, some reservoirs are rather small, and medium-spatial-resolution images (such as Landsat, 100×100 m thermal band and scheduled every 16 d) may show better results than lower-spatial-resolution ones (like MODIS; from 500 m thermal bands and scheduled twice a day). This is due to “contamination” of water areas with land area information in large pixels. Further, one should take into consideration limitations due to the absence of field data. This is because AquaSEBS, as well as other models for estimating energy balance and turbulent fluxes (SEBAL, Bastiaanssen et al., 1998; SEBS, Su, 2002), requires some information that is usually acquired on the ground as inputs (e.g. air pressure, temperature, humidity, or wind speed).
Studies report that remote sensing algorithms have a tendency to underestimate evaporation in high-temperature areas (Gokool et al., 2017; Rodrigues et al., 2021a), such as tropical coastal north-east Brazil. This feature may have influenced the on-water evaporation, assessed with the help of AquaSEBS. It is shown in Table 3 that the pixel count varies. This is mainly driven by two factors, (i) the presence of clouds and cloud shadows (that were masked out) and (ii) the water level in the reservoirs. The first factor, however, is more strongly related to the final number of pixels used because the reservoirs are maintained at full capacity (above 80 % of the storage capacity) even in the dry season, which affects the spatial representation less than the gaps produced by the cloudiness. Despite the obvious limitations, we think that the remote sensing approach offers valuable insights – though evidently insufficient to cover the temporal evaporation dynamics, the assessment based on satellite imagery offers an interesting spatial perspective that the few available weather stations cannot provide.
The climate simulations revealed great variations between the regional model outputs and within the historical series of each model. Indeed, climate models mimic the physical mechanisms of the planet; however, data-based representation is not always satisfactorily accurate, particularly when dealing with complex hydrological processes, such as lake evaporation. There are external climatic factors, such as solar radiation, Earth's orbit, atmospheric concentrations of greenhouse gases, and other atmospheric factors that increase uncertainty. Besides, there are internal factors in the model system that diminish or amplify the effects and generate high variability (Kundzewicz et al., 2018).
Chou et al. (2014) state that before using climate models as tools to estimate future climate change impacts, the systematic errors in current climate simulations need to be estimated in order to assign some degree of confidence to future climate scenarios. Climate models simulate different future climates which are equally plausible for the same period (in the present case, up to the end of the 21st century). Using bias correction methods, the aim is to bring model simulations closer to real-world measurements over a given reference period (baseline). A bias correction method that is valid for the historical validation period should then remain valid for future climate change impact studies (Chen et al., 2020). This assumption has been widely accepted in climate change impact studies (Kundzewicz et al., 2018; Teutschbein and Seibert, 2012; Fiseha et al., 2014). Yet, the performance of bias correction can be affected by climate models with different sensitivities to the real system (Chou et al., 2014). Regionally, although driven by a single GCM, various downscaling methods may lead to different future climate scenarios (Adachi and Tomita, 2020; Kendon et al., 2017; Maraun et al., 2013). Downscaling regional climate simulations is another source of uncertainty. While much attention has been paid to the uncertainties in future projections associated with the choices of GCMs (Moges and Bhat, 2021), fewer analyses have quantified the downscaling uncertainty (Ahmadalipour et al., 2018). Generally, it is recommended to use an ensemble of simulations by multiple GCMs and downscaling techniques for reliable regional climate projections (Dibike et al., 2017; Pierce et al., 2013).
A notable feature is the uncertainty intrinsic to the climate models themselves. The two models simulated the historical period in a similar manner (Eta-MIROC5 with a 16.2 % difference from the observed data and Eta-CanESM2 with 16.4 %). However, when the RCP experiment starts, the behaviour of the four model-derived scenarios goes in different directions. The high variability found in the simulations is attributed to external climate factors, such as solar radiation, Earth's orbit, atmospheric concentrations of greenhouse gases, and internal factors in the GCMs themselves (Kundzewicz et al., 2018).
CanESM2 (Chylek et al., 2011) and MIROC5 (Watanabe et al., 2010) have some differences in their model configurations, parameterisations, and simulation outputs. (i) Regarding model physics and dynamics, CanESM2 and MIROC5 use different atmospheric and oceanic dynamical cores, which can lead to differences in the representation of atmospheric and oceanic processes. For example, differences in how convection, cloud formation, and ocean circulation are parameterised can influence simulated climate patterns and variability. (ii) Regarding forcing scenarios, CanESM2 and MIROC5 may be driven by different historical and future greenhouse gas emission scenarios and external forcings. Variations in the scenarios used to force the models can lead to differences in simulated climate responses, particularly for future projections of temperature, precipitation, and other climate variables. (iii) Regarding calibration, each model undergoes a process of calibration and tuning to ensure that its simulations are consistent with observed climate variability and change. The specific calibration and tuning procedures used for CanESM2 and MIROC5 may differ, leading to differences in model behaviour and performance. (iv) For data assimilation and initialisation, differences in how observational data are assimilated into the models and how initial conditions are initialised can also lead to divergent simulation outcomes.
These differences between CanESM2 and MIROC5 can contribute to divergent climate projections, particularly on a regional scale and for specific study areas. Understanding these distinctions is important for interpreting and contextualising model results and for assessing the robustness of climate change projections.
Despite the systematic errors inherent in all simulations, the development of regional models for Brazil is essential, as this increases the possibility of understanding the impacts of climate change in various regions better given that it is a country of continental dimensions (8.5 million km2) with climatic, environmental, social, and economic particularities. Our results show that Eta-CanESM2 and Eta-MIROC5 data for Brazil have various biases, which can originate from the driving GCMs, be introduced by the downscaling RCM, and be related to uncertainties in observational data. It is expected that such biases, due to the generalised information about the region, are also present in our results, and if the output data are not corrected, any hydrological application will be compromised. Future analyses can be carried out for the study region of this research, such as analyses of the change in the aridity index or the impact of changes on other hydrological processes of relevance for dry regions.
The impact on water availability can be reported from two perspectives: first, as a change in reliability for a predefined withdrawal volume and, second, as a change in the available withdrawal volume for a given reliability level (de Araújo et al., 2006). For instance, 128 hm3 yr−1 could be taken from the reservoir system with 90 % reliability under the current climate conditions, but only 116 hm3 yr−1 could be withdrawn with the same reliability under scenario C8 conditions in the period from 2071. This reduction in water availability corresponds to a substantial loss of water resources: under the assumption of per capita consumption of 150 L d−1, the difference in water yield would be enough to supply around 200 000 people yr−1, which is 6 % of the MRF's population.
5.2 Evaporation analysis
Our findings show two opposite trends for the same study area: one climate model shows an increase in the evaporative rate when compared to the historical period and the other shows a decrease. In fact, there are records around the world of positive and negative trends in evaporation. Liu et al. (2004) found that the evaporation of 85 class-A pans in China between 1955 and 2000 had decreased at an average rate of 29.3 mm per decade. Roderick and Farquhar (2004) observed that evaporation reduced by an average of 4.3 mm between 1970 and 2002 in regions with large industrial centres in Australia. Similarly, reductions in evaporation were observed in Canada (Burn and Hesch, 2007), India (Chattopadhyay and Hulme, 1997), and Italy (Moonen et al., 2002). On the contrary, the findings of Zhao et al. (2022) show an increasing trend of evaporation on a global scale of 0.9 % per decade for the period from 1985 to 2018. Positive trends in reservoir evaporation were also observed in Benin, west Africa (Hounguè et al., 2019), Austria (Duethmann and Blösch, 2018), Australia (Helfer et al., 2012; Fuentes et al., 2020), centre-west Brazil (Althoff et al., 2019), Czech Republic (Mozny et al., 2020), and in other parts of the world generally associated with countries or regions with low rates of gas emissions/industrialisation (Wang et al., 2014; Miralles et al., 2014). These different trends of increase and decrease in evaporation in various regions of the planet have been called an “evaporation paradox” (Brutsaert and Parlange, 1998).
While the initial impression of the divergent trends might suggest that model selection alone drives significant water management decisions in a region vulnerable to climate change, it is crucial to acknowledge the complex interplay of factors. Despite the indisputable increase in global temperatures (Solomon et al., 2007; Darshana et al., 2013; Qin et al., 2021), which leads to an anticipated rise in evaporation rates, it is noteworthy that historical simulations from both the Eta-CanESM2 and Eta-MIROC5 models closely align with data recorded by INMET stations (overestimates of 16.2 % and 16.4 %, respectively). For more details of bias correction of Eta-MIROC5 and EtaCanESM-2 outputs using the quantile mapping method, please refer to Figs. S1 and S2 in the Supplement.
Rodrigues et al. (2021b) analysed the evaporation trend in Ceará reservoirs for the period 1985–2018 using the AquaSEBS model and assessed negative trends (−0.26 to −0.08 mm every 34 years). According to the authors, such behaviour was attributed to the impact of regional air pollution, analogous to the global dimming effect of reduced evaporation in reservoirs located closer to nearby industrial areas (around 2000 according to IPECE – Instituto de Pesquisa e Estratégia Econômica do Ceará, 2017). This causes an increase in the number of clouds and reduces the influence of solar radiation heating on the evaporation of the waterbody. However, although Fig. 5 shows a similar pattern to the results of the authors op. cit., our results do not have a sufficient basis to confirm this. When considering the more continuous modelled data in particular, this trend of a reduction in the evaporative rate is not evident.
One of the main limitations of the original Penman (1948) equation is its simplifying assumptions and empirical coefficients, which may not fully capture the complexities of evaporation processes in tropical climates. For example, the Penman equation assumes constant conditions over a 24 h period; neglects the effects of diurnal variations in temperature, humidity, and radiation; and may not adequately account for the specific atmospheric and surface characteristics of tropical regions. However, it has undergone adaptations (Valiantzas, 2013) and in this work we strictly follow the steps described by Allen et al. (1998) and McMahon et al. (2013). Studies such as those by Donohue et al. (2010) and Elsawwaf et al. (2010) report that Penman (1948) produces the most realistic estimates of evaporation and is the most comparable to energy balance estimates using the Bowen ratio. In a recent study, Rodrigues et al. (2023) demonstrated to what extent two direct-measurement sensors and two physically based models (Penman and modified Dalton) accurately estimate the evaporation of a tropical reservoir (same study region as in the present paper). The Penman (1948) model, based on data from a floating station, showed good results (r > 0.7) for the 12 h time step or daily evaporation in comparison with the direct measurements.
5.3 Water availability
Campos (2010) states that in Brazil, the annual reliability discharge of 90 % is commonly used for water resources planning and can be interpreted as the reference water availability of the reservoir. Recio-Villa et al. (2018) also used annual reliability to establish reference water availability; however, they recommend a reliability level of 75 % for reservoirs located in a humid tropical climate, which is the case of the region where the reservoirs studied in the present paper are located. Despite this recommendation, we used Q90 as a rule for two main reasons: (i) the reservoirs of the metropolitan region of Fortaleza are supplied by a long network of reservoirs located in a semiarid region with a water deficit during two-thirds of the year and high rainfall uncertainty and (ii) the water from these reservoirs is mainly used for industries, agriculture, and for the direct supply of about 4 million inhabitants. It should be considered that such a simulated water availability is affected by changes in the evaporation rate. In Ceará, the reservoirs usually suffer a process of reduction in storage capacity mainly due to sediment deposition in the reservoirs (de Araújo et al., 2023) because of erosion; and also due to the high rate of water pollution mostly caused by eutrophication (Mesquita et al., 2020). Our study highlights another important factor affecting water availability, which is the evaporation rate influenced by climate change (elasticity concept, as in de Araújo et al., 2006).
As stated by Krol et al. (2003), climate impacts are not merely a consequence of changes in water availability but emerge from the confrontation between availability and societal demands and also the role these demands play in society. This explains why a study should include not only the physical understanding of climate impacts on the water balance but also the analysis of water use, agricultural economy, and societal impacts. This clearly demonstrates that the study of climate change impacts in developing semiarid regions calls for an integrated approach.
Besides the uncertainty associated with future water availability, there is substantial uncertainty regarding future water demand (Kundzewicz et al., 2018). The findings of de Araújo et al. (2004) indicate that 60 % of the municipalities of the state of Ceará may suffer from long-term water scarcity by 2025. On average, the probability of these municipalities facing a water shortage ranges from 9 % to 20 % annually. Silva et al. (2021) analysed climate change impacts and population growth rates in a basin whose sole reservoir provides water to an urban area of 1 million inhabitants in north-eastern Brazil. The rate of change in population growth for the period from 2015 to 2030 varied between 0.9 % and 0.8 %. Water recycling and more efficient technologies can decrease overall water demand. In fact, the results of the investigation by Rodrigues et al. (2020) in a tropical reservoir in north-east Brazil indicated that the investment in building a floating photovoltaic power generation system could reduce water losses due to evaporation by approximately 2.6×10⁶ m3 yr−1, which is enough to supply about 50 000 people, whereas the initial investment in the construction would be fully recovered within 8 years.
5.4 Challenges of an integrated approach to regional water resources and limitations of this research
The present research assesses the impact of evaporation from reservoirs on water availability, although the impact of water quality, silting, and increase in per capita consumption should also be taken into consideration in future investigations. It is necessary, therefore, that water management agencies propose adaptation measures for different scenarios, and this study contributes to decision-making aimed at water security during the dry season. In these results, further investigation in densely populated areas situated in dry regions may find a reference for studies that take into account other variables which were not addressed in our study.
To achieve an integrated approach for integrating physical climate impacts with societal demands and water use, it is first necessary to understand the local context and the specific needs of each region, economic sectors, and water resources managers. Then, a comprehensive assessment of the projected impacts of climate change on regional water resources is needed, considering extreme weather events and changes in hydrological regimes. An accurate assessment of the current and future availability of water resources is essential, taking into account surface and groundwater, water quality, and its demand. Hydrological models and reliable field data (Rodrigues et al., 2023) to quantify water availability under different climate scenarios are essential as well.
Identifying social demands and vulnerabilities for water management is crucial. This involves pinpointing key water demands (agricultural, industrial, urban, ecological, and recreational) and analysing vulnerabilities, such as social inequality and climate resilience. Stakeholder engagement is essential, including the local communities, NGOs, private sector, and government. Inclusive participation, interdisciplinary dialogue, and consensus building are promoted. Continuous monitoring and evaluation of adaptation strategies are necessary to assess their impact on water availability and welfare.
We recommend the work of Sivapalan et al. (2012) as a starting point on that matter, titled Socio-hydrology: a new science of people and water, and Medeiros and Sivapalan (2020), whose work evaluates the dynamic nature of human adaptation to droughts since the beginning of the 20th century in the Jaguaribe Basin (89 000 km2) in semiarid Brazil, as complementary reading.
Climate simulations made with the regional models Eta-CanESM2 and Eta-MIROC5 showed different trends in the future evaporation of a reservoir network. Similarly, these trends affected regional water availability of the region in opposing patterns. Four scenarios derived from the RMs were evaluated, and from the results, the following conclusions can be drawn.
The scenarios derived from the Eta-CanESM2 model (C4 and C8) indicate an increase in dry season evaporative rates of 2 % and 6 %, respectively. When considering the total annual increase, which includes both rainy and dry seasons, the worst-case scenario shows a 12 % increase.
In contrast, scenarios derived from the Eta-MIROC5 model (M4 and M8) display a decrease in the dry-season evaporative rate. Specifically, the M4 scenario shows a change of −2 %, while no change is observed in the M8 scenario. However, statistically significant evaporation trends are only observed for the C4 (+0.87 mm yr−1) and C8 (+4.30 mm yr−1) scenarios.
Regarding the impact of the simulated evaporation on water availability, for a 90 % reliability level, the expected range of change in water availability is −7 % to +9 %. Scenario C8 envisages the highest reduction in annual water flow.
It is reasonable to state that both patterns of future evaporation in the reservoirs of the metropolitan region of Fortaleza are plausible. To reduce uncertainties in modelling future water availability, an adaptive management strategy is recommended in combination with continuous monitoring of climate change and regional development, as it directly affects water demand.
Although the models used to represent reservoir evaporation are relatively simple and do not account for advective and heat storage effects (which could be enhanced in future investigations), the estimates provided by AquaSEBS are satisfactory. This suggests a promising potential for its application in water resources management.
Given the divergent projections of climate impacts on water resources by different models, adaptive planning should rely on probabilistic approaches using ensembles of projected values rather than single scenarios. Improvements in evaporation measurements are crucial for feeding climate models and remote sensing algorithms and enhancing their reliability. Spatialised field information can further improve regional model simulations by providing a basis for bias correction and ground truth. Our findings can supplement water availability estimations, which is particularly crucial during the dry season (June to December) in north-eastern Brazil.
The historical series observed in Ceará can be obtained from the INMET database https://bdmep.inmet.gov.br/ (INMET – Brazilian National Institute of Meteorology, 2023). All the CMIP5 RCM outputs are publicly available from the National Institute for Space Research (INPE, Brazil) database at the INPE portal (https://doi.org/10.57810/lattesdata/WAVGSL, Tavares et al., 2023).
The supplement related to this article is available online at: https://doi.org/10.5194/hess-28-3243-2024-supplement.
GPR designed the research approach, made the computational analysis, and prepared the paper. AB elaborated additional research ideas and supervised the work. ISR and GLM participated in the design, writing, and revision of the paper. JCdA designed the research approach and supervised the work. All authors have reviewed and approved the final version of the paper.
The contact author has declared that none of the authors has any competing interests.
Publisher’s note: Copernicus Publications remains neutral with regard to jurisdictional claims made in the text, published maps, institutional affiliations, or any other geographical representation in this paper. While Copernicus Publications makes every effort to include appropriate place names, the final responsibility lies with the authors.
The authors acknowledge the following: (1) funding provided by the Brazilian organisation CAPES (Coordination for the Improvement of Higher Education Personnel) and the German Academic Research Service (DAAD); (2) FUNCAP (Ceará State Foundation for the Support of Scientific and Technological Development) for the scholarship granted to the first and third authors; (3) COGERH (water resources management company of Ceará) for the technical support at the Gavião Reservoir; (4) the University of Potsdam for the support during Gláuber Pontes Rodrigues's stay at the Institute of Environmental Science and Geography; and (5) Gerd Bürger (University of Potsdam), Saskia Förster (Helmholtz Centre, GFZ), and Birgit Heim (Alfred Wegener Institute, AWI) for the insightful discussion during the preparation of this study. We would like to express our gratitude to the reviewers (Maarten Krol and an anonymous referee) as well as the editor, Pieter van der Zaag, whose comments significantly enhanced the quality of the paper.
This work was supported by a joint grant between the Coordination for the Improvement of Higher Education Personnel (CAPES) and the German Academic Research Service (DAAD; grant no. 23/2019) and the University of Potsdam.
This paper was edited by Pieter van der Zaag and reviewed by Maarten Krol and one anonymous referee.
Abdelrady, A., Timmermans, J., Vekerdy, Z., and Salama, M. S.: Surface energy balance of fresh and saline waters: AquaSEBS, Remote Sens., 7, 1–17, https://doi.org/10.3390/rs8070583, 2016.
Adachi, S. A. and Tomita, H.: Methodology of the constraint condition in dynamical downscaling for regional climate evaluation: A review, J. Geophys. Res.-Atmos., 125, e2019JD032166, https://doi.org/10.1029/2019JD032166, 2020.
Adrian, R., Reilly, C. M. O., Zagarese, H., Baines, S. B., Hessen, D. O., Keller, W., Livingstone, D. M., Sommaruga, R., Straile, D., Donk, E. Van, Weyhenmeyer, G. A., and Winder, M.: Lakes as sentinels of climate change, Limnol. Oceanogr., 54, 2283–2297, https://doi.org/10.4319/lo.2009.54.6_part_2.2283, 2009.
Ahmadalipour, A., Moradkhani, H., and Rana, A.: Accounting for downscaling and model uncertainty in fine-resolution seasonal climate projections over the Columbia River Basin, Clim. Dynam., 50, 717–733, https://doi.org/10.1007/s00382-017-3639-4, 2018.
Allen, R. G., Pereira, L. S., Raes, D., and Smith, M.: Crop evapotranspiration: guidelines for computing crop water requirements, in: FAO Irrigation and drainage paper 56, Rome: FAO, https://www.fao.org/3/x0490e/x0490e00.htm#Contents (last access: 8 December 2022), 1998.
Almagro, A., Oliveira, P. T. S., Rosolem, R., Hagemann, S., and Nobre, C. A.: Performance evaluation of Eta/HadGEM2-ES and Eta/MIROC5 precipitation simulations over Brazil, Atmos. Res., 244, 105053, https://doi.org/10.1016/j.atmosres.2020.105053, 2020.
Althoff, D., Rodrigues, L. N., and Da Silva, D. D.: Evaluating Evaporation Methods for Estimating Small Reservoir Water Surface Evaporation in the Brazilian Savannah, Water-Switzerland, 11, 1–17, https://doi.org/10.3390/w11091942, 2019.
Althoff, D., Rodrigues, L. N., and da Silva, D. D.: Impacts of climate change on the evaporation and availability of water in small reservoirs in the Brazilian savannah, Clim. Change, 159, 215–232, https://doi.org/10.1007/s10584-020-02656-y, 2020.
Alvalá, R. C. S., Cunha, A. P. M. A., Brito, S. S. B., Seluchi, M. E., Marengo, J. A., Moraes, O. L. L., and Carvalho, M. A.: Drought monitoring in the Brazilian Semiarid region, An. Acad. Bras. Cienc., 91, e20170209, https://doi.org/10.1590/0001-3765201720170209, 2019.
Bastiaanssen, W. G. M.: SEBAL-based sensible and latent heat fluxes in the irrigated Gediz Basin, Turkey, J. Hydrol., 229, 87–100, https://doi.org/10.1016/S0022-1694(99)00202-4, 2000.
Bastiaanssen, W. G. M., Menenti, M., Feddes, R. A., and Holtslag, A. A. M.: A remote sensing surface energy balance algorithm for land (SEBAL). 1. Formulation, J. Hydrol., 212–213, 198–212, https://doi.org/10.1016/S0022-1694(98)00253-4, 1998.
Bjørnæs, C.: A guide to representative concentration pathways, Center for International Climate and Environmental Research, https://cicero.oslo.no/en/articles/a-guide-to-representative-concentration-pathways (last access: 8 December 2022), 2013.
Brutsaert, W. and Parlange, M. B.: Hydrologic cycle explains the evaporation paradox, Nature, 396, 30, https://doi.org/10.1038/23845, 1998.
Burn, D. H. and Hesch, N. M.: Trends in Evaporation for the Canadian Prairies, J. Hydrol., 336, 61–73, https://doi.org/10.1016/j.jhydrol.2006.12.011, 2007.
Campos, N. J. B.: Modeling the Yield-Evaporation-Spill in the Reservoir Storage Process: The Regulation Triangle Diagram, Water Resour. Manag., 24, 3487–3511, https://doi.org/10.1007/s11269-010-9616-x, 2010.
Campos, J. N. B.: Dimensionamento de Reservatórios (Reservoir Design, in Portuguese), UFC – Federal University of Ceará, Fortaleza, Brazil, ISBN 85-7563-100-4, https://www.researchgate.net/profile/Jose-Nilson-Campos/publication/277665341_Dimensionamento_de_ Reservatorios_o_metodo_do_Diagrama_Triangular_de_ Regularizacao/links/562d14d508ae518e348247ec/ Dimensionamento-de-Reservatorios-o-metodo-do-Diagrama-Triangular-de-Regularizacao.pdf (last access: 8 December 2022), 2015.
Ceará State Secretariat for Water Resources: Electronic Atlas of Water Resources of Ceará, http://atlas.cogerh.com.br/ (last access: 16 December 2022), 2022.
Chattopadhyay, N. and Hulme, M.: Evaporation and potential evapotranspiration in India under conditions of recent and future climate change, Agr. Forest Meteorol., 87, 55–73, https://doi.org/10.1016/S0168-1923(97)00006-3, 1997.
Chen, J., Brissette, F. P., and Caya, D.: Remaining error sources in bias-corrected climate model outputs, Clim. Change, 162, 563–582, https://doi.org/10.1007/s10584-020-02744-z, 2020.
Chou, S. C., Lyra, A., Mourão, C., Dereczynski, C., Pilotto, I., Gomes, J., Bustamante, J., Tavares, P., Silva, A., Rodrigues, D., Campos, D., Chagas, D., Sueiro, G., Siqueira, G., Nobre, P., and Marengo, J.: Evaluation of the Eta Simulations Nested in Three Global Climate Models, Am. J. Clim. Chang., 3, 438–454, https://doi.org/10.4236/ajcc.2014.35039, 2014.
Chylek, P., Li, J., Dubey, M. K., Wang, M., and Lesins, G.: Observed and model simulated 20th century Arctic temperature variability: Canadian Earth System Model CanESM2, Atmos. Chem. Phys. Discuss., 11, 22893–22907, https://doi.org/10.5194/acpd-11-22893-2011, 2011.
COGERH – Water Resources Management Company of Ceará: Portal Hidrológico do Ceará, http://funceme.br/hidro-ce-app/reservatorios/volume (last access: 16 December 2022), 2020.
Cui, X., Guo, X., Wang, Y., Wang, X., Zhu, W., Shi, J., Lin, C., and Gao, X.: Application of remote sensing to water environmental processes under a changing climate, J. Hydrol., 574, 892–902, https://doi.org/10.1016/j.jhydrol.2019.04.078, 2019.
Darshana, D., Pandey, A., and Pandey, R. P.: Analysing Trends in reference evapotranspiration and weather variables in the Tons River basin in central India, Stoch. Env. Res. Risk A., 27, 1407–1421, https://doi.org/10.1007/s00477-012-0677-7, 2013.
de Araújo, J. C. and Piedra, J. I. G.: Comparative hydrology: analysis of a semiarid and a humid tropical watershed, Hydrol. Process., 23, 1169–1178, https://doi.org/10.1002/hyp.7232, 2009.
de Araújo, J. C., Döll, P., Güntner, A., Krol, M., Abreu, C. B. R., Hauschild, M., and Mendiondo, E. M.: Water scarcity under scenarios for global climate change and regional development in semiarid northeastern Brazil, Water Int., 29, 209–220, https://doi.org/10.1080/02508060408691770, 2004.
de Araújo, J. C., Güntner, A., and Bronstert, A.: Loss of reservoir volume by sediment deposition and its impact on water availability in semiarid Brazil, Hydrolog. Sci. J., 51, 157–170, https://doi.org/10.1623/hysj.51.1.157, 2006.
de Araújo, J. C., Mamede, G. L., and de Lima, B. P.: Hydrological guidelines for reservoir operation to enhance water governance: Application to the Brazilian Semiarid region, Water, 10, 1628, https://doi.org/10.3390/w10111628, 2018.
de Araújo, J. C., Landwehr, T., Alencar, P. H. L., and Paulino, W. D.: Water Management causes increment of reservoir silting and reduction of water yield in the semiarid State of Ceará, Brazil, J. South Am. Earth Sci., 121, 104102, https://doi.org/10.1016/j.jsames.2022.104102, 2023.
de Macêdo, M. V. A.: Características Técnicas dos Açudes Públicos do Ceará, 2 ed., Fortaleza: DNOCS, Fortaleza, Brazil, https://search.worldcat.org/pt/title/710039600 (last access: 8 December 2022), 1981 (in Portuguese).
Dibike, Y., Prowse, T., Bonsal, B., and O'Neil, H.: Implications of future climate on water availability in the western Canadian river basins, Int. J. Climatol., 37, 3247–3263, https://doi.org/10.1002/joc.4912, 2017.
Elsawwaf, M., Willems, P., and Feyen, J.: Assessment of the sensitivity and prediction uncertainty of evaporation models applied to Nasser Lake, Egypt. J. Hydrol., 395, 10–22, https://doi.org/10.1016/j.jhydrol.2010.10.002, 2010.
Donohue, R. J., McVicar, T. R., and Roderick, M. L.: Assessing the ability of potential evaporation formulations to capture the dynamics in evaporative demand within a changing climate, J. Hydrol., 386, 186–197, https://doi.org/10.1016/j.jhydrol.2010.03.020, 2010.
Duethmann, D. and Blöschl, G.: Why has catchment evaporation increased in the past 40 years? A data-based study in Austria, Hydrol. Earth Syst. Sci., 22, 5143–5158, https://doi.org/10.5194/hess-22-5143-2018, 2018.
Feitosa, G. P., de Araújo, J. C., and Barros, M. U. G.: Different methods for measuring evaporation in a tropical reservoir: The case of the gavião reservoir in the state of Ceará, Rev. Caatinga, 34, 410–421, https://doi.org/10.1590/1983-21252021v34n217rc, 2021.
Fiseha, B. M., Setegn, S. G., Melesse, A. M., Volpi, E., and Fiori, A.: Impact of Climate Change on the Hydrology of Upper Tiber River Basin Using Bias Corrected Regional Climate Model, Water Resour. Manag., 28, 1327–1343, https://doi.org/10.1007/s11269-014-0546-x, 2014.
Fuentes, I., van Ogtrop, F., and Vervoort, R. W.: Long-term surface water trends and relationship with open water evaporation losses in the Namoi catchment, Australia, J. Hydrol., 584, 124714, https://doi.org/10.1016/j.jhydrol.2020.124714, 2020.
FUNCEME – Ceará Meteorology and Water Resources Foundation, Hydrological Portal of Ceará, http://www.funceme.br/hidro-ce-zend/ (last access: 16 December 2022), 2020.
Gokool, S., Jarmain, C., Riddell, E., Swemmer, A., Lerm, R., and Chetty, K. T.: Quantifying riparian total evaporation along the Groot Letaba River: A comparison between infilled and spatially downscaled satellite derived total evaporation estimates, J. Arid Environ., 147, 114–124, https://doi.org/10.1016/j.jaridenv.2017.07.014, 2017.
Graham, L., Hagemann, S., Jaun, S., and Beniston, M.: On interpreting hydrological change from regional climate models, Clim. Change 81, 97–122, https://doi.org/10.1007/s10584-006-9217-0, 2007.
Helfer, F., Lemckert, C., and Zhang, H.: Impacts of climate change on temperature and evaporation from a large reservoir in Australia, J. Hydrol., 475, 365–378, https://doi.org/10.1016/j.jhydrol.2012.10.008, 2012.
Hounguè, R., Lawin, A. E., Moumouni, S., and Afouda, A. A.: Change in Climate Extremes and Pan Evaporation Influencing Factors over Ouémé Delta in Bénin, Climate, 7, 2, https://doi.org/10.3390/cli7010002, 2019.
IBGE – Brazilian Institute of Geography: Estados: População. Instituto Brasileiro de Geografia, Rio de Janeiro, https://censo2022.ibge.gov.br (last access: 6 July 2023), 2022.
INMET – Brazilian National Institute of Meteorology: Normais Climatológicas do Brasil, https://portal.inmet.gov.br/normais (last access: 16 December 2022), 2019.
INMET – Brazilian National Institute of Meteorology: Banco de Dados Meteorológicos do INMET, https://bdmep.inmet.gov.br/ (last access: 16 December 2022), 2023.
IPCC – Intergovernmental Panel on Climate Change. Climate Change 2014: Synthesis Report. Contribution of Working Groups I, II and III to the Fifth Assessment Report of the Intergovernmental Panel on Climate Change, IPCC, Geneva, Switzerland, 151 pp., https://www.ipcc.ch/report/ar5/syr/ (last access: 16 December 2022), 2014.
IPECE – Instituto de Pesquisa e Estratégia Econômica do Ceará: Indústria de transformação ativa http://www2.ipece.ce.gov.br/atlas/capitulo5/52/index.htm (last access: 14 December 2022), 2017.
Kendall, M. and Gibbons, J. D.: Rank Correlation Methods, Oxford University Press, Oxford, England, ISBN 9780195208375, 1990.
Kendall, M. G.: Rank Correlation Measures, Charles Griffin, London, England, ISBN 9780852641996, 1975.
Kendon, E. J., Ban, N., Roberts, N. M., Fowler, H. J., Roberts, M. J., Chan, S. C., Evans, J. P., Fosser, G., and Wilkinson, J. M.: Do convection-permitting regional climate models improve projections of future precipitation change?, B. Am. Meteorol. Soc., 98, 79–93, https://doi.org/10.1175/BAMS-D-15-0004.1, 2017.
Konapala, G., Mishra, A. K., Wada, Y., and Mann, M. E.: Climate change will affect global water availability through compounding changes in seasonal precipitation and evaporation, Nat. Commun., 11, 1–10, https://doi.org/10.1038/s41467-020-16757-w, 2020.
Krol, M. S., Jaeger, A., and Bronstert, A.: Integrated modelling of climate change impacts in North-eastern Brazil, in: Global change and regional impacts: water availability and vulnerability of eco-systems and society in the semiarid Northeast of Brazil, edited by: Gaiser, T., Krol, M., Frischkorn, H., and de Araújo, J. C., Springer, Berlin, Germany, ISBN 978-3-642-62861-0, 2003.
Kundzewicz, Z. W., Krysanova, V., Benestad, R. E., Hov, Piniewski, M., and Otto, I. M.: Uncertainty in climate change impacts on water resources, Environ. Sci. Policy, 79, 1–8, https://doi.org/10.1016/j.envsci.2017.10.008, 2018.
Liu, B., Xu, M., Henderson, M., and Gong, W.: A spatial analysis of pan evaporation trends in China, 1955–2000, J. Geophys. Res.-Atmos., 109, D15102, https://doi.org/10.1029/2004JD004511, 2004.
Lyra, A., Tavares, P., Chou, S. C., Sueiro, G., Dereczynski, C., Sondermann, M., Silva, A., Marengo, J., and Giarolla, A.: Climate change projections over three metropolitan regions in Southeast Brazil using the non-hydrostatic Eta regional climate model at 5-km resolution, Theor. Appl. Climatol., 132, 663–682, https://doi.org/10.1007/s00704-017-2067-z, 2018.
Malveira, V. T. C., de Araújo, J. C., and Güntner, A.: Hydrological impact of a high- density reservoir network in semiarid northeastern Brazil, J. Hydrol. Eng., 17, 109–117, https://doi.org/10.1061/(ASCE)HE.1943-5584.0000404, 2012.
Mamede, G. L., Araújo, N. A., Schneider, C. M., de Araújo, J. C., and Herrmann, H. J.: Overspill avalanching in a dense reservoir network, P. Natl. Acad. Sci. USA, 109, 7191–7195, https://doi.org/10.1073/pnas.1200398109, 2012.
Mamede, G. L., Güntner, A., Medeiros, P. H. A., de Araújo, J. C., and Bronstert, A.: Modeling the Effect of Multiple Reservoirs on Water and Sediment Dynamics in a Semiarid Catchment in Brazil, J. Hydrol. Eng., 23, 05018020, https://doi.org/10.1061/(ASCE)HE.1943-5584.0001701, 2018.
Mann, H. B.: Nonparametric tests against trend, Econometrica, 13, 245, https://doi.org/10.2307/1907187, 1945.
Maraun, D.: Bias correction, quantile mapping, and downscaling: Revisiting the inflation issue, J. Climate, 26, 2137–2143, https://doi.org/10.1175/JCLI-D-12-00821.1, 2013.
Marengo, J. A., Jones, R., Alvesa, L. M., and Valverde, M. C.: Future change of temperature and precipitation extremes in South America as derived from the PRECIS regional climate modeling system, Int. J. Climatol., 29, 2241–2255, https://doi.org/10.1002/joc.1863, 2009.
Marengo, J. A., Alves, L. M., Alvalá, R. C. S., Cunha, A. P., Brito, S., and Moraes, O. L. L.: Climatic characteristics of the 2010-2016 drought in the semiarid Northeast Brazil region, An. Acad. Bras. Cienc., 90, 1973–1985, https://doi.org/10.1590/0001-3765201720170206, 2017.
Marengo, J. A., Galdos, M. V., Challinor, A., Cunha, A. P., Marin, F. R., Vianna, M. d. S., Alvala, R. C. S., Alves, L. M., Moraes, O. L., and Bender, F.: Drought in Northeast Brazil: A review of agricultural and policy adaptation options for food security, Clim. Resil. Sustain., 1, 1–20, https://doi.org/10.1002/cli2.17, 2022.
Mays, L. W.: Water Resources Engineering, John Wiley & Sons, Inc., New York, United States, ISBN 978-0-470-46064-1, 2011.
McMahon, T. A. and Mein, R. G.: River and Reservoir Yield, Water Resources Publications, Littleton, Colorado, USA, ISBN 9780918334619, 1986.
McMahon, T. A., Peel, M. C., Lowe, L., Srikanthan, R., and McVicar, T. R.: Estimating actual, potential, reference crop and pan evaporation using standard meteorological data: a pragmatic synthesis, Hydrol. Earth Syst. Sci., 17, 1331–1363, https://doi.org/10.5194/hess-17-1331-2013, 2013.
McMahon, T. A., Finlayson, B. L., and Peel, M. C.: Historical developments of models for estimating evaporation using standard meteorological data, Wires Water, 3, 788–818, https://doi.org/10.1002/wat2.1172, 2016.
Medeiros, P. H. A. and de Araújo, J. C.: Temporal variability of rainfall in a semiarid environment in Brazil and its effect on sediment transport processes, J. Soils Sediments, 14, 1216–1223, https://doi.org/10.1007/s11368-013-0809-9, 2014.
Medeiros, P. H. A. and Sivapalan, M.: From hard-path to soft-path solutions: slow–fast dynamics of human adaptation to droughts in a water scarce environment, Hydrolog. Sci. J., 65, 1803–1814, https://doi.org/10.1080/02626667.2020.1770258, 2020.
Mesinger, F., Chou, S. C., Gomes, J. L., Gomes, J. L., Jovic, D., Bastos, P., Bustamante, J. F., Lazic, L., Lyra, A. A., Morelli, S., Ristic, I., and Veljovic, K.: An upgraded version of the Eta model, Meteorol. Atmos. Phys., 116, 63–79, https://doi.org/10.1007/s00703-012-0182-z, 2012.
Mesquita, J. B. d. F., Lima Neto, I. E., Raabe, A., and de Araújo, J. C.: The influence of hydroclimatic conditions and water quality on evaporation rates of a tropical lake, J. Hydrol., 590, 125456, https://doi.org/10.1016/j.jhydrol.2020.125456, 2020.
Minville, M., Brissette, F., and Leconte, R.: Impacts and uncertainty of climate change on water resource management of the Peribonka River System (Canada), J. Water Res. Plan. Man., 136, 376–385, https://doi.org/10.1061/(ASCE)WR.1943-5452.0000041, 2010.
Miralles, D. G., van den Berg, M. J., Gash, J. H., Parinussa, R. M., de Jeu, R. A. M., Beck, H. E., Holmes, T. R. H., Jiménez, C., Verhoest, N. E. C., Dorigo, W. A., Teuling, A. J., and Johannes Dolman, A.: El Niño–La Niña cycle and recent trends in continental evaporation, Nat. Clim. Change, 4, 122–126, https://doi.org/10.1038/nclimate2068, 2014.
Moges, D. M. and Bhat, H. G.: Climate change and its implications for rainfed agriculture in Ethiopia, J. Water Clim. Change, 12, 1229–1244, https://doi.org/10.2166/wcc.2020.058, 2021.
Moonen, A. C., Ercoli, L., Mariotti, M., and Masoni, A.: Climate change in Italy indicated by agrometeorological indices over 122 years, Agr. Forest Meteorol., 111, 13–27, https://doi.org/10.1016/S0168-1923(02)00012-6, 2002.
Mozny, M., Trnka, M., Vlach, V., Vizina, A., Potopova, V., Zahradnicek, P., Stepanek, P., Hajkova, L., Staponites, L., and Zalud, Z.: Past (1971–2018) and future (2021–2100) pan evaporation rates in the Czech Republic, J. Hydrol., 590, 125390, https://doi.org/10.1016/j.jhydrol.2020.125390, 2020.
Navarro-Racines, C., Tarapues, J., Thornton, P., Jarvis, A., and Ramirez-Villegas, J.: High-resolution and bias-corrected CMIP5 projections for climate change impact assessments, Sci. Data, 7, 1–14, https://doi.org/10.1038/s41597-019-0343-8, 2020.
Penman, H. L.: Natural evaporation from open water, bare soil and grass, Proc. R. Soc., 193, 120–145, https://doi.org/10.1098/rspa.1948.0037, 1948.
Penman, H. L.: Evaporation: An introductory survey, Neth. J. Agr. Sci., 4, 9–29, https://doi.org/10.18174/njas.v4i1.17768, 1956.
Peter, S. J., de Araújo, J. C., Araújo, N. A., and Herrmann, H. J.: Flood avalanches in a semiarid basin with a dense reservoir network, J. Hydrol., 512, 408–420, https://doi.org/10.1016/j.jhydrol.2014.03.001, 2014.
Pierce, D. W., Das, T., Cayan, D. R., Maurer, E. P., Miller, N. L., Bao, Y., Kanamitsu, M., Yoshimura, K., Snyder, M. A., Sloan, L. C., Franco, G., and Tyree, M.: Probabilistic estimates of future changes in California temperature and precipitation using statistical and dynamical downscaling, Clim. Dynam., 40, 839–856, https://doi.org/10.1007/s00382-012-1337-9, 2013.
Qin, M., Zhang, Y., Wan, S., Yue, Y., Cheng, Y., and Zhang, B.: Impact of climate change on “evaporation paradox” in province of Jiangsu in southeastern China, PLoS One, 16, 1–26, https://doi.org/10.1371/journal.pone.0247278, 2021.
Recio-Villa, I., Martínez Rodríguez, J. B., Molina, J. L., and Pino Tarragó, J. C.: Multiobjective optimization modeling approach for multipurpose single reservoir operation, Water, 10, 427, https://doi.org/10.3390/w10040427, 2018.
Roderick, M. L. and Farquhar, G. D.: Changes in Australian pan evaporation from 1970 to 2002, Int. J. Climatol., 24, 1077–1090, https://doi.org/10.1002/joc.1061, 2004.
Rodrigues, I. S., Ramalho, G. L. B., and Medeiros, P. H. A.: Potential of floating photovoltaic plant in a tropical reservoir in Brazil, J. Environ. Plann. Man., 63, 2334–2356, https://doi.org/10.1080/09640568.2020.1719824, 2020.
Rodrigues, I. S., Costa, C. A. G., Raabe, A., Medeiros, P. H. A., and de Araújo, J. C.: Evaporation in Brazilian dryland reservoirs: Spatial variability and impact of riparian vegetation, Sci. Total Environ., 797, 149059, https://doi.org/10.1016/j.scitotenv.2021.149059, 2021a.
Rodrigues, I. S., Costa, C. A. G., Lima Neto, I. E., and Hopkinson, C.: Trends of evaporation in Brazilian tropical reservoirs using remote sensing, J. Hydrol., 598, 126473, https://doi.org/10.1016/j.jhydrol.2021.126473, 2021b.
Rodrigues, G. P., Rodrigues, Í. S., Raabe, A., Holstein, P., and de Araújo, J. C.: Direct measurement of open-water evaporation: a newly developed sensor applied to a Brazilian tropical reservoir, Hydrolog. Sci. J., 68, 379–394, https://doi.org/10.1080/02626667.2022.2157278, 2023.
Rosenzweig, C., Casassa, G., Karoly, D. J., Imeson, A., Liu, C., Menzel, A., Rawlins, S., Root, T. L., Seguin, B., Tryjanowski, P., and Hanson, C. E.: Assessment of observed changes and responses in natural and managed systems, In: Climate Change 2007: Impacts, Adaptation and Vulnerability. Contribution of Working Group II to the Fourth Assessment Report of the Intergovernmental Panel on Climate Change, edited by: Parry, M. L., Canziani, O. F., Palutikof, J. P., and van der Linden, P. J., Cambridge University Press, Cambridge, England, https://pubs.giss.nasa.gov/docs/2007/2007_Rosenzweig_ro02900h.pdf (last access: 16 December 2022), 2007.
Silva, J. F. C. B. d. C., da Silva, R. M., Santos, C. A. G., Silva, A. M., and Vianna, P. C. G.: Analysis of the response of the Epitácio Pessoa reservoir (Brazilian semiarid region) to potential future drought, water transfer and LULC scenarios, Nat. Hazards., 108, 1347–1371, https://doi.org/10.1007/s11069-021-04736-3, 2021.
Sivapalan, M., Savenije, H. H. G., and Blöschl, G.: Socio-hydrology: a new science of people and water, Hydrol. Process., 26, 1270–1276, https://doi.org/10.1002/hyp.8426, 2012.
Solomon, S., Qin, D., and Manning, M. (Eds.): Contribution of Working Group I to the Fourth Assessment Report of the Intergovernmental Panel on Climate Change, Cambridge University Press, Cambridge, England, ISBN 978-0-521-88009-1, 2007.
Su, Z.: The Surface Energy Balance System (SEBS) for estimation of turbulent heat fluxes, Hydrol. Earth Syst. Sci., 6, 85–100, https://doi.org/10.5194/hess-6-85-2002, 2002.
Tavares, P. d. S., Pilotto, I. L., Chou, S. C., Souza, S. A., Fonseca, L. M. G., and Chagas, D. J.: Projeções climáticas para América do Sul regionalizadas pelo modelo Eta com correção de viés, versão 3.0, LattesData [data set] https://doi.org/10.57810/lattesdata/WAVGSL, 2023.
Teutschbein, C. and Seibert, J.: Bias correction of regional climate model simulations for hydrological climate-change impact studies: Review and evaluation of different methods, J. Hydrol., 456–457, 12–29, https://doi.org/10.1016/j.jhydrol.2012.05.052, 2012.
Thrasher, B., Maurer, E. P., McKellar, C., and Duffy, P. B.: Technical Note: Bias correcting climate model simulated daily temperature extremes with quantile mapping, Hydrol. Earth Syst. Sci., 16, 3309–3314, https://doi.org/10.5194/hess-16-3309-2012, 2012.
Valiantzas, J. D.: Simplified forms for the standardized FAO-56 Penman-Monteith reference evapotranspiration using limited weather data, J. Hydrol., 505, 13–23, https://doi.org/10.1016/j.jhydrol.2013.09.005, 2013.
Wang, W., Xiao, W., Cao, C., Gao, Z., Hu, Z., Liu, S., Shen, S., Wang, L., Xiao, Q., Xu, J., Yang, D., and Lee, X.: Temporal and spatial variations in radiation and energy balance across a large freshwater lake in China, J. Hydrol., 511, 811–824, https://doi.org/10.1016/j.jhydrol.2014.02.012, 2014.
Watanabe, M., Suziki, T., O'ishi, R., Komuro, Y., Watanabe, S., Emori, S., Takemura, T., Chikira, M., Ogura, T., Sekiguchi, M., Takata, K., Yamazaki, D., Yokohata, T., Nozawa, T., Hasumi, H., Tatebe, H., and Kimoto, M.: Improved climate simulation by MIROC5: mean states, variability, and climate sensitivity, J. Climate, 23, 6312–6335, https://doi.org/10.1175/2010JCLI3679.1, 2010.
Zhang, S., Foerster, S., Medeiros, P., de Araújo, J. C., Duan, Z., Bronstert, A., and Waske, B.: Mapping regional surface water volume variation in reservoirs in northeastern Brazil during 2009–2017 using high-resolution satellite images, Sci. Total Environ., 789, 147711, https://doi.org/10.1016/j.scitotenv.2021.147711, 2021.
Zhao, G., Li, Y., Zhou, L., and Gao, H.: Evaporative water loss of 1.42 million global lakes, Nat. Commun., 13, 3686, https://doi.org/10.1038/s41467-022-31125-6, 2022.
The “alert volume” is the critical water level that prompts water management actions. Typically a fraction of the reservoir's total volume, it indicates when water availability becomes concerning. At this point, measures like usage restrictions, conservation plans, or emergency actions are activated to ensure a continuous water supply for users and ecosystem preservation. In Brazil's semiarid region, this volume is usually set to 5 % of the reservoir's total capacity.