the Creative Commons Attribution 4.0 License.
the Creative Commons Attribution 4.0 License.
 | 11 Jun 2024
The influence of human activities on streamflow reductions during the megadrought in central Chile
Nicolás Álamos
Camila Alvarez-Garreton
Ariel Muñoz
Álvaro González-Reyes
Since 2010, central Chile has experienced a protracted megadrought with annual precipitation deficits ranging from 25 % to 70 %. An intensification of drought propagation has been attributed to the effect of cumulative precipitation deficits linked to catchment memory. Yet, the influence of water extractions on drought intensification is still unclear. Our study assesses climate and water use effects on streamflow reductions during a high-human-influence period (1988–2020) in four major agricultural basins. We performed this attribution by contrasting observed streamflow (driven by climate and water use) with near-natural streamflow simulations (driven mainly by climate) representing what would have occurred without water extractions. Near-natural streamflow estimations were obtained from rainfall–runoff models trained over a reference period with low human intervention (1960–1988). Annual and seasonal streamflow reductions were examined before and after the megadrought onset, and hydrological drought events were characterized for the complete evaluation period in terms of their frequency, duration, and intensity.
Our results show that before the megadrought onset (1988–2009) the mean annual deficits in observed streamflow ranged between 2 % and 20 % across the study basins and that 81 % to 100 % of those deficits were explained by water extractions. During the megadrought (2010–2020), the mean annual deficits in observed streamflow were 47 % to 76 % among the basins. During this time, the relative contribution of precipitation deficits on streamflow reduction increased while the contribution of water extractions decreased, accounting for 27 % to 51 % of the streamflow reduction. Regarding drought events during the complete evaluation period, we show that human activities have amplified drought propagation, with almost double the intensity of hydrological droughts in some basins compared to those expected by precipitation deficits only. We conclude that while the primary cause of streamflow reductions during the megadrought has been the lack of precipitation, water uses have not diminished during this time, causing an exacerbation of the hydrological drought conditions and aggravating their impacts on water accessibility in rural communities and natural ecosystems.
- Article
(5696 KB) - Full-text XML
- BibTeX
- EndNote


The fluxes of the water cycle vary and change in time and space, as well as the anthropic activities affecting those fluxes, leading to a co-evolving hydrosocial cycle (Linton and Budds, 2014; Budds, 2012) that defines the state of the hydrological system (Van Loon et al., 2016). Observational evidence in different regions indicates that hydrological cycles are being affected by climate change and human activities. Climate change has led to changes in precipitation patterns worldwide (Fleig et al., 2010; Kingston et al., 2015), while human activities have altered the spatiotemporal distribution of water resources (Van Loon et al., 2022). This can lead to water scarcity problems, particularly when precipitation deficits occur in regions that concentrate water consumption requirements.
The alterations in the water cycle may also affect the occurrence of droughts, which are defined as a deficit of water relative to normal conditions and can be identified in different components of the hydrological cycle. While meteorological droughts (precipitation deficits) are mainly controlled by regional climate, hydrological droughts (streamflow and groundwater deficits) are also influenced by catchment characteristics and water uses. In this way, under similar meteorological conditions, the severity of hydrological droughts and their impacts on society can vary significantly within the territory (Van Lanen et al., 2013).
Most drought analyses consider climate variability as a main driver of drought; however, increasing focus has been given to assessing the compounding effects of climate variability and human activities on water resources and drought propagation (Van Loon et al., 2016; Wanders and Wada, 2015; Zhao et al., 2014). Anthropic activities, such as irrigation, urbanization, land use changes, and water infrastructure (e.g. reservoirs or water transfer channels), affect runoff mechanisms (Huang et al., 2016) and can lead to a higher frequency of hydrological droughts (Alvarez-Garreton et al., 2021; Ward et al., 2020). An example of this is the Yellow River basin in China, where – despite no significant rainfall deficits in recent years – a hydrological drought with historical minimum streamflow levels is being observed, which has been mainly driven by anthropic activities in the basin (Huang et al., 2016; Kong et al., 2016; Li et al., 2019; Liu et al., 2016; Zhao et al., 2014).
Advancing our understanding of hydrological droughts as a complex process depending on the interaction between climatic, biophysical, and anthropic drivers is critical to assessing a catchment's vulnerability to droughts, mitigating their occurrence, and designing adaptation plans. While all these drivers influence the propagation and impacts of droughts, water management plans mainly influence human activities and their local disturbances to the hydrological cycle. Therefore, it is critical to address the scientific challenge of understanding the influence of human activities on the hydrological cycle and quantifying their impacts.
To address this challenge, in this paper we focus on central Chile (29–35° S; Fig. 1), a region where the signal of anthropic climate change is leading to an increase in mean temperature, increasing heatwaves events, and a sustained decrease in precipitation (Boisier et al., 2018; Bozkurt et al., 2017; Garreaud et al., 2017, 2020; González-Reyes et al., 2023). The drying trend has led to the so-called megadrought, affecting the country since 2010, with annual precipitation deficits ranging between 25 % and 70 % (Garreaud et al., 2017, 2020). This meteorological drought in central Chile has propagated across the terrestrial system, leading to hydrological droughts and water scarcity problems that vary across the territory (Alvarez-Garreton et al., 2021; Duran-Llacer et al., 2020; Muñoz et al., 2020; Barría et al., 2021b).
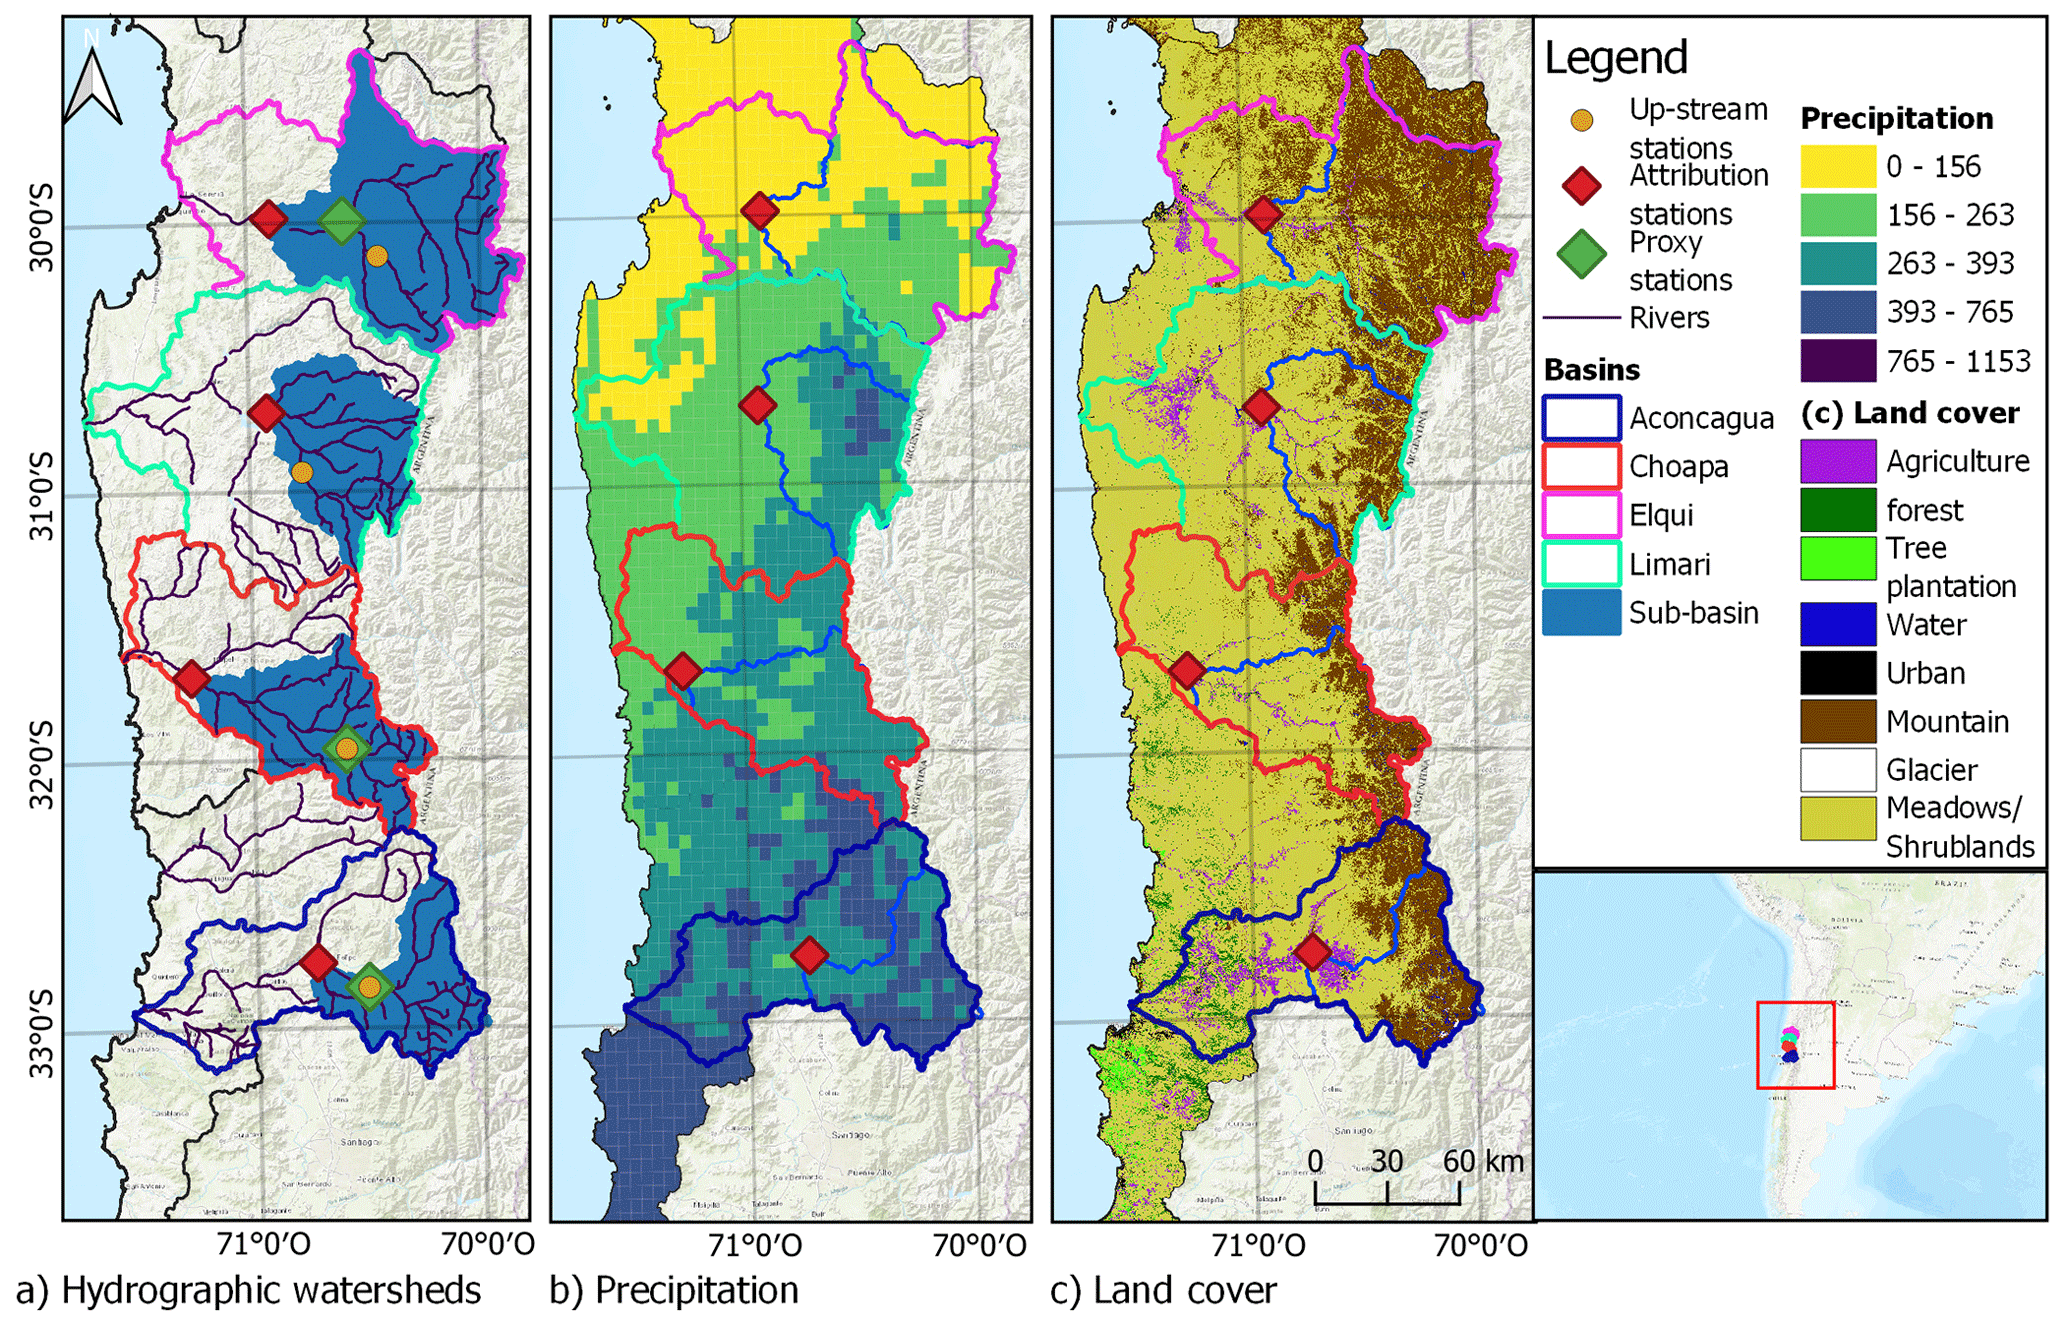
Figure 1Panel (a) shows the four main basins of the study area and the streamflow gauges used for the analyses. The red diamonds indicate the stations used to characterize each basin, the green diamonds are the gauges used as predictors for filling in monthly streamflow data (note that in the Limarí catchment no gap-filling process was made, leading to the absence of a predictor gauge station; Sect. 2.2), and the orange circles are the up-stream stations used in the rainfall–runoff ratio analysis (Sect. 2.3). The basin area covered by the red diamond gauge is painted blue. Panel (b) presents the mean annual precipitation (mm yr−1) from the CR2MET dataset for the period 1980–2010. Panel (c) shows the gridded land cover dataset from Zhao et al. (2016). Base map source: Esri (2017).
In the Petorca River basin, located in the Valparaíso region in central Chile, Muñoz et al. (2020) found that during the megadrought streamflow and water bodies from the upper parts of the basin were less affected than the middle and lower areas of the valley, where most of the agriculture is located. However, the authors did not make a formal attribution about the role of water consumption and climate on streamflow reduction. Another study was conducted on the Laguna de Aculeo (Aculeo Lake), a natural reservoir in central Chile that dried up during the ongoing megadrought. Barría et al. (2021b) performed an attribution exercise by using the Water Evaluation and Planning System (WEAP) hydrological model and concluded that climate was the primary factor explaining the lake's drying, while water demand has remained stable over the past few decades. Another study reported that basins with larger human intervention within this region exhibited lower runoff sensitivities to precipitation compared to less disturbed ones (Alvarez-Garreton et al., 2018). In that study, the authors attributed this phenomenon to the alteration of runoff generation mechanisms associated with water withdrawals and reservoirs. Furthermore, higher-than-expected streamflow reductions during the megadrought have also been observed in near-natural basins. Alvarez-Garreton et al. (2021) reported the effects of catchment memory in snow-dominated catchments in central Chile, where the accumulation of the persistent precipitation deficits led to less streamflow than expected from observations during previous single-year meteorological droughts. These studies have advanced our understanding about the role of catchments and anthropic characteristics in the megadrought's propagation; however, further studies are still required to robustly assess the impacts of human activities on streamflow reduction and drought conditions in the major basins of central Chile.
In this article, we quantify the relative effects of climate and water extractions on streamflow reduction in four major agricultural basins in central Chile. We analyse a period with high human influence within the study basins (1988–2020) and assess how the relative effects of climate and water extractions change before and after the megadrought onset. Additionally, we assess the influence of water extractions on the intensity, frequency, and duration of hydrological droughts for the complete evaluation period. To achieve this, we follow the approach proposed by Van Loon et al. (2022) and compare streamflow observations with a near-natural simulated streamflow representing the discharge that would have occurred without human influences. Hydrological droughts are identified by streamflow deficit using a threshold determined from the near-natural scenario, allowing for better identification of human impacts (Van Loon et al., 2016).
2.1 Study area
The study was conducted in four major basins located between 29 and 33° S (Fig. 1): the Elqui, Limarí, and Choapa basins in the Coquimbo region and the Aconcagua basin in the Valparaíso region. These basins fall within semi-arid (Coquimbo region) and Mediterranean (Valparaíso region) climate zones, which are particularly vulnerable to droughts due to the majority of annual precipitation occurring during the winter season concentrated on a few storm events (Garreaud et al., 2017).
All catchments feature a snow/rain-fed hydrologic regime. The Aconcagua basin also has a large glacier area (192 km2) that contributes to streamflow, especially during dry summers (Crespo et al., 2020). The study basins have experienced precipitation deficits of 25 %–70 % and streamflow deficits of up to 70 % during the megadrought that has affected the region since 2010 (Alvarez-Garreton et al., 2021; Garreaud et al., 2017, 2020).
According to the data provided by the water security platform from the Center for Climate and Resilience Research (https://seguridadhidrica.cr2.cl, last access: 1 April 2024), agriculture is the primary productive sector and the main consumer of water resources within these basins. Agricultural land cover areas of 152 km2 (total catchment area of 9800 km2), 605 km2 (total catchment area of 11 800 km2), 313 km2 (total catchment area of 8124 km2), and 582 km2 (total catchment area of 7200 km2), as well as their annual water consumption, at present correspond to 3.25, 14.3, 6.48, and 15.72 m3 s−1 in the Elqui, Limarí, Choapa, and Aconcagua basins, respectively. Avocado and table vine species are the main consumers in the Aconcagua basin, while the Limarí basin has a higher demand from permanent forage species, table vine, and citrus plantations.
2.2 Data
Catchment boundaries and time series of total monthly streamflow normalized by catchment area (in mm per month) were obtained from the CAMELS-CL dataset (Alvarez-Garreton et al., 2018, available at https://camels.cr2.cl/, last access: 20 September 2023) for the period April 1960–March 2020. Total monthly precipitation for the same period was obtained from the CR2MET dataset version 2.5 at a 5×5 m grid resolution (Boisier, 2023) and averaged across the basin boundaries. Catchment-scale monthly evapotranspiration (ET) was computed based on the ECMWF surface reanalysis ERA5-Land dataset, available at a horizontal resolution of 10 km (Muñoz-Sabater et al., 2021) from April 1960 to March 2020. For each study basin, we selected the most downstream streamflow gauge station having more than 80 % of streamflow records for the 1960–2020 period (see Fig. 1). Gaps in monthly streamflow of downstream gauges (red diamonds in Fig. 1a) were filled based on linear regression models, using the basin's precipitation and the streamflow of an upstream gauge with a strong correlation with the considered station (green diamonds in Fig. 1a) as predictors. The linear regressions resulted in coefficients of determination larger than 0.8 in Elqui, Choapa, and Aconcagua basins.
Streamflow and basin-averaged precipitation and ET were computed for hydrological years (April to March in Chile) and for wet and dry seasons. The wet season is defined from April to August, while the dry season corresponds to the months between September and March. Annual (seasonal) streamflow values were computed when the 12 (6) months had valid data.
To account for human intervention within the basins, we analysed annual water uses from industry, energy, mining, livestock, and drinking water sectors, as well as water evaporation from lakes and reservoirs for the period 1960–2020 obtained from the water security platform from the Center for Climate and Resilience Research (https://seguridadhidrica.cr2.cl, last access: 1 April 2024). All variables with a different spatial resolution than the basin (whether gridded or administrative units) were calculated for the basin considering the weighted average of the variable within the basin surface.
2.3 Near-natural streamflow modelling and attribution exercise
The attribution exercise to quantify the climatic and human contributions to streamflow reductions is schematized in Fig. 2. Near-natural streamflow simulations were obtained by rainfall–runoff statistical models trained in a period when anthropic activities had low water consumption (Sharifi et al., 2021; Zhao et al., 2014).
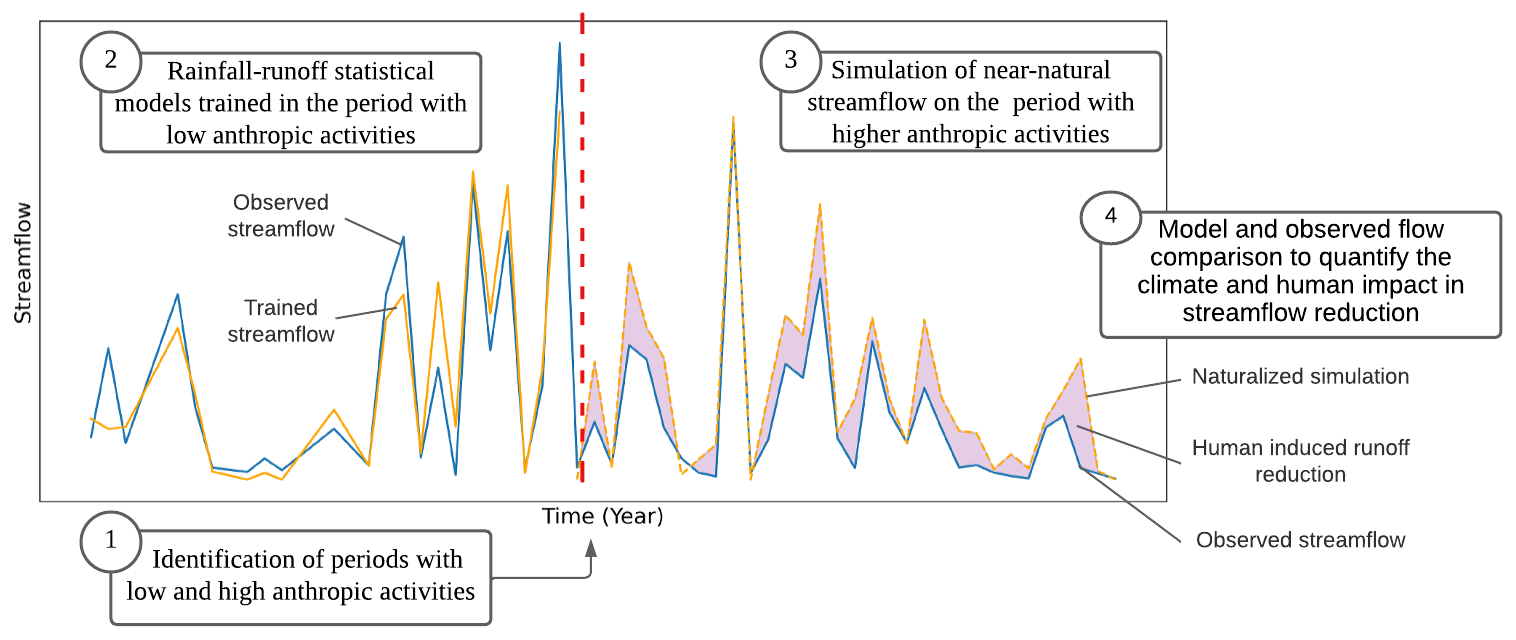
Figure 2Flowchart of the steps to quantify the human contribution to streamflow reduction based on comparing a near-natural simulated streamflow with the observed streamflow on a period of high anthropic activities.
2.3.1 Selection of low-influence reference periods
For each basin, we identified low-human-intervention periods based on the regime shifts of streamflow, precipitation, and water uses (Sect. 2.2). The non-parametric Buishand breakpoint test (Buishand, 1982) was applied to identify these shifts. Buishand is a statistical homogeneity test method that checks if two (or more) datasets come from the same distribution. In this way, the test can detect breakpoints where the distribution of a dataset changes. We applied the Buishand test to each time series during the 1960–2020 periods. To identify multiple breakpoints, we iterated the test in the sub-periods before and after the previous breakpoint until no breakpoints with a significance level at p value < 0.05. For the Buishand test, we used the pyHomogeneity Python library (Shourov, 2020).
In order to select periods with minimal human activities, it is important to identify breakpoints in the streamflow time series that are not primarily explained by climate shifts. To account for this, we selected a unique training period across basins based on the identification of concurrent breaking points in both streamflow and human activity time series, while ensuring the absence of discernible precipitation shifts. We analysed multiple variables instead of using only water use data to achieve a more robust selection of the training period. This reduces the effects of inter-basin water transfers and land cover changes, which may obscure the ability of water use data to accurately capture the magnitude of anthropogenic intervention in the basins.
To ensure that the chosen period of analysis is not dependent on the specific statistical test employed, we conducted a sensitivity analysis using the Sequential T-test Analysis of Regime Shifts (STARS) at a monthly timescale for both precipitation and streamflow time series (Rodionov, 2004). The STARS V6.3 Excel macro application, available at https://sites.google.com/view/regime-shift-test (last access: 10 December 2022), was utilized to perform the STARS test.
2.3.2 Climate and human contribution to streamflow reduction
Assuming that the effects of climate and local human activities on streamflow generation are independent, the observed streamflow (Qobs) can be disaggregated as follows (Kong et al., 2016):
where Qnn corresponds to a climatic-induced streamflow, referred to as near-natural streamflow in this paper, and ΔQhuman is the human-induced effect on streamflow. In this study, near-natural streamflow in Eq. (1) is estimated from linear rainfall–runoff regressions trained during the low-influence reference period defined in Sect. 2.3.1. To account for pluvial and snowmelt runoff generation processes, we implemented seasonal rainfall–runoff models considering the total streamflow and rainfall in the 6-month periods defined in Sect. 2.2 as dependent and independent variables, respectively. In several snow-dominated basins in central Chile, the winter flows continue to be fed by the snowmelt from the previous hydrological year, especially when the previous year was wetter than normal (Alvarez-Garreton et al., 2021). Given this, winter flow models include winter precipitation from the previous year. The models representing near-natural summer () and near-natural winter streamflow () were defined for year t as follows:
The coefficients in Eqs. (2) and (3) were obtained by the least square errors method during the training period. Based on this, the human influence during the evaluation (high-influence) period was obtained as
where is the simulated near-natural streamflow (seasonal concatenation of Eqs. 2 and 3), and ε represents the uncertainty from the regression model parameters. The attribution exercises were performed by applying Eq. (4) during the evaluation period. In the results of the attribution exercise (Sect. 3.3, Fig. 7), hydroclimatic variables are depicted as anomalies computed as the percentage difference from their mean values during the reference period (1960–1988). It is noteworthy that multiple regression equations with different functional forms (including a Box–Cox transformation to the seasonal and annual streamflow to account for potential non linearities between precipitation and streamflow) and variables (such as evapotranspiration and temperature) were tested for representing near-natural streamflow during the reference period (see Appendix A). The linear rainfall–runoff regressions from Eqs. (2) and (3) were those with a higher r2, and all variables were statistically significant at a p value of 0.05.
It should be noted that the near-natural streamflow estimations from Eqs. (2) and (3) assume a stationary rainfall–runoff relationship. However, recent evidence in this region has shown that under protracted drought conditions, a non-stationary catchment response modulated by catchment memory can emerge, resulting in larger streamflow reductions than those expected from single-year precipitation deficits (Alvarez-Garreton et al., 2021). This evidence corresponds to the headwater near-natural basins located upstream of the human-influenced basins selected in this study. To assess whether our analyses over the complete basins are potentially biased by non-stationary catchment responses, we compared the rainfall–runoff ratios (mean annual observed streamflow normalized by mean annual precipitation) during the evaluation period before (1988–2010) and after the megadrought onset (2010–2020), in both the upper and lower sections of each basin. These sections were defined by the streamflow gauges highlighted in orange circles and red diamonds in Fig. 1, respectively.
2.4 Hydrological drought event characterization
To quantify the impact of human activities on hydrological droughts (schematized in Fig. 3), we compared the characteristics of the observed and the near-natural streamflow deficits during drought events, including their frequency (number of drought events), duration (average, maximum, and total seasons), and intensity (i.e. deficit of volume) across the evaluation period. In this way, we assessed the influence of human activities over observed hydrological droughts by calculating the relative difference in each drought characteristic (DC) in the observed and near-natural scenario. To keep consistency with the attribution methodology (Sect. 2.3), drought events were characterized at a seasonal scale, as indicated in Eq. (5).
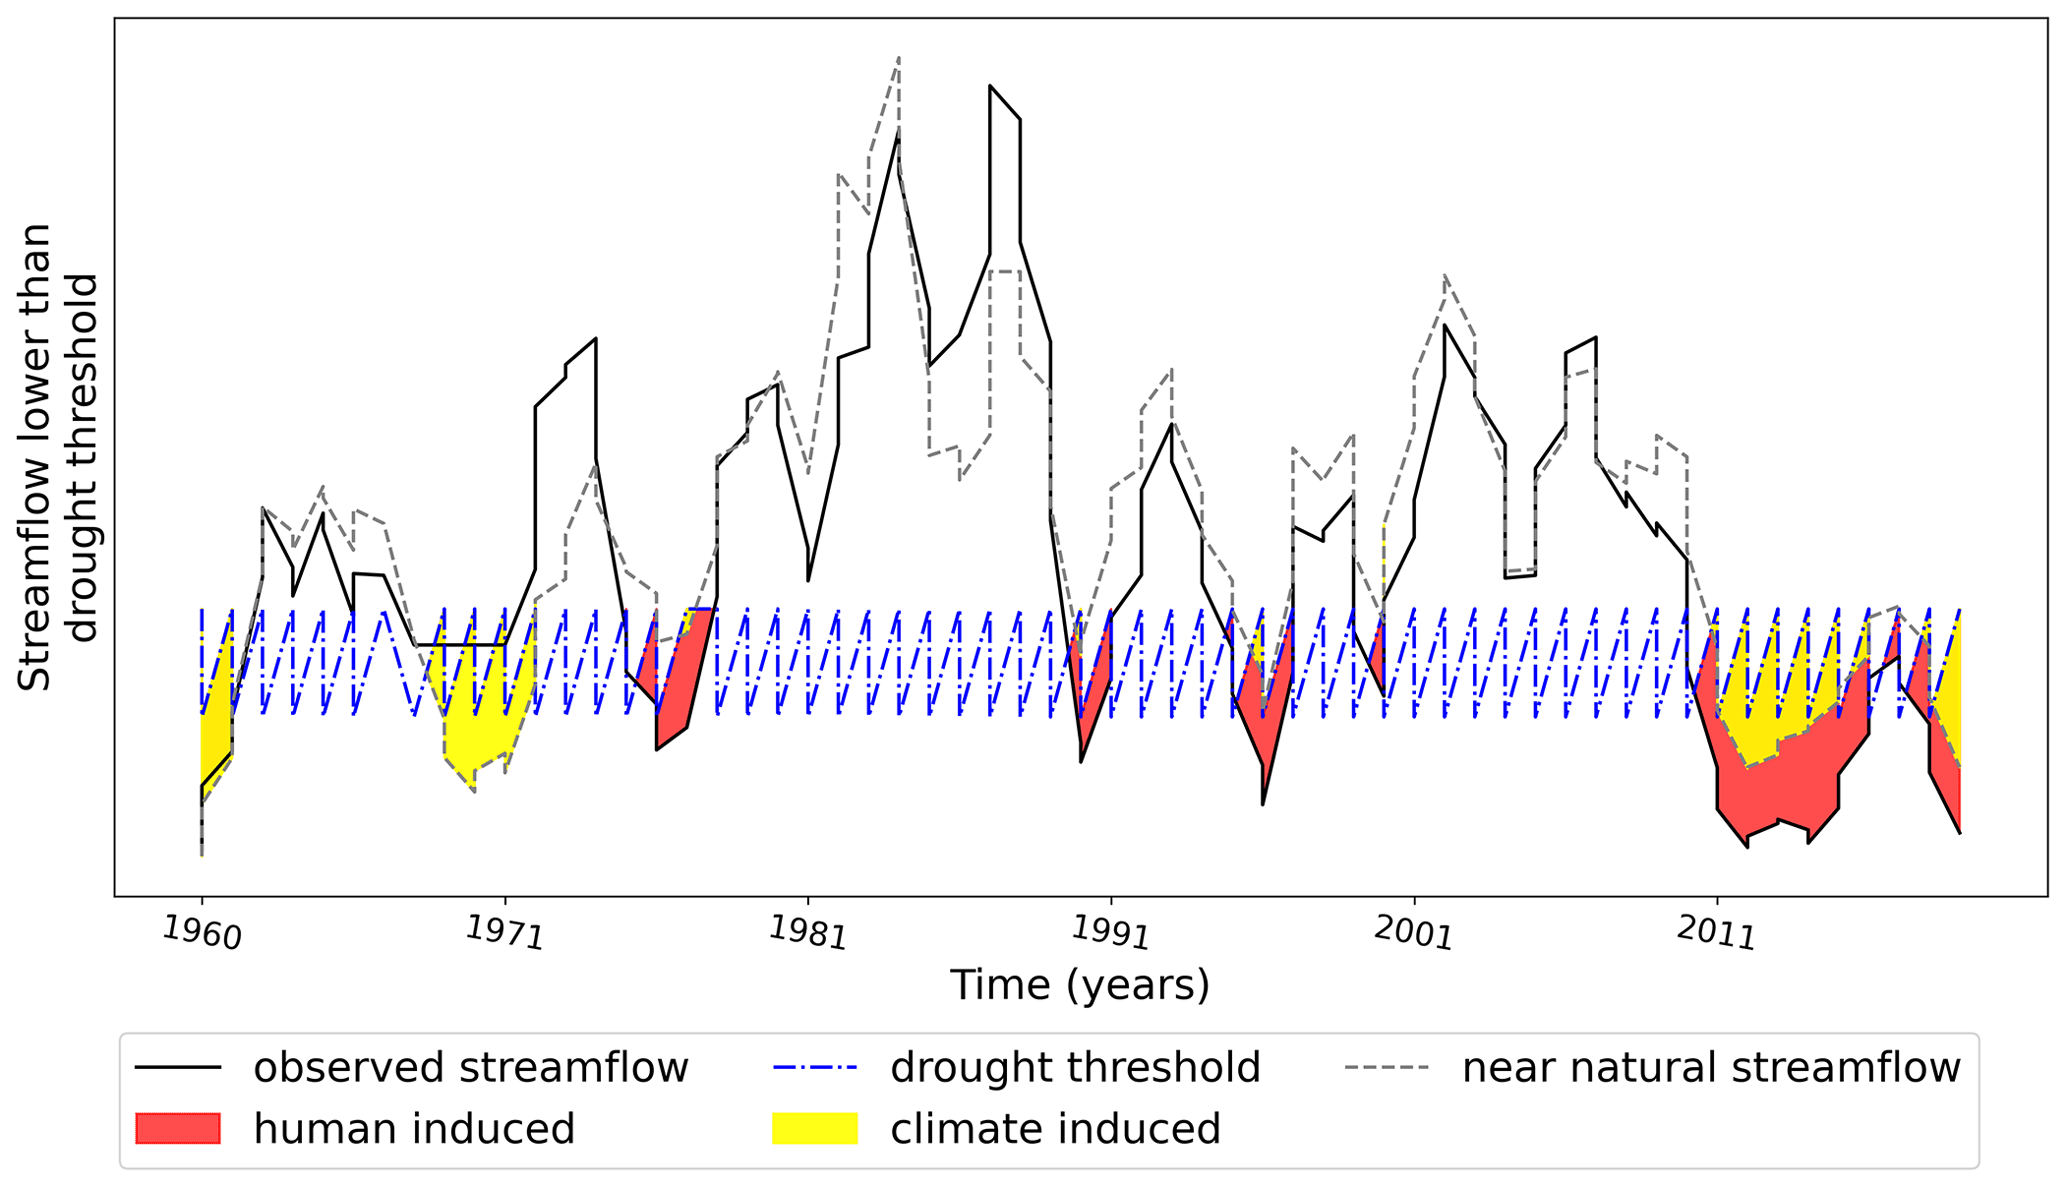
Figure 3Example of drought periods with annual streamflow lower than a threshold. Three types of droughts are identified: climate-induced droughts, when near-natural streamflow simulations are below the threshold; human-induced droughts, where only observations are below the threshold; and human and natural induced, where both observations and near-natural estimations are below the threshold (adapted from Van Loon et al., 2016).
To identify the hydrological drought events, we adopted a threshold approach, which defines drought events when the streamflow is below a specific percentile of the flow duration curve. For daily or monthly time series, a recommended threshold falls between the 70th and 90th percentile (Rangecroft et al., 2019; Van Loon et al., 2016; Van Loon, 2015). In this study, we adopted the 70th percentile of the seasonal streamflow series. This lowest threshold allows for the selection of more drought events, which makes statistical analysis more robust. The threshold can be fixed or variable; we used the variable threshold to incorporate seasonality into the drought selection (Rangecroft et al., 2019; Van Loon et al., 2019).
To allow for a strict assessment of human influence on hydrological drought, the selected threshold should not account for human activities (Rangecroft et al., 2019). To achieve this, we defined the 70th percentile threshold based on the entire period of records (1960–2020) but considering a naturalized regime provided by the near-natural simulated streamflow time series. It should be noted that if the observed streamflow for the complete period were considered, human activities would be included. On the other hand, if only the training low-influence periods were used to calculate the threshold, the climate variability and drying trend of the complete period would not be represented by the threshold.
3.1 Low-influence reference period
The series of annual streamflow, precipitation, total evapotranspiration (ET), and runoff coefficients (runoff normalized by precipitation) are shown in Fig. 4. The Buishand test resulted in significant change points only in streamflow and ET. Three change points were detected in all basins, the first between the years 1977–1978, the second one in 1988, and the last one between years 1998–2010 for the streamflow in all basins (Fig. 4), while a single change point was detected in 1973–1975 for ET in all basins except Aconcagua (Fig. 4d). The STARS test detected three similar change points in streamflow in 1977–1981, 1988, and 2010, with the 1988 breakpoint presenting the higher r2 index value.
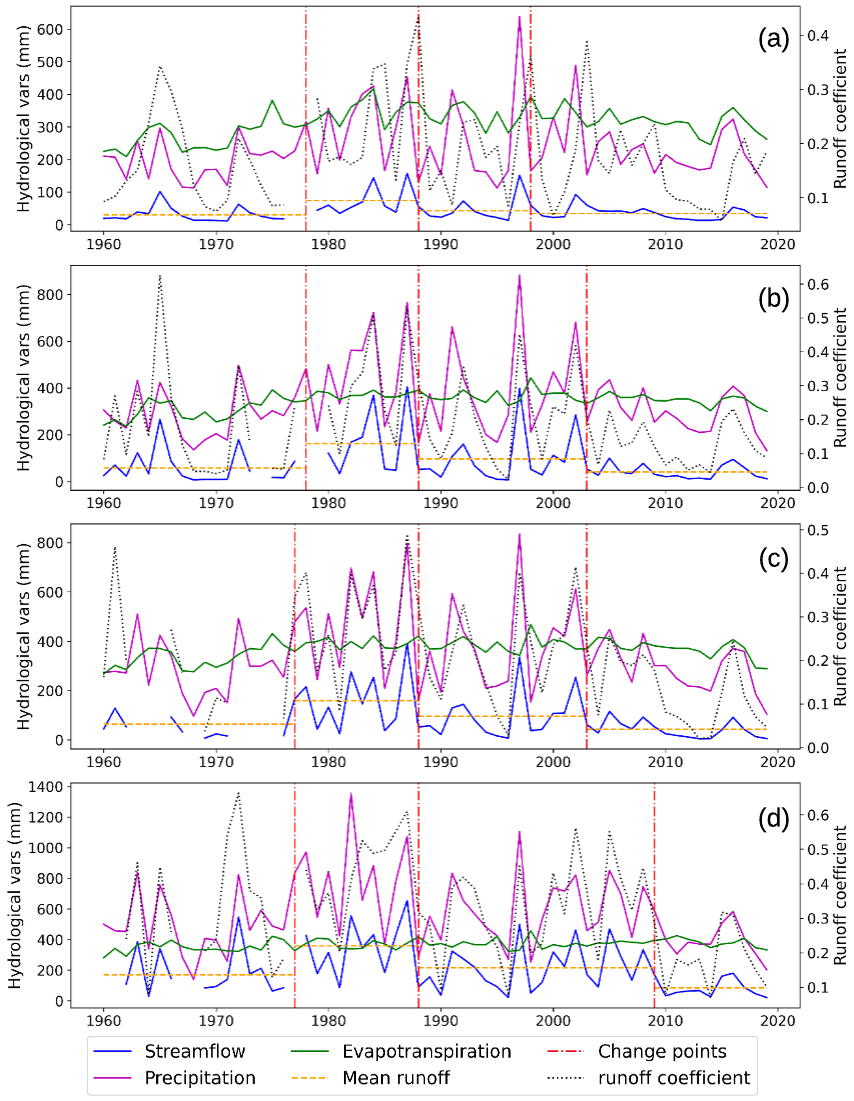
Figure 4Annual streamflow, precipitation, evapotranspiration, and runoff coefficient during the complete period (1960–2020) for Elqui (a), Limarí (b), Choapa (c), and Aconcagua (d) basins, respectively. The vertical red line indicates the years where significant change points (P value < 0.05) on streamflow distribution are detected by the Buishand test. (“vars” represents variables.)
The streamflow breakpoint of 1977–1978 was disregarded since it is mainly due to climatic drivers, as indicated by the single ET breakpoint during that period. We can relate this to the great Pacific shift and the warm cycle of the Pacific Decadal Oscillation (PDO) between 1977 and the mid-1990s (Kayano et al., 2009; Jacques-Coper and Garreaud, 2015; González-Reyes et al., 2017). Additionally, the 2010 Aconcagua streamflow breakpoint is likely driven by the onset of the megadrought, which also affected the 2004 change points in the Limarí and Choapa basins where lower precipitation was observed even before the megadrought.
Regarding water use, breakpoints were observed in Elqui and Limarí in 1988 and 1992, respectively, mainly associated to the growth of the agricultural sector (Fig. 5a and b). In the Aconcagua basin, a breakpoint occurred in 1985 due to intensified water use by the mining and agriculture sectors (Fig. 5d). Meanwhile, in the Choapa basin, a significant increase in mining water consumption since 2000 explains the time series breakpoint observed in that year (Fig. 5c). The 1998 Elqui basin streamflow breakpoint may be attributed to the construction of a dam upstream from the gauge station considered in this study (Fig. 5a). Based on these results, we used the 1988 streamflow breakpoint detected in all basins to define the low-influence period of 1960–1988. In consequence, the evaluation period was defined between 1988 and 2020, characterized by greater anthropic intervention and by the megadrought in its second half.
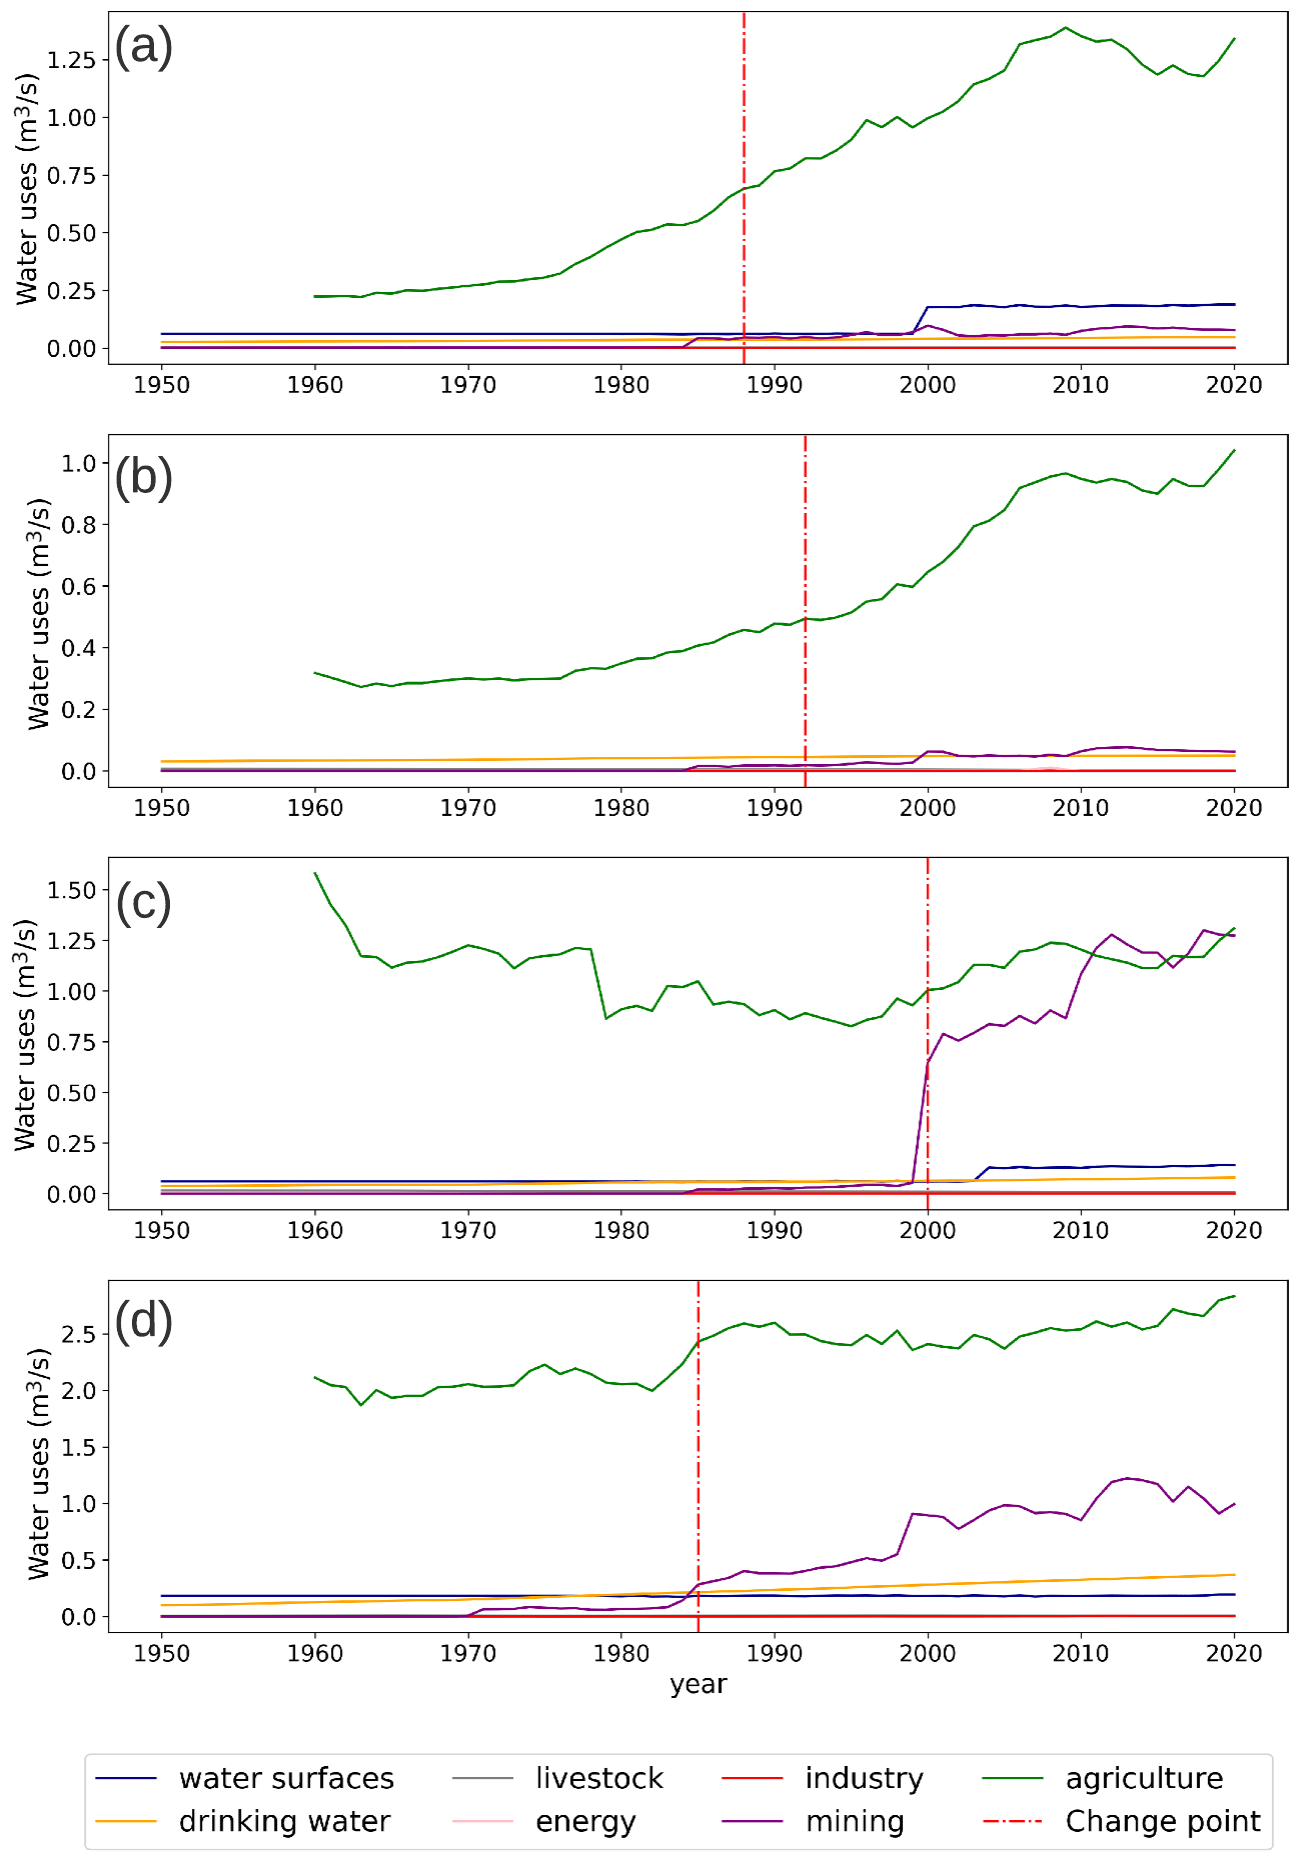
Figure 5Time series of water uses from different human activities in Elqui (a), Limarí (b), Choapa (c), and Aconcagua (d) basins, respectively. These time series include water uses for industrial, agriculture, mining, energy, livestock, water surfaces, and drinking water sectors. The red line indicates a breakpoint in the total water use distribution.
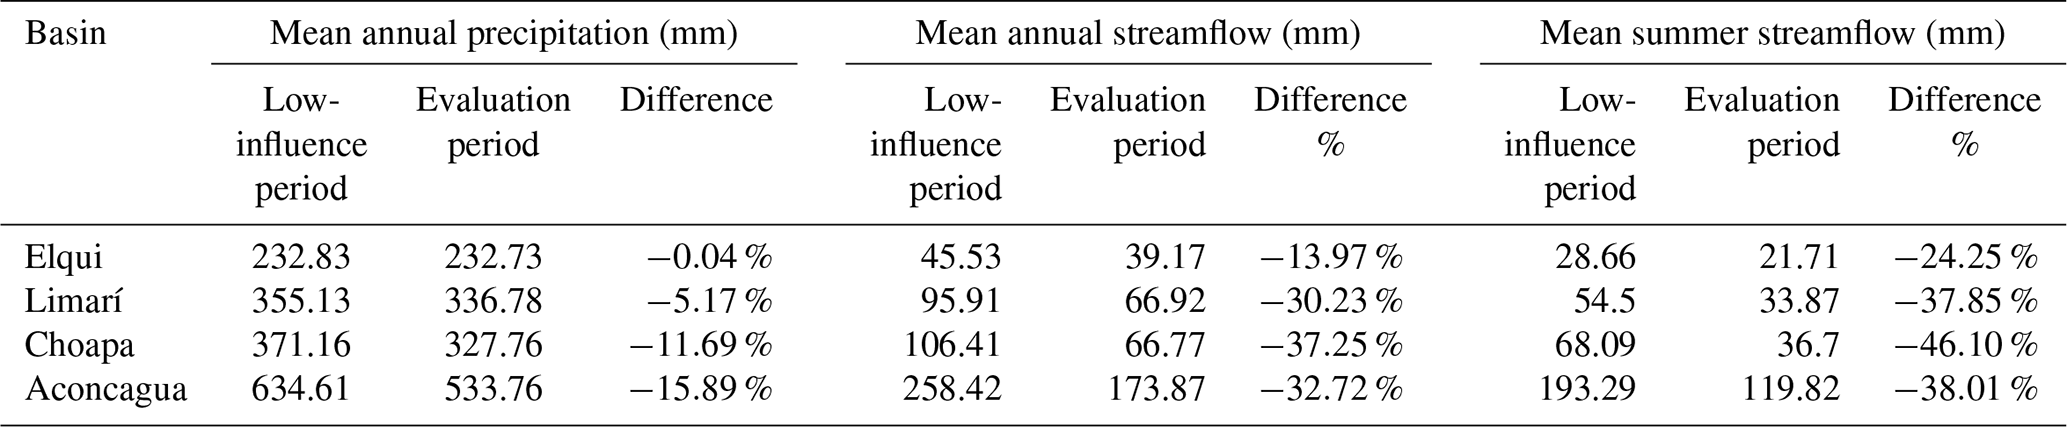
By comparing the hydroclimatic conditions of the study basins during the low-influence and evaluation periods, we see that the mean annual precipitation declined between 0.04 % and 15.89 % during these periods (Table 1). In contrast, the mean annual streamflow decreased by a range of 13.97 % to 37.25 %. If we examine summer streamflow, when agricultural water consumption is more intense, a reduction of 24.25 % to 46.1 % is observed. While the Aconcagua basin features the largest decrease in precipitation, the Choapa basin has the largest decrease in streamflow.
Table 1Average annual precipitation, average annual streamflow, and average summer season streamflow for each basin in the low-influence reference period (1960–1988) and the evaluation period (1988–2020).
3.2 Near-natural streamflow estimation
Near-natural simulated streamflow during the low-influence and evaluation periods for each basin is presented in Fig. 6. The selected models (Sect. 2.3) were based on streamflow values without the Box–Cox transformation, since the transformed data led to a reduction in model performance across all basins (Appendix A). The summer season estimations obtained from Eq. (2) had good performances during the training period, with mean biases of 0 % to 5 % and r2 ranging from 0.81 to 0.89 for the different basins. The winter season models resulted in lower performance, with mean biases of 0 % to 0.63 % and r2 ranging from 0.61 and 0.93 among the study basins.
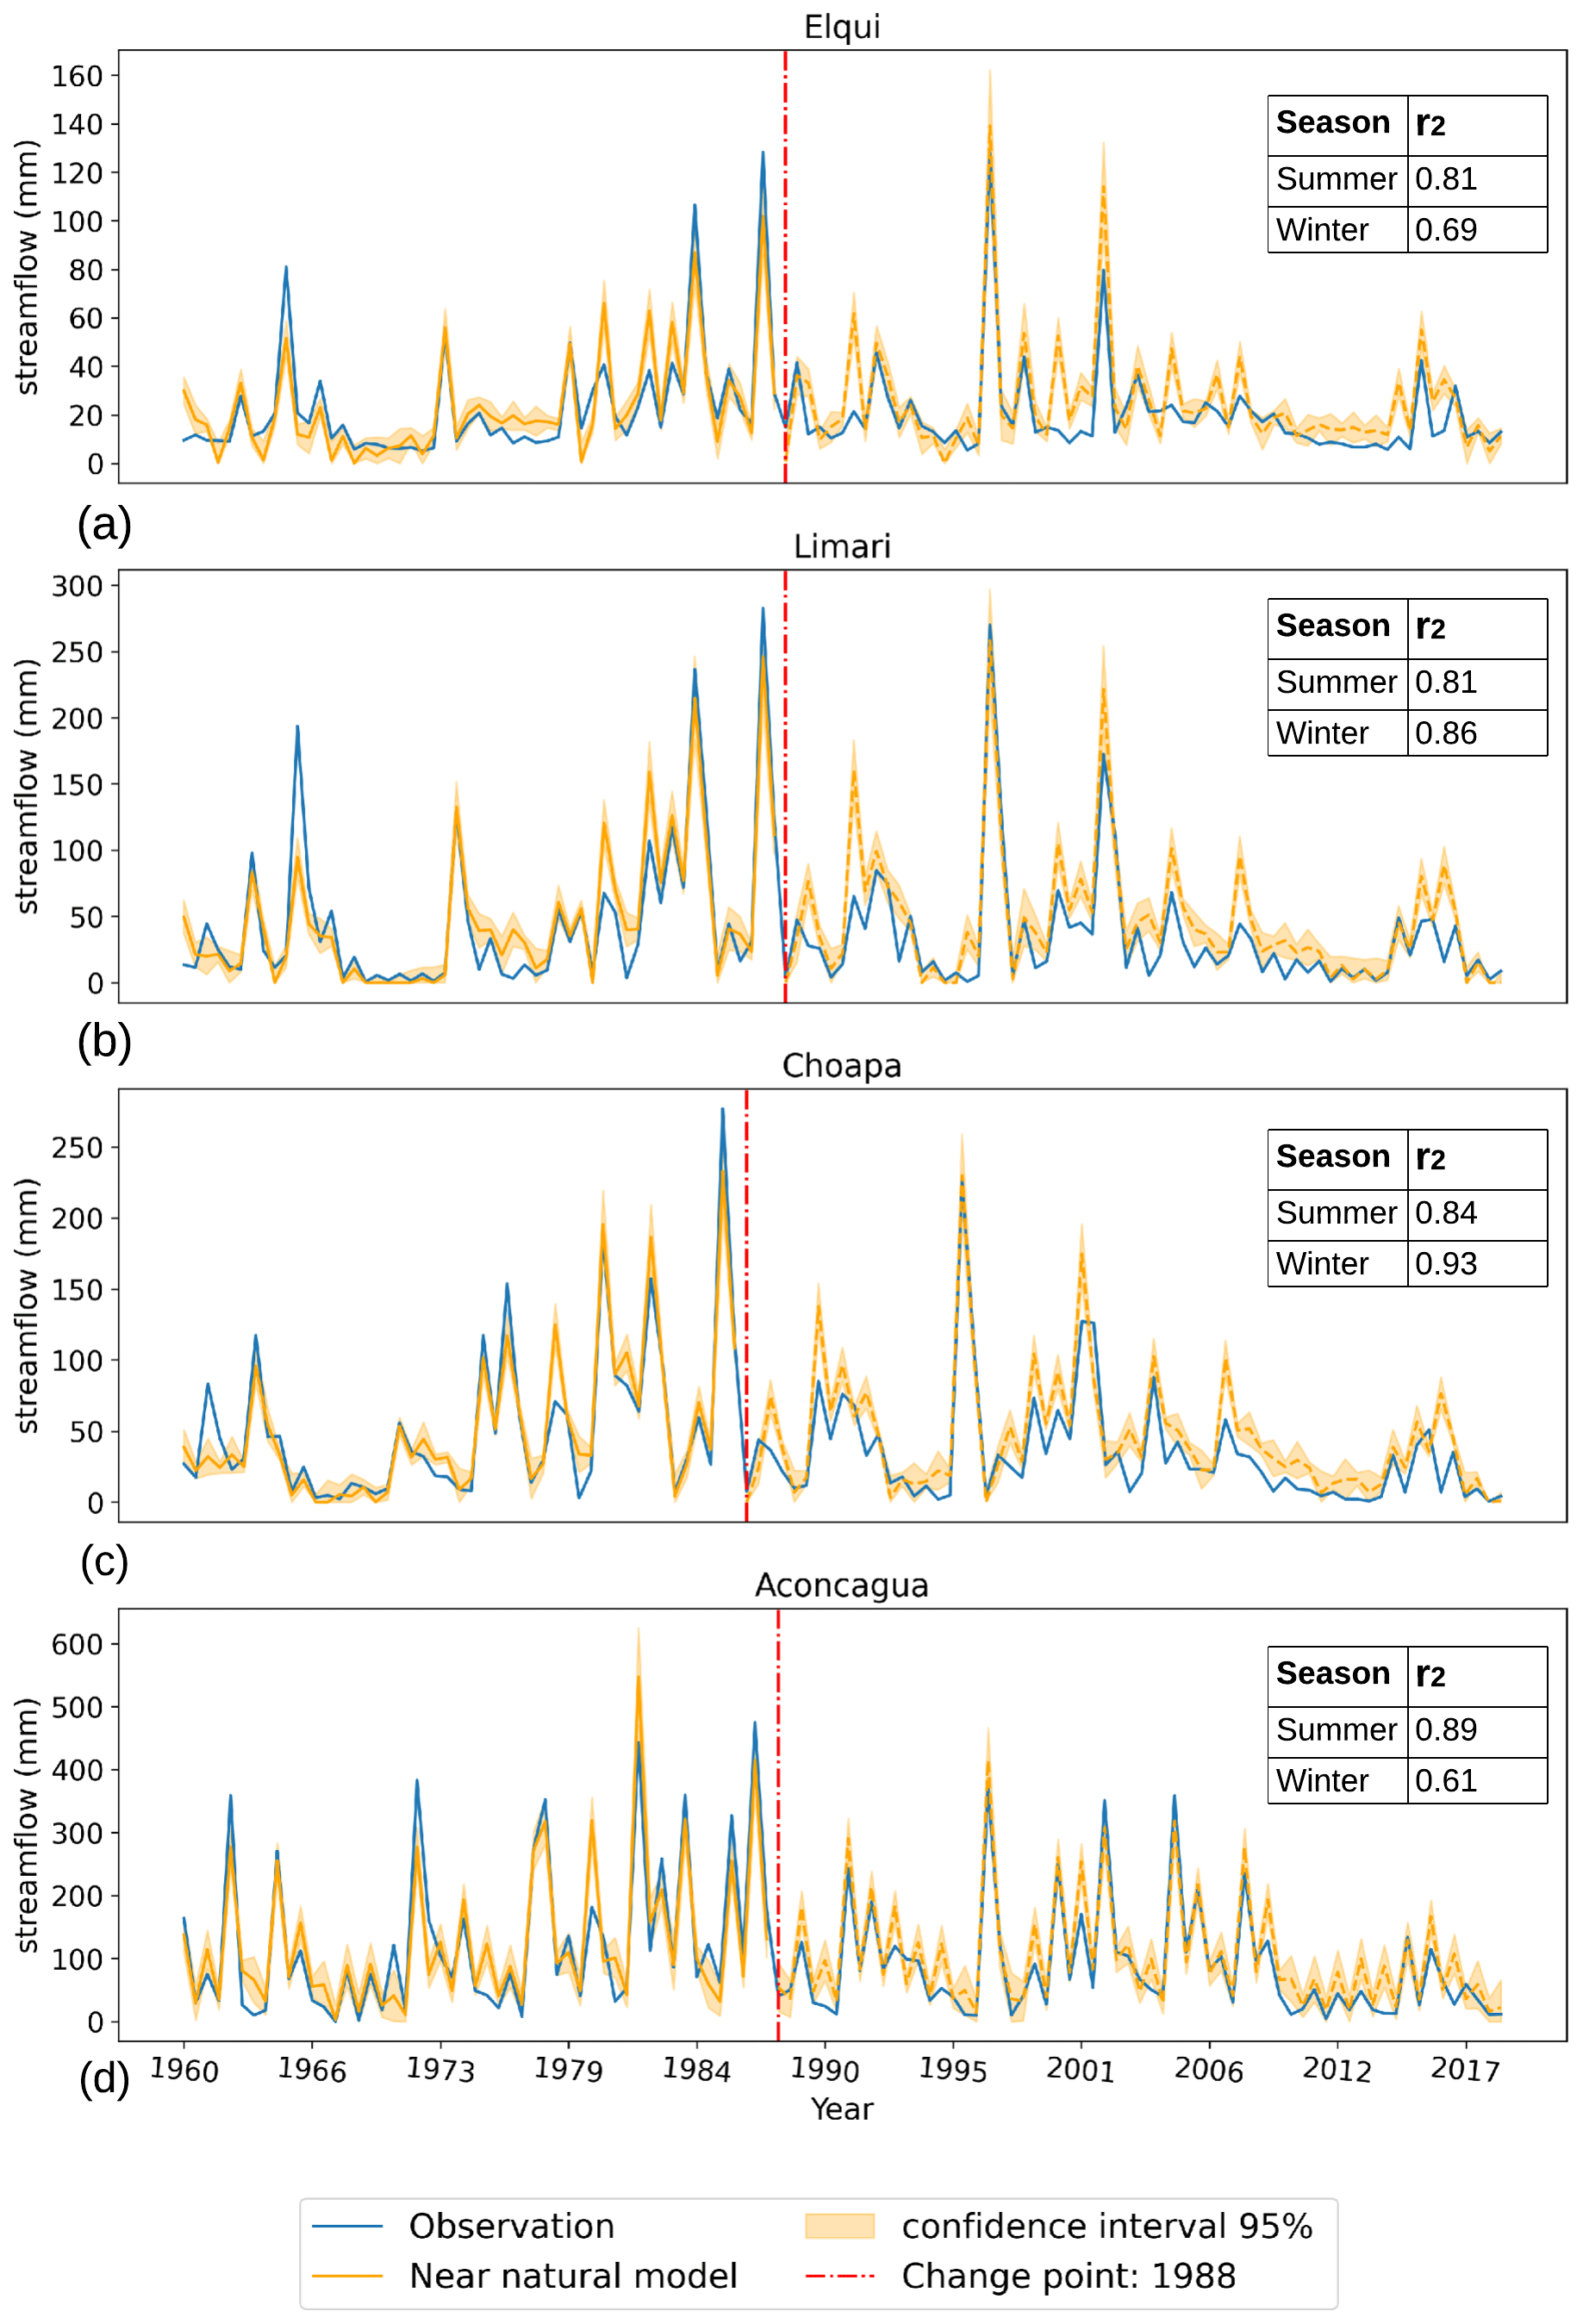
Figure 6The observed (continuous blue line) and near-natural simulated seasonal streamflow (continuous and dashed yellow line) for Elqui (a), Limarí (b), Choapa (c), and Aconcagua (d) basins, respectively. The continuous yellow line represents the simulated streamflow during the reference period, whose r2 is presented on the legend. The dashed yellow line is the simulated streamflow during the evaluation period (defined by the change point in 1988). The yellow ban represents the 95 % confidence interval of the simulated streamflow.
Table 2Average annual runoff coefficient during the evaluation period before the megadrought onset (1988–2010) and during the megadrought (2010–2020) for the upper and lower sections of each basin. The difference between the two periods relative to 1988–2010 is shown in the third row.
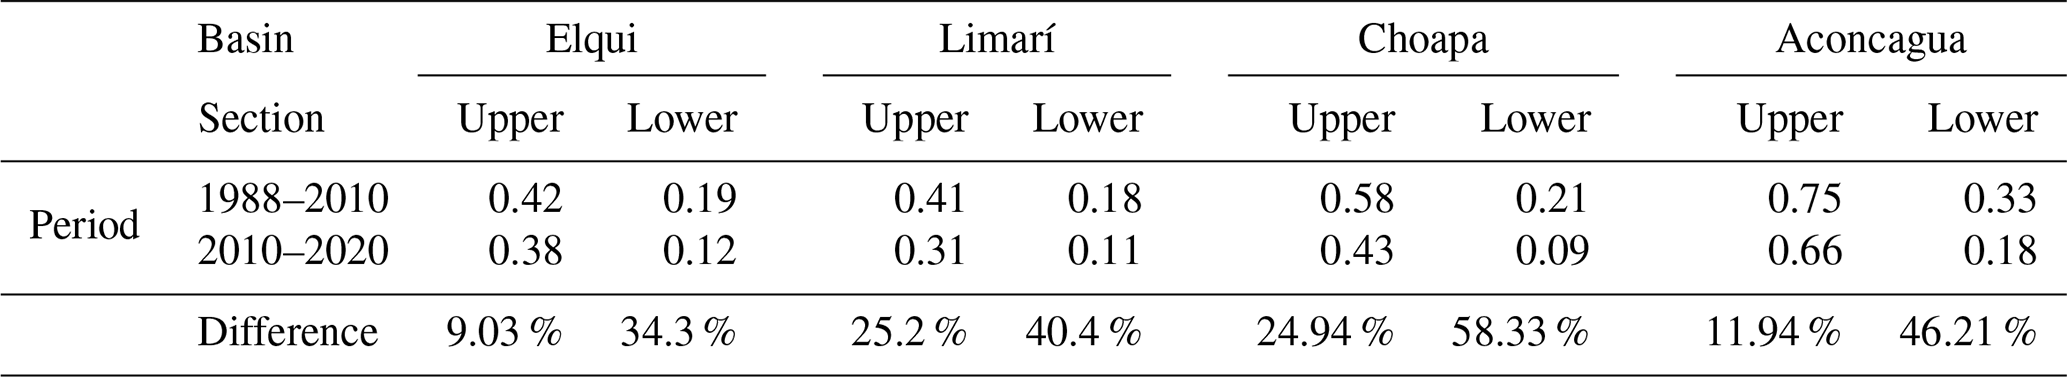
To examine the potential influence of non-stationary catchment response during the megadrought on the interpretation of our results, Table 2 shows the rainfall–runoff ratios during the evaluation period before (1988–2010) and after the megadrought onset (2010–2020). These results indicate that the mean rainfall–runoff ratios declined across the upper and lower sections (defined by up-stream and attribution stations from Fig. 1a, respectively) of all basins during the megadrought; however, the reduction in the upper sections (with low human intervention), mostly attributed to endogenous runoff mechanisms and hydrological memory, is less significant than those observed downstream (intervened basin). The changes in downstream rainfall–runoff ratios are nearly 4 times greater than the upper-stream changes in the Aconcagua and Elqui basins, more than twice in Choapa, and 1.6 times greater in the Limarí basin. This indicates that while endogenous runoff mechanisms, such as hydrological memory, may contribute to larger streamflow deficits during prolonged drought in near-natural basins, human activities in the downstream basins are inducing a larger impact on runoff generation during the megadrought.
3.3 The impacts of climate and human activities on streamflow
During the complete evaluation period, the near-natural simulated streamflow is higher than the observed streamflow in all the cases (Fig. 6), with mean differences ranging from 39.4 % in the Limarí basin (near-natural annual runoff of 93.23 mm and observed annual runoff of 66.91 mm) to 20.7 % in the Aconcagua basin (near-natural annual streamflow of 210 mm and observed annual runoff of 173.86 mm).
The relative impacts of climate and human activities on summer streamflow reductions during the evaluation period are presented in Fig. 7. This figure shows the annual anomalies of precipitation, observed and near-natural simulated summer streamflow, and the human-induced streamflow reduction obtained as the difference of the latter two (Eq. 4). The results for the annual fluxes are presented in Appendix B.
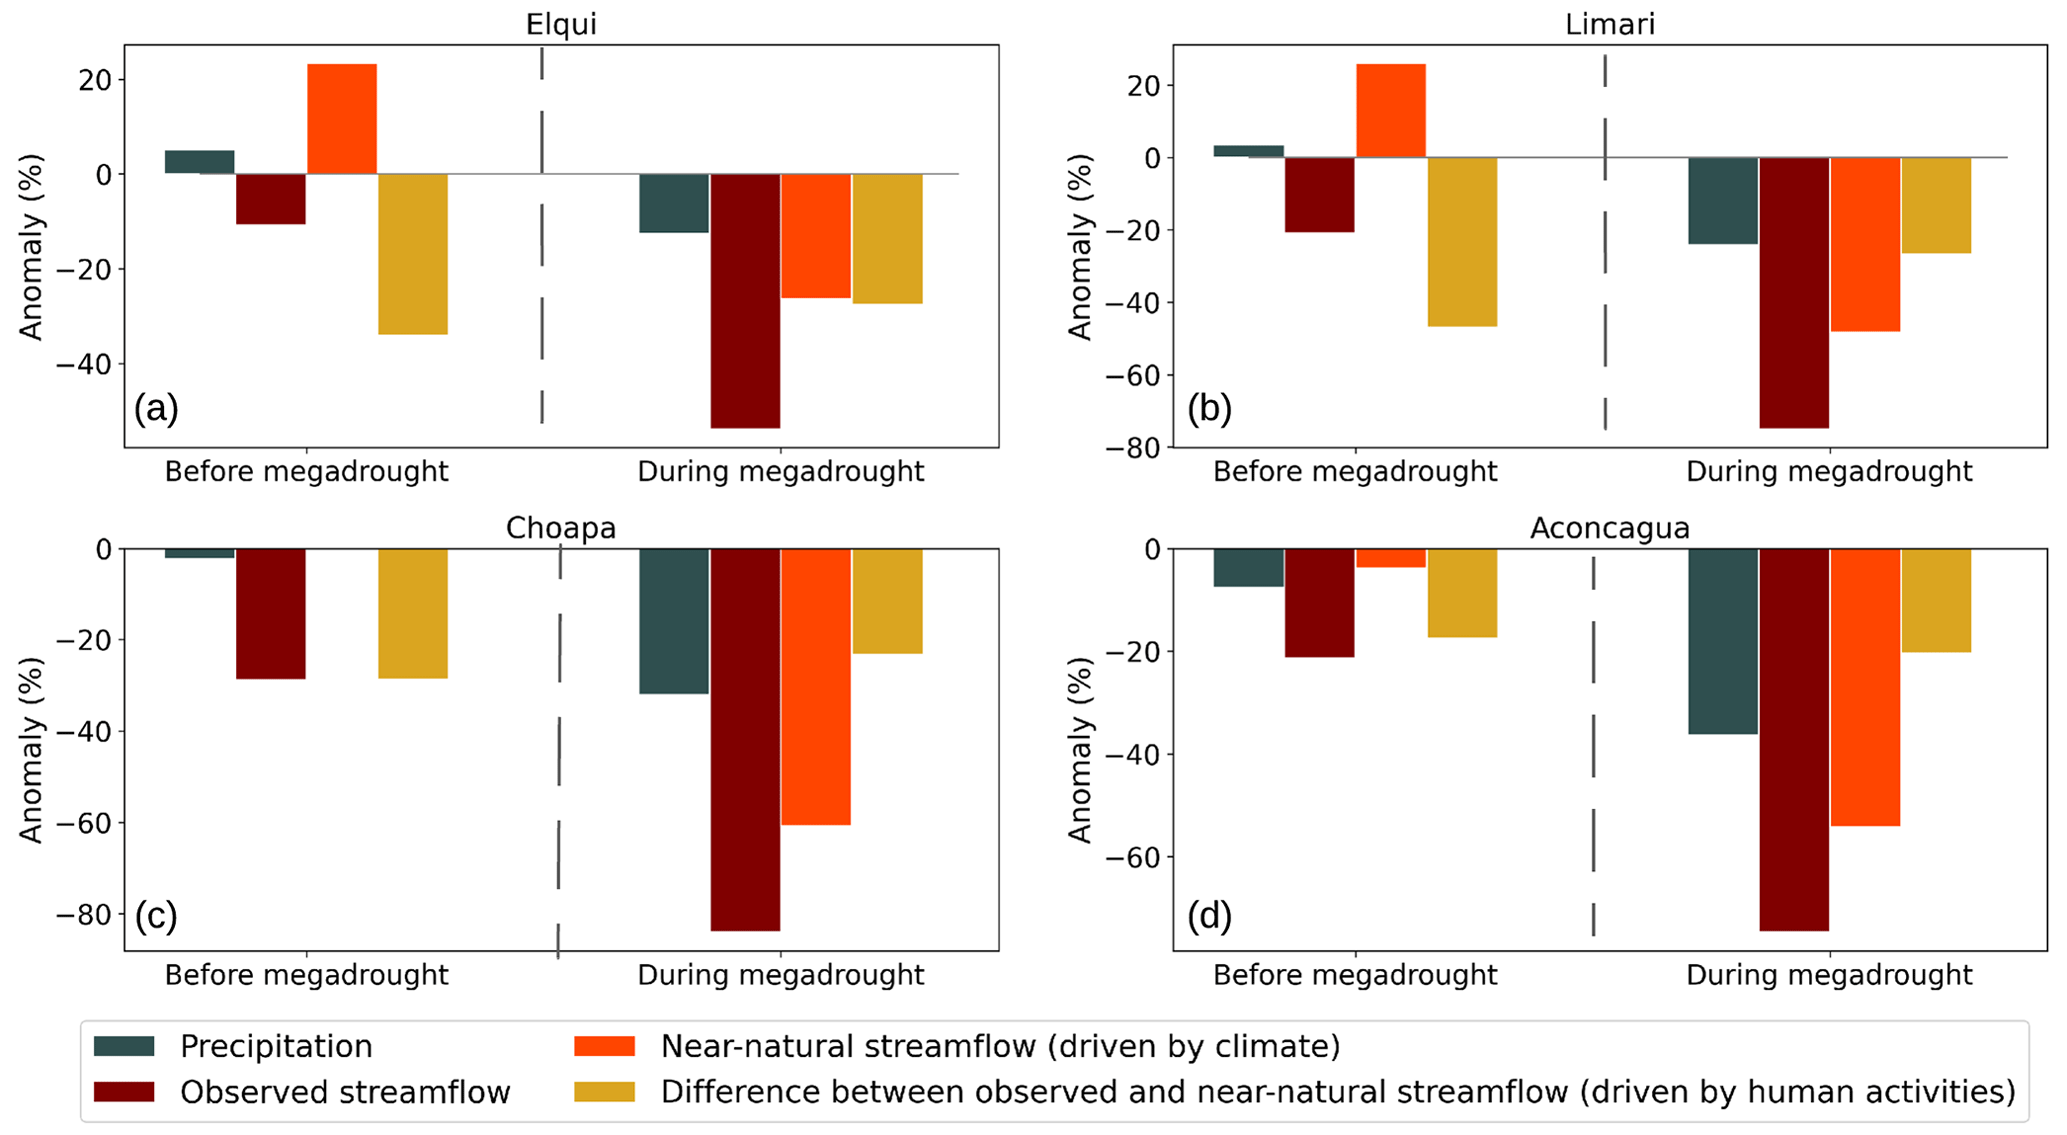
Figure 7Anomalies in annual precipitation, observed and near-natural summer streamflow, and the difference between the latter two, which represent the human-induced streamflow anomaly for the Elqui (a), Limarí (b), Choapa (c), and Aconcagua (d) basins. The anomalies are presented for the evaluation period before and after the megadrought onset (1988–2009 and 2010–2020, respectively). For each flux, the anomalies are computed as the percentage difference with respect to their mean values during the reference period (1960–1988).
Before the megadrought onset, annual precipitation varied between 5 % and −7.6 % with respect to the reference period among the study basins. The near-natural summer streamflow during that period followed the direction of the annual precipitation anomalies, with anomalies between 23 % and −4 % across basins. During that period, the observed summer streamflow – accounting for full climatic and human influence – decreased by 10 %–28 %. This indicates that water uses for human activities were the main driving factor of summer streamflow reduction before the megadrought onset, causing up to 100 % reduction in the Elqui, Limarí and Choapa basins and 82 % in the Aconcagua basin.
After the megadrought onset, the relative impact of precipitation deficits and human activities on streamflow depletion changed. The annual precipitation anomalies during the megadrought varied between −13 % and −36 % across basins, while the near-natural streamflow estimates presented anomalies between −26 % and −61 %. During this period, the observed summer streamflow featured anomalies of −54 % to −84 %. This indicates that precipitation deficits dominate the streamflow reductions; however, there is still a relevant reduction attributed to human activities, representing 51 %, 29 %, 27 %, and 27 % of the total summer streamflow reduction in the Elqui, Limarí, Choapa, and Aconcagua basins, respectively.
Particularly noteworthy is the Aconcagua basin case, where, in absolute terms, the human-induced summer streamflow reduction during the megadrought (corresponding to an absolute value of 39.47 mm) was higher than during the period before the megadrought (33.78 mm). This has happened despite the significantly lower water availability during the megadrought, where near-natural summer streamflow was 88.61 mm, which corresponds to less than half of the near-natural summer flow before the megadrought onset (185.73 mm). This apparent contradiction may be attributed to Aconcagua's increased total water consumption during the megadrought, led by intensified agricultural water demand (Fig. 5a).
Consistently with the summer seasons, near-natural annual streamflow before the megadrought followed precipitation patterns, with anomalies between 22 % and −5 % across basins (Fig. A1). During that period, the observed annual streamflow varied between −2 % and −20 % across basins. Water uses for human activities were the driver factor of streamflow reduction before the megadrought onset, causing up to 100 % of reduction in the Elqui, Limarí, and Choapa basins and 71 % in the Aconcagua basin. After the megadrought onset, the observed streamflow featured anomalies of −47 to −71 %. From these streamflow deficits, a 44 % to 75 % of the reduction is attributed to climatic factors (i.e. anomalies represented by the near-natural simulated streamflow), while the remaining 25 % to 56 % is attributed to human activities.
3.4 The impacts of human activities on hydrological drought events
The selected hydrological drought events for each basin are shown in Fig. 8. By contrasting the observed and near-natural time series, the climate-induced and human-induced droughts are distinguished. The meteorological megadrought (2010—020) is associated with several hydrological drought events, as evidenced by the observed streamflow time series. However, the megadrought does not seem to have such a persistent and intense effect on the near-natural streamflow.
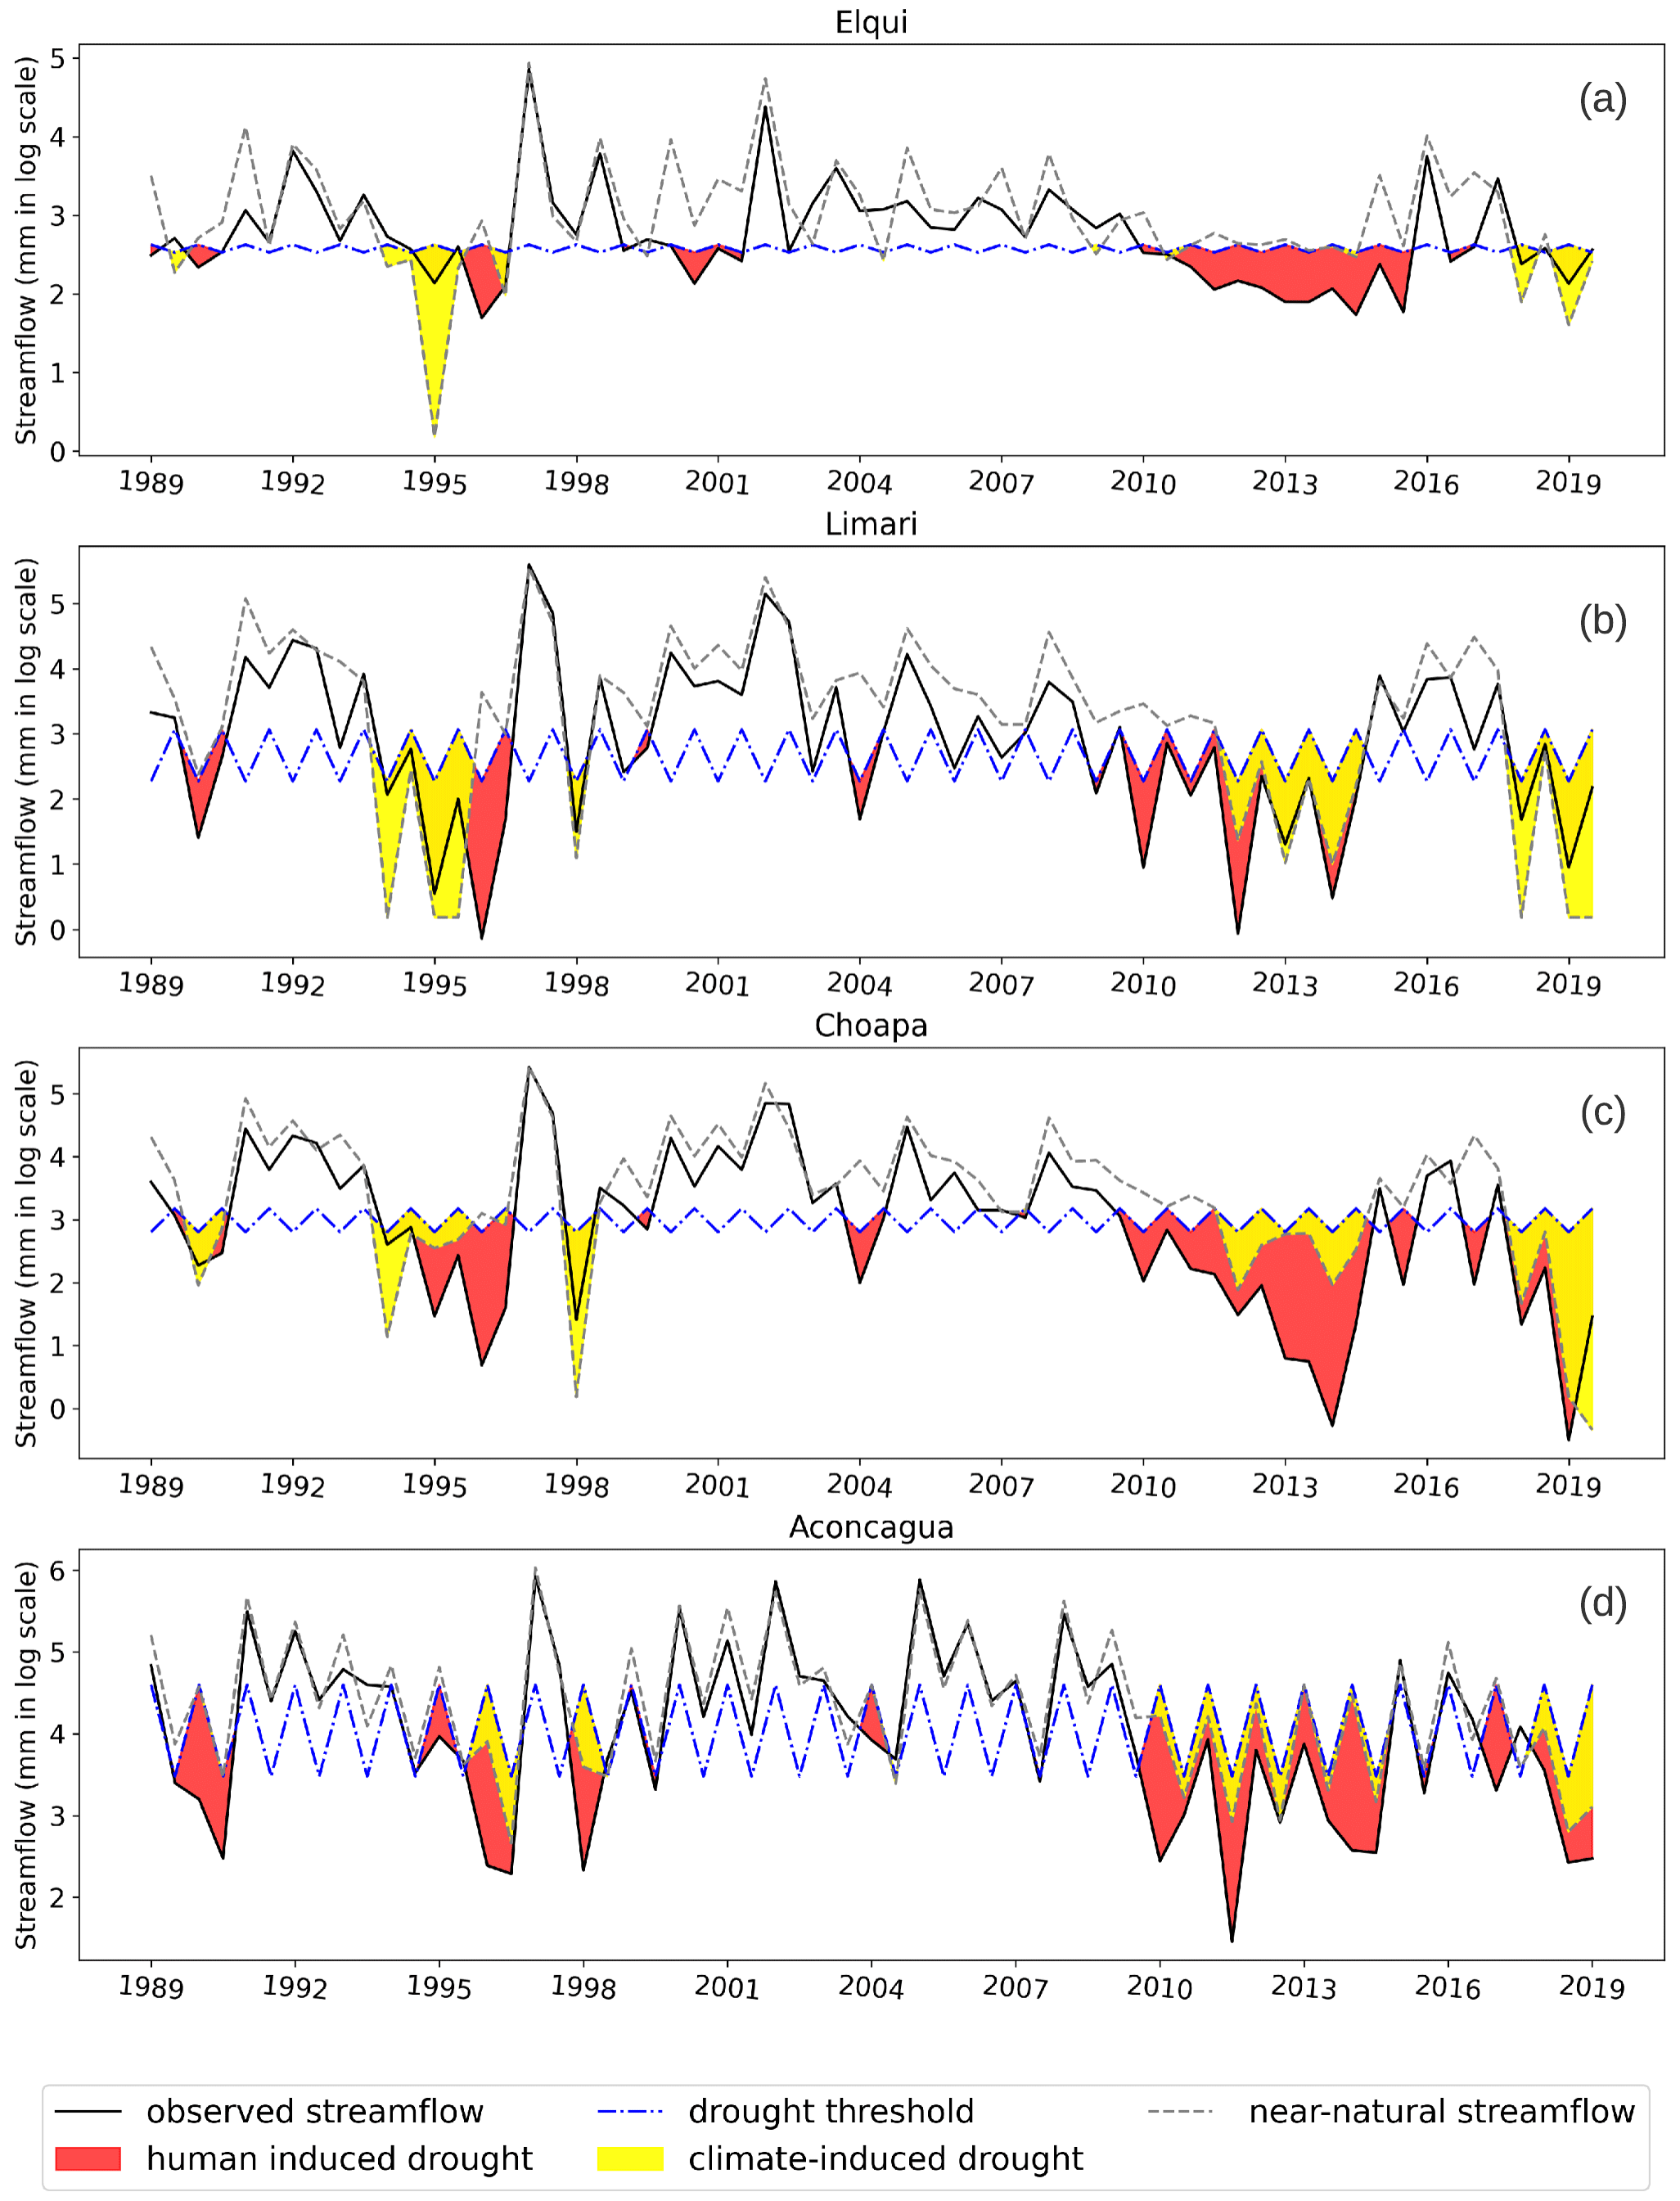
Figure 8Observed and near-natural streamflow and hydrological drought events during the evaluation period (1988–2020) for Elqui (a), Limarí (b), Choapa (c), and Aconcagua (d) basins, respectively.
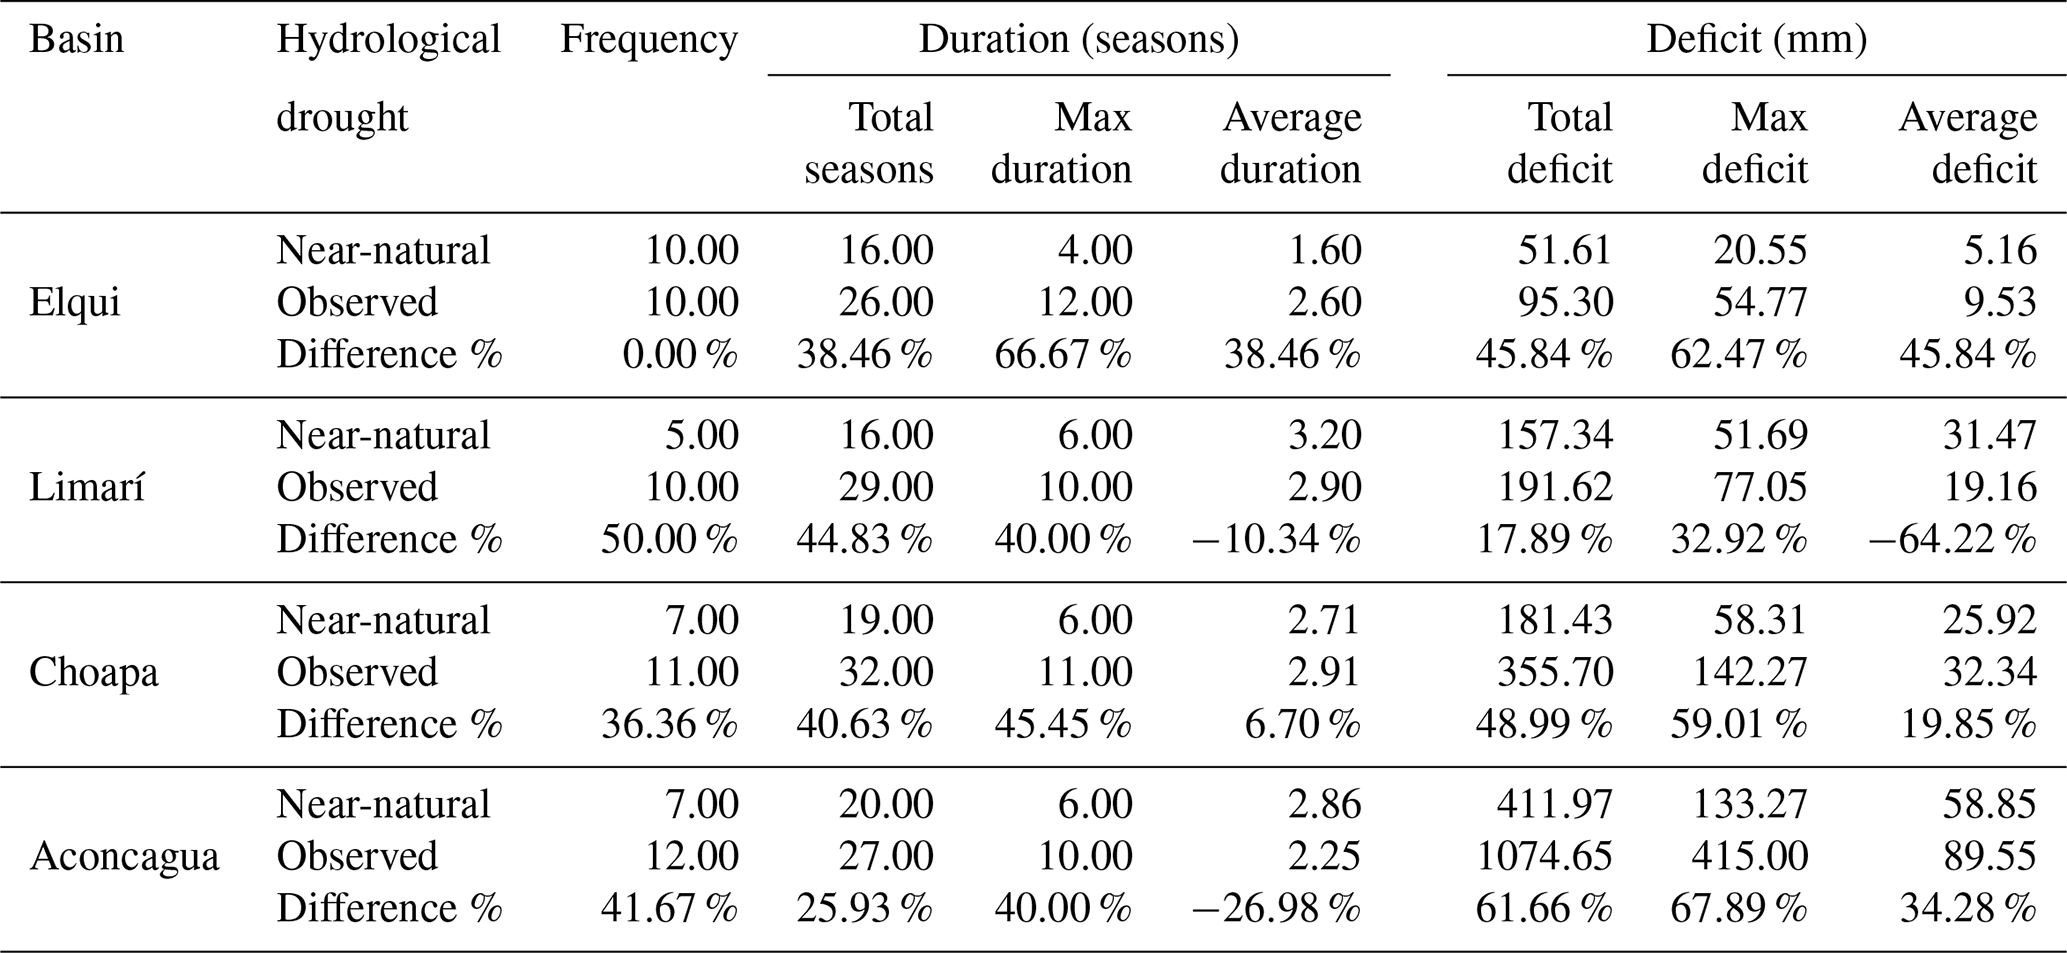
The human impact on hydrological droughts (computed as the difference between observed and near-natural streamflow drought events) is evident in the duration and intensity of drought events (Table 3). Elqui, Limarí, Choapa, and Aconcagua have 10, 13, 13, and 7 extra seasons in drought duration, respectively, and close to double of streamflow deficits. In general, more drought events (Limarí, Choapa, and Aconcagua) with a larger average time duration (Elqui and Choapa) and average deficit (Elqui, Choapa, and Aconcagua) have occurred in the observed scenario compared to the near-natural scenario. The largest drought event in each basin occurred during the megadrought. Across all basins, the human activities led to an increase in the maximum duration of hydrological droughts, with maximum values ranging between 10 and 12 seasons, in contrast to the 4 to 6 seasons experienced in the near-natural cases. In particular, this translates to 5 or 6 years of continuous streamflow below the Q70 threshold during the megadrought. The human influence over hydrological drought varies between the different drought characteristics, but in most cases it causes drought intensification, leading to an increase of 25.93 % to 44.83 % of the total drought events and an increase of 17.89 % to 61.66 % of the total streamflow deficit. The negative percentage difference in mean duration or mean deficit reported for Limarí and Aconcagua basins is due to a greater number of shorter events. However, considering that the total number of events is larger in the observed scenario, this is not indicative of an alleviation of the drought.
Table 3Drought characteristics for each basin considering the observed and simulated near-natural streamflow during the evaluation period (1988–2020). The third row for each basin represents the human influence on drought characteristics as the percentage difference between the observed and the naturalized scenario.
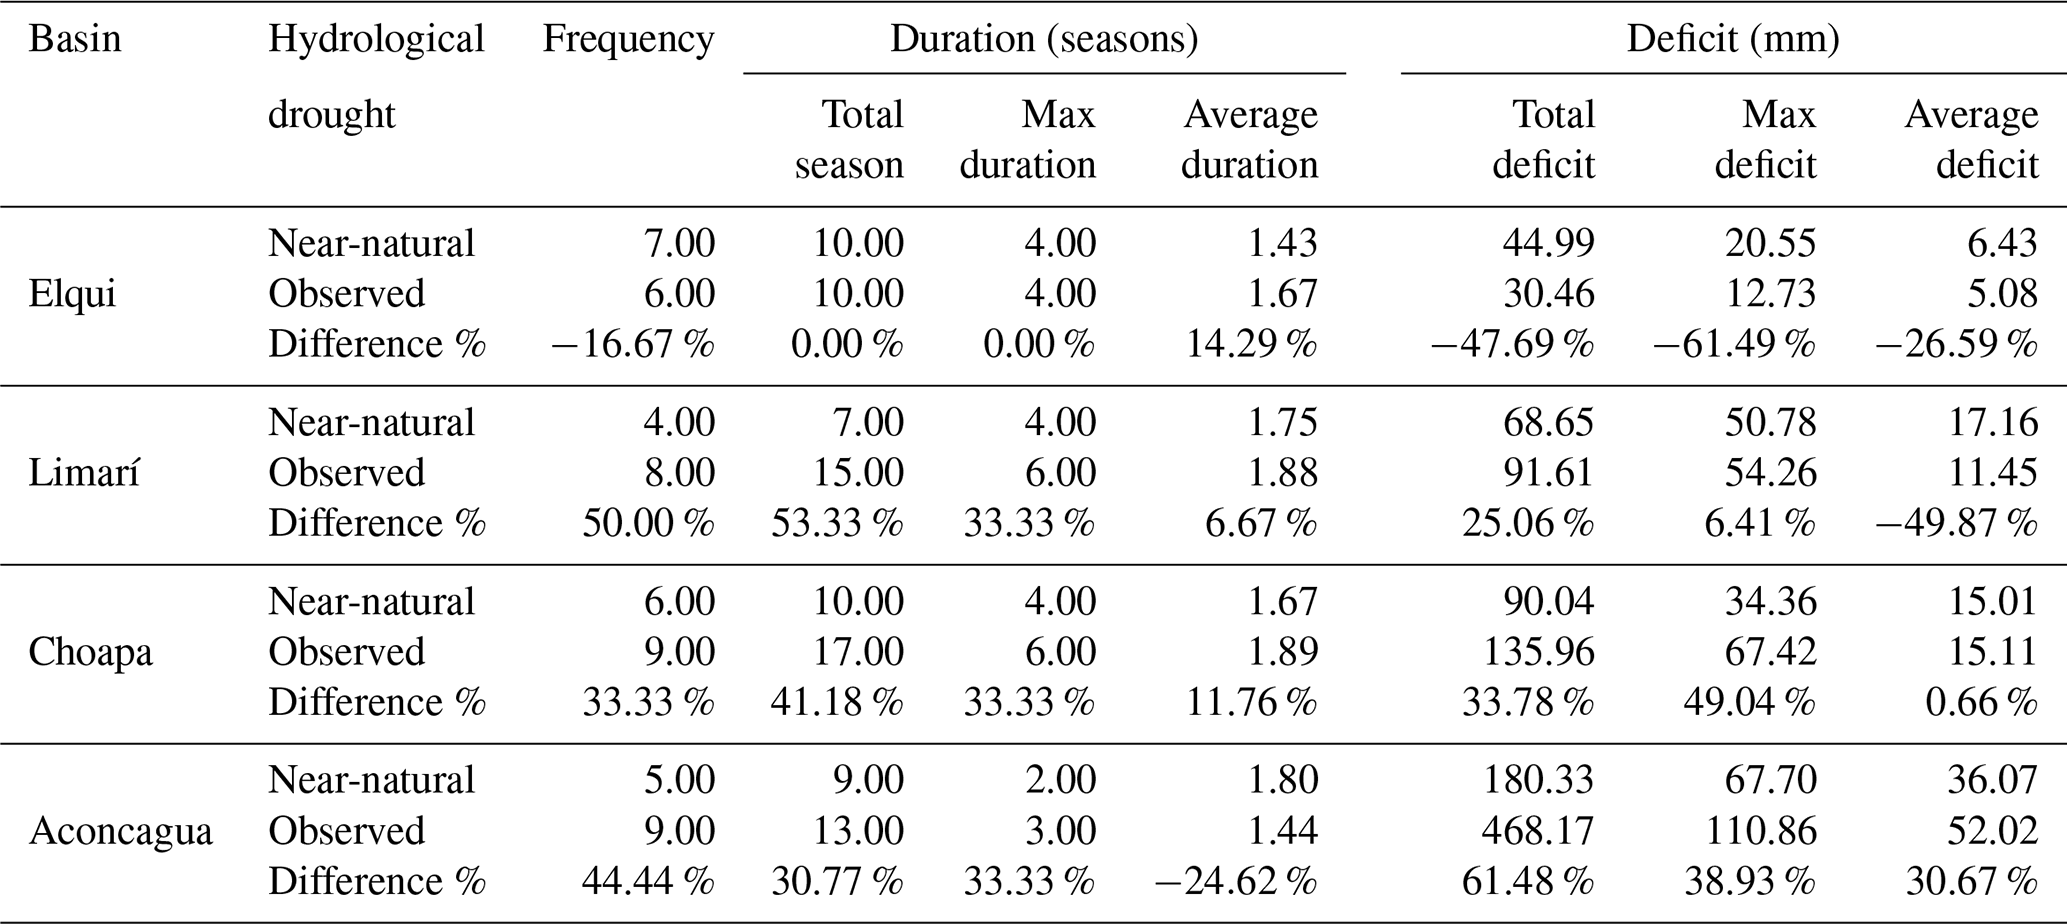
When analysing drought characteristics separately before and during the megadrought (Appendix C), Elqui exhibits a low human impact before the megadrought onset, and it notably increases during the megadrought, contributing to 57.14 % of total drought events and 70.82 % of the observed deficit. In contrast, Limarí, Choapa, and Aconcagua show a more stable human contribution to drought characteristics before and during the megadrought, with a decrease of human contribution to total events close to 25 % (all basins), a decrease in human contribution to total deficit (Limarí basin), and a slight increase contribution to total deficit during the megadrought (Choapa basin).
4.1 Impact of increased human activities on water availability
During the megadrought, precipitation deficits have played a more significant role in the decrease in annual streamflow than anthropic factors; however, human activities still account for approximately 27 % to 29 % of the streamflow reduction in the Aconcagua, Choapa, and Limarí basins and 51 % in Elqui, which is the basin least affected by the meteorological megadrought.
Human activities have intensified since the 1980s, driven by rising water demand from economic activities, population growth, and land use changes (Fig. 5a), despite the precipitation deficits and streamflow reduction during the megadrought. In general, the basins with the greatest increases in total water consumption during the evaluation period also exhibit higher human influence in the reduction of streamflow. Elqui and Limarí exhibited the most significant relative increase in total water consumption, primarily driven by a substantial rise in agricultural consumption from 1989 to 2010, while Choapa almost duplicated its total water consumption during the 2000–2010 decade due to mining operations. It is noteworthy that agriculture and mining water consumption continued to rise during the megadrought.
This suggests that total water consumption from surface and groundwater sources has been somehow inelastic to the surface water deficits. In the Aconcagua basin, the human-induced streamflow reduction expressed as millimetres (mm) increased during the megadrought, while in the other three basins it was slightly smaller compared to the period prior to the megadrought (Fig. 7). This finding can be explained by an initial reduction in agricultural water consumption during the first years of the megadrought, which was later reversed (Fig. 5a) by higher extractions of groundwater sources in the subsequent years (Taucare et al., 2020; Duran-Llacer et al., 2020).
Groundwater sources play a crucial role in streamflow within this study region, and the declines of groundwater levels caused by meteorological droughts and water extractions have critical impacts on water accessibility in rural areas (Crespo et al., 2020; Taucare et al., 2020; Alvarez-Garreton et al., 2021, 2023, 2024). These declines can also lead to the disconnection between surface and underground water sources, leading to a decrease in soil moisture conditions (agricultural drought) and the desiccation of rivers and lakes (Duran-Llacer et al., 2020; Muñoz et al., 2020). This exacerbates hydrological drought, delaying the recovery of catchments from drought episodes. Also, irrigation water extraction shifts from surface to groundwater sources, intended to alleviate megadrought impacts, also promotes the inelastic behaviour of water consumption rates. In fact, new surface and underground water use rights have been granted during the megadrought (Barría et al., 2021b). This has led to increases in water stress levels and reduction of groundwater reservoirs, which could ultimately lead to an absolute “Day Zero” (Alvarez-Garreton et al., 2024).
Despite a general decrease in the impact of human influence on streamflow reductions between the pre-megadrought and megadrought periods, the Limarí, Choapa, and Aconcagua basins show a relatively stable human contribution to drought characteristics before and during the megadrought, while the Elqui basin experiences a notable increase in human contribution. These observations highlight two key insights. First, they suggest that human activities have a greater influence on drought conditions and characteristics than the solely relative impact of human activities on total streamflow reductions. In the context of meteorological drought, increased and inelastic human water demand exacerbates streamflow reductions, causing them to exceed hydrological drought thresholds in terms of both magnitude and frequency. Second, the increase in human contribution to drought characteristics in the Elqui basin leads it to similar patterns of hydrological drought conditions than the other basins, despite having lower precipitation deficits. This suggests that the role of human water demands is particularly relevant in semi-arid basins with limited precipitation and high interannual variability in terms of precipitation regime, such as Elqui. Consequently, highly intervened basins in semi-arid regions are more susceptible to experiencing severe hydrological droughts during periods of precipitation deficits. These findings align with the observations of Huang et al. (2016), who highlighted that sustainable agricultural development is threatened in arid and semi-arid regions due to limited available water resources, and with Saft et al. (2016), who demonstrated that aridity is a crucial factor influencing streamflow sensitivity to interdecadal climate variability.
4.2 Drought vulnerability
Hydrological drought vulnerability is associated with those conditions that cause an increase in the frequency, duration, and intensity of the hydrological droughts when a precipitation deficit threat is faced. Vulnerability should be addressed by looking for sensitivity variables that come from the basin's biophysical characteristics, such as aridity, location, geomorphology, hydrological regime, natural land cover, and snow and glacier cover (Saft et al., 2015; Van Loon and Laaha, 2015), and human activities, such as management and extraction of water, land use, land cover changes, and urbanization, among others (Barría et al., 2021a; Van Loon et al., 2016, 2022).
As discussed in Sect. 4.1, human activities have intensified streamflow deficits during the megadrought. Human activities that affect catchment vulnerability in central Chile include groundwater extractions (Taucare et al., 2020), overallocation of water use rights (Alvarez-Garreton et al., 2021; Barría et al., 2021a), and continuous land use change for agricultural purposes (Madariaga et al., 2021). For example, agriculture is sometimes established on hillsides with high slopes, exacerbating water consumption problems and changing runoff mechanisms. In the entire Aconcagua basin, the water consumption of avocado plantations has increased 15 % between 2014 and 2020, reaching almost 4.8 m3 s−1, while citrus plantations have increased 67 %–70 % in the Elqui and Limarí basins since 2010, reaching 1.8 m3 s−1 of water consumption in the Limarí basin. This reveals that irrigated agriculture has been inelastic to the precipitation deficits during the megadrought. Human activities in these basins are adapting to less water availability in ways that are leading to aggravated water scarcity problems, which is considered in the literature as maladaptation (Schipper, 2020).
Precipitation deficits and human activities including human-induced maladaptation processes have broad, complex, and exacerbated impacts on society and ecosystems. For example, agricultural practices may worsen water scarcity problems and contribute to soil erosion and sediment transport (Owens, 2020), further degrading ecosystem health. The intensified streamflow deficits have disrupted watercourses and contribute to tree mortality (Miranda et al., 2020). Additionally, thousands of people have lost access to domestic water services (Muñoz et al., 2020), leading to a large spending on water cistern trucks (Alvarez-Garreton et al., 2023). These impacts reveal that there is still a gap in understanding how human activities contribute to catchment vulnerability to hydrological droughts and how their influence on the hydrological cycle can be effectively included in drought management (Van Loon et al., 2016). In the case of Chile, previous studies have shown that the current water management policy inadequately addresses the physical constraints of surface and groundwater availability, contributing to an inadequate prevention of water stress conditions (Alvarez-Garreton et al., 2023). This calls for urgent modifications in the water management system to ensure sustainable water use and prevent the exacerbation of water stress conditions in the region.
4.3 Study limitations
Our approach and insights are based on attribution exercises that compare the observed streamflow and a naturalized simulation of it, which permits us to isolate the effect of human activities. In this study, the near-natural simulation was done by using regression statistical methods, which have limitations that should be considered: they do not explicitly account for the physical mechanisms of runoff generation, they rely solely on precipitation as a predictor, and they consider a linear relationship between the variables. Although the attribution exercise is still consistent, this methodological limitation prevents us from drawing conclusions regarding the physical mechanisms involved in streamflow reduction during droughts. To enable a physical interpretation – and likely a better representation of streamflow generation and memory effects – future studies should advance into implementing physically based models to perform the attribution exercises.
Independently of the adopted model, the streamflow estimations have uncertainties that can mask some of the human influence effects in the attribution exercise. In order to visualize this potential artefact, Fig. 6 shows the streamflow estimations with a 95 % confidence interval. These plots, in general, show that the lowest values of naturalized streamflow are above the observed time series. Anyway, considering the lower performance of the winter models in some catchments and that the summer season concentrates most human intervention due to agricultural activities, we have primarily focused on exploring the results of this season (Fig. 7).
Considering the evidence of potential climate-driven non-stationarities on streamflow generation during the megadrought in Chilean catchments (Alvarez-Garreton et al., 2021), the attribution of human activities as the driving factor of the intensified streamflow reduction should then interpreted carefully. The intensification in streamflow reduction is attributed to the combination of human activities, natural hydrological processes, and the potential effects of non-stationarity catchment response. Since the upper-catchment sections have a lower human influence (but still influenced) than the downstream sections, the larger streamflow decrease during the megadrought (compared to the previous period) in these sections may be mostly (but not fully) attributed to non-stationarity in basin response during protracted droughts (consistent with Saft et al., 2015; Alvarez-Garreton et al., 2021). However, the downstream sections feature an even larger streamflow reduction during the megadrought compared to the reduction in the upper sections (Table 2). This is consistent with the added effect of human activities on streamflow reduction, which have maintained water consumption despite the reduced water availability (Fig. 5).
The megadrought in central Chile has been the longest dry period over the last centuries. The study basins featured a range of 16 % to 41 % in mean annual precipitation deficits during this period, whereas the deficits in observed streamflow were significantly larger. The Elqui, Limarí, Choapa, and Aconcagua basins experienced deficits in summer streamflow of 54 %, 75 %, 84 %, and 75 %, respectively.
Our findings indicate that human activities were the main driving factor of streamflow reduction before the megadrought onset. During the megadrought, human activities still accounted for a significant portion of streamflow reduction, ranging from 27 % to 51 %. The impact of human activities on hydrological drought characteristics was substantial, leading to more than double the recurrence, duration, and intensity of droughts in some basins.
Human activities in these basins have shown limited adaptation to the decrease in water availability. The increase in human water demand, often inelastic to the decreased surface water availability, makes basins more vulnerable to severe hydrological droughts when precipitation deficits are faced, especially on semi-arid basins with water availability constraints.
This paper demonstrates that, during long and persistent dry periods, human activities in basins in central Chile have intensified drought propagation by increasing both the intensity and the duration of hydrological droughts. This highlights the importance of understanding the impacts of human activities on drought propagation and considering such evidence in water management policies. In particular, to prevent implementing maladaptive measures, the feedback loop between water usage, human activities, and the hydrological system should be considered in the adaptation strategies. These considerations are particularly important not only in Chile but also in other regions worldwide, where the dry signal is consistent and expected to persist.
This appendix presents the outcomes of a comprehensive evaluation of various regression models, considering the seasonal runoff as a dependent variable. The objective was to identify the key climate factors influencing the streamflow response in the studied basins. Variables such as precipitation in different seasons, evapotranspiration, temperature, and the interaction between temperature and precipitation were used. Additionally, a model incorporating a Box–Cox transformation of the dependent variable (runoff) was examined to achieve a normal distribution in the variable.
After rigorous testing, it is noteworthy that the majority of the models demonstrated a singular dependency on precipitation (P). We chose the model with a higher r2, and all variables were statistically significant at a p value of 0.05. In summer (Table A1), this condition is achieved with model 1 (Eq. 2 of Sect. 2.3.2), where the summer runoff is modelled based on the winter precipitations. In winter (Table A2), the condition is achieved in model 2 (Eq. 3 of Sect. 2.3.2), where the runoff depends on the winter precipitation of the present year (t) and the annual precipitation of the previous year (t−1).
Table A1Results of multiple regression equations tested for representing near-natural streamflow during the reference period in the summer season.
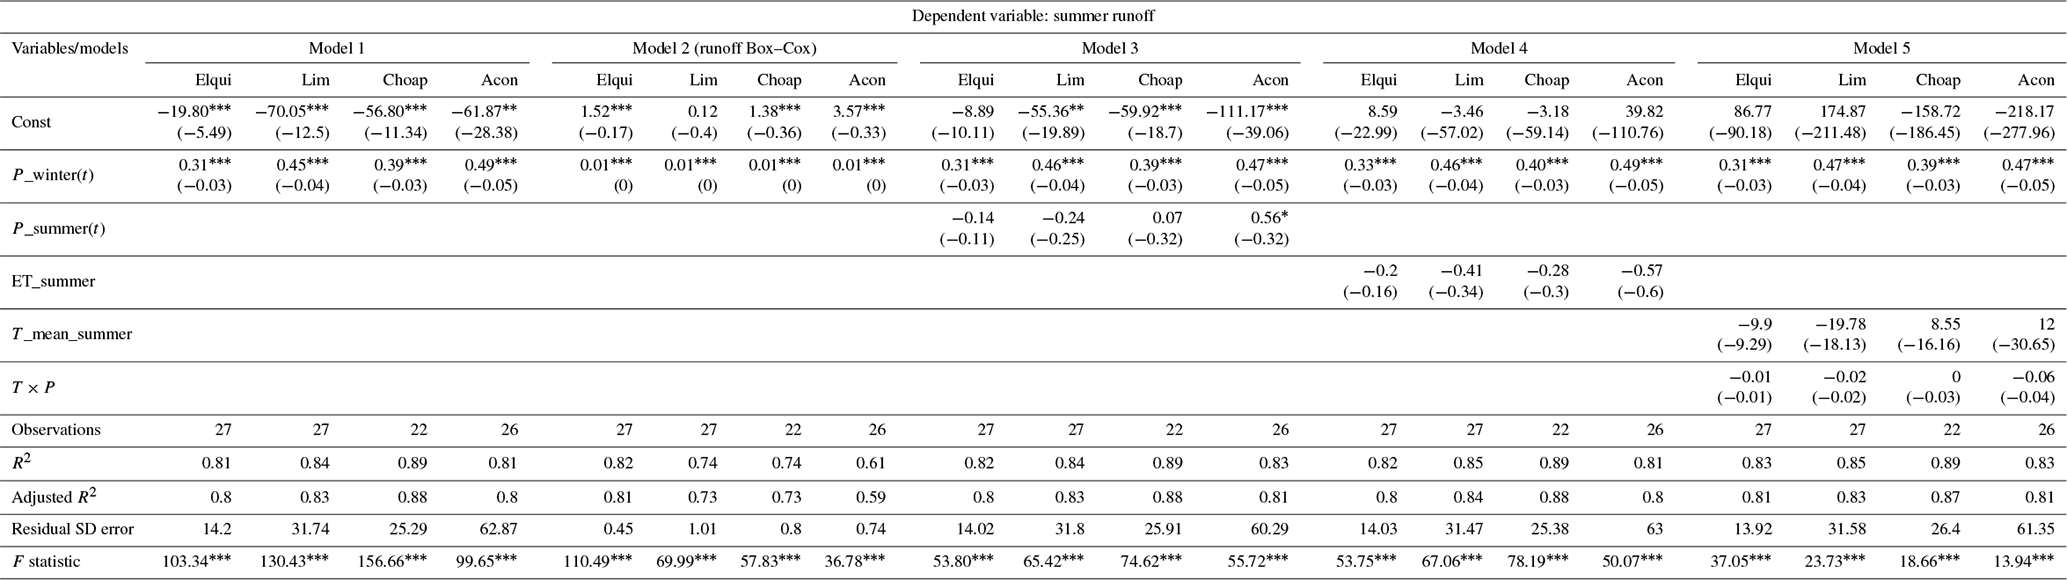
Note: * represents p<0.1; represents p<0.05; represents p<0.01; standard deviation (SD) is given in round brackets.
Table A2Results of multiple regression equations tested for representing near-natural streamflow during the reference period in the winter season.
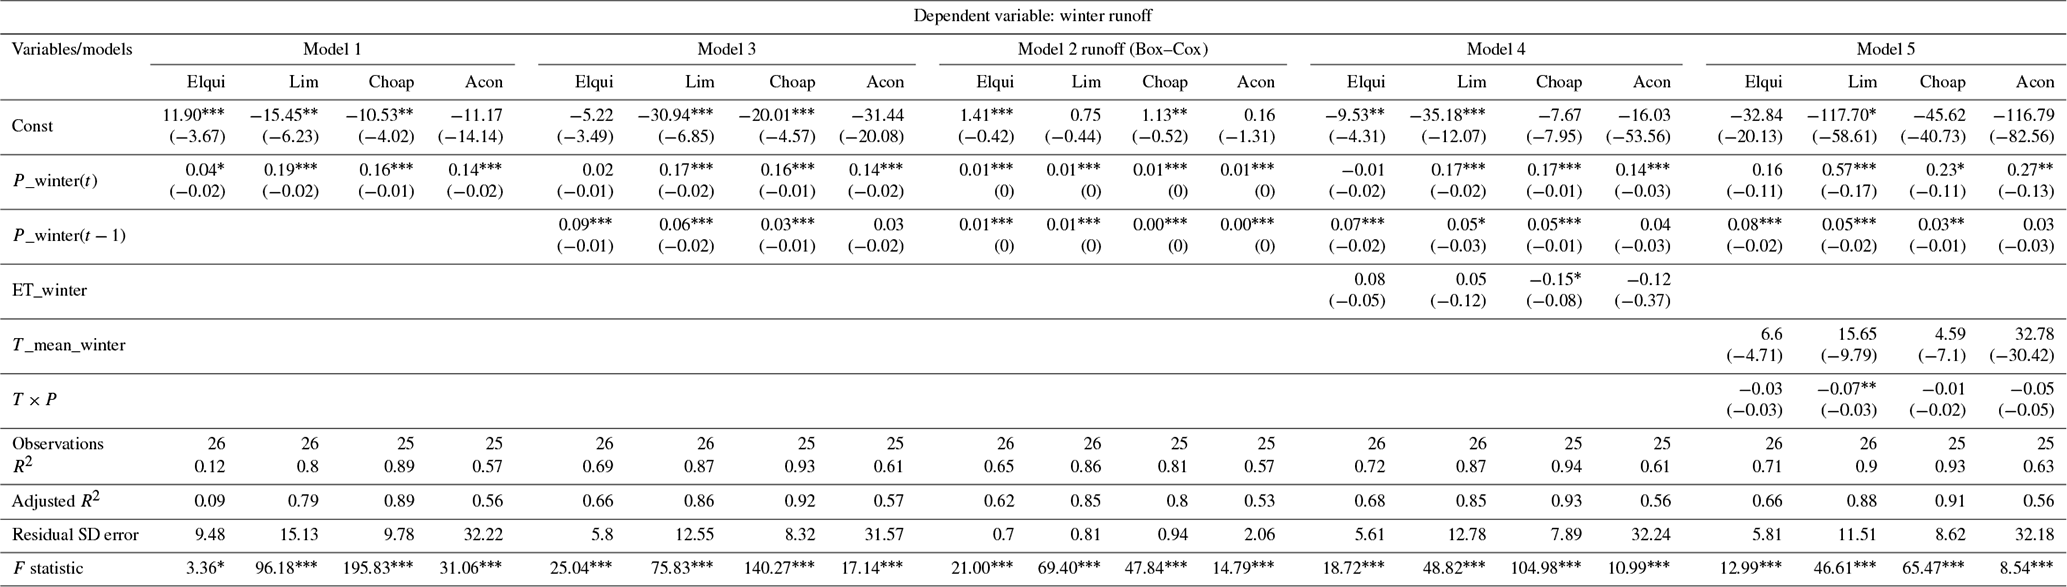
Note: * represents p<0.1; represents p<0.05; represents p<0.01; standard deviation (SD) is given in round brackets.
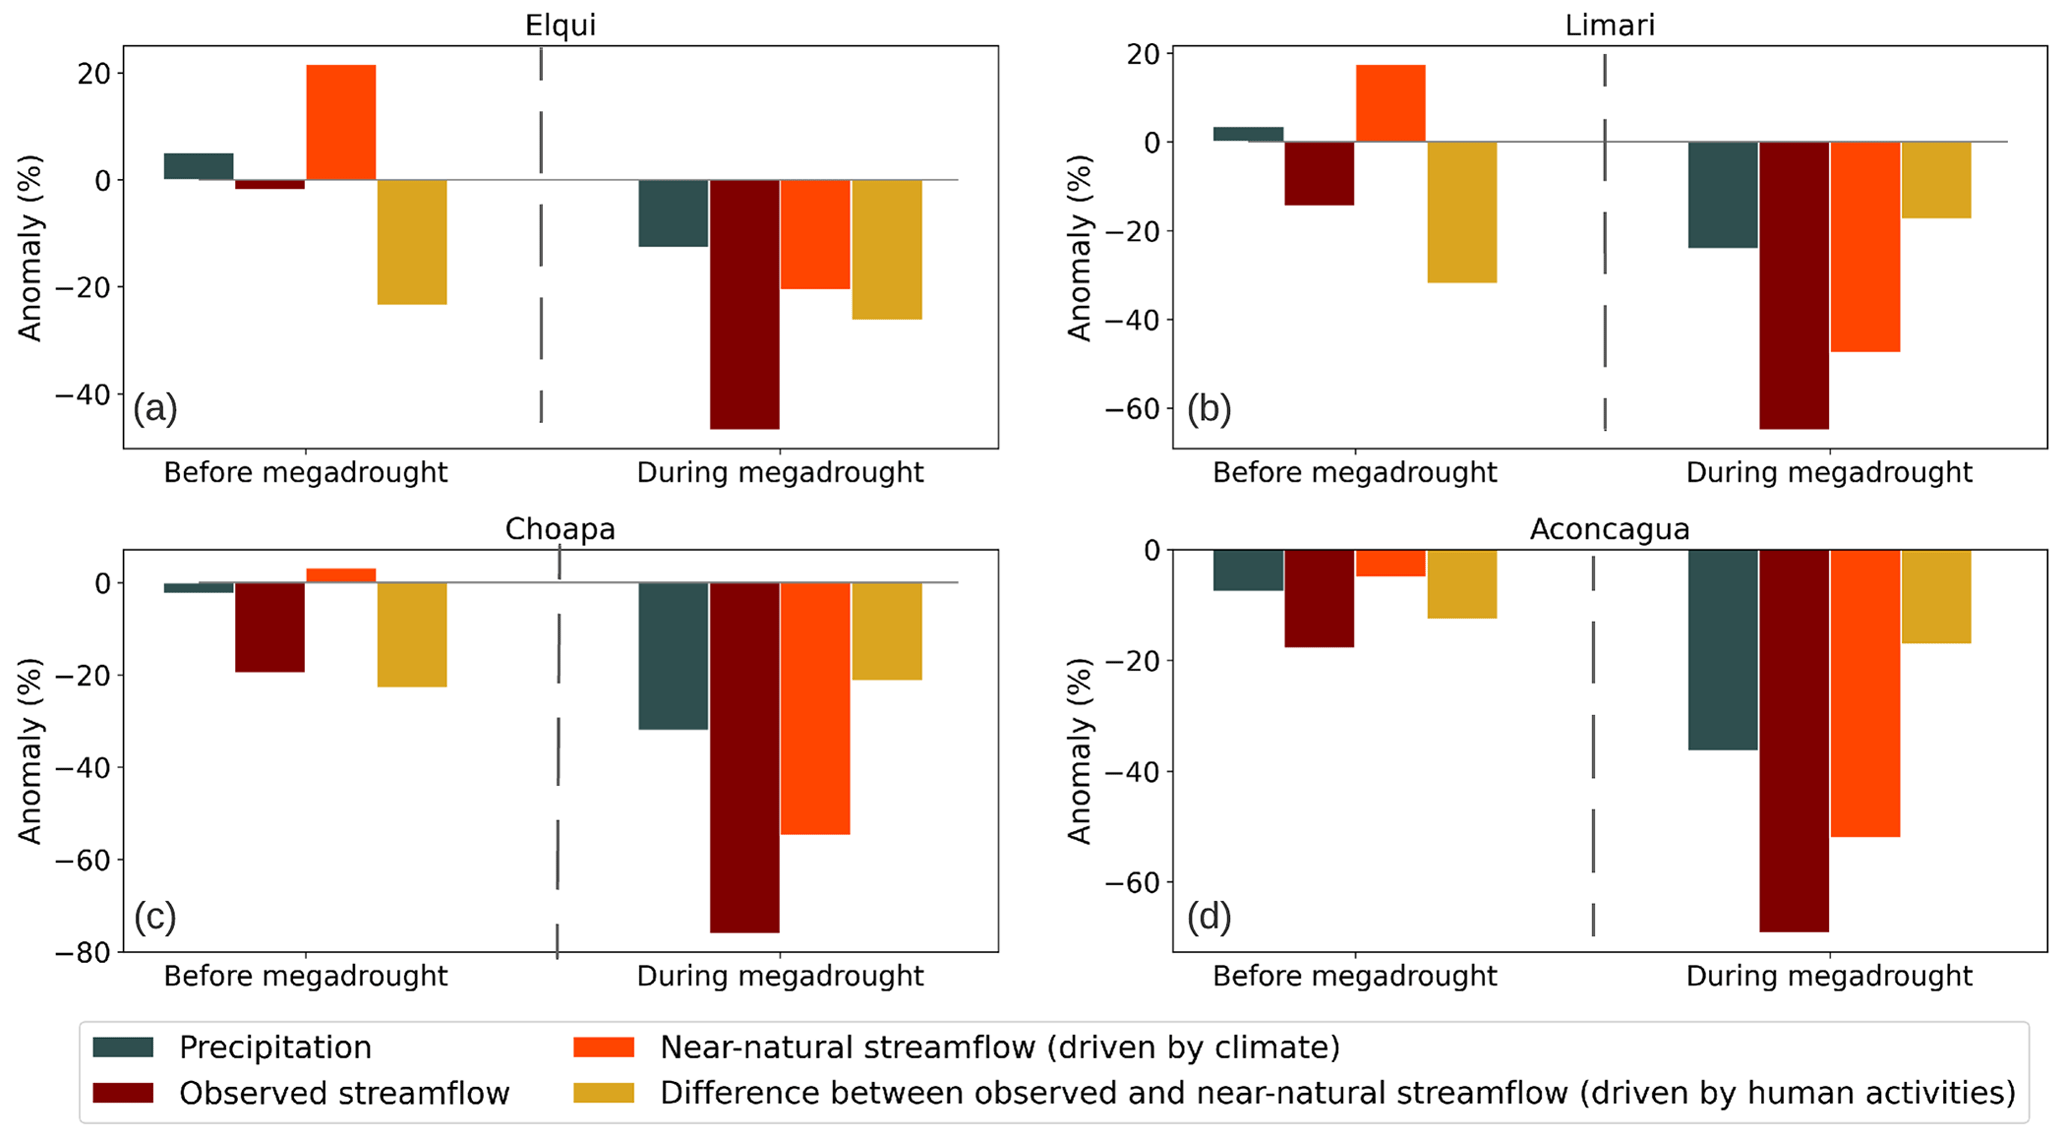
Figure B1Anomalies in annual precipitation, observed streamflow, simulated near-natural streamflow, and human-induced streamflow change. The anomalies are presented for the evaluation period before and after the megadrought onset (1988–2009 and 2010–2020, respectively). For each flux, the anomalies are computed as the percentage difference with respect to their mean values during the low-influence reference period (1960–1988). The graphs show these results for the Elqui (a), Limarí (b), Choapa (c), and Aconcagua (d) basins, respectively.
Table C1Drought characteristics for each basin considering the observed and simulated near-natural streamflow during the megadrought period (2010–2020). The third row for each basin represents the human influence on drought characteristics as the percentage difference between the observed and the naturalized scenario.
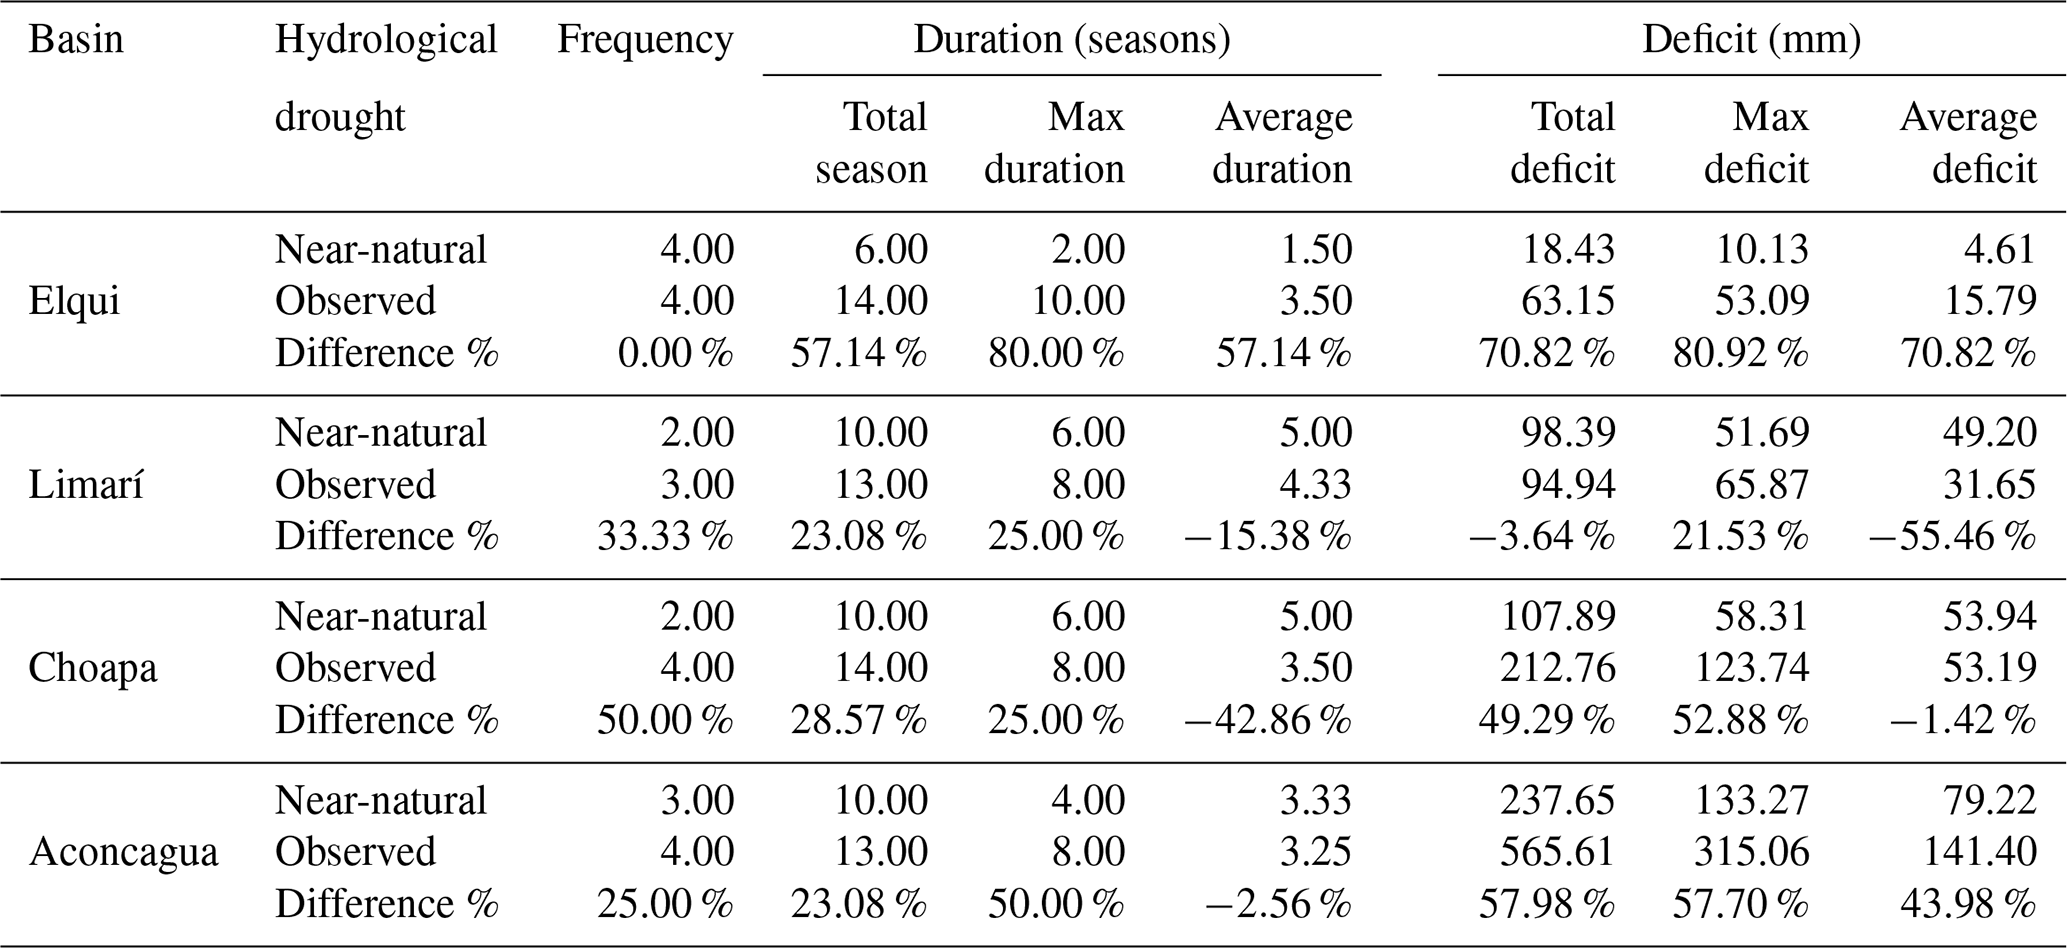
Table C2Drought characteristics for each basin considering the observed and simulated near-natural streamflow before the mega drought period (1988–2010). The third row for each basin represents the human influence on drought characteristics as the percentage difference between the observed and the naturalized scenario.
The CR2MET dataset was obtained from the Center for Climate and Resilience Research website at https://doi.org/10.5281/zenodo.7529682 (Boisier, 2023). The water use data can be obtained upon request to the Center for Climate and Resilience Research website at https://seguridadhidrica.cr2.cl (Alvarez-Garreton et al., 2023). The streamflow data were obtained from the CAMELS-CL dataset (Alvarez-Garreton et al., 2018), available at the Center for Climate and Resilience Research website at https://camels.cr2.cl (Alvarez-Garreton, 2018).
NA, CAG, and AM conceived the idea of the research. NA performed the analyses. NA and CAG wrote much of the manuscript. All the authors reviewed early manuscript drafts and the final draft.
The contact author has declared that none of the authors has any competing interests.
Publisher's note: Copernicus Publications remains neutral with regard to jurisdictional claims made in the text, published maps, institutional affiliations, or any other geographical representation in this paper. While Copernicus Publications makes every effort to include appropriate place names, the final responsibility lies with the authors.
This article is part of the special issue “Drought, society, and ecosystems (NHESS/BG/GC/HESS inter-journal SI)”. It is not associated with a conference.
This research has been developed within the framework of the Center for Climate and Resilience Research (CR2, ANID/FONDAP/1522A0001) and the research projects ANID/FSEQ210001, ANID/FONDECYT/1201714, ANID/FONDECYT/11240924, and ANID/FORTALECIMIENTO CENTROS REGIONALES/CERES/R23F0003.
This research has been supported by the Fondo Nacional de Desarrollo Científico y Tecnológico (grant no. 1201714), the Center for Climate and Resilience Research (CR2, ANID/FONDAP/1523A0002), and the research projects ANID/F-SEQ210001, ANID/FONDECYT/11240924, and ANID/FORTALECIMIENTO CENTROS REGIONALES/CERES/R23F0003.
This paper was edited by Gemma Coxon and reviewed by three anonymous referees.
Alvarez-Garreton, C.: CAMELS-CL explorer, CAMELS [data set], https://camels.cr2.cl (last access: 20 September 2023), 2018.
Alvarez-Garreton, C., Mendoza, P. A., Pablo Boisier, J., Addor, N., Galleguillos, M., Zambrano-Bigiarini, M., Lara, A., Puelma, C., Cortes, G., Garreaud, R., McPhee, J., and Ayala, A.: The CAMELS-CL dataset: Catchment attributes and meteorology for large sample studies-Chile dataset, Hydrol. Earth Syst. Sci., 22, 5817–5846, https://doi.org/10.5194/hess-22-5817-2018, 2018.
Alvarez-Garreton, C., Pablo Boisier, J., Garreaud, R., Seibert, J., and Vis, M.: Progressive water deficits during multiyear droughts in basins with long hydrological memory in Chile, Hydrol. Earth Syst. Sci., 25, 429–446, https://doi.org/10.5194/hess-25-429-2021, 2021.
Alvarez-Garreton, C., Boisier, J.P., Blanco, G., Billi, M., Nicolas-Artero, C., Maillet, A., Aldunce, P., Urrutia-Jalabert, R., Zambrano-Bigiarini, M., Guevara, G., Galleguillos, M., Muñoz, A., Christie, D., Marinao, R., and Garreaud, R.: Seguridad Hídrica en Chile: Caracterización y Perspectivas de Futuro, ANID/FONDAP/1522A0001, Centro de Ciencia del Clima y la Resiliencia CR2, 72 pp., https://www.cr2.cl/seguridadhidrica/ (last access: 1 April 2024), 2023.
Alvarez-Garreton, C., Boisier, J. P., Garreaud, R., González, J., Rondanelli, R., Gayó, E., and Zambrano-Bigiarini, M.: HESS Opinions: The unsustainable use of groundwater conceals a “Day Zero”, Hydrol. Earth Syst. Sci., 28, 1605–1616, https://doi.org/10.5194/hess-28-1605-2024, 2024.
Barría, P., Sandoval, I. B., Guzman, C., Chadwick, C., Alvarez-Garreton, C., Díaz-Vasconcellos, R., Ocampo-Melgar, A., and Fuster, R.: Water allocation under climate change: A diagnosis of the Chilean system, Elementa, 9, 1–20, https://doi.org/10.1525/elementa.2020.00131, 2021a.
Barría, P., Chadwick, C., Ocampo-Melgar, A., Galleguillos, M., Garreaud, R., Díaz-Vasconcellos, R., Poblete, D., Rubio-Álvarez, E., and Poblete-Caballero, D.: Water management or megadrought: what caused the Chilean Aculeo Lake drying?, Reg. Environ. Change, 21, 19, https://doi.org/10.1007/s10113-021-01750-w, 2021b.
Boisier, J. P.: CR2MET: A High-resolution Precipitation and Temperature Dataset for the Period 1960–2021 in Continental Chile, v2.5, Zenodo [data set], https://doi.org/10.5281/zenodo.7529682, 2023.
Boisier, J. P., Alvarez-Garreton, C., Cordero, R. R., Damiani, A., Gallardo, L., Garreaud, R. D., Lambert, F., Ramallo, C., Rojas, M., and Rondanelli, R.: Anthropogenic drying in central-southern Chile evidenced by long-term observations and climate model simulations, Elementa, 6, 74, https://doi.org/10.1525/elementa.328, 2018.
Bozkurt, D., Rojas, M., Boisier, J. P., and Valdivieso, J.: Climate change impacts on hydroclimatic regimes and extremes over Andean basins in central Chile, Hydrol. Earth Syst. Sci. Discuss. [preprint], https://doi.org/10.5194/hess-2016-690, 2017.
Budds, J.: La demanda, evaluación y asignación del agua en el contexto de escasez, Rev. Geogr. Norte Gd., 52, 167–184, 2012.
Buishand, T. A.: Some methods for testing the homogeneity of rainfall records, J. Hydrol., 58, 11–27, https://doi.org/10.1016/0022-1694(82)90066-X, 1982.
Crespo, S. A., Lavergne, C., Fernandoy, F., Muñoz, A. A., Cara, L., and Olfos-Vargas, S.: Where does the chilean aconcagua river come from? Use of natural tracers for water genesis characterization in glacial and periglacial environments, Water (Switzerland), 12, 2630, https://doi.org/10.3390/w12092630, 2020.
Duran-Llacer, I., Munizaga, J., Arumí, J. L., Ruybal, C., Aguayo, M., Sáez-Carrillo, K., Arriagada, L., and Rojas, O.: Lessons to be learned: Groundwater depletion in Chile's ligua and petorca watersheds through an interdisciplinary approach, Water, 12, 2446, https://doi.org/10.3390/w12092446, 2020.
Esri: “Topographic” [basemap], Scale Not Given, “World Topographic Map”, https://www.arcgis.com/home/item.html?id=7dc6cea0b1764a1f9af2e679f642f0f5 (last access: 24 October 2023), 2017.
Fleig, A. K., Tallaksen, L. M., Hisdal, H., Stahl, K., and Hannah, D. M.: Inter-comparison of weather and circulation type classifications for hydrological drought development, Phys. Chem. Earth, 35, 507–515, https://doi.org/10.1016/j.pce.2009.11.005, 2010.
Garreaud, R., Alvarez-Garreton, C., Barichivich, J., Pablo Boisier, J., Christie, D., Galleguillos, M., LeQuesne, C., McPhee, J., and Zambrano-Bigiarini, M.: The 2010–2015 megadrought in central Chile: Impacts on regional hydroclimate and vegetation, Hydrol. Earth Syst. Sci., 21, 6307–6327, https://doi.org/10.5194/hess-21-6307-2017, 2017.
Garreaud, R., Boisier, J. P., Rondanelli, R., Montecinos, A., Sepúlveda, H. H., and Veloso-Aguila, D.: The Central Chile Mega Drought (2010–2018): A climate dynamics perspective, Int. J. Climatol., 40, 421–439, https://doi.org/10.1002/joc.621, 2020.
González-Reyes, Á., McPhee, J., Christie, D. A., Le Quesne, C., Szejner, P., Masiokas, M. H., Villalba, R., Muñoz, A. A., and Crespo, S.: Spatiotemporal variations in hydroclimate across the Mediterranean Andes (30°–37° S) since the early twentieth century, J. Hydrometeorol., 18, 1929–1942, https://doi.org/10.1175/JHM-D-16-0004.1, 2017.
González-Reyes, Á., Jacques-Coper, M., Bravo, C., Rojas, M., and Garreaud, R.: Evolution of heatwaves in Chile since 1980, Weather Clim. Extrem., 41, 100588, https://doi.org/10.1016/j.wace.2023.100588, 2023.
Huang, S., Liu, D., Huang, Q., and Chen, Y.: Contributions of climate variability and human activities to the variation of runoff in the Wei River Basin, China, Hydrolog. Sci. J., 61, 1026–1039, https://doi.org/10.1080/02626667.2014.959955, 2016.
Jacques-Coper, M. and Garreaud, R. D.: Characterization of the 1970s climate shift in South America, Int. J. Climatol., 35, 2164–2179, https://doi.org/10.1002/joc.4120, 2015.
Kayano, M., de Oliveira, C., and Andreoli, R.: Interannual relations between South American rainfall and tropical sea surface temperature anomalies before and after 1976, Int. J. Climatol., 29, 1439–1448, https://doi.org/10.1002/joc.1824, 2009.
Kingston, D. G., Stagge, J. H., Tallaksen, L. M., and Hannah, D. M.: European-scale drought: Understanding connections between atmospheric circulation and meteorological drought indices, J. Climate, 28, 505–516, https://doi.org/10.1175/JCLI-D-14-00001.1, 2015.
Kong, D., Miao, C., Wu, J., and Duan, Q.: Impact assessment of climate change and human activities on net runoff in the Yellow River Basin from 1951 to 2012, Ecol. Eng., 91, 566–573, https://doi.org/10.1016/j.ecoleng.2016.02.023, 2016.
Li, J., Xie, S. P., Cook, E. R., Chen, F., Shi, J., Zhang, D. D., Fang, K., Gou, X., Li, T., Peng, J., Shi, S., and Zhao, Y.: Deciphering Human Contributions to Yellow River Flow Reductions and Downstream Drying Using Centuries-Long Tree Ring Records, Geophys. Res. Lett., 46, 898–905, https://doi.org/10.1029/2018GL081090, 2019.
Linton, J. and Budds, J.: The hydrosocial cycle: Defining and mobilizing a relational-dialectical approach to water, Geoforum, 57, 170–180, https://doi.org/10.1016/j.geoforum.2013.10.008, 2014.
Liu, Y., Ren, L., Zhu, Y., Yang, X., Yuan, F., Jiang, S., and Ma, M.: Evolution of Hydrological Drought in Human Disturbed Areas: A Case Study in the Laohahe Catchment, Northern China, Adv. Meteorol., 2016, 5102568, https://doi.org/10.1155/2016/5102568, 2016..
Madariaga, A., Maillet, A., and Rozas, J.: Multilevel business power in environmental politics: the avocado boom and water scarcity in Chile, Environ. Polit., 30, 1174–1195, https://doi.org/10.1080/09644016.2021.1892981, 2021.
Miranda, A., Lara, A., Altamirano, A., Di Bella, C., González, M. E., and Julio Camarero, J.: Forest browning trends in response to drought in a highly threatened mediterranean landscape of South America, Ecol. Indic., 115, 106401, https://doi.org/10.1016/j.ecolind.2020.106401, 2020.
Muñoz, A. A., Klock-Barría, K., Alvarez-Garreton, C., Aguilera-Betti, I., González-Reyes, Á., Lastra, J. A., Chávez, R. O., Barría, P., Christie, D., Rojas-Badilla, M., and Lequesne, C.: Water crisis in petorca basin, Chile: The combined effects of a mega-drought and water management, Water, 12, 648, https://doi.org/10.3390/w12030648, 2020.
Muñoz-Sabater, J., Dutra, E., Agustí-Panareda, A., Albergel, C., Arduini, G., Balsamo, G., Boussetta, S., Choulga, M., Harrigan, S., Hersbach, H., Martens, B., Miralles, D. G., Piles, M., Rodríguez-Fernández, N. J., Zsoter, E., Buontempo, C., and Thépaut, J. N.: ERA5-Land: A state-of-the-art global reanalysis dataset for land applications, Earth Syst. Sci. Data, 13, 4349–4383, https://doi.org/10.5194/essd-13-4349-2021, 2021.
Owens, P. N.: Soil erosion and sediment dynamics in the Anthropocene: a review of human impacts during a period of rapid global environmental change, J. Soils Sediments, 20, 4115–4143, https://doi.org/10.1007/s11368-020-02815-9, 2020.
Rangecroft, S., Van Loon, A. F., Maureira, H., Verbist, K., and Hannah, D. M.: An observation-based method to quantify the human influence on hydrological drought: upstream–downstream comparison, Hydrolog. Sci. J., 64, 276–287, https://doi.org/10.1080/02626667.2019.1581365, 2019.
Rodionov, S. N.: A sequential algorithm for testing climate regime shifts, Geophys. Res. Lett., 31, 2–5, https://doi.org/10.1029/2004GL019448, 2004.
Saft, M., Western, A. W., Zhang, L., Peel, M. C., and Potter, N. J.: The influence of multiyear drought on the annual rainfall-runoff relationship: An Australian perspective, Water Resour. Res., 51, 2444–2463, https://doi.org/10.1002/2014WR015348, 2015.
Saft, M., Peel, M. C., Western, A. W., and Zhang, L.: Predicting shifts in rainfall-runoff partitioning during multiyear drought: Roles of dry period and catchment characteristics, Water Resour. Res., 52, 9290–9305, https://doi.org/10.1002/2016WR019525, 2016.
Schipper, E. L. F.: Maladaptation: When Adaptation to Climate Change Goes Very Wrong, One Earth, 3, 409–414, https://doi.org/10.1016/j.oneear.2020.09.014, 2020.
Sharifi, A., Mirabbasi, R., Ali Nasr-Esfahani, M., Torabi Haghighi, A., and Fatahi Nafchi, R.: Quantify the impacts of anthropogenic changes and climate variability on runoff changes in central plateau of Iran using nine methods, J. Hydrol., 603, 127045, https://doi.org/10.1016/j.jhydrol.2021.127045, 2021.
Shourov, M. M. H.: mmhs013/pyHomogeneity: tag for Zenodo Release, Zenodo [code], https://doi.org/10.5281/ZENODO.3785287, 2020.
Taucare, M., Daniele, L., Viguier, B., Vallejos, A., and Arancibia, G.: Groundwater resources and recharge processes in the Western Andean Front of Central Chile, Sci. Total Environ., 722, 137824, https://doi.org/10.1016/j.scitotenv.2020.137824, 2020.
Van Lanen, H. A. J., Wanders, N., Tallaksen, L. M., and Van Loon, A. F.: Hydrological drought across the world: Impact of climate and physical catchment structure, Hydrol. Earth Syst. Sci., 17, 1715–1732, https://doi.org/10.5194/hess-17-1715-2013, 2013.
Van Loon, A. F.: Hydrological drought explained, Wiley Interdisciplin. Rev.: Water, 2, 359–392, https://doi.org/10.1002/WAT2.1085, 2015.
Van Loon, A. F. and Laaha, G.: Hydrological drought severity explained by climate and catchment characteristics, J. Hydrol., 526, 3–14, https://doi.org/10.1016/j.jhydrol.2014.10.059, 2015.
Van Loon, A. F., Stahl, K., Di Baldassarre, G., Clark, J., Rangecroft, S., Wanders, N., Gleeson, T., Van Dijk, A. I. J. M., Tallaksen, L. M., Hannaford, J., Uijlenhoet, R., Teuling, A. J., Hannah, D. M., Sheffield, J., Svoboda, M., Verbeiren, B., Wagener, T., and Van Lanen, H. A. J.: Drought in a human-modified world: Reframing drought definitions, understanding, and analysis approaches, Hydrol. Earth Syst. Sci., 20, 3631–3650, https://doi.org/10.5194/hess-20-3631-2016, 2016.
Van Loon, A. F., Rangecroft, S., Coxon, G., Naranjo, J. A. B., Van Ogtrop, F., and Van Lanen, H. A. J.: Using paired catchments to quantify the human influence on hydrological droughts, Hydrol. Earth Syst. Sci., 23, 1725–1739, https://doi.org/10.5194/hess-23-1725-2019, 2019.
Van Loon, A. F., Rangecroft, S., Coxon, G., Werner, M., Wanders, N., Di Baldassarre, G., Tijdeman, E., Bosman, M., Gleeson, T., Nauditt, A., Aghakouchak, A., Breña-Naranjo, J. A., Cenobio-Cruz, O., Costa, A. C., Fendekova, M., Jewitt, G., Kingston, D. G., Loft, J., Mager, S. M., Mallakpour, I., Masih, I., Maureira-Cortés, H., Toth, E., Van Oel, P., Van Ogtrop, F., Verbist, K., Vidal, J. P., Wen, L., Yu, M., Yuan, X., Zhang, M., and Van Lanen, H. A. J.: Streamflow droughts aggravated by human activities despite management, Environ. Res. Lett., 17, 044059, https://doi.org/10.1088/1748-9326/ac5def, 2022.
Wanders, N. and Wada, Y.: Human and climate impacts on the 21st century hydrological drought, J. Hydrol., 526, 208–220, https://doi.org/10.1016/j.jhydrol.2014.10.047, 2015.
Ward, P. J., de Ruiter, M. C., Mård, J., Schröter, K., Van Loon, A., Veldkamp, T., von Uexkull, N., Wanders, N., AghaKouchak, A., Arnbjerg-Nielsen, K., Capewell, L., Carmen Llasat, M., Day, R., Dewals, B., Di Baldassarre, G., Huning, L. S., Kreibich, H., Mazzoleni, M., Savelli, E., Teutschbein, C., van den Berg, H., van der Heijden, A., Vincken, J. M. R., Waterloo, M. J., and Wens, M.: The need to integrate flood and drought disaster risk reduction strategies, Water Secur., 11, 100070, https://doi.org/10.1016/j.wasec.2020.100070, 2020.
Zhao, G., Tian, P., Mu, X., Jiao, J., Wang, F., and Gao, P.: Quantifying the impact of climate variability and human activities on streamflow in the middle reaches of the Yellow River basin, China, J. Hydrol., 519, 387–398, https://doi.org/10.1016/j.jhydrol.2014.07.014, 2014.
Zhao, Y., Feng, D., Yu, L., Wang, X., Chen, Y., Bai, Y., Hernández, H. J., Galleguillos, M., Estades, C., Biging, G. S., Radke, J. D., and Gong, P.: Detailed dynamic land cover mapping of Chile: Accuracy improvement by integrating multi-temporal data, Remote Sens. Environ., 183, 170–185, https://doi.org/10.1016/j.rse.2016.05.016, 2016.