the Creative Commons Attribution 4.0 License.
the Creative Commons Attribution 4.0 License.
 | 15 May 2024
Global total precipitable water variations and trends over the period 1958–2021
Nenghan Wan
Xiaomao Lin
Roger A. Pielke Sr.
Xubin Zeng
Amanda M. Nelson
Global responses of the hydrological cycle to climate change have been widely studied, but uncertainties still remain regarding water vapor responses to lower-tropospheric temperature. Here, we investigate the trends in global total precipitable water (TPW) and surface temperature from 1958 to 2021 using ERA5 and JRA-55 reanalysis datasets. We further validate these trends using radiosonde from 1979 to 2019 and Atmospheric Infrared Sounder (AIRS) and Special Sensor Microwave Imager/Sounder (SSMIS) observations from 2003 to 2021. Our results indicate a global increase in total precipitable water (TPW) of ∼ 2 % per decade from 1993–2021. These variations in TPW reflect the interactions of global warming feedback mechanisms across different spatial scales. Our results also revealed a significant near-surface temperature (T2 m) warming trend of ∼ 0.15 K decade−1 over the period 1958–2021. The consistent warming at a rate of ∼ 0.21 K decade−1 after 1993 corresponds to a strong water vapor response to temperature at a rate of 9.5 % K−1 globally, with land areas warming approximately twice as fast as the oceans. The relationship between TPW and T2 m showed a variation of around 6 % K−1–8 % K−1 in the 15–55° N latitude band, aligning with theoretical estimates from the Clausius–Clapeyron equation.
Please read the corrigendum first before continuing.
-
Notice on corrigendum
The requested paper has a corresponding corrigendum published. Please read the corrigendum first before downloading the article.
-
Article
(5428 KB)
- Corrigendum
-
Supplement
(1446 KB)
-
The requested paper has a corresponding corrigendum published. Please read the corrigendum first before downloading the article.
- Article
(5428 KB) - Full-text XML
- Corrigendum
-
Supplement
(1446 KB) - BibTeX
- EndNote


As the most critical greenhouse gas in the Earth's atmosphere, water vapor plays a key role in atmospheric processes from the microscale (including the formation of clouds and precipitation) to the global scale and is related to the Earth's radiation budget, hydrological cycle, and climate change (Held and Soden, 2006; Lacis et al., 2010; Ruckstuhl et al., 2007). The amount of water vapor is primarily controlled by the air temperature when the relative humidity (especially over the ocean) remains unchanged in the low troposphere. The total precipitable water (TPW), also known as the column-integrated amount of water vapor from the surface to the top of the atmosphere, increases by 6 %–7 % with a 1 K increase in air temperature, according to the Clausius–Clapeyron equation. This enhances the strength of global warming with strong positive feedback due to the greenhouse effect (Held and Soden, 2006; O'Gorman and Muller, 2010) particularly in the upper troposphere, whereas changes at lower levels are strongly linked with precipitation, influencing the frequency and intensity of extreme weather events (Trenberth, 1998; Trenberth et al., 2003). Therefore, evaluating the long-term trend of TPW change and its relationship with temperature is important for understanding the role of water vapor in climate change and the impact of water vapor feedback on global warming.
Because of the short residence time of water vapor in the atmosphere, studies in terms of long-term water vapor trends and their variability still face challenges. The two main categories of water vapor data include observations collected from various weather station networks and satellites and reanalysis datasets integrated with simulations and observations. The former have difficulty in evaluating long-term trends due to discontinuities, insufficient spatial densities, and coverage (Dee et al., 2011). For example, radiosonde observations have the issue of spurious discontinuities or changes in variability due to shifts in instruments and observational methods (Dee et al., 2011; Trenberth et al., 2005). However, multiple observations have been homogenized and thoroughly quality-checked in recent years. For example, the ground-based measurements of global navigation satellite systems (GNSS) integrated water vapor from 1994–2021 (Bock, 2022) and provided evidence of global moistening (Douville et al., 2022). The in situ observations from the Radiosounding HARMonization (RHARM) dataset (Madonna et al., 2022) enhance the spatial consistency of estimated trends and align more closely with a contemporary atmospheric reanalysis. In addition, the homogenized temperature data presented by Zhou et al. (2021) exhibited spatially consistent trends and temporally stable variations and did not show the erroneous tropospheric cooling observed in various reanalyses, including ERA5 and raw datasets, across North China and Mongolia. This accuracy of temperature measurements can help increase the confidence in tropospheric temperature and water vapor and enhance the quality of atmospheric reanalysis products. Temperature and humidity extremes from the HadISDH dataset by Willett (2023) are also designed for long-term regional trends. The latter reanalysis dataset faces the issue of data quality suffering from biases and errors from assimilated data during the satellite era, causing concerns about its reliability for detecting climate trends (Dai et al., 2011; Schröder et al., 2016; Trenberth et al., 2011). Trenberth et al. (2005) evaluated the performance of global reanalyses, satellites, and radiosonde datasets in relation to TPW and found that the Special Sensor Microwave Image/Sounder (SSMIS) dataset provided by Remote Sensing Systems (RSS) is the only source with reliable means, variabilities, and trends for TPW over oceans after 1988. The discontinuity and inaccurate data in 1992 due to changes in satellite instruments were highlighted by Trenberth et al. (2015), and this spurious variability in water vapor has existed in reanalyses up to the present. Numerous studies have analyzed trends and variations in atmospheric water vapor distribution on both global and regional scales, primarily utilizing early versions of reanalysis datasets and satellite observations, albeit over relatively short study periods (e.g., Borger et al., 2022; Parracho et al., 2018; Wang et al., 2016; Zhang et al., 2019, 2021). New-generation reanalysis datasets (JRA-55 and ERA5) provide better options for climate studies because of advanced modeling and data assimilation systems, with better accuracy and fewer homogeneity issues (Hersbach et al., 2020; Kobayashi et al., 2015; Douville et al., 2022). JRA-55 showed a better performance in studying multi-decadal variability and climate change than previous reanalysis datasets (Kobayashi et al., 2015). Many studies have confirmed that ERA5 is the best or among the highest-performing reanalysis products (Taszarek et al., 2021; Yuan et al., 2023), although inhomogeneity still remains, for example, with water vapor associated with changes in SSMIS instruments (Trenberth et al., 2015) and unreliability of tropical water vapor in ERA5 and ground-based observations before 1993 (Allan et al., 2022). Therefore, the latest ERA5 and JRA-55 datasets were selected in this study to analyze long-term TPW changes and their relationship with temperatures at regional and global scales.
The near-surface air temperature (2 m air temperature, T2 m) describes the thermodynamic temperature at a 1.5–2 m height, while surface skin temperature (Ts) refers to “radiometric surface temperature” that is governed by the terrestrial radiation balance (Jin et al., 1997; Jin and Dickinson, 2010). Recent studies investigated how the TPW responds to changes in surface temperature using modeling estimation, satellite observations, or ground-based observation systems (Allan et al., 2022; Alshawaf et al., 2017; Borger et al., 2022; O'Gorman and Muller, 2010; Wang et al., 2016; Yuan et al., 2021), and many global surface temperature observational datasets use sea surface temperature (SST) over ocean and T2 m over land (e.g., HadCRUT; Morice et al., 2021). Different from prior studies, we use the newest and oldest available reanalysis datasets to discuss the difference in T2 m and Ts and the relationship between trends in TPW and T2 m from 1993 to 2021 along with additional analysis using radiosonde data as well as AIRS and SSMIS satellite measurements since 2003.
In this study, we focus on answering the following questions: (1) to what extent has the TPW changed and what is the difference between the variations in T2 m and Ts on a multi-decadal scale? (2) What is the relationship between trends of TPW changes and temperature changes? The results from the reanalysis dataset are compared with radiosonde data as well as AIRS and SSMIS satellite measurements. We discuss the difference in results among datasets and their potential discontinuities in datasets. Therefore, this paper is organized as follows: in Sect. 2, we introduce the datasets and methods; in Sect. 3, the TPW variations and the differences in T2 m and Ts are compared with radiosonde and satellite observations over land and ocean; and Sects. 4 and 5 provide the discussion and conclusion.
2.1 Datasets
Two reanalysis datasets containing TPW and temperature (T2 m, Ts) from 1958 to 2021 were used in this study, these being ERA5 (Hersbach et al., 2020) and JRA-55 (Kobayashi et al., 2015). For ERA5, skin temperature, Ts, is the temperature estimated from the surface energy balance. For JRA-55, skin temperature is a diagnostic variable computed from the surface upward longwave radiation under the assumption that the surface is a black body. We used monthly reanalysis datasets from January 1958 to December 2021 for TPW and temperatures. Both TPW and temperature variables in these two datasets were regridded into 1° × 1° resolution data using a bilinear interpolation method before analyzing (Zhuang, 2018).
The Atmospheric Infrared Sounder (AIRS) instrument captures a precisely calibrated, spectrally detailed dataset of both infrared and microwave radiances. It offers quality temperature and humidity profiles throughout the troposphere (Tian et al., 2020). Satellite observations from AIRS Version 7 (Tian et al., 2020) were used for comparison with the reanalysis from 2003 to 2021. The total column water vapor (kg m−2) is calculated as the average of daytime (TotH2OVap_A) and nighttime modes (TotH2OVap_D). In addition, the column-integrated water vapor from the Special Sensor Microwave Imager/Sounder (SSMIS) from 2003–2021 (Wentz et al., 2015) is selected for comparison with reanalysis datasets.
We also used in situ observations from the Radiosounding HARMonization (RHARM) dataset (Madonna et al., 2022), which applied a new algorithm to the Global Climate Observing System Reference Upper-Air Network (GRUAN) data and used observation measurements instead of reanalysis data as a reference to calculate and adjust for systematic effects on temperature and humidity. RHARM provides homogenized temperature and relative humidity profiles at two observation times (00:00 and 12:00 UTC) for radiosonde stations globally from 1979 to 2019. Therefore, T2 m used in this study from radiosonde observation was taken from the temperature observed at the lowest layer. Relative humidity and temperature from the surface to the 500 hPa level are used to calculate precipitable water.
2.2 Methods
Monthly TPW and temperature anomalies were calculated by the base period of 1958–2021 for reanalysis datasets and demonstrated the trends of long-term (1958–2021) and short-term (1993–2021) periods. We divided the globe into tropical regions (23.5° S–23.5° N), temperate regions (23.5–66.5° S in the Southern Hemisphere, SH, and 23.5–66.5° N in the Northern Hemisphere, NH), and polar regions (66.5–90° S in the SH and 66.5–90° N in the NH). The regional average values, presented by different latitude bins, were calculated with a cosine (latitude) weighting factor to account for the convergence of grid points for each region. For the global distribution, all datasets were resampled into 1° × 1° resolution using spatial-averaging resampling, and then the area-weighted average of anomalies was computed to formulate a global time series.
For all trend analyses in TPW and temperature (Ts, T2 m) series, we first calculated global, land, and ocean average values and then selected the seasonal Kendall (SK) test (Hirsch et al., 1982) using the Theil–Sen slopes (Sen 1968; Theil, 1992) to calculate relative TPW trends (% per decade) (Zhai and Eskridge, 1997) and temperature trends for both Ts and T2 m (K per decade). The statistical significance of all linear correlations and trends was performed at a 95 % confidence level for all analyses conducted in this study. The TPW responses to temperature from 1993 to 2021 are calculated as the ratio of TPW trends to T2 m trends.
Due to daily data missing in radiosonde observations, valid data required at least 10 d of data available within a month, and at least two-thirds of the total months had to have valid monthly data (345 months for 1979–2019). Each month had to have at least 28 years' worth of valid data at each station to calculate monthly climatology. Trend analysis is also from Sen's estimate of the slope (Sen, 1968) for these observations. Thereby, 331 radiosonde stations were selected in this study. To facilitate the comparison, interpolated reanalysis data from radiosonde stations were selected to compare with the observation data. We calculated the trend difference between reanalyses and observations to assess how effectively each reanalysis product captures changes in observed TPW over the period 1979–2019.
To detect potential discontinuity within the temporal sequence of total water vapor and temperature in the reanalysis dataset, we applied the penalized maximal F test (PMF test; Wang et al., 2006; Wang and Feng, 2013; Wang, 2018) to detect temporal discontinuity points on each grid over ocean during the period 1958–2021. The discontinuities were documented if the p value of the testing statistic was less than 0.01 (Zhou et al., 2021).
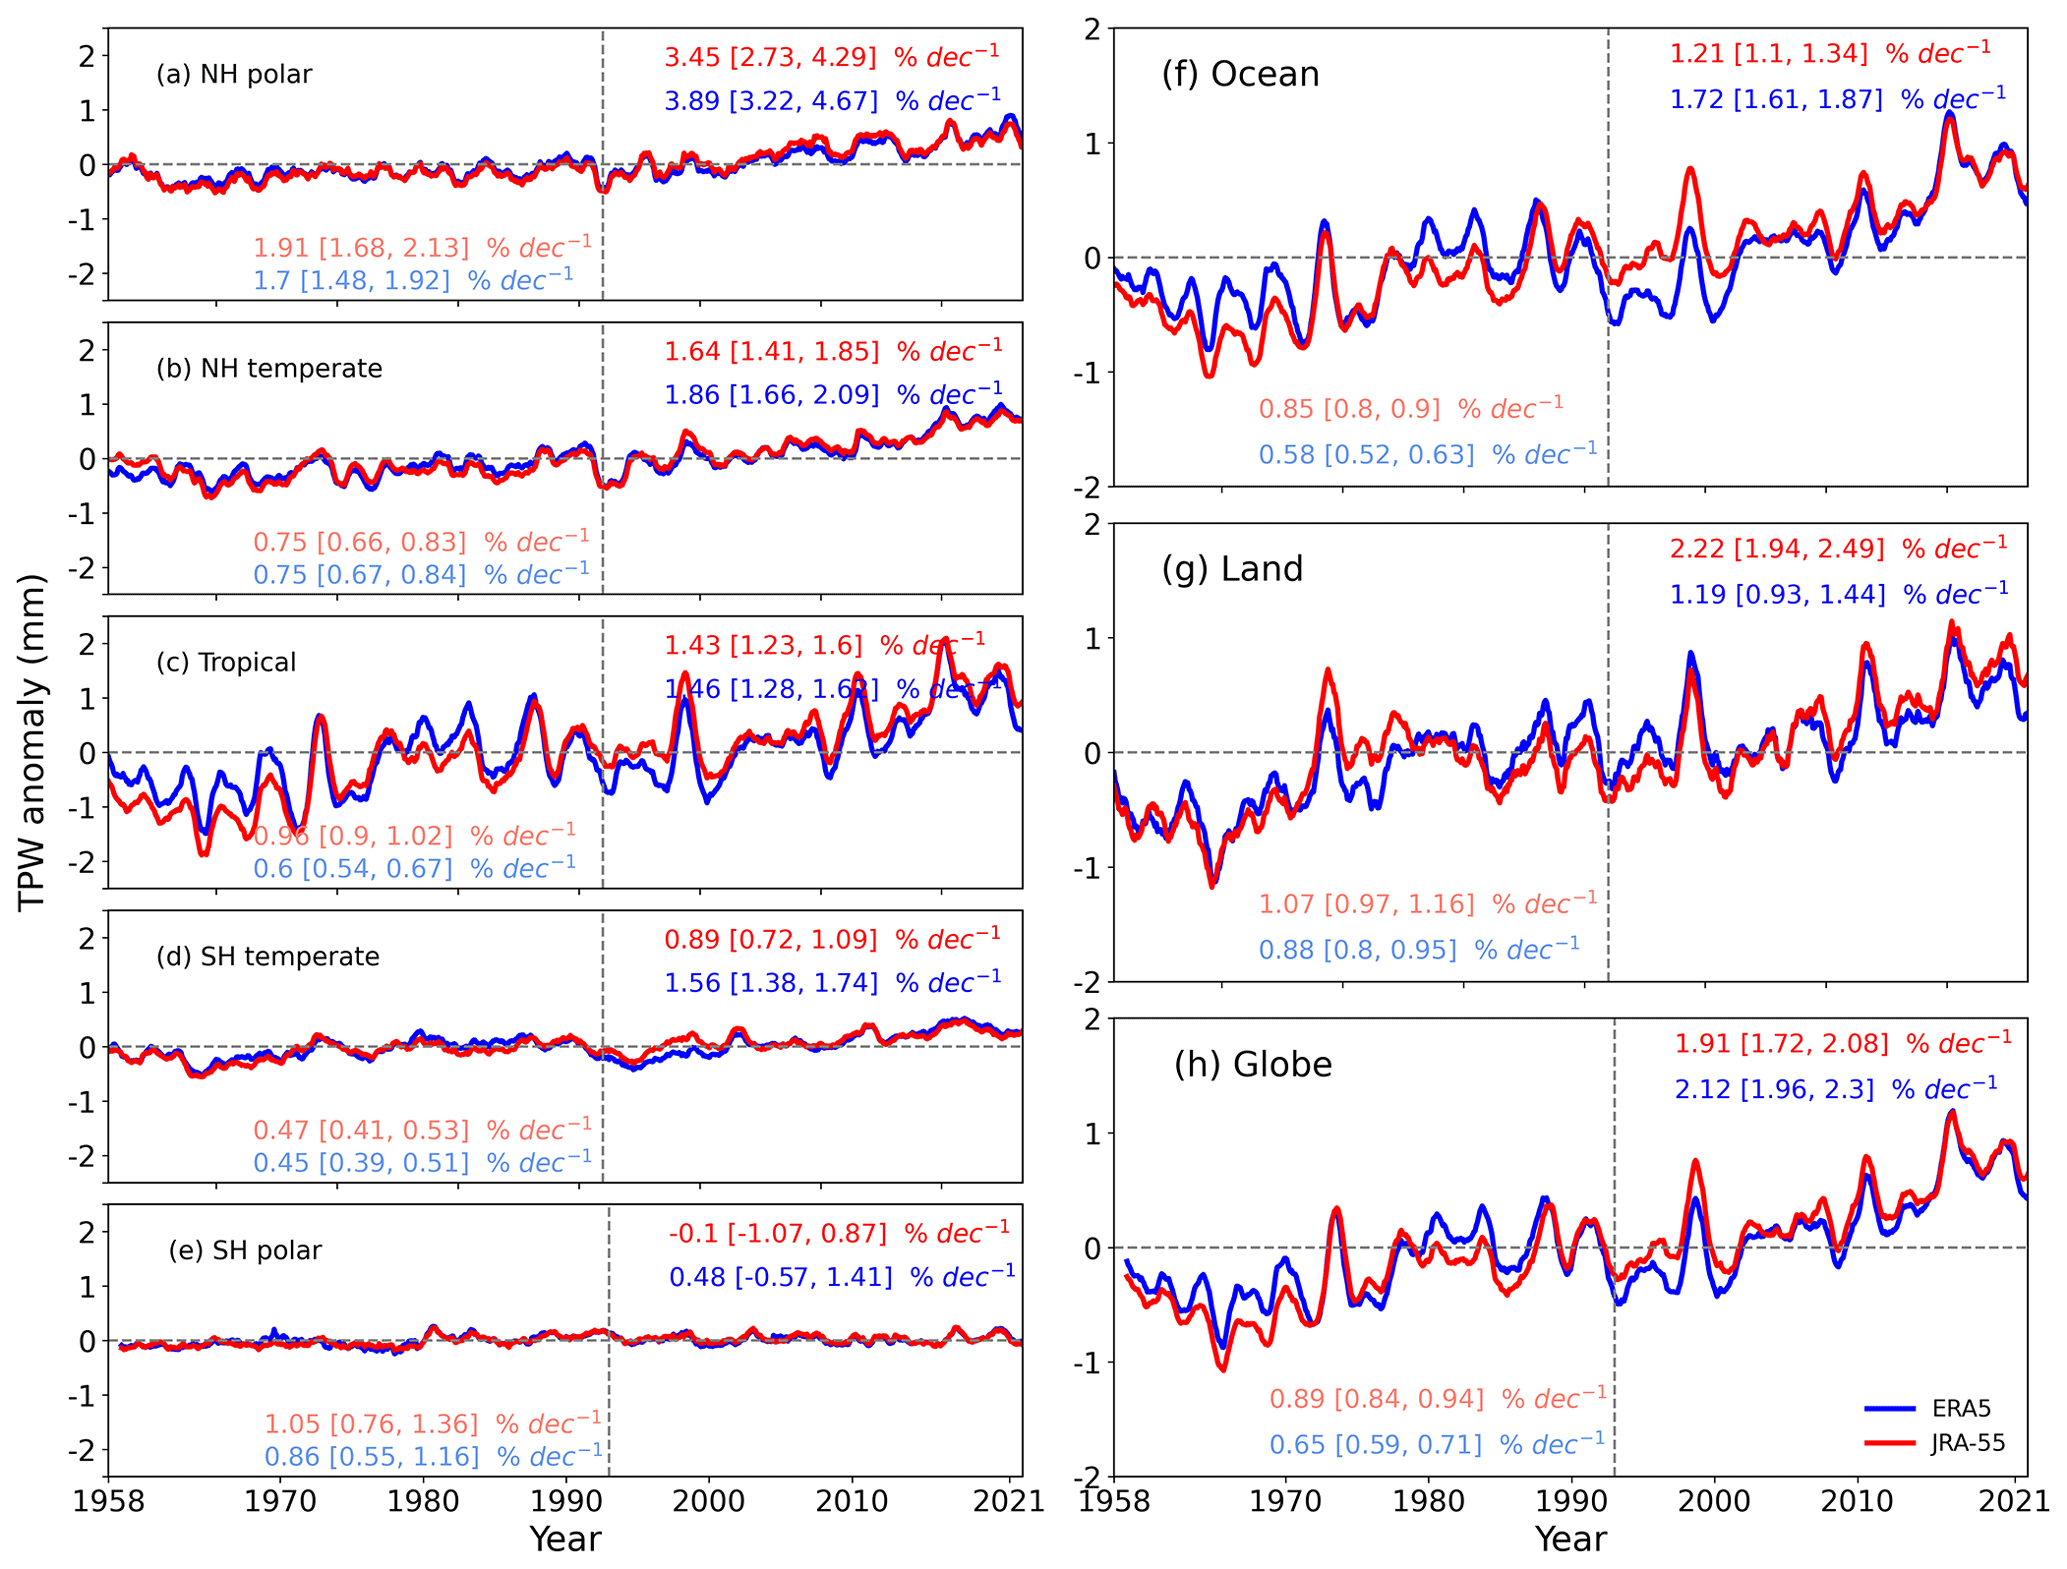
Figure 1Time series of monthly TPW anomalies (mm) over (a) the Northern Hemisphere (NH) polar regions, (b) NH temperate regions, (c) tropical regions, (d) Southern Hemisphere (SH) temperate regions, (e) SH polar regions, (f) ocean area, (g) land area, and (h) the globe from the ERA5 (blue) and JRA-55 (red) datasets during the period 1958–2021. A 12 month running smoother was applied to each time series shown. The trends are shown for the 1958–2021 (light color) and 1993–2021 (dark color) periods with 95 % confidence intervals in brackets. The vertical line indicates the year 1993.
3.1 TPW trends
Figure 1a–e show the temporal variations in monthly TPW anomalies over tropical, temperate, and polar regions. Overall, in terms of latitude bands, these trends differ little between the two reanalysis datasets. Specifically, ERA5 gives a 0.6 % per decade moistening rate, whereas the JRA-55 dataset shows a 0.96 % per decade moistening rate over the tropical regions for the whole period 1958–2021. A notable decrease in TPW is shown during the 1980s and 1990s over tropical regions in ERA5, which is consistent with ERA-Interim (Allan et al., 2014) but inconsistent with satellite microwave data (Allan et al., 2022). This discrepancy seems to originate in the tropical lower troposphere over ocean. Since SSMIS satellites became available and were used in ERA5 after 1987 (Hersbach et al., 2020), there has been some spurious variability in TPW, notably in January 1992 (Trenberth et al., 2015). However, a strong agreement of TPW after 1993 is shown between SSMIS observations and ERA5 (Allan et al., 2022). In addition, data after 1993 show fewer change points based on PMF test results on grid boxes over the ocean (Fig. S2). Thus, the 1993–2021 time series of TPW benefiting from in situ and satellite observations is expected to produce more reliable water vapor variability. ERA5 gives a 1.46 % per decade moistening rate, whereas the JRA-55 dataset shows a 1.43 % per decade moistening rate over the tropical regions from 1993 to 2021. Trends are 1.86 % per decade in NH temperate regions and 3.89 % per decade in NH polar regions for ERA5, while values are about 1.56 (0.89) % per decade over temperate regions but are not significant over polar regions in the SH for ERA5 (JRA-55) during 1993–2021. The increase of TPW trends in the NH is larger than that in the SH, although they showed strong month-to-month variabilities (coefficient of variation, CV, is 0.7 on average) in the NH, which are consistent with the global distribution (Fig. 1).
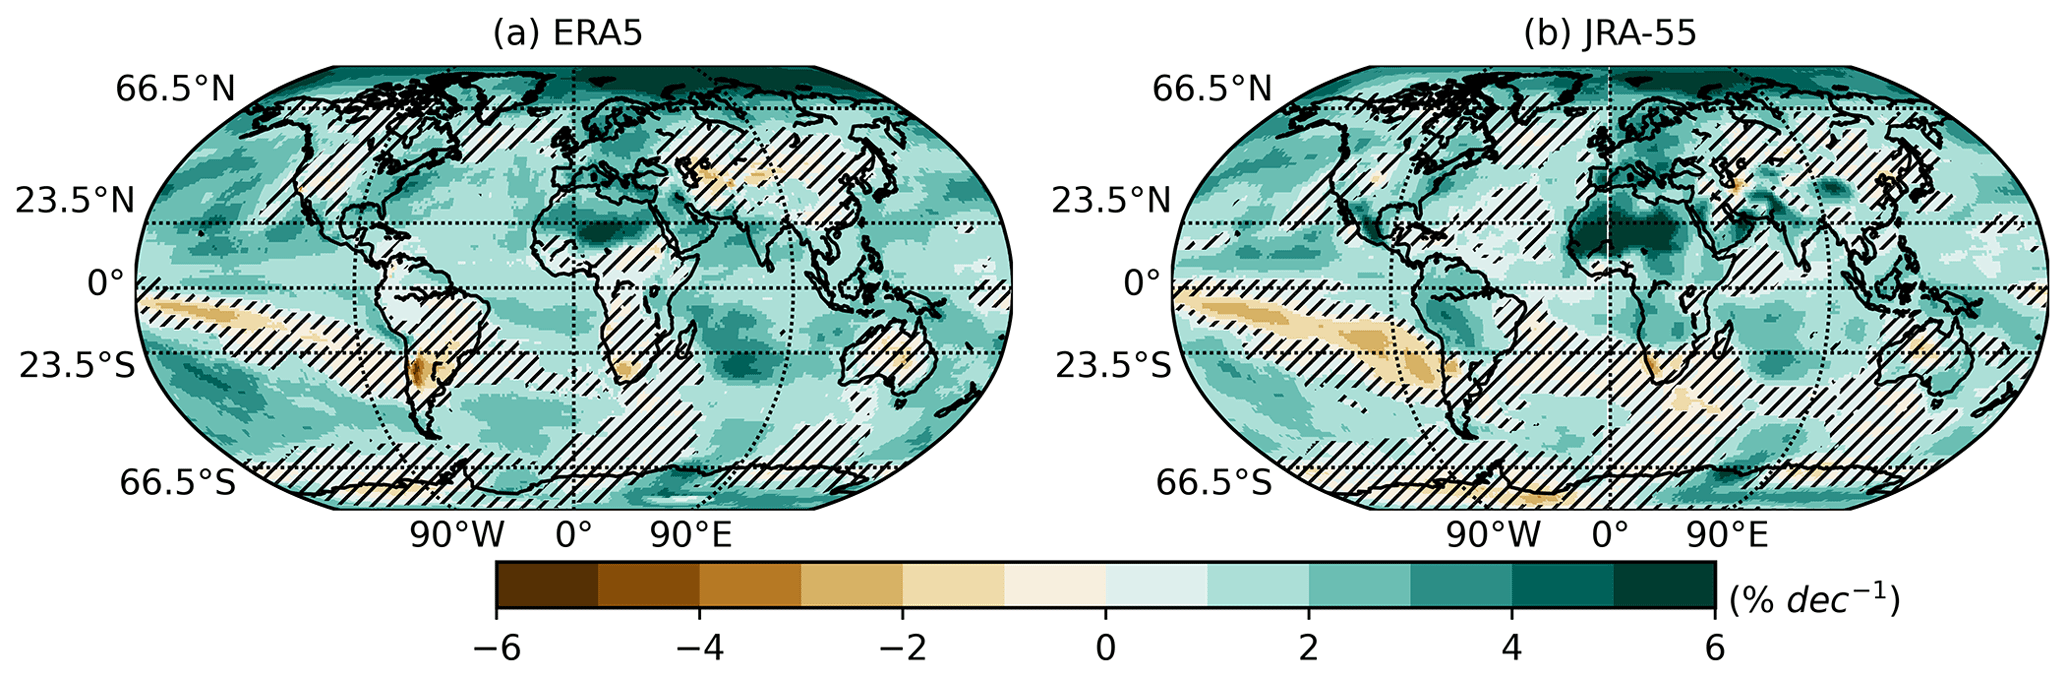
Figure 2Monthly total precipitable water (TPW) trend (% per decade) from 1993 to 2021 from (a) ERA5 and (b) JRA-55. The hatched areas represent trends that are not statistically significant at a 95 % confidence level.
Figure 1f–h depict these trends of TPW estimated over ocean, land, and the globe. It is noticeable that monthly TPW anomalies showed a consistent and statistically significant increase, yielding a rate of 0.58 (0.85), 0.88 (1.07), and 0.65 (0.89) % per decade for ERA5 (JRA-55) over the period 1958–2021 over ocean, land, and the globe, respectively. However, those trends increase at a rate of 1.72 (1.21) % per decade, 1.19 (2.22) % per decade, and 2.12 (1.91) % per decade for ERA5 (JRA-55) after 1993. The monthly TPW anomalies showed a similar variability over ocean, land, and the globe (CVs around 0.4) and displayed significant interannual variations, which had been dominated by ENSO events (Trenberth et al., 2005; Wang et al., 2016). The distinct turning points may be attributed to the intensity of ENSO events. For example, one of the most powerful ENSO events during the 1997/98 El Niña led to a significant tropical TPW increase, attributable to the warming in the equatorial Pacific (Wagner et al., 2005). The 2015/16 El Niño caused a moistening TPW trend over tropical regions (Garfinkel et al., 2018). The trend of TPW during 1988–2003 was likely associated with the decadal variation in Interdecadal Pacific Oscillation from a warm period (1977–1998) to a cold period (1999–2003) (Dong and Dai, 2015). The TPW trend for the recent period, including the 1997/98 event, will likely be similar (Wang et al., 2016). In addition, Patel and Kuttippurath (2023) also show a strong correlation (0.81) between Pacific Decadal Oscillation and TPW variability in tropical regions.
Based on time series of TPW in Fig. 1, Fig. 2 shows the decadal trends in TPW calculated from ERA5 and JRA-55 after 1993. In general, the two reanalysis datasets showed similar trend patterns of global TPW distribution, with upward trends as the dominant change in TPW, indicating a rise in moisture in response to global warming since the end of the twentieth century (Santer et al., 2006). TPW trends are largely positive and statistically significant over North Africa, Europe, and the NH polar region. In addition, Simpson et al. (2023) found that near-surface water vapor, as measured by surface observations, has not increased over arid and semi-arid regions since 1980, which represents a discrepancy compared to predicted results from simulations. These findings indicate there might be misrepresentations of hydroclimate-related processes in simulations since climate models showed moistening trends associated with the increase in water-vapor-holding capacity of a warmer atmosphere. On the other hand, decreasing TPW trends show a dipole structure over the Southern Ocean in both reanalysis datasets which can be attributed to the change in the ENSO phase (Trenberth et al., 2005). In contrast, these two reanalysis datasets show opposite trends over eastern Africa, including the Sudan, where ERA5 trends are negative while JRA-55 trends are positive. The reason for the opposite trends in reanalyses is likely due to the different representations of large-scale moisture transport, surface–atmosphere processes, and their data assimilation (Parracho et al., 2018). Chen and Liu (2016) and Parracho et al. (2018) also showed decreasing trends in North Africa using ERA-Interim reanalysis over the periods 1979–2014 and 1980–2016, and the biases in rainfall over West Africa might also exist in ERA-Interim reanalysis (Dunning et al., 2016). In terms of TPW trend over arid and semi-arid regions from 1980 to 2020 (figure not shown), the reanalysis also shows a different trend, comparing observation from Simpson et al. (2023), that only TPW significantly decreased over the southwest United States in ERA5 and central Africa in JRA-55.
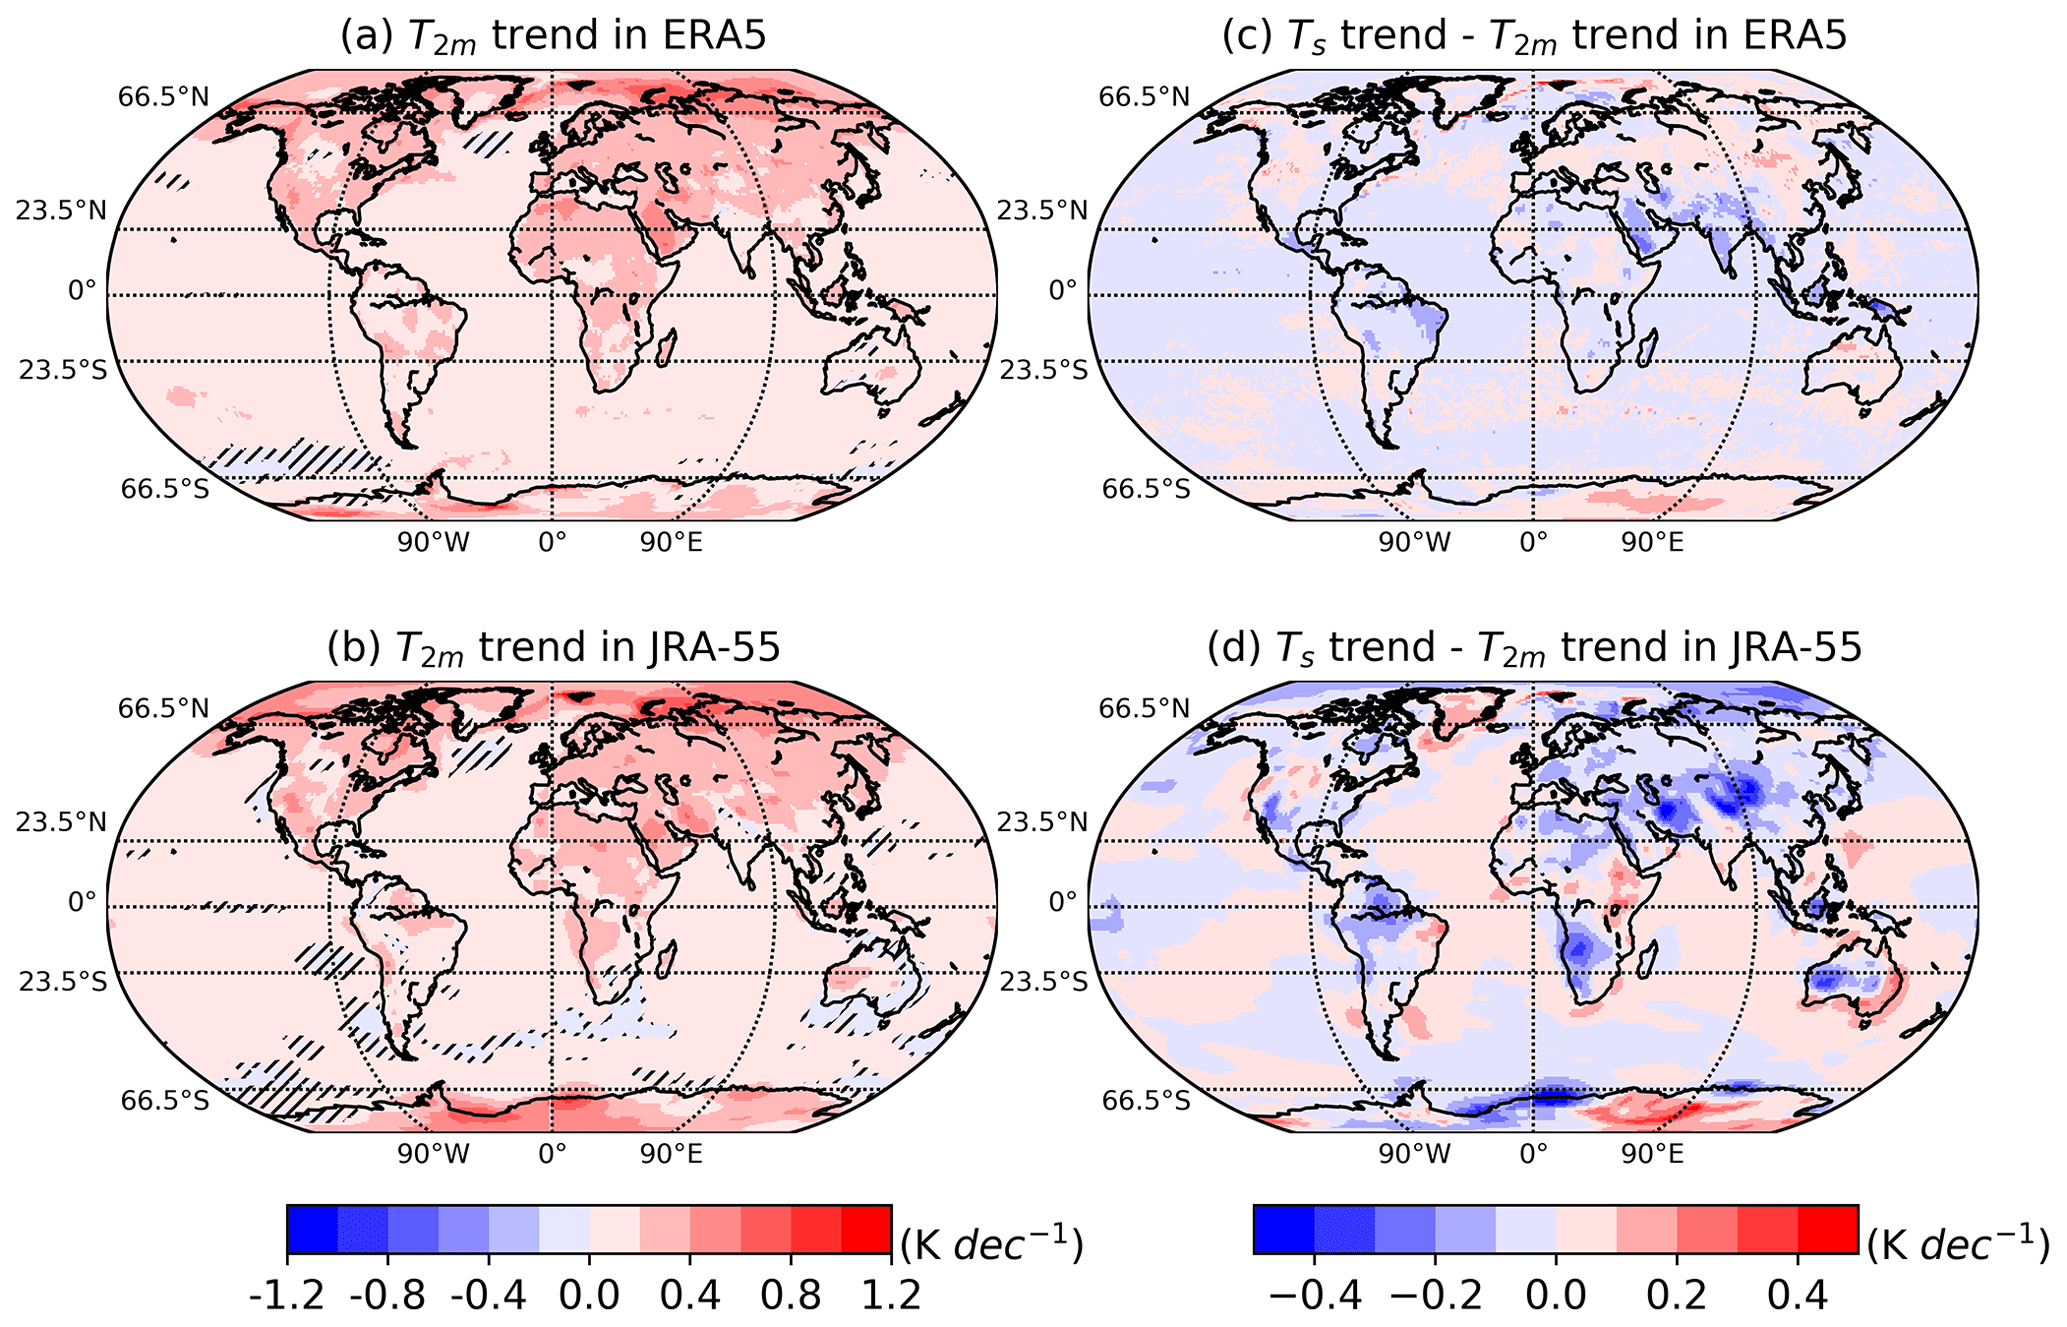
Figure 3Trends of surface air temperature (T2 m) from 1958 to 2021 for ERA5 (a) and JRA-55 (b). The differential trends between Ts and T2 m trends for ERA5 (c) and JRA-55 (d). The hatched areas indicate trends that are not statistically significant. Trend units: K per decade.
3.2 Trends in temperature
In contrast to TPW, temperature in ERA5 is relatively stable for the pre-satellite era and aligned with independent datasets, although some notable discrepancies exist in accurately representing specific regional variations (Hersbach et al., 2020). The global trends of temperature between 1958–2021 exhibit widespread warming over large regions in both reanalysis datasets, except for some small areas located in the SH and northern Atlantic (Fig. 3). Large land areas experience warming temperature changes of greater magnitude compared to the surrounding oceans (Fig. 3), and the strongest warming occurred in the Arctic (Fig. 3). Greater warming is observed over mid-latitude regions than over tropical regions in the NH, consistent with Zeng et al. (2021). Cooling in the North Atlantic is also observed by Li et al. (2022) when using observation datasets. This arises from strengthened local convection and heat dissipation from the ocean induced by the overlying atmosphere. Meanwhile, the North Atlantic cooling appears most significant in February in the Northern Hemisphere, while it becomes net warming in August (Allan and Allan, 2020). Some studies connect this phenomenon to changes in ocean circulation based on modeling results (Drijfhout et al., 2012). In addition, based on model simulations without considering variable ocean currents, He et al. (2022) explained that the warming hole is driven by enhanced surface westerly wind removing heat from the ocean surface. For the SH, the polar region also experiences the strongest warming trends, similar to the trend's magnitudes observed by Clem et al. (2020). There is a slight difference between two reanalysis datasets for differential trends (ΔT) between Ts and T2 m at the global scale, especially over the ocean area where ΔT trends are negative in ERA5 and positive in JRA-55. The ΔT shows a similar pattern only over the tropical land region (Fig. 3d). Although air and surface temperatures are closely related, they are physically distinct. The difference may be affected by changes in regional and seasonal vegetation ecosystems, land use, and land cover (Gulev et al., 2021; Masson-Delmotte et al., 2022). The ability of atmospheric reanalyses to effectively constrain variations in Ts and T2 m trends is limited because the sea surface temperatures in atmospheric reanalyses were obtained from globally observed and interpolated products (Rayner et al., 2003). In contrast, the estimation of air temperature depends on model parameterizations and assimilated observations which do not incorporate marine air temperature (Simmons et al., 2017). The strong correlations between T2 m and Ts are further discussed in the Supplement (Figs. S4 and S5). Overall, T2 m and Ts show very similar interannual variations, and the trends are not significantly different. Therefore, we only present T2 m variations and its relationship with water vapor.
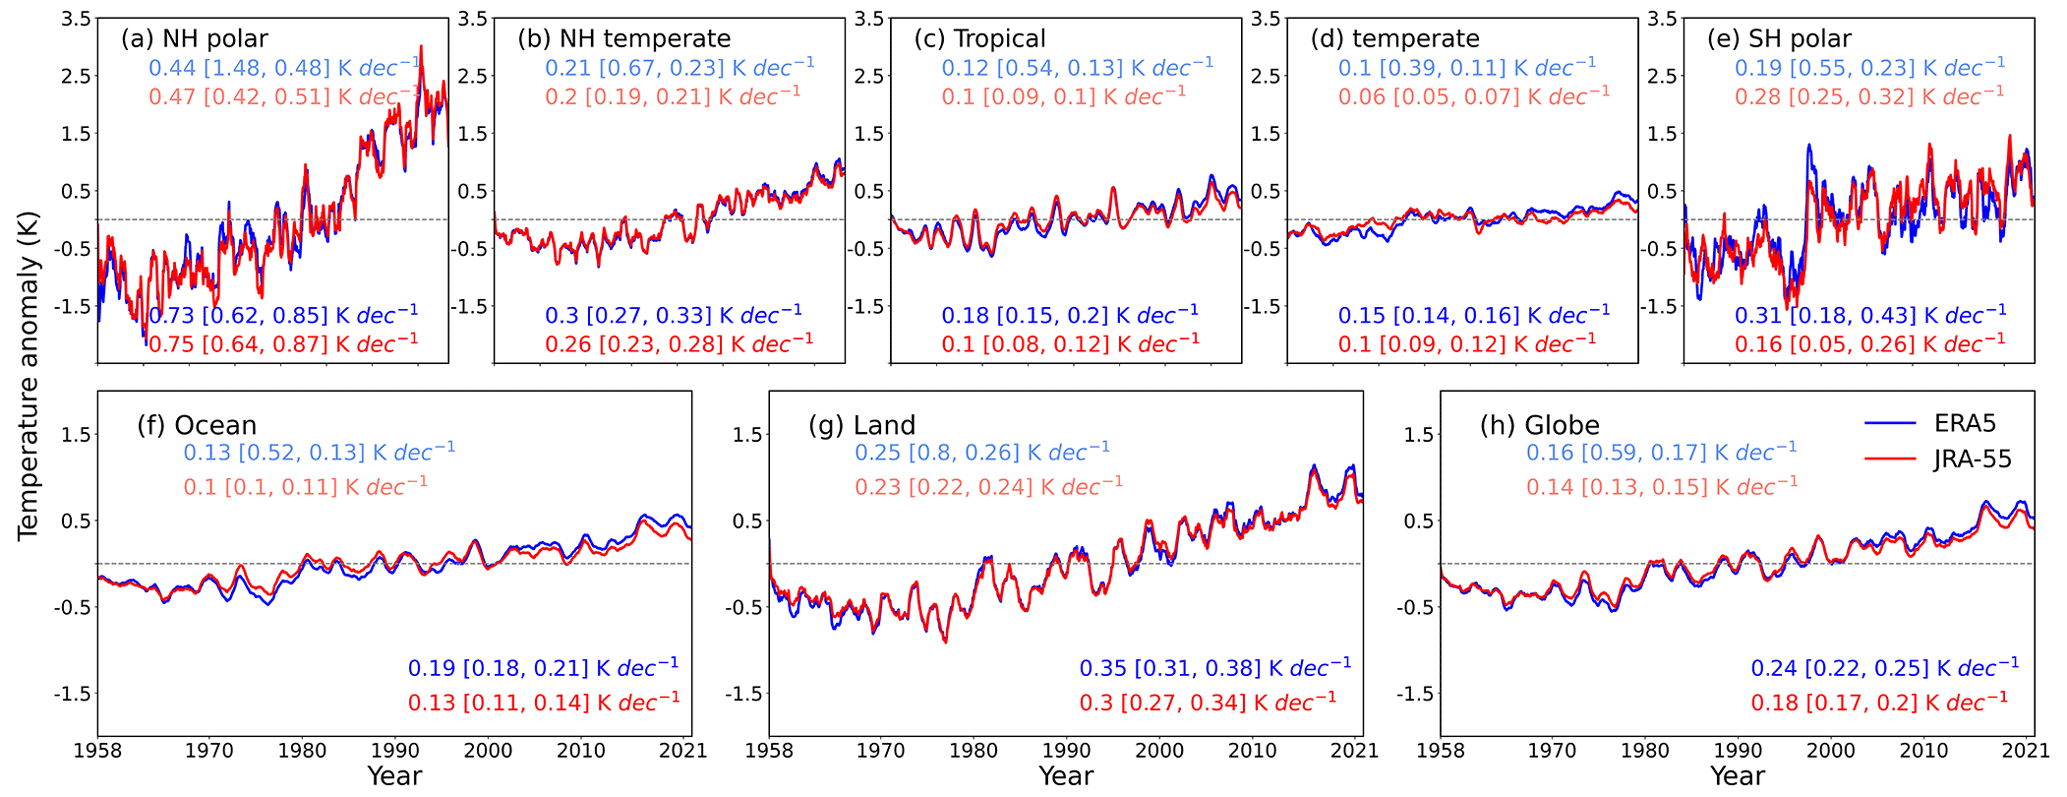
Figure 4Monthly T2 m and Ts anomaly over (a) the Northern Hemisphere (NH) polar regions, (b) NH temperate regions, (c) tropical regions, (d) Southern Hemisphere (SH) temperate regions, (e) SH polar regions, (f) ocean, (g) land, and (h) the globe from the ERA5 (blue) and JRA-55 (red) datasets during the period 1958 to 2021. A 12-month running smoother was applied to all time series. The trends are shown for the 1958–2021 (light color) and 1993–2021 (dark color) periods with 95 % confidence intervals in square brackets. The vertical line indicates the year 1993.
The general warming trends since the late 1970s revealed by T2 m over different latitude bins in both datasets agree with each other when viewing the spatial distribution of magnitudes globally (Fig. 4), manifested by much more warming in the Arctic at a rate (all temperature rates given as K per decade) of ∼ 0.45, which is 3 times faster than the global average rate (∼ 0.15) (Fig. 4h). During the 1979–2021 period, this Arctic amplification of warming was markedly pronounced, occurring at rates 3.5 times faster than the global average warming rate documented by surface climate observations (Rantanen et al., 2022) in ERA5 data and 4 times faster in JRA-55 data. The potential causes of the Arctic amplification may be linked to sea ice decline, changes in atmospheric and oceanic heat contents, or changes in atmospheric moisture transport (Graversen, 2006; Screen and Simmonds, 2010; Zhang et al., 2008). The Arctic warming is concentrated in the lower troposphere (Allan et al., 2022) and reached ∼ 0.74 K per decade after 1993, thus leading to increases in water vapor, as shown in Fig. 1a. Antarctic warming is at a rate of ∼ 0.24 K per decade over the past 64 years and consistently warming at ∼ 0.23 K per decade after 1993. In addition, the warmer and colder years are linked to the ENSO events and further cause the distinct turning points of TPW (Fig. 1). The datasets exhibit a clear consensus regarding the increased temperature of both land and ocean areas over the years. The land regions that were observed experienced greater warming at a rate exceeding 0.2 for T2 m compared to the oceans' warming, leading to a land-to-ocean warming ratio ranging from 1.8 to 2.3 (Fig. 4). The explained reasons for the land–ocean contrast in warming rates are the influence of temperature and humidity on the lapse rate, which results in a smaller reduction in the lapse rate over land areas compared to the ocean, leading to a greater warming effect on land surfaces than on ocean surfaces (Joshi et al., 2008). Additionally, the restriction of moisture in the land boundary layer directly contributes to an intensified warming of land surfaces, which, in turn, raises the lapse rate over land (Joshi et al., 2008). Byrne and O'Gorman (2018) further extended the theory of Joshi et al. (2008) in a quantitative way. They investigated the contrast of land–ocean warming from surface observations and model simulations at the global scale and indicated that amplified land temperature increases were the consequence of reduced relative humidity over land.
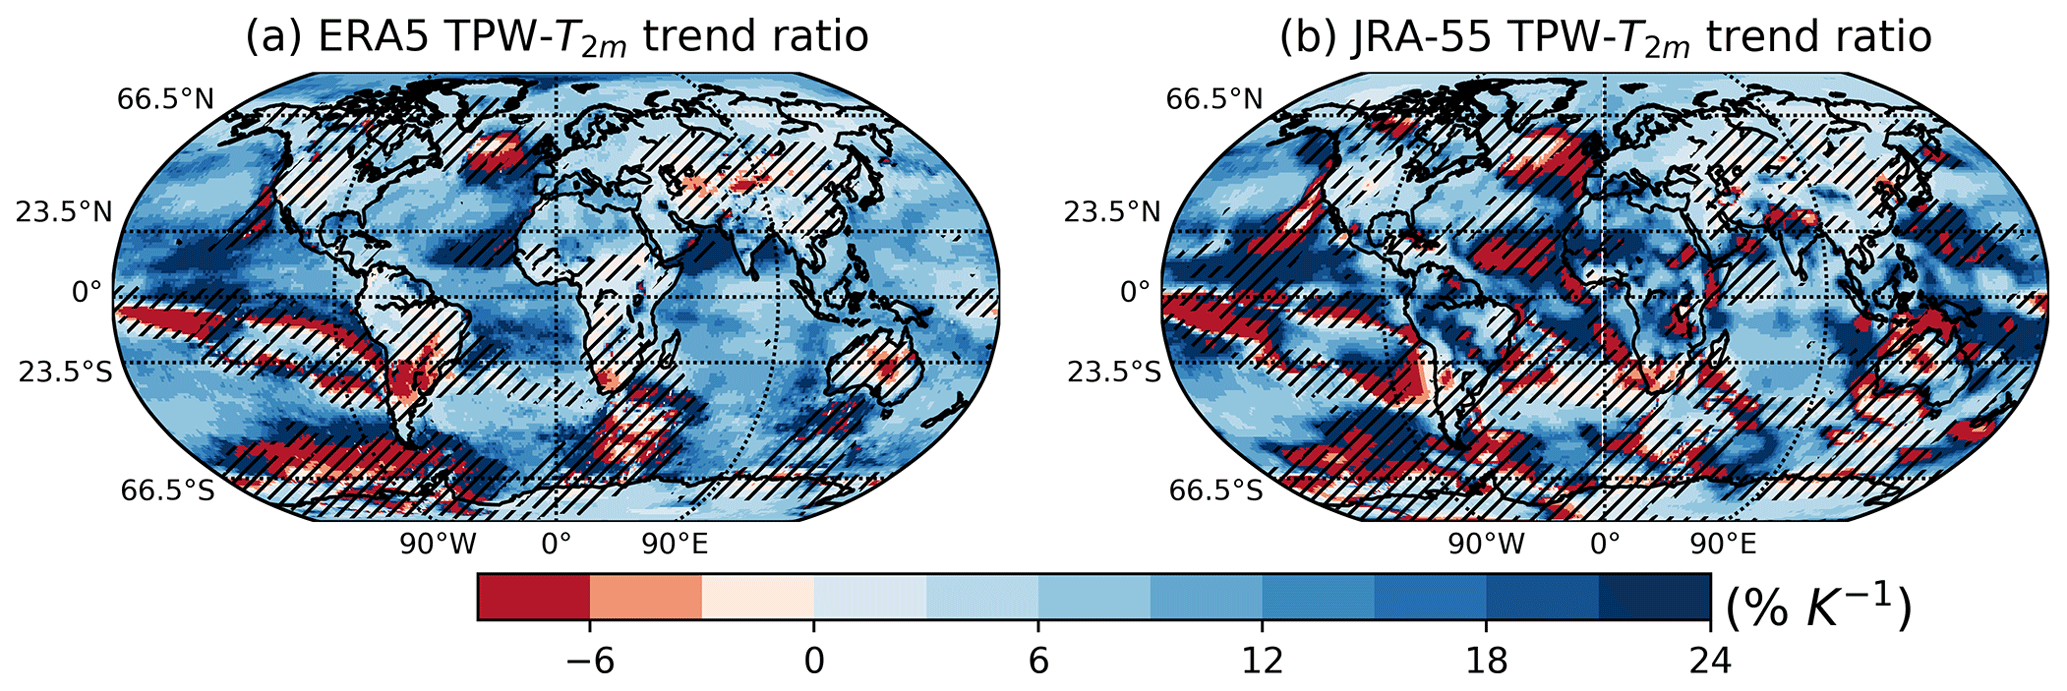
Figure 5(a) The ratio (% K−1) of the TPW trends and the surface air temperature (T2 m) trends from 1993 to 2021 in ERA5. (b) Same as (a) but for JRA-55. The hatched areas represent ratios that are not statistically significant at the 95 % confidence level.
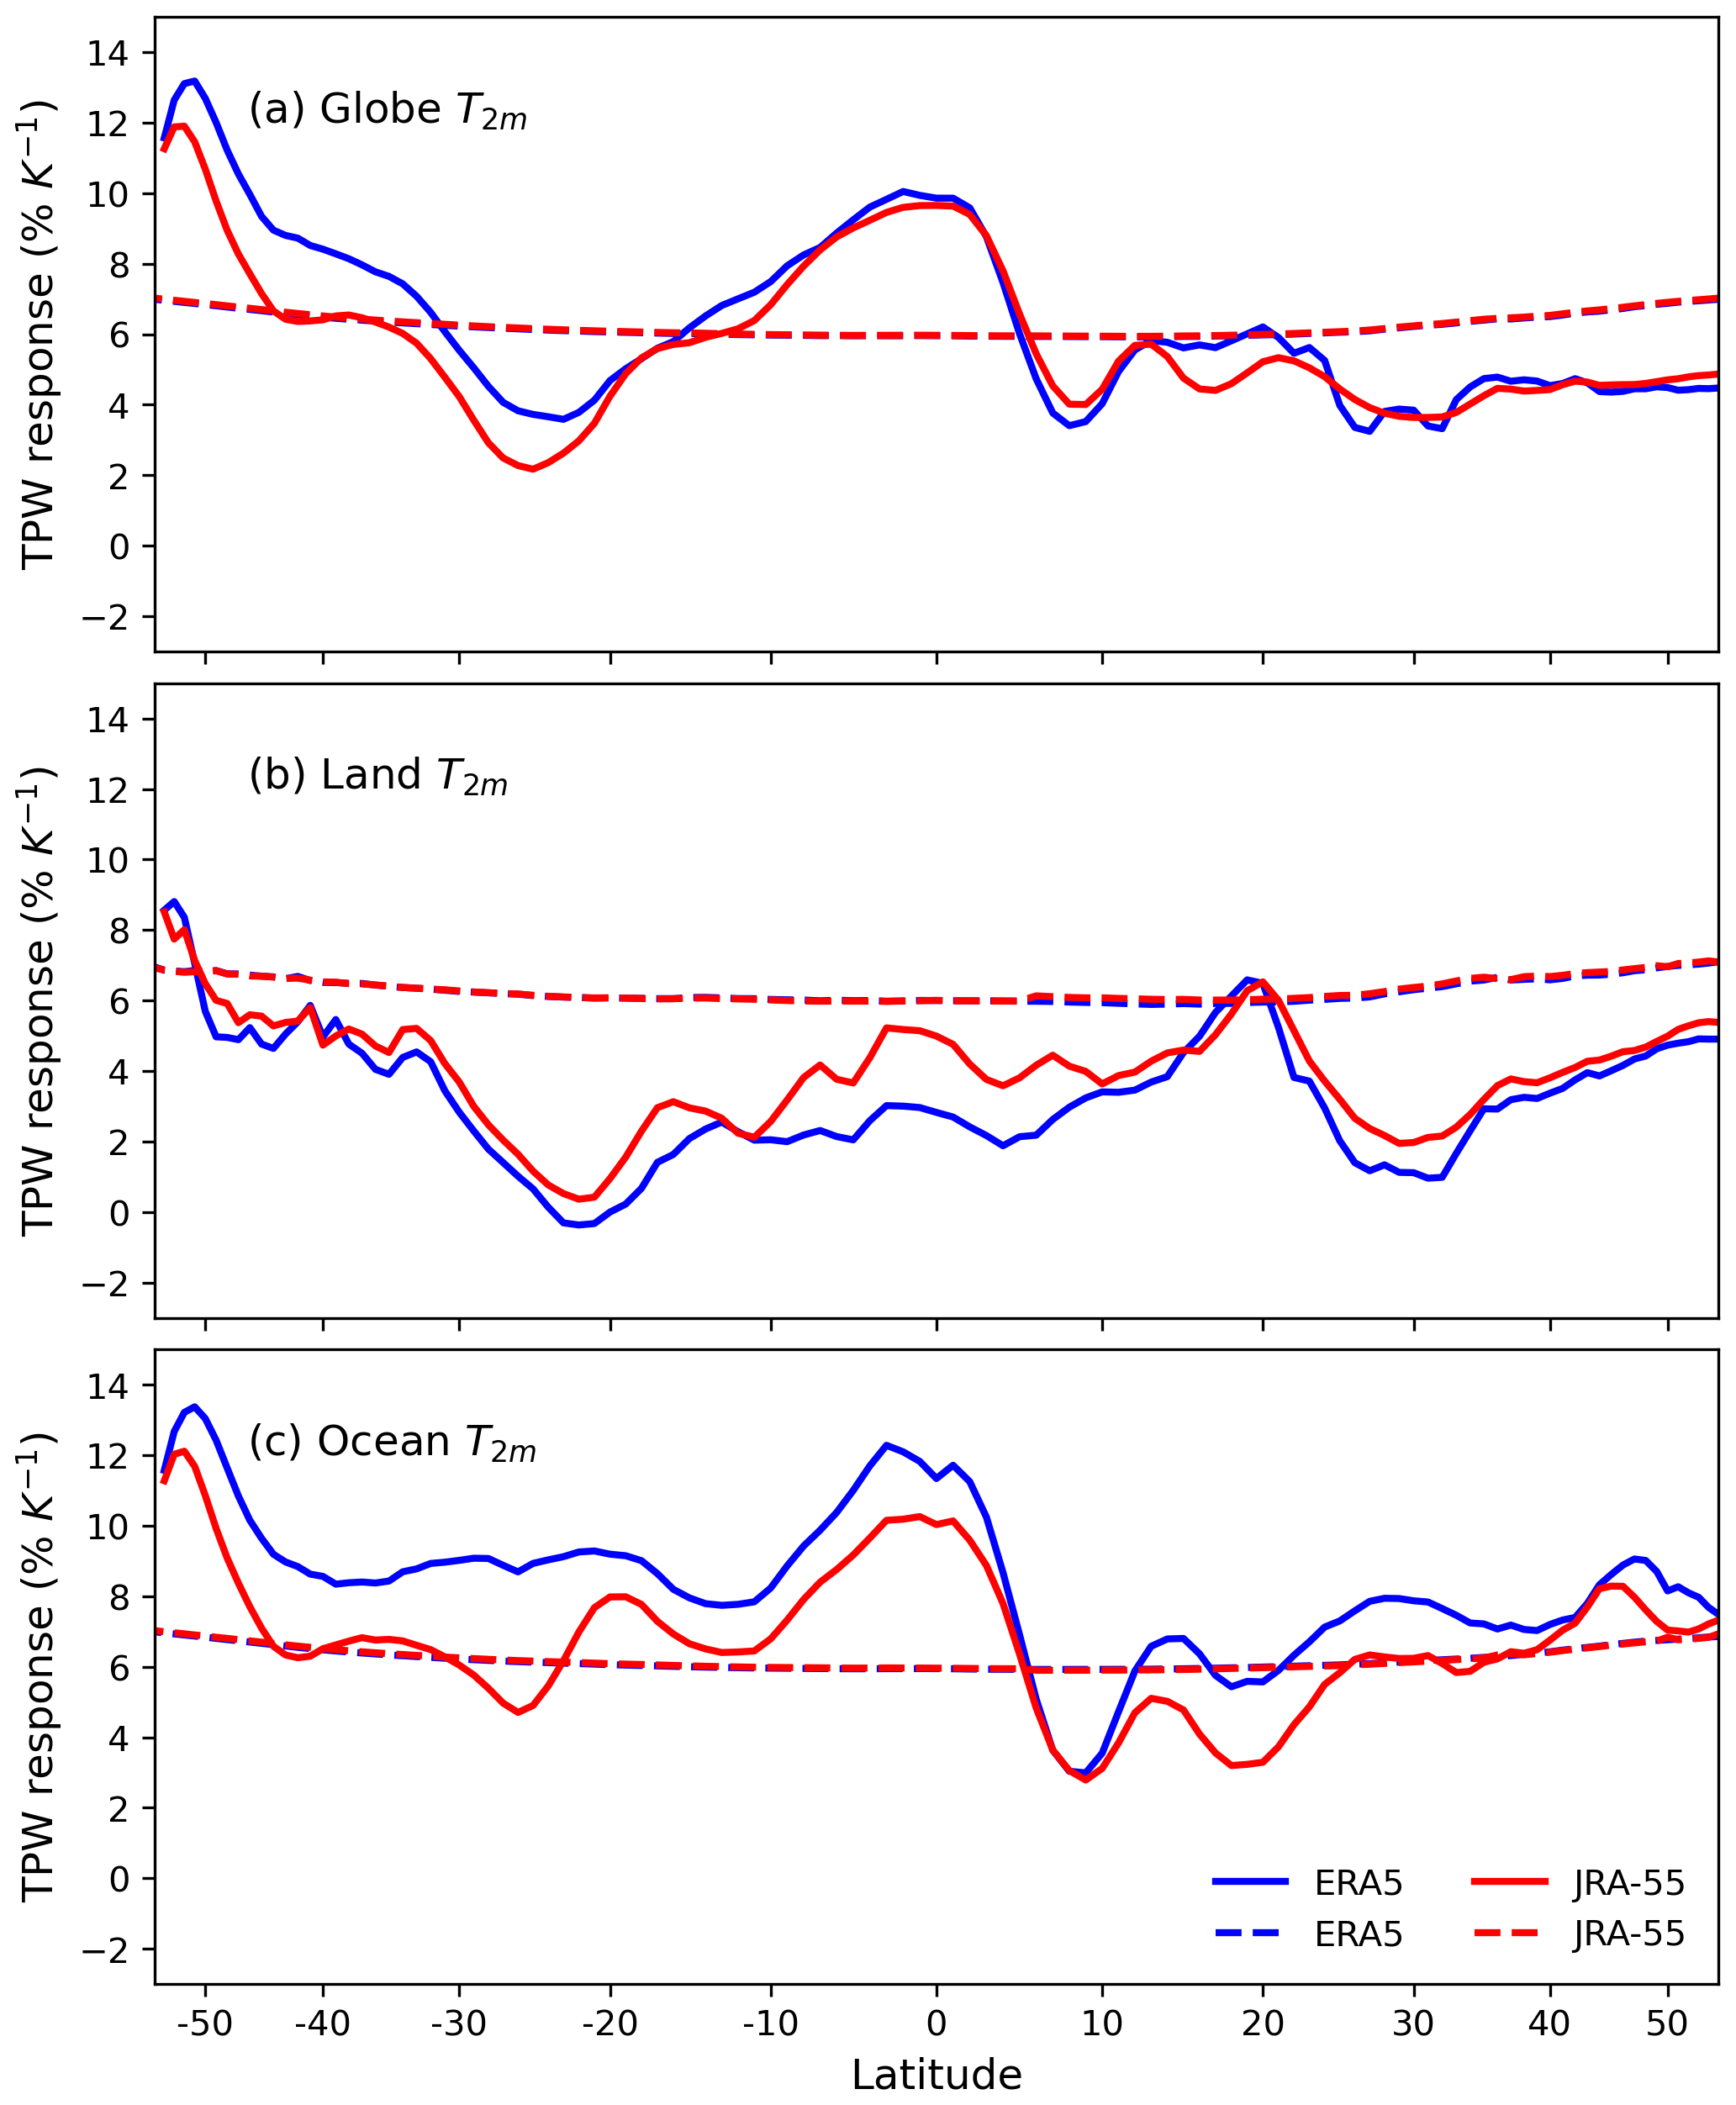
Figure 6The meridional means of change in TPW response to T2 m for ERA5 (blue) and JRA-55 (red) over (a) global, (b) land, and (c) ocean base using data from 1993 to 2021. The dashed lines represent the theoretically expected Clausius–Clapeyron response based on the climatological zonal mean temperature from the trend analysis.
3.3 TPW change response to temperature
TPW is expected to increase with air temperature by about 7 % K−1 if the relative humidity in the lower troposphere is constant, according to the Clausius–Clapeyron equation (Trenberth et al., 2005; O'Gorman and Muller, 2010). This relationship is determined by the ratio () of TPW trends to temperature trends from 1993 to 2021 (Fig. 5). The ratio shows a similar pattern but different magnitude between two reanalysis datasets. The TPW increases significantly by around 11.2 % (10.9 %), 5.8 % (9.4 %), and 9.5 % (8.9 %) K−1 for ocean, land, and the globe, respectively, for ERA5 (JRA-55). These rates are larger than 6 % K−1 at a global scale based on observational data from HadCRUT5 (Allan et al., 2022). A disagreement involving the TPW trend and the tropospheric temperature trend between observation and modeling simulation is also shown in Santer et al. (2009, 2021). The ratio increases significantly by around 6 % K−1 over eastern North America and Europe for both ERA5 and JRA-55 (Fig. 5). However, the relationship between TPW patterns and rising surface temperatures does not always follow the Clausius–Clapeyron equation, especially over some areas of Asia, central Africa, Australia, and South America, where TPW response to rising surface temperatures is negative without significance (Fig. 5). Regions with higher data density and homogeneity, such as North America and Europe, are likely to exhibit more realistic trends. Meanwhile, the shifts in wind patterns over regions can influence the local meteorological conditions over time, resulting in fluctuations in relative humidity, which in turn can cause deviations in water vapor changes from thermodynamic predictions. Negative occurs over the southern tropical oceans, where sea surface temperature increased (Fig. 3) but precipitable water decreased slightly (Fig. 1). Thus, the TPW change is contrary to what might be expected from the thermodynamic response to changes in temperature. Water vapor moves from one location to another through circulation, and the trend of vertical motion at 500 hPa could be further investigated to reveal the ascent and convective activity and its relationship to decreasing water vapor (Zveryaev and Allan, 2005).
In addition to the global patterns of spatial ratios, the ratio's latitude dependency is an interesting subject (Fig. 6) between 55° S and 55° N. Although the TPW response values show strong variations across latitudes, the ratios show a similar changing pattern over the globe and ocean, which varies across the theoretical Clausius–Clapeyron curves of ratios (Fig. 6a). The ratios are close to the Clausius–Clapeyron response curves in NH mid-latitudes to high latitudes over the ocean but larger than 6 % K−1 in the SH (−40 to −20° N band) over the ocean. Such strong latitude dependency and the discrepancy between land and ocean areas are associated with zonal relative humidity changes and possible amplification of surface warming over land relative to the ocean (O'Gorman and Muller, 2010) (Fig. 6c). In arid areas, due to a lack of water, warming does not result in increased water vapor. Conversely, water vapor changes could be amplified or suppressed in monsoon regions due to dynamics (Fasullo, 2012). Multiple other studies also confirm the “dry gets drier, and wet gets wetter” paradigm over land (Xiong et al., 2022). Likewise, an analysis of the salinity index in Cheng et al. (2024) showed that salty areas are getting saltier and fresh areas are getting fresher, while over the ocean wet areas are getting wetter and dry areas are getting drier. There are two stronger TPW response zones located in the southern mid-latitudes and in the tropical regions over the globe (Fig. 6a and c). This result is nearly the same when drawn from multiple models of climate simulations for both historical and projected climate scenarios (O'Gorman and Muller, 2010). For land areas, in addition to two stronger response zones similar to those of the globe and ocean, a local maximum was found in the subtropical areas of the NH and the SH (Fig. 6). The ratios for the land region are mainly lower than the theoretical ratio (around 7 % K−1), and these ratios are even negative in SH mid-latitudes where the arid and semi-arid regions are. Comparing these ratios between reanalyses, their discrepancies are greater over ocean, which probably contributes to their discrepancies over the globe (Fig. 6).
The reanalysis dataset combines various observations to create a coherent global dataset using an atmospheric general circulation model. It provides spatially coherent data that are consistent with global coverage, which makes it valuable for climate research (e.g., Allan et al., 2022; Urraca and Gobron, 2023). By assimilating multiple data sources and employing a physics-based model, reanalyses can effectively address uncertainties and minimize the presence of unrealistic values. However, it is worth mentioning that discontinuities in the time series may still occur in reanalysis datasets when satellites and conventional observations are transited, newly added, and removed during the assimilation process (Long et al., 2017). In order to get a general picture of discontinuities in the reanalysis data, we calculated the discontinuity from 1958 to 2021 for each grid box of temperature and TPW over the ocean, where there is a strong relationship between water vapor and temperature along with significantly increased trends (Figs. 1 and 3). We applied the PMF test to each grid of the reanalysis dataset and selected the significance level of 0.01 to detect discontinuities (Zhou et al., 2021). The years with detected discontinuities (after counting all change points within the same year) of both temperature and TPW are shown in Figs. S1 and S2 in the Supplement. Discontinuities for temperature are relatively frequent before 1980 in both reanalysis datasets (Fig. S1a and b) and are relatively less frequent after 1980 for ERA5 except for in 1992–1995, 1998, and 2015 when strong El Niño (1992, 1998, 2015) or La Niña (1995) events or the Mount Pinatubo eruption in June 1991 and volcanic eruptions in 1992 occurred (Fig. S1c). This reveals that the detected change points over the period 1990–2021 in ERA5 might be associated with the result of abrupt climate changes. Previous studies also demonstrated the reliability of ERA5 air temperature for the warming trend of the global ocean (He et al., 2023; Wang et al., 2019). For TPW, discontinuities show a pattern similar to that of the temperature in ERA5, in which water vapor before 1980 has relatively more discontinuities. In addition, change points are fewer after 1980 except for the largest discontinuity in 1991–1992 (Fig. S2a) in ERA5 and in 1996–1997 in JRA-55 (Fig. S2b). Trenberth et al. (2015) highlighted that the discontinuity and inaccurate values in 1992 are the result of changes in satellite instruments. A strong agreement between SSMIS observations and ERA5 is shown after 1993 (Allan et al., 2022), and fewer discontinuities are presented from 1993 to 2021 (Fig. S2a). Meanwhile, discontinuities in JRA-55 are larger and distributed in all decadal periods even in the years in which ENSO is inactive (Fig. S2b and c). Because TPW is highly dependent on temperatures and has a strong relationship with temperature over ocean, we further detected TPW discontinuities by comparing TPW and the expected TPW (TPWept), calculated from regression with temperature (Fig. S3), during 1981–2021, when temperature shows fewer change points (Fig. S1). The discrepancy points between TPW and TPWept are obvious over 1987, 1998, 1999, and 2015 in both analysis datasets, indicating the strong effect of ENSO events on the change in TPW. For ERA5, these discontinuities occurred in 1992 and 1995, when TPWept increased but TPW decreased (Fig. S2). The discontinuity in 1992 also existed in ERA-Interim (Trenberth et al., 2015). For JRA-55, discrepancy points occurred in 1984 and 1995. Due to lack of reliable observations before 1979, it is not recommended to use adjusted or statistically homogenized time series for trend analysis without metadata confirmation (e.g., the homogenized observations) (Wang and Feng, 2013). Although several discontinuities are detected in years after 1993 for TPW (Fig. S2), a strong agreement of TPW between ERA5 and SSMIS satellite observations might indicate reliable TPW trends (Allan et al., 2022). For the surface temperatures, most of the discontinuities occur before the satellite era; therefore the long-term trend analysis for temperatures in reanalysis datasets after 1979 should be more reliable, and removing the effect of discontinuities located in the pre-satellite period on longer-term trends needs further investigation. In terms of the temperature discontinuity identified (Fig. S1), the longer temperature trends should be more reliable using the datasets of surface observation networks (Pielke et al., 2007).
The RHARM radiosonde observations (Madonna et al., 2022), which are mostly located in the NH land areas and available from 1979–2019, are completely independent of reanalysis data in terms of calculating and adjusting temperature and humidity. Compared with TPW trends from reanalysis data, moistening TPW trends in the NH polar region and Asia show the best agreement with radiosondes with more than 90 % and 60 %, respectively, of stations' trend differences within ± 0.2 mm per decade (Fig. S6 in the Supplement). In addition, TPW trend differences are within ± 0.2 mm per decade at more than 54 % of stations in Europe and North America (Fig. S6). Moistening TPW trends in western Europe and South Asia and drying TPW trends in western North America are consistent with the results from both reanalysis data and GPS observations (Parracho et al., 2018). Overall, ERA5 and JRA-55 show good agreement with observations at regional scales. Specifically, TPW shows better agreement in North America and the NH polar region.
After evaluating the reanalysis data with radiosonde observations on land, water vapor data from the AIRS and SSMIS satellites are used to evaluate the accuracy of reanalysis over oceanic regions from 2003 to 2021 (Fig. S7 in the Supplement). Except for the drying trends of the northern Atlantic Ocean in the short-term period, the spatial drying trend patterns in the two reanalysis datasets are similar to the long-term trends (Fig. 2) although they are not statistically significant. The surface air over tropical oceans increased in water vapor at a rate of 1.6 % per decade for ERA5 and 1.9 % per decade for JRA-55 on average with a similar moistening rate shown in SSMIS (1.1 % per decade) but not in AIRS data (0.05 % per decade) since 2003. These results are consistent with Allan et al. (2022). The good agreement between the reanalyses and SSMIS observations is likely attributed to the assimilation of all-sky radiances collected by the SSMIS satellite into the ERA5 and JRA-55 datasets (Hersbach et al., 2020; Kobayashi et al., 2015). Although radiance measurement from AIRS is introduced in ERA5 but not in JRA-55 (Hersbach et al., 2020; Kobayashi et al., 2015), the TPW from AIRS does not produce a strong global moistening and disagrees with reanalysis data, SSMIS microwave data, climate models, and GPS (Allan et al., 2022; Douville et al., 2022).
Atmospheric reanalyses are widely used in the assessment of global climate change, and their accuracy has advanced in recent years. Our study, bolstered by the latest ERA5 and JRA-55 reanalysis datasets, presents notable trends in the total precipitable water (TPW), surface temperature (Ts), and 2 m temperature (T2 m) from 1993 to 2021. Beginning with TPW anomalies, a rise in moisture in response to global warming occurred from 1958–2021. However, due to data discontinuities in reanalysis data before 1993, more dependable trends have been identified. After 1993, a moistening trend is observed at rates of 1.72 % (ERA5) and 1.19 % (JRA-55) per decade over oceans, 1.21 % (ERA5) and 2.23 % (JRA-55) per decade over land, and 2.12 % (ERA5) and 1.90 % (JRA-55) per decade globally. The period 1993–2021 begins with a cooler, drier year after the eruption of Mount Pinatubo in 1991 (Soden et al., 2002); however, this event did not significantly affect the long-term trend. When considering regional TPW trends, we identified statistically significant moistening trends over North Africa, Europe, and polar regions in the Northern Hemisphere since 1993. These findings, which are in concert with prior studies (Borger et al., 2022; Trenberth et al., 2005; Wang et al., 2016), point to the solitary exception of the southern Pacific Ocean, where TPW trends registered as negative. The observed warming pattern is unlike coupled simulation, with warming more prominent in the tropical warm pool, which can increase stability in these subtropical subsidence regions (Andrews et al., 2022). Reanalysis TPW showed agreement with SSMIS satellite observations and radiosonde observations over North America after 1979 but not with AIRS measurements.
Building upon the analysis of TPW, our study further explored the temperature trends based on T2 m and Ts from ERA5 and JRA-55. Despite a general global warming trend (∼ 0.15 K per decade), certain areas of the Southern Hemisphere and the northern Atlantic Ocean have demonstrated cooling since 1958. Terrestrial regions displayed a faster warming rate compared to oceanic regions, with a ratio of roughly 2 : 1, corroborating findings from Swaminathan et al. (2022). Arctic warming was particularly pronounced, registering 3 times the global average during 1958–2021 and escalating to around 4 times from 1979 to 2021 and around 6.5 % K−1 of water vapor response to temperature. While Antarctic warming was more modest at 0.2 K per decade over the past 64 years, a sharp increase to over 0.6 K per decade was observed after 1980.
Last, we examined the TPW response to surface temperature changes, noting deviations from the Clausius–Clapeyron relation. In the ERA5 dataset, we identified TPW increases of around 11.2 % K−1, 5.8 % K−1, and 9.5 % K−1 for ocean, land, and globe, respectively, after 1993. These increased rates were higher in the JRA-55 dataset, with values at 10.9 % K−1, 9.4 % K−1, and 8.9 % K−1, respectively. Importantly, these response ratios were not uniform globally, presenting a variation between 6 % K−1 and 8 % K−1 between latitudes 15–55° N and increasing toward southern high latitudes over oceans. The most substantial ratios for deviations in TPW responses were discovered in the southern high latitudes across land, ocean, and the globe. Because of the importance of atmospheric water vapor in the global energy balance and hydrological cycle, it has received much attention in recent years (this study; Trent et al., 2023; Douville and Willett, 2022; Patel and Kuttippurath, 2023; Shao et al., 2023; Ding et al., 2022). In the near future, results from these studies need to be synthesized to further quantify atmospheric water vapor, its relationship with surface temperature, and associated uncertainties. These results can then be used to better evaluate climate models and constrain these models' future projections.
All data used for this study are freely available. The ERA5 dataset is openly available from ECMWF: https://doi.org/10.24381/cds.6860a573 (Hersbach et al., 2023). The JRA-55 dataset is available from https://doi.org/10.5065/D6HH6H41 (Japan Meteorological Agency, 2013). The AIRS satellite data are from https://doi.org/10.5067/Aqua/AIRS/DATA303 (AIRS Science Team and Teixeira, 2013). The SSMIS satellite data are from https://www.remss.com/missions/ssmi (Wentz et al., 2015). The Radiosounding HARMonization dataset is from https://doi.org/10.7289/V5X63K0Q (Durre et al., 2016).
The supplement related to this article is available online at: https://doi.org/10.5194/hess-28-2123-2024-supplement.
NW performed the analysis of the results and the visualization. XL was responsible for the funding acquisition. The original manuscript was written by NW and revised by XL, RAP Sr., XZ, and AMN.
The contact author has declared that none of the authors has any competing interests.
Publisher's note: Copernicus Publications remains neutral with regard to jurisdictional claims made in the text, published maps, institutional affiliations, or any other geographical representation in this paper. While Copernicus Publications makes every effort to include appropriate place names, the final responsibility lies with the authors.
We thank Ryan Maue for inspiring this study and Dallas Staley and Stephen Watson for editing and finalizing the paper.
This study was supported in part by the US Department of Agriculture's Agricultural Research Service (A22-0103-001) and the National Science Foundation (grant no. FAIN:2345039). The contribution number of this paper is 23-057-J.
This paper was edited by Rohini Kumar and reviewed by Richard Allan and Kevin Trenberth.
AIRS Science Team and Teixeira, J.: AIRS/Aqua L3 Daily Standard Physical Retrieval (AIRS-only) 1 degree × 1 degree V006, Greenbelt, MD, USA, Goddard Earth Sciences Data and Information Services Center (GES DISC) [data set], https://doi.org/10.5067/Aqua/AIRS/DATA303, 2013.
Allan, D. and Allan, R. P.: Seasonal Changes in the North Atlantic Cold Anomaly: The influence of cold surface waters from coastal greenland and warming trends associated with variations in subarctic sea ice cover, J. Geophys. Res.-Oceans, 124, 9040–9052, https://doi.org/10.1029/2019JC015379, 2020.
Allan, R. P., Liu, C., Zahn, M., Lavers, D. A., Koukouvagias, E., and Bodas-Salcedo, A.: Physically consistent responses of the global atmospheric hydrological cycle in models and observations, Surv. Geophys., 35, 533–552, https://doi.org/10.1007/s10712-012-9213-z, 2014.
Allan, R. P., Willett, K. M., John, V. O., and Trent, T.: Global changes in water vapor 1979–2020, J. Geophys. Res., 127, e2022JD036728, https://doi.org/10.1029/2022JD036728, 2022.
Alshawaf, F., Balidakis, K., Dick, G., Heise, S., and Wickert, J.: Estimating trends in atmospheric water vapor and temperature time series over Germany, Atmos. Meas. Tech., 10, 3117–3132, https://doi.org/10.5194/amt-10-3117-2017, 2017.
Andrews, T., Bodas-Salcedo, A., Gregory, J. M., Dong, Y., Armour, K. C., Paynter, D., Lin, P., Modak, A., Mauritsen, T., Cole, J. N. S., Medeiros, B., Benedict, J. J., Douville, H., Roehrig, R., Koshiro, T., Kawai, H., Ogura, T., Dufresne, J.-L., Allan, R. P., and Liu, C.: On the effect of historical SST patterns on radiative feedback, J. Geophys. Res.-Atmos., 127, e2022JD036675, https://doi.org/10.1029/2022JD036675, 2022.
Bock, O.: Global GNSS integrated water vapour data, 1994–2021, AERIS [data set], https://en.aeris-data.fr/landing-page/?uuid=df7cf172-31fb-4d17-8f00-1a9293eb3b95 (last access: 13 May 2024), 2022.
Borger, C., Beirle, S., and Wagner, T.: Analysis of global trends of total column water vapour from multiple years of OMI observations, Atmos. Chem. Phys., 22, 10603–10621, https://doi.org/10.5194/acp-22-10603-2022, 2022.
Byrne, M. P. and O'Gorman, P. A.: Trends in continental temperature and humidity directly linked to ocean warming, Natl. Acad. Sci. U. S. A., 115, 4863–4868, https://doi.org/10.1073/pnas.1722312115, 2018.
Chen, B. and Liu, Z.: Global water vapor variability and trend from the latest 36 year (1979 to 2014) data of ECMWF and NCEP reanalyses, radiosonde, GPS, and microwave satellite, J. Geophys. Res., 121, 11,442-11,462, https://doi.org/10.1002/2016JD024917, 2016.
Cheng, L., Abraham, J., Trenberth, K. E., Boyer, T., Mann, M. E., Zhu, J., Wang, F., Yu, F., Locarnini, R., Fasullo, J., Zheng, F., Li, Y., Zhang, B., Wan, L., Chen, X., Wang, D., Feng, L., Song, X., Liu, Y., Reseghetti, F., Simoncelli, S., Gouretski, V., Chen, G., Mishonov, A., Reagan, J., Von Schuckmann, K., Pan, Y., Tan, Z., Zhu, Y., Wei, W., Li, G., Ren, Q., Cao, L., and Lu, Y.: New record ocean temperatures and related climate indicators in 2023, Adv. Atmos. Sci., 2024, 1–15, https://doi.org/10.1007/s00376-024-3378-5, 2024.
Clem, K. R., Fogt, R. L., Turner, J., Lintner, B. R., Marshall, G. J., Miller, J. R., and Renwick, J. A.: Record warming at the South Pole during the past three decades, Nat. Clim. Change, 10, 762–770, https://doi.org/10.1038/s41558-020-0815-z, 2020.
Dai, A., Wang, J., Thorne, P. W., Parker, D. E., Haimberger, L., and Wang, X. L.: A new approach to homogenize daily radiosonde humidity data, J. Climate, 24, 965–991, 2011.
Dee, D., Uppala, S., Simmons, A., Berrisford, P., Poli, P., Kobayashi, S., Andrae, U., Balmaseda, M., Balsamo, G., and Bauer, D. P.: The ERA-Interim reanalysis: Configuration and performance of the data assimilation system, Q. J. Roy. Meteor. Soc., 137, 553–597, 2011.
Ding, J., Chen, J., and Tang, W.: Increasing trend of precipitable water vapor in Antarctica and Greenland, in: China Satellite Navigation Conference (CSNC 2022) Proceedings, 7 May 2022, Singapore, 286–296, https://doi.org/10.1007/978-981-19-2588-7_27, 2022.
Dong, B. and Dai, A.: The influence of the Interdecadal Pacific Oscillation on temperature and precipitation over the globe, Clim. Dynam., 45, 2667–2681, https://doi.org/10.1007/s00382-015-2500-x, 2015.
Douville, H. and Willett, K. M.: A drier than expected future, supported by near-surface relative humidity observations, Sci. Adv., 9, eade6253, https://doi.org/10.1126/sciadv.ade6253, 2022.
Douville, H., Qasmi, S., Ribes, A., and Bock, O.: Global warming at near-constant tropospheric relative humidity is supported by observations, Commun. Earth Environ., 3, 1–7, https://doi.org/10.1038/s43247-022-00561-z, 2022.
Drijfhout, S., Oldenborgh, G. J. van, and Cimatoribus, A.: Is a decline of AMOC causing the warming hole above the North Atlantic in observed and modeled warming patterns?, J. Climate, 25, 8373–8379, https://doi.org/10.1175/JCLI-D-12-00490.1, 2012.
Dunning, C. M., Black, E. C. L., and Allan, R. P.: The onset and cessation of seasonal rainfall over Africa, J. Geophys. Res., 121, 11, 405–11, 424, https://doi.org/10.1002/2016JD025428, 2016.
Durre, I., Xungang, Y., Vose, R. S., Applequist, S., and Arnfield, J.: Integrated Global Radiosonde Archive (IGRA), Version 2, NOAA National Centers for Environmental Information [data set], https://doi.org/10.7289/V5X63K0Q, 2016.
Fasullo, J.: A mechanism for land–ocean contrasts in global monsoon trends in a warming climate, Clim. Dynam., 39, 1137–1147, https://doi.org/10.1007/s00382-011-1270-3, 2012.
Garfinkel, C. I., Gordon, A., Oman, L. D., Li, F., Davis, S., and Pawson, S.: Nonlinear response of tropical lower-stratospheric temperature and water vapor to ENSO, Atmos. Chem. Phys., 18, 4597–4615, https://doi.org/10.5194/acp-18-4597-2018, 2018.
Graversen, R. G.: Do changes in the midlatitude circulation have any impact on the Arctic surface air temperature trend?, J. Climate, 19, 5422–5438, 2006.
Gulev, S. K., Thorne, P. W., Ahn, J., Dentener, F. J., Domingues, C. M., Gerland, S., Gong, D., Kaufman, D. S., Nnamchi, H. C., Quaas, J., Rivera, J. A., Sathyendranath, S., Smith, S. L., Trewin, B., von Schuckmann, K., and Vose, R. S.: Changing state of the climate system, in: Climate Change 2021: The Physical Science Basis. Contribution of Working Group I to the Sixth Assessment Report of the Intergovernmental Panel on Climate Change, edited by: Masson-Delmotte, V., Zhai, P., Pirani, A., Connors, S. L., Péan, C., Berger, S., Caud, N., Chen, Y., Goldfarb, L., Gomis, M. I., Huang, M., Leitzell, K., Lonnoy, E., Matthews, J. B. R., Maycock, T. K., Waterfield, T., Yelekçi, O., Yu, R., and Zhou, B., Cambridge University Press, Cambridge, United Kingdom and New York, NY, USA, 287–422, https://doi.org/10.1017/9781009157896.004, 2021.
He, C., Clement, A. C., Cane, M. A., Murphy, L. N., Klavans, J. M., and Fenske, T. M.: A north atlantic warming hole without ocean circulation, Geophys. Res. Lett., 49, e2022GL100420, https://doi.org/10.1029/2022GL100420, 2022.
He, M., Qin, J., Lu, N., and Yao, L.: Assessment of ERA5 near-surface air temperatures over global oceans by combining MODIS sea surface temperature products and in situ observations, IEEE J. Sel. Top. Appl., 16, 8442–8455, https://doi.org/10.1109/JSTARS.2023.3312810, 2023.
Held, I. M. and Soden, B. J.: Robust responses of the hydrological cycle to global warming, J. Climate, 19, 5686–5699, https://doi.org/10.1175/JCLI3990.1, 2006.
Hersbach, H., Bell, B., Berrisford, P., Hirahara, S., Horányi, A., Muñoz-Sabater, J., Nicolas, J., Peubey, C., Radu, R., Schepers, D., Simmons, A., Soci, C., Abdalla, S., Abellan, X., Balsamo, G., Bechtold, P., Biavati, G., Bidlot, J., Bonavita, M., De Chiara, G., Dahlgren, P., Dee, D., Diamantakis, M., Dragani, R., Flemming, J., Forbes, R., Fuentes, M., Geer, A., Haimberger, L., Healy, S., Hogan, R. J., Hólm, E., Janisková, M., Keeley, S., Laloyaux, P., Lopez, P., Lupu, C., Radnoti, G., de Rosnay, P., Rozum, I., Vamborg, F., Villaume, S., and Thépaut, J.-N.: The ERA5 global reanalysis, Q. J. Roy. Meteor. Soc., 146, 1999–2049, https://doi.org/10.1002/qj.3803, 2020.
Hersbach, H., Bell, B., Berrisford, P., Biavati, G., Horányi, A., Muñoz Sabater, J., Nicolas, J., Peubey, C., Radu, R., Rozum, I., Schepers, D., Simmons, A., Soci, C., Dee, D., and Thépaut, J.-N: ERA5 monthly averaged data on pressure levels from 1940 to present, Copernicus Climate Change Service (C3S) Climate Data Store (CDS) [data set], https://doi.org/10.24381/cds.6860a573, 2023.
Hirsch, R. M., Slack, J. R., and Smith, R. A.: Techniques of trend analysis for monthly water quality data, Water Resour. Res., 18, 107–121, 1982.
Japan Meteorological Agency: Updated monthly. JRA-55: Japanese 55-year Reanalysis, Daily 3-Hourly and 6-Hourly Data, Research Data Archive at the National Center for Atmospheric Research, Computational and Information Systems Laboratory [data set], https://doi.org/10.5065/D6HH6H41, 2013.
Jin, M. and Dickinson, R. E.: Land surface skin temperature climatology: benefitting from the strengths of satellite observations, Environ. Res. Lett., 5, 044004, https://doi.org/10.1088/1748-9326/5/4/044004, 2010.
Jin, M., Dickinson, R. E., and Vogelmann, A. M.: A Comparison of CCM2–BATS Skin Temperature and surface-air temperature with satellite and surface observations, J. Climate, 10, 1505–1524, https://doi.org/10.1175/1520-0442(1997)010<1505:ACOCBS>2.0.CO;2, 1997.
Joshi, M. M., Gregory, J. M., Webb, M. J., Sexton, D. M. H., and Johns, T. C.: Mechanisms for the land/sea warming contrast exhibited by simulations of climate change, Clim. Dynam., 30, 455–465, https://doi.org/10.1007/s00382-007-0306-1, 2008.
Kobayashi, S., Ota, Y., Harada, Y., Ebita, A., Moriya, M., Onoda, H., Onogi, K., Kamahori, H., Kobayashi, C., Endo, H., Miyaoka, K., and Takahashi, K.: The JRA-55 reanalysis: general specifications and basic characteristics, J. Meteorol. Soc. Jpn., 93, 5–48, https://doi.org/10.2151/jmsj.2015-001, 2015.
Lacis, A. A., Schmidt, G. A., Rind, D., and Ruedy, R. A.: Atmospheric CO2: Principal control knob governing Earth's temperature, Science, 330, 356–359, 2010.
Li, L., Lozier, M. S., and Li, F.: Century-long cooling trend in subpolar North Atlantic forced by atmosphere: an alternative explanation, Clim. Dynam., 58, 2249–2267, https://doi.org/10.1007/s00382-021-06003-4, 2022.
Long, C. S., Fujiwara, M., Davis, S., Mitchell, D. M., and Wright, C. J.: Climatology and interannual variability of dynamic variables in multiple reanalyses evaluated by the SPARC Reanalysis Intercomparison Project (S-RIP), Atmos. Chem. Phys., 17, 14593–14629, https://doi.org/10.5194/acp-17-14593-2017, 2017.
Madonna, F., Tramutola, E., Sy, S., Serva, F., Proto, M., Rosoldi, M., Gagliardi, S., Amato, F., Marra, F., Fassò, A., Gardiner, T., and Thorne, P. W.: The new Radiosounding HARMonization (RHARM) data set of homogenized radiosounding temperature, humidity, and wind profiles with uncertainties, J. Geophys. Res., 127, e2021JD035220, https://doi.org/10.1029/2021JD035220, 2022.
Masson-Delmotte, V., Zhai, P., Pörtner, H. O., Roberts, D., Skea, J., and Shukla, P. R.: Global Warming of 1.5 °C: IPCC Special Report on impacts of global warming of 1.5 °C above pre-industrial levels in context of strengthening response to climate change, Sustainable Development, and Efforts to Eradicate Poverty, Cambridge University Press, ISBN 9781009157940, 2022.
Morice, C. P., Kennedy, J. J., Rayner, N. A., Winn, J. P., Hogan, E., Killick, R. E., Dunn, R. J. H., Osborn, T. J., Jones, P. D., and Simpson, I. R.: An updated assessment of near-surface temperature change From 1850: The HadCRUT5 data set, J. Geophys. Res., 126, e2019JD032361, https://doi.org/10.1029/2019JD032361, 2021.
O'Gorman, P. A. and Muller, C. J.: How closely do changes in surface and column water vapor follow Clausius–Clapeyron scaling in climate change simulations?, Environ. Res. Lett., 5, 025207, https://doi.org/10.1088/1748-9326/5/2/025207, 2010.
Parracho, A. C., Bock, O., and Bastin, S.: Global IWV trends and variability in atmospheric reanalyses and GPS observations, Atmos. Chem. Phys., 18, 16213–16237, https://doi.org/10.5194/acp-18-16213-2018, 2018.
Patel, V. K. and Kuttippurath, J.: Increase in iropospheric water vapor amplifies global warming and climate change, Ocean-Land-Atmosphere Research, 2, 0015, https://doi.org/10.34133/olar.0015, 2023.
Pielke, R., Nielsen-Gammon, J., Davey, C., Angel, J., Bliss, O., Doesken, N., Cai, M., Fall, S., Niyogi, D., Gallo, K., and Hale, R.: Documentation of uncertainties and biases associated with surface temperature measurement sites for climate change assessment, B. Am. Meteorol. Soc., 88, 913–928, https://doi.org/10.1175/BAMS-88-6-913, 2007.
Rantanen, M., Karpechko, A. Y., Lipponen, A., Nordling, K., Hyvärinen, O., Ruosteenoja, K., Vihma, T., and Laaksonen, A.: The Arctic has warmed nearly four times faster than the globe since 1979, Commun. Earth Environ., 3, 1–10, https://doi.org/10.1038/s43247-022-00498-3, 2022.
Rayner, N. A., Parker, D. E., Horton, E. B., Folland, C. K., Alexander, L. V., Rowell, D. P., Kent, E. C., and Kaplan, A.: Global analyses of sea surface temperature, sea ice, and night marine air temperature since the late nineteenth century, J. Geophys. Res., 108, 4407, https://doi.org/10.1029/2002JD002670, 2003.
Ruckstuhl, C., Philipona, R., Morland, J., and Ohmura, A.: Observed relationship between surface specific humidity, integrated water vapor, and longwave downward radiation at different altitudes, J. Geophys. Res.-Atmos., 112, D03302, https://doi.org/10.1029/2006JD007850, 2007.
Santer, B. D., Wigley, T. M. L., Gleckler, P. J., Bonfils, C., Wehner, M. F., AchutaRao, K., Barnett, T. P., Boyle, J. S., Bruggemann, W., Fiorino, M., and Gillett, N.: Causes of ocean surface temperature changes in Atlantic and Pacific tropical cyclogenesis regions, P. Natl. Acad. Sci. USA, 103, 13905–13910, 2006.
Santer, B. D., Taylor, K. E., Gleckler, P. J., Bonfils, C., Barnett, T. P., Pierce, D. W., Wigley, T. M. L., Mears, C., Wentz, F. J., Brüggemann, W., Gillett, N. P., Klein, S. A., Solomon, S., Stott, P. A., and Wehner, M. F.: Incorporating model quality information in climate change detection and attribution studies, P. Natl. Acad. Sci. USA, 106, 14778–14783, https://doi.org/10.1073/pnas.0901736106, 2009.
Santer, B. D., Po-Chedley, S., Mears, C., Fyfe, J. C., Gillett, N., Fu, Q., Painter, J. F., Solomon, S., Steiner, A. K., Wentz, F. J., Zelinka, M. D., and Zou, C.-Z.: Using climate model simulations to constrain observations, J. Climate, 34, 6281–6301, https://doi.org/10.1175/JCLI-D-20-0768.1, 2021.
Schröder, M., Lockhoff, M., Forsythe, J. M., Cronk, H. Q., Haar, T. H. V., and Bennartz, R.: The GEWEX water vapor assessment: results from intercomparison, trend, and homogeneity analysis of total column water vapor, J. Appl. Meteorol. Clim., 55, 1633–1649, https://doi.org/10.1175/JAMC-D-15-0304.1, 2016.
Screen, J. A. and Simmonds, I.: The central role of diminishing sea ice in recent Arctic temperature amplification, Nature, 464, 1334–1337, 2010.
Sen, P. K.: Estimates of the regression coefficient based on Kendall's tau, J. Am. Stat. Assoc., 63, 1379–1389, 1968.
Shao, X., Ho, S.-P., Jing, X., Zhou, X., Chen, Y., Liu, T.-C., Zhang, B., and Dong, J.: Characterizing the tropospheric water vapor spatial variation and trend using 2007–2018 COSMIC radio occultation and ECMWF reanalysis data, Atmos. Chem. Phys., 23, 14187–14218, https://doi.org/10.5194/acp-23-14187-2023, 2023.
Soden, B. J., Wetherald, R. T., Stenchikov, G. L., and Robock, A.: Global Cooling After the Eruption of Mount Pinatubo: A Test of Climate Feedback by Water Vapor, Science, 296, 727–730, https://doi.org/10.1126/science.296.5568.727, 2002.
Simmons, A. J., Berrisford, P., Dee, D. P., Hersbach, H., Hirahara, S., and Thépaut, J. N.: A reassessment of temperature variations and trends from global reanalyses and monthly surface climatological datasets, Q. J. Roy. Meteor. Soc., 143, 101–119, https://doi.org/10.1002/qj.2949, 2017.
Simpson, I. R., McKinnon, K. A., Kennedy, D., Lawrence, D. M., Lehner, F., and Seager, R.: Observed humidity trends in dry regions contradict climate models, P. Natl. Acad. Sci. USA, 121, e2302480120, https://doi.org/10.1073/pnas.2302480120, 2023.
Swaminathan, R., Parker, R. J., Jones, C. G., Allan, R. P., Quaife, T., Kelley, D. I., Mora, L. de, and Walton, J.: The physical climate at global warming thresholds as seen in the U. K. Earth System Model, J. Climate, 35, 29–48, https://doi.org/10.1175/JCLI-D-21-0234.1, 2022.
Taszarek, M., Pilguj, N., Allen, J. T., Gensini, V., Brooks, H. E., and Szuster, P.: Comparison of convective parameters derived from ERA5 and MERRA-2 with rawinsonde data over Europe and North America, J. Climate, 34, 3211–3237, https://doi.org/10.1175/JCLI-D-20-0484.1, 2021.
Theil, H.: A rank-invariant method of linear and polynomial regression analysis, in: Henri Theil's contributions to economics and econometrics, Springer, 345–381, https://doi.org/10.1007/978-94-011-2546-8, 1992.
Tian, B., Manning, E., Roman, J., Thrastarson, H., Fetzer, E., and Monarrez, R.: AIRS version 7 level 3 product user guide, Jet Propulsion Laboratory, California Institute of Technology, https://airs.jpl.nasa.gov/data/products/v7-L2-L3/(last access: 3 June 2021), 2020.
Trenberth, K. E.: Atmospheric moisture residence times and cycling: implications for rainfall rates and climate change, Climatic Change, 39, 667–694, https://doi.org/10.1023/A:1005319109110, 1998.
Trenberth, K. E., Dai, A., Rasmussen, R. M., and Parsons, D. B.: The changing character of precipitation, B. Am. Meterol. Soc., 84, 1205–1218, https://doi.org/10.1175/BAMS-84-9-1205, 2003.
Trenberth, K. E., Fasullo, J., and Smith, L.: Trends and variability in column-integrated atmospheric water vapor, Clim. Dynam., 24, 741–758, https://doi.org/10.1007/s00382-005-0017-4, 2005.
Trenberth, K. E., Fasullo, J. T., and Mackaro, J.: Atmospheric moisture transports from ocean to land and global energy flows in reanalyses, J. Climate, 24, 4907–4924, 2011.
Trenberth, K. E., Zhang, Y., Fasullo, J. T., and Taguchi, S.: Climate variability and relationships between top-of-atmosphere radiation and temperatures on Earth, J. Geophys. Res.-Atmos., 120, 3642–3659, https://doi.org/10.1002/2014JD022887, 2015.
Trent, T., Schroeder, M., Ho, S.-P., Beirle, S., Bennartz, R., Borbas, E., Borger, C., Brogniez, H., Calbet, X., Castelli, E., Compo, G. P., Ebisuzaki, W., Falk, U., Fell, F., Forsythe, J., Hersbach, H., Kachi, M., Kobayashi, S., Kursinsk, R. E., Loyola, D., Luo, Z., Nielsen, J. K., Papandrea, E., Picon, L., Preusker, R., Reale, A., Shi, L., Slivinski, L., Teixeira, J., Vonder Haar, T., and Wagner, T.: Evaluation of Total Column Water Vapour Products from Satellite Observations and Reanalyses within the GEWEX Water Vapor Assessment, EGUsphere [preprint], https://doi.org/10.5194/egusphere-2023-2808, 2023.
Urraca, R. and Gobron, N.: Temporal stability of long-term satellite and reanalysis products to monitor snow cover trends, The Cryosphere, 17, 1023–1052, https://doi.org/10.5194/tc-17-1023-2023, 2023.
Wagner, T., Beirle, S., Grzegorski, M., Sanghavi, S., and Platt, U.: El Niño induced anomalies in global data sets of total column precipitable water and cloud cover derived from GOME on ERS-2, J. Geophys. Res., 110, https://doi.org/10.1029/2005JD005972, 2005.
Wang, C., Graham, R. M., Wang, K., Gerland, S., and Granskog, M. A.: Comparison of ERA5 and ERA-Interim near-surface air temperature, snowfall and precipitation over Arctic sea ice: effects on sea ice thermodynamics and evolution, The Cryosphere, 13, 1661–1679, https://doi.org/10.5194/tc-13-1661-2019, 2019.
Wang, J., Dai, A., and Mears, C.: Global water vapor trend from 1988 to 2011 and its diurnal asymmetry based on GPS, radiosonde, and microwave satellite measurements, J. Climate, 29, 5205–5222, https://doi.org/10.1175/JCLI-D-15-0485.1, 2016.
Wang, X. L.: Penalized maximal F test for detecting undocumented mean shift without trend change, J. Atmos. Ocean. Tech., 25, 368–384, https://doi.org/10.1175/2007JTECHA982.1, 2018.
Wang, X. L. and Feng, Y.: RHtestsV4 user manual, Climate Research Division, ASTD, STB, Environment Canada [Software], http://etccdi.pacificclimate.org/software.shtml (last access: 13 May 2024), 2013.
Wang, X. L., Swail, V. R., and Zwiers, F. W.: Climatology and changes of extratropical cyclone activity: Comparison of ERA-40 with NCEP–NCAR reanalysis for 1958–2001, J. Climate, 19, 3145–3166, https://doi.org/10.1175/JCLI3781.1, 2006.
Wentz, F. J., Hilburn, K. A., and Smith, D. K.: Remote sensing systems DMSP [SSM/I or SSMIS][Daily, 3-Day, Weekly, Monthly] environmental suite on 0.25° grid, Version 7, Remote Sensing Systems, Santa Rosa, CA [data set], https://www.remss.com/missions/ssmi (last access: 13 May 2024), 2015.
Willett, K. M.: HadISDH.extremes Part I: A gridded wet bulb temperature extremes index product for climate monitoring, Adv. Atmos. Sci., 40, 1952–1967, https://doi.org/10.1007/s00376-023-2347-8, 2023.
Xiong, J., Guo, S., Abhishek, Chen, J., and Yin, J.: Global evaluation of the “dry gets drier, and wet gets wetter” paradigm from a terrestrial water storage change perspective, Hydrol. Earth Syst. Sci., 26, 6457–6476, https://doi.org/10.5194/hess-26-6457-2022, 2022.
Yuan, P., Hunegnaw, A., Alshawaf, F., Awange, J., Klos, A., Teferle, F. N., and Kutterer, H.: Feasibility of ERA5 integrated water vapor trends for climate change analysis in continental Europe: An evaluation with GPS (1994–2019) by considering statistical significance, Remote Sens. Environ., 260, 112416, https://doi.org/10.1016/j.rse.2021.112416, 2021.
Yuan, P., Van Malderen, R., Yin, X., Vogelmann, H., Jiang, W., Awange, J., Heck, B., and Kutterer, H.: Characterisations of Europe's integrated water vapour and assessments of atmospheric reanalyses using more than 2 decades of ground-based GPS, Atmos. Chem. Phys., 23, 3517–3541, https://doi.org/10.5194/acp-23-3517-2023, 2023.
Zeng, X., Reeves Eyre, J. J., Dixon, R. D., and Arevalo, J.: Quantifying the occurrence of record hot years through normalized warming trends, Geophys. Res. Lett., 48, e2020GL091626, 2021.
Zhai, P. and Eskridge, R. E.: Atmospheric water vapor over China, J Climate, 10, 2643–2652, https://doi.org/10.1175/1520-0442(1997)010<2643:AWVOC>2.0.CO;2, 1997.
Zhang, W., Lou, Y., Cao, Y., Liang, H., Shi, C., Huang, J., Liu, W., Zhang, Y., and Fan, B.: Corrections of radiosonde-based precipitable water using ground-based GPS and applications on historical radiosonde data over China, J. Geophys. Res., 124, 3208–3222, https://doi.org/10.1029/2018JD029662, 2019.
Zhang, W., Wang, L., Yu, Y., Xu, G., Hu, X., Fu, Z., and Cui, C.: Global evaluation of the precipitable-water-vapor product from MERSI-II (Medium Resolution Spectral Imager) on board the Fengyun-3D satellite, Atmos. Meas. Tech., 14, 7821–7834, https://doi.org/10.5194/amt-14-7821-2021, 2021.
Zhang, X., Sorteberg, A., Zhang, J., Gerdes, R., and Comiso, J. C.: Recent radical shifts of atmospheric circulations and rapid changes in Arctic climate system, Geophys. Res. Lett., 35, L22701, https://doi.org/10.1029/2008GL035607, 2008.
Zhou, C., Wang, J., Dai, A., and Thorne, P. W.: A new approach to homogenize global subdaily radiosonde temperature data from 1958 to 2018, J. Climate, 34, 1163–1183, https://doi.org/10.1175/JCLI-D-20-0352.1, 2021.
Zhuang, J.: xESMF: universal regridder for geospatial data, GitHub, GitHub repository, [Software], Zenodo, https://doi.org/10.5281/zenodo.1134366, 2018.
Zveryaev, I. I. and Allan, R. P.: Water vapor variability in the tropics and its links to dynamics and precipitation, J. Geophys. Res.-Atmos., 110, D21112, https://doi.org/10.1029/2005JD006033, 2005.
The requested paper has a corresponding corrigendum published. Please read the corrigendum first before downloading the article.
- Article
(5428 KB) - Full-text XML
- Corrigendum
-
Supplement
(1446 KB) - BibTeX
- EndNote