the Creative Commons Attribution 4.0 License.
the Creative Commons Attribution 4.0 License.
 | 07 May 2024
Evaluation of reanalysis soil moisture products using cosmic ray neutron sensor observations across the globe
Yanchen Zheng
Gemma Coxon
Ross Woods
Daniel Power
Miguel Angel Rico-Ramirez
David McJannet
Rafael Rosolem
Jianzhu Li
Ping Feng
Reanalysis soil moisture products are valuable for diverse applications, but their quality assessment is limited due to scale discrepancies when compared to traditional in situ point-scale measurements. The emergence of cosmic ray neutron sensors (CRNSs) with field-scale soil moisture estimates (∼ 250 m radius, up to 0.7 m deep) is more suitable for the product evaluation owing to their larger footprint. In this study, we perform a comprehensive evaluation of eight widely used reanalysis soil moisture products (ERA5-Land, CFSv2, MERRA2, JRA55, GLDAS-Noah, CRA40, GLEAM and SMAP L4 datasets) against 135 CRNS sites from the COSMOS-UK, COSMOS-Europe, COSMOS USA and CosmOz Australia networks. We evaluate the products using six metrics capturing different aspects of soil moisture dynamics. Results show that all reanalysis products generally exhibit good temporal correlation with the measurements, with the median temporal correlation coefficient (R) values spanning 0.69 to 0.79, though large deviations are found at sites with seasonally varying vegetation cover. Poor performance is observed across products for soil moisture anomalies time series, with R values varying from 0.46 to 0.66. The performance of reanalysis products differs greatly across regions, climate, land covers and topographic conditions. In general, all products tend to overestimate data in arid climates and underestimate data in humid regions as well as grassland. Most reanalysis products perform poorly in steep terrain. Relatively low temporal correlation and high bias are detected in some sites from the west of the UK, which might be associated with relatively low bulk density and high soil organic carbon. Overall, ERA5-Land, CRA40, CFSv2, SMAP L4 and GLEAM exhibit superior performance compared to MERRA2, GLDAS-Noah and JRA55. We recommend that ERA5-Land and CFSv2 could be used in humid climates, whereas SMAP L4 and CRA40 perform better in arid regions. SMAP L4 has good performance for cropland, while GLEAM is more effective in shrubland regions. Our findings also provide insights into directions for improvement of soil moisture products for product developers.
- Article
(9037 KB) - Full-text XML
-
Supplement
(1696 KB) - BibTeX
- EndNote


Soil moisture plays a key role in water and energy interactions between the atmosphere and land surface (Zeng et al., 2015; Kim et al., 2018; Ling et al., 2021), and it controls many physical processes in hydrology, meteorology and agriculture, such as evapotranspiration, infiltration, runoff generation, drought development and crop growth. Accurate and timely soil moisture information is critical for a wide range of environmental analyses such as hydrological and climate modelling (Yee et al., 2017; Al-Yaari et al., 2014; Brocca et al., 2012; Zheng et al., 2021), flood and drought predictions (Martínez-Fernández et al., 2016; Massari et al., 2018; Ford and Quiring, 2019; Massari et al., 2014), and water resources and agriculture management (Chawla et al., 2020; Karthikeyan et al., 2020).
To date, soil moisture data are available from a variety of sources. Reanalysis products provide soil moisture data over long time periods (Li et al., 2005; Baatz et al., 2021) and typically merge soil moisture observations and land surface model output by adopting data assimilation techniques, which often results in better soil moisture estimation than satellite products (Naz et al., 2020; Beck et al., 2021; Mahto and Mishra, 2019). At present, reanalysis products are employed in a wide range of fields such as hydrological model initialisation (Zheng et al., 2020), flood modelling (McClean et al., 2023; El Khalki et al., 2020; Zheng et al., 2023), drought monitoring (Chen et al., 2019; El Khalki et al., 2020) and climatology research (Miralles et al., 2014). Currently, many reanalysis products exist including ERA5-Land (Muñoz Sabater 2019; Muñoz-Sabater et al., 2021), CFSv2 (Saha et al., 2011, 2014), MERRA2 (GMAO, 2015; Gelaro et al., 2017), JRA55 (JMA, 2013; Kobayashi et al., 2015), GLDAS-Noah (Rodell et al., 2004; Beaudoing and Rodell, 2020), CRA40 (Liu et al., 2017; Li et al., 2021), GLEAM (Miralles et al., 2011; Martens et al., 2017) datasets and SMAP Level 4 datasets (Reichle et al., 2019, 2017a, b) (one should note that technically speaking, GLDAS-Noah and GLEAM datasets are global land model-based products; we termed them “reanalysis products” in this paper for consistency). The quality of these reanalysis products is of significant interest to researchers, and their performance against point soil moisture observations has provided valuable guidance on potential applications and further improvement (Li et al., 2020; Xu et al., 2021; Zheng et al., 2022; Beck et al., 2021; Chen and Yuan, 2020; Ling et al., 2021). However, due to the heterogeneity in soil properties, topography and climate condition, low-density point measurements are not entirely representative of larger-scale soil moisture information (Gruber et al., 2013). Previous works have extensively reported the limited evaluation reliability between point measurements and soil moisture products because the observed discrepancies can be attributed to the spatial sampling error rather than the intrinsic error of soil moisture products (Dorigo et al., 2015; Crow et al., 2012; Gruber et al., 2013; Stillman et al., 2016; Miralles et al., 2010).
Cosmic-ray neutron sensors (CRNSs) are a more recent soil moisture measurement technique, compared to other traditional methods, that can measure area-average soil moisture at the field scale by capturing the variations in water content in the soil profile by fast neutron detection (Zreda et al., 2008). The neutron counting rates data from the CRNS can be converted into soil moisture via conversion equations from Desilets et al. (2010), Dong et al. (2014) and Hawdon et al. (2014). Additional influences on the neutron counting rate, besides soil moisture, need to be accounted for, including atmospheric pressure (Zreda et al., 2012; Hawdon et al., 2014), incoming high energy neutron intensity (Desilets et al., 2006), atmospheric water vapour (Rosolem et al., 2013) and above-ground biomass (Rivera Villarreyes et al., 2011; Baatz et al., 2015). CRNS calibration is also a crucial step, which requires multiple soil samples to be taken from within the sensor footprint, oven-dried, and then weighted and averaged to give field-scale accurate soil moisture estimates (Köhli et al., 2015; Schrön et al., 2017; Power et al., 2021a). The horizontal footprint of the CRNS varies approximately between 400 and 600 m in diameter (Zreda et al., 2008, 2012; Evans et al., 2016; Desilets and Zreda, 2013; Schrön et al., 2017), while the vertical measurement depths depend strongly on soil moisture content ranging from 0.1 m (under wet conditions) to 0.7 m (under dry conditions) (Franz et al., 2012; Rosolem et al., 2014). Given that the spatial variations in soil moisture and other factors such as microtopography and land cover can be considered within the footprint area, the CRNS measurements are better suited for the evaluation of satellite and reanalysis products compared to point measurements, whose signal tends to be more strongly associated with soil properties (Montzka et al., 2017; Dong et al., 2014; Peng et al., 2021; Kim et al., 2015; Desilets et al., 2010). Soil moisture estimated by CRNS presents a more compatible spatial scale, with recent efforts to promote hyper-resolution large-scale hydrological and land surface models (Iwema et al., 2017; Wood et al., 2011; Bierkens et al., 2015).
The establishment of CRNS networks across the globe is ongoing. Following the development of a first national-scale CRNS network in the USA, called the Cosmic-Ray Soil Moisture Observing System (COSMOS) (Zreda et al., 2012), other countries, such as Australia (Hawdon et al., 2014), Germany (Zacharias et al., 2011; Bogena, 2016), UK (Evans et al., 2016; Cooper et al., 2021) and India (Upadhyaya et al., 2021), have also started to establish their national networks. Several studies have evaluated a variety of soil moisture data products against CRNS measurements over different regions such as the USA (Kim et al., 2015), the UK (Peng et al., 2021), Australia (Renzullo et al., 2014), Germany (Schmidt et al., 2022) and India (Upadhyaya et al., 2021). Yet, most studies only use a few individual CRNS sites (Renzullo et al., 2014; Kêdzior and Zawadzki, 2016; Montzka et al., 2017; Mwangi et al., 2020), which hampers a comprehensive assessment at large scale. While some studies have evaluated soil moisture products against numerous CRNS sites (Kim et al., 2015; Montzka et al., 2017; Duygu and Akyürek, 2019), these studies did not consider the deviations across multiple CRNS networks caused by different calibration and neutron correction methods. That is because despite having now more than 200 CRNS sites in global operation providing soil moisture data (Andreasen et al., 2017), there has not been a community-wide consensus on best practices for sensor calibration and signal correction methods shared across the different networks. This has resulted in a non-harmonised dataset among networks to support large- or global-scale soil hydrology analysis (Rosolem et al., 2013; Hawdon et al., 2014; Power et al., 2021a).
This work provides, for the first time, a systematic evaluation of frequently used reanalysis soil moisture products against a global dataset of harmonised CRNS measurements. We analyse the reanalysis products with contrasting climate, soil properties, land cover and topography to provide insights into explaining the differences in performance. Finally, we provide recommendations to researchers for selecting suitable reanalysis soil moisture products.
2.1 CRNS measurements
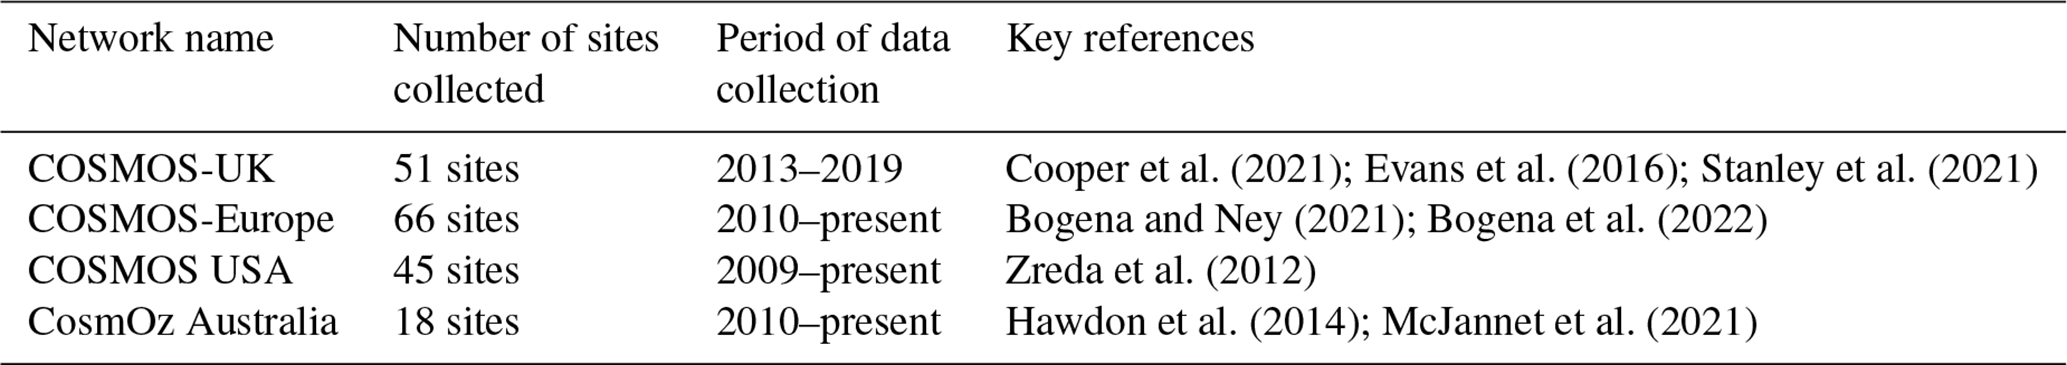
In this paper, we collected CRNS data from numerous networks globally and ensured the data were processed in a harmonised way to serve as the reference for evaluating reanalysis products. The geographical locations of CRNS sites collected in this study are shown in Fig. 1. A total of 180 CRNS data were collected from COSMOS-UK (51 sites) (Stanley et al., 2021), COSMOS-Europe (66 sites) (Bogena et al., 2022), COSMOS USA (45 sites) (Zreda et al., 2012) and the Australian CosmOz network (18 sites) (Hawdon et al., 2014). Details of each CRNS network are summarised in Table 1.
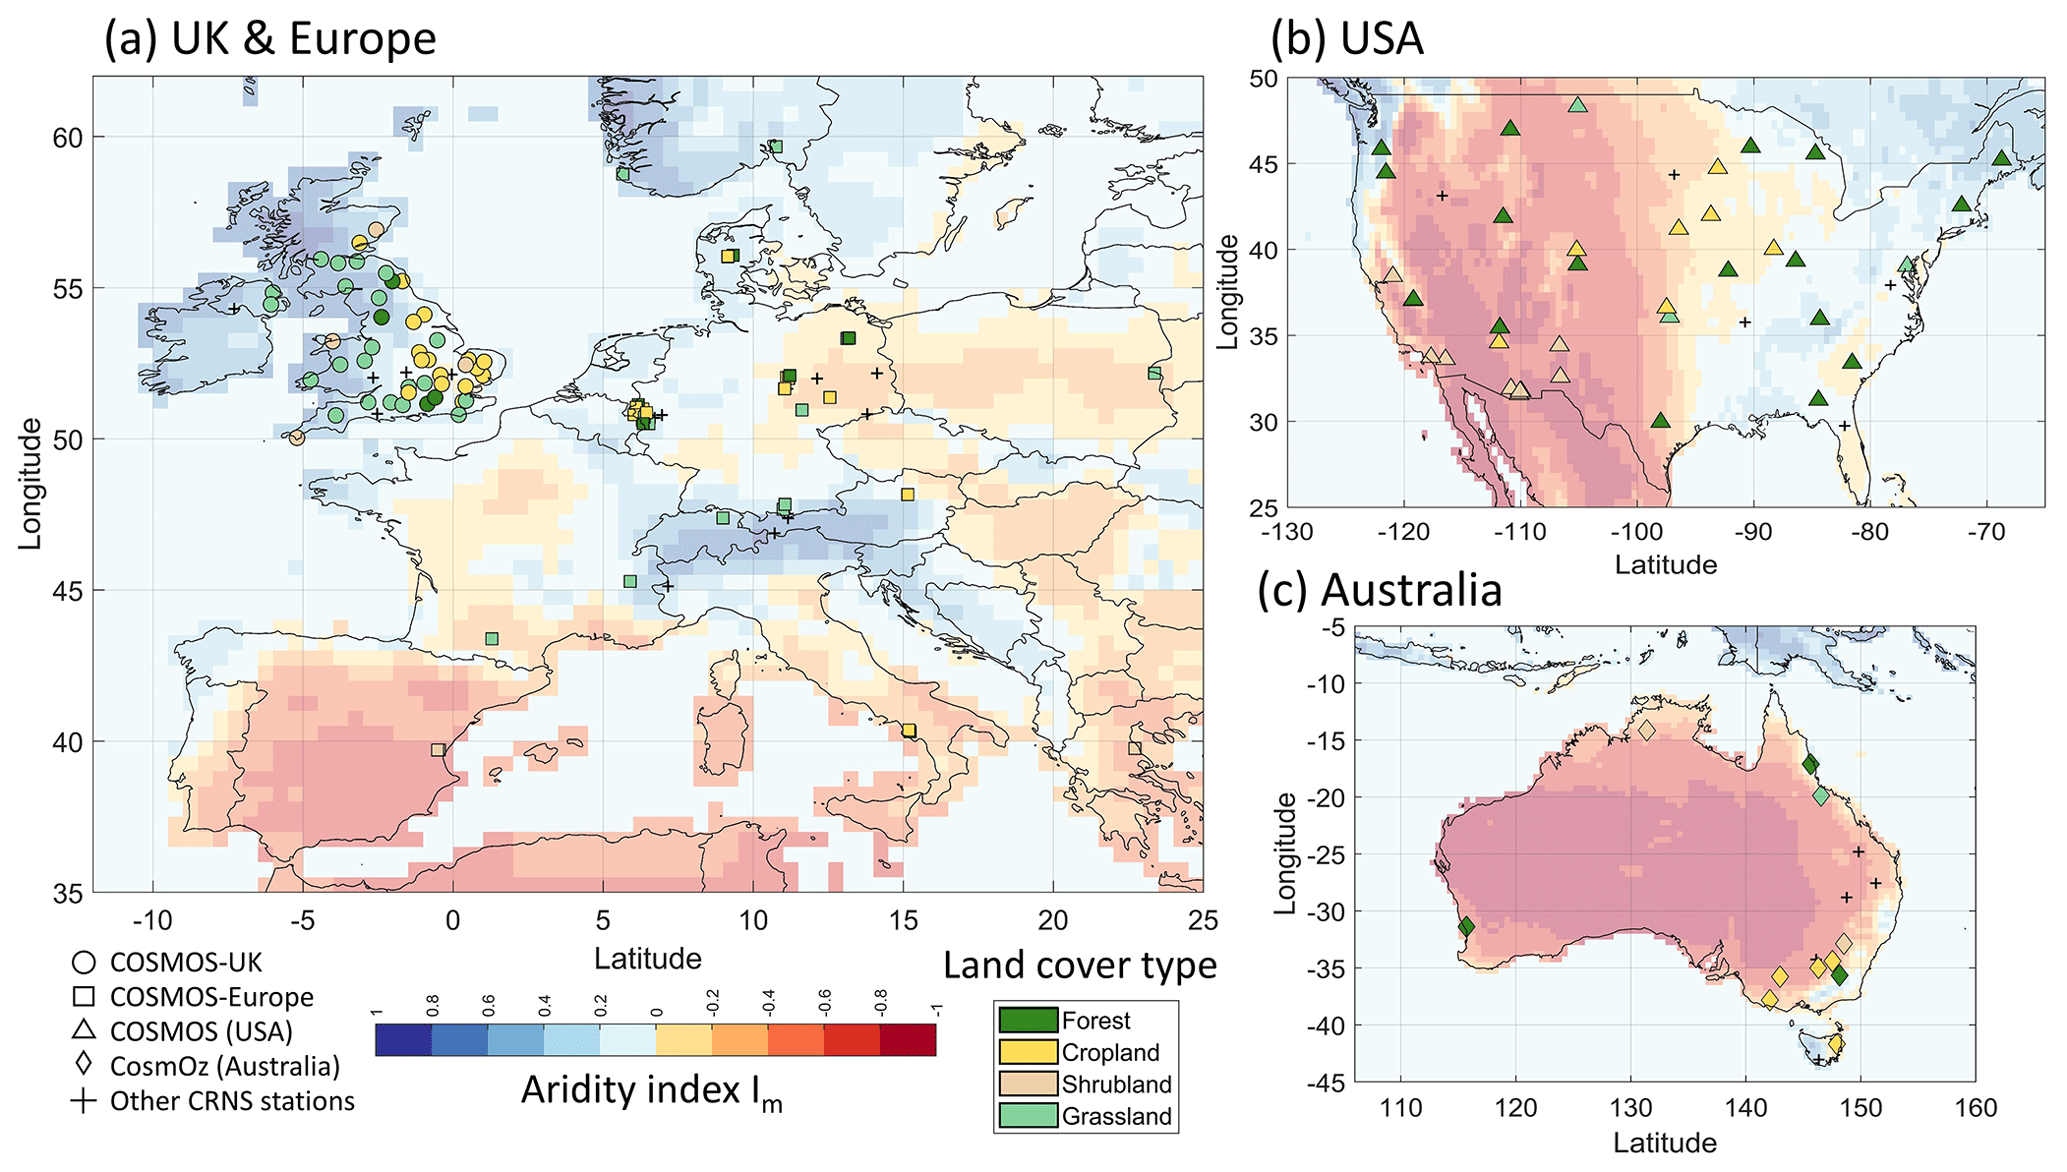
Figure 1Locations of CRNS sites collected in this study. The aridity index (Im) global map derived from Knoben et al. (2018) is used as a reference. The shape of the dots represents the CRNS sites from different networks, while the colour of the dots denotes the land cover type of each site.
2.1.1 CRNS calibration
The inverse relationship between fast neutrons and hydrogen atoms means that as neutron counts rise (fall), we know that the moisture content of the soil is decreasing (increasing). However, in order to convert this signal into volumetric soil moisture values, calibration of each sensor is required. This involves obtaining multiple samples of soil moisture profiles within the sensor footprint that are combined together to provide an average moisture content (Zreda et al., 2012). Each sample is subjected to oven drying, providing us with gravimetric soil moisture values which can be converted to volumetric soil moisture when multiplied by the dry-soil bulk density of the soil sample. As our understanding of the sensor signal has grown, improvements to this calibration step have been developed which have been shown to provide more accurate results. In particular, revised weighting schemes have been derived that consider the increased sensitivity of the signal to soil moisture nearer the sensor (Köhli et al., 2015; Schrön et al., 2017), as well as research showing the benefit in conducting multiple calibration campaigns across different seasons (Iwema et al., 2015). Ultimately this calibration step will provide us with the so-called N0 number (i.e. the theoretical neutron count found in absolutely dry conditions), which is calculated by comparing the averaged field-scale soil moisture value derived through the sampling campaign with the count rate at the time of sampling. This N0 number is used to derive the ratio between the actual counting rate (N) and the theorised maximum counting rate (N0) in the Desilets et al. (2010) equation for converting neutrons to soil moisture values. It is important to note, therefore, that changes in this number, or differences in how this number is derived, can lead to biases in soil moisture values.
The COSMOS-UK and COSMOS-EUROPE datasets each use the aforementioned revised weighting schemes to calibrate the sensors (Bogena et al., 2022; Cooper et al., 2021). To ensure comparability, the COSMOS-USA and CosmOz sites were updated to utilise the revised scheme using the Cosmic-Ray Sensor PYthon tool (crspy) (Power et al., 2021a), which was possible thanks to the openly available calibration data provided by each of the networks (Zreda et al., 2012; Hawdon et al., 2014). When multiple calibration days were available, calibration would be done on more than one day, with the N0 number being the value that reduced the error across all calibration days. It should be noted that, recently, the CosmOz network updated their data to utilise the revised weighting scheme; however there is still a difference in incoming neutron intensity correction, necessitating harmonisation through crspy (https://cosmoz.csiro.au/about, last access: 12 January 2024). More detailed of CRNS data reprocessing can be found in Sect. 2.1.2. The calibrated N0 values, along with information on how many calibration days were used, are given in the Supplement (see “CRNSsiteDataNEWR1.xlsx” file).
2.1.2 Reprocessing of CRNS data
To remove the possible influence of different CRNS processing methodologies, CRNS data were processed using the Cosmic-Ray Sensor PYthon tool (crspy) to ensure a harmonised methodology (Power et al., 2021a). The correction of the aforementioned influences on the neutron counts (i.e. atmosphere pressure, incoming neutron intensity, atmospheric water vapour and above-ground biomass) are all included in the crspy tool. Given that COSMOS-Europe and COSMOS-UK each follow the same steps for correcting neutron counts (Cooper et al., 2021; Bogena et al., 2022), reprocessing was undertaken for the COSMOS (USA) sites and the CosmOz (Australia) sites for consistency. More details about reprocessing COSMOS (USA) and CosmOz (Australia) data using crspy are provided in Sect. S2 of the Supplement. In addition, it should be noted that there are eight UK sites in COSMOS-Europe datasets, including four sites which are the same sites listed in the COSMOS-UK network. The differences in hourly and daily soil moisture data from these two networks for the four sites are shown in Figs. S1 and S2 and Table S1 of the Supplement. This difference is most likely due to COSMOS-Europe applying a 24 h rolling average to hourly values to reduce the inherent noise of neutron counts (Bogena et al., 2022), whereas COSMOS-UK does not apply any rolling average. The notable deviation in two networks indeed highlights the importance of harmonised processing of CRNS datasets. Thus, for the selection of the UK sites, only the soil moisture data provided by the COSMOS-UK network are used in this study to maintain consistency with the remaining UK sites. In particular, these four UK sites use the data from COSMOS-UK instead of COSMOS-Europe.
2.2 Reanalysis soil moisture products
Eight widely used reanalysis products that provide soil moisture data are evaluated in this study. The reanalysis products include ERA5-Land (Muñoz Sabater, 2019; Muñoz-Sabater et al., 2021), CFSv2 (Saha et al., 2011, 2014), MERRA2 (GMAO, 2015; Gelaro et al., 2017), JRA55 (JMA, 2013; Kobayashi et al., 2015), GLDAS-Noah (Rodell et al., 2004; Beaudoing and Rodell, 2020), CRA40 (Liu et al., 2017; Li et al., 2021), GLEAM (Miralles et al., 2011; Martens et al., 2017) and SMAP Level 4 (Reichle et al., 2019). These products cover a large range of temporal resolution (spanning from hourly to daily), temporal coverage, spatial resolution and different vertical soil layers. The temporal coverage of these products is 40 years on average, ranging from 9 years (SMAP L4) to 74 years (ERA5-Land). Among them, ERA5-Land (0.1° × 0.1°) and SMAP L4 (9 km) have a finer spatial resolution, whereas MERRA2 (0.5° × 0.625°) and JRA55 (0.563° × 0.562°) have a relatively coarser resolution. Table 2 presents the main characteristics of all these products. More descriptions of each reanalysis product can be found in Sect. S3.
Table 2Overview of eight reanalysis soil moisture products used in this study.
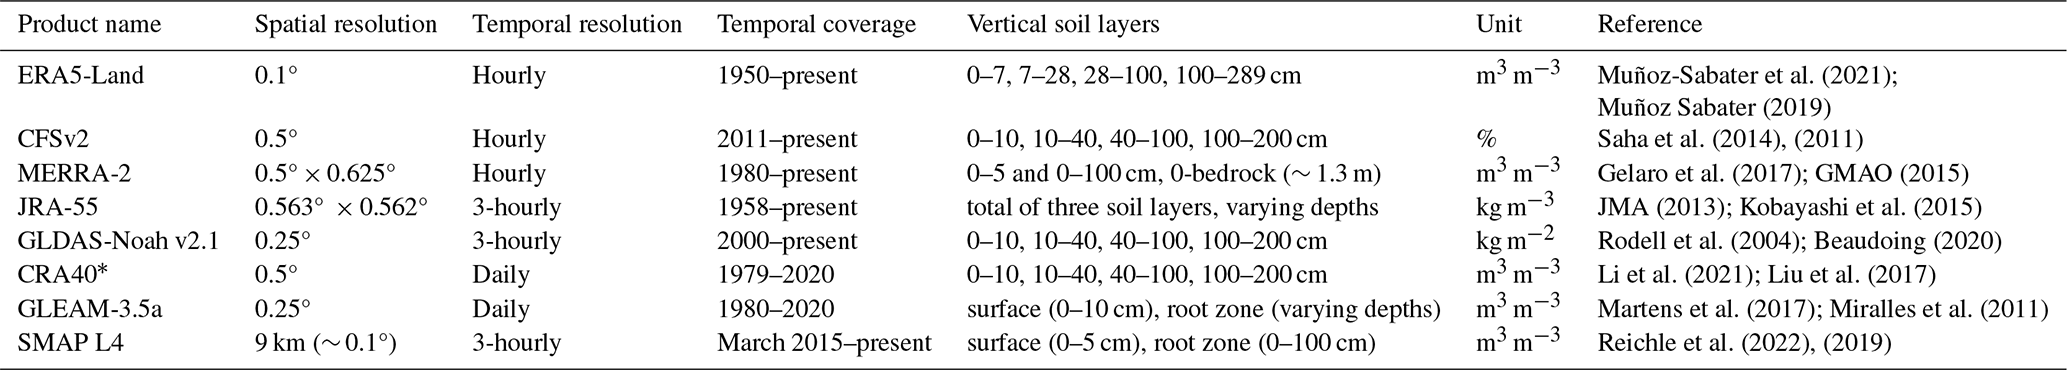
* The CRA dataset consists of two types of data, namely atmosphere-driven fusion products and land surface products. In this paper, the CRA land surface dataset is used and denoted as CRA40.
2.3 Ancillary data preparation
To provide insights into the possible reasons for differences in reanalysis products' performance, we collated data on 11 possible factors representing climate (i.e. aridity, seasonality, snow, mean annual temperature and mean annual precipitation), soil properties (i.e. bulk density, soil organic carbon and lattice water), vegetation (land cover) and topography conditions (i.e. altitude and slope).
Three climate indices (i.e. aridity, aridity seasonality and fraction of precipitation as snow) derived by Knoben et al. (2018) were adopted, which have been proved to be more effective than Köppen–Geiger classification for revealing the climatic influence especially on streamflow signatures. In their methods, aridity Im is calculated based on Thornthwaite's moisture index, MI (Willmott and Feddema, 1992), using Eqs. (1)–(2), in which P(t) and EP(t) are mean monthly precipitation and potential evapotranspiration values from the CRU TS v3.23 dataset (Harris et al., 2014). The range of aridity index is [−1, 1], where −1 indicates the most arid conditions and 1 denotes the most humid conditions. More details and equations for other two climate indices can be found in Knoben et al. (2018). Additionally, mean annual temperature (MAT) and mean annual precipitation (MAP) for each CRNS site are retrieved from the ERA5-Land product as it has the highest spatial resolution.
Soil properties' data, i.e. bulk density, soil organic carbon content and lattice water, are provided in metadata from Power et al. (2021a) and Bogena et al. (2022). Soil organic carbon represents the total organic carbon in the soil at the site, while lattice water represents the hydrogen contained in the mineral structures of the soil. In studies by Power et al. (2021a) and Bogena et al. (2022), local measurements of soil properties' data are collected for the majority of CRNS sites (bulk density – 98 % sites, soil organic carbon content – 94 % sites, lattice water – 98 % sites), while the global-raster-based SoilGrids soil dataset (Hengl et al., 2017) was used to provide data for the sites with missing measurements.
For the land cover attributes at each CRNS site, we reclassify the different land cover classes from Power et al. (2021a) and Bogena et al. (2022) into a harmonised land cover classification including four land cover types: forest, cropland, shrubland and grassland (see Table A1 in Appendix A). The land cover data collected in crspy are obtained from the ESA CCI Land Cover dataset (ESA Land Cover CCI Project Team and Defourny, 2019). A small proportion of COSMOS-Europe sites with unclear land cover classes (e.g. plantation, reforestation, orchard and heathland) that are hard to reclassify were checked in the high-resolution Sentinel-2 10 m land use and land cover map (Karra et al., 2021).
Finally, metadata from Power et al. (2021a) and Bogena et al. (2022) offer altitude information for each CRNS site. We used the 90 m MERIT DEM data (Yamazaki et al., 2017) to provide the topographic slope. To reduce the spatial-scale mismatch of the topographic slope between the CRNS site point location and its horizontal footprints, we calculated the average slope of the area with a radius of 250 m centred on the CRNS site.
3.1 Data processing
3.1.1 Temporal resolution and coverage
Due to the nature of the CRNS technology, the hourly measurements might contain higher uncertainty compared to daily measurements (Zreda et al., 2008; Desilets et al., 2010; Iwema et al., 2021), in general, high measurement uncertainty can be compensated for by applying simple daily averaging (Davies et al., 2022). Additionally, some reanalysis products only provide daily data; thus we aggregate sub-daily reanalysis products data over the beginning of the day (00:00 UTC) and the proceeding 24 h period and then perform the evaluation with the CRNS measurements at daily scale. Since CRA40 and GLEAM data provide data until the end of 2020, all available soil moisture data for each product from the start date of CRNS measurements to 2020 are used for the evaluation. To ensure the reliability of evaluation with enough soil moisture data, only the CRNS sites available with at least 2 years (730 d) of observations are selected for the analysis to avoid deviations under short-term extreme weather conditions. Therefore, a total of 135 (i.e. UK: 45 sites; mainland Europe: 41 sites; USA: 38 sites; Australia: 11 sites) out of 180 CRNS sites are used in the study. Note that since the evaluation against the COSMOS-UK network has been specifically compared, the analysis for Europe only compares the COSMOS-Europe sites from mainland European regions, omitting the UK. The basic information of these selected 135 CRNS sites is listed in Table S2.
3.1.2 Spatial-scale matching
The selected reanalysis products in this study exhibit a great variety of spatial resolutions (Table 2). The measurements from each CRNS site are compared with the reanalysis product grid cells in which the CRNS site is situated. In some cases, more than one CRNS site is located within one reanalysis product grid cell. Many studies take the average of multiple CRNS sites data first before the comparison with the grid cell data (Kim et al., 2015; Miralles et al., 2014). Yet, when many CRNS sites are located densely within the same grid cell (e.g. 13 CRNS German sites are located within one grid cell of CRA40 reanalysis product), different overlapping time periods across sites make it difficult to take an average. In this study, to maximise the use of CRNS data, we individually compare and calculate the statistical metric for the multiple CRNS sites data that are located in the same grid cell with the corresponding grid cell multiple times. Then, the Brunke ranking method (details introduced below in Sect. 3.3) is used to comprehensively compare the product performance based on these statistic metrics.
3.1.3 Vertical footprint matching
For CRNS measurements, the vertical sensing depth has a strong dependency on actual soil moisture. The wetter the soil, the shallower the signal. The neutron signal exhibits the highest sensitivity to the uppermost layers and decays nearly exponentially from the surface downwards (Köhli et al., 2015; Zreda et al., 2008). The effective vertical sensing depth D86, defined as the depth within which 86 % of neutrons probed the soil (Köhli et al., 2015), ranging from 10 to 70 cm deep, varies at each time step. By contrast, reanalysis products normally provide data for multiple soil layers.
To solve the inconsistency of vertical footprint between CRNS measurements and reanalysis products, the revised vertical weighting function, which is initially proposed to calculate vertical weighted averages of point measurements for sensor calibration (Schrön et al., 2017), is used to determine the weights for each soil layer of the reanalysis product. This revised vertical weighting function, assigning weights to soil layers, outperformed other vertical processing methods in terms of better temporal correlation with CRNS measurements (Fig. S3). Following the same procedure, we assign weights for each soil layer of the reanalysis product at different depths d and calculate the weighted average to compare with CRNS measurements. The formula for the revised vertical weighting function wi is given in Eqs. (3)–(4). The function to calculate the vertical average of soil layers i with values θi and weights wi is shown in Eq. (5).
where D represents the effective penetration depth D86. The variation of D86 is related to the adjusted distance r* from the sensor centre (which is influenced by atmospheric pressure; Schrön et al., 2017), soil moisture wetness θ and soil bulk density ρbulk. Since D86 is provided along with CRNS measurements at each time step, the weights wi at different depths d can be obtained with the exponential function. n denotes the total number of reanalysis product soil layers up to D86. The units of all the soil moisture values θi from reanalysis products and measurements are transferred into m3 m−3 for comparison in this paper.
3.1.4 Data post-processing
Neutron signals can be substantially affected by snow cover, resulting in unreliable soil moisture measurements. Yet, at most of the CRNS sites, there is a lack of measured snow data. Consequently, we follow the same procedure adopted in COSMOS-Europe (Bogena et al., 2022) to discard the soil moisture data affected by the presence of snow for other CRNS networks. Snow water equivalent data from ERA5-Land product are used to detect the snow events. CRNS data are excluded from the analysis when the 24 h moving average of the snow water equivalent data exceeds 1 mm.
3.2 Statistical metrics
The statistical metrics we used in this study include the Pearson correlation coefficient (R), Pearson correlation coefficient for seasonal (Rsea) and anomaly (Rano) soil moisture time series, the mean square error (MSE), the unbiased root mean square error (ubRMSE), and the bias. These statistical metrics are widely used in soil moisture data evaluation and capture different aspects of soil moisture dynamics (Peng et al., 2021; Cui et al., 2018; González-Zamora et al., 2019; Peng et al., 2015; Albergel et al., 2012; Yee et al., 2017; Zheng et al., 2022; Xu et al., 2021; Al-Yaari et al., 2014).
where cov denotes the covariance of both variables. SMproduct is the reanalysis soil moisture product and SMCRNS is the soil moisture derived from CRNS measurements. σ is the standard deviation of soil moisture values. The overbar represents the mean operator.
The R metric measures how well the soil moisture derived from CRNS measurements and reanalysis products correspond in terms of temporal correlation. Since the spatial-scale mismatch differences between site measurements and soil moisture reanalysis data are inevitable (Beck et al., 2021; Miralles et al., 2010; Gruber et al., 2020), the comparisons in R metrics are considered to be the most reliable (Kim et al., 2015). To quantify the temporal dynamic performance of the soil moisture time series at different timescales, the original soil moisture time series data are decomposed into the seasonal signals and anomalies (Zheng et al., 2022; Beck et al., 2021; Kim et al., 2015; Peng et al., 2015; Al-Yaari et al., 2014; Li et al., 2020). The seasonal cycle data are derived by taking a moving average with a window size of 31 d over the soil moisture data time period coverage. Then, the anomaly time series are calculated by removing the seasonal signals from the original soil moisture data. The moving mean is only extracted if a period of more than 16 d with available soil moisture values is present in the 31 d window. The Pearson correlation coefficients calculated for seasonal and anomaly soil moisture time series data are denoted as Rsea and Rano, respectively.
3.3 Brunke ranking method
This study aims to provide recommendations for researchers in choosing suitable reanalysis soil moisture products. To comprehensively quantify the performances for eight reanalysis products in terms of all six statistical metrics, the Brunke ranking scheme (Brunke et al., 2003) is adopted, which is a frequently used soil moisture product ranking method (Deng et al., 2021; Yang et al., 2020; Wang and Zeng, 2012; Deng et al., 2020; Decker et al., 2012).
For each statistical metric at each site, the eight reanalysis products are ranked and assigned a score from 1 to 8, with 1 given to the products with the best performance (e.g. the lowest value of MSE, ubRMSE and bias or highest correlation) and 8 given to the lowest performance (e.g. the largest value of MSE, ubRMSE and bias or lowest correlation). It should be noted that if the metric values are missing for some reanalysis products at one site due to insufficient time series or missing values in a specific grid cell, the ranking score is given from 1 to the number of available products' metric values (Wang and Zeng, 2012). To obtain the overall ranking score of each product, the ranking scores are further averaged across all six metrics for all sites.
4.1 Rank of reanalysis products for different regions
Figure 2 displays the Brunke ranking results for eight reanalysis products against CRNS measurements in terms of six statistical metrics (Table S3). More details for each metric can be found in the Supplement (Figs. S4, S5). Overall, the performance of reanalysis products varies across different regions. In the UK, CFSv2 exhibits good performance in terms of R, Rsea and ubRMSE. GLEAM also ranks relatively highly in multiple metrics, especially Rsea, MSE and bias. As for mainland Europe, ERA5-Land performs well in terms of R, Rsea, Rano and ubRMSE. JRA55 shows minimum bias and better MSE relative to other datasets in Europe. In the USA, CRA40 shows superior performance in terms of bias and MSE, while GLEAM provides better R, Rsea and ubRMSE. CFSv2 performs relatively poorly in the USA. As for Australia, SMAP L4 exhibits good temporal correlation with both original and seasonal measured soil moisture time series and also performs well in MSE and ubRMSE. JRA55 presents the lowest rank in terms of R, Rsea and ubRMSE.

Figure 2Brunke ranking results for a total of eight products' performance in terms of six statistical metrics across different regions, i.e. (a) the UK, (b) mainland Europe, (c) the USA and (d) Australia (AUS). Each coloured line represents a reanalysis product. For all metrics, the farther away the line in this plot from the centre (i.e. closer towards black arrow), the better the performance (i.e. the lowest value of MSE, ubRMSE and bias or highest correlation).
Figure 3 summarises the spatial distribution of the average performance for all eight soil moisture reanalysis products in terms of R and bias. The spatial map of the rest of the metrics can be found in Fig. S6 and S7. Around 70 % of the sites exhibit good temporal correlation with CRNS measurements, with R average values of eight soil moisture products larger than 0.7, and the median of R value across all sites reaches 0.74. Few sites in the west of the UK and the southwest and north central USA show a worse performance, with R < 0.5. In terms of bias, all reanalysis soil moisture products tend to underestimate data in the west of the UK, central Europe, northeastern USA and southeastern Australia, while overestimation is observed in northern Europe, northern Australia and most sites in the western USA. The spatial distribution of Rsea is similar to that of R (Fig. S6a, b and c). The performance of Rano is generally lower than the correlation of original and seasonal soil moisture time series. No clear spatial pattern is observed in the USA and Australia in terms of MSE and ubRMSE, while several sites with high MSE and ubRMSE values are notable in the UK (Fig. S7).

Figure 3Spatial distribution of all eight products' average performance in terms of statistical metrics R and bias. The green letter G denotes the statistical metric values with good performance. The size of the dots in the map indicates the length of the measurements (i.e. number of days).
Soil moisture time series comparison between reanalysis soil moisture products and CRNS measurements for four representative sites is presented in Fig. 4. Site WADDN in the UK is a grassland site from the COSMOS-UK network. The soil moisture values from reanalysis products for this site closely follow the temporal trend of the CRNS measurements, exhibiting high temporal correlation with the (Fig. 4a). In contrast, the UK site RDMER is selected to demonstrate the variations in time series data for sites with low bulk density and high organic soils (Fig. 4b). All reanalysis soil moisture products show less variability of temporal dynamics and exhibit low performance in describing soil moisture anomalies.
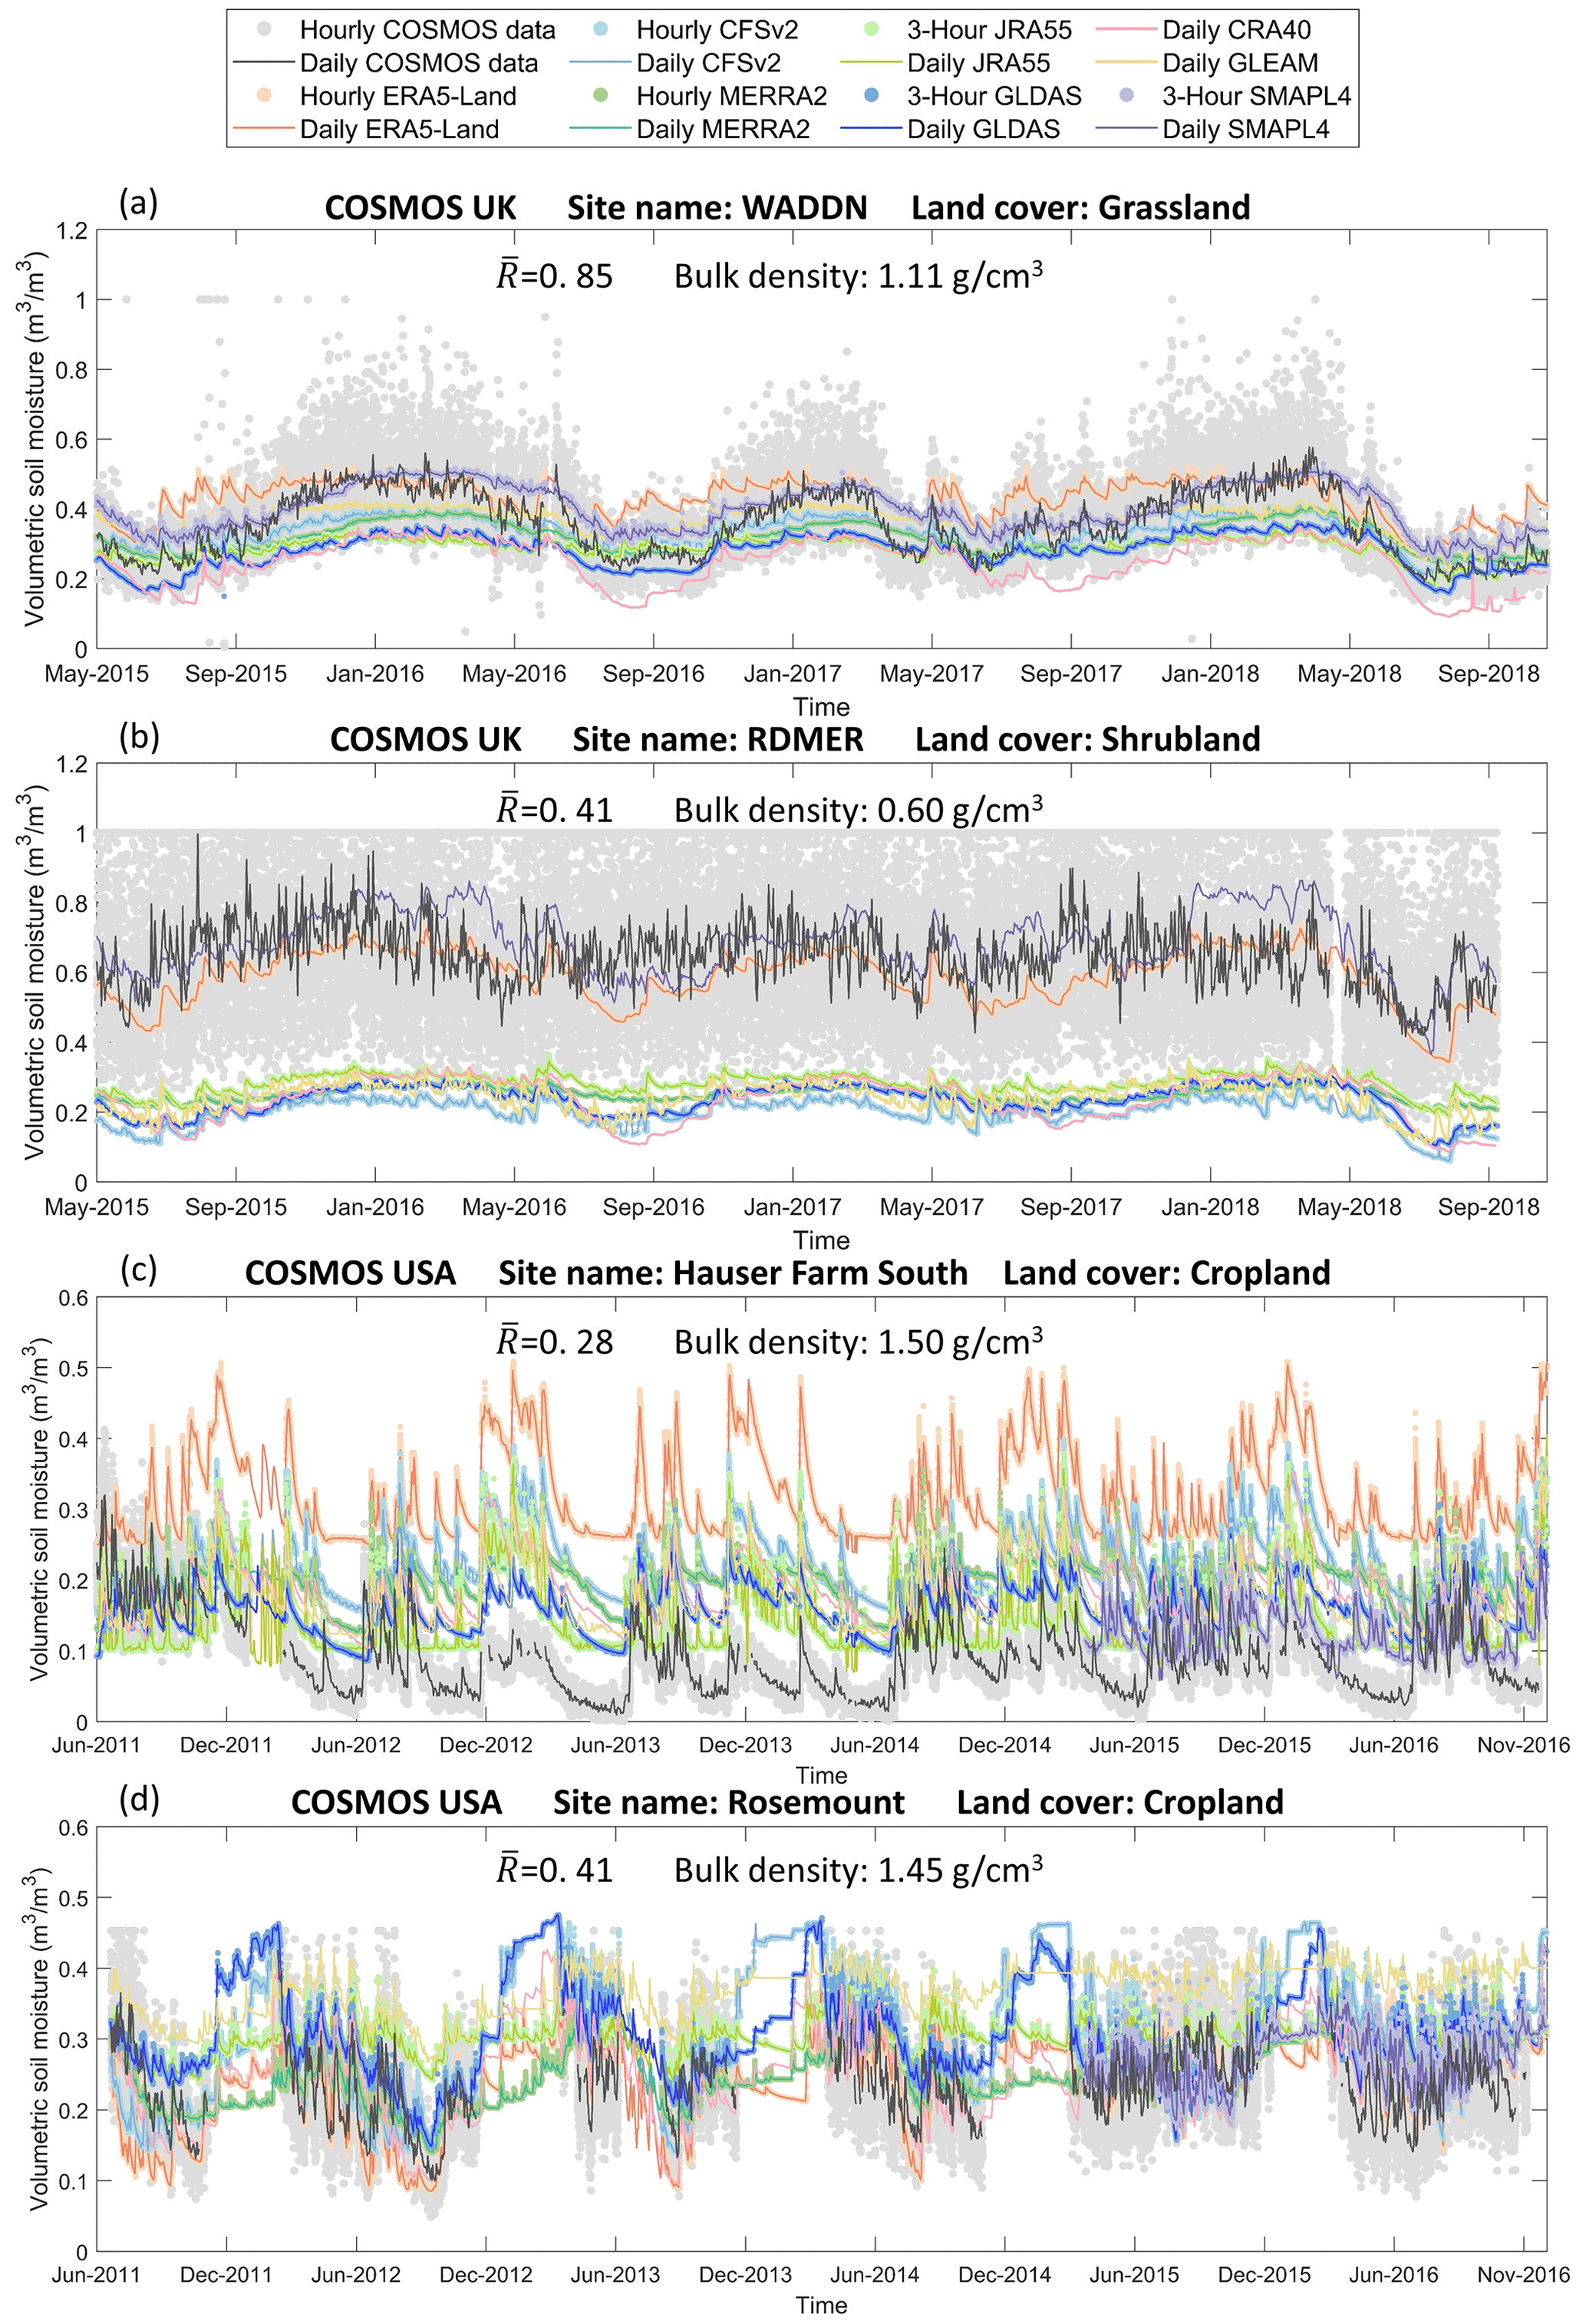
Figure 4Time series comparison between CRNS measurements and reanalysis products over four sites (i.e. (a) site WADDN from the UK, (b) site RDMER from the UK, (c) site Hauser Farm South from the USA and (d) site Rosemount from the USA). The locations of these four sites are listed in Fig. 3.
Moreover, the large deviation in bias between reanalysis soil moisture products and CRNS measurements is notable except for ERA5-Land and SMAP L4. Even though the reanalysis soil moisture products and CRNS measurements both provide accurate soil moisture information in an ideal situation, the mismatch in spatial resolution is still inevitable, which might also result in large bias (Montzka et al., 2017; Kim et al., 2015; Peng et al., 2021). Higher spatial resolution might reduce the bias; thus the smaller bias of ERA5-Land and SMAP L4 is likely attributed to the finer spatial resolution. In addition, a great variability of soil moisture data at an hourly time step is observed in RDMER site (grey scatters in Fig. 4b), while the hourly data in WADDN exhibit reasonable temporal dynamics. This also indicates that it is challenging to capture the temporal soil moisture variations at hourly scale for sites with low bulk density and high organic soils. This might be related to the fact that organic soils contain hydrogen and also that the variations of organic soil content could lead to uncertainties in soil moisture calibration (Dimitrova-Petrova et al., 2021; Peng et al., 2021; Bogena et al., 2013).
Figure 4c and d show the time series comparison of two US sites with low average R values. The time series from reanalysis soil moisture products for site Hauser Farm South generally capture the temporal variations against CRNS observations. Yet, the reanalysis soil moisture products do not dry out as much as CRNS measurements during the dry periods. Accordingly, the reanalysis soil moisture products fail to represent the accurate soil moisture condition in the sites located in the dry regions.
Site Rosemount from the USA is affected by snow cover in winter; thus the CRNS measurements during the snow events are discarded. Since the metrics are only calculated when CRNS observations and reanalysis soil moisture products are both available, the low average R value indicates poor temporal correlation during the growing season rather than the effect of snow. It is clear that the sites in USA with low temporal dynamics are normally from the cropland or shrubland land cover type (with the comparison of Figs. 3b and 1b). The seasonal variations of the biomass signals in cropland and shrubland might be the reasons that affect the deviations and low temporal correlation between CRNS measurements and reanalysis soil moisture products, as currently the harmonisation of all sites does not explicitly account for changes in biomass.
4.2 Possible reasons for the differences in performance
All selected CRNS sites are adopted to investigate the different performances of reanalysis products under various conditions. The box plots in Fig. 5 show the distribution of site performance for each reanalysis product with the influential factors filled in colour. In particular, bulk density, soil organic carbon, aridity and mean annual precipitation are four informative variables in explaining the reanalysis performance. The distribution of some other possible factors (i.e. seasonality, snow), which shows insignificant influence, is not presented in this paper. Yet, data of all 11 possible factors for each site are provided in the Supplement for those seeking further investigation. From Fig. 5, the sites in the dry regions exhibit better performance in terms of Rano than that of humid regions. These box plots also demonstrate the performance for each reanalysis soil moisture product by adopting all CRNS sites data. For direct comparison, the median value of a given statistical metric across all available sites is often used to reflect the product performance (Beck et al., 2021; Deng et al., 2020). It is notable that GLDAS performs worse in terms of Rano (Fig. 5c).
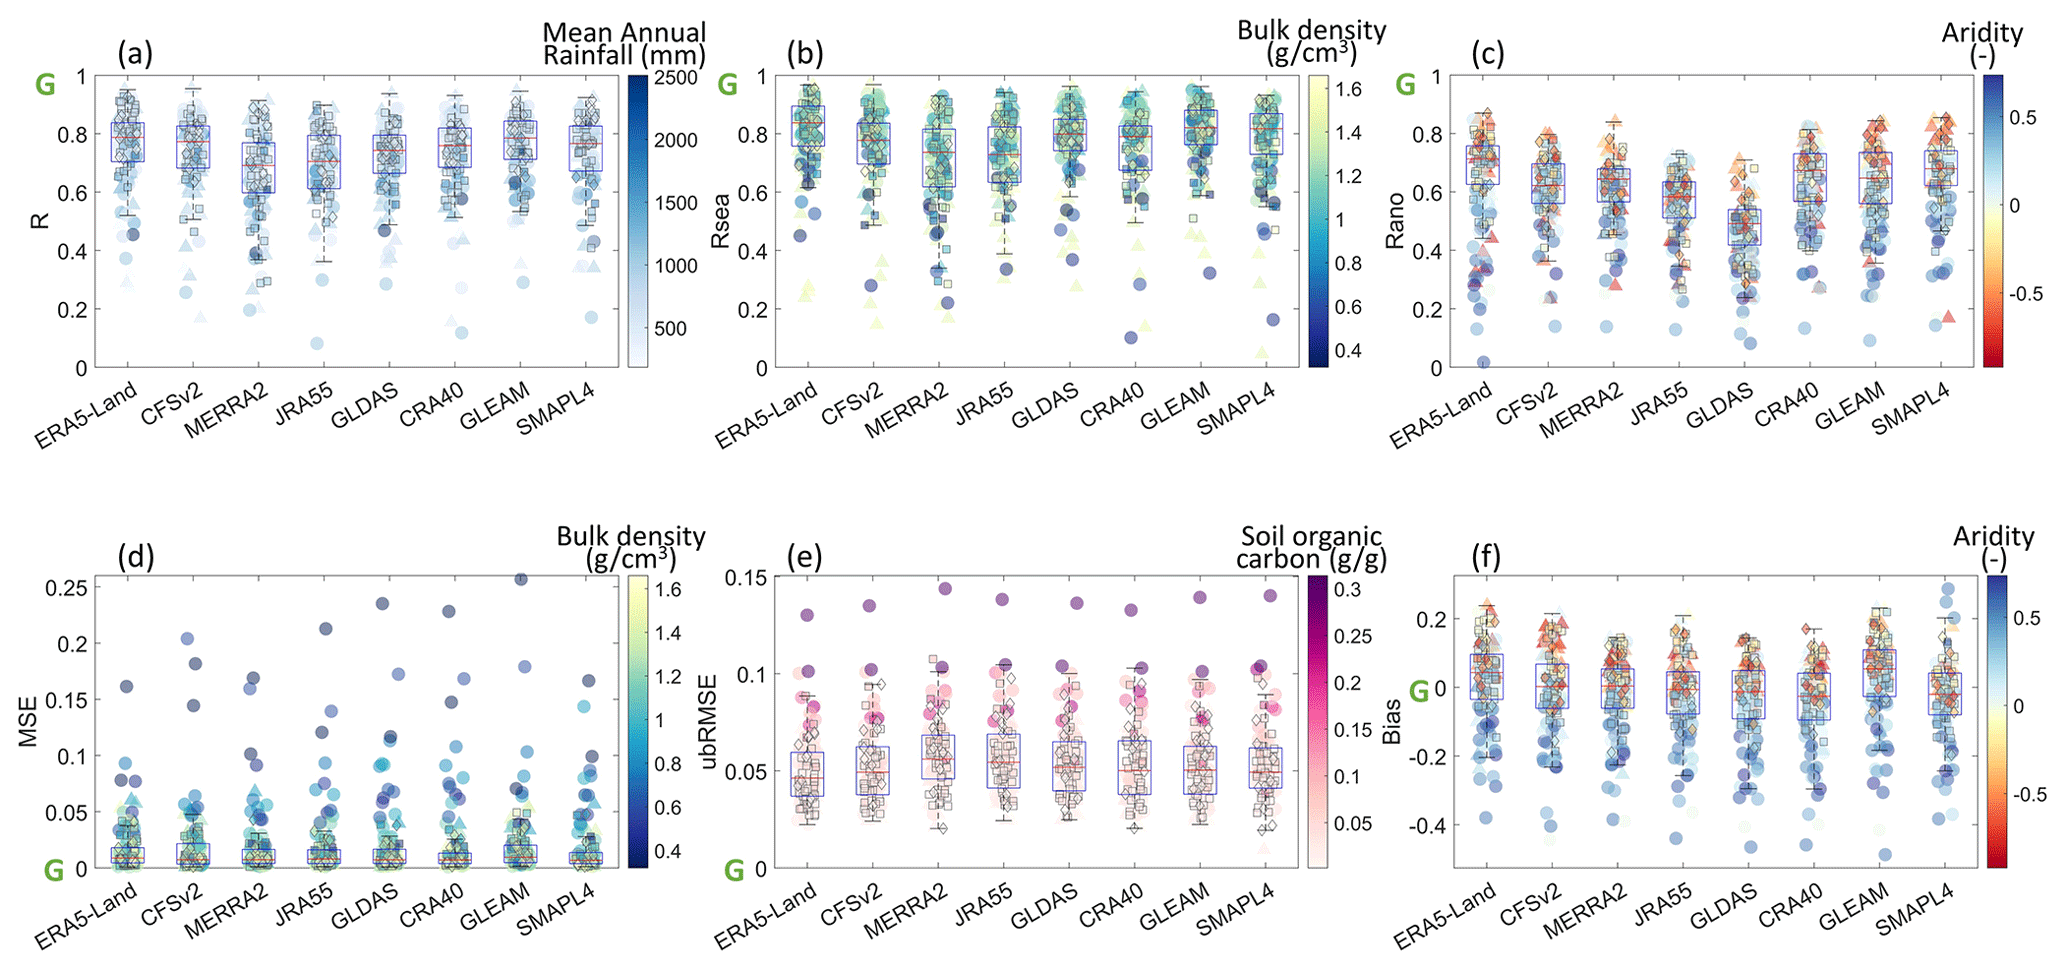
Figure 5Influential factors in explaining the reanalysis product performance. The shape of the dots denotes the CRNS sites from different networks (UK – circle, mainland Europe – square, USA – triangle and Australia – diamond), while the colour of the dots represents the values of possible factors for each site. The green letter G denotes the good performance of the statistical metric values.
4.2.1 Soil properties
With the comparison of the statistical metrics' average performance map (Fig. 3) and the spatial map of bulk density and soil organic carbon for all sites used in this study (Fig. S8), it is clear that all reanalysis products exhibit low temporal correlation and high bias in the sites with low bulk density and high soil organic carbon. Almost all statistical metrics have lower performance on these sites (Figs. 5b, d, e and S9). These sites with low bulk density and high soil organic carbon exhibiting negative bias are mainly from the humid region, especially the UK (Fig. 5f).
4.2.2 Land cover
All reanalysis products tend to have lower performance in terms of R, Rsea and ubRMSE metrics in shrubland and several sites in cropland, indicating that the reanalysis products exhibit poor performance in regions characterised by high mean annual temperature, low mean annual precipitation and high altitude (Fig. 6). The average Brunke ranking scores show that GLEAM performs best in shrubland (Table S3). The performance for each reanalysis product under four land cover types is presented in Fig. 7. As for the forest land cover type, reanalysis products show small errors in terms of ubRMSE but perform worse in MSE (Fig. 7e, d). The bias in grassland from a total of six reanalysis products is primarily negative, which means that the reanalysis products tend to underestimate the soil moisture observations in grassland (Fig. 7f). CFSv2 performs best in grassland in terms of R and ubRMSE. For cropland land cover type, ERA5-Land captures the temporal dynamics of soil moisture time series (i.e. R, Rsea and Rano) and ubRMSE relatively well, whereas SMAP L4 also shows good performance in terms of Rano.

Figure 6Average statistical metrics R, Rsea and ubRMSE performance of all eight products under different land cover types, altitude, mean annual precipitation and mean annual temperature. The shape of the dots denotes the CRNS sites from different networks (UK – circle, mainland Europe – square, USA – triangle and Australia – diamond). The colour of dots in (a) denotes different land cover types, while the colour in other panels represents the statistical metric values. MAT stands for mean annual temperature, and MAP is mean annual precipitation.

Figure 7Statistical metric performance for all products under four land cover types (forest – 33 sites, cropland – 41 sites, shrubland – 20 sites and grassland – 41 sites). The values of the dots represent the median metric values of the sites in a given land cover type; the error bar of each dot denotes the variability of the metric values. The green letter G stands for the good performance of the statistical metric values.
4.2.3 Climate
Figure 8 displays the performance of each reanalysis product under three climate conditions (humid, temperate and arid). In general, compared to the humid and temperate climate, all reanalysis products perform noticeably better in terms of Rano in arid climates but overestimate the CRNS measurements in terms of bias (Fig. 5c and f). In contrast, the bias of reanalysis products for humid regions is primarily negative, indicating underestimation in humid regions. Moreover, large errors are observed in terms of Rano and ubRMSE from all reanalysis products in humid climates, highlighting that the soil moisture anomaly information is difficult to capture accurately by reanalysis products. In temperate regions, reanalysis products exhibit good performance in terms of ubRMSE and bias. Specifically, MERRA2 performs worse in humid and temperate climates particular in terms of R, Rsea and ubRMSE. CRA40 and SMAP L4 show better performance in arid regions, especially for the metrics Rano and MSE, whereas JRA55 exhibits large errors in terms of R, Rsea and ubRMSE in arid regions.

Figure 8Statistical metric performance for all products under three climate conditions (humid – 53 sites, temperate – 42 sites and arid – 40 sites). The values of the dots represent the median metric values of the sites in a given climate zone, while the error bar of each dot denotes the variability of the metric values. The green letter G stands for the good performance of the statistical metric values. Im denotes the aridity index, which is described and shown in Fig. 1.
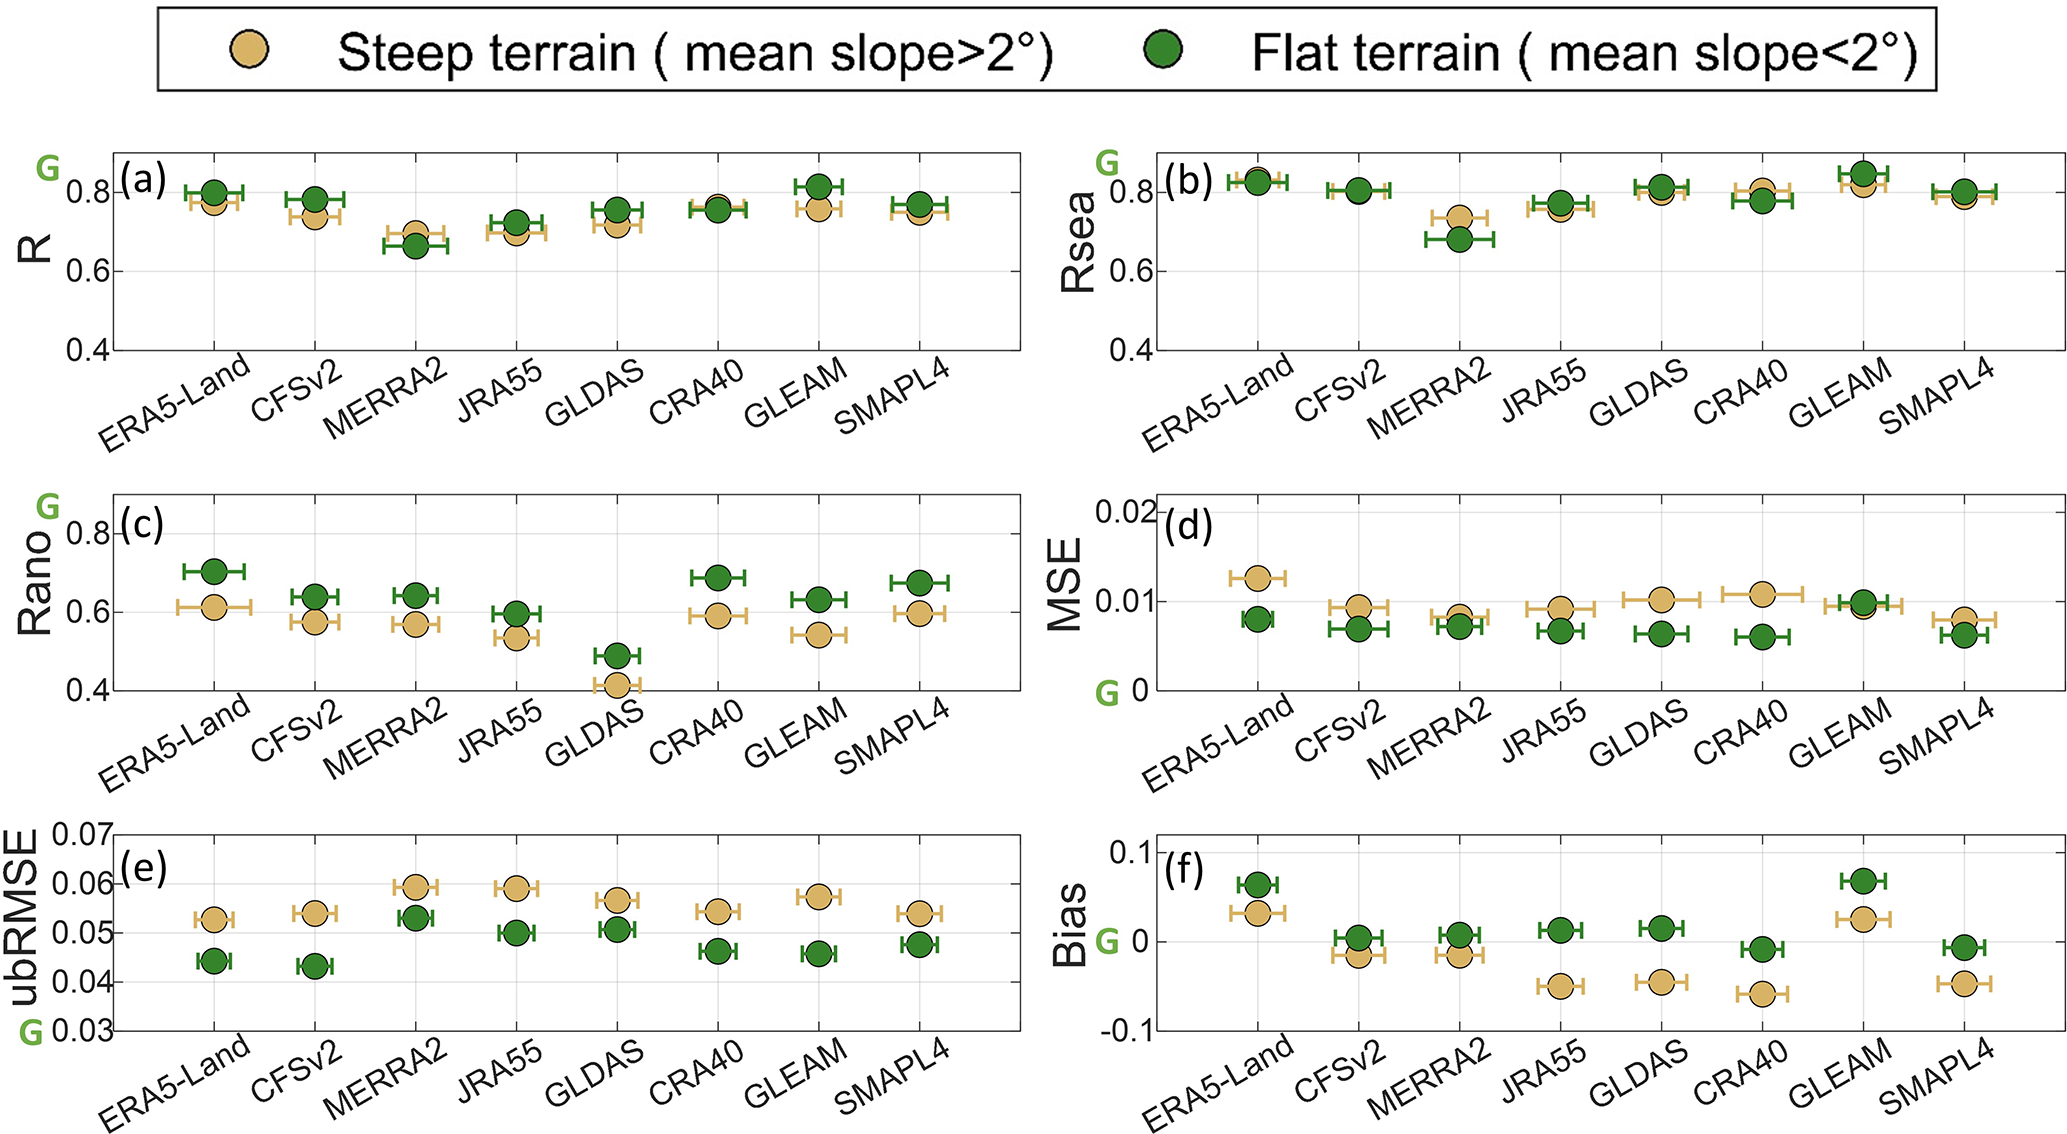
Figure 9Statistical metric performance for all products under different topographic slopes (steep terrain – 55 sites and flat terrain – 80 sites). The values of the dots represent the median metric values of the sites in a given terrain slope; the error bar of each dot denotes the variability of the metric values. The green letter G indicates the good performance of the statistical metric values.
4.2.4 Slope
Most reanalysis soil moisture products perform worse in areas of steep terrain, especially the metrics including R, Rano, MSE, ubRMSE and bias (Fig. 9). The values in Rsea under different topographic slopes from several reanalysis products (i.e. ERA5-Land, CFSv2, GLDAS, JRA55 and SMAP L4) are close to each other, which indicates that the performance in describing the temporal dynamics of seasonal soil moisture pattern does not depend on the terrain slope (Fig. 9b).
5.1 Reanalysis products' performance
This study has selected 135 CRNS sites across numerous networks globally and ensured the data were processed in a harmonised way to perform the assessment. We found that the performance of reanalysis soil moisture products varies in different regions, and this can be explained by climate, soil properties, land cover and topography conditions. Our findings provide recommendations in choosing reanalysis soil moisture products for use and insights into how to improve the accuracy of the evaluated datasets.
We find that while all reanalysis soil moisture products generally exhibit good agreement in the temporal correlation of soil moisture original time series (Fig. 5a), large deviations in temporal correlation during the growing season are observed in cropland and shrubland (Figs. 4d and 6). Low performance in cropland and shrubland might be attributed to strong biomass signal seasonal variations, which affects the accuracy of CRNS measurements. Seasonally varying vegetation cover or high amounts of vegetation biomass are found to be key sources of uncertainty in CRNS measurements (Andreasen et al., 2017; Zreda et al., 2012; Franz et al., 2013b; Bogena et al., 2013; Iwema et al., 2021). Montzka et al. (2017) also identified challenges in evaluating satellite soil moisture products against CRNS data at sites with seasonally changing vegetation cover. In addition, the lower correlation of reanalysis or satellite soil moisture products over densely vegetation regions is reported in studies by Hagan et al. (2019), Beck et al. (2021) and Kim et al. (2015, 2020), indicating the need for improving the vegetation parameters in land surface models or soil-moisture-retrieving algorithms (Baatz et al., 2015).
Furthermore, the low skill in capturing the temporal correlation of soil moisture anomalies time series is detected (Fig. 5c), which means that reanalysis soil moisture products generally show a poor response to precipitation events. Similar findings are reported in previous work (Hagan et al., 2019; Ling et al., 2021; Naz et al., 2020). Hagan et al. (2019) evaluated seven reanalysis products (i.e. ERA5, ERA-Interim, MERRA1, MERRA2, MERRA-Land, Noah 1.0, Noah 2.5) against ground measurements and showed the Rano of all soil moisture products is below 0.6. It is found that GLDAS has a weak ability in capturing the soil moisture anomalies (Deng et al., 2020; Naz et al., 2020), which is consistent with the notable Rano performance of GLDAS in our results. Moreover, Beck et al. (2017) evaluated 22 reanalysis and satellite precipitation datasets. Their study revealed that these precipitation products also tend to capture the monthly variation well but have lower performance in shorter timescales (i.e. Pearson correlation coefficient calculated for 3 d means, R3 d). This aligns with our findings that the reanalysis products tend to reproduce the seasonal pattern of the variables well but that it is hard to capture the anomalies.
Similar to previous studies, our results identify that climate, topographic slope, soil properties and land cover types are all influential factors in explaining the performance of the reanalysis products (Deng et al., 2020; Beck et al., 2021; Li et al., 2020; Hagan et al., 2019; Decker et al., 2012). In particular, our results show that all reanalysis soil moisture products tend to underestimate the soil moisture values in the sites located in humid regions, while overestimation is observed in arid climate (observed in comparison of Figs. 1 and 3d, e, f). Direct time series comparison over representative sites also confirms that reanalysis products generally exhibit negative bias and less variation in humid climates (Fig. 4b), whereas all products rarely dry out below 0.1 m3 m−3 during the dry periods in arid climate (Fig. 4c). This might be related to the fact that the soil moisture values from reanalysis products behave as an indicator of the soil wetness with a minimum threshold for soil moisture, for example, acting as a residual or limiting soil wetness fraction (Koster et al., 2009). Currently, most of the reanalysis soil moisture product evaluation studies are mainly regional-scale analysis, especially for China (Wu et al., 2021; Zheng et al., 2022; Xing et al., 2021; Qin et al., 2017; Yang et al., 2020; Cheng et al., 2019). Several studies have found that reanalysis products tend to overestimate soil moisture conditions in the Qinghai–Tibetan Plateau, northern China and Mongolia (regions that are dominated by an arid/semi-arid climate) (Ling et al., 2021; Wen et al., 2014; Zheng et al., 2022; Xing et al., 2021; Yang et al., 2020), or reanalysis products show worse performance in arid areas (Ling et al., 2021; Yang et al., 2021). Moreover, we also observed that most reanalysis products perform poorly in steep terrain, which is supported by previous studies (Beck et al., 2021; Kim et al., 2015; Ma et al., 2019; Yang et al., 2021; Nicolai-Shaw et al., 2015; Li et al., 2020).
Our results reveal that all reanalysis products show lower performance in terms of all statistical metrics at the sites with low bulk density and high soil organic carbon (Fig. S9), which are particularly from the humid regions in the UK. Similar findings are reported in the evaluation of soil moisture products against COSMOS-UK data by Peng et al. (2021). This suggests that the inaccurate soil properties' parameters in land surface models might be the cause of the large errors, as the soil organic carbon could exert a great impact on soil thermal as well as hydraulic properties, leading to deviations in soil moisture (Zhu et al., 2019; Chen et al., 2012; Lawrence and Slater, 2008; Hagan et al., 2019; Ling et al., 2021). The influence of soil organic carbon on the performance of satellite and reanalysis soil moisture products is frequently reported (Yang et al., 2020; Jonard et al., 2018; Qin et al., 2017; Xing et al., 2021). Moreover, relatively high uncertainties of CRNS hourly measurements over organic soils or in humid regions (observed in Fig. 4b) might also be the reason for explaining the lower performance for these UK sites. Although the impact of soil organic carbon on CRNS observations has been taken into account according to the crspy tool (Power et al., 2021a) used in this study, as mentioned in previous studies, it is more difficult to obtain the accurate soil moisture estimation and quantify the uncertainties of CRNS observations at sites with high soil organic carbon or in humid climates (Iwema et al., 2021; Bogena et al., 2013; Peng et al., 2021; Sigouin et al., 2016; Zhu et al., 2014; Franz et al., 2013a; Dimitrova-Petrova et al., 2021).
5.2 Recommendations for selecting suitable reanalysis products
To provide recommendations for the users, we classified the reanalysis products into three categories according to the Brunke ranking scores (Table S3, Fig. 10), which are calculated based on all six statistic metrics. We provide recommendations based on these scores regarding which product demonstrates better overall performance under various regions, climate, land cover and topographic slopes. A lower Brunke ranking score indicates the superior overall product performance, suggesting users to prioritise its selection for their analysis. The soil moisture products with the top two lowest Brunke ranking scores for each category are labelled with “ok”, indicating relatively good performance, whereas the soil moisture reanalysis products ranked last are labelled with “lower performance”. In particular, the soil moisture products with Brunke ranking scores less than 3.2 (i.e. the product with this threshold score indicates its average ranking is within or around the top three in terms of all six metrics across most of the sites in this category) are labelled with “higher performance”. The recommendations only highlight the notable performance of products (i.e. higher performance or lower performance) across regions, climate, land covers and topographic conditions. Yet, it should be noted that the differences in the median value of statistical metrics across all reanalysis products are relatively small, especially for the metric MSE and ubRMSE (Fig. 5). Figure 10 presents the intercomparison across different reanalysis soil moisture products, which does not mean that the product labelled with lower performance is not acceptable.
Overall, ERA5-Land, CRA40, CFSv2, SMAP L4 and GLEAM could be good choices for global analysis, which generally exhibit better performance in most circumstances than MERRA2, GLDAS-Noah and JRA55 (Fig. 10). Performances of reanalysis products vary across different regions. ERA5-Land ranks best in terms of R, Rsea,Rano and ubRMSE in mainland Europe (Fig. 2). CFSv2 and GLEAM are good alternatives for the UK, while SMAP L4 and ERA5-Land perform better in Australia, especially in describing the temporal correlation against the observations. CRA40 and SMAP L4 are the top two datasets that are suitable for the USA compared to other products.

Figure 10Recommendations for choosing eight reanalysis soil moisture products under various regions, climate, land cover and topographic slope conditions based on the average Brunke ranking scores.
Some products show excellent performance under specific climate, land cover or topographic conditions. For instance, CFSv2 can be an alternative for use in humid climate, temperate climate or regions in grassland, while SMAP L4 is suitable for arid climate. SMAP L4 also shows the good performance in cropland, which is consistent with the finding from Tavakol et al. (2019). Similar performance is observed in CRA40 and GLEAM, which both exhibit superior performance in shrubland. Although all reanalysis products show large bias in humid regions, ERA5-Land and CFSv2 are the optimal choice for humid climates. ERA5-Land also performs well in forest, cropland, grassland and steep or flat terrain. High spatial resolution might be the reason for explaining the superior performance of ERA5-Land. In contrast, products with coarser spatial resolution (> 0.5°), i.e. MERRA2 and JRA55, exhibit relatively poor performance, which is also observed by Li et al. (2020), Mahto and Mishra (2019). GLDAS-Noah ranks last for representing soil moisture conditions under forest, shrubland or steep terrain. Deng et al. (2020) also observed worse performance of GLDAS in many land cover types, especially the underestimation of soil moisture in forest. Reasons for low performance between reanalysis products and observations are diverse and complex. The performance of GLDAS-Noah and MERRA2 in predicting soil moisture could be related to the quality of meteorological forcing data and the soil property database (Zheng et al., 2022; Beck et al., 2021). Many other factors that are not included in this study might also contribute to the influence, for example, land surface model structures and parameterisation schemes (Deng et al., 2020; Yang et al., 2020; Xu et al., 2021). Future studies are encouraged to investigate the impact of these factors.
5.3 Limitations
The proposed method for resolving spatial-scale and vertical footprint matching currently represents the most reasonable solution after comparing several available approaches. Further studies are encouraged to find the ideal solution, especially for grids of multiple CRNS sites with different overlapping time periods, and how to process reanalysis products data at various depths while considering the CRNS sites effective depth. In addition, the sites used in this study are from COSMOS-UK, COSMOS-Europe, COSMOS USA and CosmOz Australia networks. Accordingly, the evaluation results are more applicable in these regions and regions with similar climates, soil properties, land cover and topographic conditions. It should be noted that the number of reanalysis product grid cells for evaluating the performance in Europe is limited (Table 3) as the majority of CRNS sites in the COSMOS-Europe network are concentrated in a small area of Germany. For some reanalysis products with large grid cells (e.g. CRA40), a total of 13 CRNS German sites are located within one grid cell, whereas the density of sites is relatively sparse for the rest of Europe; e.g. 19 CRA40 cells are evaluated against 41 CRNS sites, giving a ratio of 0.46. The ratio of the corresponding reanalysis product grid cells used for evaluation in Europe is relatively low, ranging from 0.46 to 0.78, while the lowest ratio of reanalysis product grid cells used for evaluation for the UK, USA and Australia is 0.73, 0.89 and 0.91, respectively. Additionally, the evaluation over Australia is also not very reliable due to lack of representativeness because huge parts of Australia are not sampled by CRNS. Thus, the evaluation results for mainland Europe and Australia are less reliable than those of the other regions. Furthermore, it is observed that the ratio also varies across different reanalysis products. The finer the spatial resolution, the lower the possibility that multiple CRNS sites are located within the same grid cell. Consequently, a large proportion of grid cells is used in ERA5-Land over different regions, while that ratio for CRA40, CFSv2, MERRA2 and JRA55 is normally the smallest.
Table 3The ratio of the reanalysis product grid cells and CRNS sites used for each region.

Regarding temporal coverage, our assessment of SMAP L4 product is limited by the period of record which begins in 2015. Since 70 % of our CRNS sites were established before 2015, the evaluation period for SMAP L4 is shorter than that for other reanalysis products, with 10 CRNS sites exhibiting temporal overlaps of less than 2 years. SMAP L4 is included in this analysis because it has been a state-of-the-art data assimilation soil moisture reanalysis product in recent years, yet it should be noted that it is evaluated over a shorter time period compared to the other reanalysis products.
In addition, the statistical metrics describing bias might not be as reliable as the ones quantifying the temporal correlation. Metrics such as R, Rsea and Rano, which measure how well the reanalysis product soil moisture time series data are consistent with the soil moisture time series temporal dynamics, are the most reliable statistical metrics and also of interest for the majority of soil moisture products' applications (Beck et al., 2021; Kim et al., 2015; Gruber et al., 2020). By contrast, the reliability of the bias metric might be affected, as the inherent scale discrepancy in soil depth and footprint between CRNS and reanalysis product grid cells still remains a limit (Crow et al., 2012; Miralles et al., 2010; Albergel et al., 2012; Kim et al., 2015; Montzka et al., 2017; Peng et al., 2021). The time series comparison in RDMER UK site indicates that the finer spatial resolution might relieve the bias caused by the scale mismatch (Fig. 4b).
To assist researchers in choosing suitable reanalysis soil moisture products, this study systematically evaluates eight reanalysis soil moisture products against soil moisture field measurements from 135 CRNS sites across numerous networks globally, which are processed in a harmonised way. The performance of reanalysis products under diverse soil properties, climates, land cover and topographic conditions is also investigated.
All reanalysis products generally exhibit good agreement in terms of temporal correlation with the median of R values over 0.7, whereas the lower performance with Rano values is detected, indicating the weaker ability of capturing the soil moisture anomalies. In particular, GLDAS has the lowest Rano values (0.46) across all sites. Low correlations of reanalysis products are observed in cropland or shrubland with seasonally varying vegetation cover. As for the bias, reanalysis soil moisture products tend to overestimate data in arid regions and underestimate data in humid regions as well as grassland. It is also notable that reanalysis products exhibit worse performance in steep terrain.
Performances of reanalysis soil moisture products differ among regions, climate, soil properties, land cover and topography conditions. CFSv2 exhibits good performance across the UK and Europe. ERA5-Land performs well in Europe and Australia. SMAP L4 is suitable to be used in Australia and USA. GLEAM is a viable choice for the UK, whereas CRA40 can be an alternative in representing soil moisture conditions for the USA. Generally, ERA5-Land and CFSv2 show superior performance in humid climates, while SMAP L4 and CRA40 are recommended for arid regions. MERRA2 is less effective in humid and temperate climates, whereas JRA55 performs poorly in arid climate. In addition, GLEAM performs best over shrubland, followed by CRA40. ERA5-Land and CRA40 are suitable for steep terrain. For users seeking one product for global analysis, ERA5-Land, CRA40, CFSv2, SMAP L4 and GLEAM are viable options, as these products generally show better performance. Yet, it is important to acknowledge that due to the availability of CRNS observations, the findings of this study are more applicable in the UK, Europe, the USA, Australia and regions with similar conditions.
We also find that all reanalysis products fail to provide good performance in all statistical metrics at the sites with low bulk density and high soil organic carbon. These sites are mainly from the humid regions, i.e. the UK. This might be attributed to the limitation in representing the process over low bulk density and high organic soils in the land surface model. It is also possible that CRNS technology is challenging to provide accurate soil moisture information over these soil properties in humid regions.
In this paper, we used the following classification (Table A1) to reclassify the land cover data from two works to four land cover types.
Table A1Land cover classes from Power et al. (2021a) and Bogena et al. (2022) along with the reclassified land cover types used in this work.

The code of Cosmic-Ray Sensor PYthon tool (crspy) is available at https://github.com/danpower101/crspy (last access: 5 January 2024; https://doi.org/10.5281/zenodo.5543669, Power et al., 2021b). COSMOS-UK is freely available at https://doi.org/10.5285/b5c190e4-e35d-40ea-8fbe-598da03a1185 (Stanley et al., 2021). COSMOS-Europe is available at https://doi.org/10.34731/x9s3-kr48 (Bogena and Ney, 2021). COSMOS USA is available via http://cosmos.hwr.arizona.edu/ (Zreda et al., 2012). CosmOz Australia is available via https://doi.org/10.25901/5e7ab81af0394 (McJannet et al., 2021). ERA5-Land data are accessible at https://doi.org/10.24381/cds.e2161bac (Muñoz Sabater, 2019). CFSv2 data can be downloaded from https://doi.org/10.5065/D6N877VB (Saha et al., 2011). MERRA-2 data can be found at https://doi.org/10.5067/VJAFPLI1CSIV (GMAO, 2015). JRA55 data are given at https://doi.org/10.5065/D6HH6H41 (JMA, 2013). GLDAS-Noah v2.1 data are available from https://doi.org/10.5067/E7TYRXPJKWOQ (Beaudoing and Rodell, 2020). CRA40 can be obtained from https://data.cma.cn/data/detail/dataCode/NAFP_CRA40_FTM_DAY_NC.html (Liu et al., 2017). GLEAM v3.5a is available at https://www.gleam.eu/ (Martens et al., 2017). SMAP L4 can be downloaded from https://doi.org/10.5067/LWJ6TF5SZRG3 (Reichle et al., 2022). The detailed information (“CRNSsiteDataNEWR1.xlsx”) and calculated statistical metrics (“StatisticMetricNEWR1.xlsx”) for each site can be found in the Supplement.
The supplement related to this article is available online at: https://doi.org/10.5194/hess-28-1999-2024-supplement.
YZ conceptualised the work, YZ, GC and RW designed the study. DP, RR, MRR and DM contributed to process CRNS observations. YZ processed the reanalysis soil moisture products and performed the analysis. JL and PF provided resources and funding. All authors contributed to the investigation and discussion of the results and writing and editing of the manuscript.
The contact author has declared that none of the authors has any competing interests.
Publisher’s note: Copernicus Publications remains neutral with regard to jurisdictional claims made in the text, published maps, institutional affiliations, or any other geographical representation in this paper. While Copernicus Publications makes every effort to include appropriate place names, the final responsibility lies with the authors.
The financial support from the China Scholarship Council (no. 202006250090) for Yanchen Zheng is gratefully acknowledged. Yanchen Zheng and Gemma Coxon were funded by a UKRI Future Leaders Fellowship award (MR/V022857/1). Jianzhu Li would like to thank the National Natural Science Foundation of China (grant number 52279022). Ping Feng was supported by the National Natural Science Foundation of China (grant number 52079086). Rafael Rosolem and Daniel Power would also like to acknowledge a number of funding agencies including the Engineering and Physical Sciences Research Council (EPSRC) Water Informatics: Science and Engineering Centre for Doctoral Training (WISE-CDT; grant no. EP/L016214/1) and additional support from the MOSAIC Digital Environment Feasibility Study (grant no. NE/T005645/1) and the COSMIC-SWAMP IoT Enabled Cosmic Ray Sensors for Irrigation Monitoring (grant no. NE/W004364/1), all of which are funded by the Natural Environment Research Council (NERC), and also from the International Atomic Energy Agency of the United Nations (IAEA/UN; project no. CRP D12014). Funding for the CosmOz network was provided through the Terrestrial Ecosystem Research Network (TERN), which is part of the National Collaborative Research Infrastructure Strategy (NCRIS) programme. The authors express their great thanks to Magdalena Szczykulska, Elizabeth Cooper and Jonathan Evans from UKCEH and the COSMOS-UK team for providing the N0 calibration data.
This research has been supported by the China Scholarship Council (grant no. 202006250090), the UK Research and Innovation (grant no. MR/V022857/1), the National Natural Science Foundation of China (grant nos. 52279022 and 52079086), the Engineering and Physical Sciences Research Council (grant no. EP/L016214/1), the Natural Environment Research Council UK (grant no. NE/T005645/1), the COSMIC-SWAMP IoT (grant no. NE/W004364/1) and the International Atomic Energy Agency (grant no. CRP D12014).
This paper was edited by Harrie-Jan Hendricks Franssen and reviewed by two anonymous referees.
Albergel, C., De Rosnay, P., Gruhier, C., Muñoz-Sabater, J., Hasenauer, S., Isaksen, L., Kerr, Y., and Wagner, W.: Evaluation of remotely sensed and modelled soil moisture products using global ground-based in situ observations, Remote Sens. Environ., 118, 215–226, https://doi.org/10.1016/j.rse.2011.11.017, 2012.
Al-Yaari, A., Wigneron, J.-P., Ducharne, A., Kerr, Y., De Rosnay, P., De Jeu, R., Govind, A., Al Bitar, A., Albergel, C., and Munoz-Sabater, J.: Global-scale evaluation of two satellite-based passive microwave soil moisture datasets (SMOS and AMSR-E) with respect to Land Data Assimilation System estimates, Remote Sens. Environ., 149, 181–195, https://doi.org/10.1016/j.rse.2014.04.006, 2014.
Andreasen, M., Jensen, K. H., Desilets, D., Franz, T. E., Zreda, M., Bogena, H. R., and Looms, M. C.: Status and perspectives on the cosmic-ray neutron method for soil moisture estimation and other environmental science applications, Vadose Zone J., 16, 1–11, https://doi.org/10.2136/vzj2017.04.0086, 2017.
Baatz, R., Bogena, H., Hendricks Franssen, H. J., Huisman, J., Montzka, C., and Vereecken, H.: An empirical vegetation correction for soil water content quantification using cosmic ray probes, Water Resour. Res., 51, 2030–2046, https://doi.org/10.1002/2014WR016443, 2015.
Baatz, R., Hendricks Franssen, H., Euskirchen, E., Sihi, D., Dietze, M., Ciavatta, S., Fennel, K., Beck, H., De Lannoy, G., and Pauwels, V.: Reanalysis in Earth system science: Toward terrestrial ecosystem reanalysis, Rev. Geophys., 59, e2020RG000715, https://doi.org/10.1029/2020RG000715, 2021.
Beaudoing, H. and Rodell, M.: NASA/GSFC/HSL: GLDAS Noah Land Surface Model L4 3 hourly 0.25 x 0.25 degree V2.1, Greenbelt, Maryland, USA, Goddard Earth Sciences Data and Information Services Center (GES DISC) [data set], https://doi.org/10.5067/E7TYRXPJKWOQ, 2020.
Beck, H. E., Vergopolan, N., Pan, M., Levizzani, V., van Dijk, A. I. J. M., Weedon, G. P., Brocca, L., Pappenberger, F., Huffman, G. J., and Wood, E. F.: Global-scale evaluation of 22 precipitation datasets using gauge observations and hydrological modeling, Hydrol. Earth Syst. Sci., 21, 6201–6217, https://doi.org/10.5194/hess-21-6201-2017, 2017.
Beck, H. E., Pan, M., Miralles, D. G., Reichle, R. H., Dorigo, W. A., Hahn, S., Sheffield, J., Karthikeyan, L., Balsamo, G., Parinussa, R. M., van Dijk, A. I. J. M., Du, J., Kimball, J. S., Vergopolan, N., and Wood, E. F.: Evaluation of 18 satellite- and model-based soil moisture products using in situ measurements from 826 sensors, Hydrol. Earth Syst. Sci., 25, 17–40, https://doi.org/10.5194/hess-25-17-2021, 2021.
Bierkens, M. F., Bell, V. A., Burek, P., Chaney, N., Condon, L. E., David, C. H., de Roo, A., Döll, P., Drost, N., and Famiglietti, J. S.: Hyper-resolution global hydrological modelling: what is next? “Everywhere and locally relevant”, Hydrol. Process., 29, 310–320, https://doi.org/10.1002/hyp.10391, 2015.
Bogena, H., Huisman, J., Baatz, R., Hendricks Franssen, H. J., and Vereecken, H.: Accuracy of the cosmic-ray soil water content probe in humid forest ecosystems: The worst case scenario, Water Resour. Res., 49, 5778–5791, https://doi.org/10.1002/wrcr.20463, 2013.
Bogena, H. R.: TERENO: German network of terrestrial environmental observatories, Journal of large-scale research facilities JLSRF, 2, A52–A52, https://doi.org/10.17815/jlsrf-2-98, 2016.
Bogena, H. and Ney, P.: Dataset of “COSMOS-Europe: A European network of Cosmic-Ray Neutron Soil Moisture Sensors”, Forschungszentrum Jülich [data set], https://doi.org/10.34731/x9s3-kr48, 2021.
Bogena, H. R., Schrön, M., Jakobi, J., Ney, P., Zacharias, S., Andreasen, M., Baatz, R., Boorman, D., Duygu, M. B., Eguibar-Galán, M. A., Fersch, B., Franke, T., Geris, J., González Sanchis, M., Kerr, Y., Korf, T., Mengistu, Z., Mialon, A., Nasta, P., Nitychoruk, J., Pisinaras, V., Rasche, D., Rosolem, R., Said, H., Schattan, P., Zreda, M., Achleitner, S., Albentosa-Hernández, E., Akyürek, Z., Blume, T., del Campo, A., Canone, D., Dimitrova-Petrova, K., Evans, J. G., Ferraris, S., Frances, F., Gisolo, D., Güntner, A., Herrmann, F., Iwema, J., Jensen, K. H., Kunstmann, H., Lidón, A., Looms, M. C., Oswald, S., Panagopoulos, A., Patil, A., Power, D., Rebmann, C., Romano, N., Scheiffele, L., Seneviratne, S., Weltin, G., and Vereecken, H.: COSMOS-Europe: a European network of cosmic-ray neutron soil moisture sensors, Earth Syst. Sci. Data, 14, 1125–1151, https://doi.org/10.5194/essd-14-1125-2022, 2022.
Brocca, L., Moramarco, T., Melone, F., Wagner, W., Hasenauer, S., and Hahn, S.: Assimilation of surface- and root-zone ASCAT soil moisture products into rainfall-runoff modeling, IEEE T. Geosci. Remote, 50, 2542–2555, 10.1109/TGRS.2011.2177468, 2012.
Brunke, M. A., Fairall, C. W., Zeng, X., Eymard, L., and Curry, J. A.: Which bulk aerodynamic algorithms are least problematic in computing ocean surface turbulent fluxes?, J. Climate, 16, 619–635, https://doi.org/10.1175/1520-0442(2003)016<0619:WBAAAL>2.0.CO;2, 2003.
Chawla, I., Karthikeyan, L., and Mishra, A. K.: A review of remote sensing applications for water security: Quantity, quality, and extremes, J. Hydrol., 585, 124826, https://doi.org/10.1016/j.jhydrol.2020.124826, 2020.
Chen, S., Gan, T. Y., Tan, X., Shao, D., and Zhu, J.: Assessment of CFSR, ERA-Interim, JRA-55, MERRA-2, NCEP-2 reanalysis data for drought analysis over China, Clim. Dynam., 53, 737–757, https://doi.org/10.1007/s00382-018-04611-1, 2019.
Chen, Y. and Yuan, H.: Evaluation of nine sub-daily soil moisture model products over China using high-resolution in situ observations, J. Hydrol., 588, 125054, https://doi.org/10.1016/j.jhydrol.2020.125054, 2020.
Chen, Y., Yang, K., Tang, W., Qin, J., and Zhao, L.: Parameterizing soil organic carbon's impacts on soil porosity and thermal parameters for Eastern Tibet grasslands, Sci. China Earth Sci., 55, 1001–1011, https://doi.org/10.1007/s11430-012-4433-0, 2012.
Cheng, M., Zhong, L., Ma, Y., Zou, M., Ge, N., Wang, X., and Hu, Y.: A study on the assessment of multi-source satellite soil moisture products and reanalysis data for the Tibetan Plateau, Remote Sens., 11, 1196, https://doi.org/10.3390/rs11101196, 2019.
Cooper, H. M., Bennett, E., Blake, J., Blyth, E., Boorman, D., Cooper, E., Evans, J., Fry, M., Jenkins, A., Morrison, R., Rylett, D., Stanley, S., Szczykulska, M., Trill, E., Antoniou, V., Askquith-Ellis, A., Ball, L., Brooks, M., Clarke, M. A., Cowan, N., Cumming, A., Farrand, P., Hitt, O., Lord, W., Scarlett, P., Swain, O., Thornton, J., Warwick, A., and Winterbourn, B.: COSMOS-UK: national soil moisture and hydrometeorology data for environmental science research, Earth Syst. Sci. Data, 13, 1737–1757, https://doi.org/10.5194/essd-13-1737-2021, 2021.
Crow, W. T., Berg, A. A., Cosh, M. H., Loew, A., Mohanty, B. P., Panciera, R., de Rosnay, P., Ryu, D., and Walker, J. P.: Upscaling sparse ground-based soil moisture observations for the validation of coarse-resolution satellite soil moisture products, Rev. Geophys., 50, RG2002, https://doi.org/10.1029/2011RG000372, 2012.
Cui, C., Xu, J., Zeng, J., Chen, K.-S., Bai, X., Lu, H., Chen, Q., and Zhao, T.: Soil moisture mapping from satellites: An intercomparison of SMAP, SMOS, FY3B, AMSR2, and ESA CCI over two dense network regions at different spatial scales, Remote Sens., 10, 33, https://doi.org/10.3390/rs10010033, 2018.
Davies, P., Baatz, R., Bogena, H. R., Quansah, E., and Amekudzi, L. K.: Optimal Temporal Filtering of the Cosmic-Ray Neutron Signal to Reduce Soil Moisture Uncertainty, Sensors, 22, 9143, https://doi.org/10.3390/s22239143, 2022.
Decker, M., Brunke, M. A., Wang, Z., Sakaguchi, K., Zeng, X., and Bosilovich, M. G.: Evaluation of the reanalysis products from GSFC, NCEP, and ECMWF using flux tower observations, J. Climate, 25, 1916–1944, https://doi.org/10.1175/JCLI-D-11-00004.1, 2012.
Deng, M., Meng, X., Lu, Y., Li, Z., Zhao, L., Hu, Z., Chen, H., Shang, L., Wang, S., and Li, Q.: Impact and Sensitivity Analysis of Soil Water and Heat Transfer Parameterizations in Community Land Surface Model on the Tibetan Plateau, J. Adv. Model. Earth Sy., 13, e2021MS002670, https://doi.org/10.1029/2021MS002670, 2021.
Deng, Y., Wang, S., Bai, X., Wu, L., Cao, Y., Li, H., Wang, M., Li, C., Yang, Y., and Hu, Z.: Comparison of soil moisture products from microwave remote sensing, land model, and reanalysis using global ground observations, Hydrol. Process., 34, 836–851, https://doi.org/10.1002/hyp.13636, 2020.
Desilets, D. and Zreda, M.: Footprint diameter for a cosmic-ray soil moisture probe: Theory and Monte Carlo simulations, Water Resour. Res., 49, 3566–3575, https://doi.org/10.1002/wrcr.20187, 2013.
Desilets, D., Zreda, M., and Prabu, T.: Extended scaling factors for in situ cosmogenic nuclides: new measurements at low latitude, Earth Planet. Sc. Lett., 246, 265-276, https://doi.org/10.1016/j.epsl.2006.03.051, 2006.
Desilets, D., Zreda, M., and Ferré, T. P.: Nature's neutron probe: Land surface hydrology at an elusive scale with cosmic rays, Water Resour. Res., 46, W11505, https://doi.org/10.1029/2009WR008726, 2010.
Dimitrova-Petrova, K., Rosolem, R., Soulsby, C., Wilkinson, M. E., Lilly, A., and Geris, J.: Combining static and portable Cosmic ray neutron sensor data to assess catchment scale heterogeneity in soil water storage and their integrated role in catchment runoff response, J. Hydrol., 601, 126659, https://doi.org/10.1016/j.jhydrol.2021.126659, 2021.
Dong, J., Ochsner, T. E., Zreda, M., Cosh, M. H., and Zou, C. B.: Calibration and validation of the COSMOS rover for surface soil moisture measurement, Vadose Zone J., 13, 1–8, https://doi.org/10.2136/vzj2013.08.0148, 2014.
Dorigo, W., Gruber, A., De Jeu, R., Wagner, W., Stacke, T., Loew, A., Albergel, C., Brocca, L., Chung, D., and Parinussa, R.: Evaluation of the ESA CCI soil moisture product using ground-based observations, Remote Sens. Environ., 162, 380–395, https://doi.org/10.1016/j.rse.2014.07.023, 2015.
Duygu, M. B. and Akyürek, Z.: Using cosmic-ray neutron probes in validating satellite soil moisture products and land surface models, Water, 11, 1362, https://doi.org/10.3390/w11071362, 2019.
El Khalki, E. M., Tramblay, Y., Massari, C., Brocca, L., Simonneaux, V., Gascoin, S., and Saidi, M. E. M.: Challenges in flood modeling over data-scarce regions: how to exploit globally available soil moisture products to estimate antecedent soil wetness conditions in Morocco, Nat. Hazards Earth Syst. Sci., 20, 2591–2607, https://doi.org/10.5194/nhess-20-2591-2020, 2020.
ESA Land Cover CCI Project Team and Defourny, P.: ESA Land Cover Climate Change Initiative (Land_Cover_cci): Global Land Cover Maps, Version 2.0.7, Centre for Environmental Data Analysis [data set], https://catalogue.ceda.ac.uk/uuid/b382ebe6679d44b8b0e68ea4ef4b701c (last access: 6611 November 2021), 2019.
Evans, J., Ward, H., Blake, J., Hewitt, E., Morrison, R., Fry, M., Ball, L., Doughty, L., Libre, J., and Hitt, O.: Soil water content in southern England derived from a cosmic-ray soil moisture observing system – COSMOS-UK, Hydrol. Process., 30, 4987–4999, https://doi.org/10.1002/hyp.10929, 2016.
Ford, T. W. and Quiring, S. M.: Comparison of contemporary in situ, model, and satellite remote sensing soil moisture with a focus on drought monitoring, Water Resour. Res., 55, 1565–1582, https://doi.org/10.1029/2018WR024039, 2019.
Franz, T. E., Zreda, M., Ferre, T., Rosolem, R., Zweck, C., Stillman, S., Zeng, X., and Shuttleworth, W.: Measurement depth of the cosmic ray soil moisture probe affected by hydrogen from various sources, Water Resour. Res., 48, W08515, https://doi.org/10.1029/2012WR011871, 2012.
Franz, T. E., Zreda, M., Rosolem, R., and Ferre, T. P. A.: A universal calibration function for determination of soil moisture with cosmic-ray neutrons, Hydrol. Earth Syst. Sci., 17, 453–460, https://doi.org/10.5194/hess-17-453-2013, 2013a.
Franz, T. E., Zreda, M., Rosolem, R., Hornbuckle, B. K., Irvin, S. L., Adams, H., Kolb, T. E., Zweck, C., and Shuttleworth, W. J.: Ecosystem-scale measurements of biomass water using cosmic ray neutrons, Geophys. Res. Lett., 40, 3929–3933, https://doi.org/10.1002/grl.50791, 2013b.
Gelaro, R., McCarty, W., Suárez, M. J., Todling, R., Molod, A., Takacs, L., Randles, C. A., Darmenov, A., Bosilovich, M. G., and Reichle, R.: The modern-era retrospective analysis for research and applications, version 2 (MERRA-2), J. Climate, 30, 5419–5454, https://doi.org/10.1175/JCLI-D-16-0758.1, 2017.
Global Modeling and Assimilation Office (GMAO): MERRA-2 tavg1_2d_slv_Nx: 2d,1-Hourly,Time-Averaged,Single-Level,Assimilation,Single-Level Diagnostics V5.12.4, Greenbelt, MD, USA, Goddard Earth Sciences Data and Information Services Center (GES DISC) [data set], https://doi.org/10.5067/VJAFPLI1CSIV, 2015.
González-Zamora, Á., Sánchez, N., Pablos, M., and Martínez-Fernández, J.: CCI soil moisture assessment with SMOS soil moisture and in situ data under different environmental conditions and spatial scales in Spain, Remote Sens. Environ., 225, 469–482, https://doi.org/10.1016/j.rse.2018.02.010, 2019.
Gruber, A., Dorigo, W. A., Zwieback, S., Xaver, A., and Wagner, W.: Characterizing coarse-scale representativeness of in situ soil moisture measurements from the International Soil Moisture Network, Vadose Zone J., 12, 1–16, https://doi.org/10.2136/vzj2012.0170, 2013.
Gruber, A., De Lannoy, G., Albergel, C., Al-Yaari, A., Brocca, L., Calvet, J.-C., Colliander, A., Cosh, M., Crow, W., and Dorigo, W.: Validation practices for satellite soil moisture retrievals: What are (the) errors?, Remote Sens. Environ., 244, 111806, https://doi.org/10.1016/j.rse.2020.111806, 2020.
Hagan, D. F. T., Parinussa, R. M., Wang, G., and Draper, C. S.: An evaluation of soil moisture anomalies from global model-based datasets over the people's republic of China, Water, 12, 117, https://doi.org/10.3390/w12010117, 2019.
Harris, I., Jones, P. D., Osborn, T. J., and Lister, D. H.: Updated high©\resolution grids of monthly climatic observations–the CRU TS3. 10 Dataset, Int. J. Climatol., 34, 623–642, https://doi.org/10.1002/joc.3711, 2014.
Hawdon, A., McJannet, D., and Wallace, J.: Calibration and correction procedures for cosmic-ray neutron soil moisture probes located across Australia, Water Resour. Res., 50, 5029–5043, https://doi.org/10.1002/2013WR015138, 2014.
Hengl, T., Mendes de Jesus, J., Heuvelink, G. B., Ruiperez Gonzalez, M., Kilibarda, M., Blagotiæ, A., Shangguan, W., Wright, M. N., Geng, X., and Bauer-Marschallinger, B.: SoilGrids250m: Global gridded soil information based on machine learning, PLoS one, 12, e0169748, https://doi.org/10.1371/journal.pone.0169748, 2017.
Iwema, J., Rosolem, R., Baatz, R., Wagener, T., and Bogena, H. R.: Investigating temporal field sampling strategies for site-specific calibration of three soil moisture–neutron intensity parameterisation methods, Hydrol. Earth Syst. Sci., 19, 3203–3216, https://doi.org/10.5194/hess-19-3203-2015, 2015.
Iwema, J., Rosolem, R., Rahman, M., Blyth, E., and Wagener, T.: Land surface model performance using cosmic-ray and point-scale soil moisture measurements for calibration, Hydrol. Earth Syst. Sci., 21, 2843–2861, https://doi.org/10.5194/hess-21-2843-2017, 2017.
Iwema, J., Schrön, M., Koltermann Da Silva, J., Schweiser De Paiva Lopes, R., and Rosolem, R.: Accuracy and precision of the cosmic-ray neutron sensor for soil moisture estimation at humid environments, Hydrol. Process., 35, e14419, https://doi.org/10.1002/hyp.14419, 2021.
JMA: JRA-55: Japanese 55-year Reanalysis, Daily 3-Hourly and 6-Hourly Data, Research Data Archive at the National Center for Atmospheric Research, Computational and Information Systems Laboratory [data set], https://doi.org/10.5065/D6HH6H41, 2013.
Jonard, F., Bircher, S., Demontoux, F., Weihermüller, L., Razafindratsima, S., Wigneron, J.-P., and Vereecken, H.: Passive L-band microwave remote sensing of organic soil surface layers: A tower-based experiment, Remote Sens., 10, 304, https://doi.org/10.3390/rs10020304, 2018.
Karra, K., Kontgis, C., Statman-Weil, Z., Mazzariello, J. C., Mathis, M., and Brumby, S. P.: Global land use/land cover with Sentinel 2 and deep learning, 2021 IEEE International Geoscience and Remote Sensing Symposium IGARSS, Brussels, Belgium, 11–16 July 2021, 4704–4707, https://doi.org/10.1109/IGARSS47720.2021.9553499, 2021.
Karthikeyan, L., Chawla, I., and Mishra, A. K.: A review of remote sensing applications in agriculture for food security: Crop growth and yield, irrigation, and crop losses, J. Hydrol., 586, 124905, https://doi.org/10.1016/j.jhydrol.2020.124905, 2020.
Kêdzior, M. and Zawadzki, J.: Comparative study of soil moisture estimations from SMOS satellite mission, GLDAS database, and cosmic-ray neutrons measurements at COSMOS station in Eastern Poland, Geoderma, 283, 21–31, https://doi.org/10.1016/j.geoderma.2016.07.023, 2016.
Kim, H., Parinussa, R., Konings, A. G., Wagner, W., Cosh, M. H., Lakshmi, V., Zohaib, M., and Choi, M.: Global-scale assessment and combination of SMAP with ASCAT (active) and AMSR2 (passive) soil moisture products, Remote Sens. Environ., 204, 260–275, https://doi.org/10.1016/j.rse.2017.10.026, 2018.
Kim, H., Wigneron, J.-P., Kumar, S., Dong, J., Wagner, W., Cosh, M. H., Bosch, D. D., Collins, C. H., Starks, P. J., and Seyfried, M.: Global scale error assessments of soil moisture estimates from microwave-based active and passive satellites and land surface models over forest and mixed irrigated/dryland agriculture regions, Remote Sens. Environ., 251, 112052, https://doi.org/10.1016/j.rse.2020.112052, 2020.
Kim, S., Liu, Y. Y., Johnson, F. M., Parinussa, R. M., and Sharma, A.: A global comparison of alternate AMSR2 soil moisture products: Why do they differ?, Remote Sens. Environ., 161, 43–62, https://doi.org/10.1016/j.rse.2015.02.002, 2015.
Knoben, W. J., Woods, R. A., and Freer, J. E.: A quantitative hydrological climate classification evaluated with independent streamflow data, Water Resour. Res., 54, 5088–5109, https://doi.org/10.1029/2018WR022913, 2018.
Kobayashi, S., Ota, Y., Harada, Y., Ebita, A., Moriya, M., Onoda, H., Onogi, K., Kamahori, H., Kobayashi, C., and Endo, H.: The JRA-55 reanalysis: General specifications and basic characteristics, J. Meteorol. Soc. Jpn. II, 93, 5–48, https://doi.org/10.2151/jmsj.2015-001, 2015.
Köhli, M., Schrön, M., Zreda, M., Schmidt, U., Dietrich, P., and Zacharias, S.: Footprint characteristics revised for field-scale soil moisture monitoring with cosmic-ray neutrons, Water Resour. Res., 51, 5772–5790, https://doi.org/10.1002/2015WR017169, 2015.
Koster, R. D., Guo, Z., Yang, R., Dirmeyer, P. A., Mitchell, K., and Puma, M. J.: On the nature of soil moisture in land surface models, J. Climate, 22, 4322–4335, https://doi.org/10.1175/2009JCLI2832.1, 2009.
Lawrence, D. M. and Slater, A. G.: Incorporating organic soil into a global climate model, Clim. Dynam., 30, 145–160, 2008.
Li, C., Zhao, T., Shi, C., and Liu, Z.: Assessment of precipitation from the CRA40 dataset and new generation reanalysis datasets in the global domain, Int. J. Climatol., 41, 5243–5263, https://doi.org/10.1002/joc.7127, 2021.
Li, H., Robock, A., Liu, S., Mo, X., and Viterbo, P.: Evaluation of reanalysis soil moisture simulations using updated Chinese soil moisture observations, J. Hydrometeorol., 6, 180–193, https://doi.org/10.1175/JHM416.1, 2005.
Li, M., Wu, P., and Ma, Z.: A comprehensive evaluation of soil moisture and soil temperature from third-generation atmospheric and land reanalysis data sets, Int. J. Climatol., 40, 5744–5766, https://doi.org/10.1002/joc.6549, 2020.
Ling, X., Huang, Y., Guo, W., Wang, Y., Chen, C., Qiu, B., Ge, J., Qin, K., Xue, Y., and Peng, J.: Comprehensive evaluation of satellite-based and reanalysis soil moisture products using in situ observations over China, Hydrol. Earth Syst. Sci., 25, 4209–4229, https://doi.org/10.5194/hess-25-4209-2021, 2021.
Liu, Z., Shi, C., Zhou, Z., Jiang, L., Liang, X., Zhang, T., Liao, J., Liu, J., Wang, M., and Yao, S.: CMA global reanalysis (CRA-40): Status and plans, Proc. 5th International Conference on Reanalysis, Rome, Italy, https://climate.copernicus.eu/sites/default/files/repository/Events/ICR5/Talks/zhinqua liu_13pm.pdf, 13–17 November, 2017 (data available at: https://data.cma.cn/data/detail/dataCode/NAFP_CRA40_FTM_DAY_NC.html, last access: 27 April 2021).
Ma, H., Zeng, J., Chen, N., Zhang, X., Cosh, M. H., and Wang, W.: Satellite surface soil moisture from SMAP, SMOS, AMSR2 and ESA CCI: A comprehensive assessment using global ground-based observations, Remote Sens. Environ., 231, 111215, https://doi.org/10.1016/j.rse.2019.111215, 2019.
Mahto, S. S. and Mishra, V.: Does ERA-5 outperform other reanalysis products for hydrologic applications in India?, J. Geophys. Res.-Atmos., 124, 9423–9441, https://doi.org/10.1029/2019JD031155, 2019.
Martens, B., Miralles, D. G., Lievens, H., van der Schalie, R., de Jeu, R. A. M., Fernández-Prieto, D., Beck, H. E., Dorigo, W. A., and Verhoest, N. E. C.: GLEAM v3: satellite-based land evaporation and root-zone soil moisture, Geosci. Model Dev., 10, 1903–1925, https://doi.org/10.5194/gmd-10-1903-2017, 2017 (data available at: https://www.gleam.eu/, last access: 12 June 2021).
Martínez-Fernández, J., González-Zamora, A., Sánchez, N., Gumuzzio, A., and Herrero-Jiménez, C.: Satellite soil moisture for agricultural drought monitoring: Assessment of the SMOS derived Soil Water Deficit Index, Remote Sens. Environ., 177, 277–286, https://doi.org/10.1016/j.rse.2016.02.064, 2016.
Massari, C., Brocca, L., Barbetta, S., Papathanasiou, C., Mimikou, M., and Moramarco, T.: Using globally available soil moisture indicators for flood modelling in Mediterranean catchments, Hydrol. Earth Syst. Sci., 18, 839–853, https://doi.org/10.5194/hess-18-839-2014, 2014.
Massari, C., Camici, S., Ciabatta, L., and Brocca, L.: Exploiting satellite-based surface soil moisture for flood forecasting in the Mediterranean area: State update versus rainfall correction, Remote Sens., 10, 292, https://doi.org/10.3390/rs10020292, 2018.
McClean, F., Dawson, R., and Kilsby, C.: Intercomparison of global reanalysis precipitation for flood risk modelling, Hydrol. Earth Syst. Sci., 27, 331–347, https://doi.org/10.5194/hess-27-331-2023, 2023.
McJannet, D., Stenson, M., Sommer, A., and Hawdon, A.: CosmOz – The Australian Cosmic-ray Soil Moisture Sensor Network, Version 1.0.0, Terrestrial Ecosystem Research Network (TERN) [data set], https://doi.org/10.25901/5e7ab81af0394, 2021.
Miralles, D. G., Crow, W. T., and Cosh, M. H.: Estimating spatial sampling errors in coarse-scale soil moisture estimates derived from point-scale observations, J. Hydrometeorol., 11, 1423–1429, https://doi.org/10.1175/2010JHM1285.1, 2010.
Miralles, D. G., Holmes, T. R. H., De Jeu, R. A. M., Gash, J. H., Meesters, A. G. C. A., and Dolman, A. J.: Global land-surface evaporation estimated from satellite-based observations, Hydrol. Earth Syst. Sci., 15, 453–469, https://doi.org/10.5194/hess-15-453-2011, 2011.
Miralles, D. G., Van Den Berg, M. J., Gash, J. H., Parinussa, R. M., De Jeu, R. A., Beck, H. E., Holmes, T. R., Jiménez, C., Verhoest, N. E., and Dorigo, W. A.: El Niño – La Niña cycle and recent trends in continental evaporation, Nat. Clim. Change, 4, 122–126, https://doi.org/10.1038/nclimate2068, 2014.
Montzka, C., Bogena, H. R., Zreda, M., Monerris, A., Morrison, R., Muddu, S., and Vereecken, H.: Validation of spaceborne and modelled surface soil moisture products with cosmic-ray neutron probes, Remote Sens., 9, 103, https://doi.org/10.3390/rs9020103, 2017.
Muñoz Sabater, J.: ERA5-Land hourly data from 1981 to present, Copernicus Climate Change Service (C3S) Climate Data Store (CDS) [data set], https://doi.org/10.24381/cds.e2161bac, 2019.
Muñoz-Sabater, J., Dutra, E., Agustí-Panareda, A., Albergel, C., Arduini, G., Balsamo, G., Boussetta, S., Choulga, M., Harrigan, S., Hersbach, H., Martens, B., Miralles, D. G., Piles, M., Rodríguez-Fernández, N. J., Zsoter, E., Buontempo, C., and Thépaut, J.-N.: ERA5-Land: a state-of-the-art global reanalysis dataset for land applications, Earth Syst. Sci. Data, 13, 4349–4383, https://doi.org/10.5194/essd-13-4349-2021, 2021.
Mwangi, S., Zeng, Y., Montzka, C., Yu, L., and Su, Z.: Assimilation of cosmic-ray neutron counts for the estimation of soil ice content on the eastern Tibetan Plateau, J. Geophys. Res.-Atmos., 125, e2019JD031529, https://doi.org/10.1029/2019JD031529, 2020.
Naz, B. S., Kollet, S., Franssen, H.-J. H., Montzka, C., and Kurtz, W.: A 3 km spatially and temporally consistent European daily soil moisture reanalysis from 2000 to 2015, Sci. Data, 7, 1–14, https://doi.org/10.1038/s41597-020-0450-6, 2020.
Nicolai-Shaw, N., Hirschi, M., Mittelbach, H., and Seneviratne, S. I.: Spatial representativeness of soil moisture using in situ, remote sensing, and land reanalysis data, J. Geophys. Res.-Atmos., 120, 9955–9964, https://doi.org/10.1002/2015JD023305, 2015.
Peng, J., Niesel, J., Loew, A., Zhang, S., and Wang, J.: Evaluation of satellite and reanalysis soil moisture products over southwest China using ground-based measurements, Remote Sens., 7, 15729–15747, https://doi.org/10.3390/rs71115729, 2015.
Peng, J., Tanguy, M., Robinson, E. L., Pinnington, E., Evans, J., Ellis, R., Cooper, E., Hannaford, J., Blyth, E., and Dadson, S.: Estimation and evaluation of high-resolution soil moisture from merged model and Earth observation data in the Great Britain, Remote Sens. Environ., 264, 112610, https://doi.org/10.1016/j.rse.2021.112610, 2021.
Power, D., Rico-Ramirez, M. A., Desilets, S., Desilets, D., and Rosolem, R.: Cosmic-Ray neutron Sensor PYthon tool (crspy 1.2.1): an open-source tool for the processing of cosmic-ray neutron and soil moisture data, Geosci. Model Dev., 14, 7287–7307, https://doi.org/10.5194/gmd-14-7287-2021, 2021a.
Power, D., Rico-Ramirez, M. A., Desilets, S., Desilets, D., and Rosolem, R.: crspy: v1.2.1, v1.2.1, Zenodo [code], https://doi.org/10.5281/zenodo.5543669, 2021b.
Qin, Y., Wu, T., Wu, X., Li, R., Xie, C., Qiao, Y., Hu, G., Zhu, X., Wang, W., and Shang, W.: Assessment of reanalysis soil moisture products in the permafrost regions of the central of the Qinghai–Tibet Plateau, Hydrol. Process., 31, 4647–4659, https://doi.org/10.1002/hyp.11383, 2017.
Reichle, R., De Lannoy, G., Koster, R. D., Crow, W. T., Kimball, J. S., Liu, Q., and Bechtold, M.: SMAP L4 Global 3-hourly 9 km EASE-Grid Surface and Root Zone Soil Moisture Analysis Update, Version 7, Boulder, Colorado USA, NASA National Snow and Ice Data Center Distributed Active Archive Center [data set], https://doi.org/10.5067/LWJ6TF5SZRG3, 2022.
Reichle, R., De Lannoy, G., Koster, R. D., Crow, W. T., Kimball, J. S., Liu, Q., and Bechtold, M.: SMAP L4 Global 3-hourly 9 km EASE-Grid Surface and Root Zone Soil Moisture Analysis Update, Version 7. Boulder, Colorado USA. NASA National Snow and Ice Data Center Distributed Active Archive Center [data set], https://doi.org/10.5067/LWJ6TF5SZRG3, 2022.
Reichle, R. H., De Lannoy, G. J., Liu, Q., Ardizzone, J. V., Colliander, A., Conaty, A., Crow, W., Jackson, T. J., Jones, L. A., and Kimball, J. S.: Assessment of the SMAP level-4 surface and root-zone soil moisture product using in situ measurements, J. Hydrometeorol., 18, 2621–2645, 2017a.
Reichle, R. H., De Lannoy, G. J., Liu, Q., Koster, R. D., Kimball, J. S., Crow, W. T., Ardizzone, J. V., Chakraborty, P., Collins, D. W., and Conaty, A. L.: Global assessment of the SMAP Level-4 surface and root-zone soil moisture product using assimilation diagnostics, J. Hydrometeorol., 18, 3217–3237, 2017b.
Reichle, R. H., Liu, Q., Koster, R. D., Crow, W. T., De Lannoy, G. J. M., Kimball, J. S., Ardizzone, J. V., Bosch, D., Colliander, A., Cosh, M., Kolassa, J., Mahanama, S. P., Prueger, J., Starks, P., and Walker, J. P.: Version 4 of the SMAP Level-4 Soil Moisture Algorithm and Data Product, J. Adv. Model. Earth Sy., 11, 3106–3130, https://doi.org/10.1029/2019MS001729, 2019.
Renzullo, L. J., Van Dijk, A., Perraud, J.-M., Collins, D., Henderson, B., Jin, H., Smith, A., and McJannet, D.: Continental satellite soil moisture data assimilation improves root-zone moisture analysis for water resources assessment, J. Hydrol., 519, 2747–2762, https://doi.org/10.1016/j.jhydrol.2014.08.008, 2014.
Rivera Villarreyes, C. A., Baroni, G., and Oswald, S. E.: Integral quantification of seasonal soil moisture changes in farmland by cosmic-ray neutrons, Hydrol. Earth Syst. Sci., 15, 3843–3859, https://doi.org/10.5194/hess-15-3843-2011, 2011.
Rodell, M., Houser, P., Jambor, U., Gottschalck, J., Mitchell, K., Meng, C.-J., Arsenault, K., Cosgrove, B., Radakovich, J., and Bosilovich, M.: The global land data assimilation system, B Am. Meteorol. Soc., 85, 381–394, https://doi.org/10.1175/BAMS-85-3-381, 2004.
Rosolem, R., Shuttleworth, W., Zreda, M., Franz, T. E., Zeng, X., and Kurc, S.: The effect of atmospheric water vapor on neutron count in the cosmic-ray soil moisture observing system, J. Hydrometeorol., 14, 1659–1671, https://doi.org/10.1175/JHM-D-12-0120.1, 2013.
Rosolem, R., Hoar, T., Arellano, A., Anderson, J. L., Shuttleworth, W. J., Zeng, X., and Franz, T. E.: Translating aboveground cosmic-ray neutron intensity to high-frequency soil moisture profiles at sub-kilometer scale, Hydrol. Earth Syst. Sci., 18, 4363–4379, https://doi.org/10.5194/hess-18-4363-2014, 2014.
Saha, S., Moorthi, S., Wu, X., Wang, J., Nadiga, S., Tripp, P., Behringer, D., Hou, Y., Chuang, H., Iredell, M., Ek, M., Meng, J., Yang, R., Mendez, M. P., van den Dool, H., Zhang, Q., Wang, W., Chen, M., and Becker, E.: NCEP Climate Forecast System Version 2 (CFSv2) Selected Hourly Time-Series Products, Research Data Archive at the National Center for Atmospheric Research [data set], https://doi.org/10.5065/D6N877VB, 2011.
Saha, S., Moorthi, S., Wu, X., Wang, J., Nadiga, S., Tripp, P., Behringer, D., Hou, Y.-T., Chuang, H.-y., and Iredell, M.: The NCEP climate forecast system version 2, J. Climate, 27, 2185–2208, https://doi.org/10.1175/JCLI-D-12-00823.1, 2014.
Schmidt, T., Schrön, M., Li, Z., and Peng, J.: Intercomparison of current soil moisture products from remote sensing and modeling over COSMOS field sites in Germany, EGU General Assembly 2022, Vienna, Austria, 23–27 May 2022, EGU22-10336, https://doi.org/10.5194/egusphere-egu22-10336, 2022.
Schrön, M., Köhli, M., Scheiffele, L., Iwema, J., Bogena, H. R., Lv, L., Martini, E., Baroni, G., Rosolem, R., Weimar, J., Mai, J., Cuntz, M., Rebmann, C., Oswald, S. E., Dietrich, P., Schmidt, U., and Zacharias, S.: Improving calibration and validation of cosmic-ray neutron sensors in the light of spatial sensitivity, Hydrol. Earth Syst. Sci., 21, 5009–5030, https://doi.org/10.5194/hess-21-5009-2017, 2017.
Sigouin, M. J., Dyck, M., Si, B. C., and Hu, W.: Monitoring soil water content at a heterogeneous oil sand reclamation site using a cosmic-ray soil moisture probe, J. Hydrol., 543, 510–522, https://doi.org/10.1016/j.jhydrol.2016.10.026, 2016.
Stanley, S., Antoniou, V., Askquith-Ellis, A., Ball, L. A., Bennett, E.S., Blake, J. R., Boorman, D. B., Brooks, M., Clarke, M., Cooper,H. M., Cowan, N., Cumming, A., Evans, J. G., Farrand, P., Fry,M., Hitt, O. E., Lord, W. D., Morrison, R., Nash, G. V., Rylett,D., Scarlett, P. M., Swain, O. D., Szczykulska, M., Thornton,J. L., Trill, E. J., Warwick, A. C., and Winterbourn, B.: Daily and sub-daily hydrometeorological and soil data (2013–2019) [COSMOS-UK], NERC Environmental Information Data Centre [data set], https://doi.org/10.5285/b5c190e4-e35d-40ea-8fbe-598da03a1185, 2021.
Stillman, S., Zeng, X., and Bosilovich, M. G.: Evaluation of 22 precipitation and 23 soil moisture products over a semiarid area in southeastern Arizona, J. Hydrometeorol., 17, 211–230, https://doi.org/10.1175/JHM-D-15-0007.1, 2016.
Tavakol, A., Rahmani, V., Quiring, S. M., and Kumar, S. V.: Evaluation analysis of NASA SMAP L3 and L4 and SPoRT-LIS soil moisture data in the United States, Remote Sens. Environ., 229, 234–246, 2019.
Upadhyaya, D. B., Evans, J., Muddu, S., Tomer, S. K., Al Bitar, A., Yeggina, S., Morrison, R., Fry, M., Tripathi, S. N., and Mujumdar, M.: The Indian COSMOS Network (ICON): validating L-band remote sensing and modelled soil moisture data products, Remote Sens., 13, 537, https://doi.org/10.3390/rs13030537, 2021.
Wang, A. and Zeng, X.: Evaluation of multireanalysis products with in situ observations over the Tibetan Plateau, J. Geophys. Res.-Atmos., 117, D05102, https://doi.org/10.1029/2011JD016553, 2012.
Wen, X., Lu, H., Li, C., Koike, T., and Kaihotsu, I.: Inter-comparison of soil moisture products from SMOS, AMSR-E, ECWMF and GLDAS over the Mongolia Plateau, Proc. SPIE, 9260, 103–110, https://doi.org/10.1117/12.2068952, 2014.
Willmott, C. J. and Feddema, J. J.: A more rational climatic moisture index, Prof. Geogr., 44, 84–88, 1992.
Wood, E. F., Roundy, J. K., Troy, T. J., Van Beek, L., Bierkens, M. F., Blyth, E., de Roo, A., Döll, P., Ek, M., and Famiglietti, J.: Hyperresolution global land surface modeling: Meeting a grand challenge for monitoring Earth's terrestrial water, Water Resour. Res., 47, W05301, https://doi.org/10.1029/2010WR010090, 2011.
Wu, Z., Feng, H., He, H., Zhou, J., and Zhang, Y.: Evaluation of soil moisture climatology and anomaly components derived from ERA5-land and GLDAS-2.1 in China, Water Resour. Manage., 35, 629–643, https://doi.org/10.1007/s11269-020-02743-w, 2021.
Xing, Z., Fan, L., Zhao, L., De Lannoy, G., Frappart, F., Peng, J., Li, X., Zeng, J., Al-Yaari, A., and Yang, K.: A first assessment of satellite and reanalysis estimates of surface and root-zone soil moisture over the permafrost region of Qinghai-Tibet Plateau, Remote Sens. Environ., 265, 112666, https://doi.org/10.1016/j.rse.2021.112666, 2021.
Xu, L., Chen, N., Zhang, X., Moradkhani, H., Zhang, C., and Hu, C.: In-situ and triple-collocation based evaluations of eight global root zone soil moisture products, Remote Sens. Environ., 254, 112248, https://doi.org/10.1016/j.rse.2020.112248, 2021.
Yamazaki, D., Ikeshima, D., Tawatari, R., Yamaguchi, T., O'Loughlin, F., Neal, J. C., Sampson, C. C., Kanae, S., and Bates, P. D.: A high-accuracy map of global terrain elevations, Geophys. Res. Lett., 44, 5844–5853, https://doi.org/10.1002/2017GL072874, 2017.
Yang, S., Li, R., Wu, T., Hu, G., Xiao, Y., Du, Y., Zhu, X., Ni, J., Ma, J., and Zhang, Y.: Evaluation of reanalysis soil temperature and soil moisture products in permafrost regions on the Qinghai-Tibetan Plateau, Geoderma, 377, 114583, https://doi.org/10.1016/j.geoderma.2020.114583, 2020.
Yang, Y., Zhang, J., Bao, Z., Ao, T., Wang, G., Wu, H., and Wang, J.: Evaluation of multi-source soil moisture datasets over central and eastern agricultural area of China using in situ monitoring network, Remote Sens., 13, 1175, https://doi.org/10.3390/rs13061175, 2021.
Yee, M. S., Walker, J. P., Rüdiger, C., Parinussa, R. M., Koike, T., and Kerr, Y. H.: A comparison of SMOS and AMSR2 soil moisture using representative sites of the OzNet monitoring network, Remote Sens. Environ., 195, 297–312, https://doi.org/10.1016/j.rse.2017.04.019, 2017.
Zacharias, S., Bogena, H., Samaniego, L., Mauder, M., Fuß, R., Pütz, T., Frenzel, M., Schwank, M., Baessler, C., and Butterbach-Bahl, K.: A network of terrestrial environmental observatories in Germany, Vadose Zone J., 10, 955–973, https://doi.org/10.2136/vzj2010.0139, 2011.
Zeng, J., Li, Z., Chen, Q., Bi, H., Qiu, J., and Zou, P.: Evaluation of remotely sensed and reanalysis soil moisture products over the Tibetan Plateau using in-situ observations, Remote Sens. Environ., 163, 91–110, https://doi.org/10.1016/j.rse.2015.03.008, 2015.
Zheng, J., Zhao, T., Lü, H., Shi, J., Cosh, M. H., Ji, D., Jiang, L., Cui, Q., Lu, H., and Yang, K.: Assessment of 24 soil moisture datasets using a new in situ network in the Shandian River Basin of China, Remote Sens. Environ., 271, 112891, https://doi.org/10.1016/j.rse.2022.112891, 2022.
Zheng, Y., Li, J., Dong, L., Rong, Y., Kang, A., and Feng, P.: Estimation of Initial Abstraction for Hydrological Modeling Based on Global Land Data Assimilation System–Simulated Datasets, J. Hydrometeorol., 21, 1051–1072, https://doi.org/10.1175/JHM-D-19-0202.1, 2020.
Zheng, Y., Li, J., Zhang, T., Rong, Y., and Feng, P.: Exploring the Application of Flood Scaling Property in Hydrological Model Calibration, J. Hydrometeorol., 22, 3255–3274, https://doi.org/10.1175/JHM-D-21-0123.1, 2021.
Zheng, Y., Coxon, G., Woods, R., Li, J., and Feng, P.: A framework for estimating the probability distribution of event runoff coefficient in ungauged catchments, Water Resour. Res., 59, e2022WR033227, https://doi.org/10.1029/2022WR033227, 2023.
Zhu, D., Ciais, P., Krinner, G., Maignan, F., Jornet Puig, A., and Hugelius, G.: Controls of soil organic matter on soil thermal dynamics in the northern high latitudes, Nat. Commum., 10, 1–9, https://doi.org/10.1038/s41467-019-11103-1, 2019.
Zhu, Z., Tan, L., Gao, S., and Jiao, Q.: Observation on soil moisture of irrigation cropland by cosmic-ray probe, IEEE Geosci. Remote S., 12, 472–476, https://doi.org/10.1109/LGRS.2014.2346784, 2014.
Zreda, M., Desilets, D., Ferré, T., and Scott, R. L.: Measuring soil moisture content non-invasively at intermediate spatial scale using cosmic-ray neutrons, Geophys. Res. Lett., 35, L21402, https://doi.org/10.1029/2008GL035655, 2008.
Zreda, M., Shuttleworth, W. J., Zeng, X., Zweck, C., Desilets, D., Franz, T., and Rosolem, R.: COSMOS: the COsmic-ray Soil Moisture Observing System, Hydrol. Earth Syst. Sci., 16, 4079–4099, https://doi.org/10.5194/hess-16-4079-2012, 2012 (data avaliable at: http://cosmos.hwr.arizona.edu/, last access: 5 June 2021).