the Creative Commons Attribution 4.0 License.
the Creative Commons Attribution 4.0 License.
 | 24 Apr 2024
Unveiling hydrological dynamics in data-scarce regions: experiences from the Ethiopian Rift Valley Lakes Basin
Ayenew D. Ayalew
Paul D. Wagner
Dejene Sahlu
Nicola Fohrer
The hydrological system of the Rift Valley Lakes in Ethiopia has recently experienced changes over the past 2 decades. Potential causes for these changes include anthropogenic, hydro-climatic, and geological factors. The main objective of this study was to utilize an integrated methodology to gain a comprehensive understanding of the hydrological systems and potential driving factors within a complex and data-scarce region. To this end, we integrated a hydrologic model, change point analysis, indicators of hydrological alteration (IHA), and a bathymetry survey to investigate hydrological dynamics and potential causes. A hydrologic model (the Soil and Water Assessment Tool Plus, SWAT+) was parameterized for the gauged watersheds and extended to the ungauged watersheds using multi-site regionalization techniques. The SWAT+ model performed very well to satisfactorily for daily streamflow in all watersheds with respect to the objective functions of the Kling–Gupta efficiency (KGE), the Nash–Sutcliffe efficiency (NSE), and percent bias (PBIAS). The findings reveal notable changes in lake inflows and lake levels over the past 2 decades. Lake Chamo experienced an increase in area of 30.1 km2 (9.5 %), an increase in depth of 4.4 m (30.9 %), and an increase in volume of 7.8×10⁸ m3 (27.2 %). In contrast, Lake Abijata witnessed an extraordinary 68 % decrease in area and a depth decrease of 1.6 m (37.2 %). During the impact period, the mean annual rainfall experienced a decrease of 6.5 % and 2.7 % over Lake Abijata and Lake Chamo, respectively. Actual evapotranspiration decreased by 2.9 % in Lake Abijata but increased by up to 4.5 % in Lake Chamo. Surface inflow to Lake Abijata decreased by 12.5 %, while Lake Chamo experienced an 80.5 % increase in surface inflow. Sediment depth in Lake Chamo also increased by 0.6 m (4.2 %). The results highlight that the changing hydrological regime in Lake Chamo is driven by increased surface runoff and sediment intrusion associated with anthropogenic influences. The hydrological regime of Lake Abijata is affected by water abstraction from feeding rivers and lakes for industrial and irrigation purposes. This integrated methodology provides a holistic understanding of complex data-scarce hydrological systems and potential driving factors in the Rift Valley Lakes in Ethiopia, which could have global applicability.
- Article
(6293 KB) - Full-text XML
- BibTeX
- EndNote


Continuous anthropogenic and natural activities are adversely altering the water resources from local to global scales (Flörke et al., 2018). Changes in lake levels influence ecosystem services worldwide (Gownaris et al., 2015; Kolding and van Zwieten, 2012). In eastern Africa, the Rift Valley Lakes are supporting eco-regions of great biodiversity and are considered to be among the global 200 freshwater eco-regions of the world (O'Brien et al., 2018; Olson and Dinerstein, 2002). In this region, water resources play a crucial role in economic development through the use of water for domestic supply, irrigation and industry, fishery, recreation, and tourism (Cowx and Ogutu-Owhayo, 2019; Minale, 2020; White et al., 2002).
The Ethiopian Rift Valley Lakes Basin is known as the Lakes District, containing a chain of eight main lakes situated on the Rift floor. The total surface area of open waters, including the wetlands of the Rift Valley, was 3413 km2 in 2019, which is 46 % of the total area of open-water resources of Ethiopia (Ayalew et al., 2022). Most of these lakes are highly productive, contain indigenous populations of edible fish, and support a variety of aquatic and terrestrial wildlife (Lemma and Desta, 2016). Currently, the hydrology of the Rift Valley Lakes is changing; i.e., water levels, areal extent, and volumes are altered, affecting ecosystem services and the communities. The situation has been aggravated recently due to increasing population density, excessive water abstraction, and catchment land use changes (Billi and Caparrini, 2006; Legesse and Ayenew, 2006). Because of high water abstraction for irrigation and industry, as well as climate change, the open-water surface area has decreased by 2.1 % in 3 decades (Ayalew et al., 2022). The problem is getting worse since water abstractions is often carried out without a basic understanding of the complex hydrogeological system and the fragile nature of the Rift ecosystem (Zinabu et al., 2002; Ayenew, 2002). The basin has become economically significant because of the development of flower and horticultural production, soda ash factories, tourism, and other human activities around the shores of the lakes. Despite the basin's significance as a vital component of the country's economy and ecological balance, the major challenge lies in the limited availability of accurate hydrological data. Previous hydrological studies conducted in the Rift Valley Lakes have predominantly focused on analyzing the impact of single drivers and have failed to provide a quantitative assessment of the respective contributions of land use and climate change to streamflow. For instance, some studies have primarily investigated the effects of high water abstraction for irrigation and industries (Kebede et al., 1994; Zinabu and Elias, 1989; Legesse and Ayenew, 2006; Ayenew, 2002), environmental degradation (Ayenew, 2004; Ayalew et al., 2004; Meshesha et al., 2012), volcano-tectonics and sedimentation (Le Turdu et al., 1999; Street and Grove, 1979), bathymetry analysis (Awulachew, 2006), and the occurrence of frequent earthquakes and faults (Ayalew et al., 2004; Ayenew, 2002). However, the hydrological system of the Rift Valley is very complex, and processes within a basin are driven by the interplay of climate, land use and land cover (LULC), topography, soil, and human activities. Evaluating hydrological change typically involves assessing changes in the flow regime and water balance of a river, a lake, or a reservoir. Therefore, to understand the hydrological system and the driving forces that control the hydrological processes requires an integrated approach. Flow regime analysis, trend analysis, time series analysis, and hydrological modeling are common methods used for hydrological change analysis (Govindaraju, 2019; Hargreaves and Samani, 1985), and in regions with limited available hydrological data, the application of regionalization techniques is a commonly employed approach (Viglione et al., 2013; Pool et al., 2021).
The study aims to understand the changing hydrological systems and driving factors by integrating hydrological modeling, indicators of hydrological alteration (IHA), change point and/or break, and bathymetry survey analysis. We hypothesize that the changes in the hydrological regimes are associated with changes in high water abstraction, climate change, and land use.
2.1 Study area discerption
The Ethiopian Rift Valley Lakes Basin is located between 4 and 9° N and 36 and 40° E. It extends from the Afar depression southwards to Kenya across the broad basins of Abijata-Ziway, Abaya-Chamo, and Segen (Fig. 1). It is 55 050 km2 and one of the most important basins in Ethiopia. The basin is characterized by diverse landscape features and climate conditions. It has a complex hydrological system and encompasses numerous lakes, springs, wetlands, and rivers.
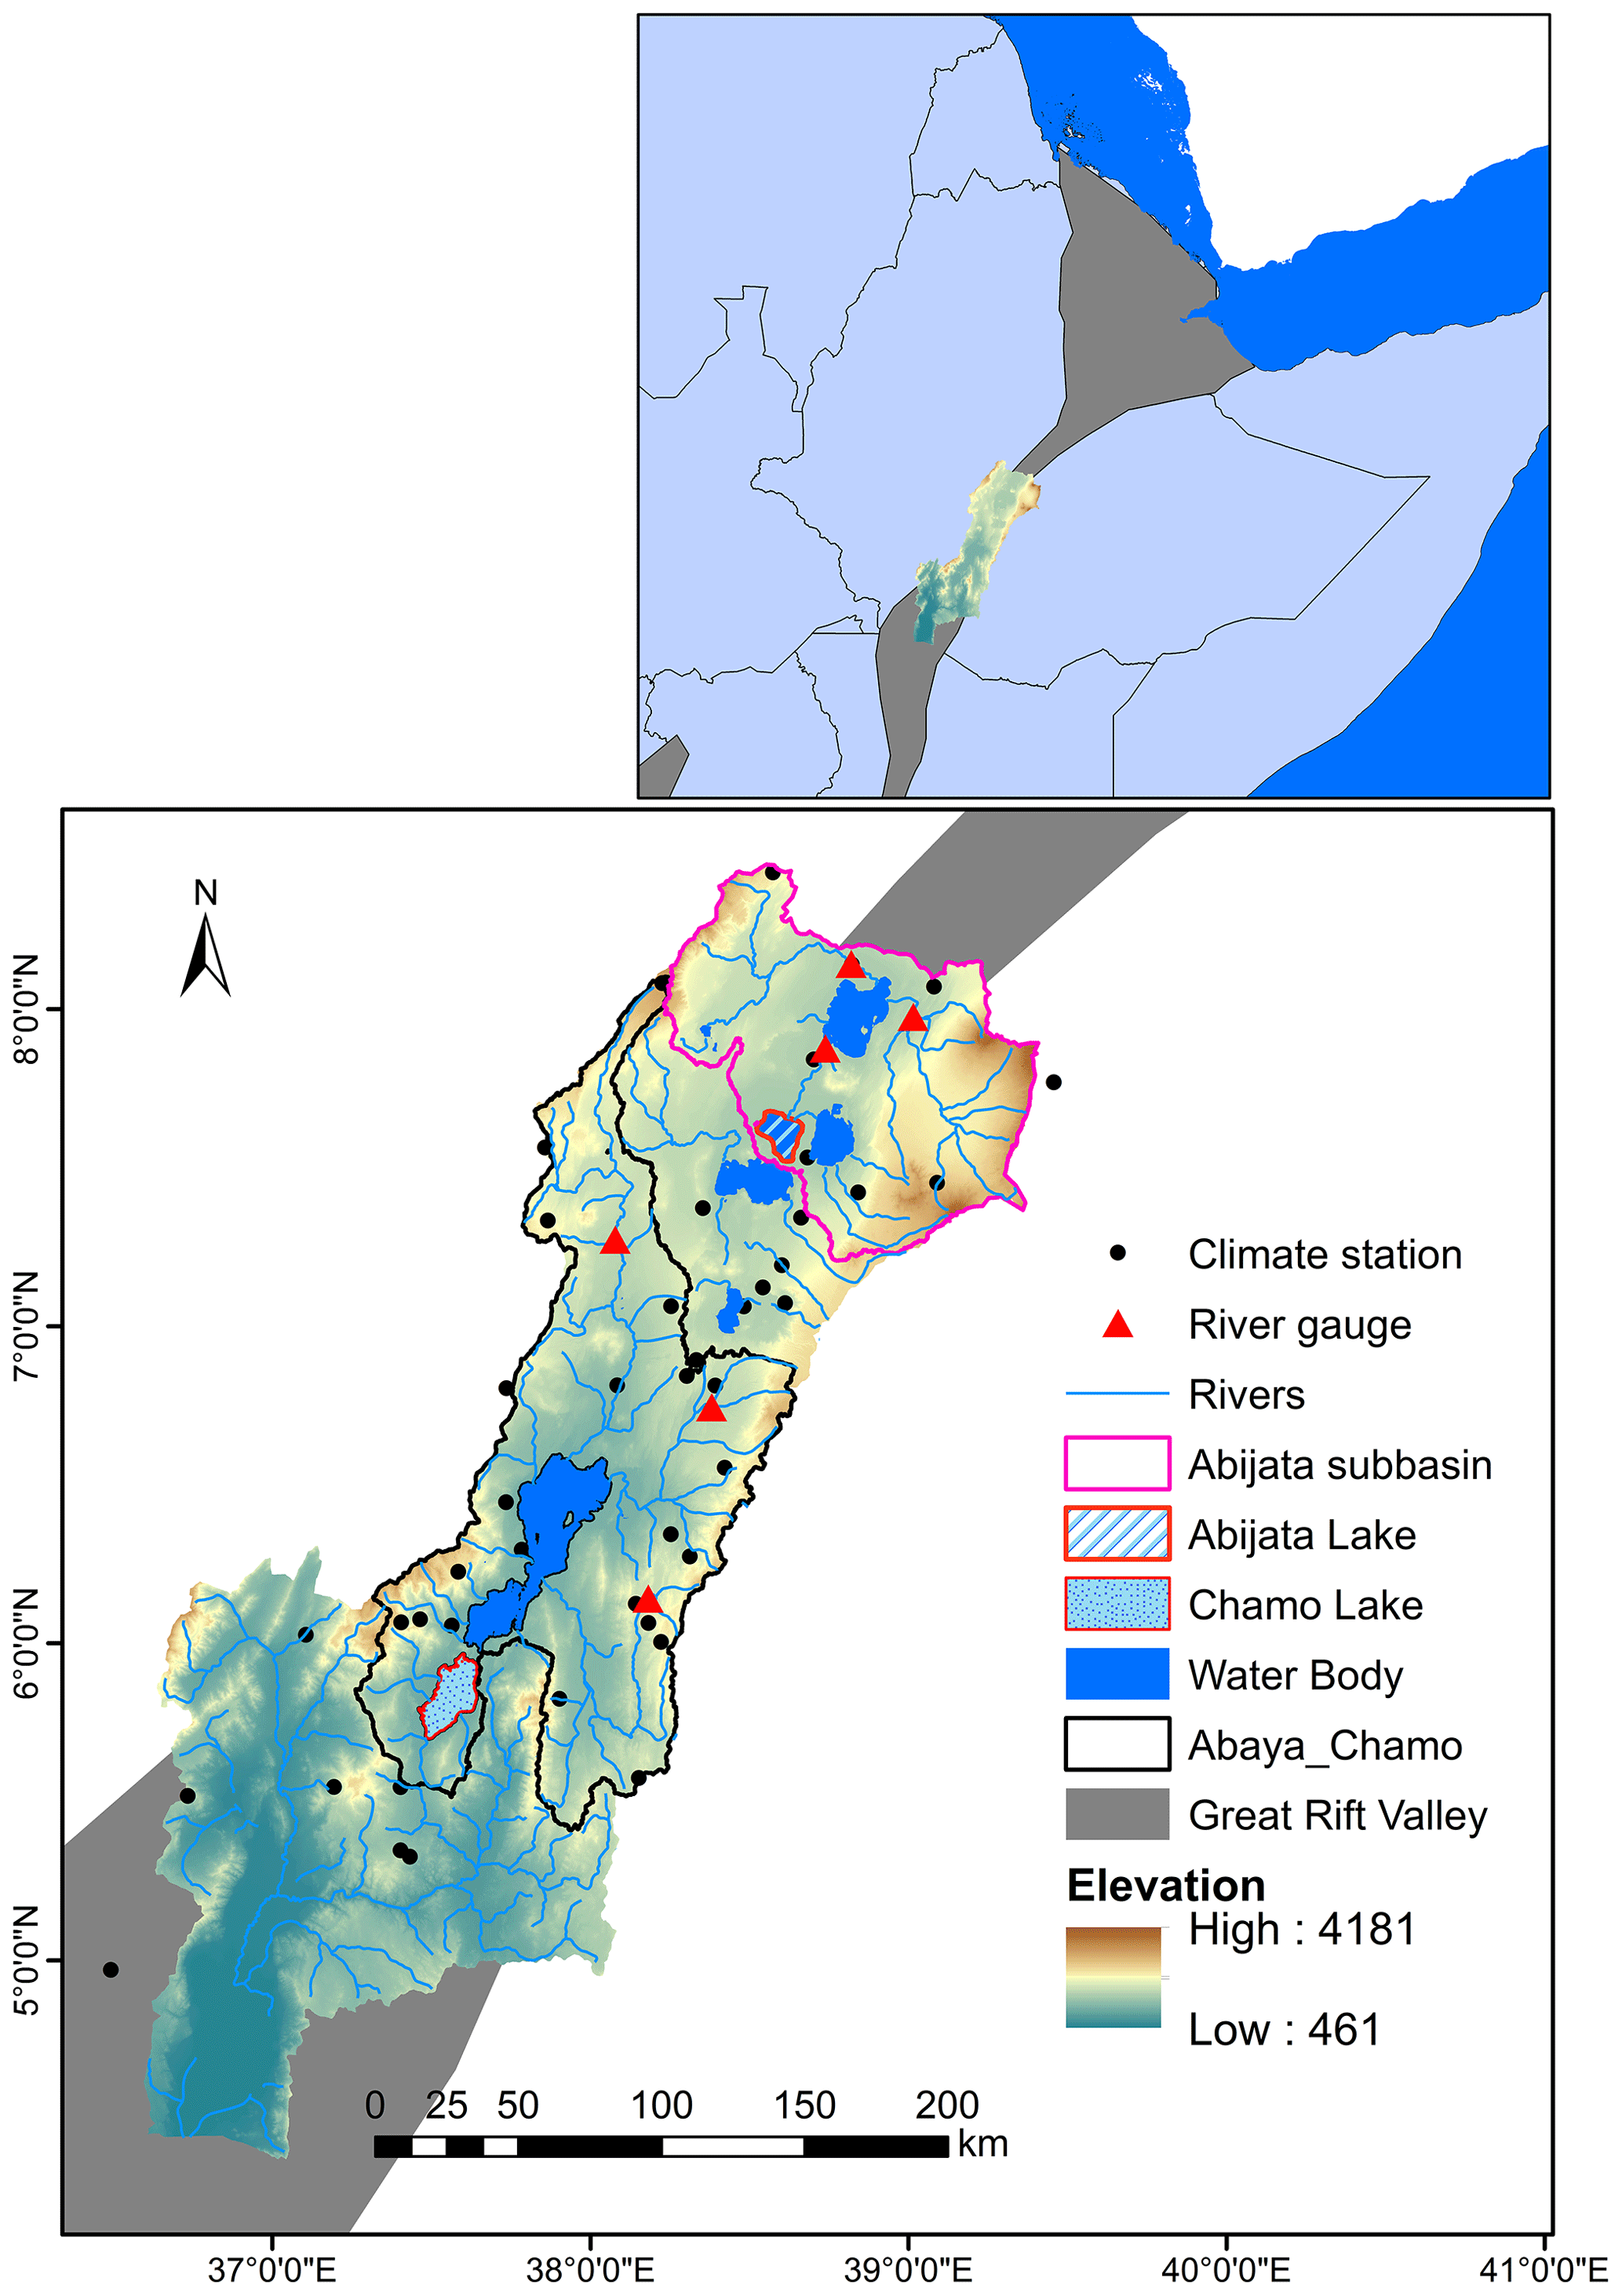
Figure 1Topography of the Rift Valley Lakes Basin, as well as the river network and river and climate stations used for modeling.
The climate of the basin is dominated by semi-arid climate (BSh) and tropical wet and dry climate (Aw/As) climate, which is characterized by low rainfall, high temperature, and high evapotranspiration. Three climate regions can be found in the basin (Ayalew et al., 2022): the first is the Abijata-Ziway subbasin, which is characterized by low annual average rainfall ranging from 400 to 860 mm, with one peak in August; the second subbasin is the Abaya-Chamo subbasin, which receives higher annual precipitation ranging from 704 to 1200 mm, with a bimodal climate pattern with peaks in April and August; and the third subbasin is the Segen subbasin, which is characterized by a bimodal rainfall pattern, with peaks in April and October, and receives an average annual precipitation ranging from 500 to 1100 mm. Temperatures within the basin exhibit a wide range, from 10 to 36 °C, with the warmest temperatures measured on the Rift Valley floor and with frost-prone conditions in the afro-alpine zone. The southern region of the Rift Valley is both lower in elevation and warmer and drier than the other areas of the basin.
The basin is also characterized by a complex and rugged topography with active faults, volcanoes, and hot springs (Stamps et al., 2008). Based on the digital elevation model (USGS, 2019) data, the slope ranges from 0 % to 161 %. Agricultural land is the most dominant land use, followed by semi-natural vegetation and waterbodies. Two lakes were chosen from the basin as representative examples of its hydrological system based on their degree of impact. Lake Abijata was selected as an example of a monomodal climate regime, while Lake Chamo was chosen to represent a bimodal climate regime. Lake Abijata is a terminal lake of the Ziway-Abijata subbasin and is linked to Lake Ziway via the Bulbula River and to Lake Lugano via the Hurakolo River. Lake Chamo is a terminal lake for the Abaya-Chamo subbasin and is linked with Lake Abaya via the Kulfo River.
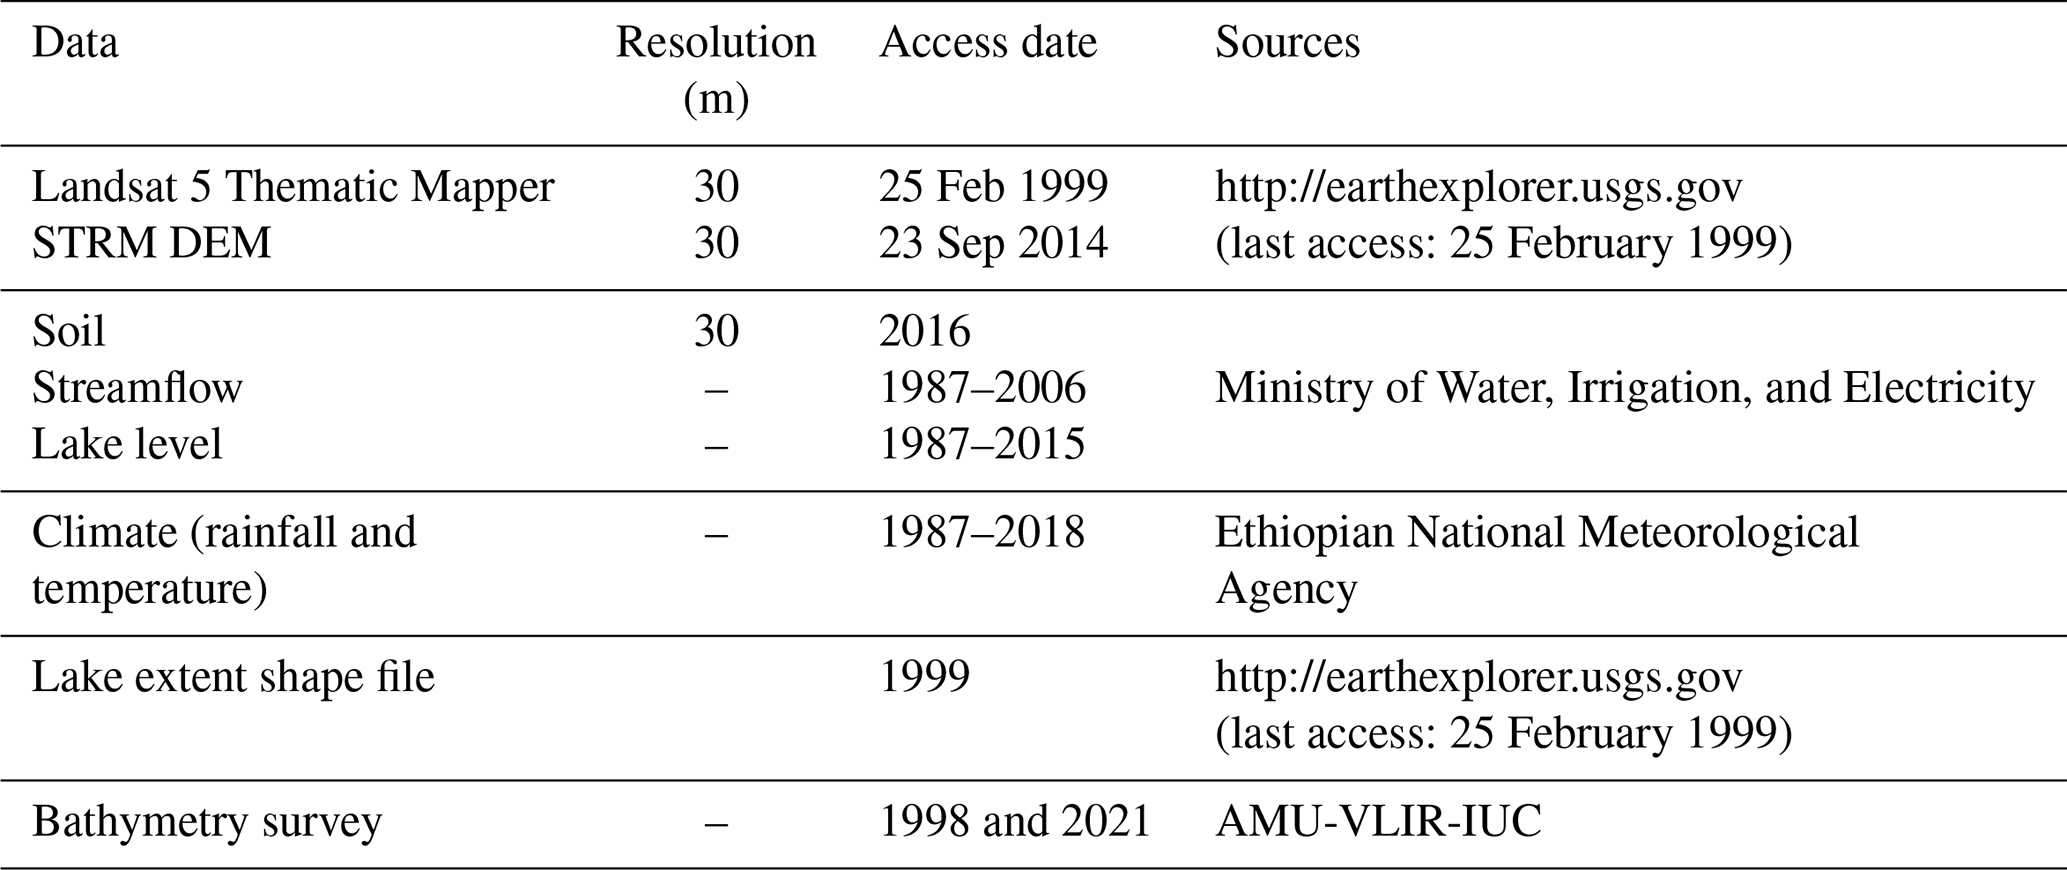
2.2 Spatial and hydroclimatic data
The main hydrological characteristics of the basin have been acquired from the climate data, topography, land use, soil properties, streamflow, lake level, and bathymetry survey (Table 1). Time series of climate data for 44 stations (1981–2018), a georeferenced Landsat image (1999), bathymetry of Lake Chamo (1998 and 2021), streamflow of rivers (1987–2006), lake level (1987–2015), the Shuttle Radar Topography Mission digital elevation model (SRTM DEM) (30×30), and soil data were used for this study. The SRTM DEM has been used, from which slope, river network, and watershed boundaries are obtained. Selected soil physical properties and the area coverage of each soil type were classified based on the requirements of the hydrologic model. The bathymetry survey data were used to calculate the change in the volume, area, and depth of a lake. These were also used to obtain information about sediment deposition in the lake.
2.3 Methodology
2.3.1 Hydrological regime change analysis
In this study, a common approach for analyzing hydrological regime change is utilized by combining a change point analysis and IHA. The IHA can be used to assess and quantify changes in the natural flow regimes of rivers and streams. It provides a systematic way to analyze the impacts of human activities, e.g., dam construction and water withdrawals, on hydrology. A set of indicators is used to evaluate alterations in flow magnitude, frequency, duration, timing, and rate of change. Combining a change point analysis and IHA allows for a more robust and comprehensive analysis of hydrological regime change (Zhang et al., 2016; Vieceli et al., 2015; Vu et al., 2019). Change point analysis is a statistical method that is used to detect changes in the mean or variance of a time series. We used it to identify break points of the lake level. Once the break points were identified, IHA was used to evaluate the degree of alteration of the natural flow regime. The range of variability approach (RVA), environmental flow components (EFCs), a flow duration curve (FDC), box and whisker (BAW) plots, and percentile analysis of the IHA were used to evaluate the alteration of the hydrological regime (Gunawardana et al., 2021).
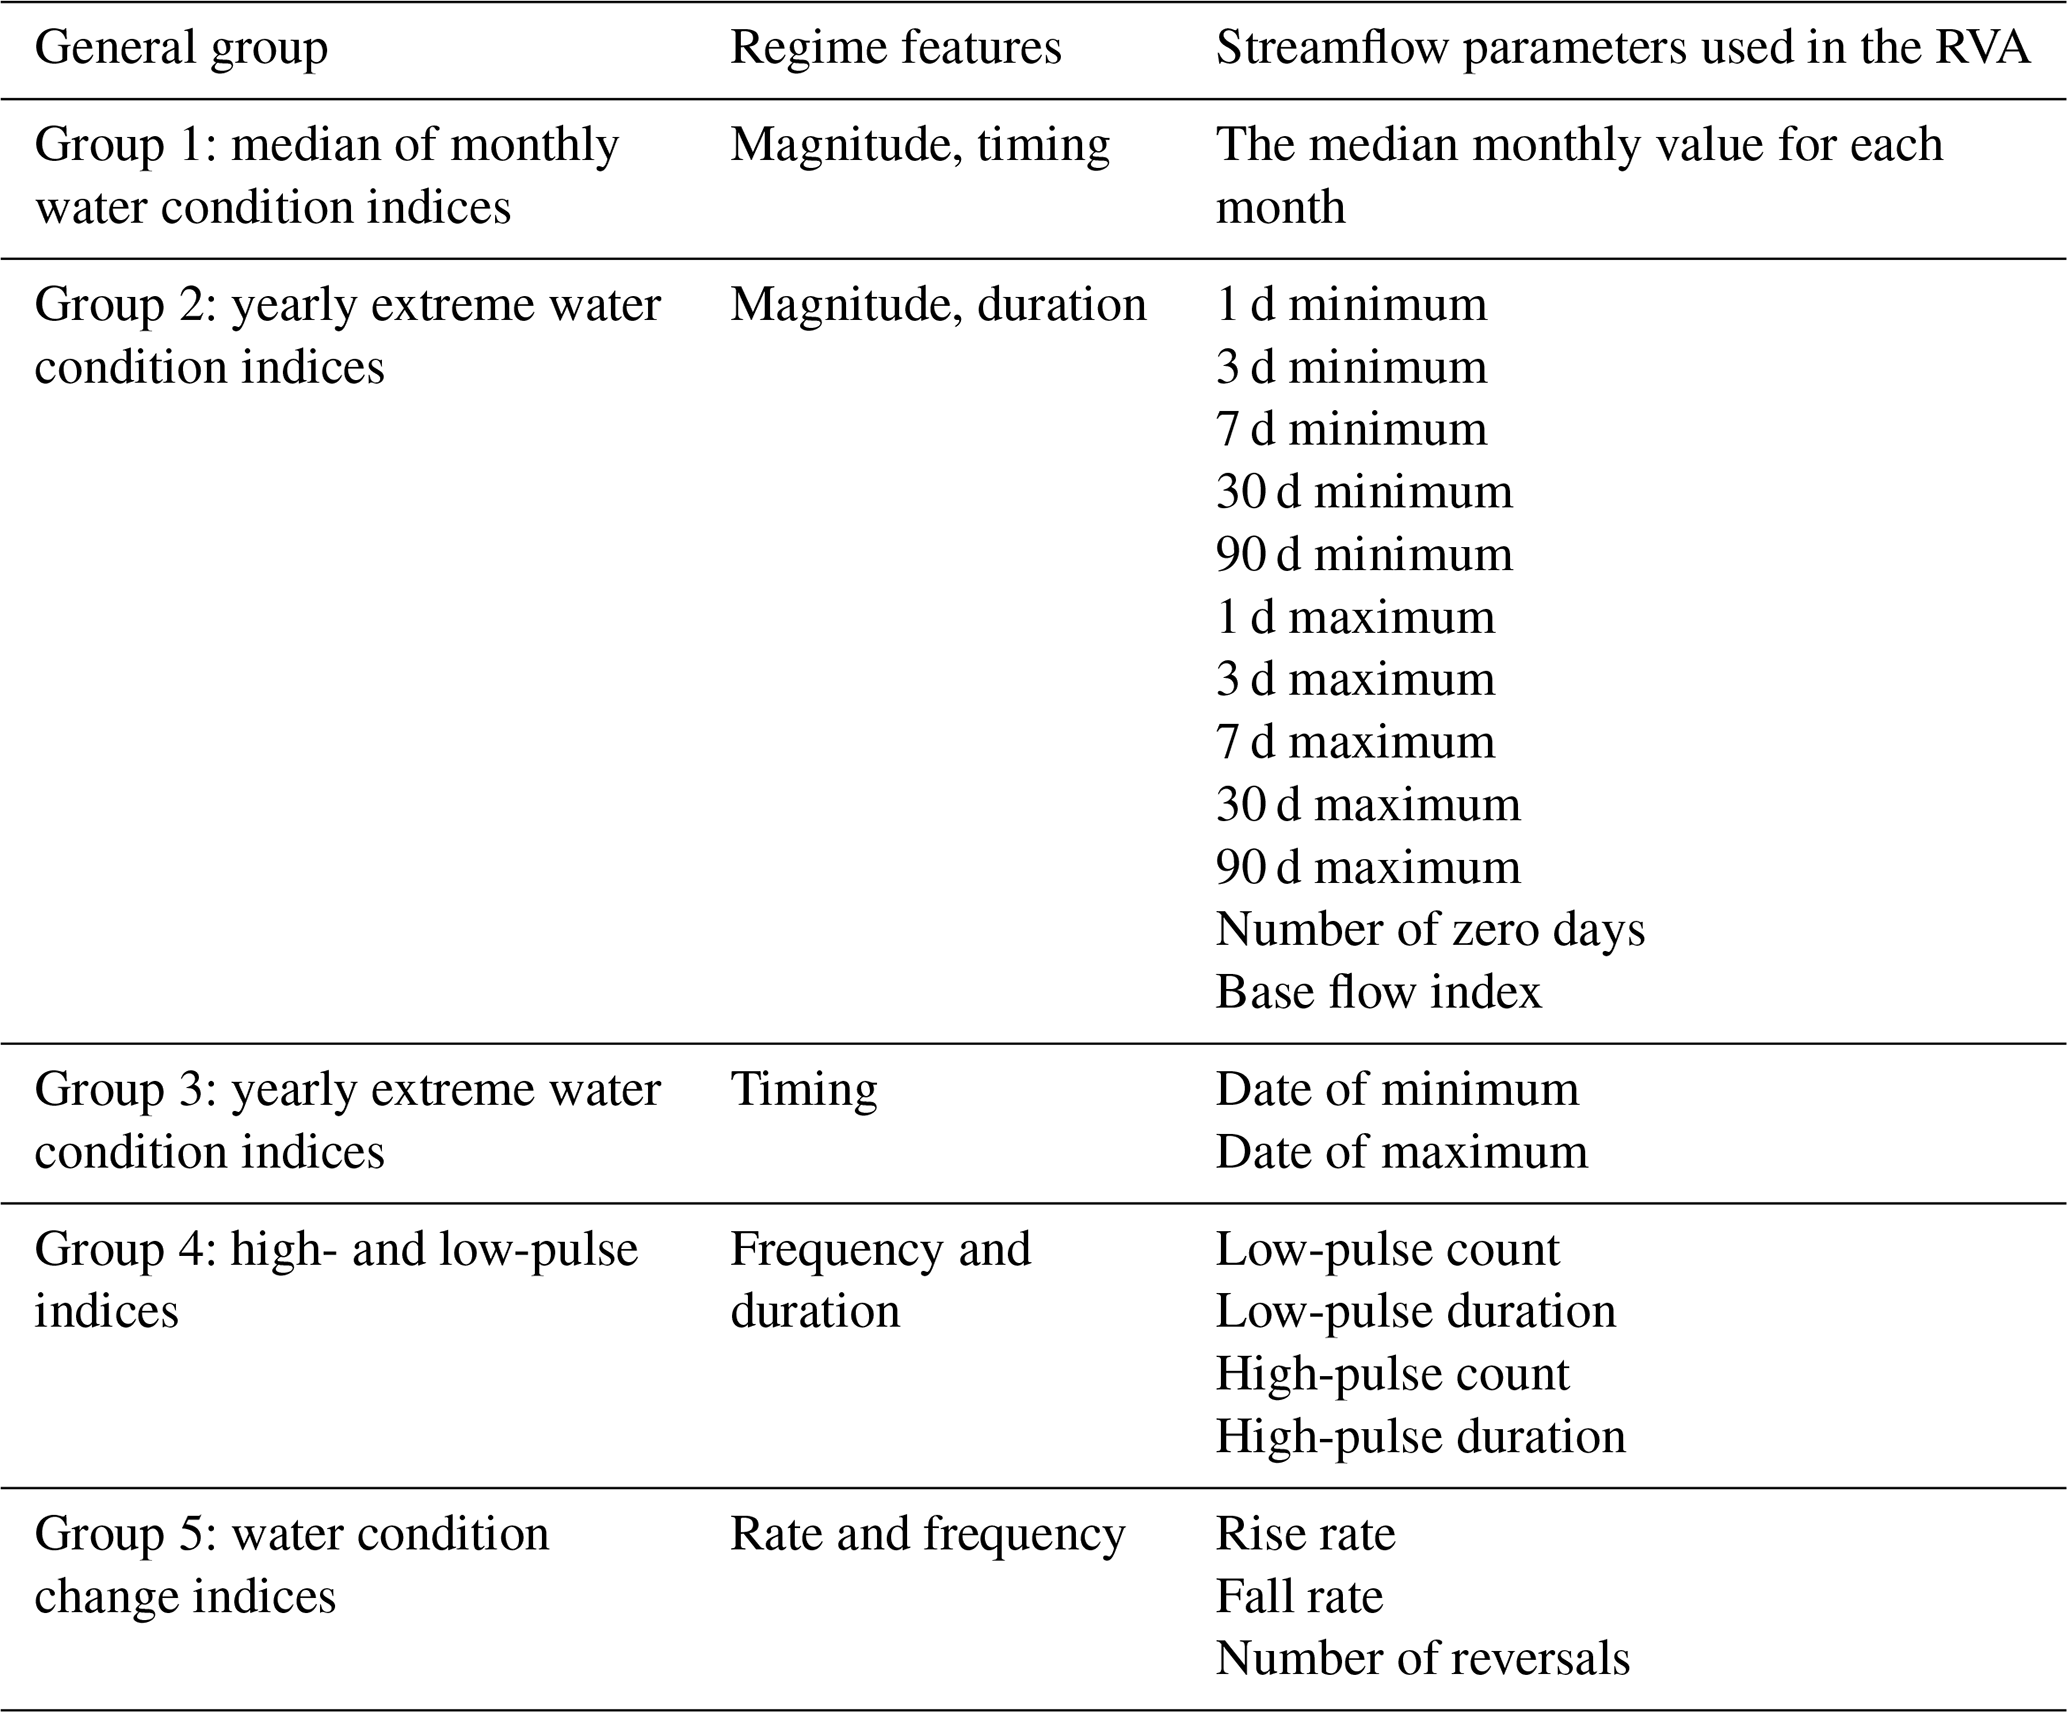
The range of variability approach (RVA) evaluates hydrological alterations by analyzing 33 hydrological parameters, which are categorized into five groups which evaluate the magnitude, timing, frequency, duration, and rate of change (Richter et al., 1998; Shieh et al., 2007) (Table 2). In group 1, the 12-monthly mean flows were computed to determine the water level. In group 2, 12 parameters were used to explain the range of changes in annual extreme flows in terms of magnitude and duration over daily, weekly, monthly, and seasonal cycles. In group 3, Julian dates for 1 d annual maxima and minima were computed to determine the variation in the timing of annual extreme flows that can be associated with extreme conditions. In group 4, four parameters that refer to the frequency and duration of high and low pulses are characterized. The high pulses refer to periods within a year when the daily flows are above the 75th percentile of the data. The low pulses are periods within a year when the daily flows are below the 25th percentile of the data. In group 5, three parameters are also categorized to understand the direction and magnitude of hydrological regime changes, including both positive and negative changes. These parameters are important because they capture the variability of hydrological flow over short periods as high flow can cause erosion and sediment transport, while low flow pulses can lead to habitat degradation and changes in water quality.
Table 2Hydrologic parameters used in the RVA and their features.
The calculation of pulse count and pulse duration was carried out through the utilization of the IHA. A threshold for both high and low pulses is used. Pulse count represents the number of pulses exceeding the established threshold (here the median), while pulse duration indicates the time from the start to the end of a high or low pulse.
The uncertainty concerning pulse counts, determined by the threshold, stems from potential overcounting and undercounting of low and high pulses. This occurs due to the computation of the median for the data series, which includes both flood and drought years. The presence of flood and drought years in the data series influences the median value, consequently affecting the counted number of high and low pulses. Another threshold definition or other climate data will lead to different results.
In the annual average water balance, the flow signals are averaged, and it is difficult to distinguish which flow signals affect the annual water balance. To avoid this limitation, we used the FDC to evaluate the variation in streamflow for the pre-impact and impact periods. The shape of the curve is an index of the natural storage in the watershed, including the groundwater. The dry-season flow consists entirely of return flow from the groundwater; i.e., the lower end of the FDC indicates the general characteristics of shallow aquifers. Therefore, flow signals were determined from the FDC based on the exceedance probability threshold. Here, low-flow signals are defined as ≥75 % of the exceedance probability, while higher-flow signals are defined as ≤20 % of the exceedance probability, and the rest are mid-flows. The choices of thresholds for disaggregation were based on earlier studies (Pfannerstill et al., 2014; Smakhtin, 2001).
2.3.2 Hydrologic model
The Soil and Water Assessment Tool Plus (SWAT+), a completely revised version of the SWAT model (Arnold et al., 1998), was built to simulate water balance fluxes in a watershed. It is more flexible than SWAT in terms of the spatial representation of interactions and processes within a watershed (Bieger et al., 2017). It simulates the hydrological processes from precipitation to streamflow using the water balance equation. There are two methods for channel routing currently implemented in SWAT+ (Muskingum and variable storage routing – VSR). In this study, the VSR, which is the standard method in SWAT+, was used for river routing. It provides a flexible representation of channel-routing behavior using storage coefficients for each reach that depend on travel time and the length of the time step (Sangin et al., 2024). It also considers the storage–discharge relationship for each reach, allowing for a better representation of channel-routing processes (Pati et al., 2018). The Soil Conservation Service (SCS) curve number (CN) method was employed to estimate surface runoff. The Hargraves equation, which is commonly used in data-scarce regions, was used to calculate the potential evapotranspiration (de Sousa Lima et al., 2013; Moeletsi et al., 2013).
Currently, SWAT+ is tested in few watersheds across the world, where the results from SWAT+ are favorable compared to the previous model version (Wagner et al., 2022). It can simulate the quantity and quality of water resources from a hydrological response unit at the basin scale. SWAT is also suitable to assess the impact of climate change (Mahmoodi et al., 2021a), land cover change (Tigabu et al., 2019) and land use change (Wagner et al., 2023; McGinn et al., 2021), and watershed management practices on water resources (Mahmoodi et al., 2021b). Moreover, it has been proven to be capable of modeling in data-scarce regions (Wagner et al., 2012; Tigabu et al., 2023). To depict the spatial heterogeneity of a watershed, each watershed is divided into multiple homogenous hydrological response units based on a unique combination of land use, slope, and soil characteristics (HRU).
Table 3Calibration parameters and the upper and lower boundaries used for calibration.
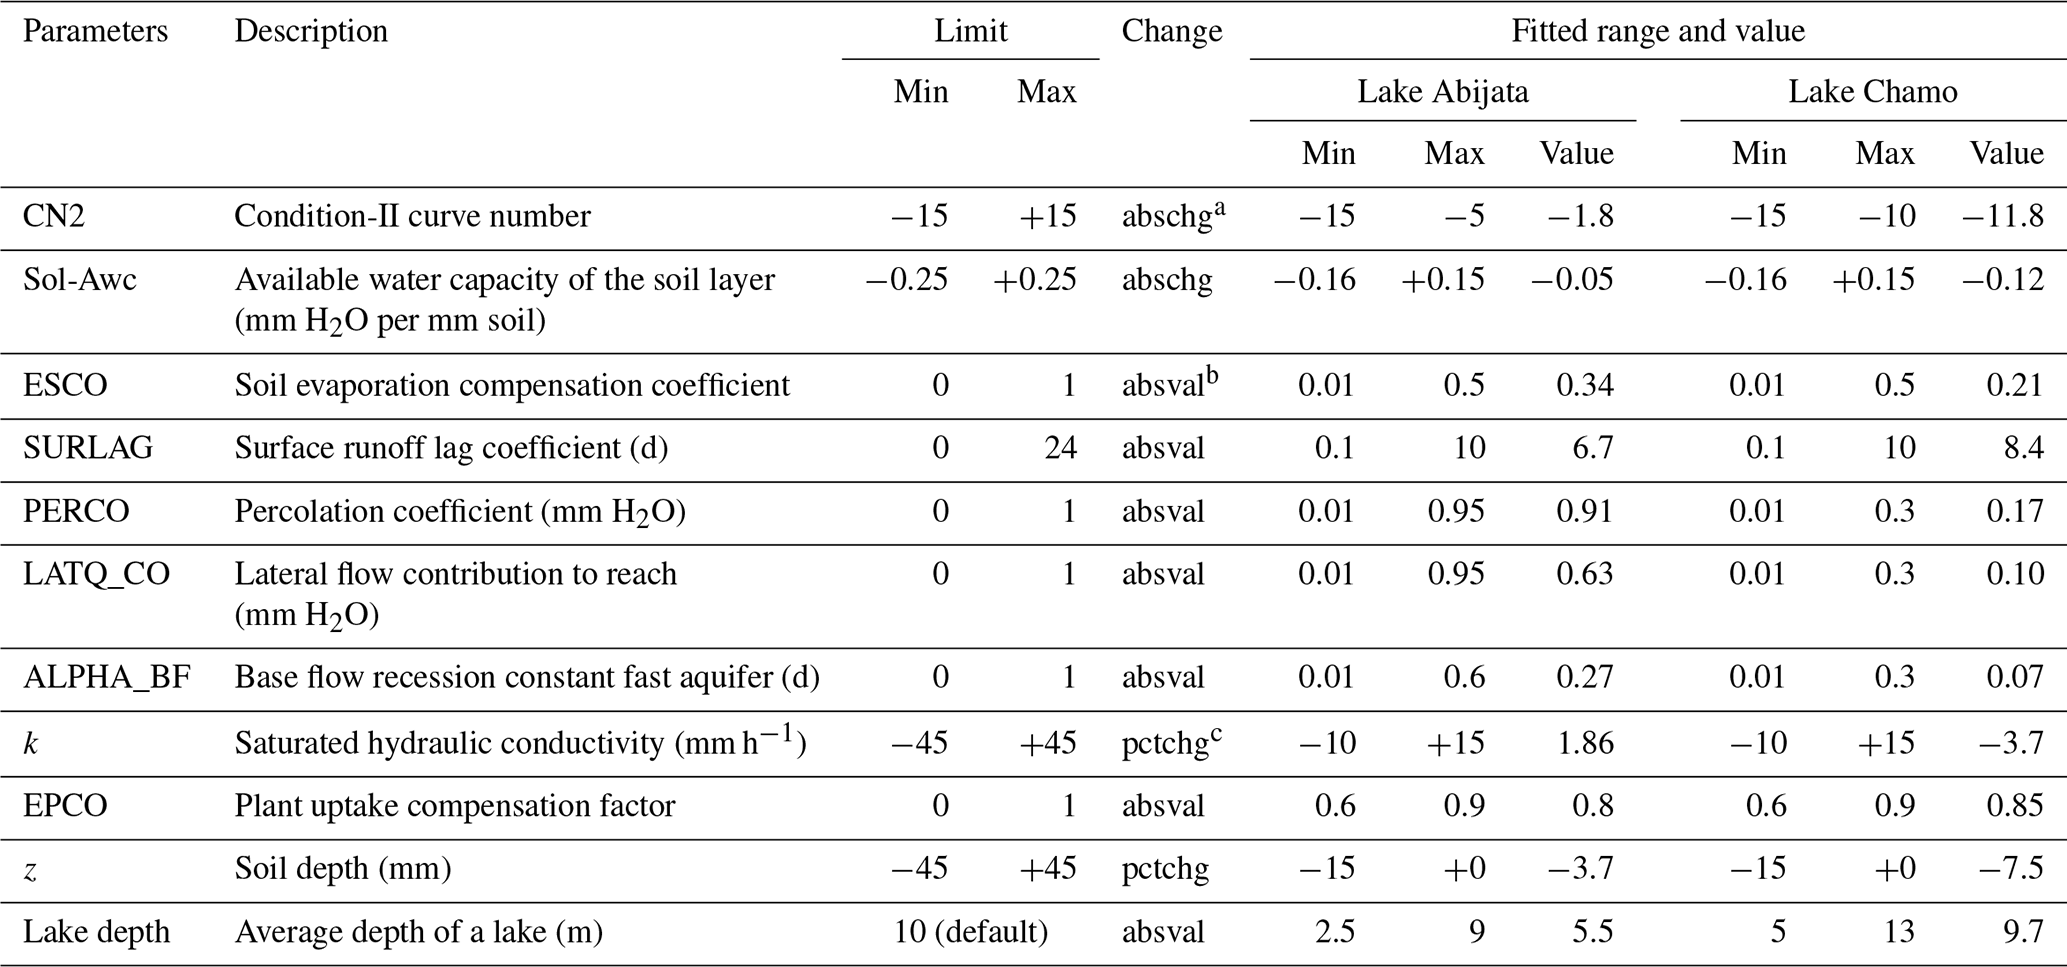
In the above, abschga adds an absolute value to the initial parameter value, absvalb replaces the initial parameter value with an absolute value, and pctchgc increases or decreases the initial parameter value by the given percentage of the value.
2.3.3 Model parameterization, calibration, and validation
Sensitive parameters were adopted from previous research (Ayalew et al., 2023) for streamflow simulation in two subbasins (Table 3). Lakes, which are located on the main channel network of the subbasin, are accounted for during modeling. The lake areal extent is used as input for the SWAT+ model. The default model parameters for the reservoirs are used; e.g., SWAT+ assumes an average depth of 10 m to calculate the volume of the lake. During the calibration process, the lake depth was modified using bathymetric data obtained from the Ethiopian Ministry of Water and Energy.
The streamflow data at each outlet (at each gauge from 1987 to 2006) are split into three periods for model warm-up (1 year), model calibration (1987 to 1995), and validation (1995 to 2006). For calibration, 5000 parameter sets were generated with Latin hypercube sampling (Soetaert and Petzoldt, 2010) using the parameter ranges given in Table 3. The model configurations were evaluated for the same 5000-parameter sets. For each parameter set, a model run was performed, and the final parameter fitted range was selected based on the best combined (Gupta et al., 2009), (Nash and Sutcliffe, 1970), percent bias , and 0 ≤ RMSE observations / standard deviation ratio (RSR) ≤ 1 values so that the KGE, NSE, PBIAS, and RSR were filtered within this range, and the model runs were accepted within these range. The best optimal value (fitted value) was selected from among the best values of the KGE. During calibration and validation, the water balance (total amount, distribution through time), storm sequence (time lag or shift), and shape of the hydrograph (rising limp, peak, recession) are considered to be key components. Calibration and validation were carried out in R using the packages FME for Latin hypercube sampling, hydroGOF for model evaluation (Zambrano-Bigiarini, 2024), and zoo (Zeileis and Grothendieck, 2005) and xts (Ryan and Ulrich, 2011) for data processing.
In addition to statistical performance evaluation, visual inspection of the hydrography and flow duration curve (FDC) provides information about the overall qualitative match between measured and modeled streamflow.
2.3.4 Regionalization
A multi-site (stepwise and pooled) regionalization method was applied to ensure that the model accurately represents the hydrological behavior of multiple locations and that the model can be used to make predictions for other locations. It improves the accuracy of the model by calibrating it with data from multiple sites (Hundecha et al., 2016). The method can also help to reduce uncertainty and improve the robustness of the model by taking into account the variability of hydrological conditions across different sites.
Hydrological processes are primarily controlled by rainfall, topography, soil characteristics, and land use; the similarity between watersheds is demonstrated prior to regionalization. The stepwise calibration is carried out on a nested class of subbasins for the corresponding multiple gauging stations in the subbasin (Tsegaw et al., 2019). A multi-gauge calibration strategy involves calibrating all parameters of the model domain simultaneously against multiple streamflow gauges within the subbasin (Wi et al., 2014). This approach aims to look for suitable parameters that are able to produce satisfactory model results at all neighboring gauging stations in a single implementation of optimization. Therefore, the pooled-regionalization technique has been chosen for this study based on its ability to predict streamflow and calibration uncertainties. To do so, Bulbula was assumed to be a gauged watershed, and Katar at Abura and Meki were assumed to be ungauged watersheds for validation (Fig. 2). Likewise, Kulfo at Abaya was considered to be a gauged watershed, and Bilate, Gidabo, and Upper Gelana were considered to be ungauged watersheds (Fig. 2). The gauged stations are considered to be the “donor” watersheds, and the ungauged stations are considered to be the “pseudo” watersheds. The donor watersheds are used to parameterize and calibrate the SWAT+ model parameters. The pseudo-ungauged watersheds are used to test the calibrated model. In testing the model on the pseudo-ungauged watersheds, the model was run with calibrated parameters for the same period, and the model performance for donor and pseudo watersheds was evaluated using the objective functions KGE, NSE, PBIAS, and RSR. If the developed model for the donor watershed performed sufficiently (KGE ≥ 0.5, NSE ≥ 0.5, −25 ≤ BIAS ≤ 25, and 0 ≤ RSR ≤ 1) for the pseudo watershed, the model was considered to be robust and was used for regionalization. The optimal values of the parameters of each catchment were transferred to the nearest ungauged catchments and reaches.
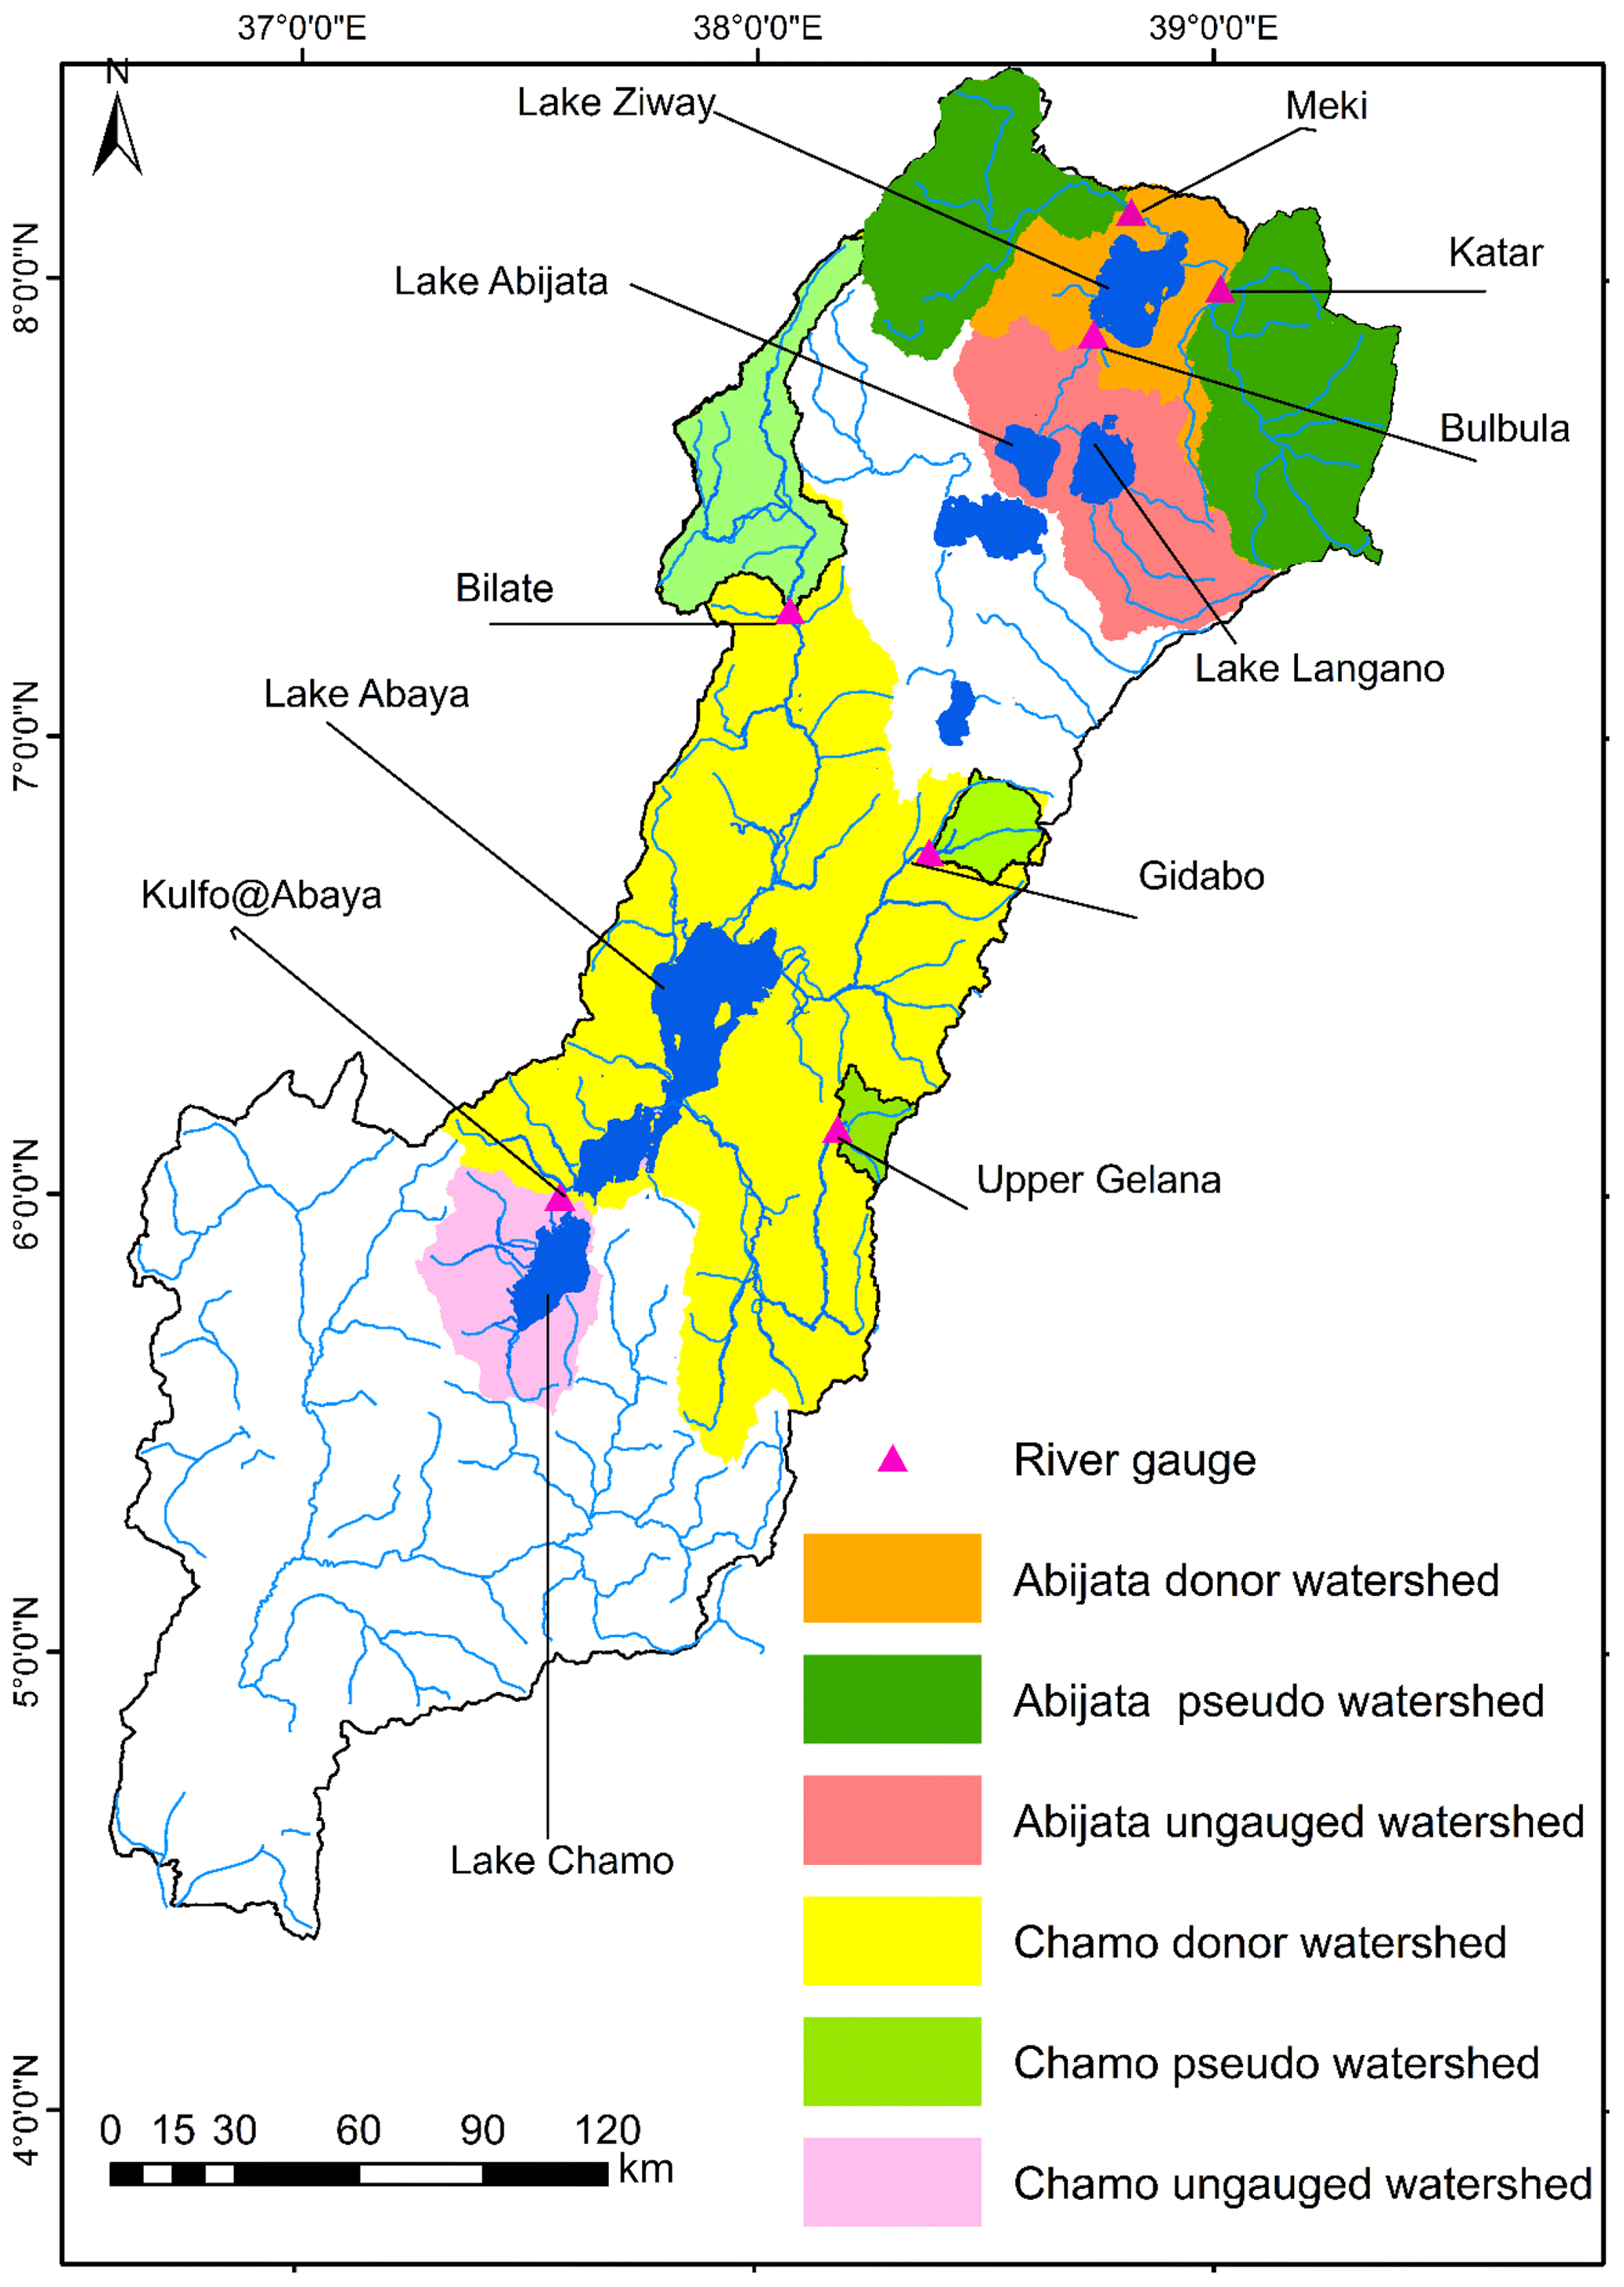
Figure 2Multi-site pooled-calibration technique to estimate flow of ungauged watersheds.
2.3.5 Bathymetry analysis
Lake Chamo was surveyed using a multibeam echo sounder (MBES). It is sonar technology that uses a band of multiple beams to create a high-resolution 3D map of the lake bed. It is based on the principle of emitting a series of acoustic pulses and measuring the time it takes for the sound to travel to the lake bed and back. Although our hydrologic model was developed on two terminal lakes, Abijata and Chamo, we conducted a bathymetry survey only for Lake Chamo.
The survey was conducted during the dry season from 1 to 21 July 2021. Before the survey began, the surface elevation of the lake level was measured with a handheld GPS, which was at a level of 1110 m, used as the reference level. Following that, a continuous record of lake floor topography was measured with an MBES mounted on a motor boat at a constant speed of 5 km h−1 along predefined average traverse lines at 450 m spacing along a north–south direction. A crossing and recrossing survey was also performed in the same area to correct errors caused by potentially misleading reflections and variations in the speed of sound moving through the lake (Fig. 3). To supplement the dataset produced by the echo sounder, zero depth coordinates were taken simultaneously with a handheld GPS along the lake's shoreline at shorter distances. Because there were no other obstacles, the true size of the lake was preserved during mapping using these border coordinates. The bathymetry data, typically in the form of point data (XYZ), that represent the depth measurements at various locations within the lake were imported into Surfer20 to analyze the lake floor morphology in 2D and 3D, as well as the depth, area, and volume.
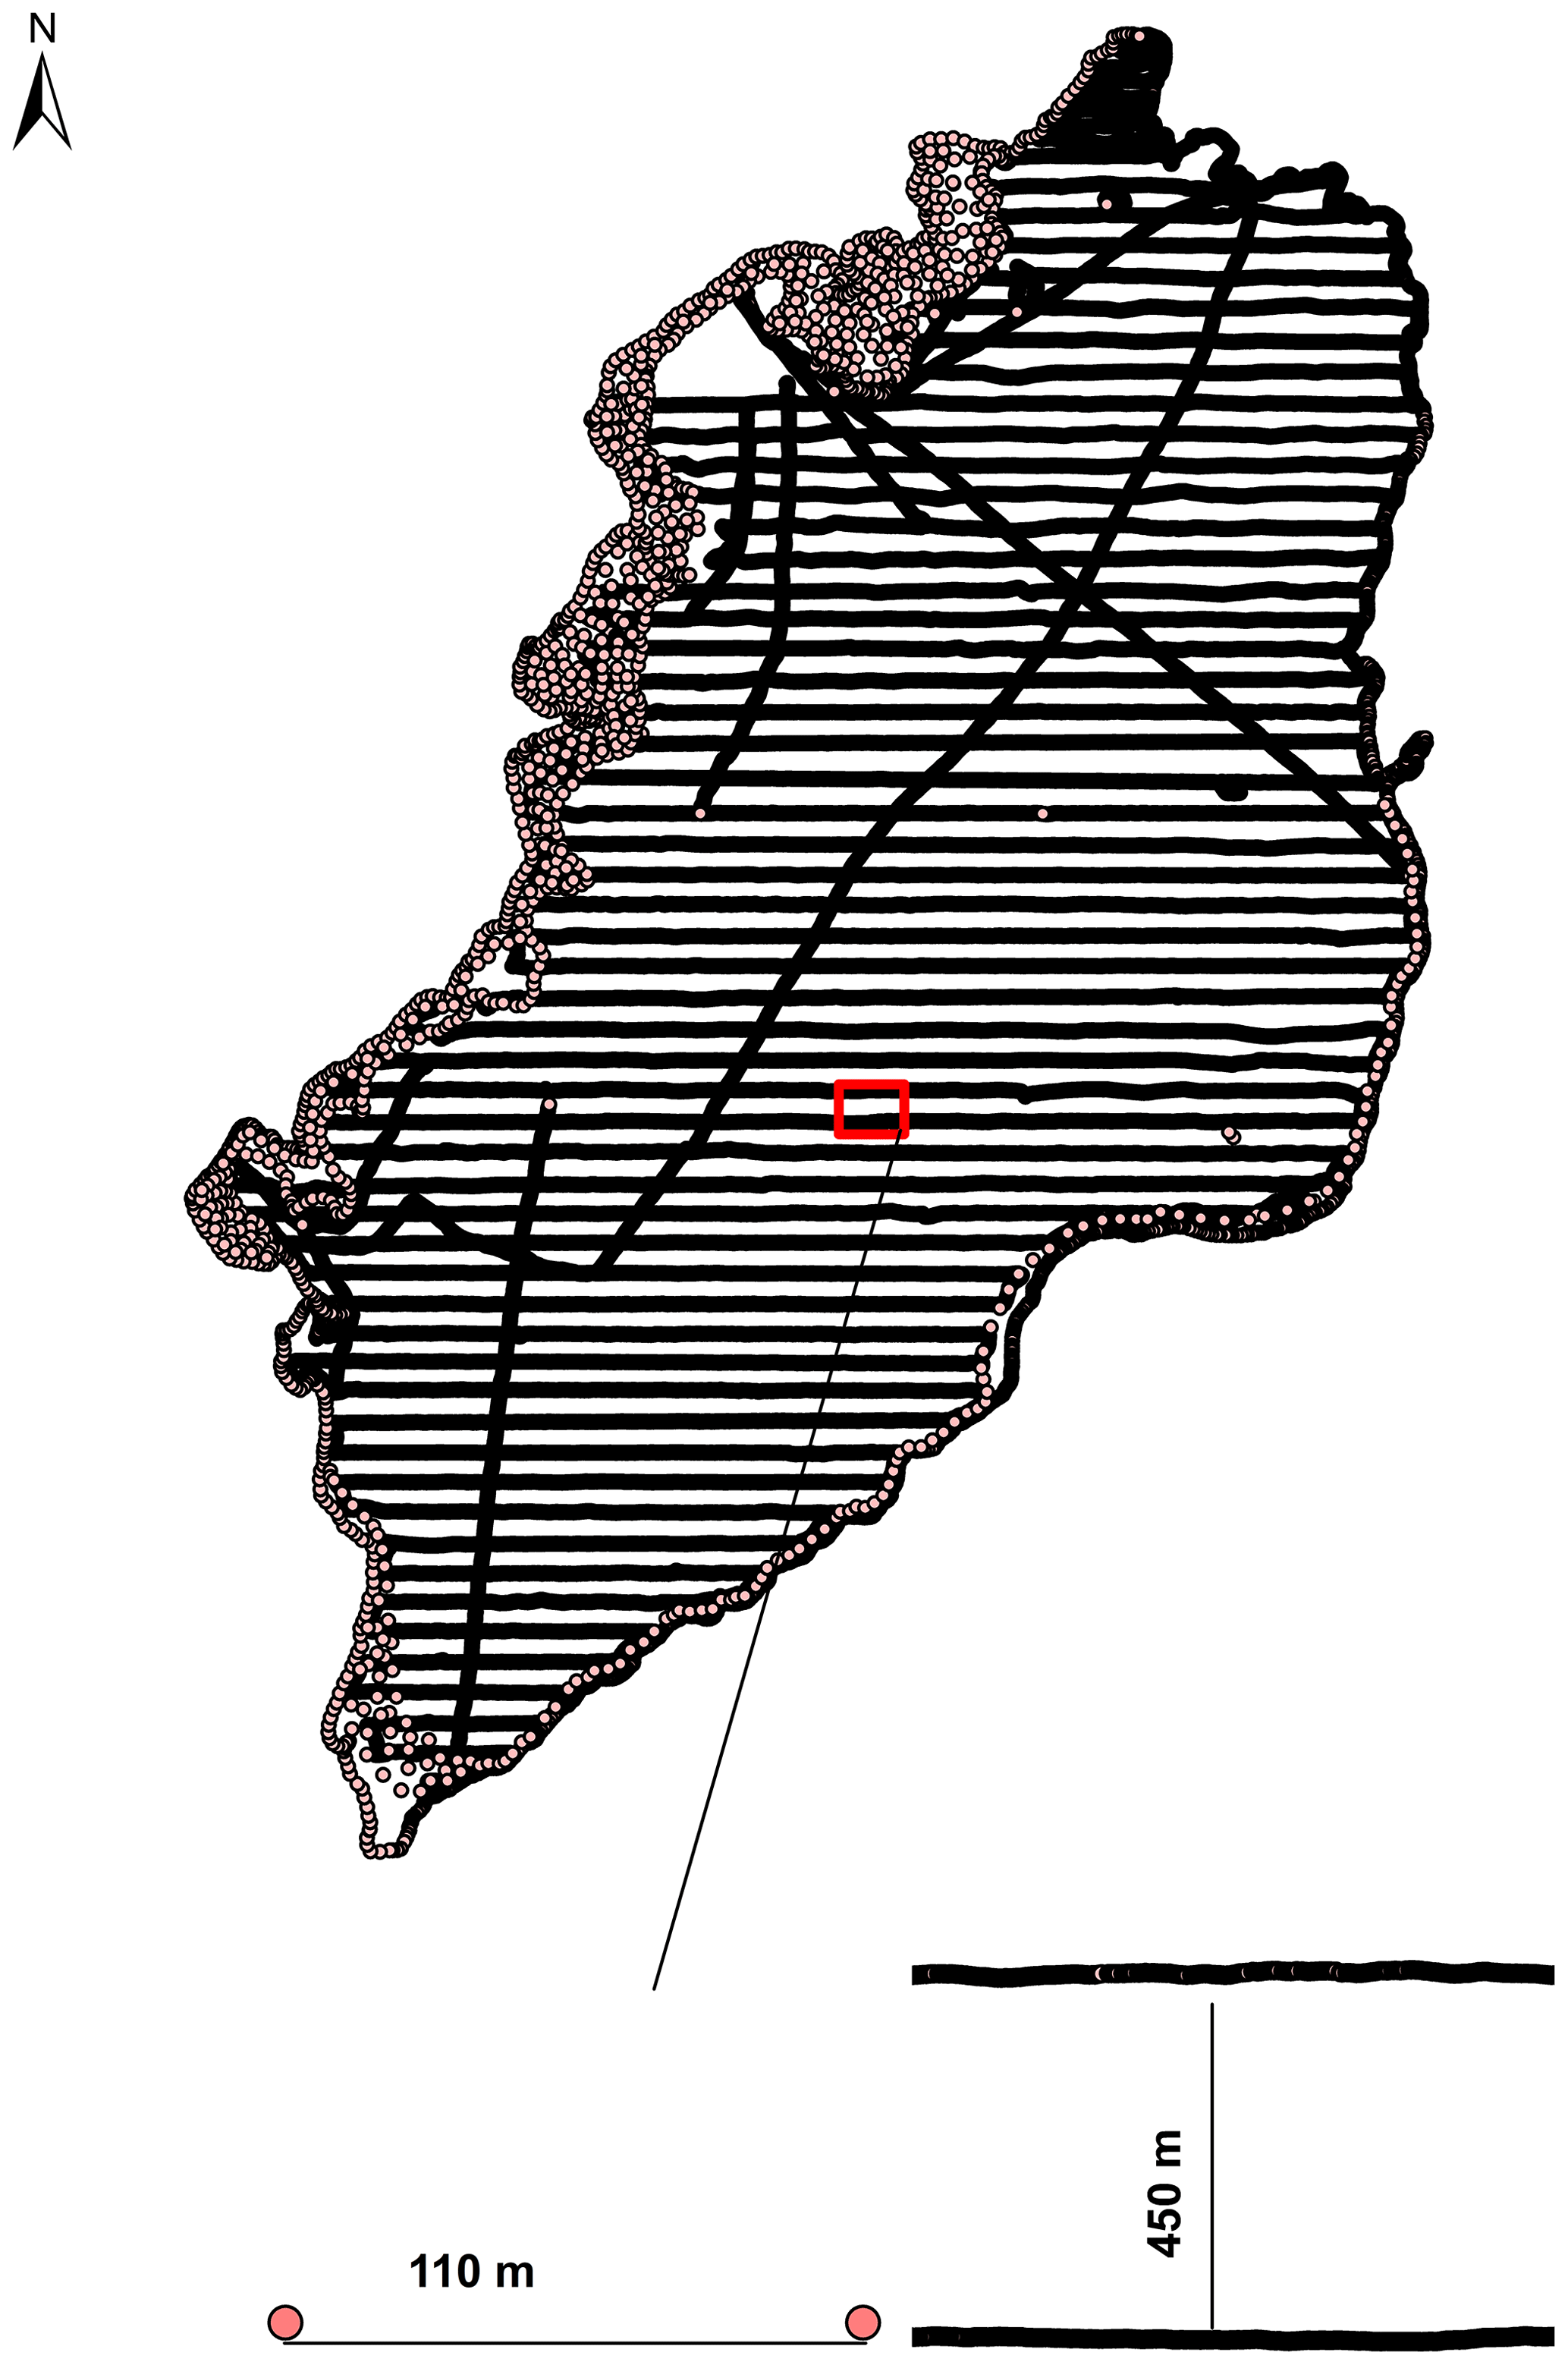
Figure 3Bathymetry survey using a multibeam echo sounder (MBES) along predefined average traverse lines at 450 m spacing along a north–south direction and at 110 m spacing along an east–west direction.
3.1 Lake water balance analysis
3.1.1 Hydrological modeling and model performance
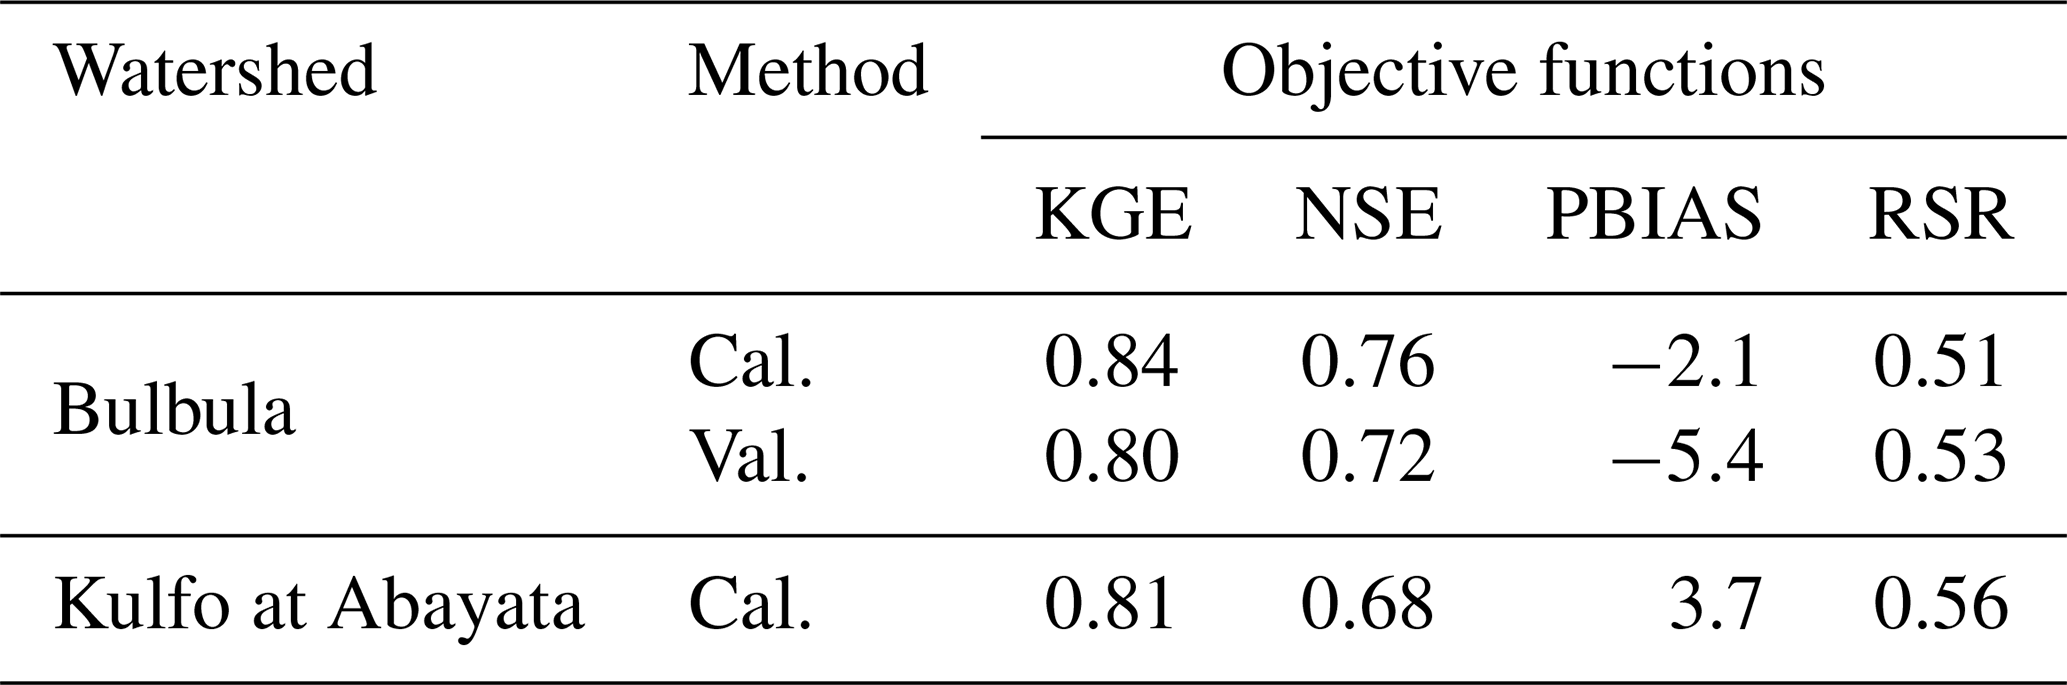
The hydrographs shown in Fig. 4 indicate that the SWAT+ model was successfully calibrated and validated for each donor watershed. The relationship between the simulated and observed streamflow based on the model is statistically summarized in Table 4. The values of the objective functions indicate a strong goodness of fit for both donor and pseudo watersheds.
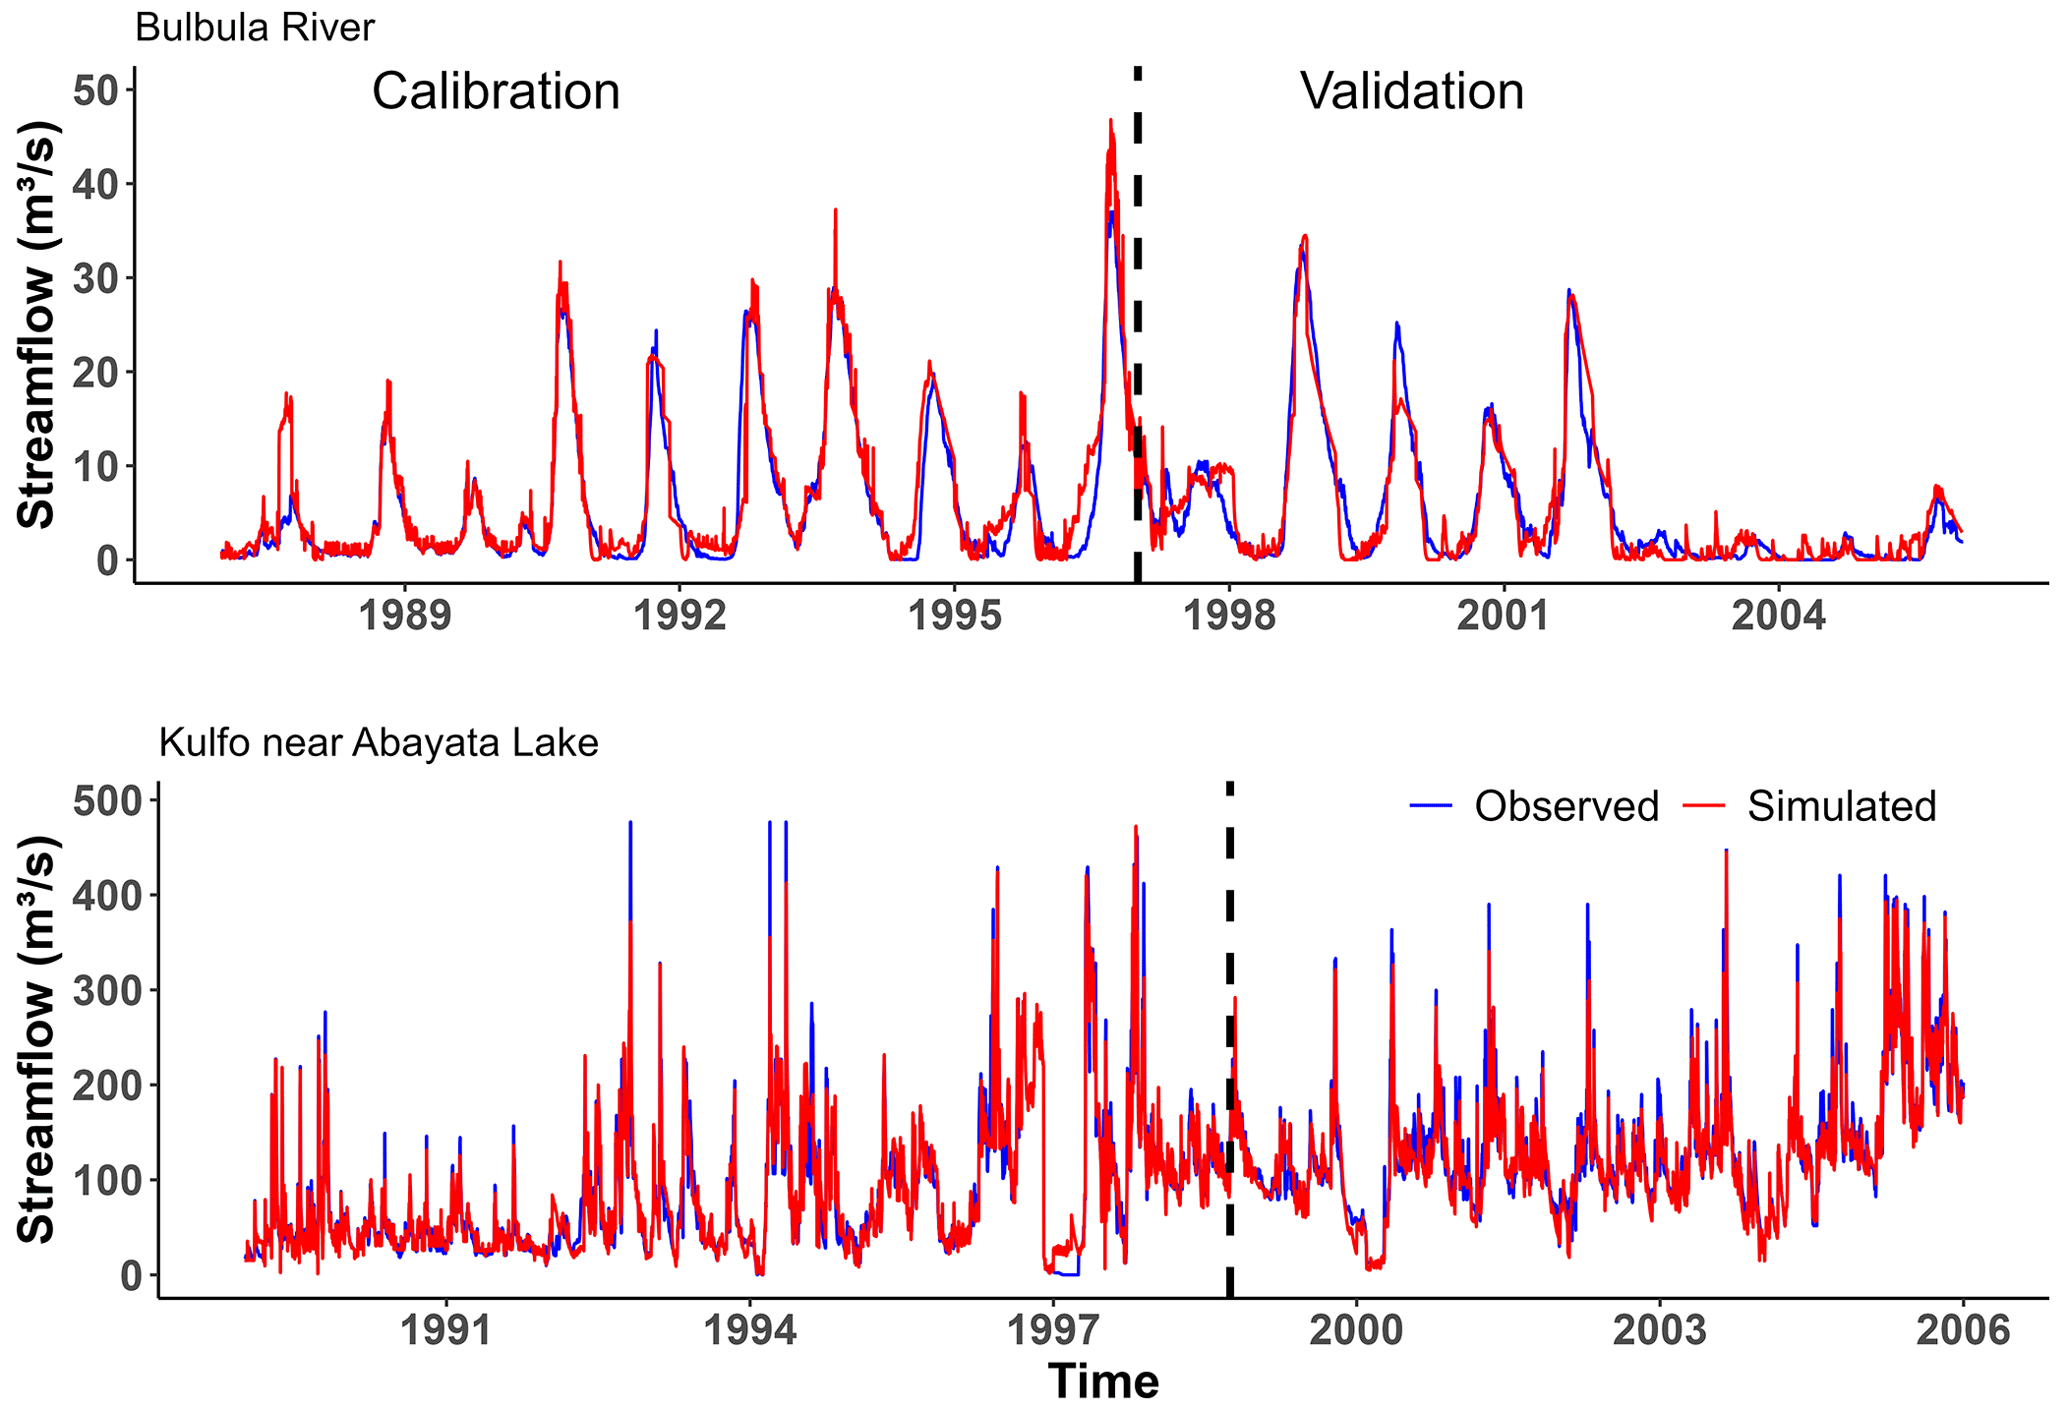
Figure 4Hydrograph of modeled and observed daily streamflow for calibration and validation period of the donor watersheds.
Table 4Model evaluation statistics of the daily SWAT+ for the “donor” watersheds (1987–2000).
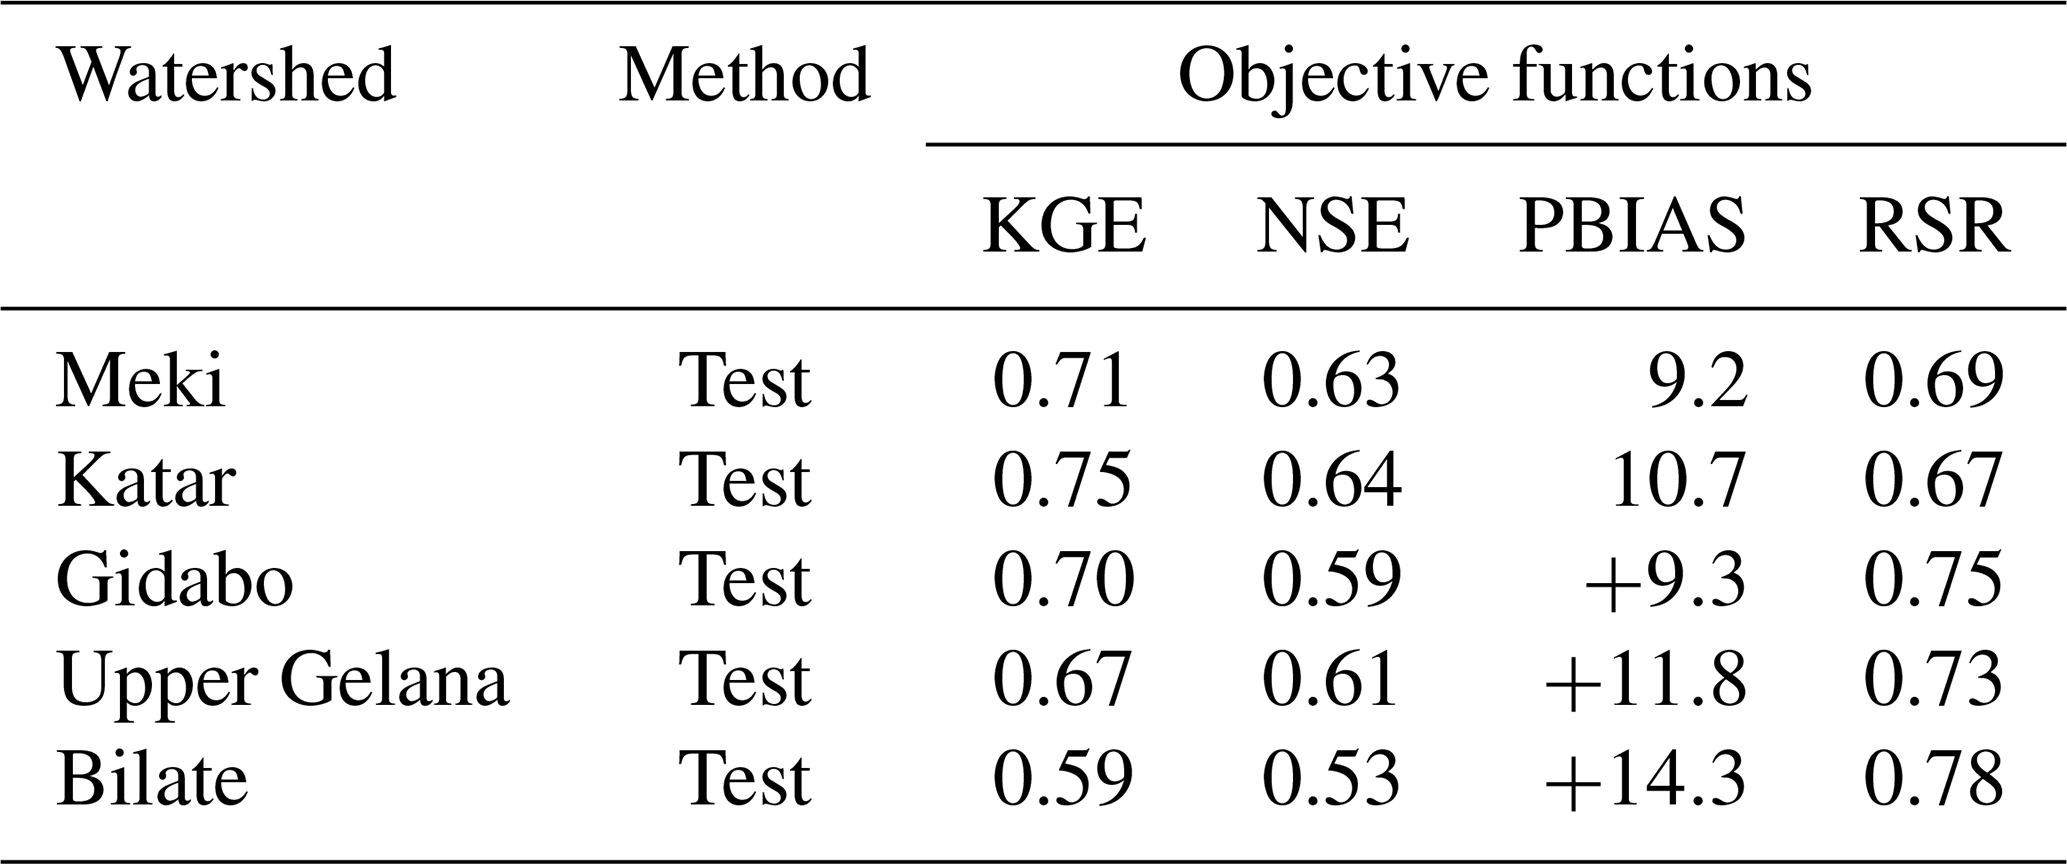
These two regionalization models have been tested to their respective subbasins using the pseudo watersheds. The hydrograph in Fig. 5 depicted the developed model's success within each respective pseudo watersheds. Meki and Katar are pseudo watersheds of the donor watershed Bulbula, and Bilate, Gidabo, and Upper Gelana are pseudo watersheds of the donor watershed Kulfo at Abayata. The values of the objective functions also indicate a strong goodness of fit for pseudo watersheds, and these are statistically summarized in Table 5.
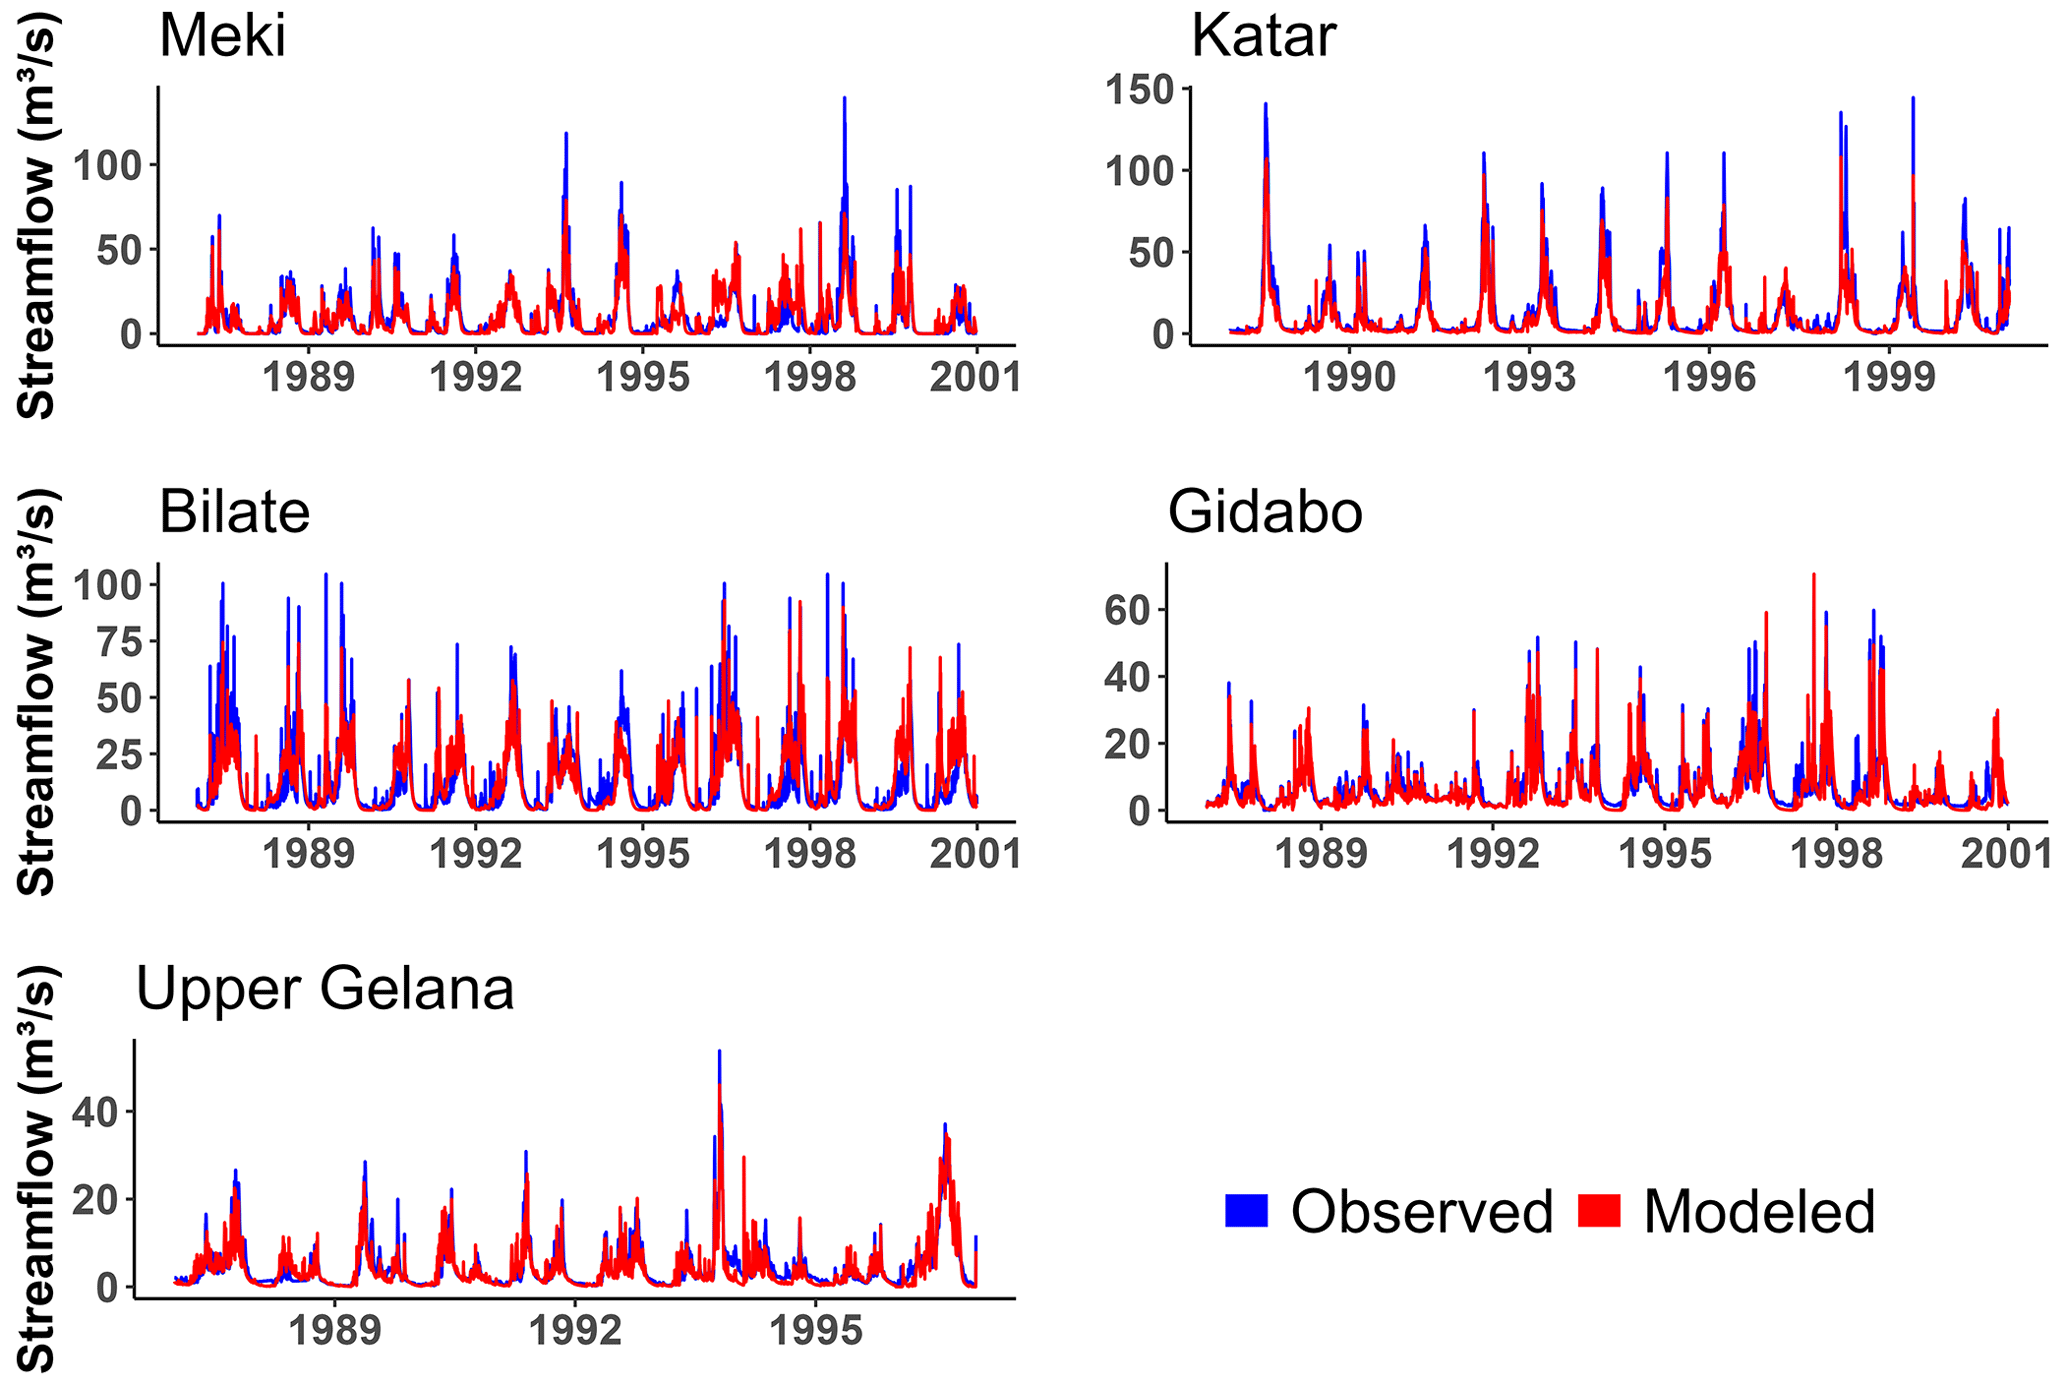
Table 5Model evaluation statistics of the daily SWAT+ for the pseudo watersheds (1987–2000).
Similarly, the FDC in Figs. 6 and 7 shows that there is a good agreement between observed and modeled discharge in both donor and pseudo watersheds. Throughout the calibration and validation period, the model shows a slight overestimation of high, middle, and low flows in Bulbul River. However, at Kulfo, high and low flows are slightly underestimated. The test of the regionalization approach shows that high flows were underestimated in all pseudo watersheds.
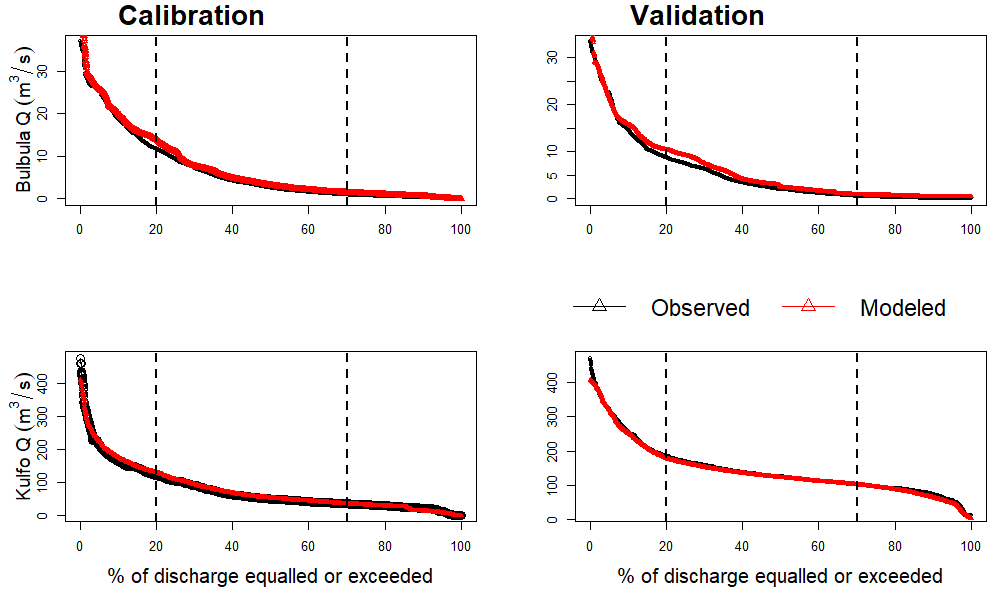
Figure 6Flow duration curves of observed and modeled daily streamflow for the calibration and validation period of the donor watersheds.
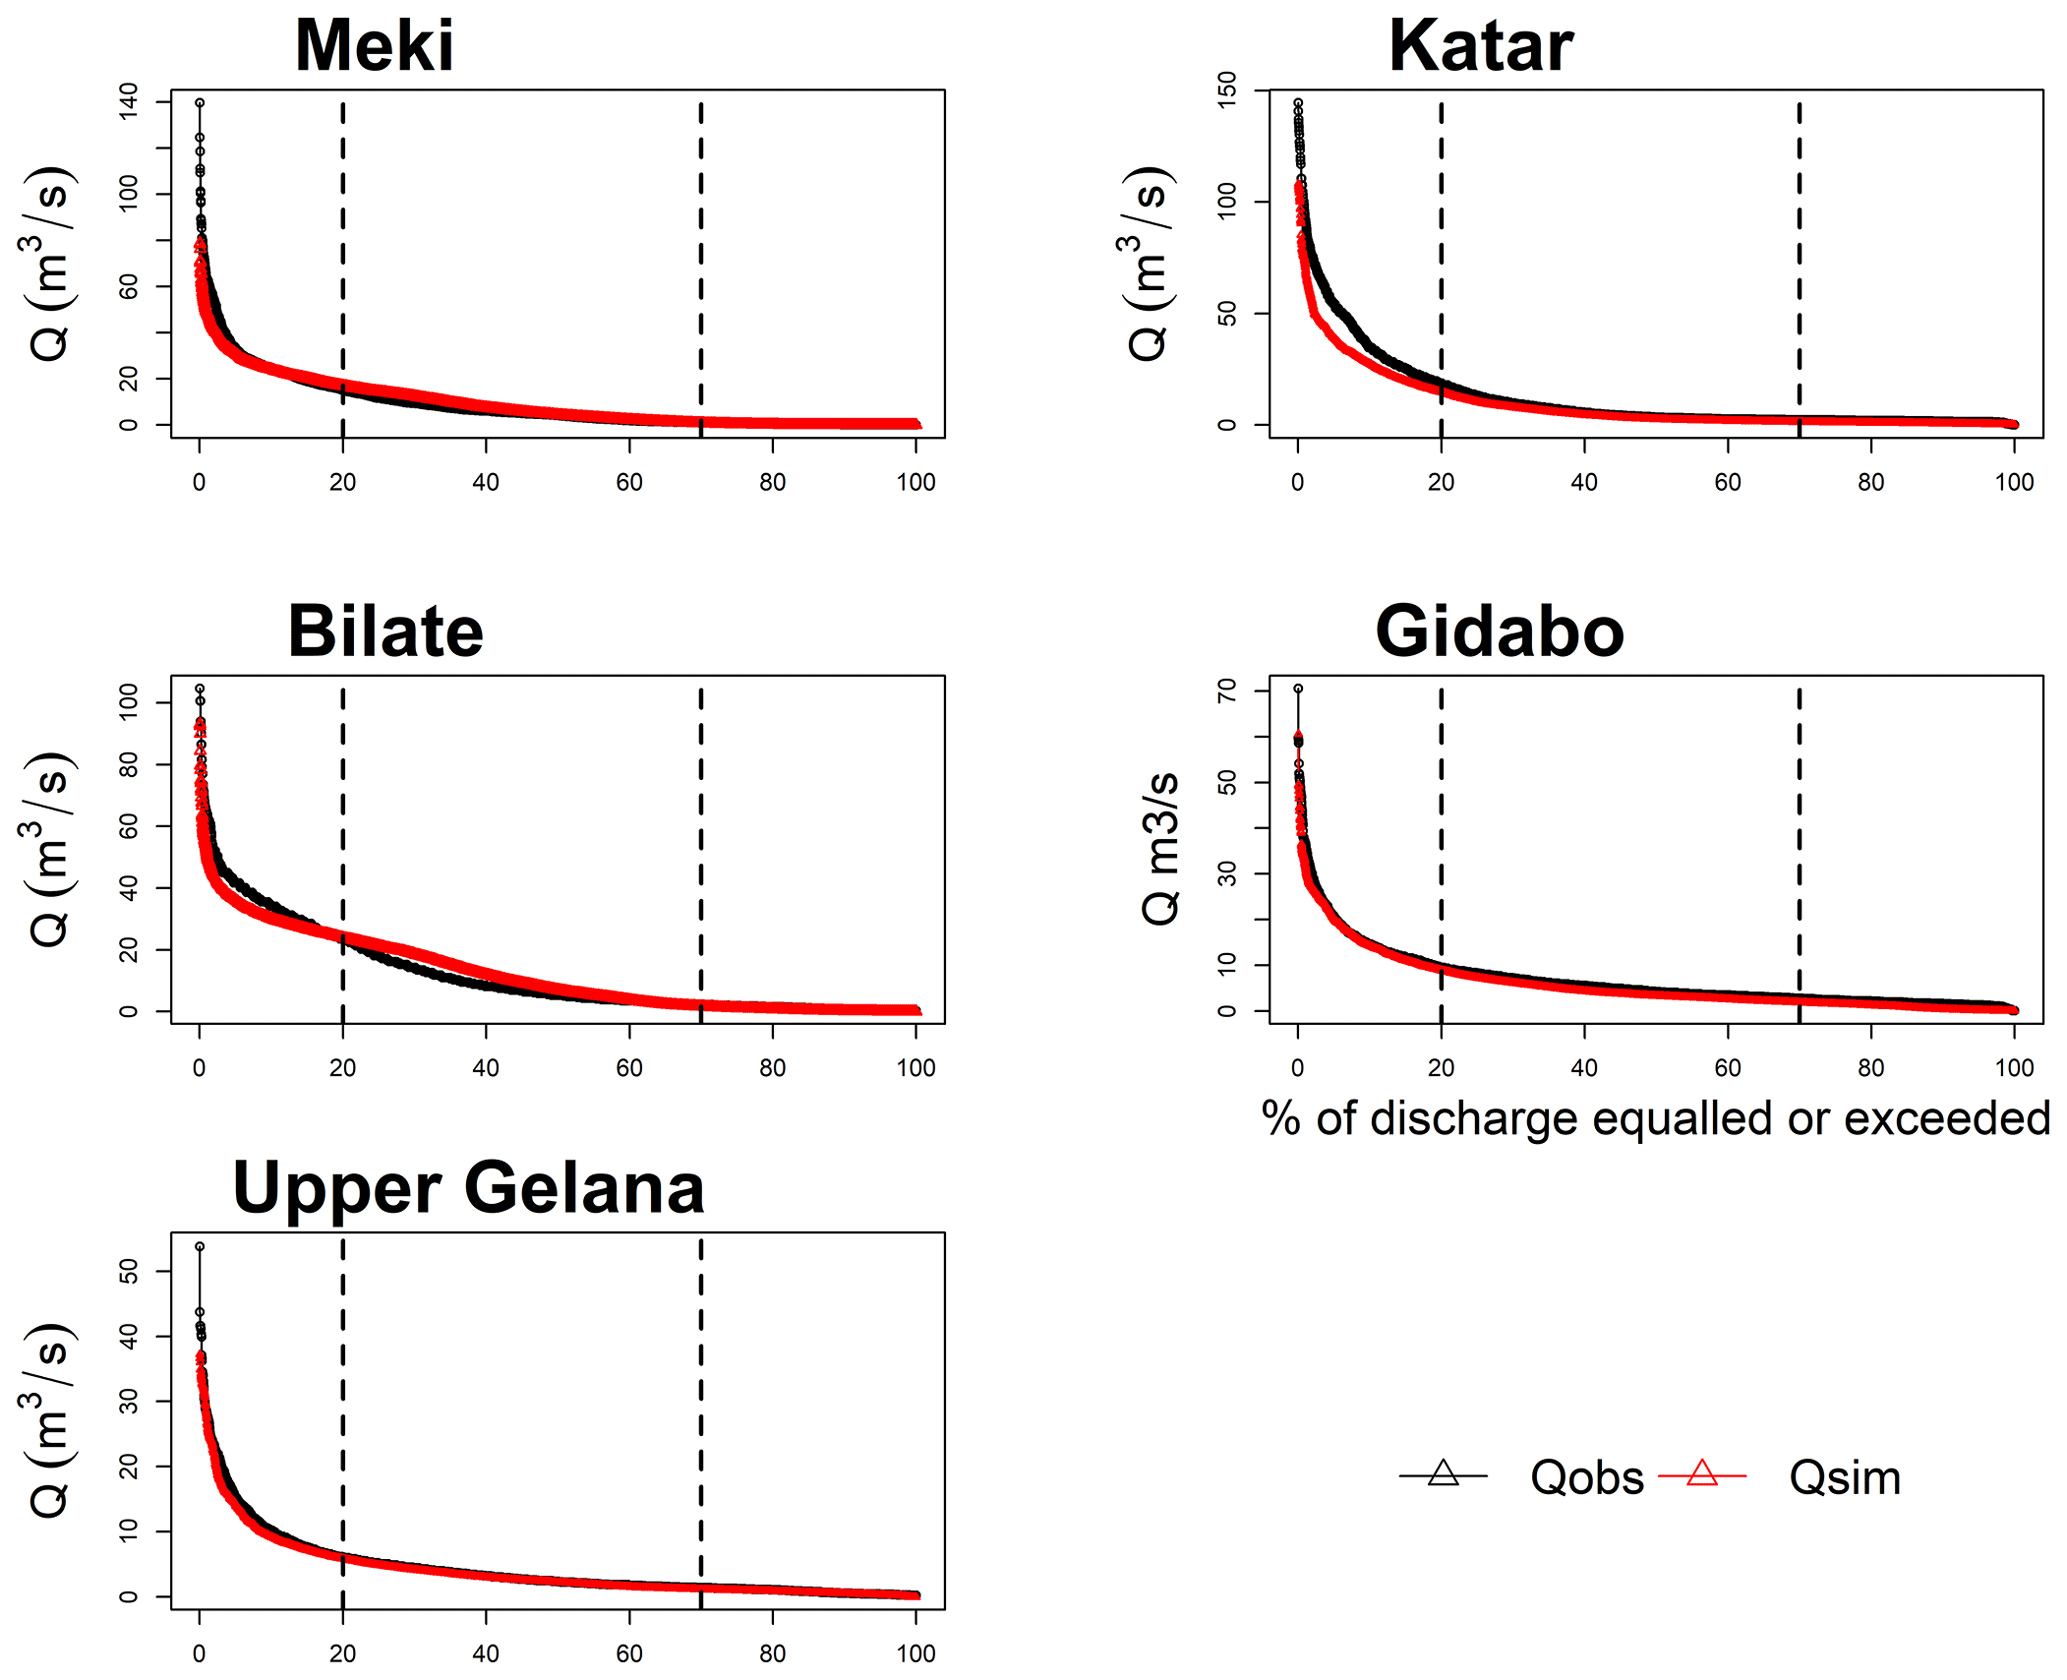
Figure 7Flow duration curves of observed and modeled daily streamflow of the pseudo watersheds.
3.1.2 Lake water balance change
The water balance of Lake Abijata is controlled by rainfall and evaporation, water abstraction from the lake by the soda ash factory, inflow from the Bulbula and Horakelo rivers, and inflow from ungauged watersheds. The water balance of Lake Chamo is primarily controlled by evaporation and rainfall on the lake, inflow from Kulfo River, 40 springs, and inflow from ungauged watersheds (Sile and Elgo) (Table 6). We assumed that the groundwater flow and movement influences are negligible, following findings by Ayenew (2004). The result depicted that the surface runoff and evaporation increased in the impact period in both lakes. Abstraction increased in Lake Abijata (Table 6). Changes in lake level and volume reflect variations in the inputs from rainfall, evaporation, abstraction, and surface flow. Trends in the lake water levels in both lakes are highly variable. The Lake Abijata level decreased by 2 m due to large-scale water use for irrigation and soda abstraction in the catchment; significant changes have been recorded in the past few decades, and by 2021, the area of Lake Abijata had been reduced by about 68 % as compared to year 1989 (Ayalew et al., 2022) and 60 % as compared to the year 2016 (Wagaw et al., 2019). Because irrigation is highly expanding and because the abstraction of water from the Meki, Katar and Bulbula rivers and from Lake Ziway for irrigation takes place year-round, the effect on water levels is increased during the dry season (Getnet et al., 2014; Wagaw et al., 2019). The water balance of the lakes in Table 6 was determined by combining model output, including lake areal rainfall, evaporation, and inflow from both gauged and ungauged watersheds, with recorded data such as abstraction, depth, and spring inflow.
Table 6Changes in the annual water balance components (in 106 m3).
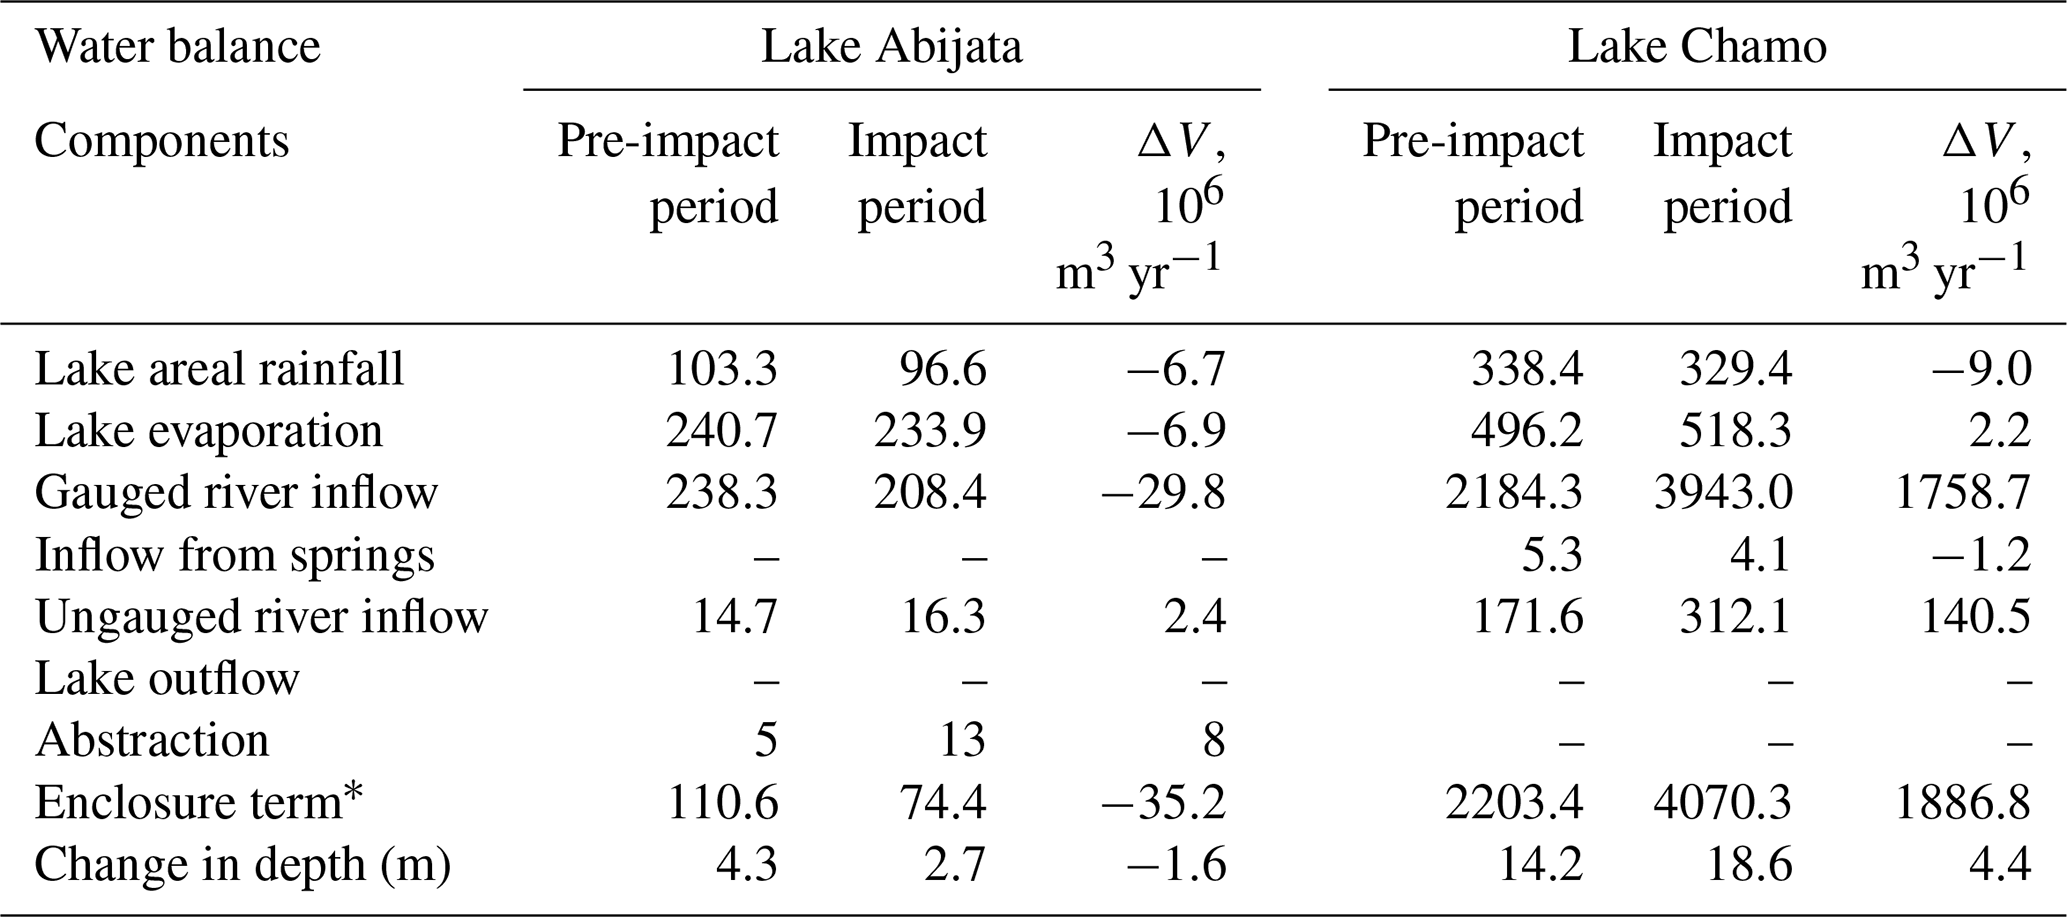
* The enclosure term in this case is the water balance on the lake, which is determined by the difference between the input and output. The magnitude of this term depends on the amount of loss and gain.
3.2 Hydrological alteration
The analysis of hydrological alterations was carried out on both Lake Abijata and Lake Abaya. The change point analysis presented in Fig. 8 shows that there is an abrupt shift in lake level over the Rift Valley Lakes Basin. The change point analysis results revealed that the lake level decreased after the year 2003. Lake Abaya experienced a decrease after a change point from the early 2000s until 2009, and, more recently, a large increase was observed. Based on the change point analysis, three periods have been identified: the pre-impact period (1985–2003), the impact period (2003 to 2009), and the post-impact period (2010 to 2015).
The environmental flow analysis in Fig. 8 depicted that the natural flow pattern has been disrupted. The magnitude and timing, duration, seasonality, and frequency of high and low flows of the impact periods have changed compared to those of the pre-impact period. The extreme-low-flow, low-flow, small-flood, and large-flood values for the impact period have decreased in Lake Abijata, while they have increased in Lake Abaya.
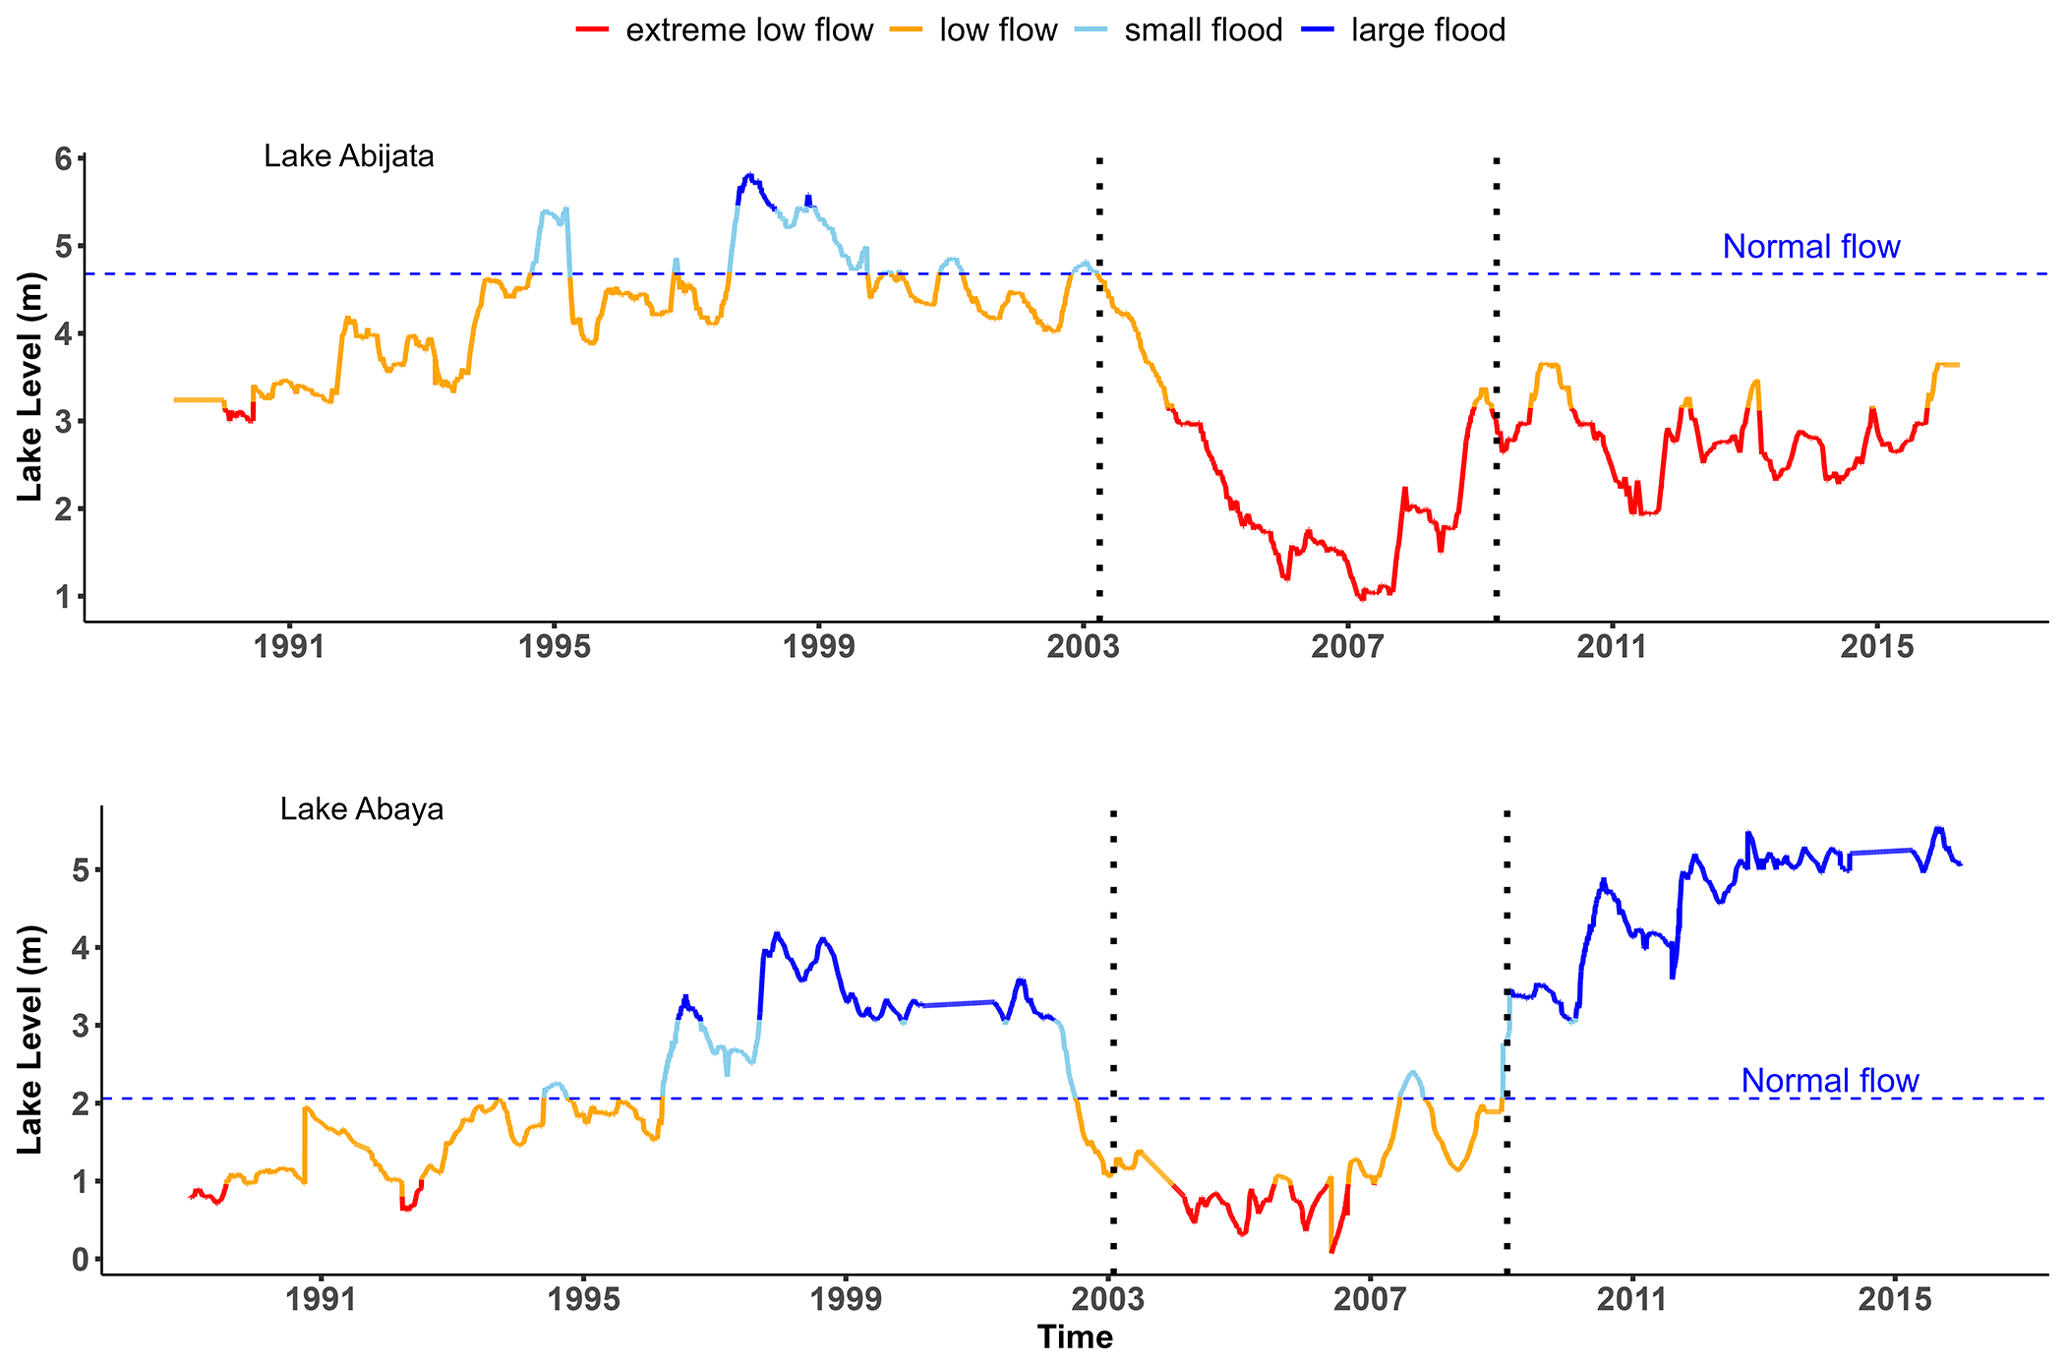
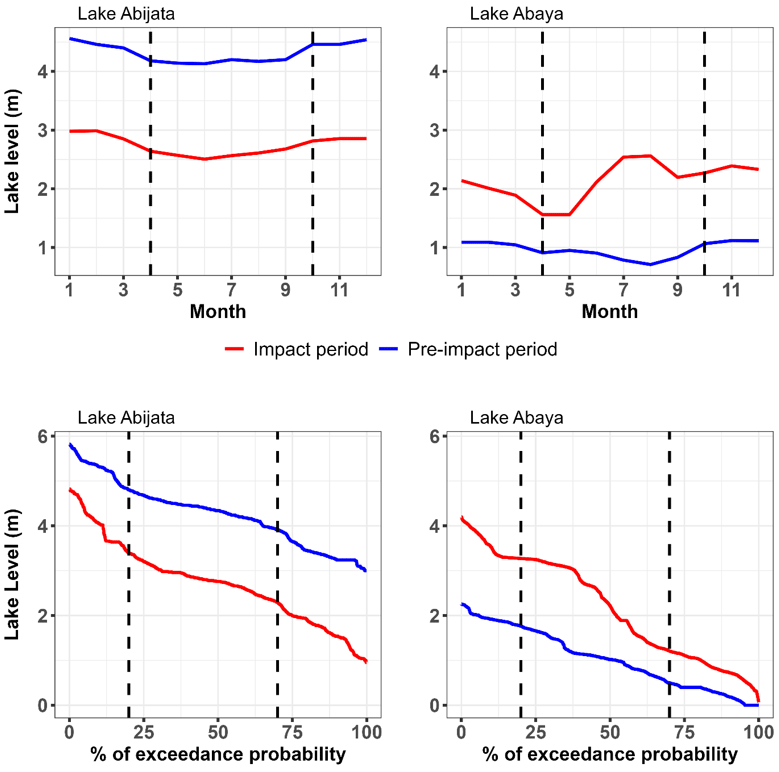
Figure 9 depicts the monthly median and FDC plot of Lake Abijata and Lake Abaya in the pre-impact and impact periods. It is observed that the lake level and the natural regime were altered after the years 2002 and 2003 in both lakes. The Lake Abijata level exhibited a significant decrease during the pre-impact period in all months, while the Lake Abaya level showed a significant increase during the impact period in all months. The FDC showed an increase in the Lake Abaya level across all flow regimes (low, middle, and high) and a decrease in the Lake Abijata level. A high degree of alteration is observed in both lakes, but the hydrological regime of Lake Abaya has undergone a complete change, especially during the dry season (May to September). This is associated with a change in the rainfall pattern (Ayalew et al., 2022).
The median of monthly flow (RVA group 1) throughout the impact period indicates a decreasing trend compared with the pre-impact period in Lake Abijata. The dispersion coefficients for the pre-impact period (ranging from 0.21 to 0.33) are mostly lower than those for the impact period (ranging from 0.3 to 0.49), indicating higher flow fluctuations in the impact period due to the irrigation expansion and soda ash factory. On the other hand, in Lake Abaya, the median of monthly flow depicted an increasing trend compared with the pre-impact period. The dispersion coefficients for the pre-impact period (ranging from 1.18 to 1.68) are mostly lower than those for the impact period (ranging from 0.80 to 1.5), indicating that the higher flow fluctuations in the impact period due to high runoff are associated with high deforestation (Ayalew et al., 2022; Dessie and Kleman, 2007; Garedew et al., 2009). The medians of annual 1, 3, 7, 30, and 90 d minima and 1, 3, 7, 30, and 90 d maxima for the impact period decrease significantly for Lake Abijata and significantly increase in the case of Lake Abaya. These results indicate that the daily, weekly, monthly, and seasonal maximum and minimum flow cycles are negatively influenced by water abstraction for irrigation and factory in the case of Lake Abijata and positively influenced by runoff increases in the case of Lake Abaya.
The median Julian dates for the annual 1 d minima were shifted forward in the impact period, moving from the 137th and 91st days in the pre-impact period to the 130th and 113th days in Lake Abijata and Lake Abaya, respectively. Likewise, the median Julian dates for the annual 1 d maxima have also moved forward in the impact period, shifting from the 309th and 320th days to the 327th and 311st days in Lake Abijata and Lake Abaya, respectively. The result also showed that there is no significant change in the medians of low- and high-pulse counts and in the base flow index in the impact period and in the pre-impact period in both lakes (Fig. 10).
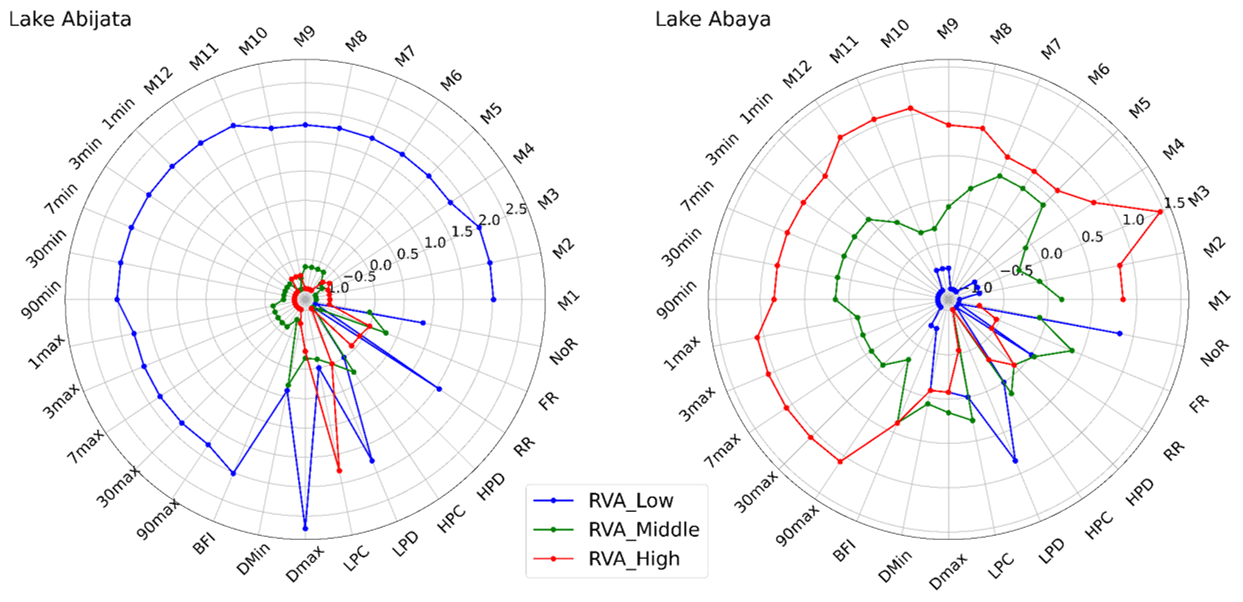
Figure 10Hydrological alteration analysis using RVA, where M1, M2, M3, M4, M5, M6, M7, M8, M9, M10, M11, M12, 1min, 3min, 7min, 30min, 90min, 1max, 3max, 7max, 30max, 90max, BFI, DMin, Dmax, LPC, LPD, HPC, HPD, RR, FR, and NoR refer to January, February, March, April, May, June, July, August, September, October, November, December, 1_day_min, 3_day_min, 7_day_min, 30_day_min, 90_day_min, 1_day_max, 3_day_max, 7_day_max, 30_day_max, 90_day_max, Base_flow_index, Date_of_min, Date_of_max, Low_pulse_count, Low_pulse_duration, High_pulse_count, High_pulse_duration, Rise_rate, Fall_rate, and Number_of_reversals.
The medians of low-pulse durations (increased from 2 to 47) and high-pulse durations (increased from 64 to 140) in the impact period are higher than those in the pre-impact period in Lake Abijata. However, the medians of low-pulse durations (decreased from 125 to 36) and high-pulse durations (increased from 208 to 223) in the impact period in Lake Abaya indicate a high hydrologic alteration of low- and high-pulse durations. Medians of high-pulse durations have increased in both lakes, which is associated with increasing runoff during the wet season.
The medians of rise rate and fall rate are the same as those in the pre-impact period in both lakes, except in terms of the number of reversals. The number of reversals is higher than in the pre-impact period (decreased from 41 to 23) in Abaya lake and (decreased from 88 to 78) in Abijata lake.
Considering all 33 parameters (Fig. 10), the highest hydrologic alteration factors occurred in the low-RVA category (ranging from 1 to 2.7), except for of fail rate and high-pulse duration, indicating that annual parameter values fell inside the RVA target window more often than expected in Lake Abijata. Likewise, in this lake, the second highest hydrologic alteration factors occurred in the high-RVA category (ranging from −1 to −0.1), except for low-pulse count, indicating that annual parameter values fell inside the RVA target window less often than expected. High hydrologic alteration factors have also been observed in Lake Abaya in the low-RVA category (ranging from −1 to −0.1), except for fail rate and low-pulse duration, indicating that annual parameter values fell inside the RVA target window less often than expected. Additionally, in this lake, the second highest hydrologic alteration factor occurred in the high-RVA category in group 1 and group 2 (ranging from 0.6 to 1.5), indicating that annual parameter values fell inside the RVA target window more often than expected.
Generally, results indicate that the hydrological system is changing in both lake basins but responding differently to the changes. Changes in hydrology are mainly associated with human activity and climate change. Apparently, the changing hydrology for the impact period (2003–2009) was worse in Lake Abijata and was linked with frequent droughts and water abstraction. Despite the fact that Lake Abijata's level increased during the post-impact period, it remained lower than the lake level observed in the pre-impact period. In contrast to the pre-impact period, the water level of Lake Abaya increased during the post-impact period.
3.3 Bathymetry analysis and bathymetric characteristics of lakes
3.3.1 Morphometric characteristics and contour maps
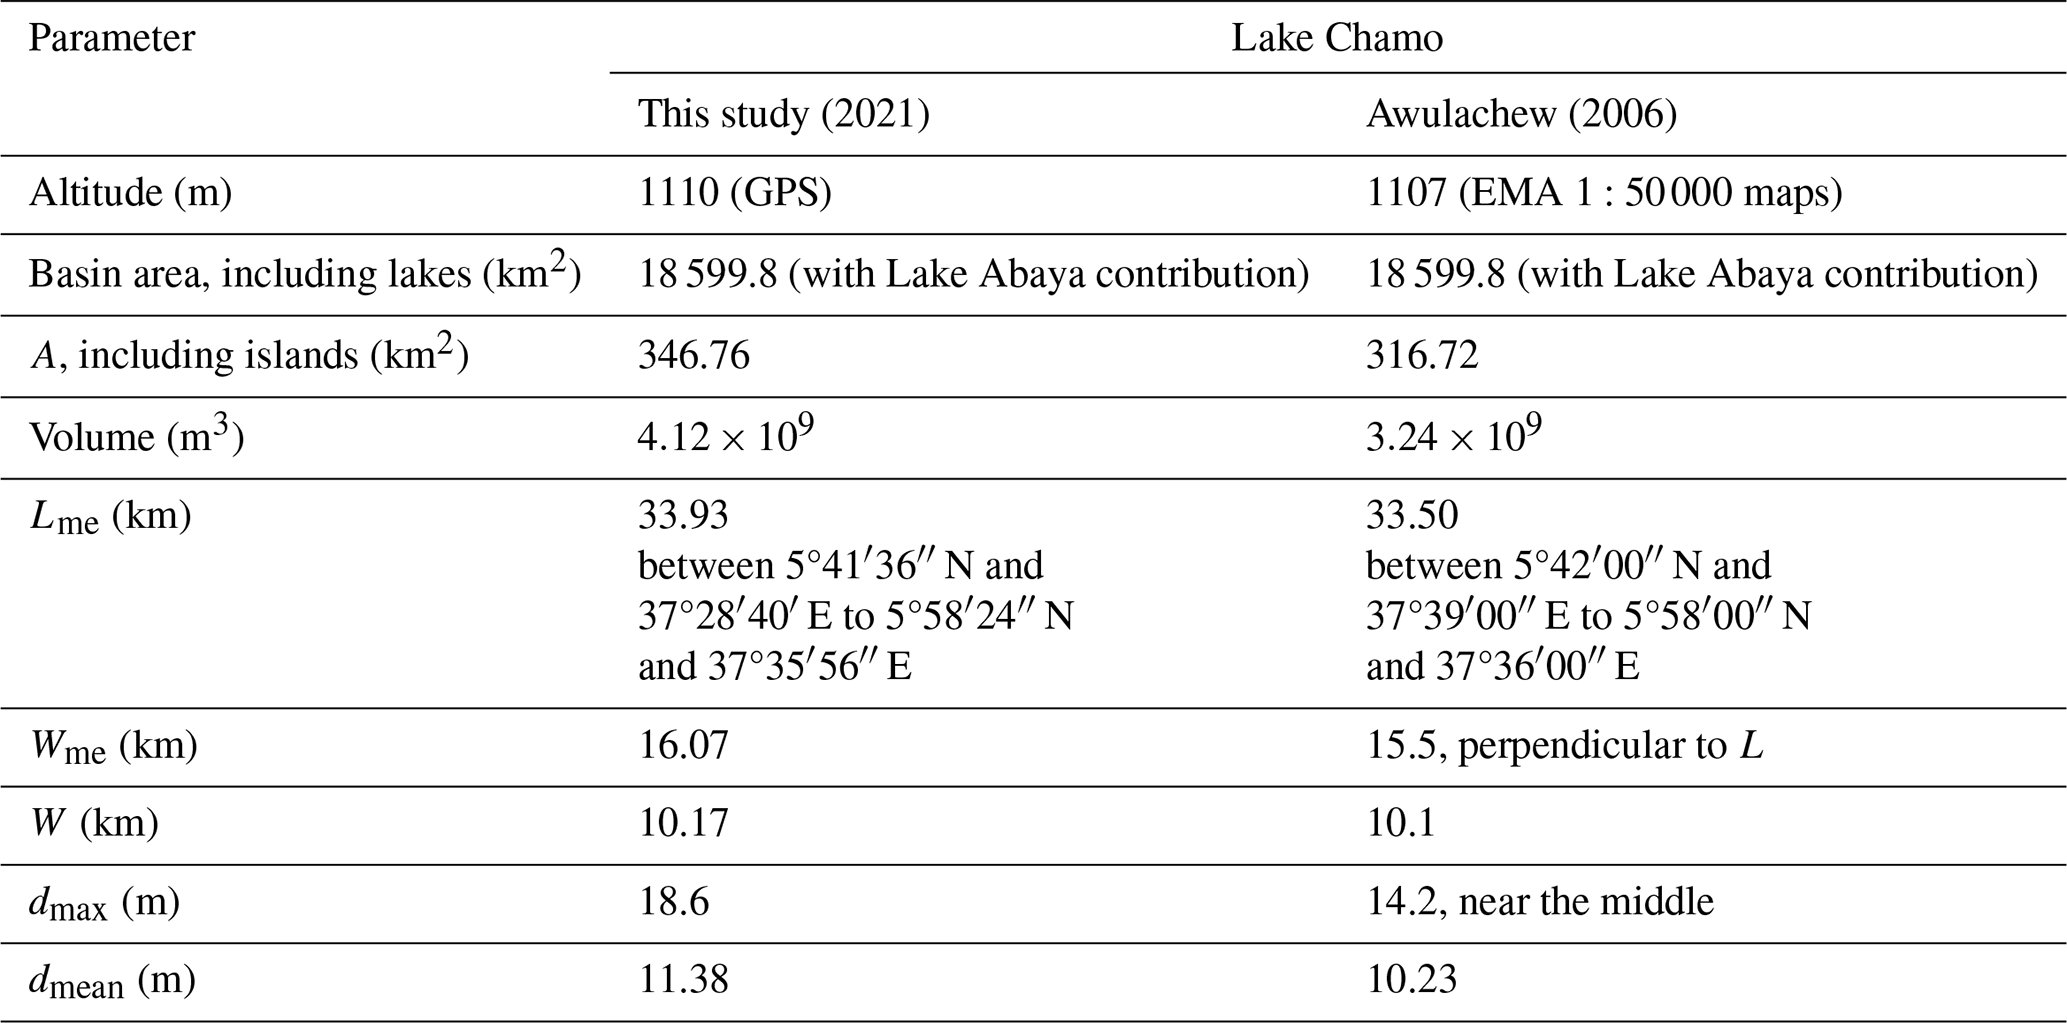
Morphological parameters used to characterize the morphometry of Lake Chamo, including area (A), volume (V), maximum effective length (Lme), maximum width (Wme), mean width (W), maximum depth (dmax), and mean depth (dmean), are summarized in Table 7. The values are presented with respect to the reference datum discussed in the methodology. The result is also compared with the bathymetry analysis of Awulachew (2006) conducted in 1998. The maximum depth increased by 4.4 m in the middle of the lake, the sediment thickness increased by about 0.6 m, the area increased by 30 km2, and the volume increased by 7.8×10⁸ m3 within 2 decades (Fig. 8).
The water depth distribution obtained using the Kriging interpolation method in Surfer 20 is shown in Fig. 9. A grid size of 110 m × 450 m (bathymetric data) was used to interpolate the depth distribution of the lake. The resulting depth estimates were plotted on a contour map to visualize the underwater topography of the lake, and we observed that the central region of the lake had the deepest parts.
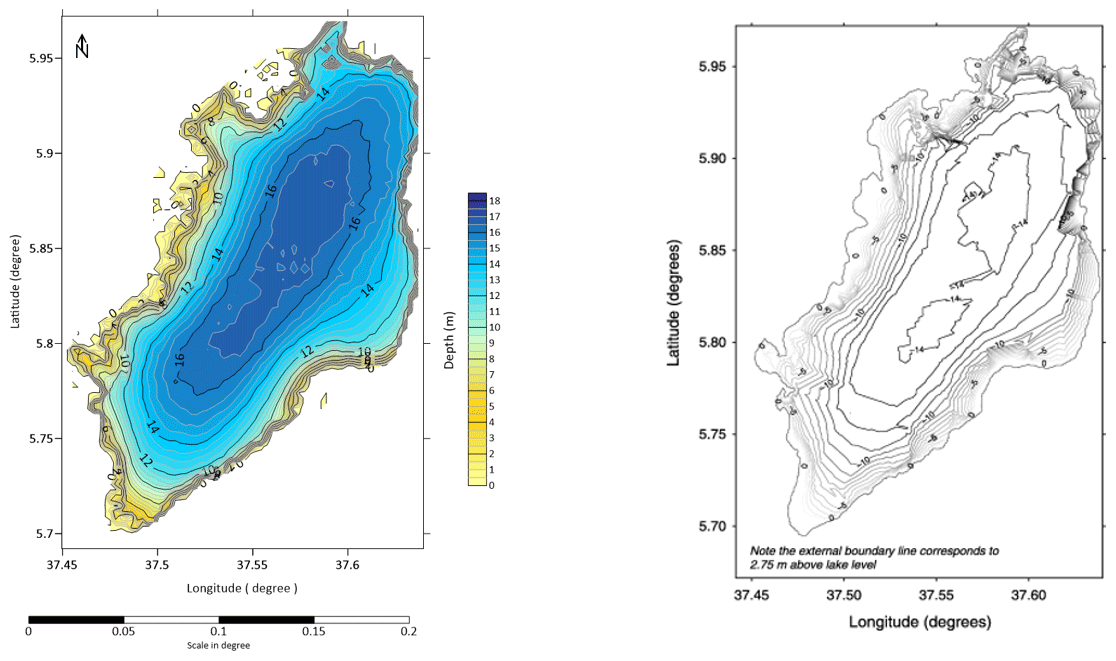
Figure 11Bathymetric maps of Lake Chamo: (a) bathymetry of this study (2021) and (b) bathymetry of Awulachew (2006).
3.3.2 Water level and storage change analysis
Figures 11, 12 and 13 illustrate the changes in the spatio-temporal patterns of Lake Chamo depth, area, and storage over a span of 20 years (1998–2021), as indicated by the depth–area and storage analysis. Specifically, the lake has experienced an expansion, gaining an area of 30 km2 (9.5 %), and its volume has increased by 7.8×10⁸ m3 (27.2 %) over the same period. The maximum depth increased by 4.4 m (31 %), and the lake bed level increased by 0.6 m (4.5 %). Possible factors that could contribute to such changes in lake size and volume are increased runoff and sedimentation from rivers or streams that flow into the lake due to land use change and/or deforestation. Another reason may be changes in the underlying geology of the area, such as changes in the flow of underground water and springs, that can contribute to changes in a lake's size and volume. These changes in size and volume could have significant ecological and environmental impacts on the lake and its surrounding area.
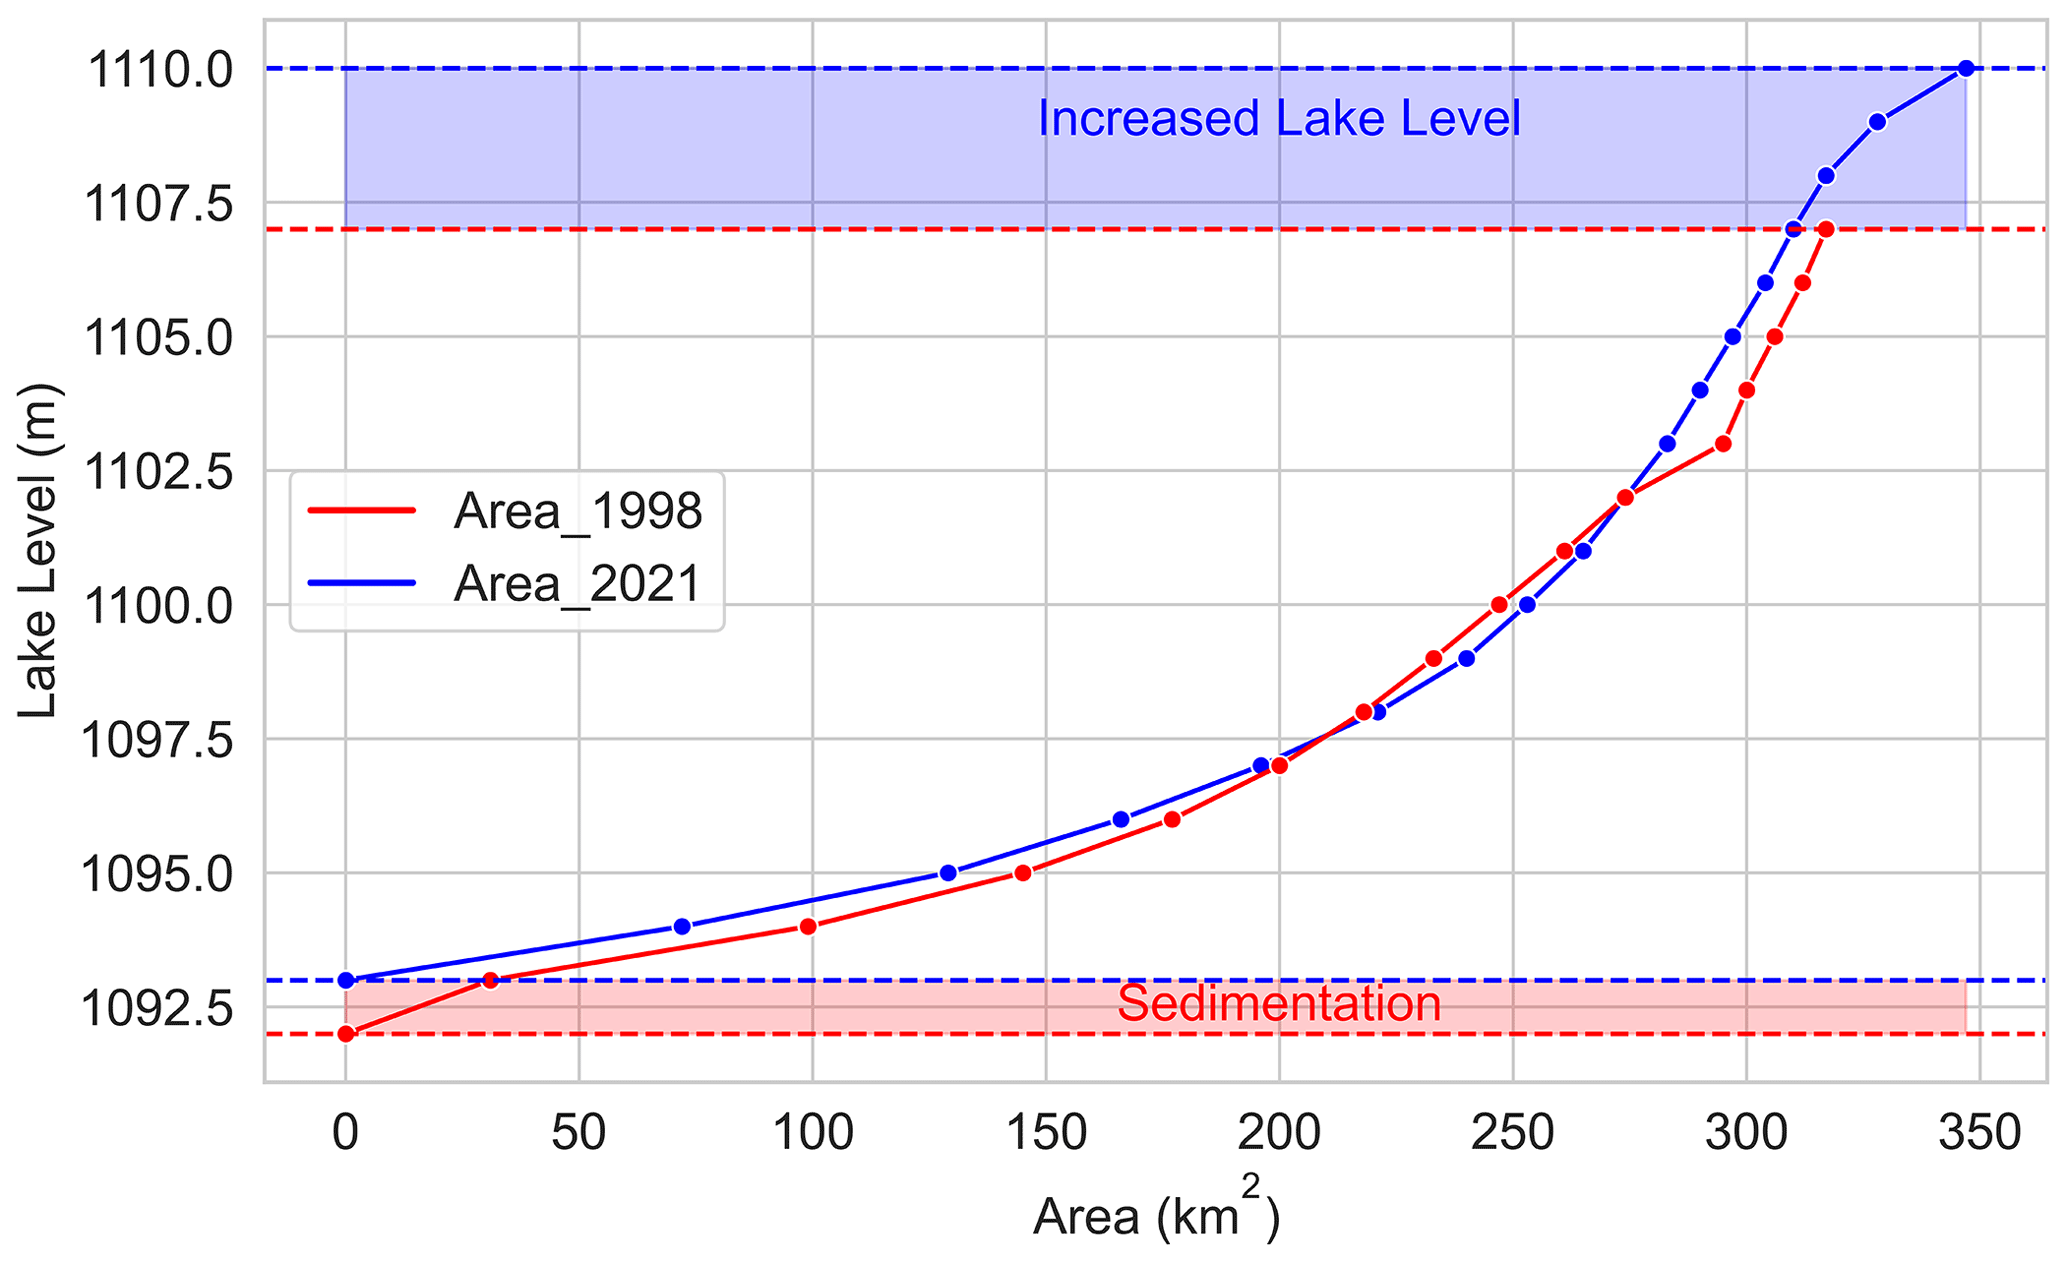
Figure 12Area–depth change analysis: blue color for the 2021 study and red color for the 1998 study (Awulachew, 2006).
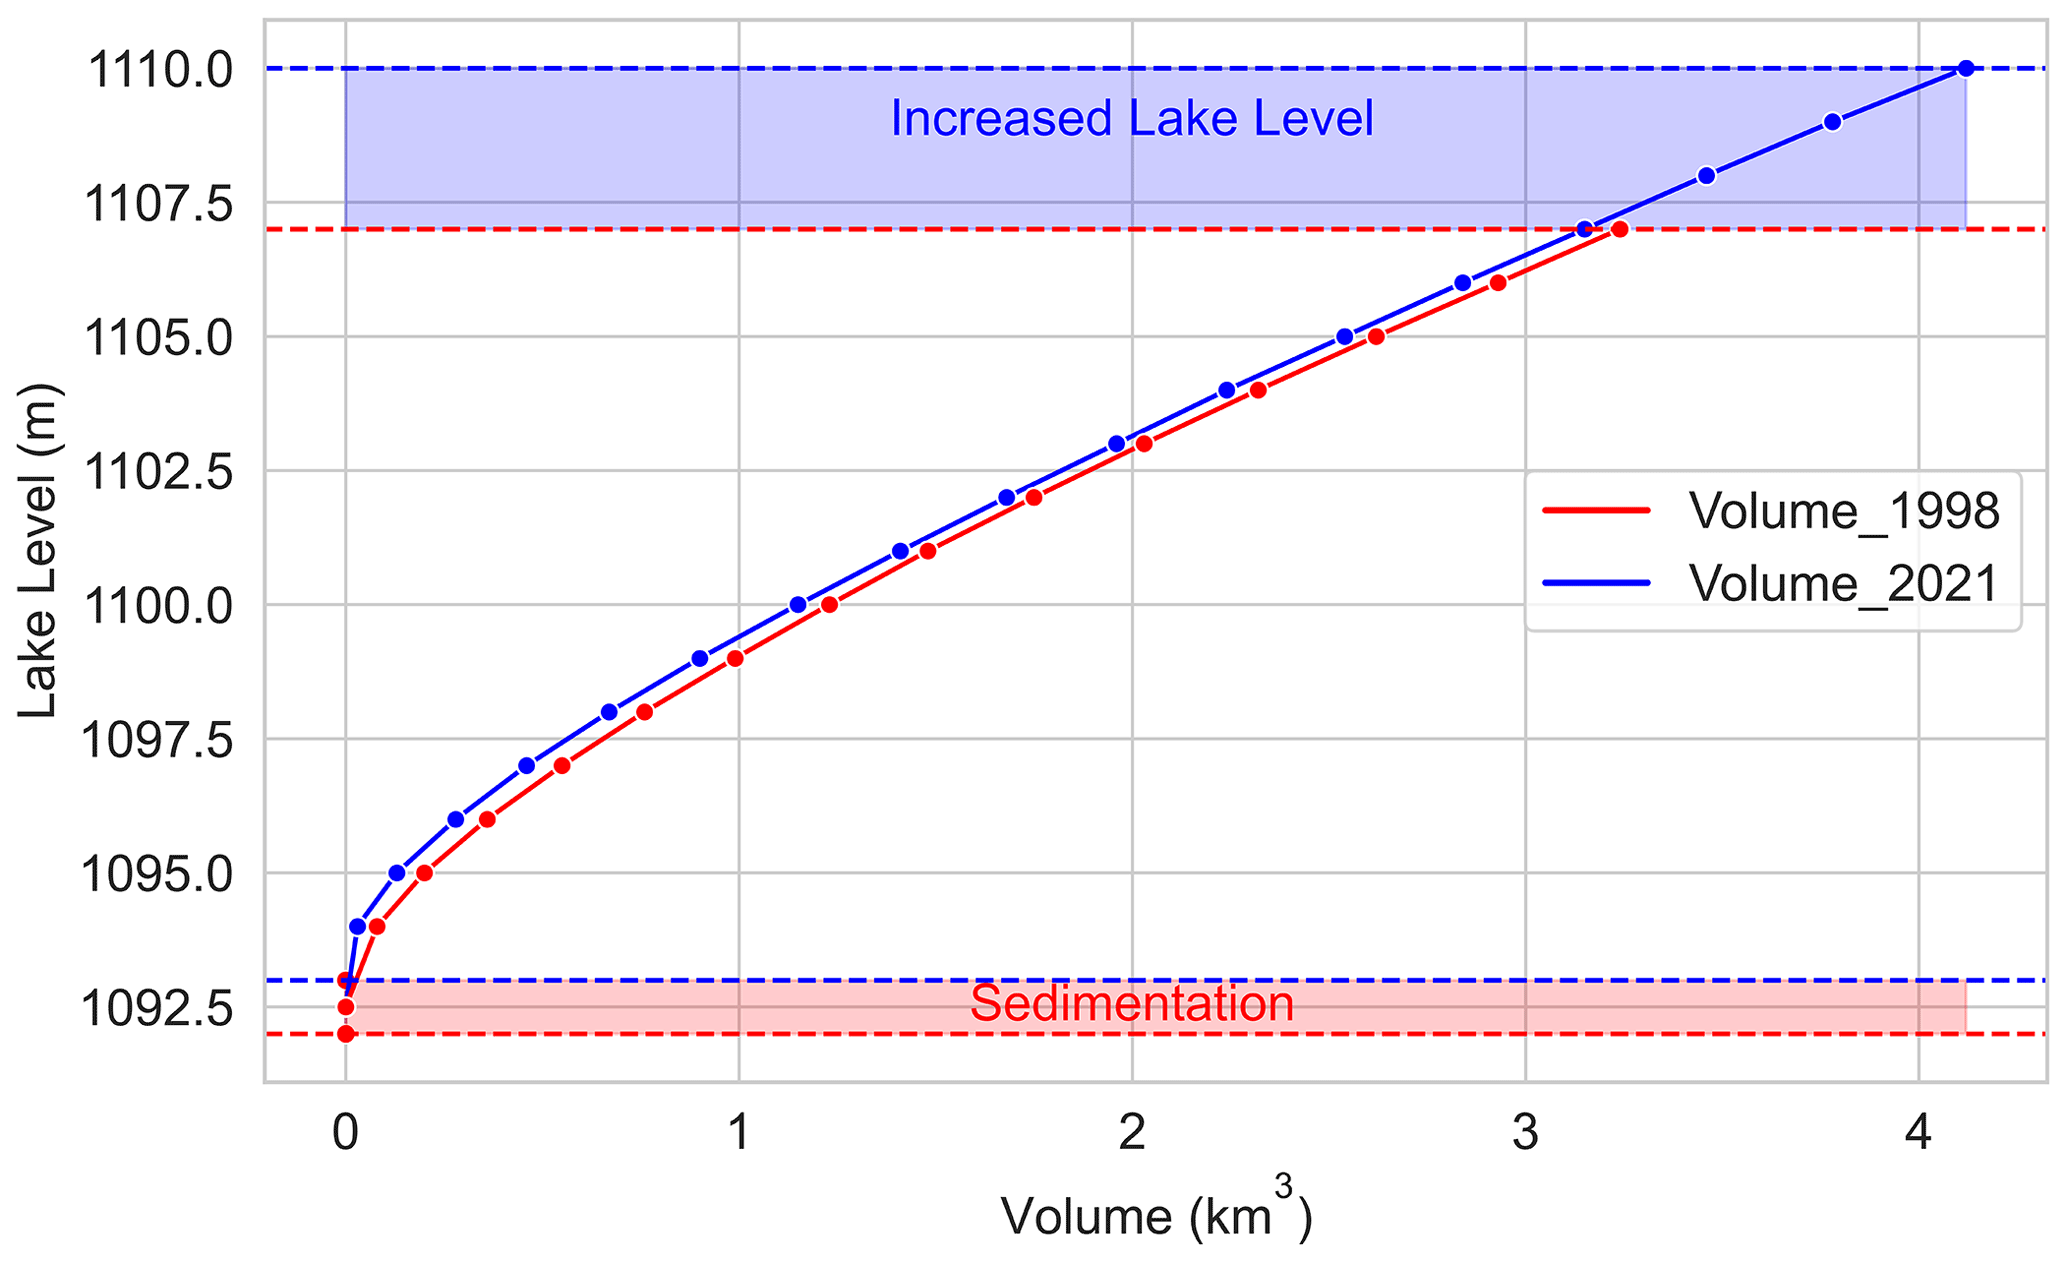
Figure 13Volume–depth change analysis: blue color for the 2021 study and red color for the 1998 study (Awulachew, 2006).
In the context of the regionalization of model parameters, our hydrological model exhibited a performance level that aligns closely with the findings documented in the literature (Seibert, 1999; Beldring, 2002; Merz and Blöschl, 2004). Based on the evaluation using the objective functions NSE, KGE, PBIAS, and RSR, the pooled-calibration technique showed a good performance. It exhibited a remarkable ability to accurately represent observed hydrological behavior, particularly for the closest pseudo watersheds (Gidabo, Upper Gelana, Meki, Katar, and Bilate). This phenomenon of varying performance across spatially related watersheds has also been noted by Merz and Blöschl (2004), who attributed it to the interplay of spatial hydrologic variability and poor data quality. Seibert (1999) observed a decline in NSE runoff efficiency from 0.81 to 0.79 when transitioning from calibrated to regionalized parameters across 11 catchments and a decrease to 0.67 for a separate set of 7 catchments. Beldring (2002) also found an NSE of 0.68 for 141 gauged catchments, and 43 catchments were treated as ungauged, though approximately 20 % of the latter group exhibited efficiencies below 0.3. Compared to this, the maximum decline in model performance due to regionalization in our study is observed in the Bilate watershed, with a decrease in the NSE from 0.68 (cal) or 0.63 (val) in the donor watershed (Table 4) to 0.53 in the pseudo watershed (Table 5). In this case, the donor watershed (Chamo) is dominated by semi-natural vegetation, whereas the pseudo watershed (Bilate) has a larger share of agricultural land. It is evident that, while regionalization allows for broader model applicability, the accuracy of predictions can vary significantly depending on contextual factors and the specific characteristics of the studied watersheds.
The study revealed significant changes in lake levels and inflows over the past 2 decades in the Rift Valley Lakes. Notably, Lake Chamo experienced substantial increases in area, depth, and volume, while Lake Abijata witnessed an extraordinary decrease in area and depth. The result revealed significant shifts in the hydrological system of Lake Abijata and Lake Abaya after the year 2003. Substantial decreases in lake levels were observed in both lakes from 2003 to 2009. The lake levels recovered after 2009. In the post-impact period (2010–2015), the lake level of Lake Abaya showed an increase compared to both the pre-impact (1987–2003) and impact period (2003–2009). On the contrary, during the same period, the lake level of Lake Abijata showed a noticeable decreasing trend compared to the pre-impact period. According to Ayalew et al. (2022), the significant decline in water level during the impact period (2003–2009) was primarily attributed to prolonged drought affecting both lakes. A study by Street and Grove (1979) also investigated the fact that many of the Rift Lakes' water level fluctuations were associated with climate conditions rather than anthropogenic factors. However, recently, the changing water level has also been associated with anthropogenic activities (Alemayehu et al., 2006).
The range of variability approach (RVA) analysis also revealed that the river's flow regime has deviated significantly from its natural or historical patterns. The high-RVA and middle-RVA values are negative in Lake Abijata, which indicates that the river's flow conditions are lower than what would be expected based on historical data. The negative value of the high and middle levels and the positive value of the low level of Lake Abijata coincides with the time of high water abstraction for soda production and water abstraction for irrigation from the upstream Lake Ziway. In the wet season, the time between May to September is a refilling period for the lake as a result of large inflows from the Katar and Meki rivers. During the dry season (November to June), Ziway shows a net loss of storage due to high abstraction of water for irrigation. This high abstraction of water leads to shifts in the flow regime, and a positive value of low RVA is observed. In Lake Abaya, the hydrological system responds reversely. The high-RVA and middle-RVA values are positive, and the low-RVA value is negative. This indicates that the peak flow increased in the impact period during the wet season. Our previous work, Ayalew et al. (2023), showed increasing surface runoff and decreasing infiltration and evaporation after 2000, associated with deforestation and agricultural expansion.
Lake Abijata is a terminal lake; it lacks any surface or groundwater outflow, making its water level and volume subject to changes in hydrological budget components such as rainfall, river inflow, and evaporation. However, recent development schemes in soda ash extraction and irrigation have also contributed to the drastic reduction in the lake level (Alemayehu et al., 2006). The main inflow is from the discharge of the Horakelo and Bulbula rivers, which are the outflows of lakes Langano and Ziway, respectively, and from direct rainfall. The total river inflow decreased by 12.5 %, which is associated with water abstraction for irrigation. As it is a terminal lake, the means of water loss from the lake are evaporation and abstraction. Therefore, the main reason for hydrological-regime change was water abstraction from feeding rivers for irrigation and water abstraction for industrial purposes from the lake followed by evaporation. Alemayehu et al. (2006) also state that abstraction of Lake Ziway for irrigation also has an influence on the level of Lake Abijata. Conversely, Lake Chamo experienced an increase in its water level during the post-impact period. The lake level increased by 4.4 m, and the lake bottom elevation increased by 0.6 m. This significant water level rise is mainly due to high surface runoff and sediment transportation. The total surface inflow increased by 80.5 %, which is influenced by changes in land use and land cover, particularly deforestation and agricultural expansion, which resulted in higher runoff (Ayalew et al., 2023) and enhanced sediment transportation. In contrast to many eastern African terminal lakes, Lake Chamo has shown significant water level rise. These changes can be explained by changes in land use and land cover (LULC) and climate change (Ayalew et al., 2023). The influence of human activities exerted a more significant impact compared to climate change. The hydrological regime of the lakes is affected by human-induced factors (mainly abstraction, urbanization, and deforestation) associated with rapid population growth. In the northern part of the study area, high water abstraction for irrigation and industry was the main driving factor for the changes in hydrology. However, in the southern part of the study area, high runoff and sedimentation associated with high deforestation are the main driving factors for the hydrological alterations (Ayalew et al., 2023). Even though further investigation is required, the changing hydrological system in the Rift Valley might also be linked to the geological setting. The Rift Valley is formed due to the divergent movement of tectonic plates, leading to the creation of a rift or crack in the Earth's crust. This tectonic activity results in the formation of grabens and horsts, additionally influencing the hydrological characteristics of the region (Scoon et al., 2018).
The Rift Valley Lakes in Ethiopia have experienced changes in their hydrological regime due to anthropogenic activities and climate change. Integrating a physically based hydrologic model, break point analysis, indicators of hydrologic alteration (IHA), and a bathymetry survey is a better approach to understand a dynamic and complex hydrological system and the potential diving factors. IHA were derived from lake level data that clearly showed the alterations of the hydrological regime. The main water balance components were simulated using a semi-distributed Soil and Water Assessment Tool Plus (SWAT+) model. Multi-site regionalization techniques represent the hydrological behavior of multiple locations and show that the model can be used to make predictions for other locations. The SWAT+ model performed well for daily streamflow during the calibration and validation periods. The pooled-calibration approach showed a satisfactory performance in capturing observed hydrological behavior in both donor and pseudo watersheds. The applied calibration technique was suitable for regionalization of model parameters, as the rather small decrease in model performance in the pseudo-ungauged watersheds showed.
The findings reveal notable changes over the past 2 decades. Lake Chamo experienced an increase in area of 11.86 km2, an increase in depth of 4.4 m, and an increase in volume of 7.8×10⁸ m3. In contrast, Lake Abijata witnessed an extraordinary 68% decrease in area and a depth decrease of −1.6 m. Mean annual rainfall decreased by 6.5 % in Lake Abijata and by 2.7 % in Lake Chamo during the impacted period. Actual evapotranspiration decreased by 2.9 % in Lake Abijata but increased by up to 0.5 % in Lake Chamo. Surface inflow to Lake Abijata decreased by 12.5 %, while Lake Chamo experienced an 80.5 % increase in surface inflow. Sediment depth in Lake Chamo also increased by 0.6 m.
The results of this study highlight the changing hydrological regime in Lake Chamo, emphasizing the role of anthropogenic influences in increasing surface runoff and sediment intrusion. Conversely, the hydrological dynamics of Lake Abijata are primarily affected by water abstraction from the rivers and lakes that serve as its water sources, driven by industrial and irrigation demands. By examining these factors, this research offers valuable insights into the evolving hydrological systems of the Rift Valley Lakes in Ethiopia, contributing to a better understanding of the driving forces behind these changes.
The hydrological regime of Lake Chamo has experienced changes characterized by increased area, depth, and volume, primarily influenced by heightened surface runoff and sediment intrusion.
Lake Abijata has undergone significant changes in its hydrological regime, marked by a substantial decrease in area and depth, resulting from water abstraction for industrial and irrigation purposes from feeding rivers and lakes.
The findings emphasize the importance of understanding the driving factors behind hydrological changes in Rift Valley Lakes, particularly the influence of anthropogenic activities and climatic variations. Lake level changes, whether declining or increasing, have resulted from a combination of natural and human-induced factors. These changes can have significant impacts on ecosystems, human communities, and water availability. Mitigating the impacts of these changes requires sustainable water management practices, climate change adaptation strategies, and a holistic understanding of the interconnection of ecosystems and human activities.
Further research and monitoring efforts are necessary to deepen our understanding of the hydrological processes and to identify effective management strategies to ensure the sustainable use and conservation of the Rift Valley Lakes in Ethiopia.
SWAT+ is a freely available open-source hydrologic model. The source code is available from https://swatplus.gitbook.io/docs/source-code (SWAT+, 2024).
The meteorological data, belonging to the Ethiopian National Meteorological Agency, are proprietary and were acquired from the main office located in Bole, Addis Ababa, Ethiopia. These data were accessed on 8 September 2021. The hydrological data are also proprietary and have been provided by the Ministry of Water, Irrigation and Electricity, Haile G/Silassie Avenue, Addis Ababa, Ethiopia. These data were accessed on 18 August 2020.
ADA, PDW and DS developed the study design. ADA performed the model simulations with essential support of PDW. All the authors substantially contributed to the interpretation of the results. ADA wrote the initial draft of the manuscript, and all the co-authors discussed the results and revised the work carefully.
The contact author has declared that none of the authors has any competing interests.
Publisher's note: Copernicus Publications remains neutral with regard to jurisdictional claims made in the text, published maps, institutional affiliations, or any other geographical representation in this paper. While Copernicus Publications makes every effort to include appropriate place names, the final responsibility lies with the authors.
This article is part of the special issue “Methodological innovations for the analysis and management of compound risk and multi-risk, including climate-related and geophysical hazards (NHESS/ESD/ESSD/GC/HESS inter-journal SI)”. It is not associated with a conference.
The German Academic Exchange Service (DAAD) and the Ethiopian Ministry of Education supported this research. Our grateful acknowledgement is also given to the Ethiopian Ministry of Water Resources for providing hydrological data, the Ethiopian Meteorology Agency for providing meteorological data, and Arba Minch University-Vlaamse Inter-universitairev Raad-Institutional University Cooperation (AMU-VLIR-IUC) program for supporting the bathymetry survey conducted on Lake Chamo. We acknowledge financial support by Land Schleswig-Holstein within the funding programme Open Access Publikationsfonds.
This research has been supported by the German Academic Exchange Service (grant no. 57472170 (EECBP Home Grown PhD Scholarship Programme, 2019)).
This paper was edited by Marleen de Ruiter and reviewed by two anonymous referees.
Alemayehu, T., Ayenew, T., and Kebede, S.: Hydrogeochemical and lake level changes in the Ethiopian Rift, J. Hydrol., 316, 290–300, https://doi.org/10.1016/j.jhydrol.2005.04.024, 2006.
Arnold, J. G., Srinivasan, R., Muttiah, R. S., and Williams, J. R.: Large area hydrologic modeling and assessment part I: model development 1, J. Am. Water Resour. Assoc., 34, 73–89, https://doi.org/10.1111/j.1752-1688.1998.tb05961.x, 1998.
Awulachew, S. B.: Investigation of physical and bathymetric characteristics of Lakes Abaya and Chamo, Ethiopia, and their management implications, Lakes Reserv.: Res. Manage., 11, 133–140, https://doi.org/10.1111/j.1440-1770.2006.00300.x, 2006.
Ayalew, L., Yamagishi, H., and Reik, G.: Ground cracks in Ethiopian Rift Valley: facts and uncertainties, Eng. Geol., 75, 309–324, https://doi.org/10.1016/j.enggeo.2004.06.018, 2004.
Ayalew, A. D., Wagner, P. D., Sahlu, D., and Fohrer, N.: Land use change and climate dynamics in the Rift Valley Lake Basin, Ethiopia, Environ. Monit. Assess., 194, 791, https://doi.org/10.1007/s10661-022-10393-1, 2022.
Ayalew, A. D., Wagner, P. D., Tigabu, T. B., Sahlu, D., and Fohrer, N.: Hydrological responses to land use and land cover change and climate dynamics in the Rift Valley Lakes Basin, Ethiopia, J. Water Clim. Change, 14, 2788–2807, https://doi.org/10.2166/wcc.2023.138, 2023.
Ayenew, T.: Recent changes in the level of Lake Abiyata, central main Ethiopian Rift, Hydrolog. Sci. J., 47, 493–503, https://doi.org/10.1080/02626660209492949, 2002.
Ayenew, T.: Environmental implications of changes in the levels of lakes in the Ethiopian Rift since 1970, Reg. Environm. Change, 4, 192–204, https://doi.org/10.1007/s10113-004-0083-x, 2004.
Beldring, S.: Multi-criteria validation of a precipitation–runoff model, J. Hydrol., 257, 189–211, https://doi.org/10.1016/S0022-1694(01)00541-8, 2002.
Bieger, K., Arnold, J. G., Rathjens, H., White, M. J., Bosch, D. D., Allen, P. M., Volk, M., and Srinivasan, R.: Introduction to SWAT+, a completely restructured version of the soil and water assessment tool, J. Am. Water Resour. Assoc., 53, 115–130, https://doi.org/10.1111/1752-1688.12482, 2017.
Billi, P. and Caparrini, F.: Estimating land cover effects on evapotranspiration with remote sensing: a case study in Ethiopian Rift Valley, Hydrolog. Sci. J., 51, 655–670, https://doi.org/10.1623/hysj.51.4.655, 2006.
Cowx, I. G. and Ogutu-Owhayo, R.: Towards sustainable fisheries and aquaculture management in the African Great Lakes, Fish. Manage. Ecol., 26, 397–405, https://doi.org/10.1111/fme.12391, 2019.
de Sousa Lima, J. R., Antonino, A. C. D., de Souza, E. S., Hammecker, C., Montenegro, S. M. G. L., and de Oliveira Lira, C. A. B.: Calibration of Hargreaves-Samani equation for estimating reference evapotranspiration in sub-humid region of Brazil, J. Water Resour. Protect., 5, 1–5, https://doi.org/10.4236/jwarp.2013.512A001, 2013.
Dessie, G. andKleman, J.: Pattern and magnitude of deforestation in the South Central Rift Valley Region of Ethiopia, Mount. Res. Dev., 27, 162–168, https://doi.org/10.1659/mrd.0730, 2007.
Flörke, M., Schneider, C., and McDonald, R. I.: Water competition between cities and agriculture driven by climate change and urban growth, Nat. Sustainabil., 1, 51–58, https://doi.org/10.1038/s41893-017-0006-8, 2018.
Garedew, E., Sandewall, M., Söderberg, U., and Campbell, B. M.: Land-use and land-cover dynamics in the central rift valley of Ethiopia, Environ. Manage., 44, 683–694, https://doi.org/10.1016/j.apgeog.2015.10.002, 2009.
Getnet, M., Hengsdijk, H., and van Ittersum, M.: Disentangling the impacts of climate change, land use change and irrigation on the Central Rift Valley water system of Ethiopia, Agr. Water Manage., 137, 104–115, https://doi.org/10.1016/j.agwat.2014.02.014, 2014.
Gownaris, N. J., Pikitch, E. K., Ojwang, W. O., Michener, R., and Kaufman, L.: Predicting species' vulnerability in a massively perturbed system: The fishes of Lake Turkana, Kenya, PLoS One, 10, e0127027, https://doi.org/10.1371/journal.pone.0127027, 2015.
Gunawardana, S. K., Shrestha, S., Mohanasundaram, S., Salin, K. R., and Piman, T.: Multiple drivers of hydrological alteration in the transboundary Srepok River Basin of the Lower Mekong Region, J. Environ. Manage., 278, 111524, https://doi.org/10.1016/j.jenvman.2020.111524, 2021.
Gupta, H. V., Kling, H., Yilmaz, K. K., and Martinez, G. F.: Decomposition of the mean squared error and NSE performance criteria: Implications for improving hydrological modelling, J. Hydrol., 377, 80–91, https://doi.org/10.1016/j.jhydrol.2009.08.003, 2009.
Hargreaves, G. H. and Samani, Z. A.: Reference crop evapotranspiration from temperature, Appl. Eng. Agricult., 1, 96–99, https://doi.org/10.13031/2013.26773, 1985.
Hundecha, Y., Arheimer, B., Donnelly, C., and Pechlivanidis, I.: A regional parameter estimation scheme for a pan-European multi-basin model, J. Hydrol.: Reg. Stud., 6, 90—11, https://doi.org/10.1016/j.ejrh.2016.04.002, 2016.
Kebede, E., Mariam, Z. G., and Ahlgren, I.: The Ethiopian Rift Valley lakes: chemical characteristics of a salinity-alkalinity series, Hydrobiologia, 288, 1–12, https://doi.org/10.1007/BF00006801, 1994.
Kolding, J. and van Zwieten, P. A.: Relative lake level fluctuations and their influence on productivity and resilience in tropical lakes and reservoirs, Fish. Res., 115, 99–109, https://doi.org/10.1016/j.fishres.2011.11.008, 2012.
Legesse, D. and Ayenew, T.: Effect of improper water and land resource utilization on the central Main Ethiopian Rift lakes, Quatern. Int., 148, 8–18, https://doi.org/10.1016/j.quaint.2005.11.003, 2006.
Lemma, B. and Desta, H.: Review of the natural conditions and anthropogenic threats to the Ethiopian Rift Valley rivers and lakes, Lakes Reserv.: Res. Manage., 21, 133–151, https://doi.org/10.1111/lre.12126, 2016.
Le Turdu, C., Tiercelin, J.-J., Gibert, E., Travi, Y., Lezzar, K.-E., Richert, J.-P., Massault, M., Gasse, F., Bonnefille, R., and Decobert, M.: The Ziway–Shala lake basin system, Main Ethiopian Rift: influence of volcanism, tectonics, and climatic forcing on basin formation and sedimentation, Palaeogeogr. Palaeoclim. Palaeoecol., 150, 135–177, https://doi.org/10.1016/S0031-0182(98)00220-X, 1999.
Mahmoodi, N., Kiesel, J., Wagner, P. D., and Fohrer, N.: Spatially distributed impacts of climate change and groundwater demand on the water resources in a wadi system, Hydrol. Earth Syst. Sci., 25, 5065–5081, https://doi.org/10.5194/hess-25-5065-2021, 2021a.
Mahmoodi, N., Wagner, P. D., Kiesel, J., and Fohrer, N.: Modeling the impact of climate change on streamflow and major hydrological components of an Iranian Wadi system, J. Water Clim. Change, 12, 1598–1613, https://doi.org/10.2166/wcc.2020.098, 2021b.
McGinn, A. J., Wagner, P. D., Htike, H., Kyu, K. K., and Fohrer, N.: Twenty years of change: Land and water resources in the Chindwin catchment, Myanmar between 1999 and 2019, Sci. Total Environ., 798, 148766, https://doi.org/10.1016/j.scitotenv.2021.148766, 2021.
Merz, R. and Blöschl, G.: Regionalisation of catchment model parameters, J. Hydrol., 287, 95–123, https://doi.org/10.1016/j.jhydrol.2003.09.028, 2004.
Meshesha, D. T., Tsunekawa, A., Tsubo, M., and Haregeweyn, N.: Dynamics and hotspots of soil erosion and management scenarios of the Central Rift Valley of Ethiopia, Int. J. Sediment Res., 27, 84–99, https://doi.org/10.1016/S1001-6279(12)60018-3, 2012.
Minale, A. S.: Water level fluctuations of Lake Tana and its implication on local communities livelihood, northwestern Ethiopia, Int. J. River Basin Manage., 18, 503–510, https://doi.org/10.1080/15715124.2019.1700512, 2020.
Moeletsi, M. E., Walker, S., and Hamandawana, H.: Comparison of the Hargreaves and Samani equation and the Thornthwaite equation for estimating dekadal evapotranspiration in the Free State Province, South Africa, Phys. Chem. Earth Pt. A/B/C, 66, 4–15, https://doi.org/10.1016/j.pce.2013.08.003, 2013.
Nash, J. E., and Sutcliffe, J. V.: River flow forecasting through conceptual models part I – A discussion of principles, J. Hydrol., 10, 282–290, https://doi.org/10.1016/0022-1694(70)90255-6, 1970.
O'Brien, G. C., Dickens, C., Hines, E., Wepener, V., Stassen, R., Quayle, L., Fouchy, K., MacKenzie, J., Graham, P. M., and Landis, W. G.: A regional-scale ecological risk framework for environmental flow evaluations, Hydrol. Earth Syst. Sci., 22, 957–975, https://doi.org/10.5194/hess-22-957-2018, 2018.
Olson, D. M. and Dinerstein, E.: The Global 200: Priority ecoregions for global conservation, JSTOR, 199–224, https://doi.org/10.2307/3298564, 2002.
Pati, A., Sen, S., and Perumal, M. J. J. H. E.: Modified channel-routing scheme for SWAT model, J. Hydrol. Eng., 23, 04018019, https://doi.org/10.1061/(ASCE)HE.1943-5584.0001657, 2018.
Pfannerstill, M., Guse, B., and Fohrer, N.: Smart low flow signature metrics for an improved overall performance evaluation of hydrological models, J. Hydrol., 510, 447–458, https://doi.org/10.1016/j.jhydrol.2013.12.044, 2014.
Pool, S., Vis, M., and Seibert, J.: Regionalization for ungauged catchments – lessons learned from a comparative large-sample study, Water Resour. Res., 57, e2021WR030437, https://doi.org/10.1029/2021WR030437, 2021.
Richter, B. D., Baumgartner, J. V., Braun, D. P., and Powell, J.: A spatial assessment of hydrologic alteration within a river network, Regulat. Rivers: Res. Manage., 14, 329–340, https://doi.org/10.1002/(SICI)1099-1646(199807/08)14:4<329::AID-RRR505>3.0.CO;2-E, 1998.
Ryan, J. A. and Ulrich, J. M.: xts: Extensible time series, R package version 0.8-2, GitHub [code], https://joshuaulrich.github.io/xts/ (last access: 22 April 2024), 2011.
Sangin, E., Mishra, S. K., and Patil, P. R.: Analogy Between SCS-CN and Muskingum Methods, Water Resour. Manage., 38, 153–171, https://doi.org/10.1007/s11269-023-03660-4, 2024.
Scoon, R. N., Scoon, R. N., and Plateaus, R.: The east African rift system, Geology of National Parks of central/southern Kenya northern Tanzania: Geotourism of the Gregory Rift Valley, active volcanism, Springer, 19–28, https://doi.org/10.1007/978-3-319-73785-0_3, 2018.
Seibert, J.: Regionalisation of parameters for a conceptual rainfall-runoff model, Agr. Forest Meteorol., 98, 279–293, https://doi.org/10.1016/S0168-1923(99)00105-7, 1999.
Shieh, C.-L., Guh, Y.-R., and Wang, S.-Q.: The application of range of variability approach to the assessment of a check dam on riverine habitat alteration, Environ. Geol., 52, 427–435, https://doi.org/10.1007/s00254-006-0470-3, 2017.
Smakhtin, V. U.: Low flow hydrology: a review, J. Hydrol., 240, 147–186, https://doi.org/10.1016/S0022-1694(00)00340-1, 2001.
Soetaert, K. and Petzoldt, T.: Inverse modelling, sensitivity and Monte Carlo analysis in R using package FME, J. Stat. Softw., 33, 1–28, https://doi.org/10.18637/jss.v033.i03, 2010.
Stamps, D. S., Calais, E., Saria, E., Hartnady, C., Nocquet, J. M., Ebinger, C. J., and Fernandes, R. M.: A kinematic model for the East African Rift, Geophys. Res. Lett., 35, L05304, https://doi.org/10.1029/2007GL032781, 2008.
Street, F. A. and Grove, A.: Global maps of lake-level fluctuations since 30,000 yr BP, Quatern. Res., 12, 83–118, https://doi.org/10.1016/0033-5894(79)90092-9, 1979.
SWAT+: SWAT+ Model Compile Help, https://swatplus.gitbook.io/docs/source-code (last access: 22 April 2024), 2024.
Tigabu, T. B., Wagner, P. D., Hörmann, G., and Fohrer, N.: Modeling the impact of agricultural crops on the spatial and seasonal variability of water balance components in the Lake Tana basin, Ethiopia, Hydrol. Res., 50, 1376–1396, https://doi.org/10.2166/nh.2019.170, 2019.
Tigabu, T. B., Wagner, P. D., Narasimhan, B., and Fohrer, N.: Pitfalls in hydrologic model calibration in a data scarce environment with a strong seasonality: experience from the Adyar catchment, India, Environ. Earth Sci., 82, 367, https://doi.org/10.1007/s12665-023-11047-2, 2023.
Tsegaw, A. T., Alfredsen, K., Skaugen, T., and Muthanna, T. M.: Predicting hourly flows at ungauged small rural catchments using a parsimonious hydrological model, J. Hydrol., 573, 855–871, https://doi.org/10.1016/j.jhydrol.2019.03.090, 2019.
USGS: 3D elevation program 1-meter resolution digital elevation model, USGS, https://doi.org/10.5066/F7K072R7, 2019.
Vieceli, N., Bortolin, T. A., Mendes, L. A., Bacarim, G., Cemin, G., and Schneider, V. E.: Morphometric evaluation of watersheds in Caxias do Sul City, Brazil, using SRTM (DEM) data and GIS, Environ. Earth Sci., 73, 5677–5685, https://doi.org/10.1007/s12665-014-3823-3, 2015.
Viglione, A., Parajka, J., Rogger, M., Salinas, J., Laaha, G., Sivapalan, M., and Blöschl, G.: Comparative assessment of predictions in ungauged basins – Part 3: Runoff signatures in Austria, Hydrol. Earth Syst. Sci., 17, 2263–2279, https://doi.org/10.5194/hess-17-2263-2013, 2013.
Vu, T. T., Kiesel, J., Guse, B., and Fohrer, N.: Analysis of the occurrence, robustness and characteristics of abrupt changes in streamflow time series under future climate change, Clim. Risk Manage., 26, 100198, https://doi.org/10.1016/j.crm.2019.100198, 2019.
Wagaw, S., Mengistou, S., and Getahun, A.: Review of anthropogenic threats and biodiversity assessment of an Ethiopian soda lake, Lake Abijata, Afr. J. Aquat. Sci., 44, 103–111, https://doi.org/10.2989/16085914.2019.1596065, 2019.
Wagner, P. D., Fiener, P., Wilken, F., Kumar, S., and Schneider, K.: Comparison and evaluation of spatial interpolation schemes for daily rainfall in data scarce regions, J. Hydrol., 464, 388–400, https://doi.org/10.1016/j.jhydrol.2012.07.026, 2012.
Wagner, P. D., Bieger, K., Arnold, J. G., and Fohrer, N. J. E. M.: Representation of hydrological processes in a rural lowland catchment in Northern Germany using SWAT and SWAT+, Hydrol. Process., 36, e14589, https://doi.org/10.1002/hyp.14589, 2022.
Wagner, P. D., Kumar, S., and Fohrer, N.: Integrated modeling of global change impacts on land and water resources, Sci. Total Environ., 892, 164673, https://doi.org/10.1016/j.scitotenv.2023.164673, 2023.
White, G. F., Bradley, D. J., and White, A. U.: Drawers of water: domestic water use in East Africa, Bull. World Health Organiz., 80, 63–73, https://doi.org/10.2307/213928, 2002.
Wi, S., Yang, Y., Steinschneider, S., Khalil, A., and Brown, C.: Calibration approaches for distributed hydrologic models using high performance computing: implication for streamflow projections under climate change, Hydrol. Earth Syst. Sci. Discuss., 11, 10273–10317, https://doi.org/10.5194/hessd-11-10273-2014, 2014.
Zambrano-Bigiarini, M.: hydroGOF: Goodness-of-Fit Functions for Comparison of Simulated and Observed Hydrological Time Series, 2017, R package version 0.3-10, Zenodo [code], https://doi.org/10.5281/zenodo.839854, 2018.
Zeileis, A. and Grothendieck, G.: zoo: S3 infrastructure for regular and irregular time series, arXiv [preprint], math/0505527, https://doi.org/10.48550/arXiv.math/0505527, 2005.
Zhang, H., Wang, B., Lan, T., Shi, J., and Lu, S.: Change-point detection and variation assessment of the hydrologic regime of the Wenyu River, Toxicol. Environ. Chem., 98, 358–375, https://doi.org/10.1080/02772248.2015.1123480, 2016.
Zinabu, G.-M. and Elias, D.: Water resources and fisheries management in the Ethiopian rift valley lakes, Sinet, 12, 95–109, https://doi.org/10.1080/07900627.2013.843410, 1989.