the Creative Commons Attribution 4.0 License.
the Creative Commons Attribution 4.0 License.
 | 15 Apr 2024
Stream water sourcing from high-elevation snowpack inferred from stable isotopes of water: a novel application of d-excess values
Rosemary W. H. Carroll
David Marchetti
Carleton Bern
Harsh Beria
Wendy Brown
Alexander Newman
Curtis Beutler
Kenneth H. Williams
About 80 % of the precipitation at the Colorado River's headwaters is snow, and the resulting snowmelt-driven hydrograph is a crucial water source for about 40 million people. Snowmelt from alpine and subalpine snowpack contributes substantially to groundwater recharge and river flow. However, the dynamics of snowmelt progression are not well understood because observations of the high-elevation snowpack are difficult due to challenging access in complex mountainous terrain as well as the cost and labor intensity of currently available methods. We present a novel approach to infer the processes and dynamics of high-elevation snowmelt contributions predicated upon stable hydrogen and oxygen isotope ratios observed in streamflow. We show that deuterium-excess (d-excess) values of stream water could serve as a comparatively cost-effective proxy for a catchment-integrated signal of high-elevation snowmelt contributions to catchment runoff.
We sampled stable hydrogen and oxygen isotope ratios of the precipitation, snowpack, and stream water in the East River, a headwater catchment of the Colorado River, and the stream water of larger catchments at sites on the Gunnison River and Colorado River.
The d-excess of snowpack increased with elevation; the upper subalpine and alpine snowpack (> 3200 m) had substantially higher d-excess compared to lower elevations (< 3200 m) in the study area. The d-excess values of stream water reflected this because d-excess values increased as the higher-elevation snowpack contributed more to stream water generation later in the snowmelt/runoff season. End-member mixing analyses based on the d-excess data showed that the share of high-elevation snowmelt contributions within the snowmelt hydrograph was on average 44 % and generally increased during melt period progression, up to 70 %. The observed pattern was consistent during 6 years for the East River, and a similar relation was found for the larger catchments on the Gunnison and Colorado rivers. High-elevation snowpack contributions were found to be higher for years with lower snowpack and warmer spring temperatures. Thus, we conclude that the d-excess of stream water is a viable proxy to observe changes in high-elevation snowmelt contributions in catchments at various scales. Inter-catchment comparisons and temporal trends of the d-excess of stream water could therefore serve as a catchment-integrated measure to monitor if mountain systems rely on high-elevation water inputs more during snow drought compared to years of average snowpack depths.
- Article
(5993 KB) - Full-text XML
-
Supplement
(1600 KB) - BibTeX
- EndNote


The snowpack in mountainous regions provides a crucial water source for the ecosystems and human activities downstream (Immerzeel et al., 2020). In the alpine and subalpine headwaters of semi-arid regions where the summer precipitation contribution to streamflow is usually relatively low, as in the southwestern United States, snowmelt sustains streamflow during much of the growing season when water demands are higher. The Colorado River plays a special role in the hydrology of the southwestern United States because its headwaters in the Rocky Mountains support the water supply for about 40 million people, agriculture, industry, and power generation (Bureau of Reclamation, 2012). The snowmelt from high-elevation upper subalpine and alpine regions of the mountainous headwaters of the Colorado River has been shown to be particularly important for groundwater recharge and sustaining river flow (Carroll et al., 2019). However, observed (Faybishenko et al., 2022; Hoerling et al., 2019) and projected (Bennett and Talsma, 2021) increases in air temperatures at the headwaters of the Colorado River can lead to a decrease in the snow-to-rain ratio during the coming decades (Hammond et al., 2023). Therefore, the mountainous catchments in the Colorado River could likely transition towards low-to-no-snow conditions during the second half of this century (Siirila-Woodburn et al., 2021). In fact, a general trend towards lower snowpacks and earlier snowmelt in the western United States has already been observed (Musselman et al., 2021). However, the tools needed to observe high-elevation snowmelt processes are either missing (e.g., point observations), too coarse of a resolution (e.g., satellite), or expensive to obtain (e.g., airborne lidar (light detection and ranging) techniques and numerical models), which is why we investigate the use of a stable isotope-based method that can help assess upper subalpine and alpine snowmelt contributions to streamflow.
Snowpack assessments and snowmelt dynamics are usually monitored with point observations like the U.S. Natural Resource Conservation Service (NRCS) SNOw TELemetry (SNOTEL) network (NWCC, 2023). However, the highest elevations in the western United States are not covered by this network (max elevation 3543 m above sea level), despite this area harboring the largest snow water equivalent (SWE) and most surface water input volume per square meter (Hammond et al., 2023). Therefore, although the measured snowpack at SNOTEL sites will indicate melt-out, substantial snow cover remains in the alpine regions past the SNOTEL-indicated melt-out dates (Dozier et al., 2016). To obtain a spatial representation of the SWE from the SNOTEL point measurements, regression analyses with physiographic variables (e.g., elevation, slope, and aspect) are commonly used (Fassnacht et al., 2003). Heterogeneity of snowfall accumulation and redistribution of snow (Freudiger et al., 2017) in complex mountainous terrain makes such interpolation and extrapolation efforts difficult (Dozier et al., 2016). Adding information about the previous year's snow cover distribution from satellite data was shown to improve the reconstruction of SWE across the complex mountainous terrain of the upper Colorado River basin (Schneider and Molotch, 2016). However, maps of snowpack distribution from an airborne snow observatory (ASO) based on airborne lidar (Painter et al., 2016) are costly and therefore may not be applicable across multiple mountainous catchments and/or during several years.
In addition to the high costs and labor intensity of the currently available methods to study high-elevation snowmelt dynamics, these approaches are generally limited to hydrometric data and do not include any tracer information. Beria et al. (2018) outlined multiple ways that stable hydrogen and oxygen isotopes of water (δ2H and δ18O) can provide valuable insights into snow hydrological processes. Because the water molecule comprises hydrogen and oxygen isotopes, δ2H and δ18O signatures are ideal tracers to track fluxes in the water cycle (Kendall and McDonnell, 1998). Stable hydrogen and oxygen isotopes of water have long been used to infer snowmelt contributions to stream water (e.g., Rodhe, 1981). However, because groundwater recharge is predominantly by snowmelt in snow-dominated semi-arid environments (Sprenger et al., 2022), the isotopic difference between snowmelt newly contributing to the stream discharge and the groundwater-dominated streamflow during baseflow makes mixing model applications unfeasible in such environments. We therefore explore the applicability of the deuterium-excess (d-excess) value as an alternative tracer. This metric is based on the relation between the hydrogen and oxygen isotope ratios of water systems, which was identified by Craig (1961a) as
and was characterized by Craig as being indicative of “waters which have not undergone excessive evapotranspiration.” Dansgaard (1964) defined the concept of d-excess as
which can be interpreted as an index of non-equilibrium in the simple condensation–evaporation of global precipitation. This formulation is useful for screening isotopic results from water samples: values of d-excess between 10 and 11 are effectively the intercept in Craig's proposed relation and indicate quasi-stable conditions at a relative humidity of ∼ 85 % (Dansgaard, 1964; Gat, 2000). Here, we test two hypotheses to examine how d-excess data from stream water samples are related to high-elevation snowmelt contributions to catchment runoff during the snowmelt periods. First, we hypothesize that d-excess values in stream water during the snowmelt hydrograph reflect the changing dominance of snowmelt contributions from lower to higher elevations through time. Second, we test if these patterns in d-excess of stream water are detectable across ranges in drainage area, thus increasing their broader applicability.
2.1 Study sites and data
Our study is situated in the headwater region of the upper Colorado River (Fig. 1) with a focus on an East River subcatchment (85 km2) as defined by the gaging and sampling station at the Pumphouse location (38.922447, −106.950828) near Mount Crested Butte, CO. The Pumphouse subcatchment has a large elevation gradient from about 2700 to 4100 m (Fig. 1) and is predominantly underlain by Paleozoic and Mesozoic sedimentary rocks, including Mancos Shale, which covers 44 % of the catchment area, and localized intrusive igneous rocks like granodiorite (Gaskill et al., 1991). Varying dominance of vegetation with elevation defines four ecozones in the catchment: shrubs, grasses, and forbs dominate the montane (< 2800 m elevation; 2 % of catchment area) zone; aspen and conifers dominate in the lower subalpine (2800 to 3200 m; 34 % of the catchment area) region; and conifers dominate in the upper subalpine (3200 to 3500 m; 32 % of the catchment area) region. In the alpine region (> 3500 m; 31 % of the catchment area), shrubs are dominant until 3800 m, above which the land is mostly barren (Carroll et al., 2022b). Meadows are distributed across the catchment but take up a relatively small share of the total area above the montane. The climate is dominated by cold winters with substantial snow cover and snowpack accumulation that constitutes about 80 % of the total annual precipitation (Carroll et al., 2022b). There is a consistent snowpack cover in the subalpine and alpine region with no mid-winter melt. In the montane region, melt is very limited (< 10 mm d−1) prior to early March (Carroll et al., 2022a). The dominant moisture source of winter precipitation in the study region is the northeastern Pacific, and snowfall occurs predominantly from northwestern frontal storms (Marchetti and Marchetti, 2019). Summers are relatively warm and dry, with monsoonal rain that accounts for 20 % of the annual precipitation. The snowpack depth is generally greater and snowmelt timing is later with increasing elevation across the catchment (Carroll et al., 2022a). The catchment hydrograph is dominated by the snowmelt pulse with onset in April, a pronounced peak during June, and a subsequent snowmelt recession interspersed with smaller peaks driven by monsoon rainfall events. Between September and March, the catchment streamflow is generally limited to baseflow (Carroll et al., 2020). The East River has been intensely instrumented and studied since 2015; more details are provided in Hubbard et al. (2018).
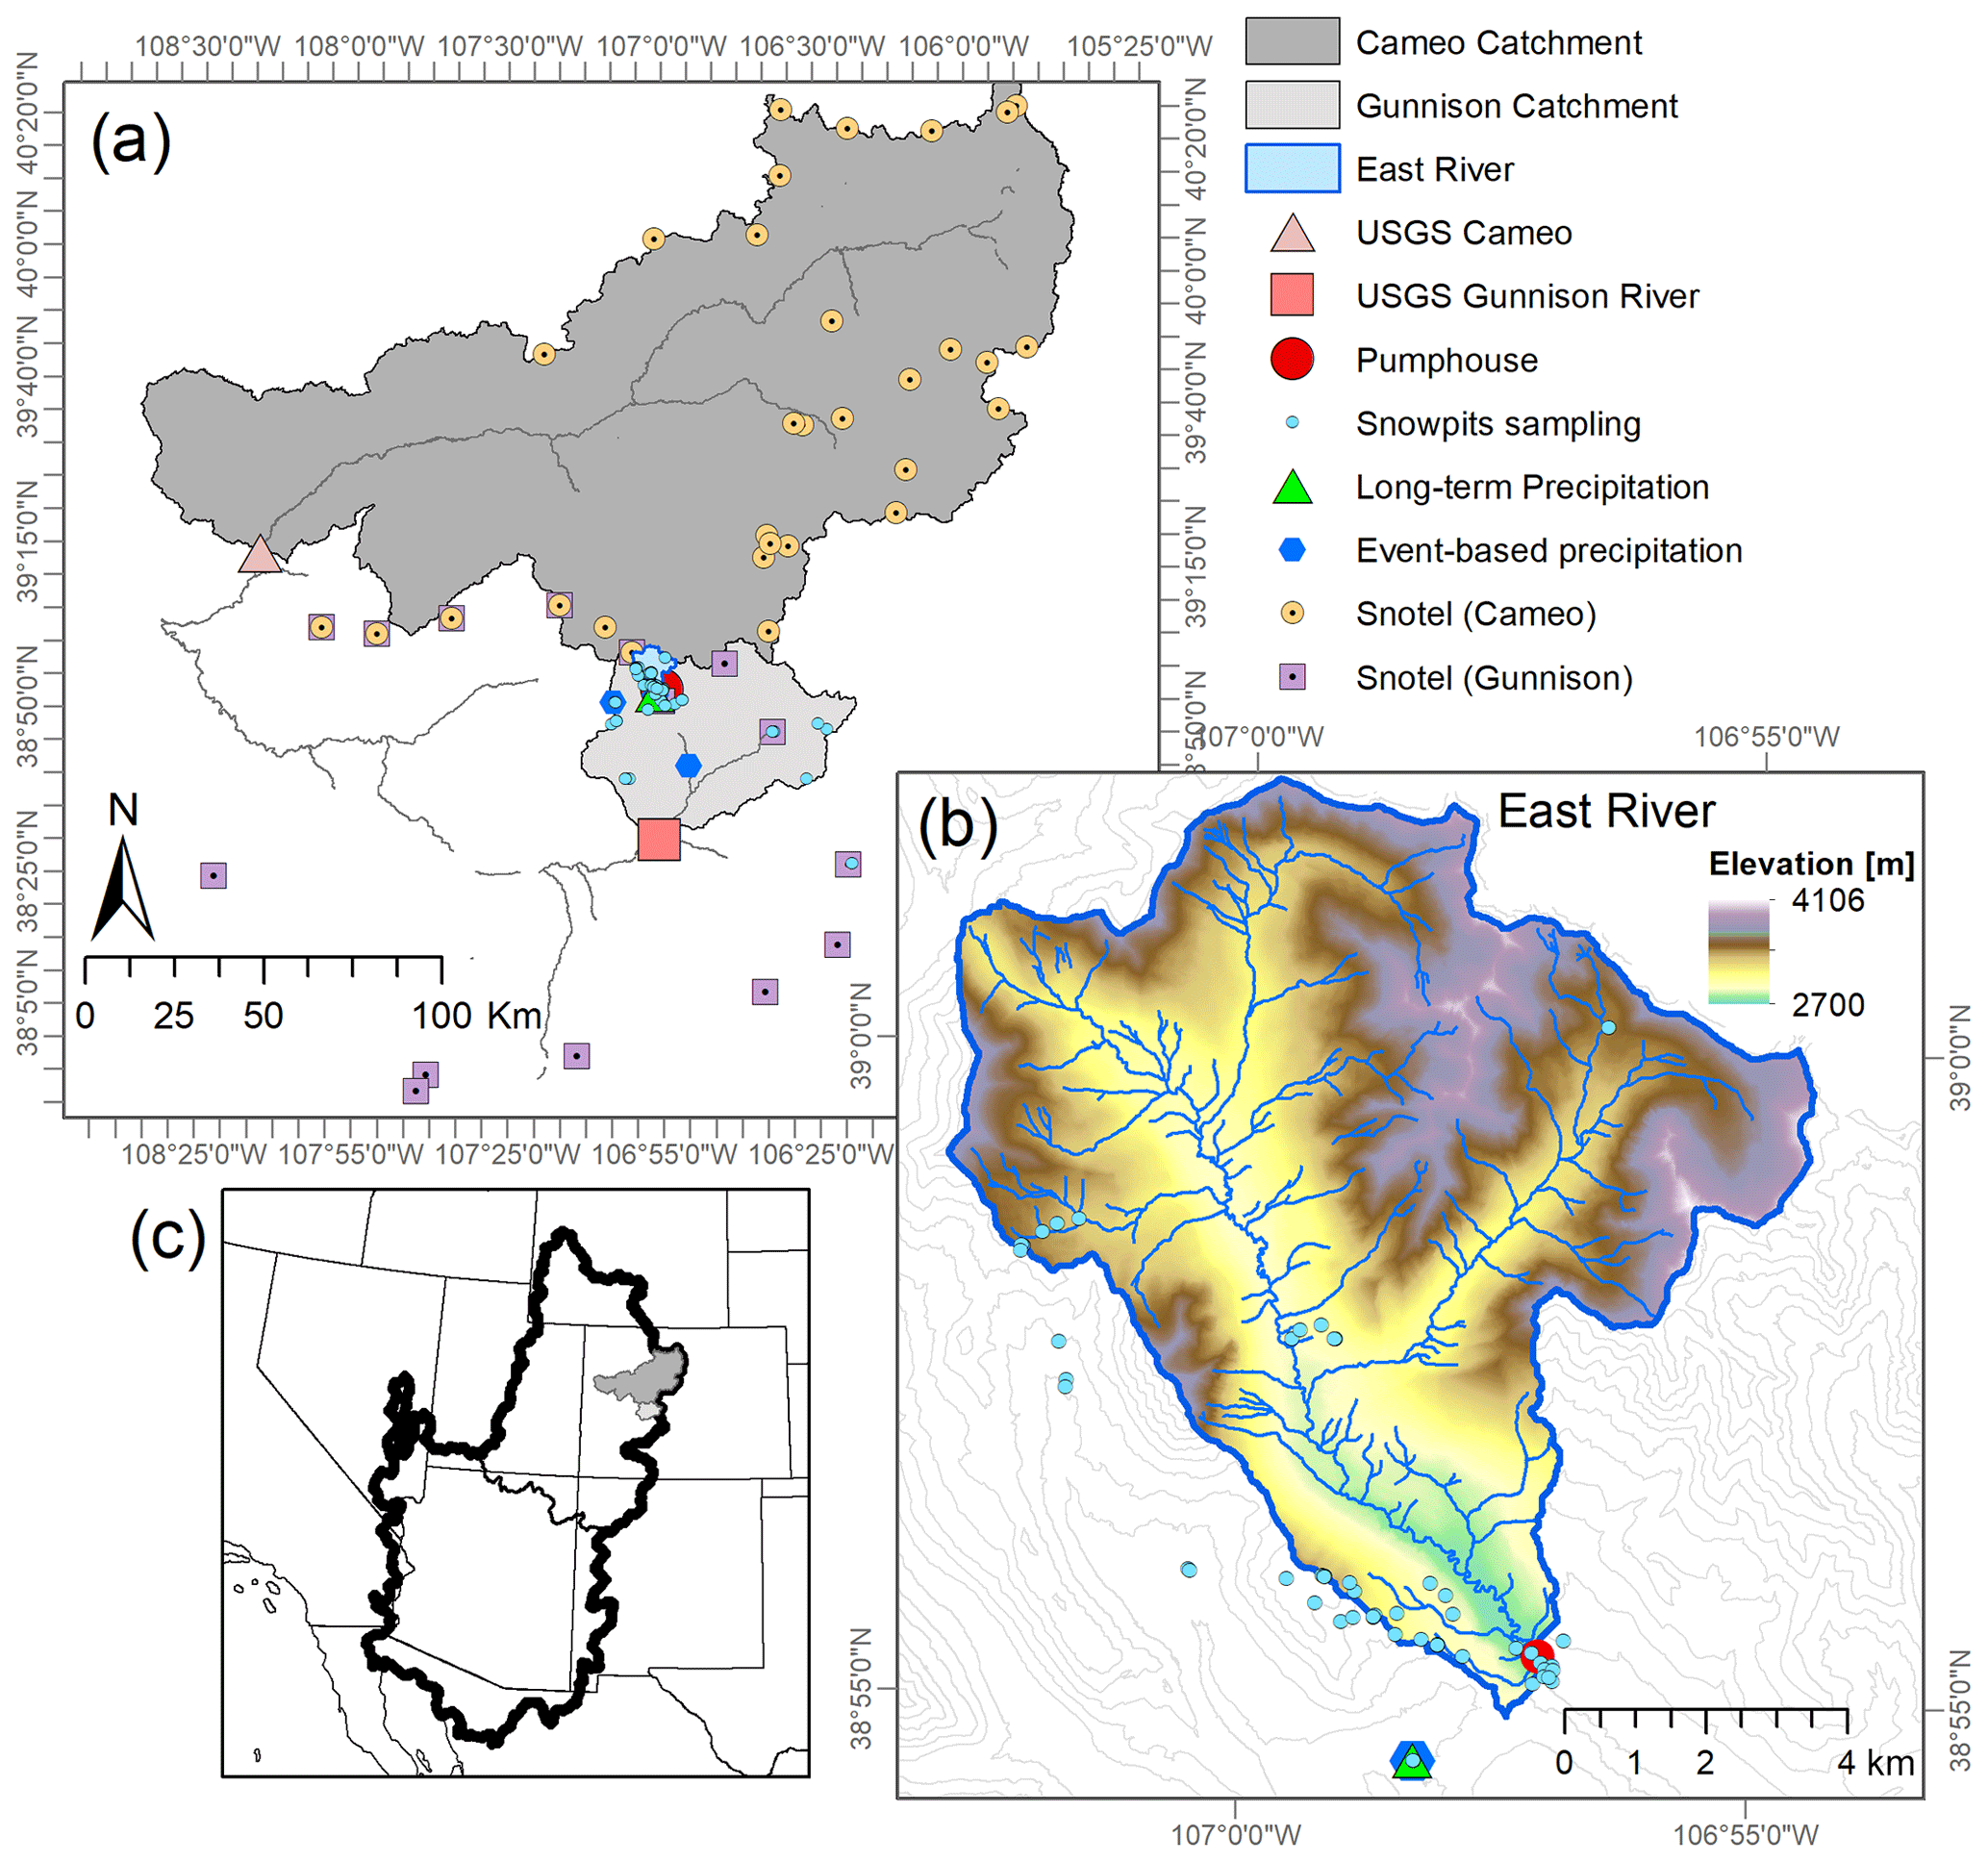
Figure 1(a) Locations of streamgages and water sampling of the Colorado River near Cameo, the Gunnison River near Gunnison, and the river's catchment area (grey). Locations of event-based precipitation sampling (blue markers) and SNOTEL stations in the Colorado River (light blue) and Gunnison River (light purple) areas. East River catchment area (blue outline) as defined by the Pumphouse gaging and sampling location (red circle) located within the Gunnison river catchment (also shown). (b) Area and elevation of the East River catchment with the streamgage and water sampling location at Pumphouse (red marker) and long-term precipitation sampling site (cyan triangle). (c) Locations of the catchments defined by the streamgages near Cameo and Gunnison (grey and light grey, respectively) in the Colorado River basin (thick black line).
In addition to the East River, we also sampled the Gunnison River near Gunnison, CO, about 50 km downstream from Mount Crested Butte. This catchment is defined by the USGS streamgage no. 09114500 (38.54193567, −106.9497661) and has a drainage area of 2618 km2. A third basin was included, which is defined by the USGS streamgage no. 09095500 (39.2391463 −108.2661946) of the main stem of the Colorado River near Cameo, CO. Its drainage area is 20 683 km2 (USGS, 2023). Hereafter, these two basin locations are referred to as Gunnison and Cameo, respectively, and their catchment areas are shown in Fig. 1.
Within the Gunnison River basin, there are 15 SNOTEL sites located at elevations ranging between 2674 and 3523 m providing snow water equivalent (SWE) observations (Supplement Table S1). Across these SNOTEL sites, elevation was not a good predictor of the maximum snowpack depth (Supplement Fig. S1). For the Colorado River at Cameo, we chose the 31 SNOTEL sites in the Colorado headwaters ranging between 2610 and 3452 m (NWCC, 2023; Fig. 1).
We sampled snowpack between 2016 and 2019 across a gradient spanning 1324 m in elevation (from 2347 to 3671 m) in the Gunnison catchment (Fig. 1a and b). The snowpack sampling generally took place between early February and late May, with 80 % of all samples taken ±30 d from 1 April, which is often assumed to be the timing of peak SWE. A total of 53 snow pits were dug in flat areas with samples collected in duplicate at 10 cm depth increments to tabulate snow density, temperature, and stable isotope ratios. Bulk snowpack isotopic content represents the SWE-weighted composite value across the entire snow column (Carroll et al., 2022b). Precipitation was first sampled on an event basis via a collector from 2014 to 2017 on Mount Crested Butte at 2885 m (long-term precipitation; Fig. 1), and the sampling procedure was outlined in Carroll et al. (2022b). Since 2020, we have sampled the precipitation on an approximate event basis at the locations Estess (2513 m), Mount Crested Butte (2885 m), and Irwin Barn (3181 m); see event-based precipitation in Fig. 1. We sampled stream water from the East River at the Pumphouse location from 2014 to 2022 at a daily to fortnightly frequency (Pumphouse; Fig. 1). There was a gap in sampling in April 2018; therefore, 2018 was excluded from the present analyses. The East River stable isotope data are published in Williams (2023). Sampling at the Gunnison River was done between March 2020 and December 2021 on a weekly basis with occasional higher (3 d) or lower (15 d) frequency. At Cameo, stream water sampling occurred at a weekly to fortnightly frequency in 2021 and 2022.
All water samples were measured for stable hydrogen and oxygen isotopes using cavity ring-down spectroscopy (Picarro L2130-i). We report isotope ratios as δ18O and δ2H values expressed relative to Vienna Standard Mean Ocean Water (Craig, 1961b).
2.2 Data analyses
We calculated the deuterium-excess value (d-excess) for all water samples as defined by Eq. (2).
The slope of the local meteoric water line is 7.4 (Carroll et al., 2022b) near Mount Crested Butte and 7.2 at the lower-elevation Gunnison site (Marchetti and Marchetti, 2019), which does not deviate much from the slope of 8 of the global meteoric water line that defines d-excess (see Fig. S2). For significant linear Pearson correlations (p < 0.05), we added linear regression lines to the plots.
We used the SNOTEL data to compute the fraction of maximum SWE through time for each water year (a value of 1 equals maximum SWE and zero indicates that the snowpack has melted). Because SNOTEL SWE data only reflect conditions at the stations, we used the spatially explicit energy balance snowmelt simulations published by Carroll et al. (2022a) that were informed by the spatial variation in SWE as observed by flights of the ASO. For each water year with snowmelt simulations available, we calculated the cumulative difference through time between the simulated snowmelt for the montane and alpine elevation bands in the East River, given as millimeter (mm) SWE. In this case, a value of zero indicates equal snowmelt volumes from the montane and alpine snowpack, whereas positive values show that alpine snowmelt exceeded montane snowmelt.
We defined the snowmelt period in the East River catchment, based on the hydrograph at the Pumphouse streamgage, to be the time between day 200 and 300 of the water year. This period is between mid-April and late July because the water year starts on 1 October. For the snowmelt period, we used the Bayesian mixing model HydroMix, developed by Beria et al. (2020), to estimate the contribution of high-elevation snowmelt to streamflow during the snowmelt period. HydroMix uses tracer data of the end members and the mixture to estimate the probability distribution function (pdf) of the mixing ratio, defined as the fractional contribution of end members to the mixture:
where M is the tracer concentration in the mixture, S1 and S2 are tracer concentrations in the two sources, and ρ is the fractional contribution of S1 to mixture M.
In typical Bayesian mixing analysis, pdfs are fitted to tracer concentrations in different end members and in the mixture, and the pdf of the mixing ratio is estimated using standard Bayesian inference principles. This requires a large tracer dataset to ensure a robust fit of the end members and the mixture to tracers, which is often not available. HydroMix adopts a bootstrap approach, using all possible combinations of end-member tracer measurements and formulating a likelihood function based on an assumed pdf of the underlying error function, which is the difference between simulated and observed mixture concentrations. Using all available combinations of end-member tracer measurements, HydroMix builds an empirical pdf while optimizing the likelihood function. This approach has been shown to work both theoretically and in real-case scenarios (Beria et al., 2020).
The two end members (S1 and S2) were defined as the d-excess of the snowpack from the upper subalpine and alpine snowpack (> 3200 m, n= 31; defined as “high elevation”) and lower subalpine and montane area (< 3200 m, n= 60), respectively. We report the mean fraction of high-elevation snowmelt in each water sample (M) with standard deviations based on the distribution of the two end members as described in Beria et al. (2020). We further report the seasonal flow-weighted mean share of high-elevation snowpack in the stream samples. We compared the HydroMix results with MixSIAR (Stock et al., 2018) calculations and found that both methods produced very similar results. A multiple linear regression was used to explore the predictability of the mean share of high-elevation snowmelt during the different years as a function of the average maximum SWE (SWEmax) and the mean air temperature (Tair) of measurements at the Gunnison SNOTEL sites (NWCC, 2023) during the snowmelt period.
3.1 The d-excess of stream water increased with high-elevation snowmelt contributions
Our snowpack sampling campaigns along a 1324 m elevation gradient showed that the average (±SD) d-excess value of the high-elevation (> 3200 m) snowpack was 13.8 (±1.6) ‰ and thus significantly higher than that of the lower-elevation snowpack (10.7 ±1.8 ‰; Fig. 2c). The d-excess of the lower-elevation snowpack was not significantly different from groundwater (10.5±1.0 ‰, Fig. 2c) nor from the d-excess of summer rainfall (Fig. S3). We further observed a strong and temporally consistent (generally r > 0.63 and p < 0.05 for the 4 individual years) increase in d-excess of the snowpack with elevation (Fig. 2b). The d-excess lapse rate of the snowpack was +0.52 ‰ per 100 m, leading to 12.9 ‰ to 14.4 ‰ and 14.4 ‰ to 17.6 ‰ for the d-excess of the snowpack in the upper subalpine and alpine regions, respectively. Lapse rates for the snowpack were not seen in δ18O (Fig. 2b) or δ2H (data not shown). The precipitation sampled via collectors across the 667 m elevation gradient from the event-based sampler also showed a relation between average d-excess and elevation in the samples collected weekly to fortnightly between November and April during water years 2021 and 2022 (Fig. S4). These samples reflect a d-excess lapse rate for winter precipitation of +0.7 ‰ per 100 m, which was slightly higher than snowpack, although the elevation range for the precipitation sampler was lower. There was generally a large variability in SWE dynamics across the SNOTEL sites in the Gunnison catchment (Fig. 3a), and this variation among the sites did not result from elevation differences (Fig. S1).
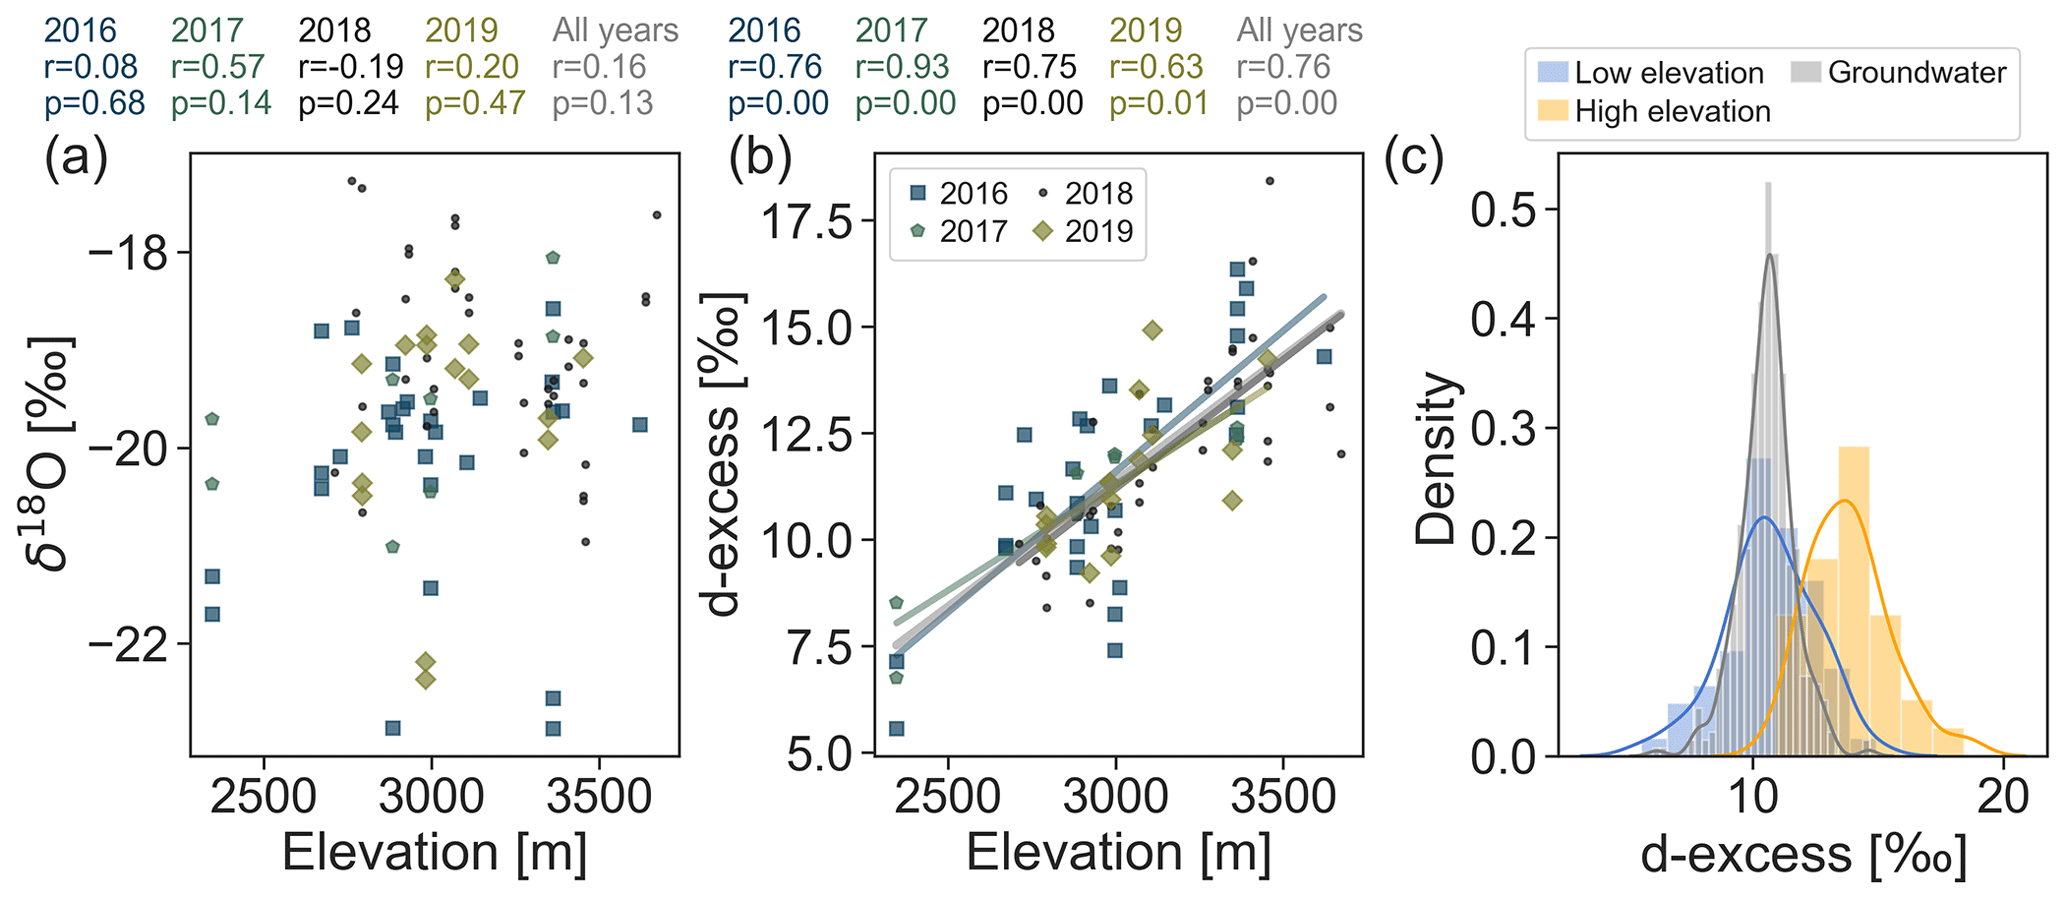
Figure 2The δ18O (a) and d-excess values (b) of the snowpack sampled in the upper Colorado River basin during four different winters along an elevation gradient (Carroll et al., 2021). Regression lines are plotted for correlations with p < 0.05. For each year and for the bulk isotope data over all years, Pearson correlation coefficients (r) and significance (p) are given. (c) Histogram showing the distribution of snow pit d-excess values for the sites < 3200 m a.s.l. (“low elevation”; blue), sites above > 3200 m a.s.l. (“high elevation”; orange), and groundwater sampled at five wells between 2015 and 2022 (grey; Williams, 2023). The mean d-excess values for the low- and high-elevation snowpack (10.7 ‰ and 13.8 ‰, respectively) are significantly different (p < 0.0001, ) according to Student's t test. The mean groundwater d-excess value (10.5 ‰) is not significantly different from that of the low-elevation snowpack.
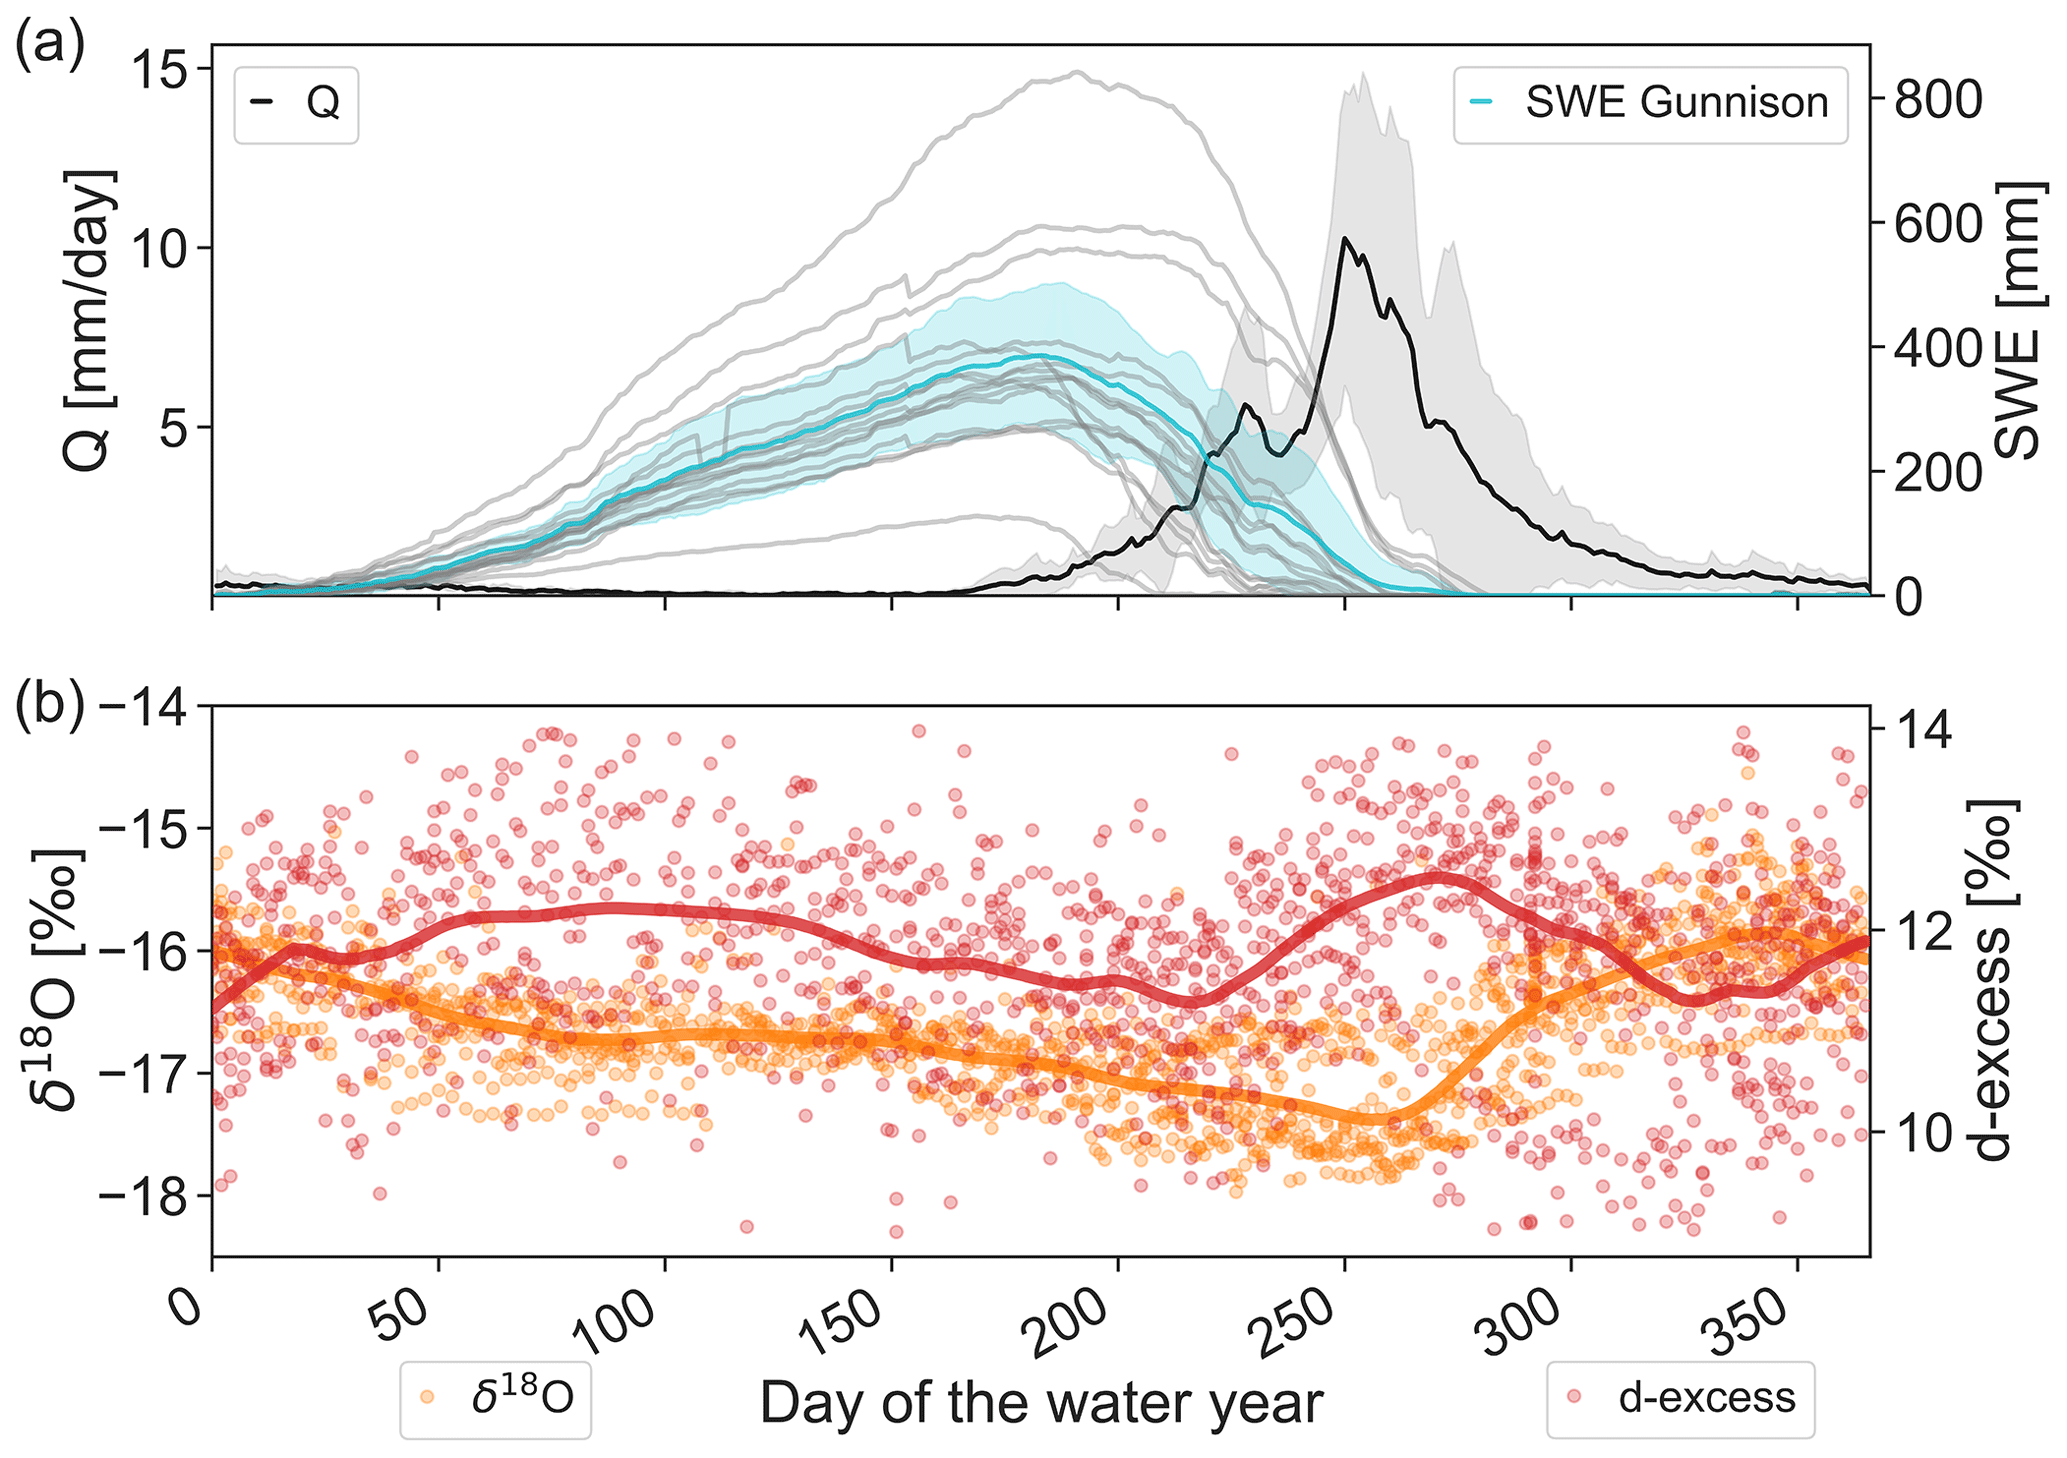
Figure 3(a) Median annual dynamics of East River streamflow (Q, black; Carroll, 2023) and snow water equivalent (SWE; NWCC, 2023) at the individual SNOTEL sites within the Gunnison River catchment (grey) and the average of all sites (cyan) from water year 2015 to 2022, with semitransparent grey and cyan areas representing the standard deviations of Q and SWE, respectively. (b) The δ18O (orange) and d-excess (red) of all stream water samples collected between water year 2015 and 2022 from the East River at the Pumphouse location (Williams et al., 2023). The orange and red lines are a locally weighted scatterplot smoothing (LOWESS) fit to the data points. See Fig. S5 for a time series plot of the same data.
The hydrograph of the snowmelt period had peak streamflow during May and June, a recession towards August, and the lowest flows between September and March (Fig. 3a). This pattern was consistent during the 7 water years, but years with lower SWE resulted in lower peak flows as expected (Fig. S5).
The stream water δ18O dynamics reflected the seasonality of precipitation inputs: having lower values (depleted in 18O) during peak flow and trending towards higher values (enriched in 18O) during summer and early fall, due to greater fractional contributions from baseflow and rainfall contributions that had higher δ18O values compared to the snowfall. Due to the strong difference between δ18O values in rain and snowfall (see discussion in Sprenger et al., 2022), the δ18O of stream water decreased during the low flows in winter due to a higher fraction of groundwater sourced from snowmelt vs. rain in the catchment runoff (orange points and line in Fig. 3b). The δ18O of snowmelt stream water reached a minimum in June during maximum snowmelt contribution, after which the snowpack ceased to exist and δ18O of stream water increased throughout the summer.
We found that over the study period, the timing of the peak streamflow could be explained by the timing of the most intense snowmelt (i.e., the slope of SWE in Fig. 3) and the timing of complete melt-out at the higher (> 3200 m) SNOTEL stations (r= 0.83 and r= 0.79, respectively).
The d-excess values of stream water did not show a strong seasonal dynamic, but in general, d-excess values mainly increased during the snowmelt season and subsequently dropped again during the summer (red points and line in Fig. 3b). The increase of d-excess in stream water was not due to rainfall input because there was no seasonal trend in d-excess of rainfall (Fig. S3). Instead, d-excess of stream water resulted from melting snowpack at higher elevations due to snowmelt progression, as evidenced by the SNOTEL SWE data, which resulted in increases in d-excess of stream water consistently for each of the investigated years (Fig. 4a). The hypothesis that this increase in d-excess of stream water resulted from high-elevation snowmelt contributions is supported by its relation to simulated snowmelt differences between alpine and montane snowmelt volumes through time (Fig. 4b). When the high-elevation snowmelt volumes became increasingly larger than the low-elevation snowmelt, d-excess of stream water increased consistently. Annual average snowmelt from alpine regions (1075 m3 s−1) was more than double that of snowmelt from montane regions (520 m3 s−1), despite the area of the former (111 km2) being smaller than the latter (143 km2) in Carroll's (2022a) modeling domain of the East River. Notably, Fig. 4b also shows that d-excess values of stream water were highest for years with the largest differences between alpine and montane snowpack (2017 and 2019).
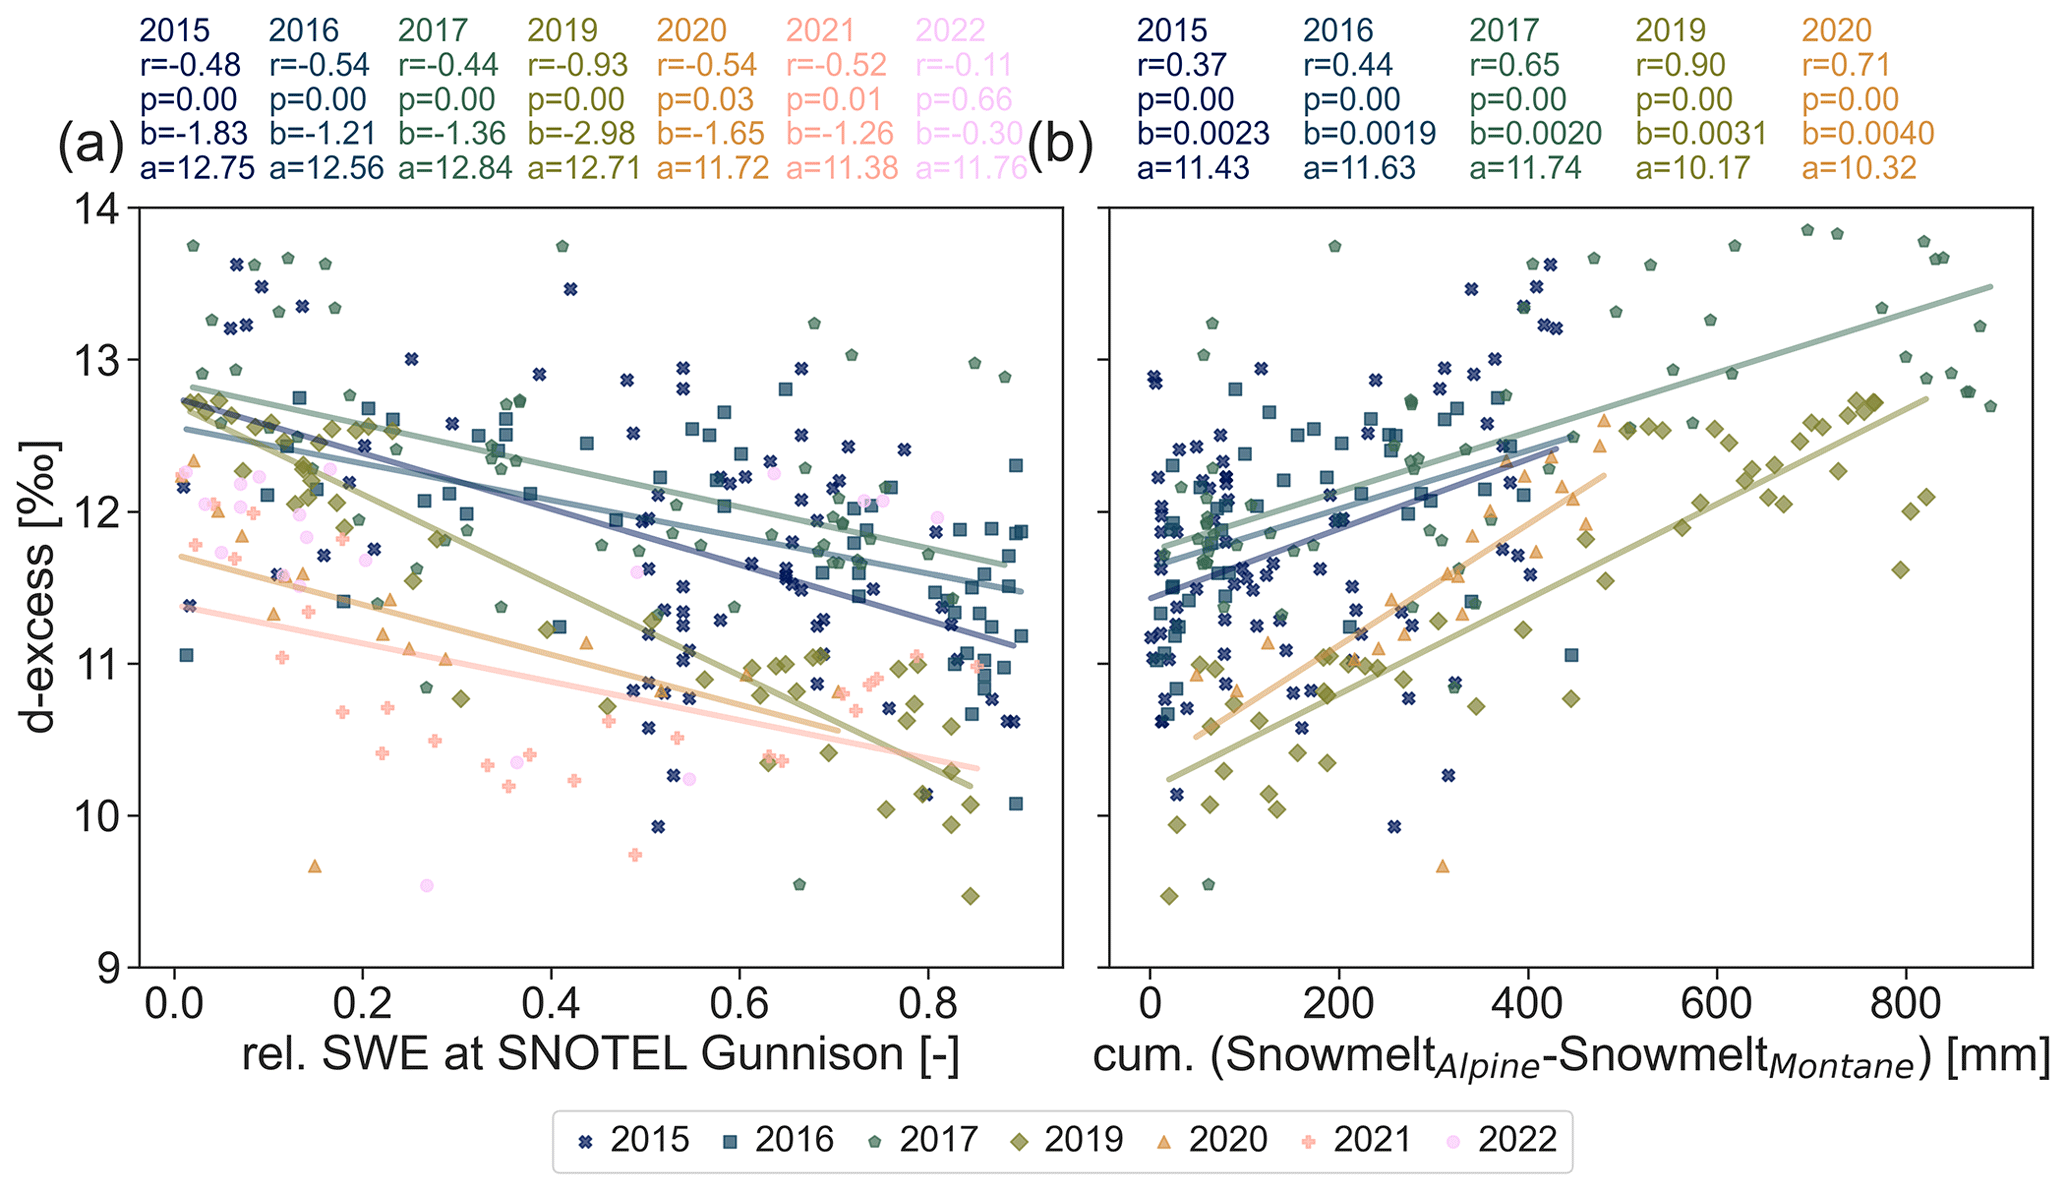
Figure 4(a) The d-excess values of stream water during snowmelt for 7 individual years, shown as a function of relative snow water equivalent (rel. SWE) measured at the SNOTEL stations across the Gunnison River catchment at the time of sampling. For each year, the Pearson correlation (r) and the associated significance level (p) are given as well as the intercept (a) and slope (b) of the regression. (b) The d-excess of stream water as a function of the cumulative (cum.) differences between the simulated snowmelt at alpine (highest elevation in the East River) and montane (lowest elevation in the East River) regions at the time of each stream water collection. Regression lines are shown for p≤0.05.
Our d-excess-based end-member mixing analyses revealed that 41 % to 57 % of the flow in the East River during the snowmelt period stemmed from high-elevation snowpack (Fig. 5). Periods when there were increases in the fraction of high-elevation snowmelt contributions tend to be later in the snowmelt hydrograph and coincided with periods of runoff intensification (Fig. S6). During peak alpine snowmelt contributions, about two-thirds of the East River flow stemmed from the high-elevation snowpack. There was a general trend that the annual mean high-elevation snowpack contributions were higher in water years with lower maximum SWE observed at the SNOTEL sites across Gunnison County (Fig. S7a; , p= 0.24). However, the relatively warm snowmelt period of 2017, following a winter with deep snowpack, resulted in relatively large high-elevation snowmelt contributions and thus did not follow that trend (Fig. S7b; r= 0.25, p= 0.58). Because of this observation, we included the average air temperature measured at the SNOTEL sites during the snowmelt period as a second variable in addition to maximum SWE in the multiple regression analysis. The regression equation,
explained 66 % of the interannual variation in the mean high-elevation snowmelt contribution, and all variables had significance levels of < 0.1. Our results therefore indicate that the snowpack at the highest elevations was most important for runoff generation in low-snow years and relatively high air temperature and in years with a deep snowpack and relatively low air temperature (Fig. 6). We also tested streamflow volumes during the snowmelt period as a variable but did not include it because of its strong correlation with SWEmax (r= 0.84, p= 0.018).
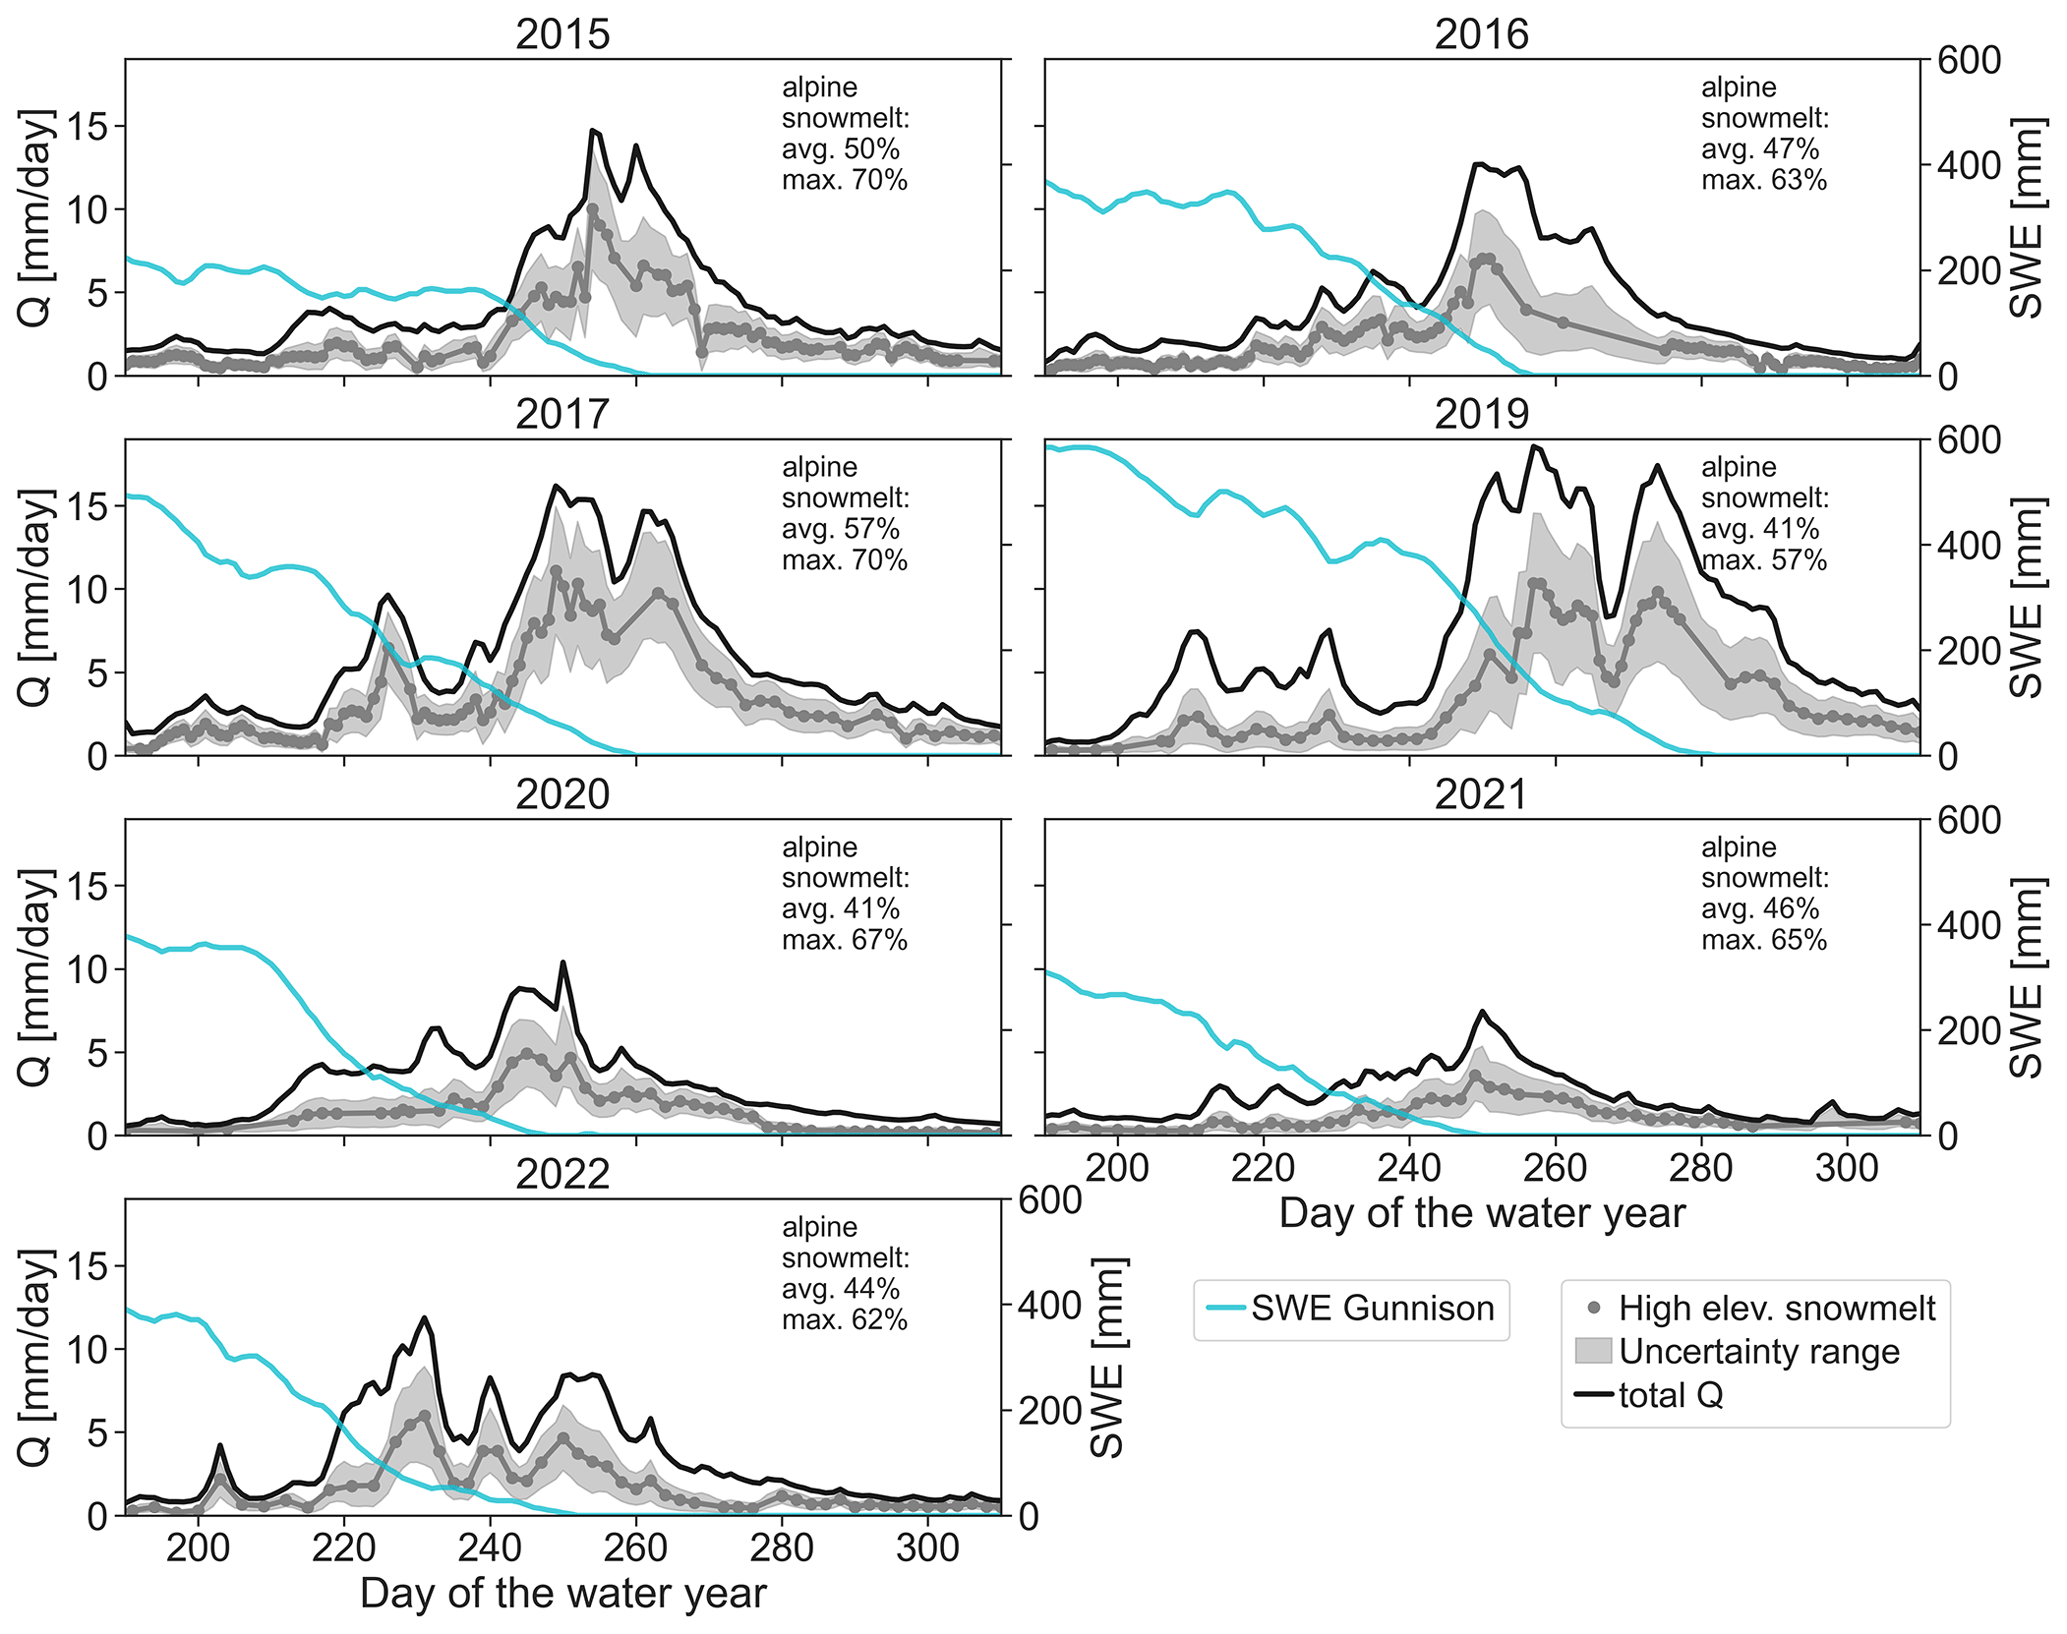
Figure 5End-member mixing analyses based on d-excess of stream water inferring the share of high-elevation snowmelt (grey dots and lines) in the streamflow during the snowmelt-induced peak flow of the East River. The uncertainty range is shown as grey bands, and it represents the standard deviation (22 % on average). Days 200 and 300 of the water year represent mid-April and late July, respectively. The cyan line represents the average snow water equivalent (SWE) observed across the SNOTEL sites in Gunnison County.
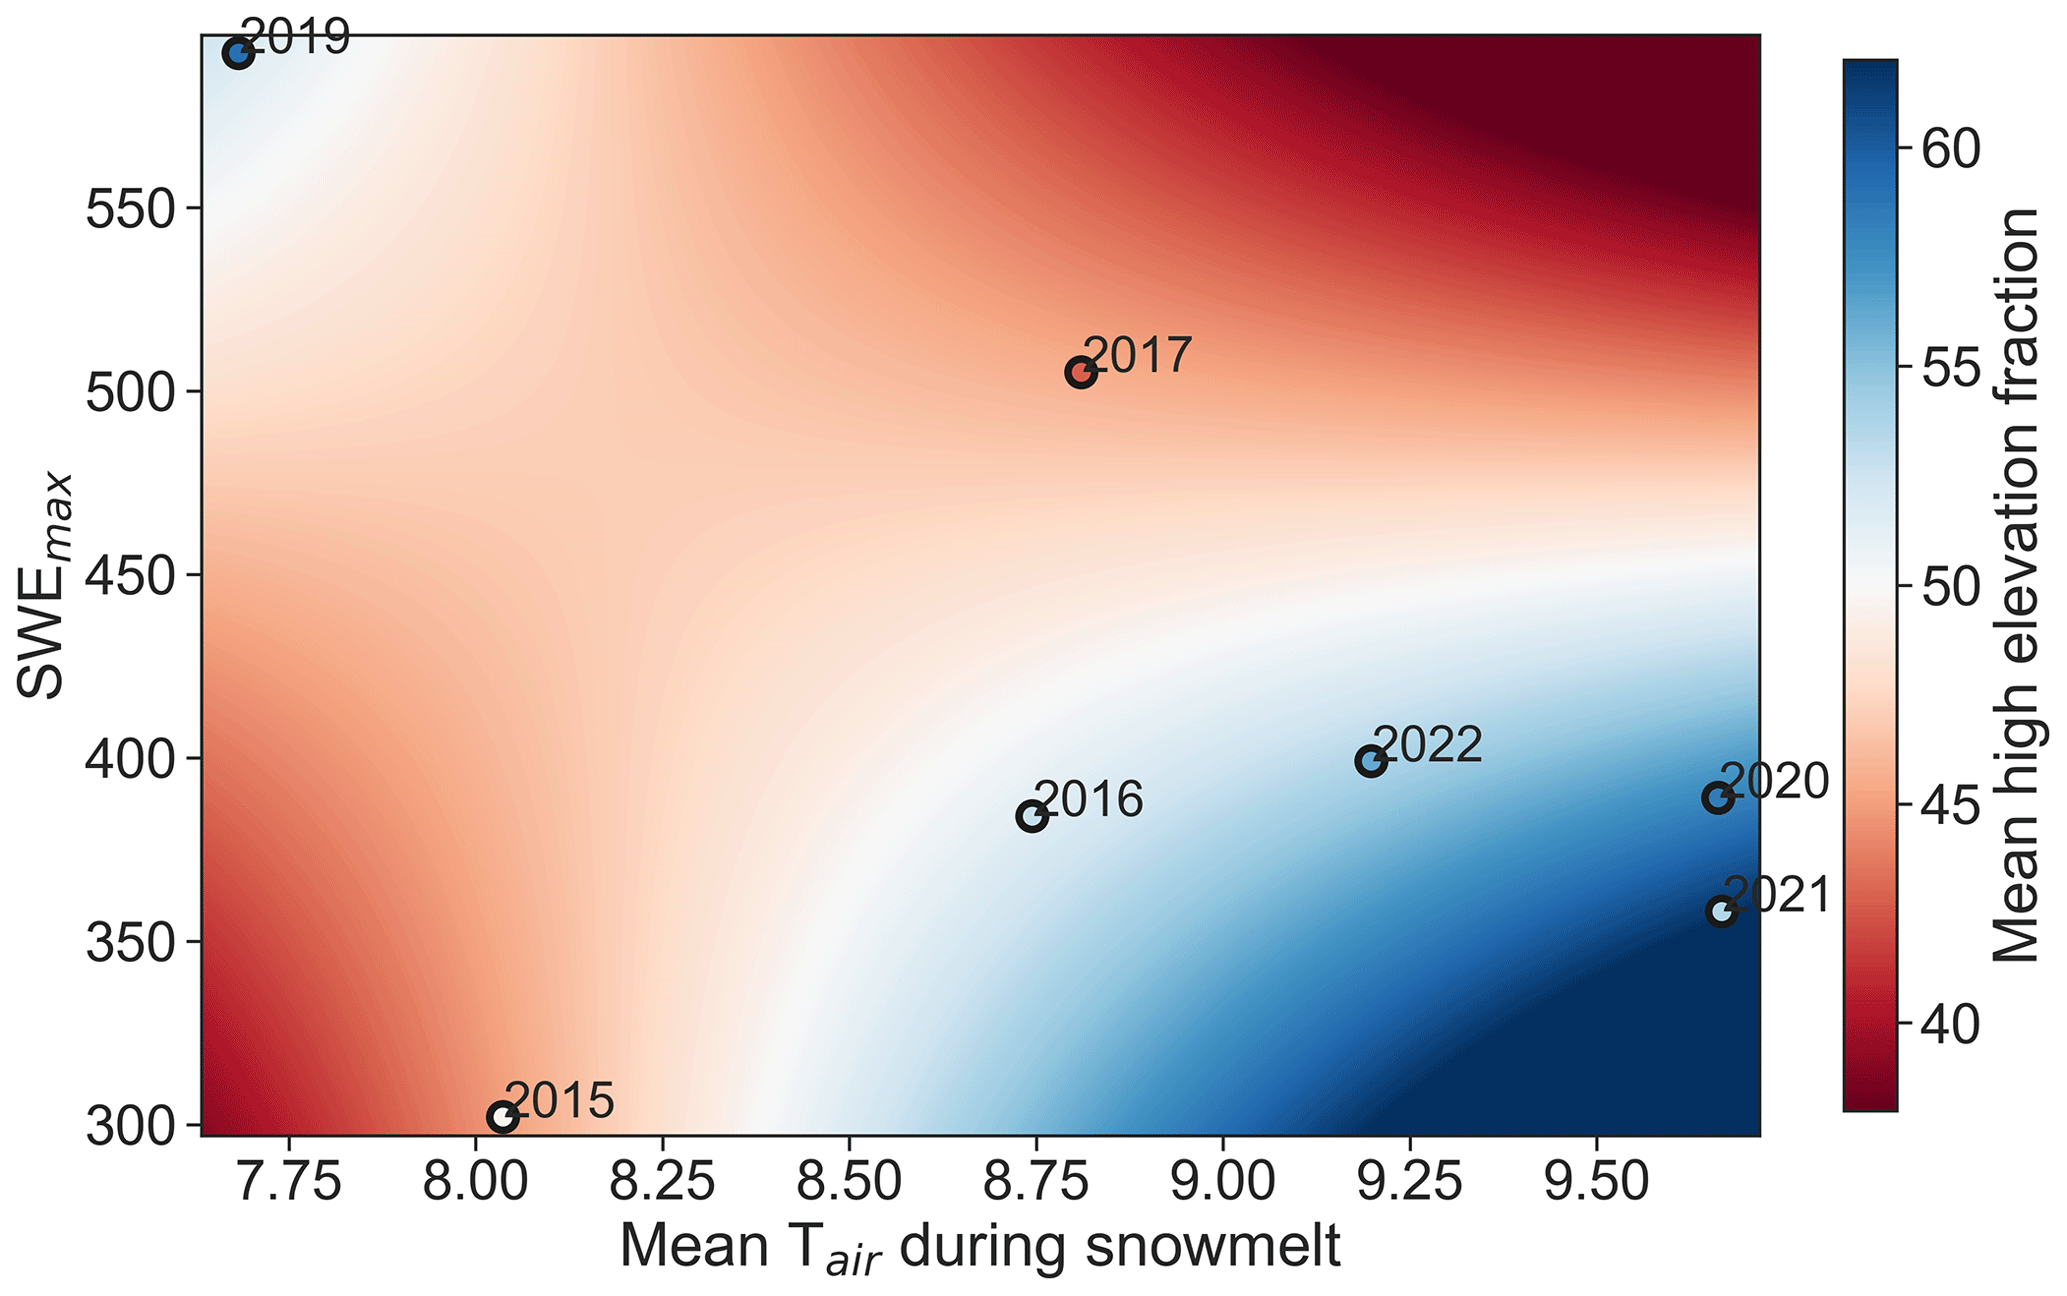
Figure 6Result of the multiple regression analyses to assess predictability of the mean contribution of high-elevation snowmelt to stream water as a function of the maximum snow water equivalent (SWEmax) and the air temperature (Tair) during the snowmelt period measured at the SNOTEL sites in Gunnison. Note that the regression includes the interaction between SWEmax and Tair as follows: maximum high-elevation fraction = −37.03 ⋅ SWEmax+ 0.089 ⋅ Tair ⋅ SWEmax+ 350.74. The data points labeled with years indicate the data that went into the model.
3.2 The d-excess dynamics of stream water beyond the headwaters
Downstream from the East River, the Gunnison River stream water samples showed a similar increase in d-excess as streamflow during the snowmelt season increased. This pattern was observed for both years in which stream water sampling in Gunnison was done. In 2020, the snowpack was deeper, and the runoff was higher than in 2021. Additionally, the d-excess values of stream water were different for the different years, with generally higher values in 2020 than in 2021 (Fig. 7a, c). Despite the 30-times-larger drainage area of the Gunnison River compared to the East River, the effect of the high-elevation snowmelt on the d-excess measurements of stream water was detectable, albeit dampened, given the greater fraction of lower elevations contributing to its flow.
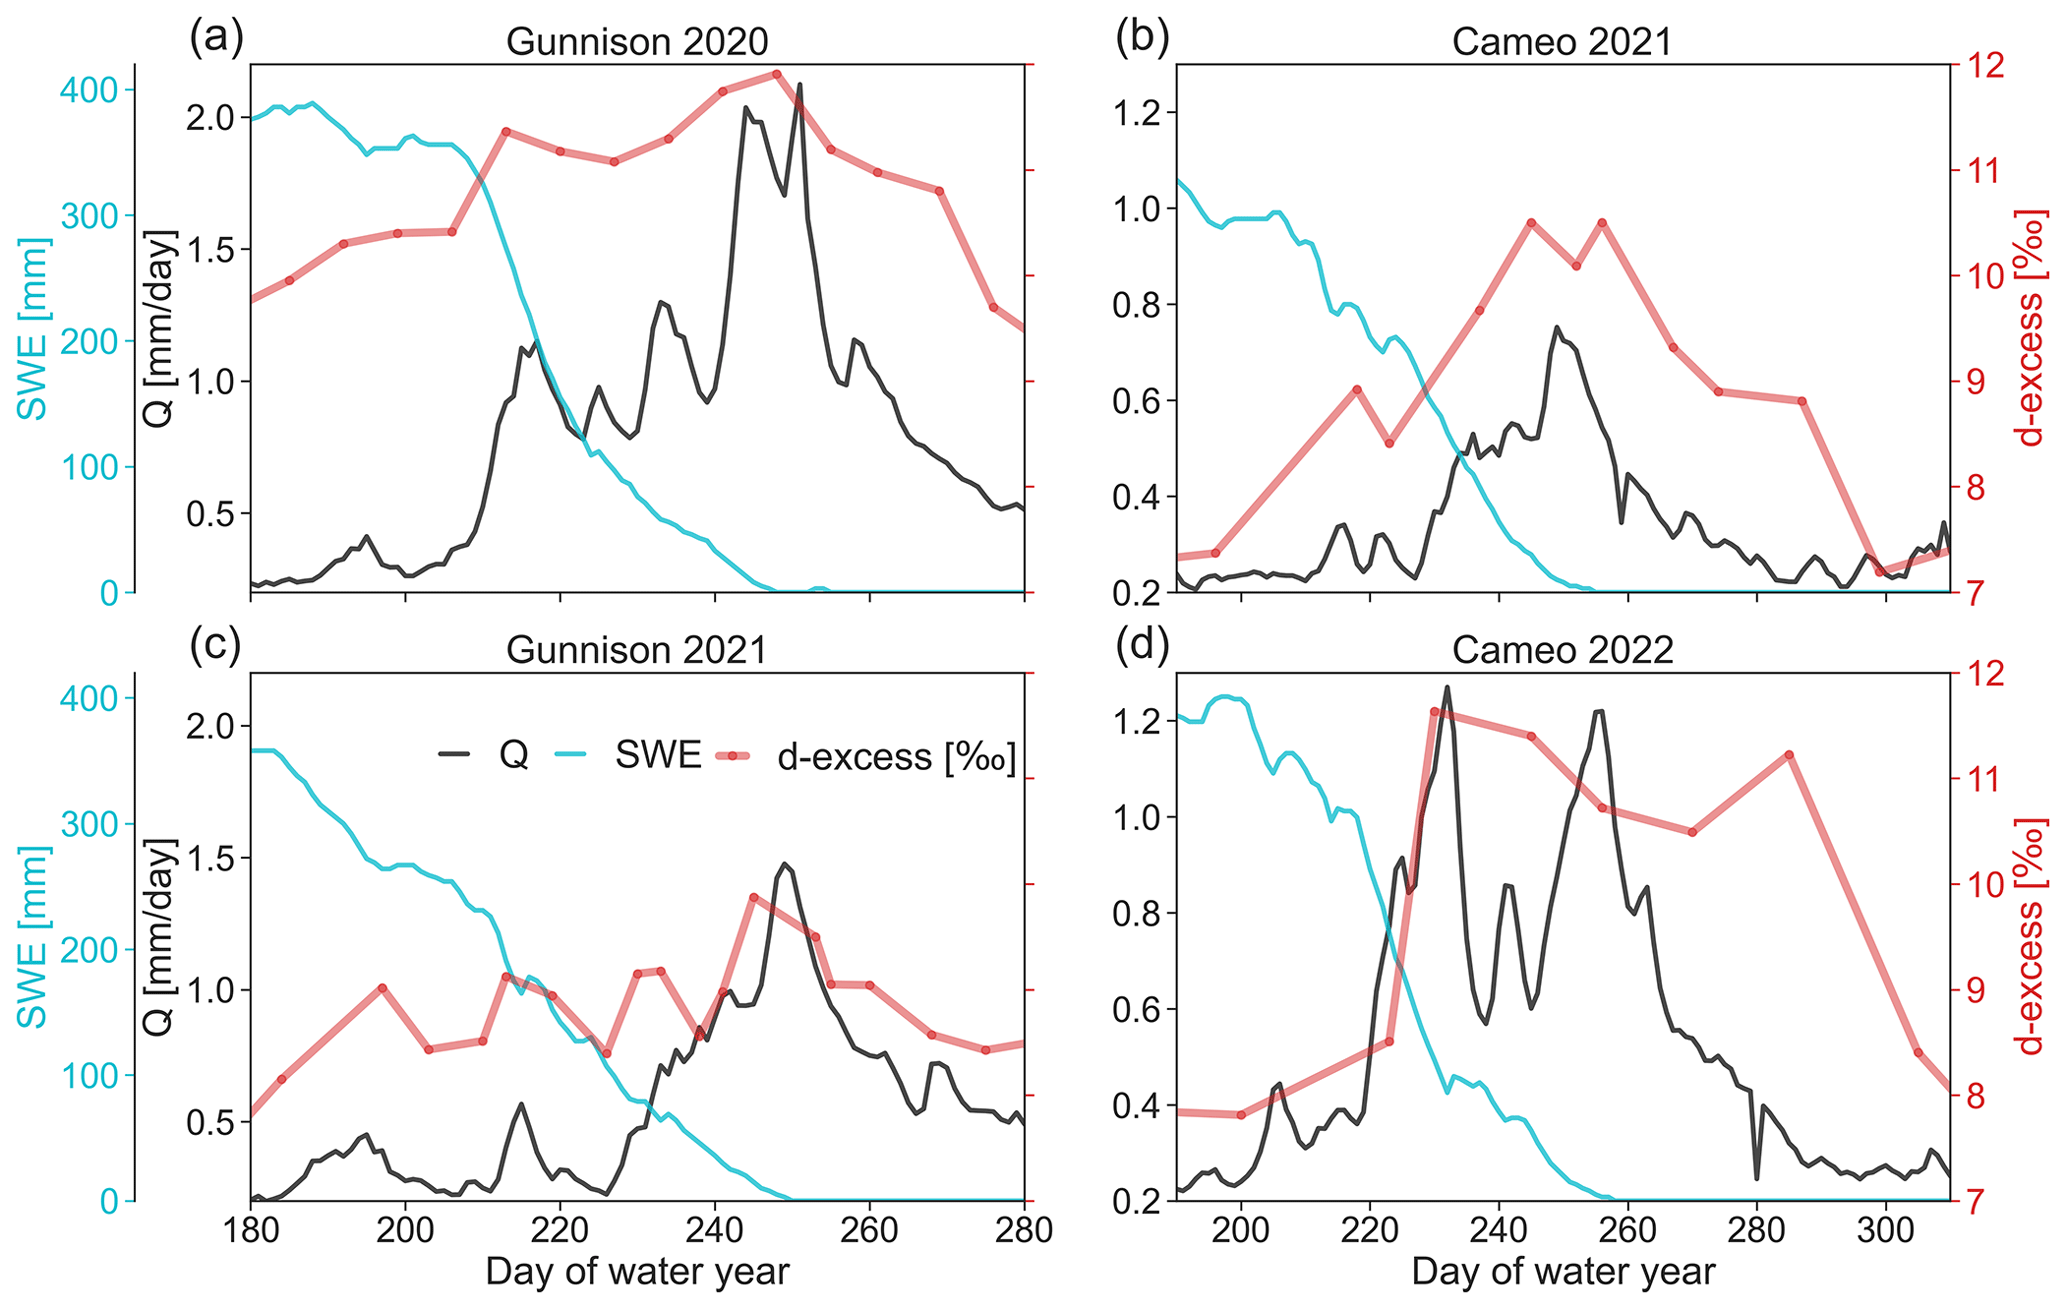
Figure 7Streamflow (Q; black) and d-excess (red dots and line) of the stream water before and during snowmelt for the Gunnison River near Gunnison, CO, in 2020 (a) and 2021 (c) and for the Colorado River near Cameo, CO, for 2021 (b) and 2022 (d). Further shown is the average snow water equivalent (SWE; cyan line) of all the SNOTEL sites located in the Gunnison catchment and in the Colorado River headwaters for the Cameo site, respectively. Note that the y axes have different scales in each panel.
The drainage area of the Colorado River near Cameo is 8 times larger than the drainage area of the Gunnison River, but the difference between the d-excess of stream water at the beginning and end of the snowmelt period was greater than 3 ‰ in 2021 and 2022. Thus, despite the large catchment area of the Colorado River near Cameo and the greater mixing of runoff in reservoirs within that catchment, the snowmelt contribution from high-elevation regions was substantial during the snowmelt peak flow (Fig. 7b, d).
4.1 The d-excess of stream water reflects high-elevation snowmelt
We find that d-excess of stream water can be used to differentiate the effects of snowmelt from low vs. high elevations using three independent approaches: first, comparison of d-excess dynamics of stream water with the observed snowpack reduction at SNOTEL sites in the region showed a strong relation that was consistent during six of the seven investigated snowmelt periods (Fig. 4a). The SNOTEL data do not show increased snowpack with elevation (Fig. S1), but ASO flight data indicate that snowpack depth generally increases with elevation (Carroll et al., 2022b). Thus, with decreasing SWE during the snowmelt period, the ratio of high-elevation snowmelt can increase. Such a trend of relative increase in the high-elevation snowpack during low-snow years was observed. Second, simulated differences based on spatially explicit hydrological modeling of snowmelt timing and volumes between the montane and alpine regions within the East River catchment correlated significantly with d-excess of stream water for every simulated snowmelt period (Fig. 4b). Third, the increase in d-excess of stream water coincided with the peak streamflow during each snowmelt period (with the exception of 2022; Fig. 5). Thus, elevated d-excess values cannot stem from low-elevation snowmelt but most likely result from higher-elevation snowmelt, as the snowmelt generally progresses from lower to higher elevations due to the temperature gradients across the catchment.
Because we observed consistent lapse rates of d-excess values in the snowpack during several years (Fig. 2b), significant differences between the d-excess at lower- and higher-elevation snowpack (Fig. 2c), and also a d-excess lapse rate in winter precipitation (Fig. S4), we see great potential for d-excess measurements to serve as a tracer for end-member mixing analyses to derive high-elevation snowmelt contributions to the catchment's streamflow during snowmelt periods.
Other studies have also shown that winter precipitation (i.e., snow) at the highest elevations had the highest d-excess values; monthly weighted precipitation data by Froehlich et al. (2008) indicated a lapse rate in d-excess values of +0.2 ‰ per 100 m across an elevation range between 469 and 2245 m in the Alps. Data published by Tappa et al. (2016) indicated a lapse rate of +0.63 ‰ per 100 m in the Rocky Mountains in Idaho for samples taken between October and May across five sites spanning an elevation gradient from 830 to 1850 m. Rolle (2022) sampled snowpack at 10 sites across elevations from 1262 to 1905 m in the Lubrecht Experimental Forest, Greenough, Montana, in late March and found a d-excess lapse rate of +0.26 ‰ per 100 m. Our lapse rate of +0.72 ‰ per 100 m for precipitation and +0.52 ‰ per 100 m for the snowpack was higher than in the other studies, but we cover a larger elevation gradient and study higher elevations than the other studies. Nevertheless, the general trend of increased d-excess values with elevation was the same for all four studies in mountainous systems.
However, the processes behind why we see a d-excess lapse rate in mountain snowfall and snowpack are not yet fully understood. The current literature suggests two potential processes.
One potential explanation for how d-excess lapse rates in the snowpack develop is evaporation and sublimation of snow at lower elevations combined with daytime up-valley (anabatic) winds that occur in mountainous areas and the subsequent condensation of the water vapor at colder, higher elevations (Beria et al., 2018; Lambán et al., 2015). Sublimation and evaporation from the snowpack lead to kinetic non-equilibrium fractionation that leaves an isotopically enriched snowpack behind (Stichler et al., 2001). Recent in situ stable isotope measurements by Wahl et al. (2021) support this process because they found that when radiation-driven sublimation outweighed deposition, the vapor was isotopically depleted compared to the snowpack. They further showed that the isotopic composition of the vapor determined the isotopic composition of the humidity flux during deposition conditions (Wahl et al., 2021). For our study region, we have shown previously via spatially explicit snowmelt modeling, based on the energy balance and accounting for isotopic fractionation (Carroll et al., 2022a), that the snowpack at lower elevations experiences more snow loss to the atmosphere due to higher energy availability than at higher elevations, which leads to an elevation gradient of the d-excess in the simulations. These simulations also have shown that shade provided by vegetation in forested areas reduces evaporation and sublimation from the underlying snowpack, making d-excess values of this snowpack higher than snowpack in non-forested areas at the same elevation (Carroll et al., 2022a). Because the snowpack in forests with higher d-excess values melts later than the snowpack in non-forested areas, it also results in an increase in stream water d-excess values during the later phase of the snowmelt discharge peak.
The second potential explanation for how d-excess lapse rates in the snowpack develop would be sub-cloud evaporation, which leads to lower d-excess values of precipitation at lower elevations because the distance between the cloud base and the ground and the saturation deficit are higher than at higher elevations. Thus, precipitation at lower elevations would experience more kinetic non-equilibrium isotopic fractionation due to evaporation, leading to lower d-excess (Froehlich et al., 2008). However, this process is less likely to occur during wintertime and snowfall (Froehlich et al., 2008), and Xing et al. (2023) showed with precipitation and vapor isotope measurements that sub-cloud evaporation altered the d-excess values of snowfall much less than rainfall on the Chinese Loess Plateau. While we cannot conclude which process leads to the d-excess lapse rate, observation of a d-excess lapse rate in several other high-elevation snow studies (Rolle, 2022; Tappa et al., 2016; Froehlich et al., 2008) suggests that we could expect a d-excess response due to high-elevation snowmelt contributions in the flow of other mountainous streams. Thus, the transferability of our approach to other watersheds will depend on observations of a d-excess lapse rate in the snowpack, which will likely be influenced by the climatic conditions that lead to thick a snowpack without mid-winter melt, a relatively steady moisture source of the snowfall, and accessibility to sample the snowpack near peak SWE.
Importantly, our long-term sampling of the precipitation in the East River can rule out the influence of a potential precipitation d-excess seasonality on the d-excess of stream water during the snowmelt period (Fig. S3). Therefore, there are several independent data sources that all point towards high-elevation snowmelt contributions to the catchment streamflow driving the observed d-excess of stream water variation during the snowmelt period.
Our findings, based on end-member mixing analyses via d-excess values, highlight the importance of high-elevation snowpack for runoff generation. Since the d-excess values in the groundwater are more similar to those in the lower-elevation snowpack (Fig. 2c), we infer that groundwater recharge is dominated by early snowmelt at relatively lower elevations infiltrating into a relatively dry subsurface. High-elevation snowmelt occurs during later freshet when the soils are already saturated or near saturation, which leads to fast runoff generation and thus shorter travel times and higher runoff efficiency (as outlined by Webb et al., 2022) of high-elevation snowmelt compared to low-elevation snowmelt. This temporal aspect of the high-elevation snowmelt and its larger contribution to streamflow later in the snowmelt hydrograph is reflected in the end-member mixing results that show the highest share on the recession limb of the hydrograph (Fig. S6). The interannual variation in d-excess of stream water and the derived high-elevation snowmelt contributions indicate that the snowpack of the upper subalpine and alpine regions could be most important in years of relatively low snowpack accumulation and comparably high spring air temperatures. The observed regression stems from the generally higher volume share of high-elevation snowpack compared to low-elevation snowpack during low-snow years and the faster melt-out during warmer spring temperatures, both leading to larger contributions of high-elevation snowmelt to the spring hydrograph peak. Thus, with the projection of a reduced snowpack in the western United States (Siirila-Woodburn et al., 2021), understanding the high-elevation snowpack dynamics could most likely become more important, and d-excess observations are a tool to investigate the timing (e.g., a trend towards earlier melt) and fate (e.g., streamflow contribution vs. sublimation or groundwater recharge) of the snowpack throughout the melting period.
4.2 Limitations and opportunities of d-excess of stream water with scale
Our results show that the d-excess patterns of stream water observed in a headwater stream can be scaled up because we see a similar d-excess pattern of stream water at larger scales from stream water sampling at the USGS streamgages of the Gunnison River near Gunnison and the Colorado River near Cameo. The latter sampling site is an entirely different catchment to the north of the East River and Gunnison River in which the snowpack was not sampled for its d-excess values. However, the d-excess signal of stream water for Coal Creek, a smaller headwater catchment to the west of the East River catchment, did not show a similar pattern (Figs. S8, S9), likely because of a lower representation of high-elevation bands within in the catchment (Fig. S10). A proportion of 29 % of the Coal Creek catchment area is the upper subalpine region, but only 6 % of the catchment is alpine (> 3500 m). Thus, high-elevation snowpack with the highest d-excess values is essentially missing from Coal Creek, which presumably dampened the d-excess response of stream water. We therefore hypothesize that the applicability of the d-excess of stream water as a signal for high-elevation snowmelt is dependent on a sufficient area with high elevation (> 3200 m) and sufficient elevation gradient in the catchment of the sampled stream. Lastly, although we see d-excess dynamics of stream water in response to high-elevation snowmelt at relatively large scales, the isotope dynamics may likely not be detectable downstream from large reservoirs. Initial sampling of the Colorado River near the Colorado–Utah state line, with a drainage area of 46 230 km2 that includes several large reservoirs, indicates that stream water d-excess changes are rather dampened and might not hold sufficient information to infer high-elevation snowmelt contributions (not shown).
Because snowpack volumes are getting lower, and snowmelt is starting earlier in mountainous regions due to climate change (Musselman et al., 2021), we could benefit by finding ways to assess the effect of both at sub-annual to decadal timescales. Short-term identification of a snow drought could allow for adaptive water management measures at the sub-annual timescale, whereas long-term trends might show the trajectory of mountain snow dynamics. With 0.2 ‰ measurement uncertainty in the d-excess values due to 0.025 ‰ and 0.1 ‰ precision (1σ) in δ18O and δ2H, respectively, the observed variation in d-excess in snowpack and stream water is at least 10 times larger. Our results and the discussion in the previous section show that measurement of d-excess of stream water is a relatively efficient way to obtain catchment-integrated information about the high-elevation snowpack.
Although SNOTEL sites are point measurements and therefore do not represent integrated patterns across heterogeneous mountainous regions, catchment-scale hydrological processes are integrated into the dynamics of d-excess of stream water. The lidar-based ASO data provide spatially explicit snowpack observations at catchment scales, but such data collection can be difficult and represents only snapshots in time, although time series changes in snowpack during the snowmelt period might be more informative. The difficulty of large-scale flight-based data collection may also make monitoring of interannual SWE changes difficult to conduct over every basin where trends induced by climate change may be useful to identify. The d-excess application introduced in this study can be efficient, is applicable across scales that vary by orders of magnitude, and uses limited labor and instruments for the water sampling (e.g., autosampler) and standardized laboratory analyses (e.g., laser spectrometer).
The d-excess of stream water could serve as a complementary information source, in addition to the currently applied streamflow shape and flashiness at low and high flows, to derive relations between snow persistence effects on the hydrograph across different climates (Le et al., 2022).
Measurements of d-excess of stream water could further help disentangle rapid high-elevation snowmelt contributions to the streamflow vs. groundwater inflow to the stream. This could be highly beneficial because mountainous catchments with lower groundwater influence were found to be more sensitive to snowpack changes due to warming (Tague and Grant, 2009).
Our snowpack and stream water stable hydrogen and oxygen isotope sampling program during several years links d-excess of stream water at the catchment outlet to high-elevation snowmelt contributions during the snowmelt period. The relation between d-excess of stream water and snowmelt dynamics at high elevations was consistent during several years. End-member mixing analyses based on d-excess values quantified the temporal dynamics of high-elevation snowmelt contributions and its relative importance for runoff generation from mountainous catchments. As compared to other approaches, such catchment-integrated information may be an effective way to better quantify the role of upper subalpine and alpine snowpack in streamflow contributions in snow-dominated mountainous systems. Our findings indicate that high-elevation snowpack contributions to the streamflow tend to be more important for runoff generation during years with lower snowpack and warmer spring temperatures. Thus, the high-elevation snowpack could likely play a bigger role in the coming decades as snowpack reduces and air temperatures rise.
Because we observed an increase in d-excess in the stream water during snowmelt for catchments of 85 to over 20 000 km2 in size, d-excess appears to be a robust tracer across a wide range of drainage basin scales. We suggest, however, that transferability of this approach could depend on the share of high-elevation regions in the catchment area that contribute to streamflow, the presence of a d-excess lapse rate in the snowpack, and the absence of large reservoirs upstream from the isotope sampling location. With increasing availability of stable isotope data of mountainous catchments across the globe, future synthesis work could investigate the role of high-elevation snowmelt contributions in headwater regions worldwide.
The HydroMix code by Beria et al. (2019) is available on Zenodo at https://doi.org/10.5281/zenodo.3475429.
The data on East River streamflow (https://doi.org/10.15485/1779721, Carroll et al., 2023); snowpack (https://doi.org/10.15485/1824223, Carroll et al., 2021); and stable isotopes of precipitation, groundwater, and stream water (https://doi.org/10.15485/1668053, Williams et al., 2023) are available online as cited. Snow water equivalent data from the SNOTEL sites are made available by NWCC (2023, https://wcc.sc.egov.usda.gov/reportGenerator/); streamflow and water-stable hydrogen and oxygen isotope data from the Gunnison River near Gunnison and the Colorado River near Cameo are available from the USGS National Water Information System (https://doi.org/10.5066/F7P55KJN, USGS, 2023) database.
The supplement related to this article is available online at: https://doi.org/10.5194/hess-28-1711-2024-supplement.
The paper was written by MS with contributions from all coauthors. MS and HB conducted the mixing model analysis. MS conducted the multiple regression analysis. RWHC, DW, CaB, WB, AN, CuB, and KHW compiled the stable isotope data used for the mixing model and provided critical feedback and insights for the interpretation of the mixing model and linear regression results. All authors reviewed and edited the paper.
The contact author has declared that none of the authors has any competing interests.
Any use of trade, firm, or product names is for descriptive purposes only and does not imply endorsement by the U.S. Government.
Publisher’s note: Copernicus Publications remains neutral with regard to jurisdictional claims made in the text, published maps, institutional affiliations, or any other geographical representation in this paper. While Copernicus Publications makes every effort to include appropriate place names, the final responsibility lies with the authors.
We would like to express appreciation to the Rocky Mountain Biological Laboratory for handling Forest Service permitting. We thank Jarral Ryter from the Western Colorado University Chemistry program for analytical help with cavity ring-down spectroscopy.
This work was supported by the US Department of Energy Office of Science under contract DE-AC02-05CH11231 as part of the Lawrence Berkeley National Laboratory Watershed Function Science Focus Area.
This paper was edited by Markus Hrachowitz and reviewed by James McNamara, Bettina Schaefli, and one anonymous referee.
Bennett, K. E. and Talsma, C.: Concurrent Changes in Extreme Hydroclimate Events in the Colorado River Basin, Water, 13, 978, https://doi.org/10.3390/w13070978, 2021.
Beria, H., Larsen, J. R., Ceperley, N. C., Michelon, A., Vennemann, T., and Schaefli, B.: Understanding snow hydrological processes through the lens of stable water isotopes, Wiley Interdiscip, Rev. Water, 5, e1311, https://doi.org/10.1002/wat2.1311, 2018.
Beria, H., Larsen, J. R., Michelon, A., Ceperley, N. C., and Schaefli, B.: Data for the manuscript “HydroMix v1.0: a new Bayesian mixing framework for attributing uncertain hydrological sources” (Version 1.0), Zenodo [code], https://doi.org/10.5281/zenodo.3475429, 2019.
Beria, H., Larsen, J. R., Michelon, A., Ceperley, N. C., and Schaefli, B.: HydroMix v1.0: a new Bayesian mixing framework for attributing uncertain hydrological sources, Geosci. Model Dev., 13, 2433–2450, https://doi.org/10.5194/gmd-13-2433-2020, 2020.
Bureau of Reclamation: Colorado River Basin Water Supply and Demand Study Executive Summary, Reclam. Manag. Water West, https://www.usbr.gov/watersmart/bsp/docs/finalreport/ColoradoRiver/CRBS_Executive_Summary_FINAL.pdf (last access: 10 April 2024), 2012.
Carroll, R. W. H., Deems, J. S., Niswonger, R., Schumer, R., and Williams, K. H.: The Importance of Interflow to Groundwater Recharge in a Snowmelt-Dominated Headwater Basin, Geophys. Res. Lett., 46, 5899–5908, https://doi.org/10.1029/2019GL082447, 2019.
Carroll, R. W. H., Manning, A. H., Niswonger, R., Marchetti, D., and Williams, K. H.: Baseflow Age Distributions and Depth of Active Groundwater Flow in a Snow-Dominated Mountain Headwater Basin, Water Resour. Res., 56, e2020WR028161, https://doi.org/10.1029/2020WR028161, 2020.
Carroll, R. W. H., Brown, W., Newman, A., Beutler, C., and Williams, K. H.: East River Watershed Stable Water Isotope Data in Precipitation, Snowpack and Snowmelt 2016–2020, ESS-DIVE Repos. [data set], https://doi.org/10.15485/1824223, 2021.
Carroll, R. W. H., Deems, J., Sprenger, M., Maxwell, R., Brown, W., Newman, A., Beutler, C., and Williams, K. H.: Modeling Snow Dynamics and Stable Water Isotopes Across Mountain Landscapes, Geophys. Res. Lett., 49, e2022GL098780, https://doi.org/10.1029/2022GL098780, 2022a.
Carroll, R. W. H., Deems, J., Maxwell, R., Sprenger, M., Brown, W., Newman, A., Beutler, C., Bill, M., Hubbard, S. S., and Williams, K. H.: Variability in observed stable water isotopes in snowpack across a mountainous watershed in Colorado, Hydrol. Process., 36, e14653, https://doi.org/10.1002/hyp.14653, 2022b.
Carroll, R. W. H., Newman, A., Beutler, C., Williams, K., and O'Ryan, D.: Stream discharge and temperature data collected within the East River, Colorado for the Lawrence Berkeley National Laboratory Watershed Function Science Focus Area (water years 2019 to 2022), ESS-DIVE Repos. [data set], https://doi.org/10.15485/1779721, 2023.
Craig, H.: Isotopic variations in meteoric waters, Science, 133, 1702–1703, https://doi.org/10.1126/science.133.3465.1702, 1961a.
Craig, H.: Standard for Reporting Concentrations of Deuterium and Oxygen-18 in Natural Waters, Science, 133, 1833–1834, https://doi.org/10.1126/science.133.3467.1833, 1961b.
Dansgaard, W.: Stable isotopes in precipitation, Tellus, 16, 436–468, https://doi.org/10.1111/j.2153-3490.1964.tb00181.x, 1964.
Dozier, J., Bair, E. H., and Davis, R. E.: Estimating the spatial distribution of snow water equivalent in the world's mountains, WIREs Water, 3, 461–474, https://doi.org/10.1002/wat2.1140, 2016.
Fassnacht, S. R., Dressler, K. A., and Bales, R. C.: Snow water equivalent interpolation for the Colorado River Basin from snow telemetry (SNOTEL) data, Water Resour. Res., 39, 1208, https://doi.org/10.1029/2002WR001512, 2003.
Faybishenko, B., Arora, B., Dwivedi, D., and Brodie, E.: Statistical framework to assess long-term spatio-temporal climate changes: East River mountainous watershed case study, Stoch. Env. Res. Risk A., 37, 1303–1319, https://doi.org/10.1007/s00477-022-02327-7, 2022.
Freudiger, D., Kohn, I., Seibert, J., Stahl, K., and Weiler, M.: Snow redistribution for the hydrological modeling of alpine catchments, Wiley Interdiscip. Rev. Water, 4, e1232, https://doi.org/10.1002/wat2.1232, 2017.
Froehlich, K., Kralik, M., Papesch, W., Rank, D., Scheifinger, H., and Stichler, W.: Deuterium excess in precipitation of Alpine regions – Moisture recycling, Isot. Environ. Health S., 44, 61–70, https://doi.org/10.1080/10256010801887208, 2008.
Gaskill, D. L., Mutschler, F. E., and Kramer, J. H.: Geologic map of the Gothic Quadrangle, Gunnison County, Colorado, https://doi.org/10.3133/gq1689, 1991.
Gat, J. R.: Atmospheric water balance-the isotopic perspective, Hydrol. Process., 14, 1357–1369, https://doi.org/10.1002/1099-1085(20000615)14:8<1357::AID-HYP986>3.0.CO;2-7, 2000.
Hammond, J. C., Sexstone, G. A., Putman, A. L., Barnhart, T. B., Rey, D. M., Driscoll, J. M., Liston, G. E., Rasmussen, K. L., McGrath, D., Fassnacht, S. R., and Kampf, S. K.: High Resolution SnowModel Simulations Reveal Future Elevation-Dependent Snow Loss and Earlier, Flashier Surface Water Input for the Upper Colorado River Basin, Earths Future, 11, e2022EF003092, https://doi.org/10.1029/2022EF003092, 2023.
Hoerling, M., Barsugli, J., Livneh, B., Eischeid, J., Quan, X., and Badger, A.: Causes for the century-long decline in Colorado river flow, J. Climate, 32, 8181–8203, https://doi.org/10.1175/JCLI-D-19-0207.1, 2019.
Hubbard, S. S., Williams, K. H., Agarwal, D., Banfield, J., Beller, H., Bouskill, N., Brodie, E., Carroll, R., Dafflon, B., Dwivedi, D., Falco, N., Faybishenko, B., Maxwell, R., Nico, P., Steefel, C., Steltzer, H., Tokunaga, T., Tran, P. A., Wainwright, H., and Varadharajan, C.: The East River, Colorado, Watershed: A Mountainous Community Testbed for Improving Predictive Understanding of Multiscale Hydrological–Biogeochemical Dynamics, Vadose Zone J., 17, 180061, https://doi.org/10.2136/vzj2018.03.0061, 2018.
Immerzeel, W. W., Lutz, A. F., Andrade, M., Bahl, A., Biemans, H., Bolch, T., Hyde, S., Brumby, S., Davies, B. J., Elmore, A. C., Emmer, A., Feng, M., Fernández, A., Haritashya, U., Kargel, J. S., Koppes, M., Kraaijenbrink, P. D. A., Kulkarni, A. V., Mayewski, P. A., Pacheco, P., Painter, T. H., Pellicciotti, F., Rajaram, H., Rupper, S., Sinisalo, A., Shrestha, A. B., Viviroli, D., Wada, Y., Xiao, C., Yao, T., and Baillie, J. E. M.: Importance and vulnerability of the world ' s water towers, Nature, 577, 364–369, https://doi.org/10.1038/s41586-019-1822-y, 2020.
Kendall, C. and McDonnell, J. J.: Isotope tracers in catchment hydrology, Elsevier, Amsterdam, Netherlands, 839 pp., https://doi.org/10.1016/C2009-0-10239-8, 1998.
Lambán, L. J., Jódar, J., Custodio, E., Soler, A., Sapriza, G., and Soto, R.: Isotopic and hydrogeochemical characterization of high-altitude karst aquifers in complex geological settings. The Ordesa and Monte Perdido National Park (Northern Spain) case study, Sci. Total Environ., 506–507, 466–479, https://doi.org/10.1016/j.scitotenv.2014.11.030, 2015.
Le, E., Ameli, A., Janssen, J., and Hammond, J.: Snow Persistence Explains Stream High Flow and Low Flow Signatures with Differing Relationships by Aridity and Climatic Seasonality, Hydrol. Earth Syst. Sci. Discuss. [preprint], https://doi.org/10.5194/hess-2022-106, 2022.
Marchetti, D. W. and Marchetti, S. B.: Stable isotope compositions of precipitation from Gunnison, Colorado 2007–2016: implications for the climatology of a high-elevation valley, Heliyon, 5, e02120, https://doi.org/10.1016/j.heliyon.2019.e02120, 2019.
Musselman, K. N., Addor, N., Vano, J. A., and Molotch, N. P.: Winter melt trends portend widespread declines in snow water resources, Nat. Clim. Change, 11, 418–424, https://doi.org/10.1038/s41558-021-01014-9, 2021.
National Water and Climate Center (NWCC): SNOTEL, https://wcc.sc.egov.usda.gov/reportGenerator/ (last access: 8 June 2023), 2023.
Painter, T. H., Berisford, D. F., Boardman, J. W., Bormann, K. J., Deems, J. S., Gehrke, F., Hedrick, A., Joyce, M., Laidlaw, R., Marks, D., Mattmann, C., McGurk, B., Ramirez, P., Richardson, M., Skiles, S. M. K., Seidel, F. C., and Winstral, A.: The Airborne Snow Observatory: Fusion of scanning lidar, imaging spectrometer, and physically-based modeling for mapping snow water equivalent and snow albedo, Remote Sens. Environ., 184, 139–152, https://doi.org/10.1016/j.rse.2016.06.018, 2016.
Rodhe, A.: Spring Flood Meltwater or Groundwater?: Paper presented at the Nordic Hydrological Conference (Vemdalen, Sweden, August, 1980), Hydrol. Res., 12, 21–30, https://doi.org/10.2166/nh.1981.0002, 1981.
Rolle, J.: Determining Spatial Controls on Snow Isotopic Signature and Tracing the Snowmelt Pulse as it Moves Through Two Montane Catchments, Graduate Student Thesis, The University Of Montana, https://scholarworks.umt.edu/etd/11940 (last access: 8 April 2024), 2022.
Schneider, D. and Molotch, N. P.: Real-time estimation of snow water equivalent in the Upper Colorado River Basin using MODIS-based SWE Reconstructions and SNOTEL data, Water Resour. Res., 52, 7892–7910, https://doi.org/10.1002/2016WR019067, 2016.
Siirila-Woodburn, E. R., Rhoades, A. M., Szinai, J., Tague, C., Nico, P. S., and Huning, L. S.: A low-to-no snow future and its impacts on water resources in the western United States, Nat. Rev. Earth Environ., 2, 800–819, https://doi.org/10.1038/s43017-021-00219-y, 2021.
Sprenger, M., Carroll, R. W. H., Dennedy-frank, J., Siirila-woodburn, E. R., Newcomer, M. E., Brown, W., and Williams, K. H.: Variability of Snow and Rainfall Partitioning Into Evapotranspiration and Summer Runoff Across Nine Mountainous Catchments, Geophys. Res. Lett., 49, e2022GL099324, https://doi.org/10.1029/2022GL099324, 2022.
Stichler, W., Schotterer, U., Fröhlich, K., Ginot, P., Kull, C., Gäggeler, H., and Pouyaud, B.: Influence of sublimation on stable isotope records recovered from high-altitude glaciers in the tropical Andes, J. Geophys. Res.-Atmos., 106, 22613–22620, https://doi.org/10.1029/2001JD900179, 2001.
Stock, B. C., Jackson, A. L., Ward, E. J., Parnell, A. C., Phillips, D. L., and Semmens, B. X.: Analyzing mixing systems using a new generation of Bayesian tracer mixing models, PeerJ, 6, e5096, https://doi.org/10.7717/peerj.5096, 2018.
Tague, C. and Grant, G. E.: Groundwater dynamics mediate low-flow response to global warming in snow-dominated alpine regions, Water Resour. Res., 45, W07421, https://doi.org/10.1029/2008WR007179, 2009.
Tappa, D. J., Kohn, M. J., McNamara, J. P., Benner, S. G., and Flores, A. N.: Isotopic composition of precipitation in a topographically steep, seasonally snow-dominated watershed and implications of variations from the Global Meteoric Water Line, Hydrol. Process., 30, 4582–4592, https://doi.org/10.1002/hyp.10940, 2016.
USGS: USGS Water Data for the Nation, USGS [data set], https://doi.org/10.5066/F7P55KJN, 2023.
Wahl, S., Steen-Larsen, H. C., Reuder, J., and Hörhold, M.: Quantifying the Stable Water Isotopologue Exchange Between the Snow Surface and Lower Atmosphere by Direct Flux Measurements, J. Geophys. Res.-Atmos., 126, e2020JD034400, https://doi.org/10.1029/2020JD034400, 2021.
Webb, R. W., Musselman, K. N., Ciafone, S., Hale, K. E., and Molotch, N. P.: Extending the vadose zone: Characterizing the role of snow for liquid water storage and transmission in streamflow generation, Hydrol. Process., 36, e14541, https://doi.org/10.1002/hyp.14541, 2022.
Williams, K. H., Beutler, C. A., Bill, M., Brown, W., Newman, A. W., and Versteeg, R.: Stable Water Isotope Data for the East River Watershed, Colorado (2014–2023), ESS-DIVE Repos. [data set], https://doi.org/10.15485/1668053, 2023.
Xing, M., Liu, W., Hu, J., and Wang, Z.: A set of methods to evaluate the below-cloud evaporation effect on local precipitation isotopic composition: a case study for Xi'an, China, Atmos. Chem. Phys., 23, 9123–9136, https://doi.org/10.5194/acp-23-9123-2023, 2023.