the Creative Commons Attribution 4.0 License.
the Creative Commons Attribution 4.0 License.
 | 11 Apr 2024
Increasing seasonal variation in the extent of rivers and lakes from 1984 to 2022
Roger Sayre
Elco Luijendijk
Knowledge of the spatial and temporal distribution of surface water is important for water resource management, flood risk assessment, monitoring ecosystem health, constraining estimates of biogeochemical cycles and understanding our climate. While global-scale spatiotemporal change detection of surface water has significantly improved in recent years due to planetary-scale remote sensing and computing, it has remained challenging to distinguish the changing characteristics of rivers and lakes. Here we analyze the spatial extent of permanent and seasonal rivers and lakes globally over the past 38 years based on new data of river system extents and surface water trends. Results show that while the total permanent surface area of both rivers and lakes has remained relatively constant, the areas with intermittent seasonal coverage have increased by 12 % and 27 % for rivers and lakes, respectively. The increase is statistically significant in over 84 % of global water catchments based on Spearman's rank correlations (rho) above 0.05 and p values less than 0.05. The seasonal river extent is nearly 32 % larger than the previously observed annual mean river extent, suggesting large seasonal variations that impact not only ecosystem health but also estimations of terrestrial biogeochemical cycles of carbon. The outcomes of our analysis are shared as the Surface Area of Rivers and Lakes (SARL) database, serving as a valuable resource for monitoring and research of hydrological cycles, ecosystem accounting, and water management.
- Article
(5891 KB) - Full-text XML
-
Supplement
(1715 KB) - BibTeX
- EndNote


Climate change and population growth have placed considerable stress on our natural freshwater resources. Water demand has increased nearly 8-fold over the past century, with an estimated 70 % of the total used to meet irrigation needs (Siebert et al., 2010; Wada et al., 2016). To meet the increasing water demand, an estimated 1.67×10⁷ reservoirs have been built (Lehner et al., 2011) with the largest 24 783 dams holding a predicted 7384 km3 of fresh water (Wang et al., 2022). Current water demand represents only 10 % of our approximate annual renewable freshwater resources (Oki and Kanae, 2006). Nonetheless, water scarcity remains a significant problem around the world due to the variability in water in time and space (Oki and Kanae, 2006; Mekonnen et al., 2016). The hydrological cycle is also crucial to the health of our ecosystems and biodiversity that depend on the recurrence and seasonality of water to support life (Gleeson et al., 2020). Furthermore, inland waters are also an important component in biogeochemical cycles of CO2 and methane that, by size, disproportionately contribute a significant portion of gases to our total greenhouse emissions annually (Bastviken et al., 2004; Allen and Pavelsky, 2018; Matthews et al., 2020).
While the surface area of water is only one part of the hydrological cycle, it is the most accessible portion influencing human and ecosystem behavior and an important component in groundwater recharge (Oki and Kanae, 2006; Siebert et al., 2010; Gleeson et al., 2020). Knowledge of the type of water body, i.e., whether it is permanent, intermittent or seasonal and whether it is part of a river system or a lake, is important to understand the role of water bodies in different hydrological processes, ecosystem support and biogeochemical cycles. The changing physical environment and its water body type due to droughts, floods or direct human alteration also alters migration patterns of humans, ecosystems and biodiversity (Neumann et al., 2015; Van Loon et al., 2016). In addition, the perennial and seasonal state of both rivers and lakes has important implications for ecosystem health (Messager et al., 2021) and carbon cycles (Keller et al., 2020). Knowledge of the type, extent and seasonality of water bodies at a global basin scale is needed for improved water resource management and sustained delivery of ecosystem services (Sheffield et al., 2018).
Planetary-scale computing and analysis of remotely sensed imagery have led to a number of studies revealing the unprecedented impact of human resource management and climate change stress on the extent of water (Van Dijk et al., 2011; Wada et al., 2016; Pekel et al., 2016a; Donchyts et al., 2016). In particular, significant advancements have been made in identifying and quantifying the historical change in global reservoirs at a 0.01 to 100 km2 resolution (Donchyts et al., 2022). In addition, the temporal analysis of lake extents has been examined up to 50° N at a 0.1 km2 resolution (Khandelwal et al., 2022). Identification of natural lakes in high-latitude regions has not been analyzed within a global water surface change context.
Far fewer studies have analyzed the change in river extents. Allen and Pavelsky (2018) mapped the observed global surface area of rivers but only for a specific year and at mean annual water discharge. More recently, Feng et al. (2022) quantified the temporal variability in global river widths over the past 37 years based on 30 m Landsat imagery. However, this study neither maps the changing surface area of rivers nor provides measurements at the confluence and divergence of rivers common in the anabranching and braided systems that comprise an estimated 52 % of global rivers (Nyberg et al., 2023a). As a result, a significant knowledge gap remains in the temporal variability in river surface area and its interaction with lakes and reservoirs. The aim of this paper is to assess the utility of a new global river extent dataset (Nyberg et al., 2023a) in mapping the historical change in water surface area for rivers and lakes over the past 38 years and to examine the implications for water resource management, ecosystem health and biogeochemical cycles.
2.1 Water surface area classification
To classify the permanent and seasonal extent of lakes and rivers, we utilize existing datasets describing the surface area of water combined with a new and improved definition of river extents on a global scale. Our analysis is based on the Global Surface Water (GSW) version 1.4 by Pekel et al. (2016b), which describes the permanent and seasonal extent of open water from 1984 to 2022 based on 30 m Landsat imagery. Permanent surface area of water is defined as locations where open water is detected for all 12 months of a given year (or 100 % of valid pixels). Seasonal surface water is defined as any pixel location with at least 1 month during which water was detected. The authors report less than 1 % of false positive open-water classifications and less than 5 % of missed open-water classifications based on 40 000 randomly selected points.
Defining the spatial extent of rivers is challenging given the dynamic nature of rivers, varying morphology and the perennial versus non-perennial character of rivers. We used a dataset produced by Nyberg et al. (2022) that quantified the global extent of river channel belts (GCBs) at a 30 m Landsat imagery resolution using a machine-learning method that spatially delineates channel belt areas based on geomorphological features. In this dataset, the river channel belt extents show the riverine landforms of the river channel and their associated levees, bars and overbank deposits that, therefore, capture the evolution of the riverine environment over time (Fig. 1). The model reports a confidence value ranging from 0 % to 100 %, where a 0 % confidence value indicates a non-riverine environment, but a 100 % confidence value indicates a riverine environment for a given pixel location. The model used by Nyberg et al. (2023a) reports 94 % accuracy of the validation dataset for channel belts wider than 1 km.

Figure 1Example permanent and seasonal water extent of rivers and lakes – (a) Landsat 8 imagery for 2020 with overlaid delineations of the maximum channel belt extent in white based on the GCB dataset (Nyberg, 2022; Nyberg et al., 2023a). Any pixel outside the channel belt is defined as lacustrine, wetland or floodplain. (b) Permanent and seasonal extent of rivers and lakes for the year 2020 based on the new Surface Area of Rivers and Lakes (SARL) database. Landsat 8 imagery courtesy of the U.S. Geological Survey.
To improve delineations of river channel belt extent, we refine the classification of Nyberg et al. (2023a) using GCB pixels with reported confidence of 10 % or higher and 50 % confidence above 60° N. This step was chosen to constrain rivers without distinct channel belts in high-latitude regions (e.g., the Canadian Shield or Siberian Plateau), given that most sedimentary basins with clearly defined channel belts occur around mid- to low-latitude regions (Nyberg and Howell, 2015). In addition, previous databases of large lakes and reservoirs (∼ > 10 km2) defined by the HydroLAKES (Messager et al., 2016) and OpenStreetMap contributors (2022) datasets are included to further improve delineations. This step was achieved by converting the vector lacustrine databases to rasters at the same 30 m resolution of the GCB delineation to remove the misclassified pixels. The inclusion of the lacustrine databases reduced the global channel belt extent by 1.86 % or 13.4 × 10⁴ km2 .
Finally, the seaward extent of the SARL database is based on the global shoreline vector (GSV) dataset by Sayre et al. (2019). This classification represents an image-derived instantaneous shoreline position for the year 2014 captured between a low- and high-tide classification. This step is necessary to remove the sea pixels from the resulting lacustrine or riverine classification. Depending on the tidal range for a particular region and available Landsat images, this may result in a lower or higher riverine and lacustrine extent, which may impact our subsequent statistical analyses. However, the GSV dataset provides a global 30 m resolution shoreline classification, creating a consistent definition of the shoreline that is needed for the SARL database.
By combining the GCB and GSW datasets, we produce a new global dataset mapping the historical change in the seasonal and permanent water surface area of lakes and rivers (SARL) from 1984 to 2022. The seasonal extent of water within the channel belt shows rivers at bank full or larger flood events with inundation persisting for at least 1 month. Water bodies outside the channel belt are defined as a lake or wetland region (Fig. 1). The processing is completed on the Google Earth Engine platform (Gorelick et al., 2017), resulting in a global database of the seasonal and permanent surface area of rivers and lakes from 1984 to 2022 at a 30 m Landsat resolution.
2.2 Temporal water surface area analysis
Following the mapping of the SARL database, we analyze the data by aggregating results on drainage catchments derived from the HydroSHEDS level 5 catchment dataset (Lehner et al., 2008). Considering that satellite imagery is not available for certain years due to non-acquisition or excessive cloud cover, it is important to consider missing values in the time series of surface water observations. Pekel et al. (2016a) define the location of missing values for each year in the GSW database but do not identify the water body type or seasonality of those missing values. To rectify this omission, we take the averaged ratio between seasonal to permanent water body extent for each water body type (lake, river and no water) between 2015 and 2017 within each catchment as a baseline, given there are no reported missing values during those years. While this approach does not account for the changing seasonal to permanent water ratios or water body type over time, it does provide an approximation that allows for the analysis of water trends in situations where a few missing values (< 5 %) are reported in a much larger catchment region. This method was preferred over a long-term pixel average and interpolation given that earlier Landsat acquisitions have a lower temporal resolution, and therefore seasonal changes can be interpreted less reliably, which may result in skewed ratios of seasonal to permanent rivers and lakes.
Subsequently, for each catchment, the permanent and seasonal water extent for each time period without satellite data is calculated proportional to the number of missing values and the known ratio of seasonal to permanent extent in Eq. (1).
where pArea is the permanent surface area, sArea is the seasonal surface area, pO is the observed permanent surface area, sO is the observed seasonal surface area, nD is the area of no data values for the entire catchment, k is the seasonal to permanent surface area ratio and p is the total area of the water pixels (e.g., observed + missing values).
Equation (1) is processed separately for rivers and lakes and only assigned to catchments where less than 5 % of the data are missing for any given year, water body type and seasonality. For years with more than 5 % of missing values, the first year with valid observations for any given catchment is used. This creates an accompanying dataset showing the absolute change, percentage change and annual percentage change in surface area of water bodies for each catchment from 1984 to 2022 (see “Data availability” section for the interactive map and Fig. S1 in the Supplement).
To statistically analyze trends in the surface area of rivers and lakes by catchment, we perform Spearman's rank correlations (Spearman, 1987). This correlation measures the monotonicity of the relationship between two parameters, in this case the surface area of the water body extent versus time. This measure is ideal considering water body extent often does not have a linear relationship with time, given the interannual variability. To perform this analysis, we limit our analyses to catchments with more than 10 years of results, at least 1 km2 of detected water surface area and 95 % data coverage for each year. Statistically significant trends are defined by p values less than 0.05 or 5 %. In total, the analysis captures between 1172 and 1493 watersheds (or 34 % to 41 % of the global watersheds with water occurrence), depending on the seasonal versus permanent or river versus lake analysis performed.
2.3 Validation
To validate and assess the accuracy of the SARL dataset over the 38 years of available water surface data, we compare the results to the manually interpreted extent of river channel belt and lake environments for the year 2022. In total, 50 locations (see Fig. S2) measuring 50 km2 were randomly selected (excluding Greenland and Antarctica) to manually map the river channel belt extent using 30 m Landsat 8 imagery. The Landsat imagery corresponds to the same spatial resolution and year of acquisition as the GCB dataset defined by Nyberg et al. (2023a) that is used in the current model to define the global channel belt extent (Sect. 2.1). Manual delineation of the channel belt is defined as encompassing the region of the active river and its associated bars, over-bank deposits and abandoned channels (Nyberg et al., 2023a) to show the maximum geomorphologically observed extent of the river system through time.
Following the proposed automated method to classify the current SARL database (e.g., Fig. 1), water bodies defined within the manually defined 2020 channel belt extent are classified as riverine, whereas all other surface water bodies are defined as lacustrine. Seasonal and permanent water body extents for both rivers and lakes are then extracted based on the GSW model (Pekel et al., 2016b). The manual river channel belt delineation is subsequently used to compare to the accuracy of the automated delineation in capturing the permanent and seasonal water extent of the GSW dataset from 1984 to 2022 (see Table S2). While the GCB dataset and manual delineation for validation are only available for the year 2022, the channel belt represents the lateral migration of a river's course through time (Nyberg et al., 2023a), thus capturing the extent of the river system throughout multiple years. Hence, the method provides a baseline assessment for the accuracy of the automated method in capturing the natural variability in seasonal and permanent water extent through time.
3.1 Total water surface extent
The permanent surface area of rivers has remained relatively steady over the past 38 years, increasing slightly (by 1.1 %) to a total area of 2.9 × 10⁵ km2 (Fig. 2). In contrast, the observed seasonal extent of rivers has increased more significantly (by 12 %) with a total area of 3.2 × 10⁵ km2 by 2022. The yearly percentage of seasonal to permanent river water extent ranges from 88 % to 119 %, increasing towards the end of 2022. Similarly, the spatial extent of permanent lake surface area has increased by less than 1 % since 1984 to a total area of 24.2 × 10⁵ km2 (Fig. 2). The seasonal extent of lakes has, however, increased significantly (by as much as 27 % since 1984) to a total area of 7.2 × 10⁵ km2. The ratio of seasonal to permanent water extent in lakes is considerably lower than that of rivers and ranges between 23 %–31 % over the same period.
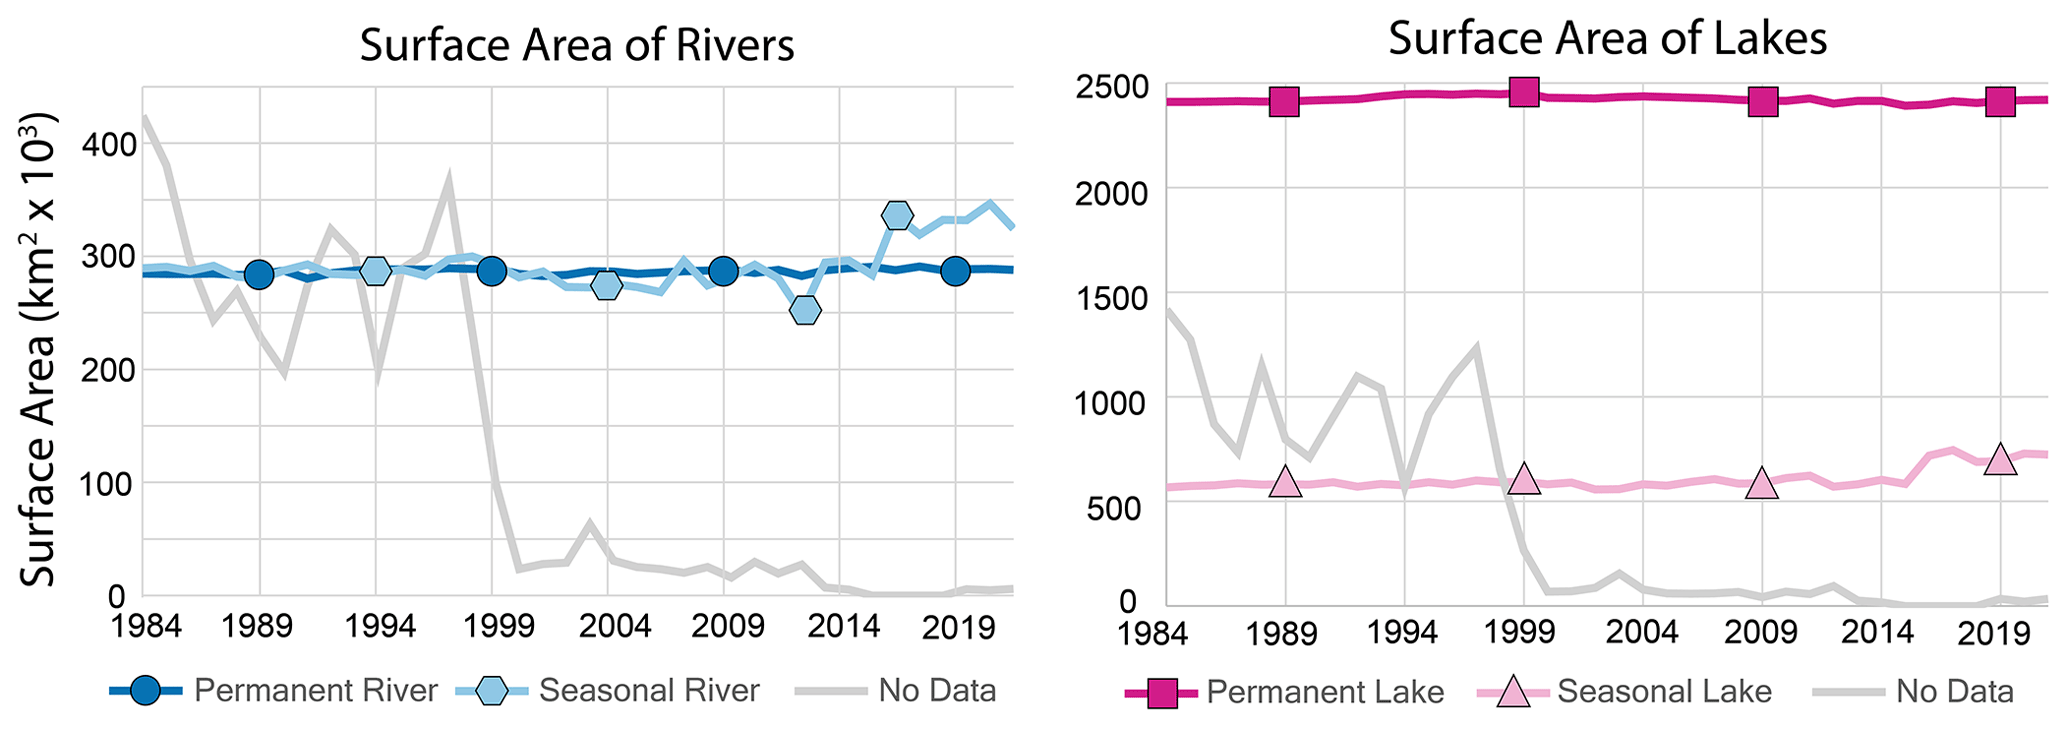
Figure 2Global water surface area summary – graphs show the temporal variability in permanent and seasonal water extent of rivers and lakes by year.
The spatial trends in the total water surface area change from the first observation until the year 2022 are often similar for rivers and lakes. Here we see that regions of the Basin and Range in the United States, southern South America and Patagonia, southern Africa, central Asia, and central Australia show a decrease in water body extent. In contrast, significant regions around the Equator show increased water body extent including Brazil, central Africa and Oceania. In addition, the northern-latitude Canadian Shield and Siberian Plateau, as well as the Himalayas, Europe, China, southeast Asia and India, to name a few locations, show increasing water trends. Lastly, no water observations are most commonly found in desert regions of the northern African Sahara, southwestern Africa, western Australia and the Arabian Peninsula, as well as glacier-covered northern regions of Nunavut and Greenland. It is crucial to emphasize that Fig. 3 presents a comparison between only two time periods and may be skewed by variation over time with a shorter interval than the two time periods. We address this point later in Sect. 3.2 through Spearman's correlation analyses of water surface area trends over time.
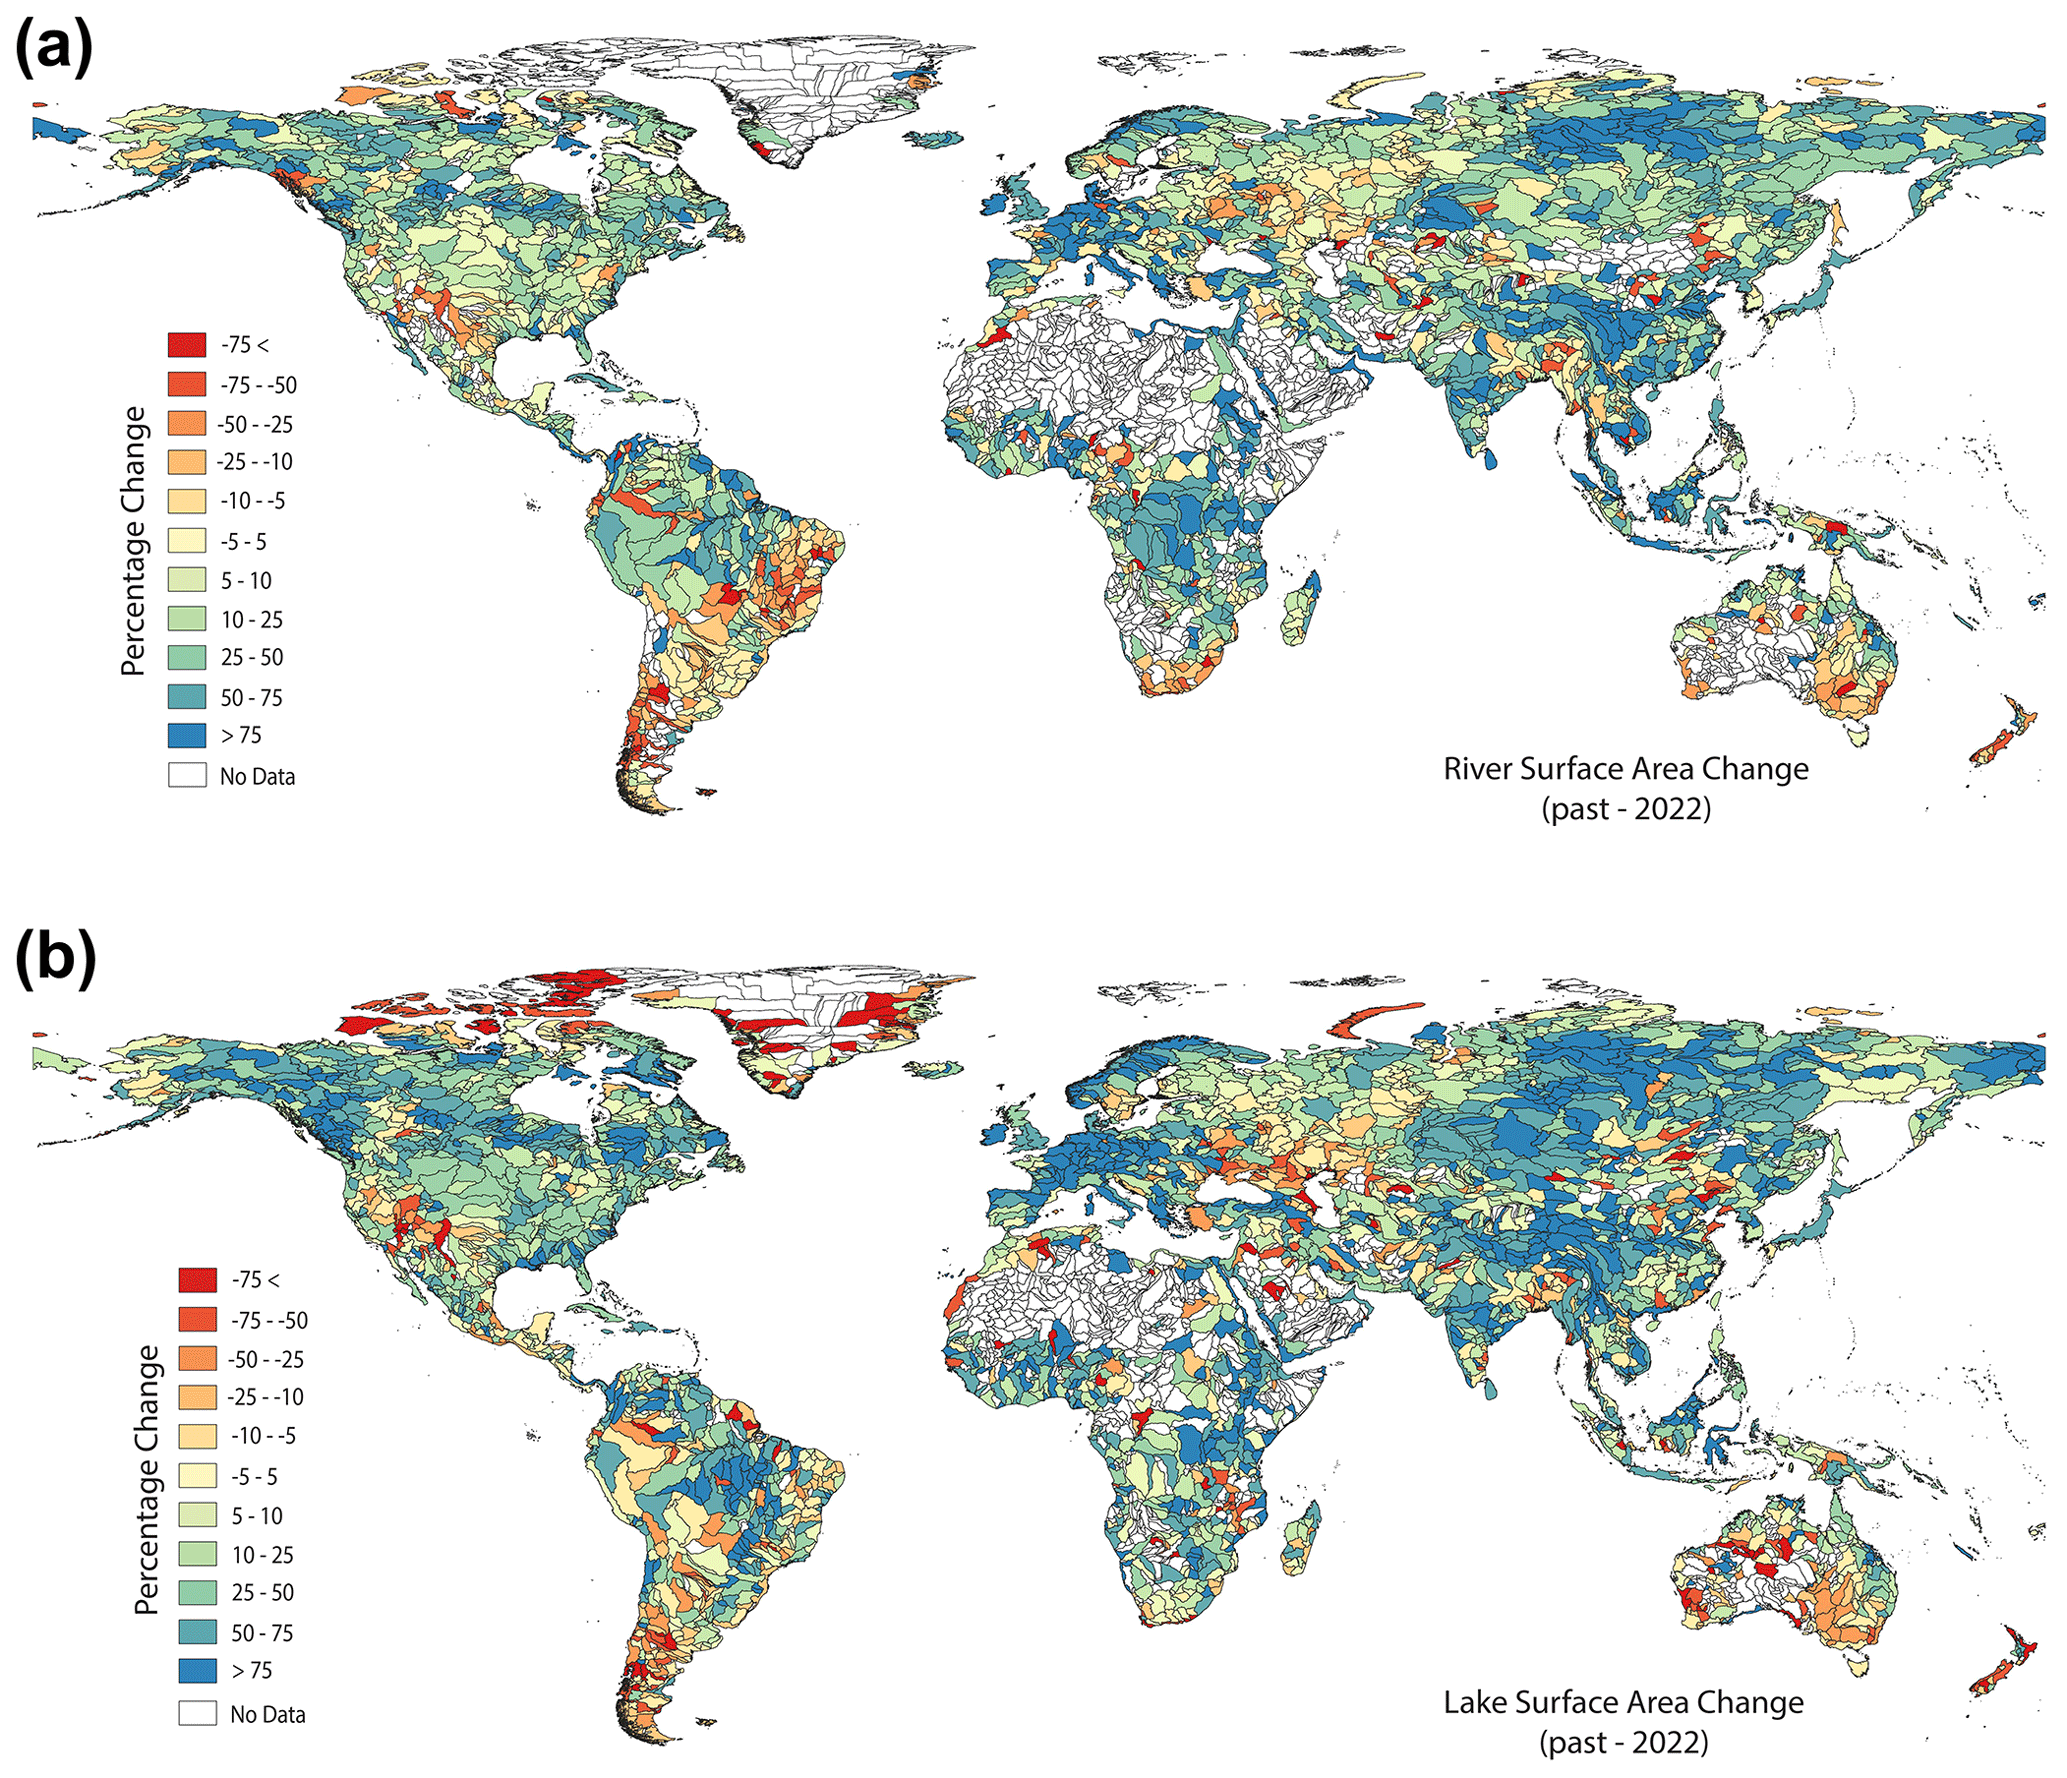
Figure 3Global total water surface area change – the global total surface water area of permanent and seasonal extent of rivers (a) and lakes (b) based on the difference between the first recorded observation and 2022. See Fig. S3 for percentage change by permanent and seasonal river and lake levels.
3.2 Annual water surface area trends
Figure 4 shows trends in permanent versus seasonal water surface area of rivers and lakes from 1984 to 2022 based on Spearman's rank correlations (rho). Permanent river and lake extents show a relative normal distribution in Spearman's correlations, indicating that the permanent extents of rivers and lakes have experienced both decreases and increases in surface water area. In total, 47 % and of catchments exhibit statistical changes in the permanent surface area of rivers (Fig. 4a) and 54 % exhibit changes in lakes (Fig. 4c). Out of all catchments with statistically significant changes, 62 % and 55 % of catchments have a positive increase in permanent water surface area of rivers and lakes, respectively. In comparison, the seasonal extent of rivers and lakes is strongly positive, indicating an overall increased seasonality, with 42 % and 49 % of catchments showing a significant change for rivers and lakes, respectively (Fig. 4b and d). Out of all catchments with statistically significant changes, 84 % and 90 % of catchments have a positive increase in seasonal water surface area extent for rivers and lakes, respectively.

Figure 4Spearman's rank correlations of catchments with statistically significant change in permanent (a, c) and seasonal (b, d) water surface area from 1984 to 2020 for rivers and lakes. Spearman's rank correlations (rho) are shown ranging from −1 (red) to 1 (blue), where no correlation (light gray) indicates no statistically significant change. The histogram for each map shows the Spearman's correlations with the line indicating the distribution of the statistically significant samples (n>9). See Fig. S4 for the entire Spearman's correlation dataset.
3.3 Accuracy
Overall, the SARL dataset showed a 93.8 % accuracy compared to the manual delineation of the channel belt extents for the calculation of permanent and seasonal lake coverage over the 38-year period, as summarized in Fig. 5. The permanent extent of lakes is the most consistent and has the highest accuracy, ranging between 96.7 % and 98.5 %. The accuracy of the permanent river extent is lower and ranges from 94.3 % to 97.5 %. Finally, both seasonal river and seasonal lake water bodies show, on average, an accuracy over 90 % but are also the most variable, reflecting the variability in yearly water extent. The accuracy of the seasonal rivers are slightly higher, ranging from 87 % to 95 %, whereas seasonal lakes have the lowest reported accuracy, between 85 % and 95 %.
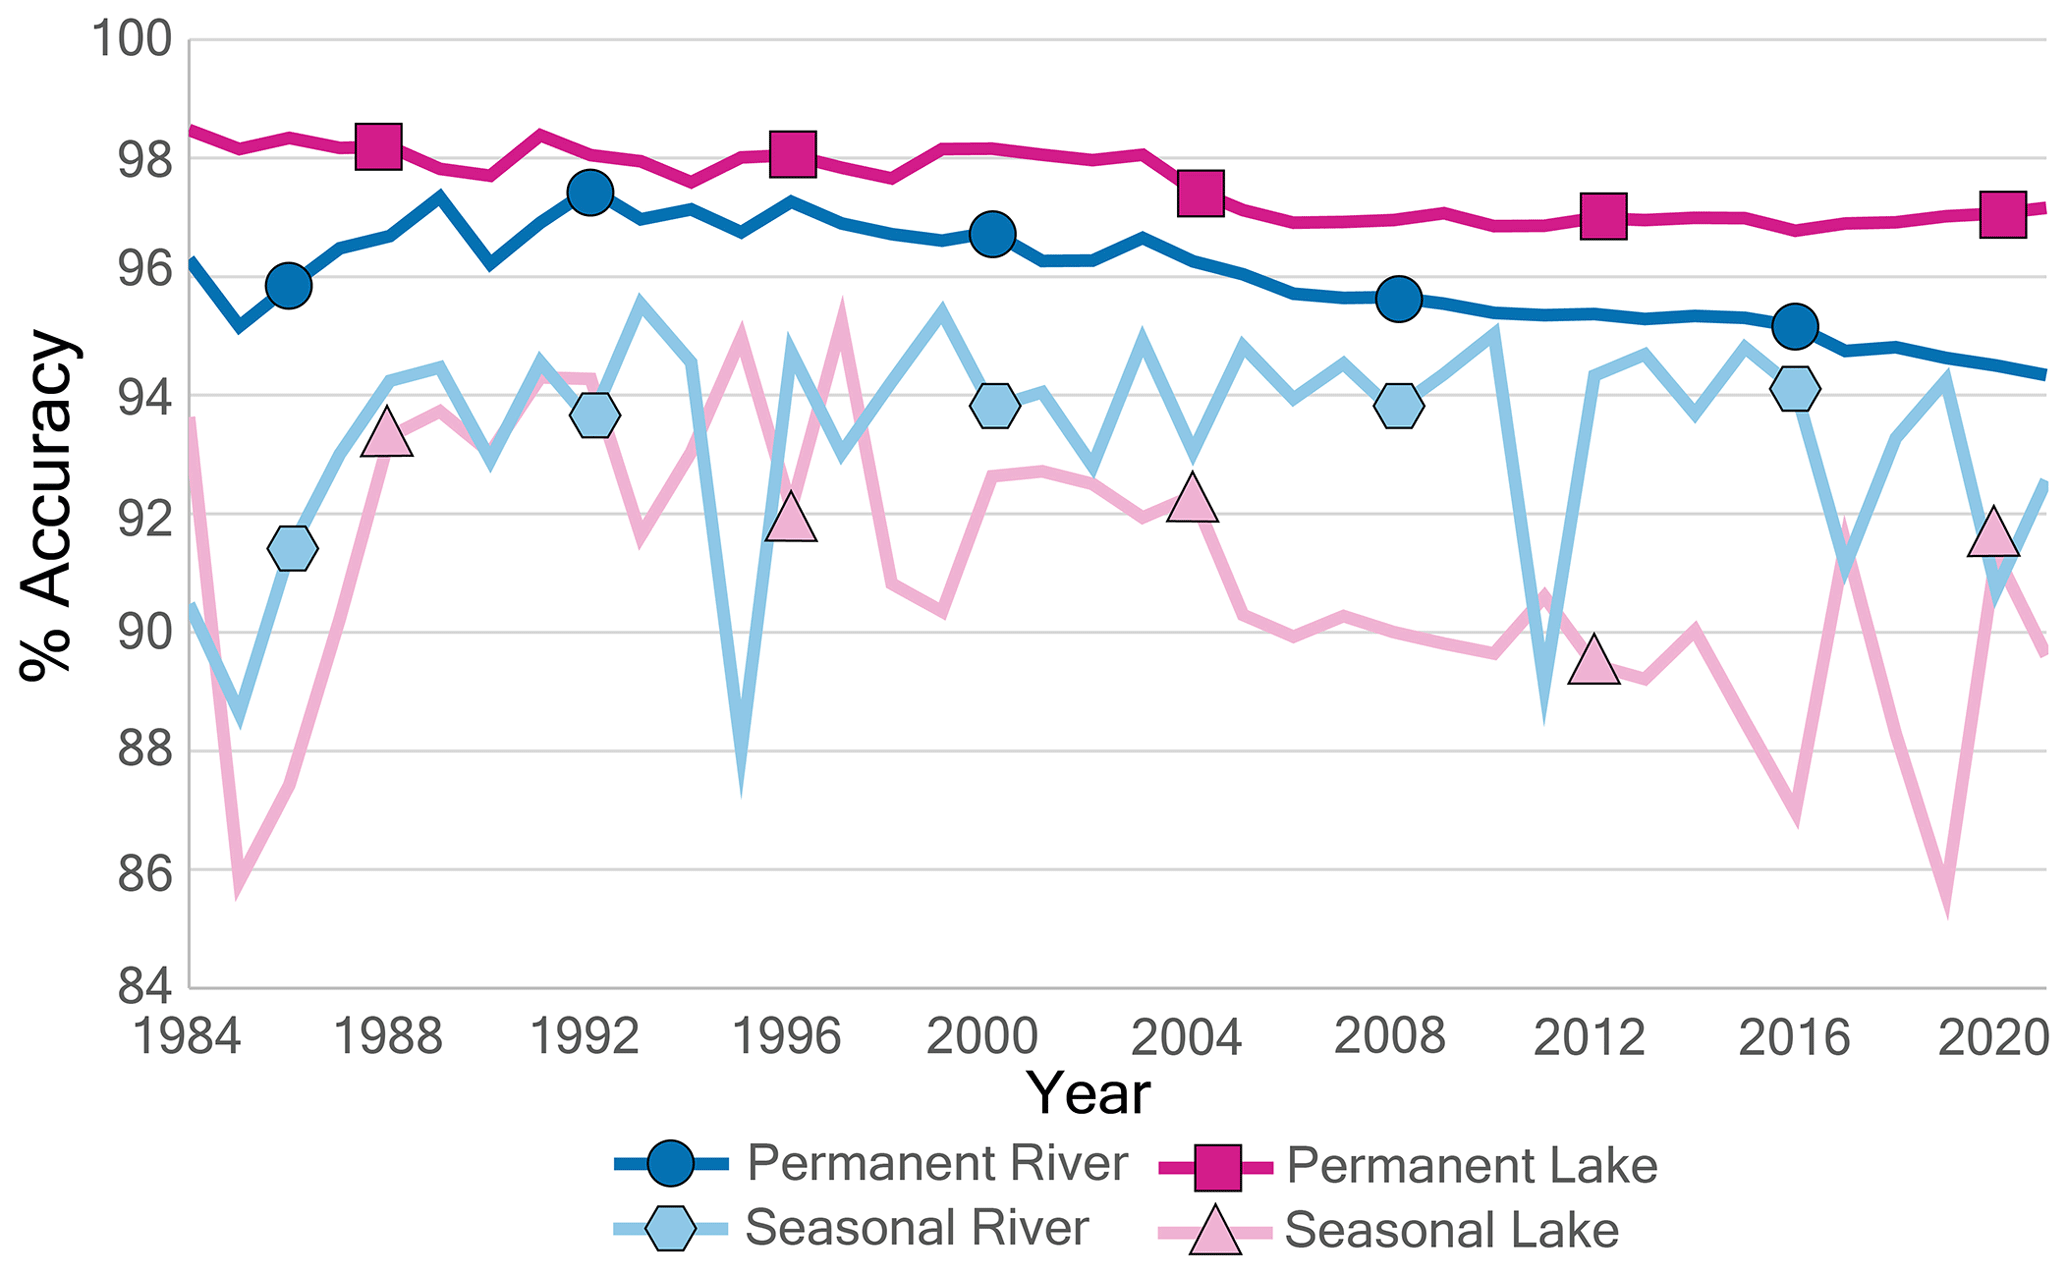
Figure 5Temporal accuracy of the SARL database – overall accuracy of the SARL database for seasonal and permanent water extent of lakes and rivers.
4.1 Global surface water trends
Global observations of surface water extent are important to regulate and manage water at a basin scale for a range of different sectors, including agriculture, ecosystems, forestry, energy, water supply, environment protection, flood and drought control, irrigation, wastewater treatment, governance, and policy, to name a few (Garcia and You, 2016; Sheffield et al., 2018). In particular, the data are important to understand the impacts of the hydrological extremes of droughts and floods on the short- and long-term trends in water allocation and management. The distinction between rivers and lakes is important to understand the storage and transfer of water that impact different sectors and to predict the future impacts of human and climate-change stressors.
The permanent versus seasonal extent of water is also important to quantify pressures on water resources. In many circumstances, the permanent extent of rivers and lakes has decreased over the past ∼ 4 decades of observations (38 % and 45 % of watersheds, respectively) and has been replaced by an increased seasonality (60 % and 77 %, respectively; Fig. 4; Pekel et al., 2016a; Donchyts et al., 2016). A change in seasonal surface water of rivers from perennial to seasonal directly impacts groundwater recharge and the resulting water table level (Gleeson et al., 2020). For instance, regions of central Australia, the Caspian Sea, the Aral Sea, the western United States and southern Africa have seen a statistical decrease in permanent water of both rivers and lakes (Fig. 4) that is related to well-documented droughts and anthropogenic stresses (Micklin, 2007; Van Loon et al., 2016; Mekonnen et al., 2016). There are also rivers that have experienced relatively stable permanent river water levels while also showing a decrease in annual seasonal flooding, e.g., the Ob River in Siberia (Zemtsov, 2019).
On the other extreme, the Brahmaputra River in Bangladesh and India shows stable permanent water levels with an increased seasonal extent (Figs. 2 and 4) that correlates with increased intensity of river discharge during monsoonal seasons due to increasing Southern Oscillation Index extremes (Mirza, 2011). In other natural river systems, like the lower Amazon basin, we see a slight statistically significant increase in the water surface area of rivers over the past 3 decades (Fig. 4). The Amazon water catchment, as one of the least human-modified river systems globally (Grill et al., 2019), has increased water levels due to strengthening of the Walker circulation (Barichivich et al., 2018). An increase in permanent water surface area for both rivers and lakes is particularly noticeable in central Asia and the Tibetan Plateau as well, which has been associated with the acceleration of glacial melting and precipitation (Song et al., 2014). Furthermore, seasonal water expansion in Siberia can be related to increased thawing of permafrost lakes in summer months (Matthews et al., 2020). Lastly, reservoir expansion, particularly around the Indian subcontinent, eastern Brazil and China, contributes to the increased water surface area of lakes (Donchyts et al., 2022). In summary, the statistically increasing permanent extent of rivers and lakes accounts for 62 % and 55 % of watersheds, respectively (Fig. 4), and they often show a constant or increasing seasonal extent as well (rho > −0.05; 78 % and 88 %, respectively), suggesting larger water bodies through time.
4.2 Ecosystem health
Understanding temporal and spatial changes in rivers and lakes is key to the study of animal migrations and community dynamics in and around lotic and lentic environments (Ngor et al., 2018). The availability of spawning pathways from the ocean to permanent mainstem rivers and from lakes to permanent or seasonal tributary streams and lakes is a function of water presence and quality (Briggs et al., 2018). Site selection of preferred habitat for feeding and nutrients by aquatic organisms will also depend on whether or not water is present at candidate locations (Power et al., 2008). In general, riverine and lacustrine animals move in response to changing water extents, so the ability to determine or predict the occurrence of water in global rivers and lakes is a powerful capability.
The ability to couple the area of river and stream surface water with adjacent in-channel terrestrial area supports increased understanding of freshwater microhabitats and freshwater biotic interactions. For example, while fish are obviously restricted to in-water lotic microhabitats like riffles, pools and runs (the locations of which also change spatially and temporally with changing surface water extent), amphibians and certain terrestrial invertebrates regularly move between water and adjacent in-channel dry land (Lowe, 2009). Conceptualizing and delineating freshwater ecosystems as only containing water is therefore under-representative of the area of occupancy and use by many freshwater aquatic organisms.
Certain areas in the aqueous stream channel are utilized as flow refugia (Lancaster and Hildrew, 1993; Sakai et al., 2021) or refugia from adverse stream acidification episodes (Baker et al., 1996) during discharge events. The availability of flow refugia is a function of riverine surface water seasonality (Lancaster and Hildrew, 1993). Clearly, the ability to define the riverine environment as not just the water but also the larger area within the channel belt and then to be able to distinguish between water and adjacent dryland spatially and temporally within that riverine ecosystem will advance understanding of the distribution and behavior of aquatic organisms in seasonally changing environments. Moreover, current biodiversity models often overlook the importance of terrestrial and aquatic ecosystems in non-perennial systems (Messager et al., 2021). The current datasets may help to narrow this knowledge gap.
Delineation of channel belt areas as geomorphologically derived riverine environments also has potential for addressing the “linearity” challenge when delineating global freshwater ecosystems and habitats. For certain applications like ecosystem conservation status reporting (such as is required by the UN Convention on Biological Diversity) and ecosystem accounting (such as is characterized in the guidance from the UN's System for Environmental and Economic Accounting), area-based measures of ecosystem extent are needed (Unites Nations, 2021). Except for very large rivers, however, river features are nearly always represented spatially as vector networks, where the spatial entity for a river reach is a line segment. The segments may have an attribute for river width, but regardless, the spatial entities representing river reaches are generally not area-based, and including freshwater ecosystems in area-based assessments is challenging. As such, there may be value in using the Global Channel Belt resource for spatial delineation of global freshwater ecosystems, which would permit area-based assessments of their condition.
4.3 Biogeochemical cycles
Existing observations of river surface area at a 30 m global resolution suggest an area of 4.6 × 10⁵ km at mean annual water level (Allen and Pavelsky, 2018). However, our current study at the same 30 m resolution suggests that the permanent extent of rivers is considerably lower, 2.9 × 10⁵ km2 or 37 % less (Fig. 2). On the other hand, the seasonal extent of rivers may contribute another 3.2 × 10⁵ km2, for a total area of 6.1 × 10⁵ km2 or an area approximately 32 % larger than the previous observed estimate. Given that rivers are known as a significant source of carbon emissions through water–atmosphere controls, our observations suggest a strong seasonal influence on biogeochemical cycles. Indeed, current estimates based on modeled monthly river surface area suggest that rivers emit 2.0 ± 0.2 Pg C yr−1 and that this is strongly based on seasonal river extents, particularly in temperate and arctic rivers (Liu et al., 2022). The current study further suggests that over the past 38 years rivers have increased in seasonality by as much as 12 %. This indicates that carbon emissions from rivers have significantly increased in recent years, especially from high-latitude arctic rivers and the high mountainous regions of, for instance, the Tibetan Plateau, which experiences longer summer months.
The type of river system is also important in the carbon cycle, with high-discharge braided rivers recognized to actively erode carbon-rich floodplain material to reduce carbon oxidation into the atmosphere (Repasch et al., 2021). The current SARL database shows locations of laterally active river systems versus human-controlled river systems. It is also important to recognize the perennial versus non-perennial nature of rivers and lakes, which suggests that CO2 emissions from dry inland waters are overlooked in global calculations, contributing an additional 6 % (∼ 0.12 Pg C yr−1; Keller et al., 2020; Messager et al., 2021). Because we found that many rivers and lakes have decreasing permanent extents (40 % and 46 %, respectively; Fig. 4), our results suggest that previously buried sediments with a disproportionately high amount of organic carbon will be increasingly released into the atmosphere (Keller et al., 2020; Hao et al., 2021). Lastly, the damming of rivers and its impact on flow and sedimentation patterns have been shown to eliminate another 48 ± 11 Tg C yr−1 (Maavara et al., 2017), although significant knowledge gaps remain at the local to regional level. The current study and recent reservoir maps (Donchyts et al., 2022; Khandelwal et al., 2022) highlight that rivers and reservoirs have undergone significant historical changes, which may help to further constrain these estimates.
Here we have presented a new classification of the long-term change in permanent and seasonal extents of rivers and lakes from 1984 to 2022. Our results show that while the global area of permanent rivers and lakes has remained relatively steady over the past 4 decades (∼ 1 % change), the regional variability is considerably higher. The global extent of seasonal rivers and lakes presents a different trend, increasing in surface area by 12 % and 27 %, respectively. For catchments with a statistically significant change, 84 % of rivers and lakes are positively skewed, showing an increased seasonality in surface water coverage over the same period. Decreasing perennial extent of many rivers and lakes (38 % to 45 %, respectively) is often reflected by an increased seasonality of those same water bodies (60 % and 77 %, respectively). However, the increasing perennial extent of rivers and lakes (62 % and 55 %, respectively) also shows a constant or increased seasonal coverage of the same water bodies (78 % and 88 %, respectively) to create an overall expanding maximum surface area extent annually. Quantifying perennial and seasonal change in rivers and lakes is crucial for measuring and tracking the health of aquatic ecosystems and the impact of climate change and human pressures. The strong increase in seasonal maximum extent of rivers suggests that atmosphere–carbon interactions in rivers may have been larger than expected from permanent river coverage alone and may also have increased over the last few decades. The results of our analysis are shared as the SARL database, which includes water body type, seasonality and spatiotemporal change for global rivers and lakes. This database is a valuable resource and framework for water resource monitoring and assessment of ecosystem health and conservation for different water body types.
The SARL database developed in this study has been deposited in the Zenodo database under access code https://doi.org/10.5281/zenodo.6895820 (Nyberg et al., 2023b). An interactive map is available at https://bjornburrnyberg.users.earthengine.app/view/waterchange (Nyberg et al., 2023c).
The supplement related to this article is available online at: https://doi.org/10.5194/hess-28-1653-2024-supplement.
BN conceptualized the original idea, designed the methodology and created the database. BN and EL analyzed the original data and created the figures. BN, RS and EL wrote the paper.
The contact author has declared that none of the authors has any competing interests.
Any use of trade, product or firm names is for descriptive purposes only and does not imply endorsement by the U.S. Government.
Publisher’s note: Copernicus Publications remains neutral with regard to jurisdictional claims made in the text, published maps, institutional affiliations, or any other geographical representation in this paper. While Copernicus Publications makes every effort to include appropriate place names, the final responsibility lies with the authors.
The authors are grateful for the journal-provided reviews and for helpful comments from John W. Jones of the U.S. Geological Survey. Nyberg was funded by the Architectural Element Characterization of Fluvial Systems project by AkerBP ASA and by the Sea Level Projections and Reconstructions (SeaPR) project at the Bjerknes Centre for Climate Research. We thank the University of Bergen for APC support.
The research has been supported by AkerBP ASA, the Bjerknes Centre for Climate Research and the University of Bergen.
This paper was edited by Serena Ceola and reviewed by two anonymous referees.
Allen, G. H. and Pavelsky, T. M.: Global extent of rivers and streams, Science, 361, 585–588, https://doi.org/10.1126/science.aat0636, 2018.
Baker, J. P., Van Sickle, J., Gagen, C. J., DeWalle, D. R., Sharpe, W. E., Carline, R. F., Baldigo, B. P., Murdoch, P. S., Bath, D. W., Krester, W. A., Simonin, H. A., and Wigington Jr., P. J.: Episodic Acidification of Small Streams in the Northeastern United States: Effects on Fish Populations, Ecol. Appl., 6, 422–437, https://doi.org/10.2307/2269380, 1996.
Barichivich, J., Gloor, E., Peylin, P., Brienen, R. J. W., Schöngart, J., Espinoza, J. C., and Pattnayak, K. C.: Recent intensification of Amazon flooding extremes driven by strengthened Walker circulation, Sci. Adv., 4, eaat8785, https://doi.org/10.1126/sciadv.aat8785, 2018.
Bastviken, D., Cole, J., Pace, M., and Tranvik, L.: Methane emissions from lakes: Dependence of lake characteristics, two regional assessments, and a global estimate, Global Biogeochem. Cy., 18, 2004GB002238, https://doi.org/10.1029/2004GB002238, 2004.
Briggs, M. A., Harvey, J. W., Hurley, S. T., Rosenberry, D. O., McCobb, T., Werkema, D., and Lane Jr., J. W.: Hydrogeochemical controls on brook trout spawning habitats in a coastal stream, Hydrol. Earth Syst. Sci., 22, 6383–6398, https://doi.org/10.5194/hess-22-6383-2018, 2018.
Donchyts, G., Winsemius, H., Baart, F., Dahm, R., Schellekens, J., Gorelick, N., Iceland, C., and Schmeier, S.: High-resolution surface water dynamics in Earth's small and medium-sized reservoirs, Sci. Rep., 12, 13776, https://doi.org/10.1038/s41598-022-17074-6, 2022.
Feng, D., Gleason, C. J., Yang, X., Allen, G. H., and Pavelsky, T. M.: How Have Global River Widths Changed Over Time?, Water Resour. Res., 58, e2021WR031712, https://doi.org/10.1029/2021WR031712, 2022.
Garcia, D. J. and You, F.: The water-energy-food nexus and process systems engineering: A new focus, Comput. Chem. Eng., 91, 49–67, https://doi.org/10.1016/j.compchemeng.2016.03.003, 2016.
Gleeson, T., Wang-Erlandsson, L., Porkka, M., Zipper, S. C., Jaramillo, F., Gerten, D., Fetzer, I., Cornell, S. E., Piemontese, L., Gordon, L. J., Rockström, J., Oki, T., Sivapalan, M., Wada, Y., Brauman, K. A., Flörke, M., Bierkens, M. F. P., Lehner, B., Keys, P., Kummu, M., Wagener, T., Dadson, S., Troy, T. J., Steffen, W., Falkenmark, M., and Famiglietti, J. S.: Illuminating water cycle modifications and Earth system resilience in the Anthropocene, Water Resour. Res., 56, e2019WR024957, https://doi.org/10.1029/2019WR024957, 2020.
Gorelick, N., Hancher, M., Dixon, M., Ilyushchenko, S., Thau, D., and Moore, R.: Google Earth Engine: Planetary-scale geospatial analysis for everyone, Remote Sens. Environ., 202, 18–27, https://doi.org/10.1016/j.rse.2017.06.031, 2017.
Grill, G., Lehner, B., Thieme, M., Geenen, B., Tickner, D., Antonelli, F., Babu, S., Borrelli, P., Cheng, L., Crochetiere, H., Ehalt Macedo, H., Filgueiras, R., Goichot, M., Higgins, J., Hogan, Z., Lip, B., McClain, M. E., Meng, J., Mulligan, M., Nilsson, C., Olden, J. D., Opperman, J. J., Petry, P., Reidy Liermann, C., Sáenz, L., Salinas-Rodríguez, S., Schelle, P., Schmitt, R. J. P., Snider, J., Tan, F., Tockner, K., Valdujo, P. H., Van Soesbergen, A., and Zarfl, C.: Mapping the world's free-flowing rivers, Nature, 569, 215–221, https://doi.org/10.1038/s41586-019-1111-9, 2019.
Hao, X., Ruihong, Y., Zhuangzhuang, Z., Zhen, Q., Xixi, L., Tingxi, L., and Ruizhong, G.: Greenhouse gas emissions from the water–air interface of a grassland river: a case study of the Xilin River, Sci. Rep., 11, 2659, https://doi.org/10.1038/s41598-021-81658-x, 2021.
Keller, P. S., Catalán, N., Von Schiller, D., Grossart, H.-P., Koschorreck, M., Obrador, B., Frassl, M. A., Karakaya, N., Barros, N., Howitt, J. A., Mendoza-Lera, C., Pastor, A., Flaim, G., Aben, R., Riis, T., Arce, M. I., Onandia, G., Paranaíba, J. R., Linkhorst, A., Del Campo, R., Amado, A. M., Cauvy-Fraunié, S., Brothers, S., Condon, J., Mendonça, R. F., Reverey, F., Rõõm, E.-I., Datry, T., Roland, F., Laas, A., Obertegger, U., Park, J.-H., Wang, H., Kosten, S., Gómez, R., Feijoó, C., Elosegi, A., Sánchez-Montoya, M. M., Finlayson, C. M., Melita, M., Oliveira Junior, E. S., Muniz, C. C., Gómez-Gener, L., Leigh, C., Zhang, Q., and Marcé, R.: Global CO2 emissions from dry inland waters share common drivers across ecosystems, Nat. Commun., 11, 2126, https://doi.org/10.1038/s41467-020-15929-y, 2020.
Khandelwal, A., Karpatne, A., Ravirathinam, P., Ghosh, R., Wei, Z., Dugan, H. A., Hanson, P. C., and Kumar, V.: ReaLSAT, a global dataset of reservoir and lake surface area variations, Sci. Data, 9, 356, https://doi.org/10.1038/s41597-022-01449-5, 2022.
Lancaster, J. and Hildrew, A. G.: Flow Refugia and the Microdistribution of Lotic Macroinvertebrates, J. N. Am. Benthol. Soc., 12, 385–393, https://doi.org/10.2307/1467619, 1993.
Lehner, B., Verdin, K., and Jarvis, A.: New Global Hydrography Derived From Spaceborne Elevation Data, EoS Transactions, 89, 93–94, https://doi.org/10.1029/2008EO100001, 2008.
Lehner, B., Liermann, C. R., Revenga, C., Vörösmarty, C., Fekete, B., Crouzet, P., Döll, P., Endejan, M., Frenken, K., Magome, J., Nilsson, C., Robertson, J. C., Rödel, R., Sindorf, N., and Wisser, D.: High-resolution mapping of the world's reservoirs and dams for sustainable river-flow management, Front. Ecol. Environ., 9, 494–502, https://doi.org/10.1890/100125, 2011.
Liu, S., Wang, P., Huang, Q., Yu, J., Pozdniakov, S. P., and Kazak, E. S.: Seasonal and spatial variations in riverine DOC exports in permafrost-dominated Arctic river basins, J. Hydrol., 612, 128060, https://doi.org/10.1016/j.jhydrol.2022.128060, 2022.
Lowe, W. H.: Amphibians, in: Encyclopedia of Inland Waters, edited by: Likens, G. E., Academic Press, Oxford, 439–445, https://doi.org/10.1016/B978-012370626-3.00190-3, 2009.
Matthews, E., Johnson, M. S., Genovese, V., Du, J., and Bastviken, D.: Methane emission from high latitude lakes: methane-centric lake classification and satellite-driven annual cycle of emissions, Sci. Rep., 10, 12465, https://doi.org/10.1038/s41598-020-68246-1, 2020.
Mekonnen, M. M. and Hoekstra, A. Y.: Four billion people facing severe water scarcity, Sci. Adv., 2, e1500323, https://doi.org/10.1126/sciadv.1500323, 2016.
Messager, M. L., Lehner, B., Grill, G., Nedeva, I., and Schmitt, O.: Estimating the volume and age of water stored in global lakes using a geo-statistical approach, Nat. Commun., 7, 13603, https://doi.org/10.1038/ncomms13603, 2016.
Messager, M. L., Lehner, B., Cockburn, C., Lamouroux, N., Pella, H., Snelder, T., Tockner, K., Trautmann, T., Watt, C., and Datry, T.: Global prevalence of non-perennial rivers and streams, Nature, 594, 391–397, https://doi.org/10.1038/s41586-021-03565-5, 2021.
Micklin, P.: The Aral Sea Disaster, Annu. Rev. Earth Pl. Sc., 35, 47–72, https://doi.org/10.1146/annurev.earth.35.031306.140120, 2007.
Mirza, M. M. Q.: Climate change, flooding in South Asia and implications, Reg. Environ. Change, 11, 95–107, https://doi.org/10.1007/s10113-010-0184-7, 2011.
Neumann, K., Sietz, D., Hilderink, H., Janssen, P., Kok, M., and Van Dijk, H.: Environmental drivers of human migration in drylands – A spatial picture, Appl. Geogr., 56, 116–126, https://doi.org/10.1016/j.apgeog.2014.11.021, 2015.
Ngor, P. B., Oberdorff, T., Phen, C., Baehr, C., Grenouillet, G., and Lek, S.: Fish assemblage responses to flow seasonality and predictability in a tropical flood pulse system, Ecosphere, 9, e02366, https://doi.org/10.1002/ecs2.2366, 2018.
Nyberg, B.: Global Channel Belt (GCB) (1.0), Zenodo [data set], https://doi.org/10.5281/zenodo.7680163, 2022.
Nyberg, B. and Howell, J.: Is the present the key to the past? A global characterization of modern sedimentary basins, Geology, 43, 643–646, https://doi.org/10.1130/G36669.1, 2015.
Nyberg, B., Henstra, G., Gawthorpe, R. L., Ravnås, R., and Ahokas, J.: Global scale analysis on the extent of river channel belts, Nat. Commun., 14, 2163, https://doi.org/10.1038/s41467-023-37852-8, 2023a.
Nyberg, B., Luijendijk, E., and Sayre, R.: Surface Area of River and Lakes (SARL), Zenodo [data set], https://doi.org/10.5281/zenodo.6895820, 2023b.
Nyberg, B., Luijendijk, E., and Sayre, R.: Surface Area of Rivers and Lakes (SARL), Earth Engine Apps [data set], https://bjornburrnyberg.users.earthengine.app/view/waterchange, last access: 10 October 2023c.
Oki, T. and Kanae, S.: Global Hydrological Cycles and World Water Resources, Science, 313, 1068–1072, https://doi.org/10.1126/science.1128845, 2006.
OpenStreetMap contributors: https://www.openstreetmap.org/, last access: 1 June 2022.
Pekel, J.-F., Cottam, A., Gorelick, N., and Belward, A. S.: High-resolution mapping of global surface water and its long-term changes, Nature, 540, 418–422, https://doi.org/10.1038/nature20584, 2016a.
Pekel, J. F., Cottam, A., Gorelick, N., and Belward, A. S.: Global Surface Water – Data Access, JRC Publications Repository [data set] https://doi.org/10.1038/nature20584, 2016b.
Power, M. E., Parker, M. S., and Dietrich, W. E.: Seasonal Reassembly of a River Food Web: Floods, Droughts, and Impacts of Fish, Ecological Monographs, 78, 263–282, 2008.
Repasch, M., Scheingross, J. S., Hovius, N., Lupker, M., Wittmann, H., Haghipour, N., Gröcke, D. R., Orfeo, O., Eglinton, T. I., and Sachse, D.: Fluvial organic carbon cycling regulated by sediment transit time and mineral protection, Nat. Geosci., 14, 842–848, https://doi.org/10.1038/s41561-021-00845-7, 2021.
Sakai, M., Wakiya, R., and Hoshi, G.: Flood-induced interspecific interactions in spring-fed tributary as an ecosystem function of heterogeneous river networks, Landsc. Ecol. Eng., 17, 555–561, https://doi.org/10.1007/s11355-021-00465-8, 2021.
Sayre, R., Noble, S., Hamann, S., Smith, R., Wright, D., Breyer, S., Butler, K., Graafeiland, K. V., Frye, C., Karagulle, D., Hopkins, D., Stephens, D., Kelly, K., Basher, Z., Burton, D., Cress, J., Atkins, K., Sistine, D. P. V., Friesen, B., Allee, R., Allen, T., Aniello, P., Asaad, I., Costello, M. J., Goodin, K., Harris, P., Kavanaugh, M., Lillis, H., Manca, E., Muller-Karger, F., Nyberg, B., Parsons, R., Saarinen, J., Steiner, J., and Reed, A.: A new 30 meter resolution global shoreline vector and associated global islands database for the development of standardized ecological coastal units, J. Oper. Oceanogr., 12, S47–S56, https://doi.org/10.1080/1755876X.2018.1529714, 2019.
Sheffield, J., Wood, E. F., Pan, M., Beck, H., Coccia, G., Serrat-Capdevila, A., and Verbist, K.: Satellite Remote Sensing for Water Resources Management: Potential for Supporting Sustainable Development in Data-Poor Regions, Water Resour. Res., 54, 9724–9758, https://doi.org/10.1029/2017WR022437, 2018.
Siebert, S., Burke, J., Faures, J. M., Frenken, K., Hoogeveen, J., Döll, P., and Portmann, F. T.: Groundwater use for irrigation – a global inventory, Hydrol. Earth Syst. Sci., 14, 1863–1880, https://doi.org/10.5194/hess-14-1863-2010, 2010.
Song, C., Huang, B., Richards, K., Ke, L., and Hien Phan, V.: Accelerated lake expansion on the Tibetan Plateau in the 2000s: Induced by glacial melting or other processes?, Water Resour. Res., 50, 3170–3186, https://doi.org/10.1002/2013WR014724, 2014.
Spearman, C.: The Proof and Measurement of Association between Two Things, Am. J. Psychol., 100, 441–471, https://doi.org/10.2307/1422689, 1987.
United Nations: System of Environmental-Economic Accounting – Ecosystem Accounting (SEEA EA), White cover publication, pre-edited text subject to official editing, https://seea.un.org/ecosystem-accounting (last access: 1 August 2023), 2021.
van Dijk, A. I. J. M. and Renzullo, L. J.: Water resource monitoring systems and the role of satellite observations, Hydrol. Earth Syst. Sci., 15, 39–55, https://doi.org/10.5194/hess-15-39-2011, 2011.
Van Loon, A. F., Gleeson, T., Clark, J., Van Dijk, A. I. J. M., Stahl, K., Hannaford, J., Di Baldassarre, G., Teuling, A. J., Tallaksen, L. M., Uijlenhoet, R., Hannah, D. M., Sheffield, J., Svoboda, M., Verbeiren, B., Wagener, T., Rangecroft, S., Wanders, N., and Van Lanen, H. A. J.: Drought in the Anthropocene, Nat. Geosci., 9, 89–91, https://doi.org/10.1038/ngeo2646, 2016.
Wada, Y., De Graaf, I. E. M., and Van Beek, L. P. H.: High-resolution modeling of human and climate impacts on global water resources, J. Adv. Model Earth Sy., 8, 735–763, https://doi.org/10.1002/2015MS000618, 2016.
Wang, J., Walter, B. A., Yao, F., Song, C., Ding, M., Maroof, A. S., Zhu, J., Fan, C., McAlister, J. M., Sikder, S., Sheng, Y., Allen, G. H., Crétaux, J.-F., and Wada, Y.: GeoDAR: georeferenced global dams and reservoirs dataset for bridging attributes and geolocations, Earth Syst. Sci. Data, 14, 1869–1899, https://doi.org/10.5194/essd-14-1869-2022, 2022.
Zemtsov, V. A., Vershinin, D. A., Khromykh, V. V., and Khromykh, O. V.: Long-term dynamics of maximum flood water levels in the middle course of the Ob River, IOP Conf. Ser.-Earth Environ. Sci., 400, 012004, https://doi.org/10.1088/1755-1315/400/1/012004, 2019.