the Creative Commons Attribution 4.0 License.
the Creative Commons Attribution 4.0 License.
 | 08 Jan 2024
Combined impacts of climate and land-use change on future water resources in Africa
Celray James Chawanda
Albert Nkwasa
Wim Thiery
Ann van Griensven
Africa depends on its water resources for hydroelectricity, inland fisheries and water supply for domestic, industrial and agricultural operations. Anthropogenic climate change (CC) has changed the state of these water resources. Land use and land cover have also undergone significant changes due to the need to provide resources to a growing population. Yet, the impact of the land-use and land cover change (LULCC) in addition to CC on the water resources of Africa is underexplored. Here we investigate how precipitation, evapotranspiration (ET) and river flow respond to both CC and LULCC scenarios across the entire African continent. We set up a Soil and Water Assessment Tool (SWAT+) model for Africa and calibrated it using the hydrological mass balance calibration (HMBC) methodology detailed in Chawanda et al. (2020a). The model was subsequently driven by an ensemble of bias-adjusted global climate models to simulate the hydrological cycle under a range of CC and LULCC scenarios. The results indicate that the Zambezi and the Congo River basins are likely to experience reduced river flows under CC with an up to 7 % decrease, while the Limpopo River will likely have higher river flows. The Niger River basin is likely to experience the largest decrease in river flows in all of Africa due to CC. The Congo River basin has the largest difference in river flows between scenarios with (over 18 % increase) and without LULCC (over 20 % decrease). The projected changes have implications for the agriculture and energy sectors and hence the livelihood of people on the continent. Our results highlight the need to adopt policies to halt global greenhouse gas emissions and to combat the current trend of deforestation to avoid the high combined impact of CC and LULCC on water resources in Africa.
- Article
(3226 KB) - Full-text XML
-
Supplement
(467 KB) - BibTeX
- EndNote


Africa benefits from surface water in various ways. Surface water resources drive hydroelectricity, inland fisheries and water supply for domestic, industrial and agricultural operations. With agriculture as the mainstay of most African economies (Evans, 2018), irrigation is of importance for local food security, with sustainable irrigation practices having the potential to boost African agricultural productivity in many areas without adverse environmental impacts on freshwater resources (Rosa et al., 2020). Surface water provides most of the irrigation water used in Africa (Frenken, 2005).
Anthropogenic climate change (CC) has resulted in changes in the global state of water resources (Marvel et al., 2019; Padrón et al., 2020; Vanderkelen et al., 2020; Grant et al., 2021; Gudmundsson et al., 2021). Regarding Africa, Maidment et al. (2015) concluded that there had been a general increase in precipitation from 1983 to 2014 over the Sahel (29–43 mm yr−1 per decade) and Southern Africa (12–41 mm yr−1 per decade), while East Africa has dried at −14 to −65 mm yr−1 per decade in March–May. There is also ample evidence that the African water resources have responded to observed warming through reduced snow and ice cover, increases and decreases in runoff, and changing precipitation patterns, including extremes (IPCC, 2014, 2021). The World Meteorological Organisation (2019) has documented the increase in extreme events attributed to CC, including the recent shift from arid conditions to heavy rains and floods in 2019 in the Greater Horn of Africa. Further changes in the hydrological cycle due to CC are expected towards the future (Bais et al., 2015; Vanderkelen et al., 2018; Souverijns et al., 2016).
Changes in rainfall patterns linked to natural variability and CC can have profound societal consequences in Africa, where rainfall is crucial for sustaining livelihoods and economic development (Maidment et al., 2015). For example, the 2014–2015 drought in Zimbabwe and the 2016 drought in Kenya left millions of people with food shortage (Zimbabwe Food Security Outlook Update, 2019; Uhe et al., 2018), while crop fields were destroyed and hundreds of thousands of people were displaced in parts of Malawi and Mozambique due to floods triggered by heavy rains in 2014–2015 (Southeastern Africa's topsy-turvy monsoon, 2021). The food supply problems posed by climate changes are expected to worsen (Nkrumah, 2018; Zommers et al., 2020; Hurlbert et al., 2022). The Intergovernmental Panel on Climate Change (IPCC, 2021, 2014) pointed out that projected warming in Africa is larger than the global annual mean warming, and further changes in rainfall patterns are expected. Thus, projecting how the hydrological resources of Africa may respond to CC is of importance for reducing potentially adverse impacts of CC and enabling sustainable development.
Land cover has also undergone significant changes driven by the need to provide food and other resources for a growing population (Foley et al., 2005; Lawrence et al., 2016). Between the years of 1990 to 1997, 310 000 ha yr−1 of forests were converted to agricultural land (Achard et al., 2002). An update by Hansen et al. (2013) revealed that tropical forests are being lost at the rate of 53 600 ha yr−1, and since the year 2000, Africa has lost millions of hectares of tree cover (Interactive World Forest Map & Tree Cover Change Data | GFW, 2021). The loss of forests is expected to accelerate with projected population growth. In addition, Africa is one of the fastest urbanising continents (Beniston et al., 2011; Cartwright, 2015; Ruhiiga, 2013), which is also cutting into forest lands. These land-use and land cover changes (LULCC) influence the water resources on the continent. Deforestation and urbanisation in Africa have been associated with decreased rainfall and enhanced runoff, increasing the risk of flooding (Akkermans et al., 2014; Shi et al., 2007). Likewise, irrigation and conservation agriculture may alter local and remote precipitation patterns (Thiery et al., 2017; De Hertog et al., 2022; Hirsch et al., 2018; Thiery et al., 2020; Hauser et al., 2019). In West Africa, the loss of forests has contributed to reduced rainfall (Garcia-Carreras and Parker, 2011). The upper Blue Nile and parts of South Africa have experienced increased surface runoff due to the expansion of cultivated land and urbanisation (Gyamfi et al., 2016; Woldesenbet et al., 2017). Thus, LULCC, in addition to CC, poses a threat to water resource availability in Africa.
Only few studies have investigated how hydrology will responded to LULCC in Africa, and even fewer have looked at combined impacts of CC and LULCC, and most of these studies have been conducted at small scales (e.g. Mango et al. (2011), Gyamfi et al. (2016), Warburton et al. (2012)). Thus, the impacts of future LULCC on the hydrology of Africa are underexplored. Nevertheless, such studies are needed to plan for mitigating against potential negative impacts of LULCC on African water resources.
Climate and hydrological models are used to generate future scenarios and quantify water resources at various spatial and temporal scales (Kim et al., 2008). Hydrological models at small spatial scales are often calibrated and validated and are therefore arguably more reliable in their projections (Krysanova et al., 2018; Trambauer et al., 2013). In contrast, global- and continental-scale models are often not calibrated but allow for large-scale CC impact assessments (Hattermann et al., 2017; Sood and Smakhtin, 2015; Zaherpour et al., 2018; Thiery et al., 2021; Sterl et al., 2020; Tabari et al., 2021; Boulange et al., 2021; Reinecke et al., 2021). Chawanda et al. (2020a) and Krysanova et al. (2020) demonstrated that the calibration of large-scale models has a substantial impact on the model's projections.
One of the reasons that calibration of large-scale models is currently limited is the large computational requirements of such a procedure. To overcome this limitation, Chawanda et al. (2020a) suggest hydrological mass balance calibration (HMBC), with less computational and time demands. HMBC uses long-term annual average components of the water balance to calibrate the model.
This study projects how runoff and river flow across Africa may change under different future CC and LULCC scenarios. First, we use the HMBC methodology (Chawanda et al., 2020a) to calibrate a continental-scale hydrological model and subsequently drive it with an ensemble of bias-adjusted global climate models to simulate future runoff, evapotranspiration (ET) and river flow projections under CC and LULCC scenarios for RCPs 2.6, 6.0 and 8.5. Finally, we analyse the changes in river flows and ET changes in the future under both CC and LULCC scenarios compared to a historical reference period.
2.1 SWAT+ model
The Soil and Water Assessment Tool (SWAT) model is a process-based hydrological model that is usually applied at a catchment scale. It is a semi-distributed and time-continuous model (Arnold et al., 2012). SWAT+ is a restructured version of SWAT (Arnold et al., 2018; Bieger et al., 2017). A more detailed description of the SWAT+ model can be found in Chawanda et al. (2020b; Sect. 2).
2.2 Source code adaptations to run land-use change scenarios
By default, the SWAT+ model does not simulate transient land use. We modified the source code to read updated areas for each land-use category at the beginning of each simulation year. We achieved this by creating yearly hydrologic response unit (HRU) connection files (hru.con) with the naming scheme hru_xxxx.con where xxxx is the year for the connection file. We also created yearly files for the landscape unit element file (ls_unit.ele) with the analogous naming scheme ls_unit_xxxx.ele. These files are used to update the area of the HRUs and the percent area of landscape unit (LSU) they are contained in. If the connection file for a given year does not exist, the previously used HRU connection file is maintained to avoid crashes in model runs where transient land use is not simulated. The same mechanism was also implemented for the landscape unit element file.
2.3 Model setup and calibration
The SWAT+ model setup was done using SWAT+ AW (Chawanda et al., 2020b). The methodology and datasets for model setup including a digital elevation model (DEM), soil data and evaluation data were obtained from open sources. The DEM was resampled to 300 m resolution, while the soil data were available at 250 m resolution. The data are described in detail in Chawanda et al. (2020a). The model was set up for the entire African continent, including Madagascar but excluding smaller islands. Model calibration was done using HMBC using the same simulation period discussed in Sect. 2.3 (1979 to 1986).
Unlike traditional calibration methods which predominantly rely on hard data, such as time series of hydrological quantities at a specific point in the watershed, the hydrological mass balance calibration (HMBC) uses soft data to improve model accuracy, especially for larger-scale applications. Soft data refers to information on individual processes, such as long-term annual average estimates (Arnold et al., 2015). These types of data provide insights into the broader patterns and averages, setting constraints during hard calibration to enhance the representation of hydrological processes. Using soft data reduces computational and time expenses (Chawanda et al., 2020a). HMBC aims to adjust model parameters to ensure that the simulated long-term average water balance components align with observed averages, which enhances the model's performance in impact studies by more accurately simulating hydrological mass balance components. The procedure involves running the model, evaluating results against soft data, estimating new parameter values, re-running the model and repeating this cycle until certain criteria are met. Generally, a hydrological component such as ET is calibrated within five iterations before progressing to the next component in each region. More details on HMBC are discussed in Chawanda et al. (2020a). The forcing used for calibration runs was from EWEMBI (Lange, 2016).
In contrast to a previous southern Africa SWAT+ model application (Chawanda et al., 2020a), the Nile and Congo River basins had very few gauging stations from which long-term average surface runoff could be derived. This was a major problem in the Nile Basin where river data availability from public sources is even more restricted. As such, only ET was calibrated by HMBC in some calibration zones where gauge data were not available (Supplement Fig. S1). If there is a gauging station downstream, HMBC is applied to calibration zones that have no surface runoff ratio so that they collectively yield the estimated surface runoff ratio downstream. Thus, although HMBC can be used in data-scarce areas, it is limited by the absence of long-term average river flow data in these river basins. The SWAT+ model was also run for the period 2009–2016 using the EWEMBI forcing to compare with the WaPOR product, which has time series data in this period.
2.4 Scenarios setup
2.4.1 Climate scenarios
In this study, 31-year simulations were run for historical (1975–2005) and future (2070–2100) periods with a 1-year warmup period. The meteorological forcing data were obtained through the Inter-Sectoral Impact Model Intercomparison Project (ISIMIP) phase 2b (Frieler et al., 2017). The forcing data were from four bias-adjusted global climate models (GCMs), namely GFDL-ESM2M, HadGEM2-ES, IPSL-CM5A-LR and MIROC5 for both historical and future periods under Representative Concentration Pathways (RCPs) 2.6, 6.0 and 8.5. Thus, in total 24 simulations were conducted.
2.4.2 Land-use scenarios
Land-use scenarios were run using scenarios obtained from the Land-Use Harmonization Project phase 2 (LUH2; Hurtt et al., 2020). LUH2 reconstructs historical land uses from data based on the History of the Global Environment database (HYDE) and multiple alternative scenarios of the future (2015–2100) from integrated assessment models (IAMs; Hurtt et al., 2020). The scenarios used for land use were from three marker Shared Socioeconomic Pathway (SSP)–RCP combinations discussed in Hurtt et al. (2020). These scenarios include SSP1–RCP2.6, SSP4–RCP6.0 and SSP5–RCP8.5.
The SSP1–RCP2.6 scenario is derived from the SSP1 baseline scenario where sustainable socioeconomic trends and ambitious climate policy result in reductions in agricultural land and increases in forest land (Doelman et al., 2018). Under SSP4–RCP6.0, environmental policies are present in high- and medium-income countries only where afforestation is encouraged resulting in a global increase in cover of 3 % from 2010 to 2100. There is also an increase in global crop and pasture land of 14 % and 9 % from 2010 to 2100, respectively. Under SSP5–RCP8.5, annual greenhouse gas emissions more than double with very high levels of fossil use. Food demand is doubled, and there is a strong expansion of global cropland with an increase of about 20 % between 2010 and 2100 (Hurtt et al., 2020). More details about the scenarios SSP1–RCP2.6, SSP4–RCP6.0 and SSP5–RCP8.5 (henceforth referred to as land-use scenarios for RCPs 2.6, 6.0 and 8.5, respectively) are discussed by Hurtt et al. (2020).
We run another 24 runs for the CC combined with LULCC scenarios, making a total of 48 simulations when climate scenario simulations are considered. A list of scenario simulations (including the run for ET evaluation) done in this study is shown in Table 1.
The same vegetation cover as prescribed by LUH2 is kept. Thus, we are not considering dynamical vegetation shifts that might occur due to CC.
2.5 Model evaluation and analysis
The model was evaluated using monthly flow values from gauging station data obtained through the Global Runoff Data Centre (BfG – The GRDC, 2019). Some gauging stations were not considered in our study as the data were on small rivers that were not represented at the model scale. Since the EWEMBI (Lange, 2016) forcing starts in 1979, data before 1979 were not usable and most stations had data between 1980 and 1990 with extensive missing data after 1986. The same criteria as specified in Chawanda et al. (2020a; Sect. 2.3.2) were applied, which resulted in 154 gauging stations. The WaPOR dataset (at 0.0022∘ × 0.0022∘ resolution) was used to check the model performance for ET both spatially and temporarily.

Figure 1Major river basins in Africa.
Analysis of projections for river flows was done for major river basins at the main outlets where possible (Fig. 1). Characteristics of these river basins are shown in Table 2. We also evaluated the changes in river flows and ET in future climate in relation to historical climate.
Table 2Characteristics of the major river basins in Africa (Lakshmi et al., 2018; Latrubesse et al., 2005; Nakayama, 2003; Lugomela et al., 2021; Senegal-Hycos, 2021; Lange, 2016).
3.1 Model performance in the historical period
3.1.1 Simulation of river flows
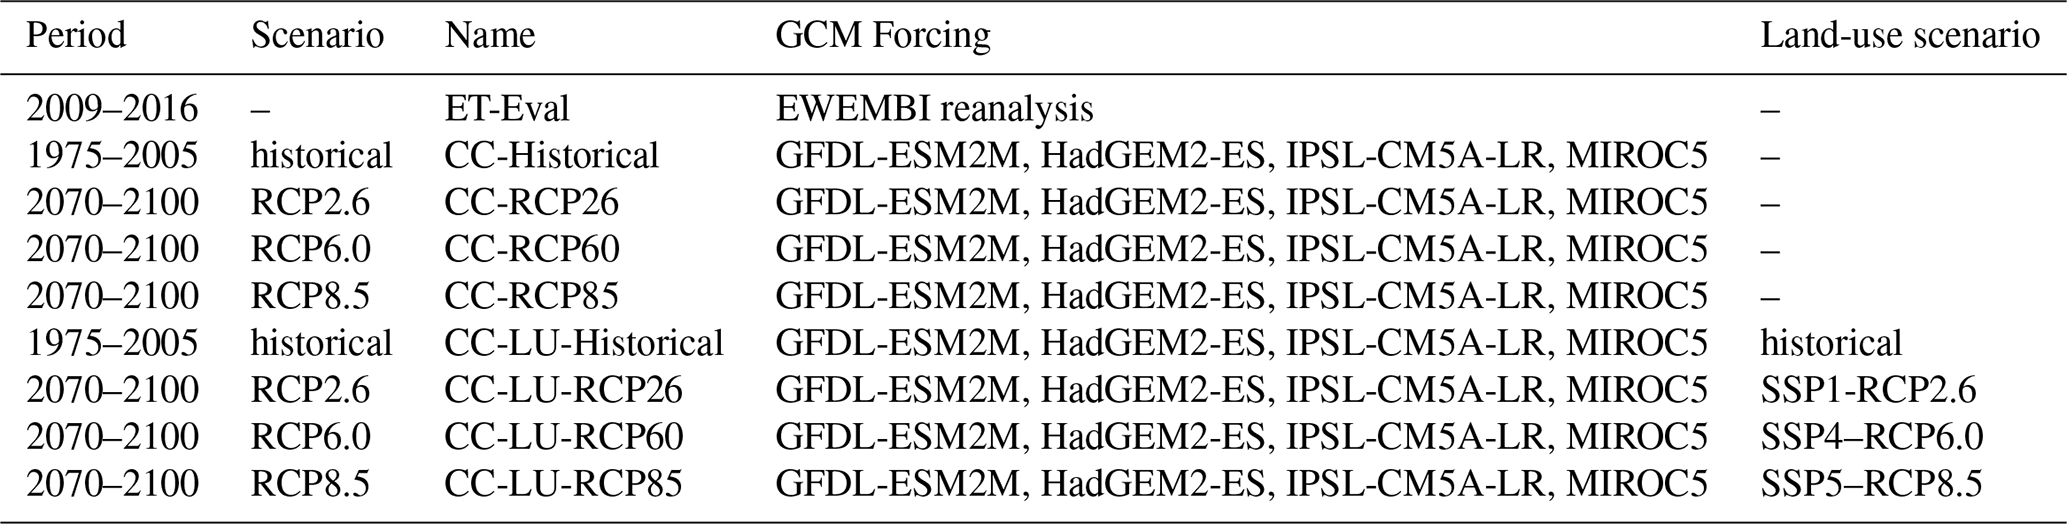
The performance of the uncalibrated model with irrigation and reservoirs as measured by Nash–Sutcliffe efficiency (NSE) values was generally poor. HMBC improved NSE values in 98 gauging stations, whereas 38 stations did not have changes in performance after HMBC. A total of 18 stations had a lower performance after HMBC than before HMBC (Fig. 2).
Figure 2(a) Changes in NSE values across the gauging stations in the SWAT+ Africa model after performing hydrological mass balance calibration (HMBC). (b) Distribution of changes in NSE values after HMBC.
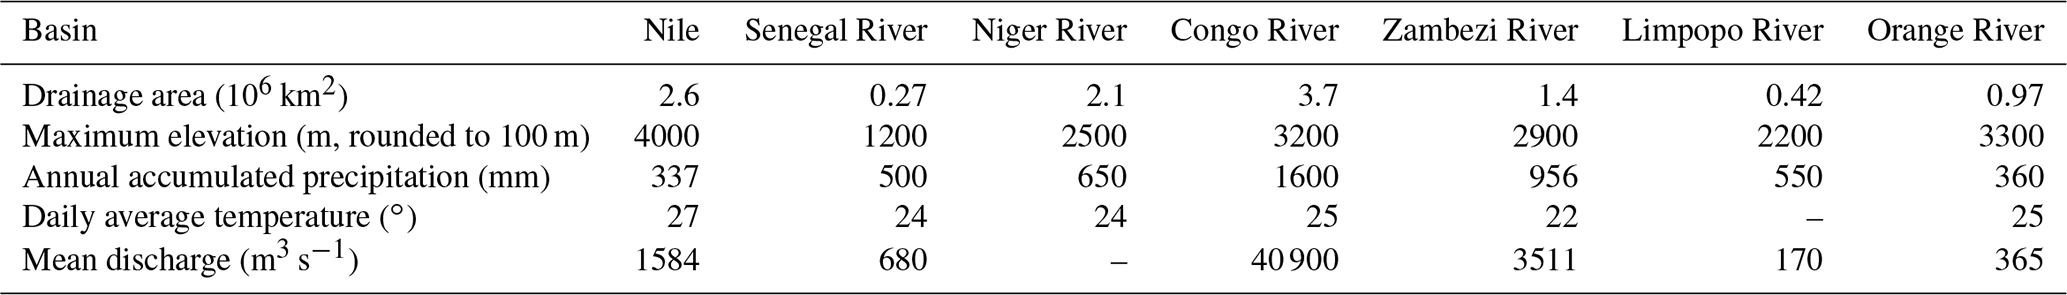
After performing HMBC, 96 out of 154 gauging stations had a monthly NSE value > 0, with 50 gauging stations having a monthly NSE above 0.5 (Fig. 3).
Figure 3(a) Monthly NSE values for gauging stations across the SWAT+ Africa model. (b) Distribution of NSE values after HMBC (evaluated for river flows between 1980–1986).
Low model performance was observed in gauging stations that were downstream of reservoirs (Fig. 4). This was expected, as a lack of data on dam management contributes to a poor simulation of river flows through reservoirs (Chawanda et al., 2020a). The poor performance downstream of reservoirs also had an impact on the performance of the most-downstream gauging stations of major river basins as observed in the Orange, Niger, Nile (NSE < 0) and Limpopo (NSE 0.04) rivers, whereas in the Senegal River basin, where there are no reservoirs implemented along the main river, an NSE of 0.55 was achieved.
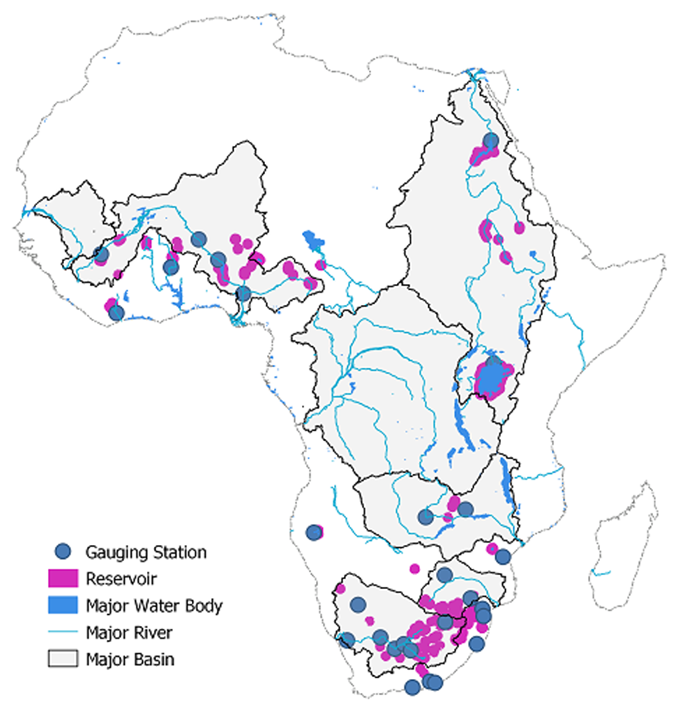
Figure 4Gauging stations that had NSE < 0 with a reservoir upstream. (The size of the reservoirs has been exaggerated to make the location of the reservoirs easily visible.)
3.1.2 Simulation of evapotranspiration
Model ET was comparable to WaPOR ET spatially using the ET-Eval run (Table 1). The model captured high ET in coastal zone of North Africa, West and Central Africa, and the Ethiopian Highlands.
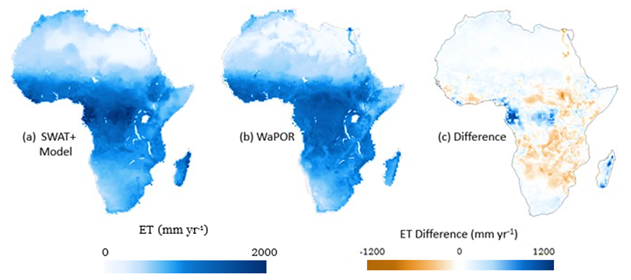
Figure 5Annual mean ET from (a) the SWAT+ model and (b) the WaPOR reference product. (c) Difference between the SWAT+ model and WaPOR (SWAT+ model–WaPOR) for the period 2009–2016.
Further ET checks were done by comparing simulated and WaPOR spatially averaged annual ET values for each major basin. The model captured the low ET values expected in the Sahara, Namib and Kalahari (Fig. 5a and b). However, the SWAT+ model overestimated ET in the Congo Basin by 58 mm yr−1 and underestimated annual ET in the lower Nile River by 42 mm yr−1. The high observed ET values (locally up to 500 mm yr−1) in the lower Nile, which the model underestimates, are expected due to irrigation activity and multiple cropping sessions in the area. The model underestimated the ET in the Ethiopian Highlands by 50 mm yr−1, and ET was also underestimated in parts of the greater Horn of Africa. The SWAT+ model overestimates ET in Madagascar by 360 mm yr−1 (Fig. 5c), but the highest overestimation was in the west of the Congo River basin caused by excessive rainfall in the area (Fig. 5). In temporal terms, the model captures the magnitude of the overall ET values in Africa but slightly underestimates the annual average ET by 10 mm yr−1 (1.8 %) on average.
3.2 Model projections
3.2.1 Projected changes in precipitation
The spatial patterns of projected changes in precipitation as simulated by the driving ISIMIP2b GCMs show an overall increase in the west of the Congo River basin under all RCPs. The White Nile river basin, the Ethiopian Highlands and the Horn of Africa receive higher precipitation in the future under all RCPs. On average, the White Nile river basin receives 1046 mm for RCP2.6, 1136 mm for RCP6.0 and 1253 mm for RCP8.5 in contrast to 1014 mm in the historical period. The Ethiopian Highlands have the highest precipitation increase (392 mm spatial average) under RCP8.5, while upper Madagascar has the largest decrease of 226 mm under RCP8.5. In general, the changes in precipitation are more pronounced under RCP6.0 than RCP2.6 and under RCP8.5 more than under RCP6.0 (Fig. 6).
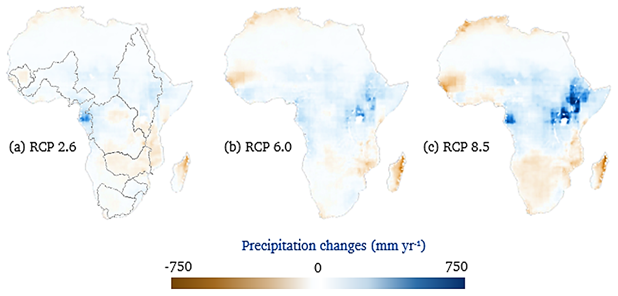
Figure 6Annual mean precipitation changes for the future period (2071–2100) under (a) RCP2.6, (b) RCP6.0 and (c) RCP8.5 averaged across the four ISIMIP2b GCMs. Maps are calculated by subtracting the average precipitation for the future period from the average precipitation for the historical period (1976–2005).
Southern Africa is projected to experience an overall decrease in future precipitation, including Madagascar, and the severity of the decrease scales with the emission scenario. The decrease in future precipitation for Madagascar is more severe than southern Africa under all scenarios.
3.2.2 Projected changes in evapotranspiration
Under RCP2.6, CC alone leads to an increase in the ET values between 7∘ S and 15∘ N (Fig. 7) according to the SWAT+ projections with an overall decrease in ET in West Africa and southern Africa (including Madagascar) under all RCPs. The increases become more pronounced moving from RCP2.6 to RCP8.5 (Fig. 8).
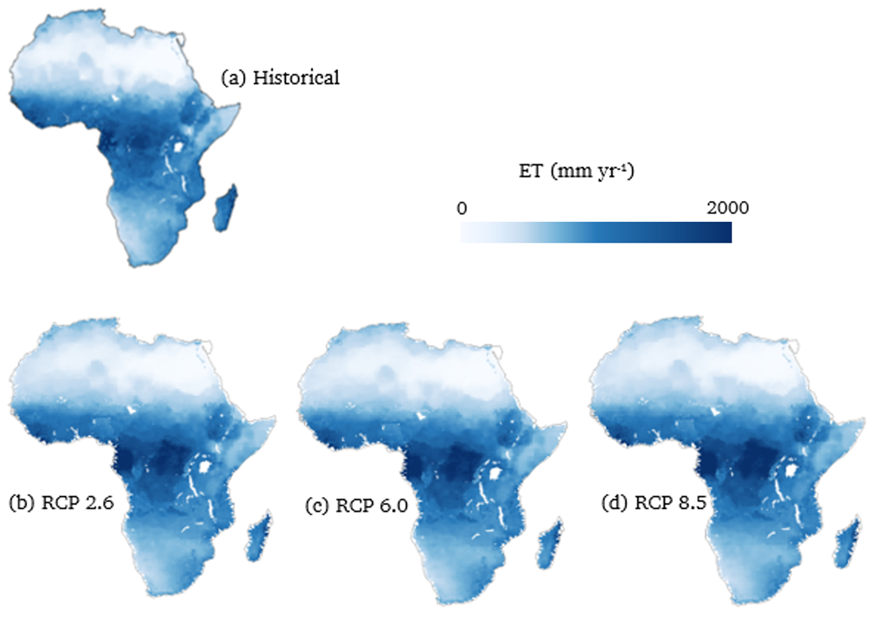
Figure 7Annual mean ET for (a) a historical period (1976–2005) and a future period (2071–2100) under (b) RCP2.6, (c) RCP6.0 and (d) RCP8.5 for CC.
The increases in precipitation in the Ethiopian Highlands are matched by an increase in ET in the same area (Fig. 8) under all RCPs under CC. The central parts of Africa also show a similar signal for both precipitation and ET under CC. There is also a strong ET decrease in the Senegal River basin and coastal North Africa compared to the region south of the Niger River basin (4.5–13.5∘ N, −7.0–2.0∘ E) and most of the region south of the 7∘ S latitude. In contrast, a large increase in ET is projected over the Ethiopian Highlands and parts of the upper White Nile river basin averaging up to 46 mm yr−1 under RCP2.6 and 160 mm yr−1 under RCP8.5 (Fig. 8b and c).

Figure 8Annual mean ET change for the future period (2071–2100) under (a) RCP2.6, (b) RCP6.0 and (c) RCP8.5 for CC and (d) RCP2.6, (e) RCP6.0 and (f) RCP8.5 for CC and LULCC (maps are calculated by subtracting ET for the future period by ET for the historical period, 1976–2005).
In contrast to the pure CC effect, the ET under the combined effects of CC and LULCC in the Congo River basin decreases in the future, especially for RCP2.6 (−207 mm yr−1 change for CC and LULCC vs. 96 mm yr−1 change for CC; Fig. 8d, e and f). The role of the CC is also apparent under CC and LULCC. Under CC and LULCC, there is a larger decrease in ET under RCP2.6 (Fig. 8d) than under RCP8.5 (Fig. 8f), while there is a smaller increase in ET under pure CC in RCP2.6 (Fig. 8a) compared to RCP8.5 (Fig. 8c).
Madagascar shifts from lower ET under CC alone (−42, −65 and −59 mm yr−1 for RCPs 2.6, 6.0 and 8.5, respectively) to increased ET under CC and LULCC (44, 92 and 26 mm yr−1 for RCPs 2.6, 6.0 and 8.5, respectively). There is also a shift within the CC and LULCC scenarios from a negative change in ET under RCP2.6 to a positive change in ET under RCPs 6.0 and 8.5 for parts of East Africa, Liberia and Guinea (10.2–11.1∘ N, 13–9∘ W).
3.2.3 Projected changes in water availability
The inclusion of the land-use scenarios modifies the signal of change in water availability (here defined as precipitation − ET) in the Congo River basin. There is an overall reduction in water availability under CC of −79, −64 and −57 mm yr−1 under RCPs 2.6, 6.0 and 8.5, respectively, while there is an increase of over 120 mm yr−1 in available water under CC and LULCC (Fig. 9).
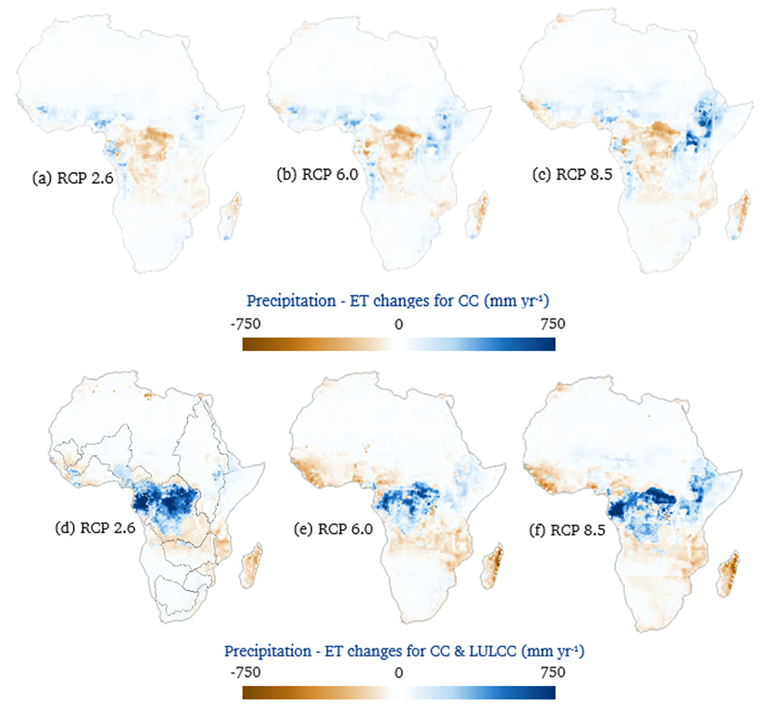
Figure 9Annual mean water availability (P–ET) change for future period (2071–2100) under (a) RCP2.6, (b) RCP6.0 and (c) RCP8.5 for CC and (d) RCP2.6, (e) RCP6.0 and (f) RCP8.5 for CC and LULCC. (Maps are calculated by subtracting average precipitation–ET for the future period by average precipitation–ET for the historical period, 1976–2005.)
In West Africa, an increase in water availability is projected under all RCPs under CC alone. On average, water availability in the Niger River basin increases by 44 mm yr1 under RCP2.6, 50 mm yr1 under RCP6.0 and 37 mm yr1 under RCP8.5. There is also a 22 mm yr1 increase in water availability in the Niger River basin under RCP2.6 if both CC and LULCC are considered but a reduction of −25 and −3 mm yr1 for RCP6.0 and RCP8.5, respectively.
In the Senegal River basin, the increase in water availability under RCP2.6 for the CC-only scenario is caused by a small decrease in precipitation in future climate that is accompanied by an even smaller decrease in ET as a response, leading to an excess in the change in water availability. RCPs 6.0 and 8.5 also show a decrease in both precipitation and ET, but there is a deficit in water availability by 8 mm yr−1 for RCP6.0 and 11 mm yr−1 for RCP8.5 under CC. When both CC and LULCC are considered in the Senegal River Basin, all RCPs show a greater decrease in water availability. Thus, in West Africa, combining CC and LULCC scenarios reduces the water availability values relative to the CC-only scenario.
The Orange River basin is projected to experience an increase in water availability under CC under RCPs 2.6 and 6.0, while for RCP8.5 there is a reduction of −13 mm yr1. In contrast, the Zambezi River has a negative signal under all RCPs in CC averaging −22 mm yr1 and under CC and LULCC (except RCP8.5) averaging −39 mm yr1. With a decrease in precipitation in Madagascar under all CC RCPs, there is a reduction in the water availability under CC, but there is even more reduction when LULCC is considered (Fig. 9).
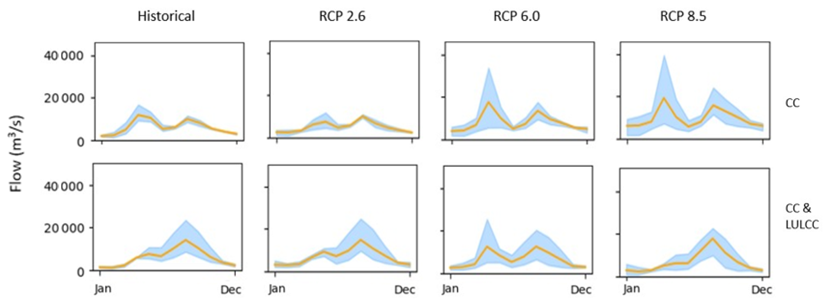
Figure 10Mean monthly river flows averaged across GCMs for the Nile Basin outlet at Aswan (22.7∘ N, 32.50∘ E) for the historical period (1975–2005), RCP2.6, RCP6.0 and RCP8.5 (2070–2100) under (a) CC and (b) CC and LULCC. (Orange line represents the mean, while the sky-blue band represents the range of values across GCMs.)
3.2.4 Projected changes in river flows
River flows under CC were reduced by the inclusion of LULCC in the Senegal, Niger and Orange River basins while river discharge increased in the Congo River basin (Fig. 11). The Limpopo, Zambezi and Nile rivers had either an increase or a decrease in river flows depending on RCP. Overall changes in average river flows from the major river basins were within −30 % to 30 % for all RCPs except for the Nile and the Niger River basins, where annual average river flows are projected to increase by over 70 % under RCP6.0 and by over 100 % under RCP8.5.
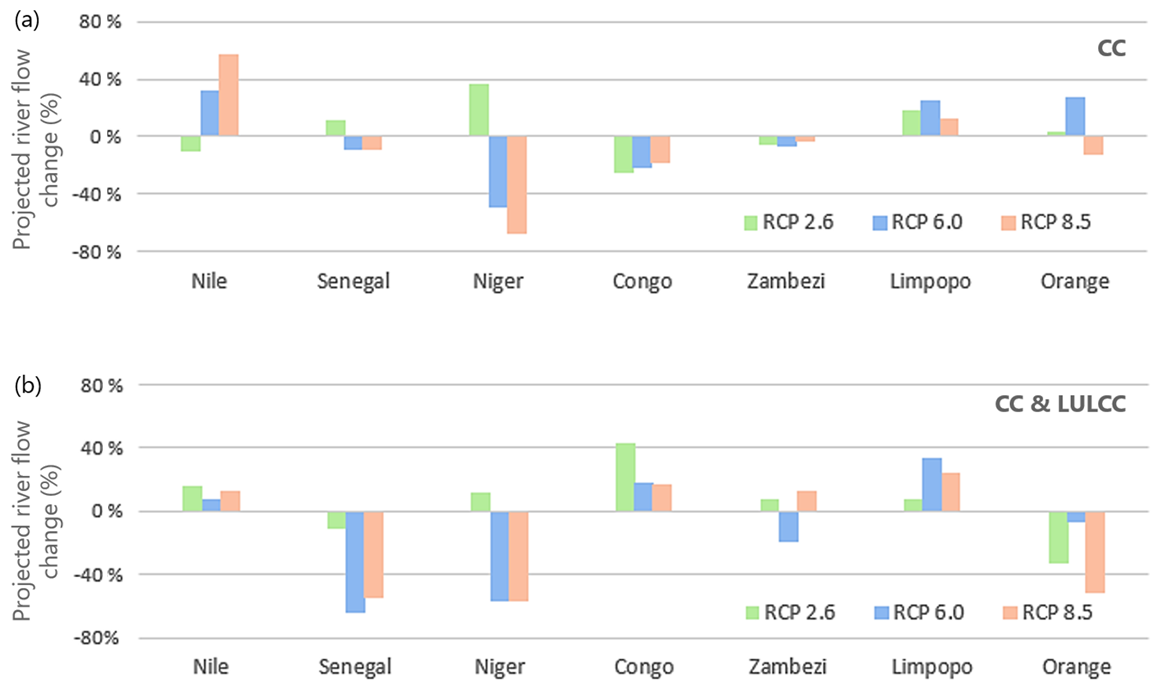
Figure 11Projected change in river flow (%) for the future period (2071–2100) relative to the historical period (1976–2005) obtained from multi-model mean of average annual river flows at the outlet of major basins in (Fig. 1) (The percentage change for the Nile was calculated just before Lake Nasser.)
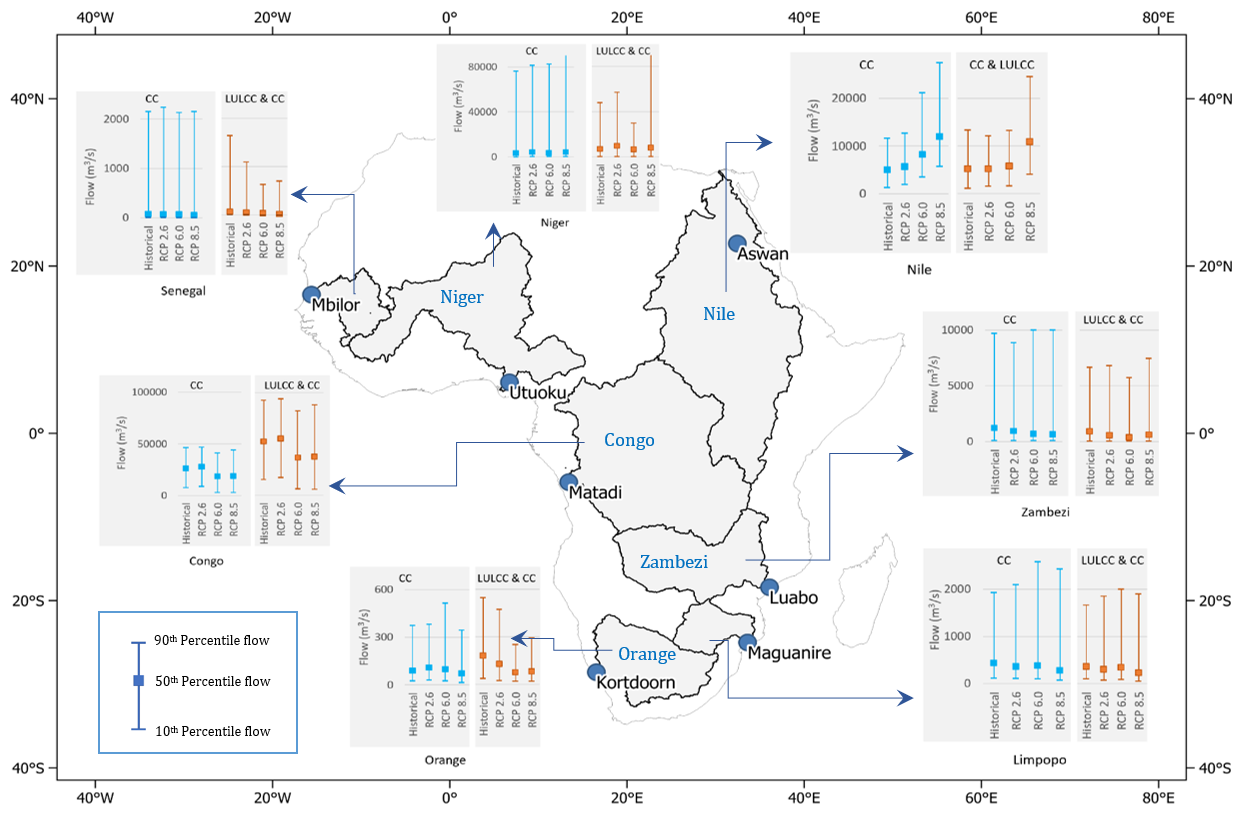
Figure 12The 10th, 50th and 90th percentile river flows across major river basins in Africa under CC and under CC and LULCC for the historical period (1975–2005) and RCP2.6, RCP6.0 and RCP8.5 (2070–2100).
A closer look revealed that simulation CC-RCP60 (Table 1) with the IPSL-CM5A-LR GCM had a reservoir bug where unrealistic discharge of 1.38×10¹¹ m3 s−1 was released in May, 2086 from the Nile reservoir at Owen Falls. Another reservoir failed in the Niger River basin for simulation CC-RCP85 with the MIROC5 GCM releasing 1.38×10¹³ m3 s−1 in August 2084. With these cases of reservoir simulation instabilities, the IPSL-CM5A-LR GCM was excluded for the Nile River basin, and the MIROC5 GCM was not included for the Niger River basin. Figure 12 characterises projections under pure CC and projections under combined CC and LULCC.
In the Nile, peak river flows are simulated in March, April, May and August, September and October. Under RCP2.6, there is a general decrease in monthly river flows under CC in the Nile driven by a 15 % reduction in river flows in the peak flow months. In contrast, there are 28 % and 50 % increases in the same months under RCP6.0 and RCP8.5 (Fig. 11a). The monthly river flow changes under CC and LULCC were less than under pure climate except under RCP2.6, where there was an increase in projected river flows (Fig. 11b).
In the Senegal River basin, there was only a slight change in the mean monthly river flows under CC (Fig. 11a). However, the spread of values across GCMs increased from the historical period to RCPs 2.6, 6.5 and 8.5. Also, the river flows in September are, on average, greater than those in August under RCP8.5, which is different when compared to the historical period and the other RCPs (Fig. 13). When LULCC is considered, the mean monthly river flows in the wet months of July to October decrease towards the future (Fig. 13), leading to an overall decrease in river flows under CC and LULCC (Fig. 11).
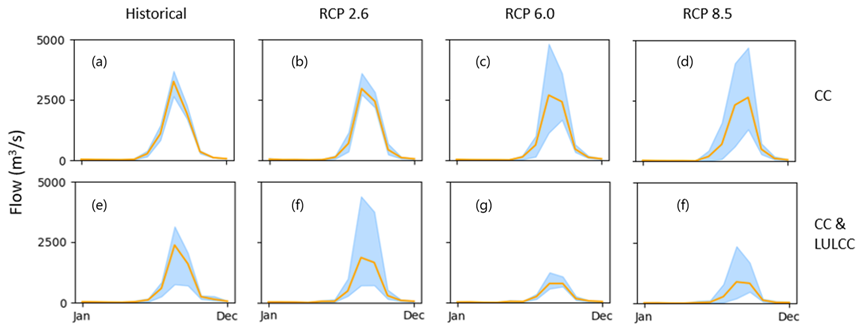
Figure 13Mean monthly river flows averaged across GCMs for the Senegal River Basin outlet at Mbilor (16.58∘ N, 15.61∘ W) for the historical period (1975–2005), RCP2.6, RCP6.0 and RCP8.5 (2070–2100) under (a) CC and (b) CC and LULCC. (Orange line represents the mean, while the sky-blue band represents the range of values across GCMs.)
In the Niger River basin, the upper part of the basin has different dynamics from the lower part. Looking at the outlet at Amgoundji (17.06∘ N, 1.12∘ W), there is an increase in river flows during the wet months (August to December) under RCPs 2.6, 6.0 and 8.5 of 61 %, 71 % and 58 % of the historical period river flows, respectively, for the same months under CC. Accounting for LULCC in addition to CC leads to a reduction in average discharge under RCPs 2.6 and 6.0 of 48 % and 4 % but to an increase under RCP8.5 of 7 %.
The mean monthly river flows in the Congo River basin show an overall decrease under all CC scenarios compared to the historical period (Fig. 11a). The decreases are spread throughout both wet and dry months of the year. There is also an increase in the spread of values across GCMs at the outlet of the Congo River basin. Under CC and LULCC, there is more interannual variability in river flows within the GCMs for all scenarios (Fig. 14).
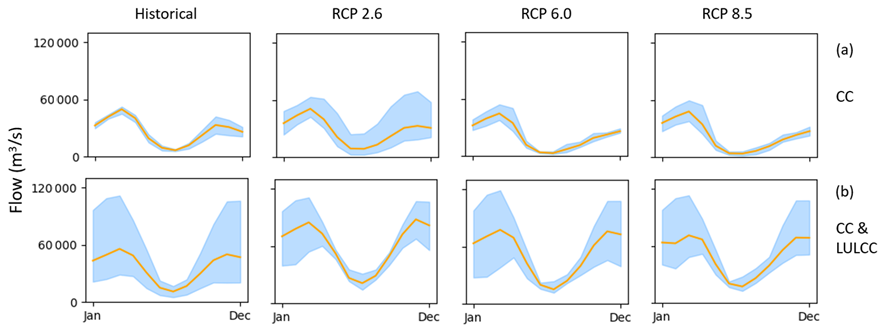
Figure 14Mean monthly river flows averaged across GCMs for the Congo Basin outlet at Matadi (5.80∘ S, 13.40∘ E) for the historical period (1975–2005), RCP2.6, RCP6.0 and RCP8.5 (2070–2100) under (a) CC and (b) CC and LULCC. (Orange line represents the mean, while the sky-blue band represents the range of values across GCMs.)
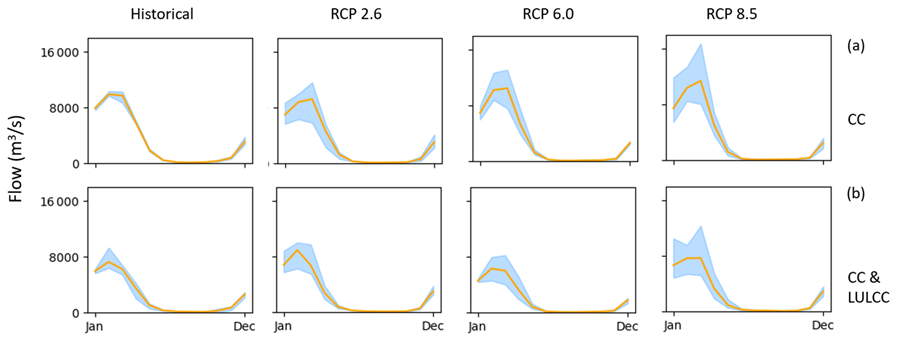
Figure 15Mean monthly river flows averaged across GCMs for the Zambezi River Basin outlet at Luabo (18.40∘ S, 36.10∘ E) for the historical period (1975–2005), RCP2.6, RCP6.0 and RCP8.5 (2070–2100) under (a) CC and (b) CC and LULCC. (Orange line represents the mean, while the sky-blue band represents the range of values across GCMs.)
The average river flows for the Zambezi River in the historical period are similar in both CC and CC and LULCC, but there is an increase in river flows projected under CC and LULCC in future scenarios. The changes in mean monthly river flow at the outlet of the Zambezi River basin, Luabo (18.40∘ S, 36.08∘ E), were within 10 % on average (Fig. 11), but the range of the spread of values across GCMs increases from the historical period, RCP2.6 and RCP6.0 to RCP8.5 (Fig. 15). With LULCC, the river flows in the Zambezi River basin show an increase under RCPs 2.6 and 8.5 (Fig. 11), but this is because of lower simulated historical values under LULCC (Fig. 15b).
The Limpopo River basin is projected to experience a slight increase in both the monthly mean river flows in the wet months (January to April) and a larger variability in the river flows from the historical periods to future periods under CC. Under CC and LULCC, river flows increase from CC scenarios under all RCPs but RCP6.0 has the largest increase in monthly flow during the wet months of up to 33 % (Fig. 16).
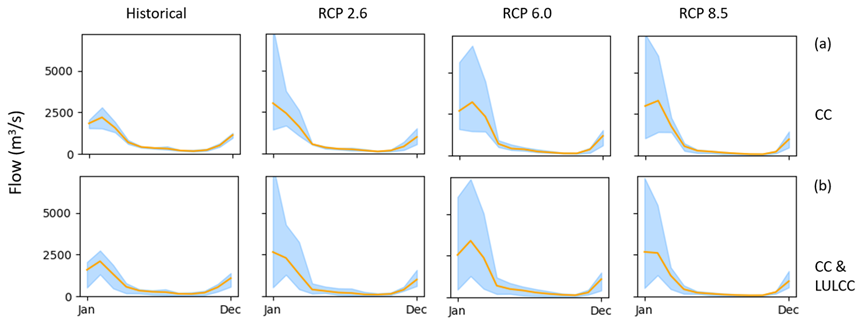
Figure 16Mean monthly river flows averaged across GCMs for the Limpopo River basin outlet for the historical period (1975–2005), RCP2.6, RCP6.0 and RCP8.5 (2070–2100) under (a) CC and (b) CC and LULCC. (Orange line represents the mean, while the sky-blue band represents the range of values across GCMs.)
For the Orange River basin, an increase in average mean monthly river flows is projected in the wet months (October to April) across GCMs for CC under RCP2.6 and RCP6.0 of 4 % and 32 %, respectively, while river flow in RCP8.5 demonstrates a decrease in the wet months (Fig. 17). The spread in values across GCMs also increases relative to the historical period, with the largest change observed under RCP6.0. Under both CC and LULCC, the monthly river flows in the river basin decrease from the CC river flows across all RCPs (Fig. 11).
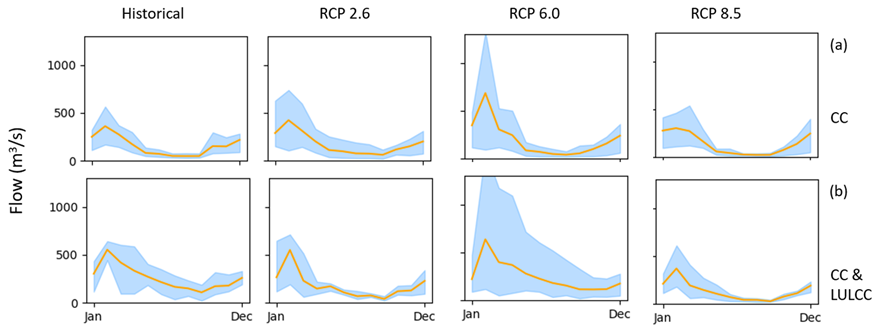
Figure 17Mean monthly river flows averaged across GCMs for the Orange River basin outlet for the historical period (1975–2005), RCP2.6, RCP6.0 and RCP8.5 (2070–2100) under (a) CC and (b) CC and LULCC. (Orange line represents the mean, while the sky-blue band represents the range of values across GCMs.)
4.1 Model performance of the SWAT+ Africa model after HMBC
The model was calibrated using HMBC following Chawanda et al. (2020a). This methodology aims to match long-term averages of major components of the hydrological cycle. However, even though HMBC does not calibrate against river flows, looking at the changes in performance of river flows may reflect improvements (if any) in the representation of internal processes. There was an improvement in the performance of river flows following calibration (Fig. 2), yet the performance of the model in gauges downstream of reservoirs is consistently poor (Fig. 4). This is mainly due to the difficulty in modelling human control of river discharge at dams holding the water in most reservoirs on the continent. The implementation of generalised decision tables for various reservoir types in this study does improve model performance, but more data are needed for a more accurate representation of reservoir control.
HMBC's ability to target specific components of the hydrological cycle improves the model's ability to capture the average annual values of ET in Africa when compared to the WaPOR dataset, although it slightly underestimated ET in the years 2015 and 2016. The model was able to capture the spatial pattern of ET (Fig. 5). The ability of the model to have a comparable spatial pattern in simulated ET relative to WaPOR ET is in part due to the implementation of irrigation. High ET is observed in areas where irrigation was implemented. In some regions, such as the lower Nile, the model underestimated ET, which may point to under-irrigation, but the values for irrigation simulated by SWAT+ in the Nile Delta are in line with data collected by Kubota et al. (2020), ranging from 320 to 450 mm. Thus, the underestimation may be attributed to having a single growing season implemented in the model, which hinders further transpiration from the irrigated fields (Nkwasa et al., 2022a). Irrigation fields are also very fragmented on the continent due to small-scale agriculture along riverbanks which is not usually reflected in global datasets and poses a challenge in the representation of irrigation in models at such a large scale. As such, there is room for improvement in irrigation datasets and the representation of irrigation in large-scale modelling.
In this study, the application of HMBC was limited in the Nile and Congo River basins due to the lack of gauging stations with river flow data. Thus, HMBC was applied only for ET in some calibration zones. Furthermore, as with most ET products, the reference ET product used (WaPOR) is a result of a “model” which limits the improvements to model performance in some areas.
4.2 Impacts of climate change
The increase in precipitation over the Ethiopian Highlands (Fig. 6) is reflected in the river flows for the Nile River basin (Fig. 11). The increase in precipitation was slightly offset by an increase in ET over the Ethiopian Highlands area (Fig. 8), which takes away from water available for surface runoff and infiltration. However, there is still a significant increase in the available water for the Upper Nile in the future period (Fig. 9), leading to overall increases in river flows along the entire Nile River. In their study to find impacts of CC in the Nile Basin, Di Baldassarre et al. (2011) show an ensemble of models that project changes in river flows at El Diem at the outlet of the upper Blue Nile (near the Ethiopia–Sudan border) ranging from −67 % to 55 % by 2098. The disagreements in the signal of future annual river flows point to a high uncertainty in future river flows for the river basin. However, Conway (2017) argues that the river flows in the Nile are more likely to increase in the future.
The results also indicate an increase in variability in flows in the Nile River under CC (Fig. 10). This is in line with findings from other studies, such as that by Siam and Eltahir (2017), which project an up to 50 % increase in interannual variability. The Nile River is important geo-politically since countries upstream and downstream of the river have to work together in managing optimal river flows for all interested parties. While the construction of the Grand Ethiopian Renaissance Dam may reduce the river flows downstream permanently (Ramadan and Negm, 2013), such a dam could act as a buffer for the increased extreme events (Sterl et al., 2021). In addition, an overall increase in river flows due to CC would offset flow decreases after the construction of the dam.
The results show that precipitation is likely to decrease in the Senegal River basin due to CC. This has the potential of extending the Sahara further down. Projections show an overall decrease in river flows in the future under CC. The future drying up of the Senegal River, in addition to sea-level rise (Croitoru et al., 2019), has important implications in the area. Roughly 70 % of the population in the river basin earns a living through agriculture (Kohli and Alam, 2018). Saltwater intrusion into aquifers and arable land, which has been observed in the area (Delphine, 2013), is likely to intensify under CC, which would further devastate the agricultural sector and hence the livelihood of the population of the Senegal River basin.
Projections for the Niger River basin show an increase in overall river flows under RCP2.6 and a decrease in river flows and available water if the outlier GCM for the area (MIROC5) is not accounted for. The same signals were projected in the Senegal River basin. West Africa has experienced a southward shift in climatic zones (Wittig et al., 2007), leading to drier conditions in the northern parts of the region (IPCC, 2021). The projected drying of the Niger River basin together with the Senegal River basin implies further desertification of the northern parts of West Africa, which will further expand the Sahara Desert.

Figure 18Mean monthly river flows averaged across four GCMs for the Ubangi River at Bangui (Congo River basin) in the historical period (1976–2005) and in the future period (2071–2100) under RCP2.6, RCP6.0 and RCP8.5.
The projections show a decrease in the river flows from the Congo River basin and Zambezi River basin (Fig. 11). The decreases in the Congo River basin flows can be attributed to a decrease in river flows during wet months. This is apparent at Bangui (4.36∘ N, 18.58∘ E) along the Ubangi River (Fig. 18) but is not apparent for the main outlet of the Congo River basin (Fig. 14). The overall decrease in river flows in the Zambezi River basin is attributed to a decrease in river flows during dry months even though there was an increase in peak river flows in wet months for all RCPs. This is in line with the relative changes in precipitation and ET in the basin. There is a larger drop in future rainfall compared to the drop in future ET which leads to an increased deficit in available water (Fig. 19b). Unlike in the Zambezi River basin, the overall decrease in water availability in the Congo is due to a higher increase in ET than the increase in precipitation for the future period (Fig. 19a).
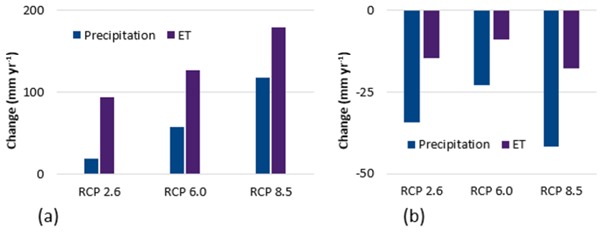
Figure 19Changes in spatially averaged annual ET vs. changes in spatially averaged annual precipitation in the (a) Congo River basin and (b) Zambezi River basin, under CC for simulated scenarios for the future period (2071–2100) relative to the historical period (1976–2005).
Unlike in the Congo River basin, the river flows in the Zambezi River basin do not change much but show more variability in the future CC scenarios than in the historical period. The increased variability in river flows was also observed in the Limpopo River basin with an increase in overall river flows from the catchment. This is because the change in water availability increases in the future for RCPs 2.6, 6.0 and 8.5 by 14, 18 and 7 mm yr1, respectively. The increase is, however, observed in wet months (December to April), but there is still a slight decrease in flow in the dry months.
The increased flow variability in both the Zambezi and the Limpopo rivers could mean increased occurrence of extreme events such as more floods and droughts. With agriculture being the main source of livelihood in the basins, crop failure due to drought or flooding could leave millions in need of food aid. This calls for coordination between the countries that share the basins to combat the impacts of future climate variability.
The behaviour observed in the Senegal River basin under RCP2.6 is also observed in the Orange River basin for RCPs 2.6 and 6.0, while the behaviour observed in the Senegal River basin under RCPs 6.0 and 8.5 is also observed in the Orange River basin under RCP8.5. Herring et al. (2018) pointed out that the prevalence of droughts in South Africa has tripled in the last 60 years due to CC. The occurrence of droughts is likely to increase with the projected future decrease in precipitation in the Orange River basin (Fig. 6). This is in line with a study by Pokhrel et al. (2021), who predict a general increase in drought hazards in the Southern Hemisphere. Thus, agricultural production is likely to suffer due to insufficient rains as more droughts are to be expected in the future. The model suggests a slight increase in available water under CC in the Orange River basin, but this is due to ET being very sensitive to the decrease in precipitation.
All projections are characterised by a wider spread in flow values across GCMs in the future, which is caused mainly by enhanced climate variability in each of the GCMs.
4.3 Impacts of land-use change
The combined impacts of CC and LULCC on ET are more pronounced under all RCPs compared to the pure CC impacts (Fig. 8). LULCC had the strongest impact in the Nile, Congo, Senegal and Orange River basins. The Congo River basin shows a strong decline in ET under RCP2.6 with mild changes in ET all over the continent under combined drivers. RCPs 6.0 and 8.5 show a weaker decrease for ET in the Congo Basin compared to RCP2.6 but a stronger signal elsewhere. The reduction in ET in the Congo Basin is mainly driven by projected deforestation under all RCPs (see Fig. 20 a for RCP8.5). Both the reduction in ground cover and reduced ET lead to increased surface runoff (Fig. 11b).
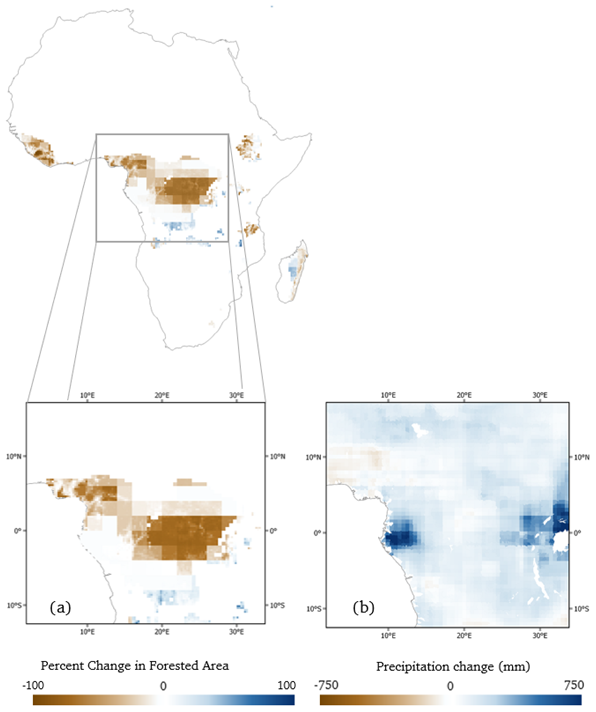
Figure 20(a) Percentage change in forested area under RCP8.5. (b) Precipitation change under RCP8.5 for Central Africa. The changes are from the historical period (1975–2005) to the future period (2070–2100).
With deforestation in mind, precipitation is expected to reduce in the future. Dyer et al. (2017) concluded that a significant proportion of the moisture responsible for rainfall in the Congo River basin comes from the Indian Ocean (which may also be amplified under CC) and, thus, deforestation is not expected to drive precipitation changes in the area. For the moisture that is recycled within the basin, it is likely that the increased precipitation due to greenhouse gas forcing is more important than the decrease in ET due to deforestation.
In West Africa, especially Senegal, increased agricultural activity is responsible for the future increase in ET under LULCC in the area but with projected precipitation, Available water is expected to decrease further than that under CC alone. This makes the situation for agriculture in the Senegal River basin higher risk if LULCC is considered. This is in addition to saltwater intrusion and a potential increase in droughts. A similar situation is observed in Madagascar where increased agricultural activity reduces the water availability in the future by promoting evapotranspiration under LULCC. With a projected decrease in precipitation, water stress is expected to become an issue. However, no literature documenting the same saltwater intrusion problems and loss of coastal lands due to sea-level rise experienced in Senegal was found.
LULCC has minimal impact in the Zambezi and Limpopo River basins due to mild changes in future scenarios of LULCC. If these LULCC scenarios are realised, climate variability could be a more important issue in the Zambezi and Limpopo River basins unlike in the Congo or Senegal River basins.
In the Orange River basin, there is an increase in agricultural land on the east side of the catchment, where a significant proportion of the water comes from. This change in LULCC in addition to future precipitation decreases reduces the water availability in the area under CC and LULCC and hence leads to a reduction in river flows at the outlet of the river basin.
Studies focusing on the impacts of LULCC on hydrological indicators such as ET and surface runoff in Africa often look at historical impacts and are done at a very small scale, e.g. Warburton et al. (2012) and Yira et al. (2016). Very few studies have investigated the hydrological effects of future land-use change. For example, Näschen et al. (2019) looks at land impacts of LULCC until 2030 on water resources, but the differences in LULCC development and the small-scale nature of the study do not allow a direct comparison of results. However, such studies highlight that LULCC can have substantial effects on hydrological indicators.
The results of CC and LULCC projections also show artefacts in the ET and water availability change maps. These are caused by artefacts in either the land-use scenarios that were used (Fig. 20a) or the weather forcing (Fig. 20b). These artefacts were also observed in Chawanda et al. (2020a).
The limitations of this modelling study include non-overlapping observation data, a lack of reservoir management data, poor-resolution input data, limited information on agricultural management practices and an assumption about the source of irrigation water. These limitations are also mentioned in the study by Chawanda et al. (2020a), but another limitation was discovered for reservoirs that start working during the simulation period. These reservoirs did not let water pass through until the year they became operational, which is erroneous. The bug was reported to the developers. There were also bugs in very large reservoirs where the reservoir continued to grow in surface area beyond the maximum surface area specified during model setup. This was specifically observed in Lake Nasser and a few reservoirs in West Africa. We also acknowledge that the vegetation in our model does not respond to heat waves as it might in the real world.
In this study, we set up a SWAT+ model for the all of Africa using SWAT+ AW (Chawanda et al., 2020b). We implemented irrigation, reservoirs and HMBC. We also modified the model to incorporate transient land-use change and used the model to run projections under RCPs 2.6, 6.0 and 8.5 using four GCMs with and without land-use change.
We have demonstrated that apart from changes in precipitation, the response in ET plays a substantial role on whether water availability will increase or decrease. The Niger River basin is likely to experience the largest reduction in the river flows under RCPs 6.0 and 8.5, while the Congo River basin is likely to experience reduced river flows under all RCPs. At the same time, the Limpopo River will likely see an increase in river flows under a future climate. The largest increases in river flows are observed in the Nile under RCPs 6.0 and 8.5.
The Congo basin is likely to have less ET and more water availability under the combined effects of CC and LULCC. LULCC is also likely to lead to more stress on water availability in the Senegal and the Orange River basins. The effects of LULCC on river flows point to the potential of using land use as an adaptation measure to future hydrological changes.
Further studies can be done based on the rich data produced in this study. While CC is likely to cause drier dry months and wetter wet months in most major river basins in Africa, it is still unclear whether the frequency, intensity and duration of wet and dry extreme events will increase or decrease. Thus, further study is needed to analyse how climate change will affect the frequency and duration of the above-mentioned events. Further work needs to be done on the reservoirs in the SWAT+ code to allow water through a reservoir even before the year that the reservoir became operational. Multiple growing seasons should be implemented in the SWAT+ model as suggested by Nkwasa et al. (2022b) based on available cropping patterns from global datasets to account for ET coming from rainfed and irrigated crops.
Results show that precipitation will be reduced mainly in North Africa, the Senegal region and south-eastern Africa, including Madagascar, while large increases are expected in the Ethiopian Highlands. ET will likely increase under CC around the Equator region driven by an increase in precipitation in the same area, while North Africa, West Africa and most of southern Africa will experience lower ET driven by a decline in average rainfall in those regions under CC. The changes in average river flows mostly depend on the change in water availability. Projections show that the Congo River basin is likely to experience lower average river flows in the future due to CC under all RCPs, while the Niger River is likely to experience a strong decrease in river flows under RCPs 6.0 and 8.5. The Limpopo River (under all RCPs) and the Nile (under RCPs 6.0 and 8.5) are likely to experience higher average river flows in the future due to CC. The Nile, the Senegal and the Orange River basins have mixed signals between RCPs, which calls for more careful planning of water resources for the future in these regions to account for the uncertainties in current-generation projections.
Combining CC and LULCC results in larger signals in changes in ET than only considering CC. The Congo Basin has a strong decrease in ET under LULCC and CC, yet it has an increase in ET under CC alone. The Congo River basin also experiences a shift from a decrease in river flows under pure CC scenarios to an increase in river flows when LULCC is considered. In the Senegal and the Orange River basins and Madagascar, increased agricultural activity negatively impacts water availability and increases ET.
The projected changes have huge implications on the livelihood of people in Africa. Increased rainfall and river flow variability pose a threat of increased frequencies of floods and droughts and will likely threaten agricultural production across the continent. Africa is dominated by small-scale farming with farmers heavily dependent on rainfall (Thornton et al., 2014), which makes the livelihood of people on the continent vulnerable to projected hydrological changes. There is a need to establish agricultural policies and practices that increase resilience against CC. Hasan et al. (2019) estimate that a 10 % decrease in future water resources would affect 57 % of the African population for 2050 projections.
We have demonstrated that LULCC can have significant effects on water resources. Governments can adopt land-use policies as one of the adaptation measures to counter the effects of CC. In addition, governments should develop land policies to stop the current deforestation trend on the continent as combined climate and land-use change can have a higher impact on water resources than pure CC. However, the impacts of pure CC should not be underestimated. CC has already had devastating impacts in many regions in Africa, from increased frequency of droughts to flooding. As such, policies that help curb greenhouse gas emissions need to be employed all over the continent to limit CC.
The tools used in this study are available from the HYDR repository (https://github.com/VUB-HYDR, last access: 16 December 2023) and through Zenodo (https://doi.org/10.5281/zenodo.10393517, Chawanda, 2020). Simulation results are very big in size (greater than 1 TB) and cannot easily be hosted online. These are available upon request. All input data are from open sources.
The digital elevation model (DEM) data were taken from the Shutter Radar Topography Mission (Farr et al., 2007).
The land-use map was prepared from the Land-Use Harmonization Project phase 2 (LUH2; Hurtt et al., 2011).
Soil data with a 250 m × 250 m resolution were obtained from the Africa Soil Information Service (AfSIS; Hengl et al., 2015).
Monthly discharge observation data were obtained from the Global Runoff Data Centre (BfG – The GRDC, 2019).
Irrigated areas were obtained from the Food and Agriculture Organisation at a 0.083∘ × 0.083∘ resolution (FAO; https://doi.org/10.2499/9780896298460_08, Siebert and Karen, 2014).
Reservoir data were obtained from the Global Reservoir and Dam (GRanD) database (Beames et al., 2019).
Yearly ET data were obtained from CSIRO's Moderate resolution imaging spectroradiometer reflectance Scaling Evapotranspiration (CMRSET; Guerschman et al., 2009) and Water Productivity through Open access of Remotely sensed derived data (WaPOR; FAO, 2018) at a resolution of 0.0022∘ × 0.0022∘.
The EartH2Observe, WFDEI and ERA-Interim data Merged and Bias-corrected for ISIMIP (EWEMBI; Lange, 2016, https://doi.org/10.5880/PIK.2016.004) datasets were obtained for weather forcing through the Inter-Sectoral Impact Model Intercomparison Project (ISIMIP) at a daily time step. Additionally, daily weather forcing was obtained through ISIMIP for four bias-adjusted global climate models (GCMs) under the Representative Concentration Pathways (RCPs) 2.6, 6.0 and 8.5: GFDL-ESM2M, HadGEM2-ES, IPSL-CM5A-LR and MIROC5.
Please refer to Chawanda et al. (2020a) for a detailed description.
The supplement related to this article is available online at: https://doi.org/10.5194/hess-28-117-2024-supplement.
CJC, WT and AvG developed the research idea; CJC collected data and set up the model; CJC, WT and AvG analysed the results; CJC, AN, WT and AvG discussed the results; CJC wrote the paper; WT, CJC, AvG and AN edited and reviewed the paper.
At least one of the (co-)authors is a member of the editorial board of Hydrology and Earth System Sciences. The peer-review process was guided by an independent editor, and the authors also have no other competing interests to declare.
Publisher's note: Copernicus Publications remains neutral with regard to jurisdictional claims made in the text, published maps, institutional affiliations, or any other geographical representation in this paper. While Copernicus Publications makes every effort to include appropriate place names, the final responsibility lies with the authors.
The authors thank The Research Foundation – Flanders (FWO) for funding the International Coordination Action (ICA) “Open Water Network: Open Data and Software tools for water resources management” (Project Code G0E2621N) and the EU H2020 project Defining the future of inland water services for Copernicus (Water-ForCE), grant agreement no. 101004186.
This paper was edited by Nadia Ursino and reviewed by two anonymous referees.
Achard, F., Eva, H. D., Stibig, H.-J., Mayaux, P., Gallego, J., Richards, T., and Malingreau, J.-P.: Determination of deforestation rates of the world's humid tropical forests, Science, 297, 999–1002, https://doi.org/10.1126/science.1070656, 2002.
Akkermans, T., Thiery, W., and Van Lipzig, N. P. M.: The regional climate impact of a realistic future deforestation scenario in the congo basin, J. Climate, 27, 2714–2734, https://doi.org/10.1175/JCLI-D-13-00361.1, 2014.
Arnold, J. G., Moriasi, D. N., Gassman, P. W., Abbaspour, K. C., White, M. J., Srinivasan, R., Santhi, C., Harmel, R. D., Van Griensven, A., and Van Liew, M. W.: SWAT: Model use, calibration, and validation, T. ASABE, 55, 1491–1508, 2012.
Arnold, J. G., Youssef, M. A., Yen, H., White, M. J., Sheshukov, A. Y., Sadeghi, A. M., Moriasi, D. N., Steiner, J. L., Amatya, D. M., Skaggs, R. W., Haney, E. B., Jeong, J., Arabi, M., and Gowda, P. H.: Hydrological processes and model representation: Impact of soft data on calibration, T. ASABE, 58, 1637–1660, https://doi.org/10.13031/trans.58.10726, 2015.
Arnold, J. G., Bieger, K., White, M. J., Srinivasan, R., Dunbar, J. A., and Allen, P. M.: Use of decision tables to simulate management in SWAT+, Water (Switzerland), 10, 1–10, https://doi.org/10.3390/w10060713, 2018.
Bais, A. F., McKenzie, R. L., Bernhard, G., Aucamp, P. J., Ilyas, M., Madronich, S., and Tourpali, K.: Water Vapor Transport in CMIP5, Photochem. Photobio. S., 14, 19–52, https://doi.org/10.1002/2015GL064672, 2015.
Beames, P., Lehner, B., and Anand, M.: Global Reservoir and Dam (GRanD) database: Technical documentation v1.3.3, , https://www.globaldamwatch.org/directory (last access: 16 December 2023), 2019.
Beniston, M., Williams, C. J. R., Kniveton, D. R., Smith, C., Wood, S., and Black, R.: African Climate and Climate Change, 43, 179–201, https://doi.org/10.1007/978-90-481-3842-5, 2011.
BfG – The GRDC: http://grdc.bafg.de, last access: 6 June 2019.
Bieger, K., Arnold, J. G., Rathjens, H., White, M. J., Bosch, D. D., Allen, P. M., Volk, M., and Srinivasan, R.: Introduction to SWAT+, A Completely Restructured Version of the Soil and Water Assessment Tool, J. Am. Water Resour. As., 53, 115–130, https://doi.org/10.1111/1752-1688.12482, 2017.
Boulange, J., Hanasaki, N., Satoh, Y., Yokohata, T., Shiogama, H., Burek, P., Thiery, W., Gerten, D., Müller Schmied, H., Wada, Y., Gosling, S. N., Pokhrel, Y., and Wanders, N.: Validity of estimating flood and drought characteristics under equilibrium climates from transient simulations, Environ. Res. Lett., 16, 104028, https://doi.org/10.1088/1748-9326/ac27cc, 2021.
Cartwright, A.: Better growth, better climate, better cities: Rethinking and redirecting urbanisation in Africa, Glob. Comm. Econ. Clim., 1–44, https://www.cisl.cam.ac.uk/system/files/documents/NCE-APP-final.pdf (last access: 10 December 2023), 2015.
Chawanda, C. J.: SWAT+ AW v1.0.4, Zenodo [code], https://doi.org/10.5281/zenodo.10393517, 2020.
Chawanda, C. J., Arnold, J., Thiery, W., and van Griensven, A.: Mass balance calibration and reservoir representations for large-scale hydrological impact studies using SWAT+, Clim. Change, 163, 1307–1327, https://doi.org/10.1007/s10584-020-02924-x, 2020a.
Chawanda, C. J., George, C., Thiery, W., Griensven, A. van, Tech, J., Arnold, J., and Srinivasan, R.: User-friendly workflows for catchment modelling: Towards reproducible SWAT+ model studies, Environ. Modell. Softw., 134, 104812, https://doi.org/10.1016/j.envsoft.2020.104812, 2020b.
Conway, D.: Future Nile river flows, Nat. Clim. Change, 7, 319–320, https://doi.org/10.1038/nclimate3285, 2017.
Croitoru, L., Miranda, J. J., and Sarraf, M.: The Cost of Coastal Zone Degradation in West Africa: Benin, Côte D’Ivoire, Senegal and Togo, World Bank Gr., p28, http://hdl.handle.net/10986/31428 (last access: 14 May 2021), 2019.
De Hertog, S. J., Havermann, F., Vanderkelen, I., Guo, S., Luo, F., Manola, I., Coumou, D., Davin, E. L., Duveiller, G., Lejeune, Q., Pongratz, J., Schleussner, C.-F., Seneviratne, S. I., and Thiery, W.: The biogeophysical effects of idealized land cover and land management changes in Earth system models, Earth Syst. Dynam., 13, 1305–1350, https://doi.org/10.5194/esd-13-1305-2022, 2022.
Delphine, B. N. A.: Anti-Salt Dam as a Means of Recovering Lowland Degraded by Sea Water: the Case of Lowland Ndour Ndour, Senegal, Am. J. Environ. Protect., 2, 79, https://doi.org/10.11648/j.ajep.20130203.11, 2013.
Di Baldassarre, G., Elshamy, M., van Griensven, A., Soliman, E., Kigobe, M., Ndomba, P., Mutemi, J., Mutua, F., Moges, S., Xuan, Y., Solomatine, D., and Uhlenbrook, S.: Future hydrology and climate in the River Nile basin: a review, Hydrolog. Sci. J., 56, 199–211, https://doi.org/10.1080/02626667.2011.557378, 2011.
Doelman, J. C., Stehfest, E., Tabeau, A., van Meijl, H., Lassaletta, L., Gernaat, D. E. H. J., Hermans, K., Harmsen, M., Daioglou, V., Biemans, H., van der Sluis, S., and van Vuuren, D. P.: Exploring SSP land-use dynamics using the IMAGE model: Regional and gridded scenarios of land-use change and land-based climate change mitigation, Global Environ. Chang., 48, 119–135, https://doi.org/10.1016/j.gloenvcha.2017.11.014, 2018.
Dyer, E. L. E., Jones, D. B. A., Nusbaumer, J., Li, H., Collins, O., Vettoretti, G., and Noone, D.: Congo Basin precipitation: Assessing seasonality, regional interactions, and sources ofmoisture, J. Geophys. Res., 122, 6882–6898, https://doi.org/10.1002/2016JD026240, 2017.
Evans, O.: Digital Agriculture: Mobile Phones, Internet & Agricultural Development in Africa, Actual Probl. Econ., 7–8, 76–90, 2018.
FAO: WaPOR Database Methodology: Level 1. Remote Sensing for Water Productivity Technical Report, Rome, Italy, 72 pp., ISBN 9789251097694, 2018.
Farr, T. G., Rosen, P. A., Caro, E., Crippen, R., Duren, R., Hensley, S., Kobrick, M., Paller, M., Rodriguez, E., Roth, L., Seal, D., Shaffer, S., Shimada, J., Umland, J., Werner, M., Oskin, M., Burbank, D., and Alsdorf, D. E.: The shuttle radar topography mission, Rev. Geophys., 45, RG2004, https://doi.org/10.1029/2005RG000183, 2007.
Foley, J. A., DeFries, R., Asner, G. P., Barford, C., Bonan, G., Carpenter, S. R., Chapin, F. S., Coe, M. T., Daily, G. C., and Gibbs, H. K.: Global consequences of land use, Science, 309, 570–574, 2005.
Frenken, K.: Irrigation in Africa in figures: AQUASTAT survey, Food/Agriculture Org., 29 pp., ISBN 92-5-105414-2, 2005.
Frieler, K., Lange, S., Piontek, F., Reyer, C. P. O., Schewe, J., Warszawski, L., Zhao, F., Chini, L., Denvil, S., Emanuel, K., Geiger, T., Halladay, K., Hurtt, G., Mengel, M., Murakami, D., Ostberg, S., Popp, A., Riva, R., Stevanovic, M., Suzuki, T., Volkholz, J., Burke, E., Ciais, P., Ebi, K., Eddy, T. D., Elliott, J., Galbraith, E., Gosling, S. N., Hattermann, F., Hickler, T., Hinkel, J., Hof, C., Huber, V., Jägermeyr, J., Krysanova, V., Marcé, R., Müller Schmied, H., Mouratiadou, I., Pierson, D., Tittensor, D. P., Vautard, R., van Vliet, M., Biber, M. F., Betts, R. A., Bodirsky, B. L., Deryng, D., Frolking, S., Jones, C. D., Lotze, H. K., Lotze-Campen, H., Sahajpal, R., Thonicke, K., Tian, H., and Yamagata, Y.: Assessing the impacts of 1.5 °C global warming – simulation protocol of the Inter-Sectoral Impact Model Intercomparison Project (ISIMIP2b), Geosci. Model Dev., 10, 4321–4345, https://doi.org/10.5194/gmd-10-4321-2017, 2017.
Garcia-Carreras, L. and Parker, D. J.: How does local tropical deforestation affect rainfall?, Geophys. Res. Lett., 38, L19802, https://doi.org/10.1029/2011GL049099, 2011.
Grant, L., Vanderkelen, I., Gudmundsson, L., Tan, Z., Perroud, M., Stepanenko, V. M., Debolskiy, A. V., Droppers, B., Janssen, A. B. G., Woolway, R. I., Choulga, M., Balsamo, G., Kirillin, G., Schewe, J., Zhao, F., del Valle, I. V., Golub, M., Pierson, D., Marcé, R., Seneviratne, S. I., and Thiery, W.: Attribution of global lake systems change to anthropogenic forcing, Nat. Geosci., 14, 849–854, https://doi.org/10.1038/s41561-021-00833-x, 2021.
Gudmundsson, L., Boulange, J., Do, H. X., Gosling, S. N., Grillakis, M. G., Koutroulis, A. G., Leonard, M., Liu, J., Müller Schmied, H., Papadimitriou, L., Pokhrel, Y., Seneviratne, S. I., Satoh, Y., Thiery, W., Westra, S., Zhang, X., and Zhao, F.: Globally observed trends in mean and extreme river flow attributed to climate change, Science, 371, 1159–1162, https://doi.org/10.1126/science.aba3996, 2021.
Guerschman, J. P., Van Dijk, A. I. J. M., Mattersdorf, G., Beringer, J., Hutley, L. B., Leuning, R., Pipunic, R. C., and Sherman, B. S.: Scaling of potential evapotranspiration with MODIS data reproduces flux observations and catchment water balance observations across Australia, J. Hydrol. (Amst.), 369, 107–119, https://doi.org/10.1016/j.jhydrol.2009.02.013, 2009.
Gyamfi, C., Ndambuki, J. M., and Salim, R. W.: Hydrological responses to land use/cover changes in the Olifants Basin, South Africa, Water (Switzerland), 8, 588, https://doi.org/10.3390/w8120588, 2016.
Hansen, M. C., Potapov, P. V., Moore, R., Hancher, M., Turubanova, S. A., Tyukavina, A., Thau, D., Stehman, S. V., Goetz, S. J., Loveland, T. R., Kommareddy, A., Egorov, A., Chini, L., Justice, C. O., and Townshend, J. R. G.: High-resolution global maps of 21st-century forest cover change, Science, 342, 850–853, https://doi.org/10.1126/science.1244693, 2013.
Hasan, E., Tarhule, A., Hong, Y., and Moore, B.: Assessment of physical water scarcity in Africa using GRACE and TRMM satellite data, Remote Sens., 11, 1–17, https://doi.org/10.3390/rs11080979, 2019.
Hattermann, F. F., Krysanova, V., Gosling, S. N., Dankers, R., Daggupati, P., Donnelly, C., Flörke, M., Huang, S., Motovilov, Y., Buda, S., Yang, T., Müller, C., Leng, G., Tang, Q., Portmann, F. T., Hagemann, S., Gerten, D., Wada, Y., Masaki, Y., Alemayehu, T., Satoh, Y., and Samaniego, L.: Cross-scale intercomparison of climate change impacts simulated by regional and global hydrological models in eleven large river basins, Clim. Change, 141, 561–576, https://doi.org/10.1007/s10584-016-1829-4, 2017.
Hauser, M., Thiery, W., and Seneviratne, S. I.: Potential of global land water recycling to mitigate local temperature extremes, Earth Syst. Dynam., 10, 157–169, https://doi.org/10.5194/esd-10-157-2019, 2019.
Hengl, T., Heuvelink, G. B. M., Kempen, B., Leenaars, J. G. B., Walsh, M. G., Shepherd, K. D., Sila, A., MacMillan, R. A., De Jesus, J. M., Tamene, L., and Tondoh, J. E.: Mapping soil properties of Africa at 250 m resolution: Random forests significantly improve current predictions, PLoS One, 10, 1–26, https://doi.org/10.1371/journal.pone.0125814, 2015.
Herring, S. C., Christidis, N., Hoell, A., Kossin, J. P., Schreck, C. J., and Stott, P. A.: Explaining Extreme Events of 2016 Explaining Extreme Events of 2016 From a, B. Am. Meteorol. Soc., 99, S1–S157, 2018.
Hirsch, A. L., Prestele, R., Davin, E. L., Seneviratne, S. I., Thiery, W., and Verburg, P. H.: Modelled biophysical impacts of conservation agriculture on local climates, Glob. Change Biol., 24, 4758–4774, https://doi.org/10.1111/gcb.14362, 2018.
Hurlbert, M., J. Krishnaswamy, Davin, E., Johnson, F. X., Mena, C. F., Morton, J., Myeong, S., Viner, D., Warner, K., Wreford, A., Zakieldeen, S., and Zommers, Z.: 2019: Risk management and decision-making in relation to sustainable development, in: Climate Change and Land, edited by: Shukla, P. R., Skea, J., Calvo Buendia, E., Masson-Delmotte, V., Pörtner, H.-O., Roberts, D. C., Zhai, P., Slade, R., Connors, S., van Diemen, R., Ferrat, M., Haughey, E., Luz, S., Neogi, S., Pathak, M., Petzold, J., Portugal Pereira, J., Vyas, P., Huntley, E., Kissick, K., Belkacemi, M., and Malley, J., Cambridge University Press, 673–800, https://doi.org/10.1017/9781009157988.009, 2022.
Hurtt, G. C., Chini, L. P., Frolking, S., Betts, R. A., Feddema, J., Fischer, G., Fisk, J. P., Hibbard, K., Houghton, R. A., Janetos, A., Jones, C. D., Kindermann, G., Kinoshita, T., Klein Goldewijk, K., Riahi, K., Shevliakova, E., Smith, S., Stehfest, E., Thomson, A., Thornton, P., van Vuuren, D. P., and Wang, Y. P.: Harmonization of land-use scenarios for the period 1500-2100: 600 years of global gridded annual land-use transitions, wood harvest, and resulting secondary lands, Clim. Change, 109, 117–161, https://doi.org/10.1007/s10584-011-0153-2, 2011.
Hurtt, G. C., Chini, L., Sahajpal, R., Frolking, S., Bodirsky, B. L., Calvin, K., Doelman, J. C., Fisk, J., Fujimori, S., Klein Goldewijk, K., Hasegawa, T., Havlik, P., Heinimann, A., Humpenöder, F., Jungclaus, J., Kaplan, J. O., Kennedy, J., Krisztin, T., Lawrence, D., Lawrence, P., Ma, L., Mertz, O., Pongratz, J., Popp, A., Poulter, B., Riahi, K., Shevliakova, E., Stehfest, E., Thornton, P., Tubiello, F. N., van Vuuren, D. P., and Zhang, X.: Harmonization of global land use change and management for the period 850–2100 (LUH2) for CMIP6, Geosci. Model Dev., 13, 5425–5464, https://doi.org/10.5194/gmd-13-5425-2020, 2020.
Interactive World Forest Map & Tree Cover Change Data|GFW: https://www.globalforestwatch.org/map/, last access: 15 July 2021.
IPCC: Climate Change 2013 – The Physical Science Basis, edited by: Intergovernmental Panel on Climate Change, Cambridge University Press, Cambridge, https://doi.org/10.1017/CBO9781107415324, 2014.
IPCC: Climate Change 2021 – The Physical Science Basis, Cambridge University Press, https://doi.org/10.1017/9781009157896, 2021.
Kim, U., Kaluarachchi, J. J., and Smakhtin, V. U.: Climate Change Impacts on Hydrology and Water Resources of the Upper Blue Nile River Basin, Ethiopia, Water Management, 45, 27, https://doi.org/10.22004/AG.ECON.53025, 2008.
Kohli, R. and Alam, M.: National Adaptation Plans in focus: lessons from the Republic of Senegal, Global Suport Program, 1–4, https://www.globalsupportprogramme.org/sites/default/files/resources/nap_in_focus_lessons_from_senegal_eng.pdf (last access: 23 June 2021), 2018.
Krysanova, V., Donnelly, C., Gelfan, A., Gerten, D., Arheimer, B., Hattermann, F., and Kundzewicz, Z. W.: How the performance of hydrological models relates to credibility of projections under climate change, Hydrolog. Sci. J., 63, 696–720, https://doi.org/10.1080/02626667.2018.1446214, 2018.
Krysanova, V., Zaherpour, J., Didovets, I., Gosling, S. N., Gerten, D., Hanasaki, N., Müller Schmied, H., Pokhrel, Y., Satoh, Y., Tang, Q., and Wada, Y.: How evaluation of global hydrological models can help to improve credibility of river discharge projections under climate change, Clim. Change, 163, 1353–1377, https://doi.org/10.1007/s10584-020-02840-0, 2020.
Kubota, A., Atta, Y., Abdel-fattah, A., El-behlak, S., Shinoto, Y., Fukunaga, A., and Maruyama, S.: Effects of Irrigation Inter val and Method on Growth, Photosynthesis, Yield, and Water Use Efficiency of Maize in the Nile Delta of Egypt, Trop. Agr. Dev., 64, 178–188, https://doi.org/10.11248/jsta.64.178, 2020.
Lakshmi, V., Fayne, J., and Bolten, J.: A comparative study of available water in the major river basins of the world, J. Hydrol. (Amst.), 567, 510–532, https://doi.org/10.1016/j.jhydrol.2018.10.038, 2018.
Lange, S.: EartH2Observe, WFDEI and ERA-Interim data Merged and Bias-corrected for ISIMIP (EWEMBI), Potsdam Institute for Climate Impact Research [data set], https://doi.org/10.5880/PIK.2016.004, 2016.
Latrubesse, E. M., Stevaux, J. C., and Sinha, R.: Tropical rivers, Geomorphology, 70, 187–206, https://doi.org/10.1016/j.geomorph.2005.02.005, 2005.
Lawrence, D. M., Hurtt, G. C., Arneth, A., Brovkin, V., Calvin, K. V., Jones, A. D., Jones, C. D., Lawrence, P. J., de Noblet-Ducoudré, N., Pongratz, J., Seneviratne, S. I., and Shevliakova, E.: The Land Use Model Intercomparison Project (LUMIP) contribution to CMIP6: rationale and experimental design, Geosci. Model Dev., 9, 2973–2998, https://doi.org/10.5194/gmd-9-2973-2016, 2016.
Southeastern Africa's topsy-turvy monsoon: https://www.climate.gov/news-features/event-tracker/southeastern-africas-topsy-turvy-monsoon, last access: 16 June 2021.
Lugomela, G. V., Chavula, G., and Mwedzi, T.: Hydrology of the Zambezi River Basin, Ecological Changes in the Zambezi River Basin, 151–182, https://doi.org/10.2307/j.ctv1grbbq5.13, 2021.
Maidment, R. I., Allan, R. P., and Black, E.: Recent observed and simulated changes in precipitation over Africa, Geophys. Res. Lett., 42, 8155–8164, https://doi.org/10.1002/2015GL065765, 2015.
Mango, L. M., Melesse, A. M., McClain, M. E., Gann, D., and Setegn, S. G.: Land use and climate change impacts on the hydrology of the upper Mara River Basin, Kenya: results of a modeling study to support better resource management, Hydrol. Earth Syst. Sci., 15, 2245–2258, https://doi.org/10.5194/hess-15-2245-2011, 2011.
Marvel, K., Cook, B. I., Bonfils, C. J. W., Durack, P. J., Smerdon, J. E., and Williams, A. P.: Twentieth-century hydroclimate changes consistent with human influence, Nature, 569, 59–65, https://doi.org/10.1038/s41586-019-1149-8, 2019.
Nakayama, M.: International Waters in Southern Africa (Water Resources Management and Policy), United Nations University Press, Tokyo, 306 pp., ISBN 9280810774, 2003.
Näschen, K., Diekkrüger, B., Evers, M., Höllermann, B., Steinbach, S., and Thonfeld, F.: The Impact of Land Use/Land Cover Change (LULCC) on Water Resources in a Tropical Catchment in Tanzania under Different Climate Change Scenarios, Sustainability, 11, 7083, https://doi.org/10.3390/su11247083, 2019.
Nkrumah, B.: Edible backyards: climate change and urban food (in)security in Africa, Agric. Food Secur., 7, 45, https://doi.org/10.1186/s40066-018-0196-y, 2018.
Nkwasa, A., Chawanda, C. J., Jägermeyr, J., and van Griensven, A.: Improved representation of agricultural land use and crop management for large-scale hydrological impact simulation in Africa using SWAT+, Hydrol. Earth Syst. Sci., 26, 71–89, https://doi.org/10.5194/hess-26-71-2022, 2022a.
Nkwasa, A., Chawanda, C. J., and Van Griensven, A.: Regionalization of the SWAT+ model for projecting climate change impacts on sediment yield: An application in the Nile basin, J. Hydrol. Reg. Stud., 42, 101152, https://doi.org/10.1016/j.ejrh.2022.101152, 2022b.
Padrón, R. S., Gudmundsson, L., Decharme, B., Ducharne, A., Lawrence, D. M., Mao, J., Peano, D., Krinner, G., Kim, H., and Seneviratne, S. I.: Observed changes in dry-season water availability attributed to human-induced climate change, Nat. Geosci., 13, 477–481, https://doi.org/10.1038/s41561-020-0594-1, 2020.
Pokhrel, Y., Felfelani, F., Satoh, Y., Boulange, J., Burek, P., Gädeke, A., Gerten, D., Gosling, S. N., Grillakis, M., Gudmundsson, L., Hanasaki, N., Kim, H., Koutroulis, A., Liu, J., Papadimitriou, L., Schewe, J., Müller Schmied, H., Stacke, T., Telteu, C.-E., Thiery, W., Veldkamp, T., Zhao, F., and Wada, Y.: Global terrestrial water storage and drought severity under climate change, Nat. Clim. Change, 11, 226–233, https://doi.org/10.1038/s41558-020-00972-w, 2021.
Ramadan, S. and Negm, A.: Environmental Impacts Of Great Ethiopian Renaissance Dam On The Egyptian Water Resources Management And Security, in: The 23rd International Conference On: Environmental Protection is a Must, 11–13 May 2013, Alexandria, https://doi.org/10.13140/2.1.2233.2483, 2013.
Reinecke, R., Müller Schmied, H., Trautmann, T., Andersen, L. S., Burek, P., Flörke, M., Gosling, S. N., Grillakis, M., Hanasaki, N., Koutroulis, A., Pokhrel, Y., Thiery, W., Wada, Y., Yusuke, S., and Döll, P.: Uncertainty of simulated groundwater recharge at different global warming levels: a global-scale multi-model ensemble study, Hydrol. Earth Syst. Sci., 25, 787–810, https://doi.org/10.5194/hess-25-787-2021, 2021.
Rosa, L., Chiarelli, D. D., Sangiorgio, M., Beltran-Peña, A. A., Rulli, M. C., D'Odorico, P., and Fung, I.: Potential for sustainable irrigation expansion in a 3 ∘C warmer climate, P. Natl. Acad. Sci. USA, 117, 29526–29534, https://doi.org/10.1073/pnas.2017796117, 2020.
Ruhiiga, T. M.: Managing Explosive Urbanisation in Africa, Journal of Human Ecology, 42, 43–52, https://doi.org/10.1080/09709274.2013.11906580, 2013.
Senegal-Hycos: https://hydrohub.wmo.int/en/projects/Senegal-HYCOS (last access: 28 January 2021), 2021.
Shi, P. J., Yuan, Y., Zheng, J., Wang, J. A., Ge, Y., and Qiu, G. Y.: The effect of land use/cover change on surface runoff in Shenzhen region, China, Catena (Amst.), 69, 31–35, https://doi.org/10.1016/j.catena.2006.04.015, 2007.
Siam, M. S. and Eltahir, E. A. B.: Climate change enhances interannual variability of the Nile river flow, Nat. Clim. Change, 7, 350–354, https://doi.org/10.1038/nclimate3273, 2017.
Siebert, S. and Karen, F.: Irrigated Areas, Atlas of African agriculture research & development, 18–19, https://doi.org/10.2499/9780896298460_08, 2014.
Sood, A. and Smakhtin, V.: Global hydrological models: a review, Hydrolog. Sci. J., 60, 549–565, https://doi.org/10.1080/02626667.2014.950580, 2015.
Souverijns, N., Thiery, W., Demuzere, M., and Lipzig, N. P. M. Van: Drivers of future changes in East African precipitation, Environ. Res. Lett., 11, 114011, https://doi.org/10.1088/1748-9326/11/11/114011, 2016.
Sterl, S., Vanderkelen, I., Chawanda, C. J., Russo, D., Brecha, R. J., van Griensven, A., van Lipzig, N. P. M., and Thiery, W.: Smart renewable electricity portfolios in West Africa, Nat. Sustain, 3, 710–719, https://doi.org/10.1038/s41893-020-0539-0, 2020.
Sterl, S., Fadly, D., Liersch, S., Koch, H., and Thiery, W.: Linking solar and wind power in eastern Africa with operation of the Grand Ethiopian Renaissance Dam, Nature Energy, 6, 407–418, https://doi.org/10.1038/s41560-021-00799-5, 2021.
Tabari, H., Hosseinzadehtalaei, P., Thiery, W., and Willems, P.: Amplified Drought and Flood Risk Under Future Socioeconomic and Climatic Change, Earths Future, 9, e2021EF002295, https://doi.org/10.1029/2021EF002295, 2021.
Thiery, W., Davin, E. L., Lawrence, D. M., Hirsch, A. L., Hauser, M., and Seneviratne, S. I.: Present-day irrigation mitigates heat extremes, J. Geophys. Res.-Atmos., 122, 1403–1422, https://doi.org/10.1002/2016JD025740, 2017.
Thiery, W., Visser, A. J., Fischer, E. M., Hauser, M., Hirsch, A. L., Lawrence, D. M., Lejeune, Q., Davin, E. L., and Seneviratne, S. I.: Warming of hot extremes alleviated by expanding irrigation, Nat. Commun., 11, 290, https://doi.org/10.1038/s41467-019-14075-4, 2020.
Thiery, W., Lange, S., Rogelj, J., Schleussner, C.-F., Gudmundsson, L., Seneviratne, S. I., Andrijevic, M., Frieler, K., Emanuel, K., Geiger, T., Bresch, D. N., Zhao, F., Willner, S. N., Büchner, M., Volkholz, J., Bauer, N., Chang, J., Ciais, P., Dury, M., François, L., Grillakis, M., Gosling, S. N., Hanasaki, N., Hickler, T., Huber, V., Ito, A., Jägermeyr, J., Khabarov, N., Koutroulis, A., Liu, W., Lutz, W., Mengel, M., Müller, C., Ostberg, S., Reyer, C. P. O., Stacke, T., and Wada, Y.: Intergenerational inequities in exposure to climate extremes, Science, 374, 158–160, https://doi.org/10.1126/science.abi7339, 2021.
Thornton, P. K., Ericksen, P. J., Herrero, M., and Challinor, A. J.: Climate variability and vulnerability to climate change: a review, Global Change Biol., 20, 3313–3328, https://doi.org/10.1111/gcb.12581, 2014.
Trambauer, P., Maskey, S., Winsemius, H., Werner, M., and Uhlenbrook, S.: A review of continental scale hydrological models and their suitability for drought forecasting in (sub-Saharan) Africa, Phys. Chem. Earth, 66, 16–26, https://doi.org/10.1016/j.pce.2013.07.003, 2013.
Uhe, P., Philip, S., Kew, S., Shah, K., Kimutai, J., Mwangi, E., van Oldenborgh, G. J., Singh, R., Arrighi, J., Jjemba, E., Cullen, H., and Otto, F.: Attributing drivers of the 2016 Kenyan drought, Int. J. Climatol., 38, e554–e568, https://doi.org/10.1002/joc.5389, 2018.
Vanderkelen, I., van Lipzig, N. P. M., and Thiery, W.: Modelling the water balance of Lake Victoria (East Africa) – Part 2: Future projections, Hydrol. Earth Syst. Sci., 22, 5527–5549, https://doi.org/10.5194/hess-22-5527-2018, 2018.
Vanderkelen, I., Lipzig, N. P. M., Lawrence, D. M., Droppers, B., Golub, M., Gosling, S. N., Janssen, A. B. G., Marcé, R., Schmied, H. M., Perroud, M., Pierson, D., Pokhrel, Y., Satoh, Y., Schewe, J., Seneviratne, S. I., Stepanenko, V. M., Tan, Z., Woolway, R. I., and Thiery, W.: Global Heat Uptake by Inland Waters, Geophys. Res. Lett., 47, e2020GL087867, https://doi.org/10.1029/2020GL087867, 2020.
Warburton, M. L., Schulze, R. E., and Jewitt, G. P. W.: Hydrological impacts of land use change in three diverse South African catchments, J. Hydrol. (Amst.), 414–415, 118–135, https://doi.org/10.1016/j.jhydrol.2011.10.028, 2012.
Wittig, R., König, K., Schmidt, M., and Szarzynski, J.: A study of climate change and anthropogenic impacts in West Africa, Environ. Sci. Pollut. Res.-Int., 14, 182–189, https://doi.org/10.1065/espr2007.02.388, 2007.
Woldesenbet, T. A., Elagib, N. A., Ribbe, L., and Heinrich, J.: Hydrological responses to land use/cover changes in the source region of the Upper Blue Nile Basin, Ethiopia, Sci. Total Environ., 575, 724–741, https://doi.org/10.1016/j.scitotenv.2016.09.124, 2017.
World Meteorological Organization (WMO): State of the Climate in Africa 2019, ISBN 978-92-63-11253-8, 2019.
Yira, Y., Diekkrüger, B., Steup, G., and Bossa, A. Y.: Modeling land use change impacts on water resources in a tropical West African catchment (Dano, Burkina Faso), J. Hydrol., 537, 187–199, https://doi.org/10.1016/j.jhydrol.2016.03.052, 2016.
Zaherpour, J., Gosling, S. N., Mount, N., Schmied, H. M., Veldkamp, T. I. E., Dankers, R., Eisner, S., Gerten, D., Gudmundsson, L., Haddeland, I., Hanasaki, N., Kim, H., Leng, G., Liu, J., Masaki, Y., Oki, T., Pokhrel, Y., Satoh, Y., Schewe, J., and Wada, Y.: Worldwide evaluation of mean and extreme runoff from six global-scale hydrological models that account for human impacts, Environ. Res. Lett., 13, 065015, https://doi.org/10.1088/1748-9326/aac547, 2018.
Zimbabwe Food Security Outlook Update: https://fews.net/southern-africa/zimbabwe/food-security-outlook-update/august-2015 (last access: 10 June 2019), 2019.
Zommers, Z., Marbaix, P., Fischlin, A., Ibrahim, Z. Z., Grant, S., Magnan, A. K., Pörtner, H.-O., Howden, M., Calvin, K., Warner, K., Thiery, W., Sebesvari, Z., Davin, E. L., Evans, J. P., Rosenzweig, C., O'Neill, B. C., Patwardhan, A., Warren, R., van Aalst, M. K., and Hulbert, M.: Burning embers: towards more transparent and robust climate-change risk assessments, Nat. Rev. Earth Environ., 1, 516–529, https://doi.org/10.1038/s43017-020-0088-0, 2020.