the Creative Commons Attribution 4.0 License.
the Creative Commons Attribution 4.0 License.
 | 07 Mar 2024
A D-vine copula-based quantile regression towards merging satellite precipitation products over rugged topography: a case study in the upper Tekeze–Atbara Basin
Mohammed Abdallah
Lijun Chao
Abubaker Omer
Khalid Hassaballah
Kidane Welde Reda
Linxin Liu
Tolossa Lemma Tola
Omar M. Nour
Precipitation is a vital key element in various studies of hydrology, flood prediction, drought monitoring, and water resource management. The main challenge in conducting studies over remote regions with rugged topography is that weather stations are usually scarce and unevenly distributed. However, open-source satellite-based precipitation products (SPPs) with a suitable resolution provide alternative options in these data-scarce regions, which are typically associated with high uncertainty. To reduce the uncertainty of individual satellite products, we have proposed a D-vine copula-based quantile regression (DVQR) model to merge multiple SPPs with rain gauges (RGs). The DVQR model was employed during the 2001–2017 summer monsoon seasons and compared with two other quantile regression methods based on the multivariate linear (MLQR) and the Bayesian model averaging (BMAQ) techniques, respectively, and with two traditional merging methods – the simple modeling average (SMA) and the one-outlier-removed average (OORA) – using descriptive and categorical statistics. Four SPPs have been considered in this study, namely, Tropical Applications of Meteorology using SATellite (TAMSAT v3.1), the Climate Prediction Center MORPHing Product Climate Data Record (CMORPH-CDR), Global Precipitation Measurement (GPM) Integrated Multi-satellitE Retrievals for GPM (IMERG v06), and Precipitation Estimation from Remotely Sensed Information using Artificial Neural Networks (PERSIANN-CDR). The bilinear (BIL) interpolation technique was applied to downscale SPPs from a coarse to a fine spatial resolution (1 km). The rugged-topography region of the upper Tekeze–Atbara Basin (UTAB) in Ethiopia was selected as the study area. The results indicate that the precipitation data estimates with the DVQR, MLQR, and BMAQ models and with traditional merging methods outperform the downscaled SPPs. Monthly evaluations reveal that all products perform better in July and September than in June and August due to precipitation variability. The DVQR, MLQR, and BMAQ models exhibit higher accuracy than the traditional merging methods over the UTAB. The DVQR model substantially improved all of the statistical metrics (CC = 0.80, NSE = 0.615, KGE = 0.785, MAE = 1.97 mm d−1, RMSE = 2.86 mm d−1, and PBIAS = 0.96 %) considered compared with the BMAQ and MLQR models. However, the DVQR model did not outperform the BMAQ and MLQR models with respect to the probability of detection (POD) and false-alarm ratio (FAR), although it had the best frequency bias index (FBI) and critical success index (CSI) among all of the employed models. Overall, the newly proposed merging approach improves the quality of SPPs and demonstrates the value of the proposed DVQR model in merging multiple SPPs over regions with rugged topography such as the UTAB.
- Article
(9911 KB) - Full-text XML
- BibTeX
- EndNote


Optimizing water resource management requires accurate and reliable meteorological information at a fine spatial and temporal resolution. Precipitation is vital in various studies, such as weather forecasts, hydrology, agricultural practices, flood prediction, drought monitoring, and water resource management (Zhang et al., 2016; Kimani et al., 2017; Sun et al., 2018; Amjad et al., 2020). However, due to the lack of rain gauges, the rugged topography, and the significant spatial variability in precipitation, accurate precipitation estimation in remote areas such as the Nile River basin is extremely difficult (Kimani et al., 2017). Accurate high-spatiotemporal-resolution precipitation data in regions with rugged topography are precious for hydrological simulation and extreme event investigations. However, precipitation data contain significant uncertainty due to the limitations of precipitation recording and estimation methods (Alfieri et al., 2014; Qi et al., 2019).
Conventional precipitation data from rain gauges lack sufficient spatial and temporal resolution, particularly in rugged topography (Yong et al., 2010; Ma et al., 2015; Kidd et al., 2017). In tropical climates, at least one gauge per 600–900 km2 of flat area or one gauge per 100–250 km2 of mountainous area is recommended for ground precipitation measuring networks (WMO, 1994), but this criterion is usually not met in practice (Worqlul et al., 2017). The upper Tekeze–Atbara Basin (UTAB) is located in a tropical region and is one of the major tributaries of the transboundary Nile River (see Fig. 1). It has an inadequate rain gauge network, with only one gauge per 1400 km2 (Gebremicael et al., 2019). The main difficulty with respect to capturing the spatial precipitation variability in this basin lies in the uneven distribution of meteorological stations (Belete et al., 2020). Alternate precipitation data from satellite-based precipitation products (SPPs) are highly desirable for extreme precipitation estimates (Barrett and Martin, 1981). Although the use of SPPs at regional and global scales has increased substantially over recent years (Belete et al., 2020; Reda et al., 2021), the quality of SPPs over complex topography is still problematic, as these SPPs are significantly influenced by climate conditions, seasonal variability, precipitation type, and complex topography (Kidd and Huffman, 2011; Hou et al., 2014). SPPs data have been used as input for hydrologic modeling simulations of extreme flood events (Li et al., 2015; Fenta et al., 2018; Muhammad et al., 2018). While these studies have highlighted the capability of SPPs in flood modeling, they have also reported inherent uncertainties in SPPs (Zubieta et al., 2017), such as the over- or underestimation of SPPs, which may lead to high uncertainties in streamflow simulation and drought monitoring (Reda et al., 2021, 2022; Gebremicael et al., 2022). The quality of individual SPPs is improved at longer timescales (monthly to daily); however, they still encounter several inevitable errors, such as over- or underestimations, indicating that there is still potential for further enhancement of their performance.
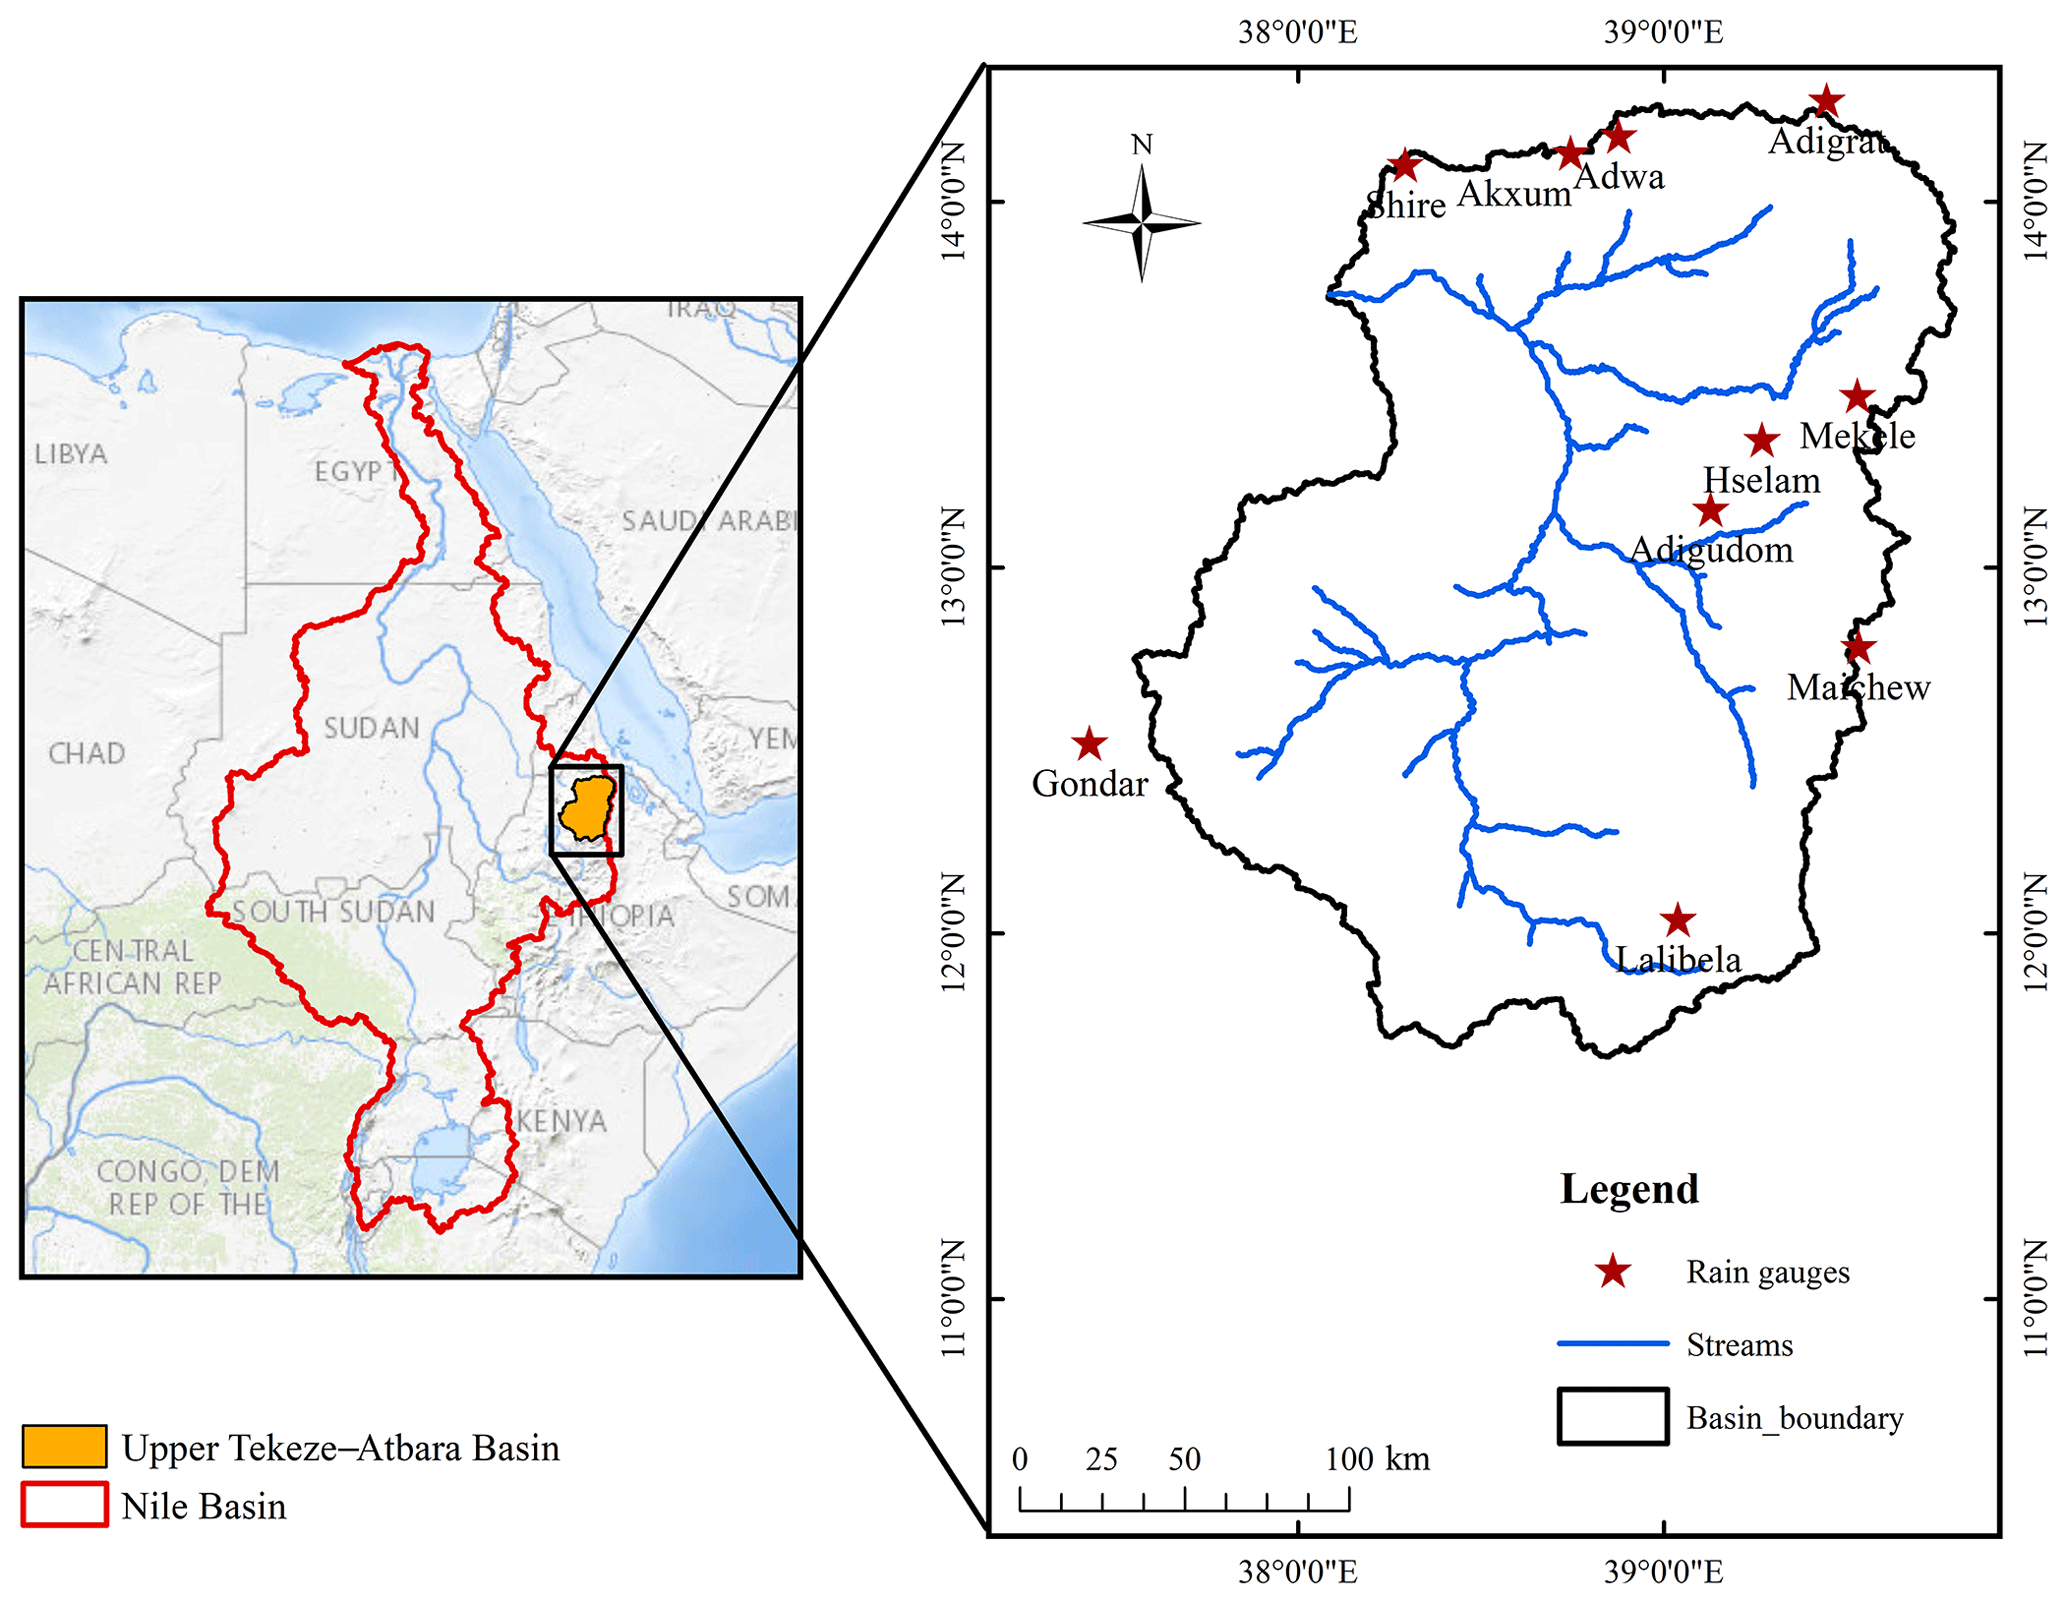
Figure 1Map of the study area (upper Tekeze–Atbara Basin) and location of the rain gauge stations. Publisher's remark: please note that the above figure contains disputed territories.
Several efforts have been made to increase the accuracy of precipitation estimates with SPPs, including improvements to calibration methods, bias correction, and the merging of multiple SPPs (Sun et al., 2016; Chao et al., 2018; Muhammad et al., 2018; Rahman et al., 2018; Kumar et al., 2019). The merging approach is a concept comprising the blending of multiple products into a single new product (Rahman et al., 2018). Merging techniques have recently been employed via many statistic approaches, substantially increasing the accuracy of hydrological models (Raftery et al., 2005a). The procedure of merging multiple SPPs produces a single source of precipitation data that is characterized by better performance than all or the majority of the individual SPPs, and the ability of these data has been demonstrated in hydrological applications and the simulation of extreme events (Rahman et al., 2020b, 2021). The most common traditional merging methods are simple model averaging (SMA), the one-outlier-removed average (OORA), inverse error variance weighting (IEVW), and the optimized weighted average (OWA). These methods indicate a slight improvement in accuracy compared with original SPPs (Shen et al., 2014; Yumnam et al., 2022). Therefore, a bias correction of errors is needed to improve the quality and spatial distribution of precipitation data.
Recently, merging multiple satellites, reanalyses, explanatory variables, and ground products has opened up new possibilities to improve the estimation of precipitation data across data-scarce regions at all temporal scales (Mastrantonas et al., 2019). However, the merging approaches to creating a new product are still in their early stages. A few authors have explored different techniques for merging multiple SPPs from various sources, such as geographically weighted regression (GWR) (Chao et al., 2018), stepwise regression (STER) (Xiao et al., 2020), Bayesian model averaging (BMA) (Ma et al., 2018), wavelet transform analysis (Pradhan et al., 2015), and Kriging-based algorithms (Manz et al., 2016). The efficacy of these merging techniques in raising precipitation estimate quality has been demonstrated. However, most of them are based on strong (ad hoc) hypotheses that might not be accurate in practice (Wu et al., 2020). Dynamic and cluster BMA methods reflect the highest potential and highest capability with respect to producing high-quality merged precipitation data, and these techniques have performed better than traditional merging methods (e.g., IEVW, OWA, and OORA) and row satellite data (e.g., Multi-Source Weighted-Ensemble Precipitation – MSWEP) on the Tibetan Plateau of China (Ma et al., 2018), in Pakistan (H. L. R. Rahman et al., 2020; Rahman et al., 2020a), and in the Vamsadhara River basin in India (Yumnam et al., 2022). However, the model produces a combined single-value prediction by averaging the deterministic model outputs linearly, which does not accurately reflect the contributions of each input variable (Jennifer et al., 1999). Several machine learning (ML) methods developed to merge multiple satellite products, such as random forest (G. V. Nguyen et al., 2021), multilayer perceptron neural network (Kolluru et al., 2020), support vector machine (Kumar et al., 2019), and quantile regression forests (Bhuiyan et al., 2018, 2019) have shown an ability to capture the nonlinear relationship between the variables. Therefore, it is unclear if these approaches affect the spatiotemporal scales of the distribution pattern of precipitation data.
The copula approach has proven successful in hydrometeorological applications for modeling the multivariate nonlinear interdependence of input data using the joint, marginal distributions. Successful applications of bivariate copulas in correcting the error of satellite precipitation products have been reported. For instance, Sharifi et al. (2019) employed a t-copula approach to adjust the additive errors to improve SPP quality, the multivariate Gaussian copula approach was utilized to reduce the uncertainty of precipitation data for the bias correction of two SPPs (Moazami et al., 2014), and the D-vine copula-based quantile regression (DVQR) algorithm was introduced by Kraus and Czado (2017) to predict the conditional quantile with the highest flexibility. The DVQR algorithm demonstrated a high ability and potential to capture the nonlinear relationships between the variables in different hydrology applications, such as reference evapotranspiration estimation (Abdallah et al., 2022), soil moisture modeling (H. H. Nguyen et al., 2021), and drought prediction (Wu et al., 2022). The above studies reflect the advantage of the DVQR model in term of capturing the complex nonlinear relationship among input variables. Therefore, using the DVQR model in term of merging multiple SPPs with rain gauges (RGs) across rugged topography can provide a robust model.
Here, we aim to merge daily precipitation data from multiple individual SPPs with RGs and meteorological and topographical variables over the UTAB to reduce the uncertainty in individual SPPs. Multiple SPPs have been employed in this study, namely, Tropical Applications of Meteorology using SATellite (TAMSAT v3.1), the Climate Prediction Center MORPHing Product Climate Data Record (CMORPH-CDR), Global Precipitation Measurement (GPM) Integrated Multi-satellitE Retrievals for GPM (IMERG v06), and Precipitation Estimation from Remotely Sensed Information using Artificial Neural Networks (PERSIANN-CDR). The meteorological and topographical explanatory variables are as follows: wind speed (WS), elevation (DEM), slope (SLP), aspect (ASP), hillshade (HSHD), and surface soil moisture (SSM). In the following, we suggest a novel application of the DVQR model to merge daily precipitation data during the summer monsoon (June, July, August, and September) in the period from 2001 to 2017. We further compare the performance of the DVQR model with multivariate linear (MLQR) and Bayesian model averaging (BMAQ) models and with two traditional merging methods (SMA and OORA) using descriptive and categorical statistics.
The Tekeze–Atbara Basin (TAB) is one of the main tributaries of the Nile River, as shown in Fig. 1. The current study was conducted in the upper Tekeze–Atbara Basin (UTAB), which is located in the northwestern part of Ethiopia, between longitudes 37°30′0′′ and 39°48′0′′ E and latitudes 11°30′0′′ and 14°18′0′′ N, and has a contributing area of approximately 45 694 km2, with more than 50 % of the total area located at an elevation from 2000 to above 3000 m a.s.l. (meters above sea level). The TAB comprises 13 % of the entire Nile Basin area and contributes 14 % of the annual flow at the Aswan High Dam in Egypt (Gebremicael et al., 2019). The complex topography of the basin is characterized by significant variation in elevation from 833 to 4530 m a.s.l., based on digital elevation model (DEM) topographic information.
The basin is characterized by a semiarid climate in its northern and eastern parts and a semi-humid climate in its southern region. Precipitation over the basin occurs from June to September, accounting for more than 70 % of annual precipitation, ranging from 400 mm yr−1 in the east to 1200 mm yr−1 in the southwest (Gebremicael et al., 2019). The mean annual temperature over the basin ranges from 11 to 31 °C from the eastern mountain region to the western lowlands; the highest mean monthly temperature occurs in May and the lowest is in December.
3.1 Data collection and processing
RG and SPP data from CMORPH CRD, IMERG v06, TAMSAT v3.1, and PERSIANN-CDR were gathered over 17 years, from January 2001 to December 2017, during the summer monsoon (June, July, August, and September).
3.1.1 Rain gauge data
The daily precipitation data from 10 rain gauge stations were provided by the Ethiopian National Meteorological Agency (NMA) for the period from January 2001 to December 2019. Most of the RGs are localized in complex topography in the northeastern part of the TAB, but stations are very sparse in the west, as shown in Fig. 1. Moreover, Table 1 summarizes the geographical locations of rain gauge, elevation, and statistical data. There are more than 75 rain gauge observations across the upper TAB; however, most of these gauges are missing more than 50 % of their records, and some of the stations have gone out of service (Gebremicael et al., 2019).
Table 1Geographical locations of rain gauge observations, elevation, and statistical characteristics based on a daily scale, including the minimum (Min), maximum (Max), mean, and standard deviation (SD) from January 2001 to December 2017 over the UTAB.
3.1.2 Remote-sensing data
CMORPH is another National Oceanographic and Atmospheric Administration Climate Prediction Center (NOAA-CPC) product. In contrast to other items, the CMORPH product does not utilize an algorithm to combine passive microwave (PMW) and infrared (IR) estimates; instead, it utilizes IR information to predict the temporal and spatial evolution of clouds, rather than rainfall estimates (Joyce et al., 2004). CMORPH uses motion vectors constructed using IR for high-accuracy precipitation propagation resulting from PMW data. This method is highly adaptable because it allows for the addition of any precipitation estimate using PMW satellites. CMORPH CRD was used in this study.
GPM IMERG V06 produces precipitation with a fine spatial resolution (0.1°) and a half-hourly temporal resolution between 60° S and 60° N. The Dual-frequency phased array precipitation radar (DPR) and multi-channel GPM Microwave Imager (GMI) data are used to validate and integrate precipitation estimates from different PMW satellites to create precipitation using the IMERG algorithms. Furthermore, the PERSIANN-CCS algorithm and morphing technique were employed to compute the precipitation rate from microwave-calibrated IR and global gridded precipitation (Huffman et al., 2015; Tan et al., 2019). In this study, the GPM IMERG Final Run V06 product was used.
The PERSIANN-CDR product estimates precipitation by utilizing the IR Channel Brightness Temperature archive from GridSat-B1 (Hsu et al., 1997). The Global Precipitation Climatology Project (GPCP) version 2.2 product was integrated with estimated precipitation from the PERSIANN algorithm for bias correction at a 2.5°×2.5° spatial resolution and covering 60° N–60° S from 1983 to the present at daily, monthly, and yearly resolutions. The present study utilized the PERSIANN-CDR product, which was downloaded free of charge from the Center for Hydrometeorology and Remote Sensing (CHRS).
The University of Reading in Africa established TAMSAT, which is based on thermal IR imagery from the Meteosat satellite and observation gauges with a fine spatial resolution of 0.0375° (approximately 4 km) from 1983 to the present at daily, 5 d, decadal, and monthly timescales (Maidment et al., 2014, 2017). The TAMSAT version 3.1 product was utilized in the present study.
3.1.3 Explanatory variables
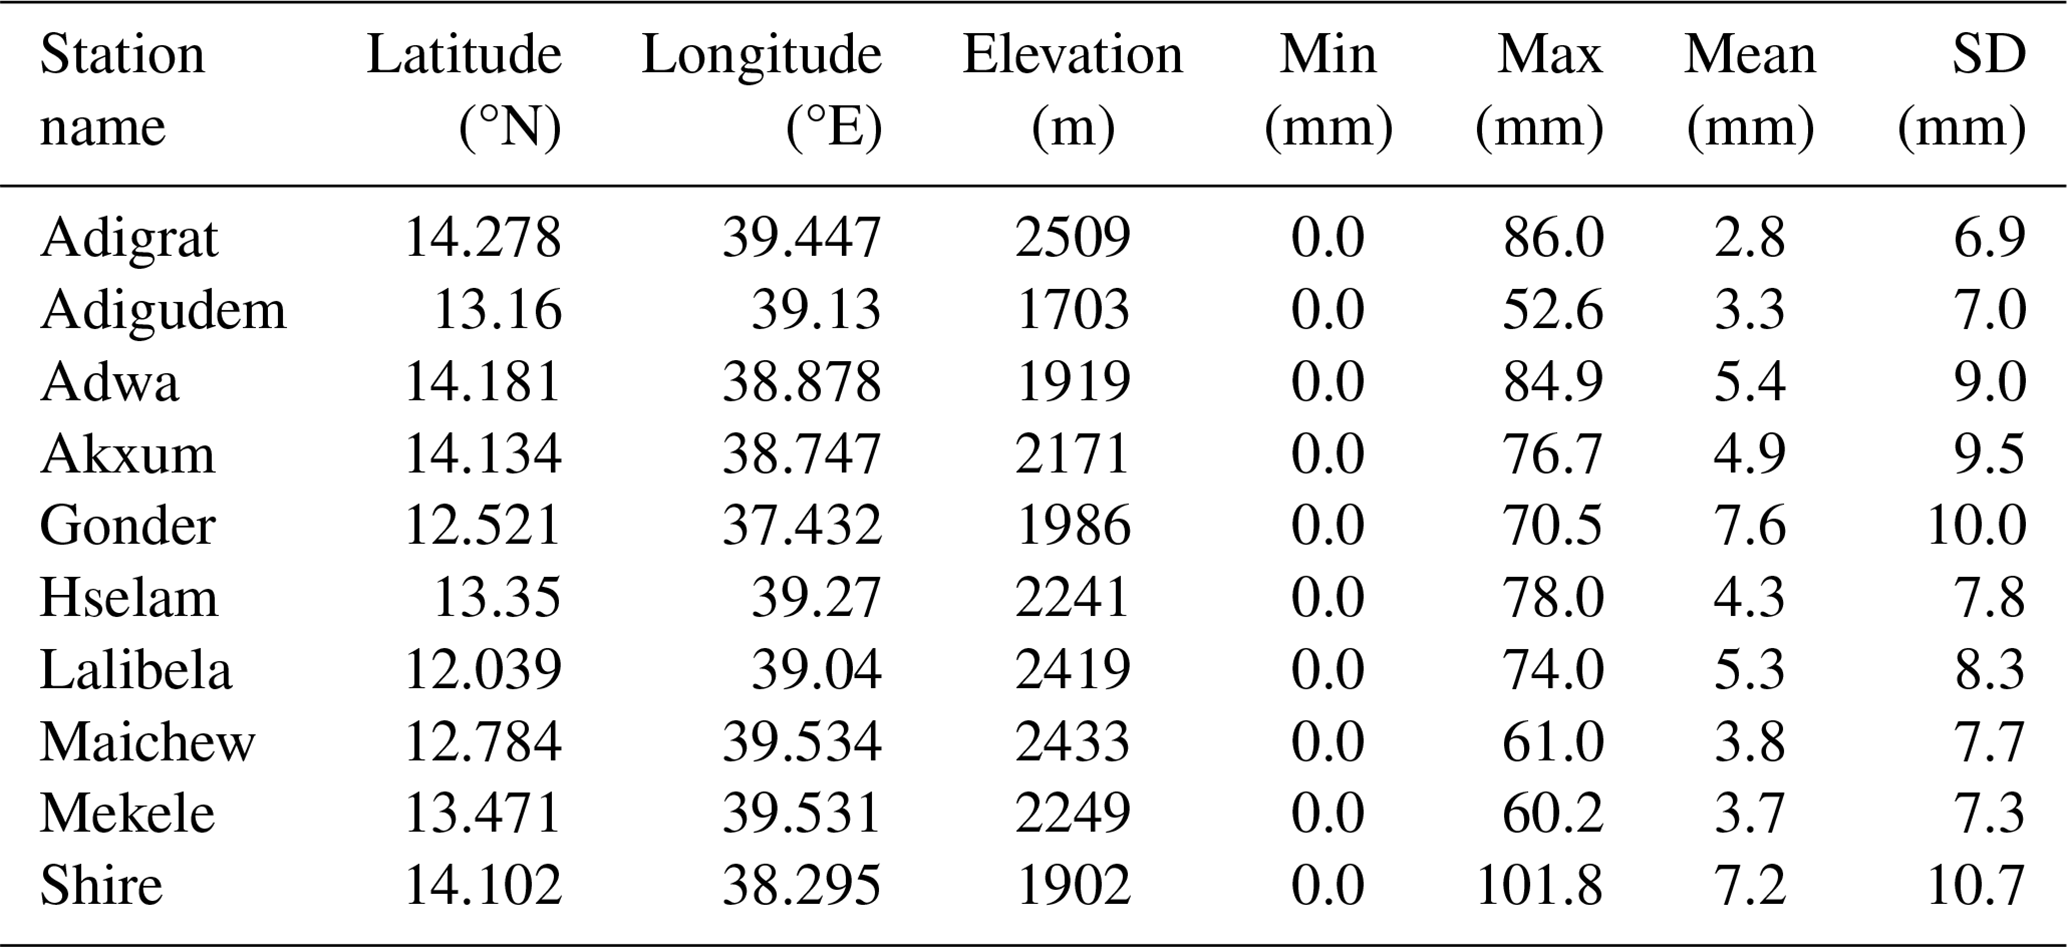
The digital elevation model (DEM) data employed in this study were obtained from the Shuttle Radar Topography Mission (SRTM) with a spatial resolution of 90 m and were rescaled to 1 km using bilinear (BIL) interpolation techniques. In contrast, the topographic variables were derived from DEM information, including the slope (SLP), aspect (ASP), and hillshade (HSHD), as shown in Fig. 2. The ASP characterized across the basin ranged from −1 to 358.3°, the SLP ranged from 0.0 to 45.7°, and the HSHD ranged from 8 to 254.
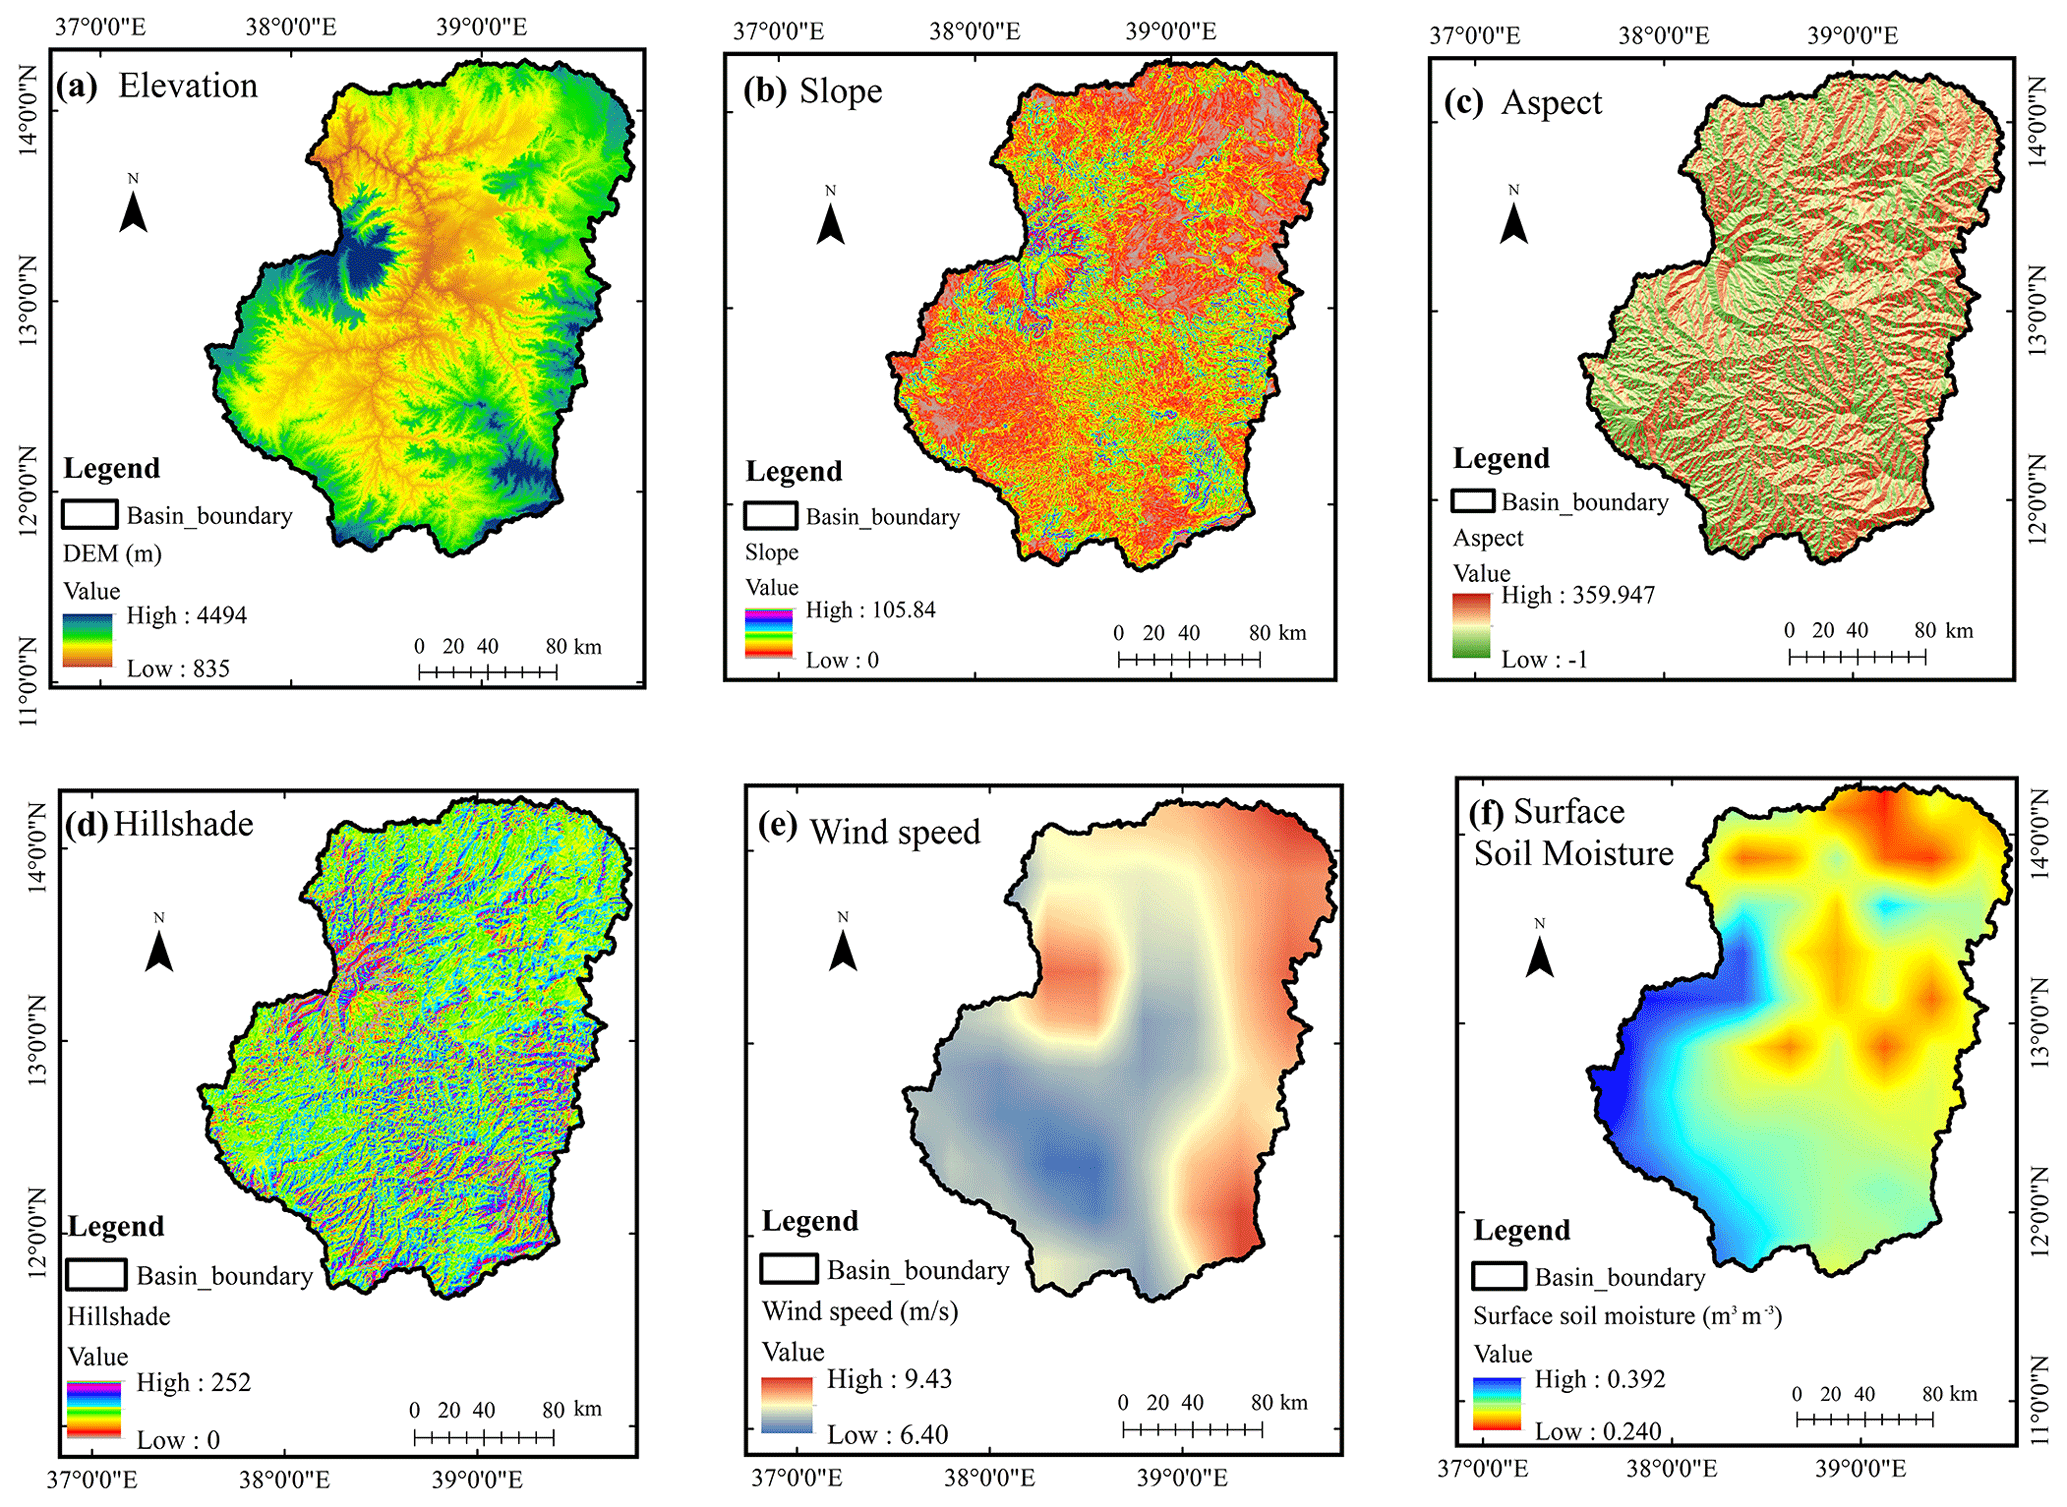
Figure 2Spatial pattern of the distribution of explanatory variables, including (a) elevation, (b) slope, (c) aspect, (d) hillshade, (e) average wind speed, and (f) average surface soil moisture, during the summer monsoon from 2001 to 2017 over the UTAB.
The daily 10 m wind speed (WS) at a 0.25° spatial resolution was obtained from ERA5, the fifth-generation reanalysis product from the European Centre for Medium-Range Weather Forecasts (ECMWF). In contrast, the daily surface soil moisture (SSM) was obtained from the Global Land Evaporation Amsterdam Model (GLEAM 3.6a) with a spatial resolution of 0.25° during the summer monsoon (June–July–August–September). Recently, some investigations have indicated that using the WS and SSM can improve the estimation of SPPs in various regions (Chao et al., 2018; Kumar et al., 2019). Furthermore, BIL techniques have been applied to downscale the WS and SSM from a coarse resolution (0.25°) to a fine resolution (0.01°). The average WS across the basin ranges from 6.4 to 9.4 m s−1, while the SSM ranges from 0.24 to 0.39 m3 m−3 (as presented in Fig. 2e and f, respectively).
3.2 Merging models
Figure 3 presents the workflow of the merged SPPs approach developed in this study. First, the BIL technique is applied to downscale the original SPPs from a coarse to a fine spatial resolution (0.01°) during the summer monsoon for the period from 2001 to 2017. Second, three (DVQR, MLQR, and QBMA) models are employed to merge downscaled SPPs with RGs coupled with explanatory variables over the UTAB. A more detailed description is provided in the following.
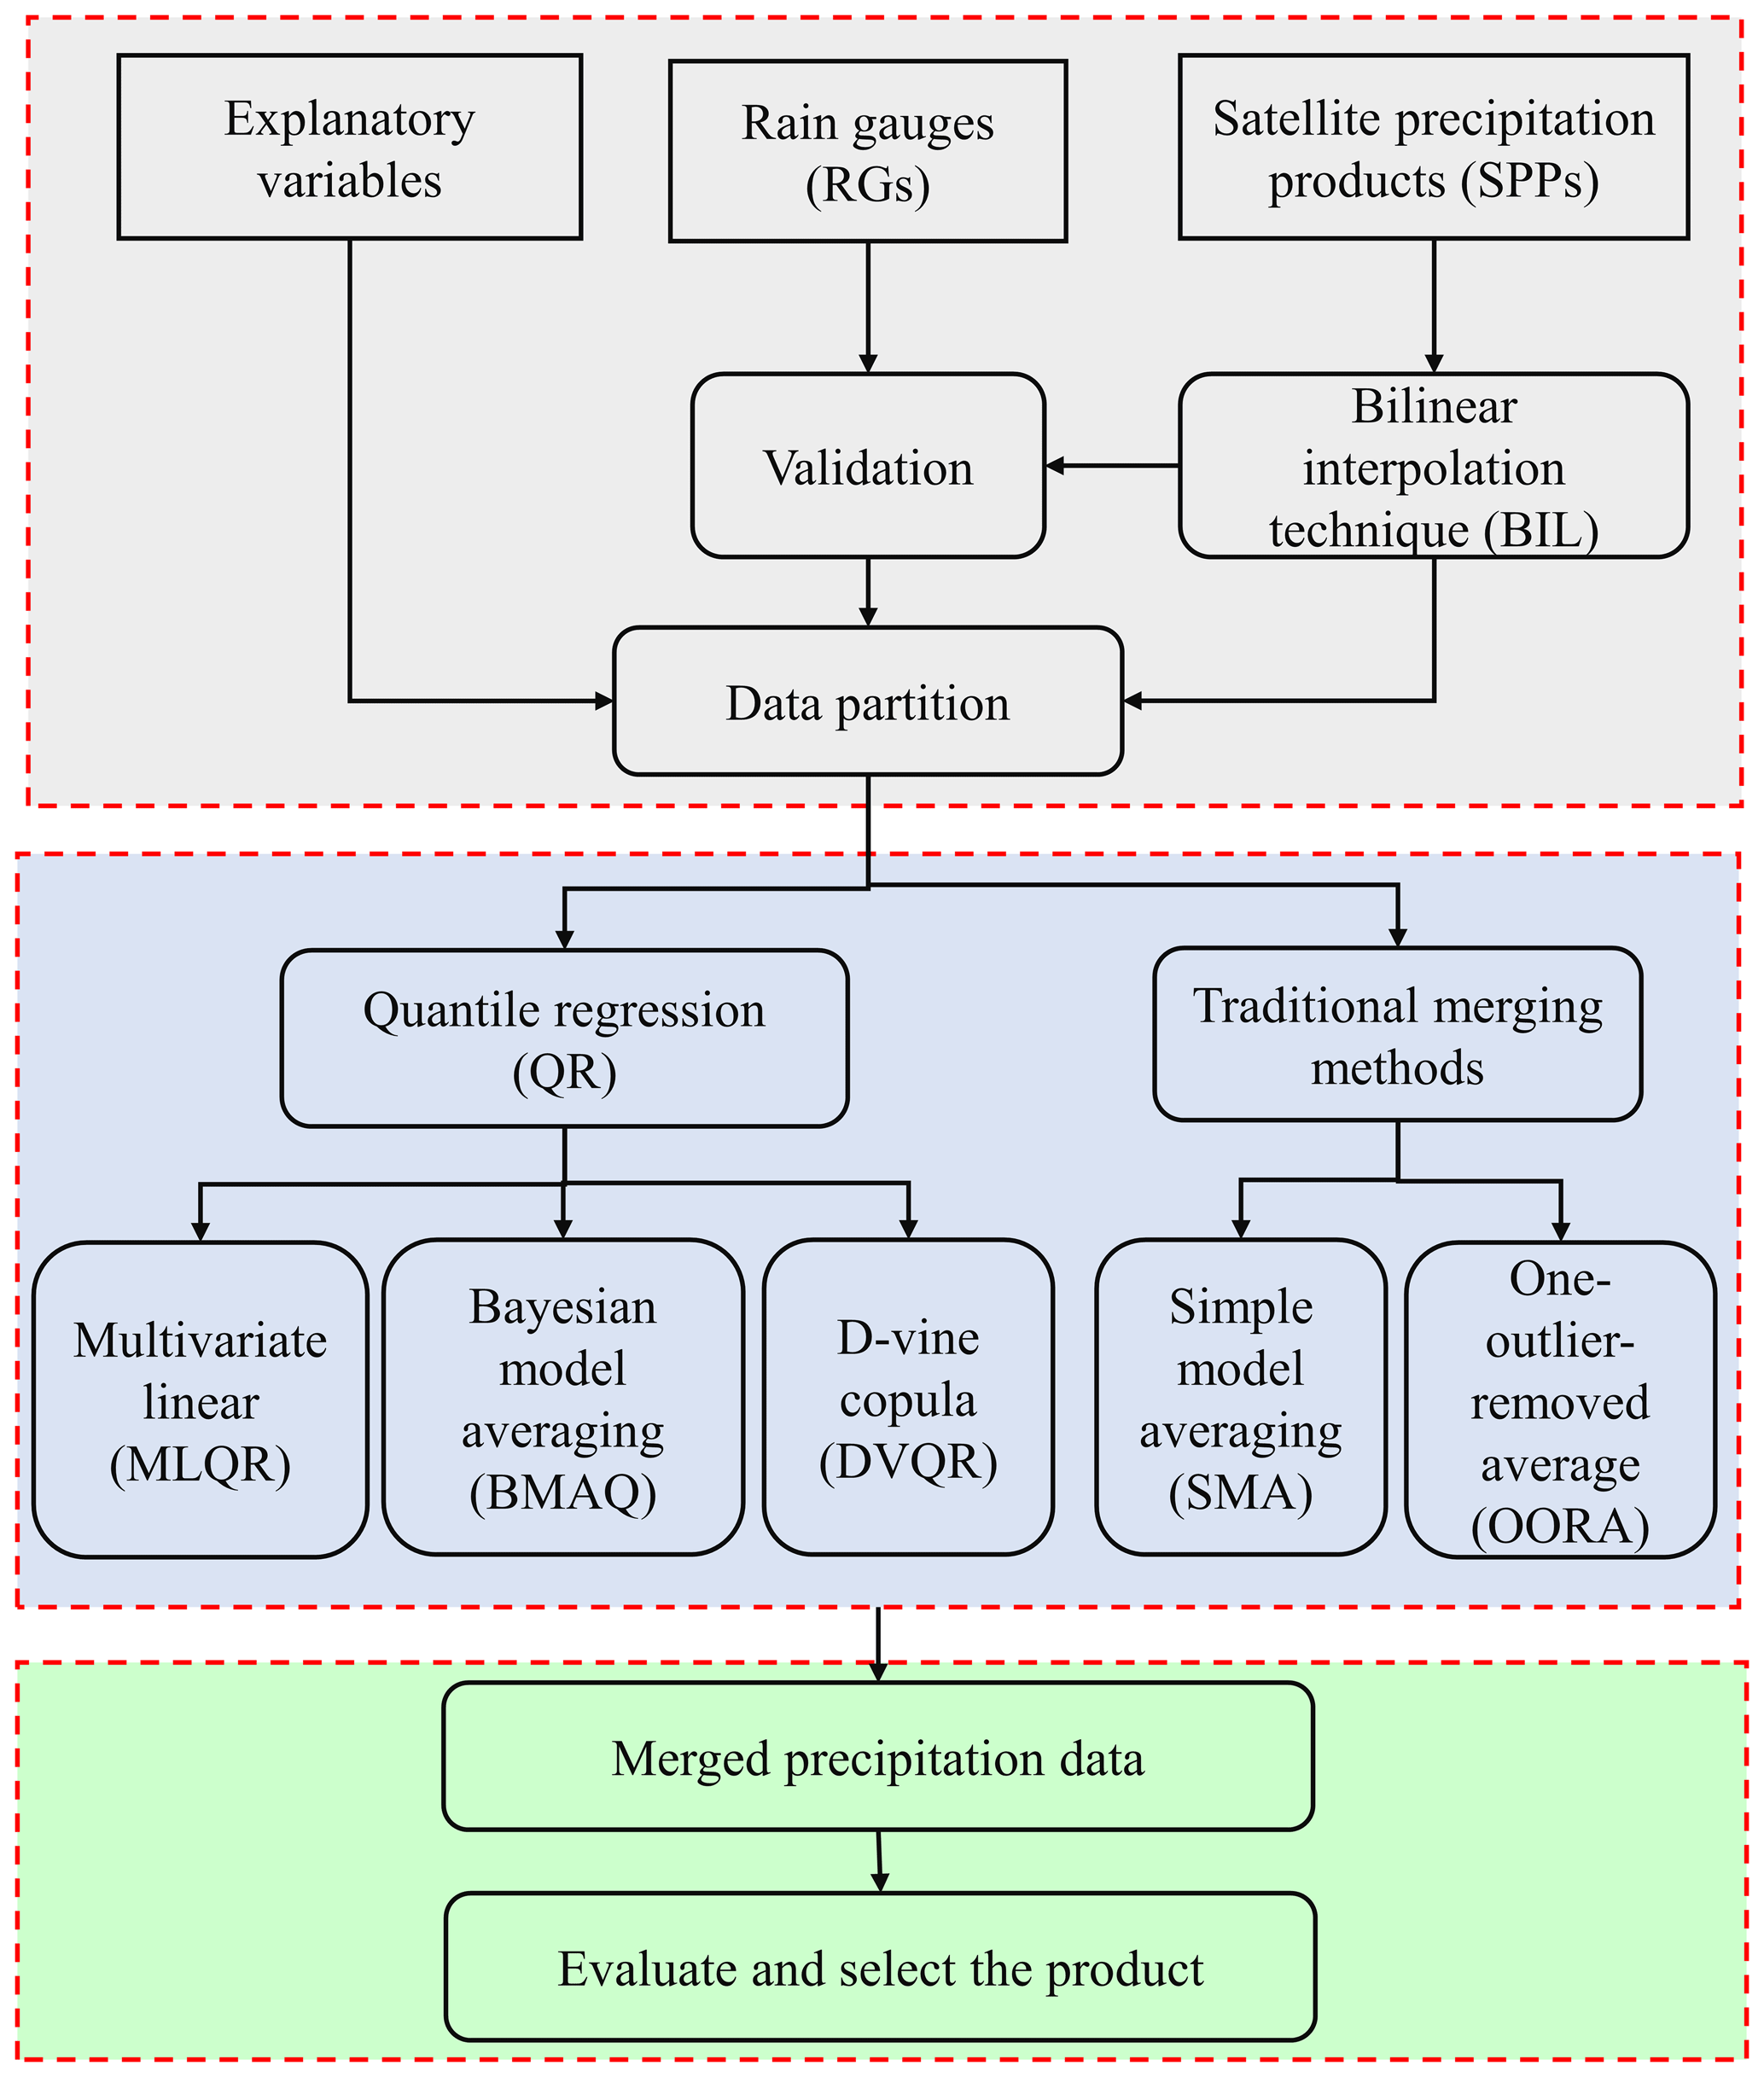
Figure 3The flowchart of merging multiple SPPs with RGs coupled with explanatory variables using quantile regression models and traditional merging methods during the summer monsoon over the UTAB.
3.2.1 D-vine copula-based quantile regression (DVQR) model
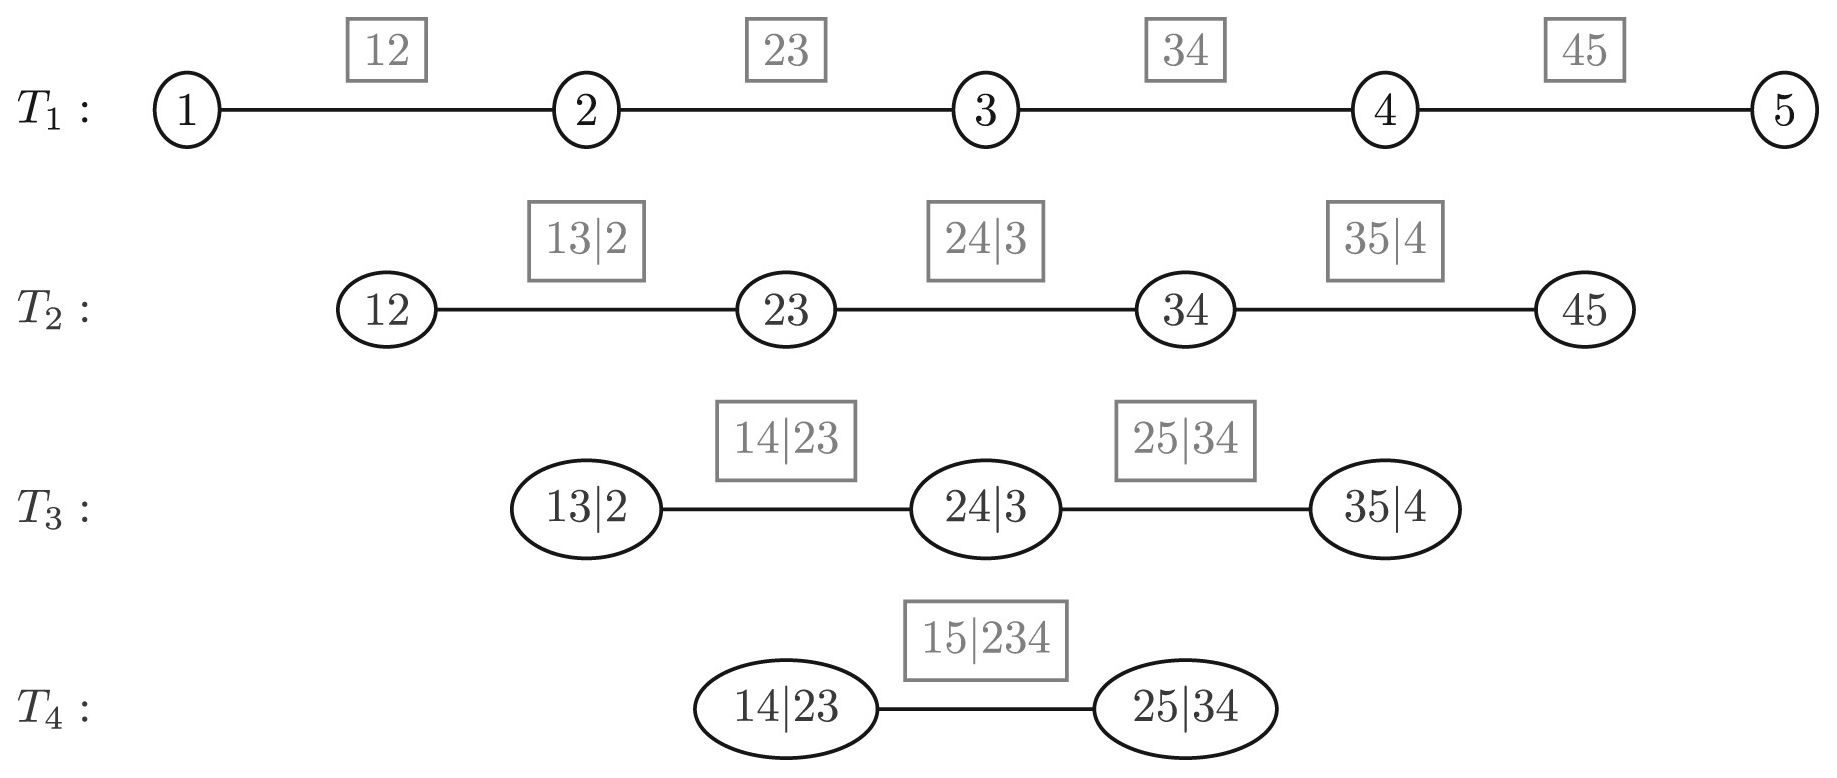
Copulas are functions that integrate several univariate marginal distributions into a single multivariate distribution, with all marginal distributions having the same uniform distribution on the [0, 1] (Genest and MacKay, 1959; Nelsen, 2005). Copulas have previously been used to tackle complex issues in a variety of fields, including hydrology (Pham et al., 2016), engineering (Niemierko et al., 2019), and finance (Bouyé and Salmon, 2009). Most previous studies have applied the copula approach in hydrology to model the dependence of two variables; however, only a few research studies have attempted to address the issues associated with high dimensions. Pair-copula construction, also known as vine copula (Aas et al., 2009), is a flexible approach for modeling high-dimensional dependency structures by breaking them down into individual products of conditional bivariate copula levels. Regular vine copulas are divided into two types: canonical (C-vine) and drawable vine (D-vine) copulas (Kurowicka and Cooke, 2005); thus, each model explains how to decompose the density uniquely. The hierarchy of a D-vine copula is made up of nesting trees. Figure 4 represents a hierarchical tree D-vine structure with five variables.
To our knowledge, this study is the first to use D-vine copula-based quantile regression (DVQR) to merge multiple SPPs with RGs coupled with explanatory variables across rugged topography like the UTAB. The DVQR model was first developed using historical data and integrating numerous variables selected to estimate the conditional quantile. DVQR offers benefits such as modeling high-dimensional dependency structures between input data and may represent nonlinear interactions among variables (Niemierko et al., 2019).
The primary goal of the DVQR model is to estimate the quantile level of the outcome variable Y based on the explanatory variables X1, …, Xn, n>1, where Y∼Fy and (i=1, 2, …, n). D-vines are utilized to simulate the joint distribution of Y, X1, …, Xn and compute the conditional quantile function of Y given X1, …, Xn for as the inverted conditional distribution function:
where V=FY(Y) and Uj=Fj(Xj) are defined as independent variables with implementations uj=Fj(xj). The right-hand side of Eq. (1) can be stated using Sklar's theorem (Genest and MacKay, 1959), as follows:
Lastly, Eq. (1) can be modified to include the calculated marginals , , …, and the vine copula , …, Un, as follows:
where represents the integral probability transformation computed using the continuous kernel smoother estimator (Parzen, 1962). The onepar copula (ONC) family is chosen for fitting copula selection because it is simple and flexible in terms of catching natural dependencies between hydrologic elements (Chen and Guo, 2019), which minimizes the computation costs when merging SPPs with fine spatial resolution. In the present study, five common ONCs are used: the Gaussian (GA), Clayton (C), Frank (F), Gumbel (GU), and Joe (J) copulas.
To predict daily precipitation data, the DVQR model merges multiple SPPs using all of the data on the interdependence relationships among components. To reduce the high computational cost, we limited our testing to modeling at only five quantile levels (5th, 25th, 50th, 75th, and 90th). Using Eq. (3) and the parameters , conditional quantiles of the merged precipitation data were produced. Descriptive statistics, including the correlation coefficient (CC), Nash–Sutcliffe efficiency (NSE), mean absolute error (MAE), and root-mean-square error (RMSE), were selected as key criteria to measure the reliability and sensitivity of merged precipitation data at various quantile levels.
3.2.2 Multivariate linear-based quantile regression (MLQR) model
The MLQR model was proposed by Koenker and Bassett (1978), and a detailed description of the concept can be found in Koenker and Ng (2005). The method employs procedures equivalent to linear regression to compute the quantile levels of a dependent variable based on predictor factors. The MLQR model differs from linear regression in that it minimizes the total amount of weighted absolute residuals rather than squared residuals. The MLQR model is explained intuitively as fitting a linear model and bisecting the input so that 100 q % (all of the output prediction values are under 1 quantile level) of the outputs are below the prediction values of the trained model. In practice, this is accomplished by training a linear model to the information and reducing the average quantile score.
3.2.3 Quantile Bayesian model averaging (QBMA) model
BMA is a technique that combines the estimated forecast density from various models to generate a new prediction probability density function (PDF). The predicted distribution of merged precipitation data x, given the observed rain gauges X during the training phase and the independent estimates of k models, can be stated using the theory of total probability, as follows:
where p(x|Mi, X) represents the posterior distribution of x given the predicted values Mi and training dataset X. Moreover, p(Mi|X) represents the likelihood of predicted data offered to the observed data X during the training phase, which further indicates the weight of every model Mi. Hence, the output of the BMA model is the mean weight of the predicted PDF produced from each model. Because the model predictions vary over time, Eq. (4) can be phrased as follows:
Note that w denotes the quality of the model throughout the training phase. To address this equation, it is generally acknowledged that such a posterior distribution follows a Gaussian distribution with the average of observed data , while the variance , related to SPPs, can be represented as follows (Abbaszadeh et al., 2022): . BMA probabilistic modeling improves reliability by including weights from more efficient precipitation products. It is essential to emphasize that a powerful transformation (e.g., Box–Cox) is employed for non-Gaussian forecasting variables (SPPs, RGs, and explanatory variables) to translate them from their natural space toward a Gaussian space. The variability and weight of each prediction model can be determined using the log-likelihood formula. The expectation–maximization (EM) model was proposed by Raftery et al. (2005a) to optimize Eq. (6), which cannot be calculated analytically.
The EM algorithm execution instructions are laid out in Duan et al. (2007). The EM algorithm was employed to calculate unique weights (wk). With an accurate assessment of weights for each precipitation product, it is simple to construct merged precipitation data using Eq. (4). The quantile-based BMA (BMAQ) technique transfers data from predictors to estimate the target at various quantile levels. In the present study, we suggest employing the BMAQ model to produce merged-precipitation-data-based quantile levels and to consider this for comparison with other models.
3.2.4 Traditional merging methods
This study adopted two common traditional merging methods of multiple SPPs, the simple model average (SMA) and the one-outlier-removed average (OORA), as given in Eqs. (7) and (8), respectively:
Here, Rmerg represents the merged precipitation data, n is the number of satellite products, and Sati represents the SPPs.
3.2.5 Merging criteria
In this study, daily precipitation data over the UTAB from four SPPs were merged with RGs and explanatory variables during the summer monsoon for the period from 2001 to 2017. We developed 10 models to train the DVQR, MLQR, and BMAQ models based on 9 stations (90 %) in order to predict merged precipitation data at a target station (10 %); we then switched the target station with one of the training stations (Mohammadi and Aghashariatmadari, 2020).
The DVQR, MLQR, and QBMA models were optimized during the training phase to produce good modeling performance while avoiding overfitting. Hyperparameter optimization searches the optimal parameters of applied models that govern their performance (Abdalla et al., 2021). The best quantile level was selected to predict accurate and realistic merged precipitation data by testing five quantile levels (0.05, 0.25, 0.50, 0.75, and 0.90) for the DVQR and MLQR models, whereas the BMAQ model was tested using the mean quantile, and the 0.1, 0.5, and 0.9 quantile levels.
3.3 Performance evaluation
Several descriptive and categorical statistics were employed to assess the performance and robustness of the DVQR, MLQR, and BMAQ models in terms of merging multiple SPPs over rugged topography (in the UTAB). The selected descriptive statistics include the CC, Kling–Gupta efficiency (KGE), NSE, MAE, and RMSE. The CC and KEG were used to measure the agreement between SPP and RG data; these statistics range from 0 to 1: 1 indicates a perfect match, whereas 0 indicates no agreement. The NSE, in contrast, is a technique for determining the relative magnitude of SPPs compared to RGs; it has been widely used to assess the accuracy of hydrological simulations (Nash and Sutcliffe, 1970). However, the NSE was recently used to evaluate precipitation data (Lu et al., 2019); it ranges from −∞ to 1: 1 indicates high credibility and good-quality SPPs, whereas a value less than 0 indicates that SPPs are not credible and have low quality. The MAE and RMSE measure the mean error of SPPs: perfect values are close to zero.
The aforementioned descriptive statistics are calculated as follows:
Here, S is a satellite estimate of precipitation; O represents daily RG precipitation at station i; and represent the average precipitation from SPPs and RGs, respectively; n represents the number of days in the study period; cd and rd represent the average precipitation data for SPPs and RGs, respectively; and cm and rm are the standard deviation of SPPs and RGs, respectively.
Additionally, we employed different categorical statistics to assess the capability of the original and merged SPPs with respect to capturing varied precipitation events, including the probability of detection (POD), false-alarm ratio (FAR), frequency bias index (FBI), and critical success index (CSI). Successful detection of precipitation events ought to have POD, CSI, and FBI values of 1 and a FAR value of 0. The aforementioned categorical statistics are defined as follows:
Here, H represents the precipitation events captured by the RGs and the original and merged SPPs at the same time, M represents the precipitation events captured by the RGs but not by the original and merged SPPs, and F represents the precipitation events captured by the original and merged SPPs but not by the RGs.
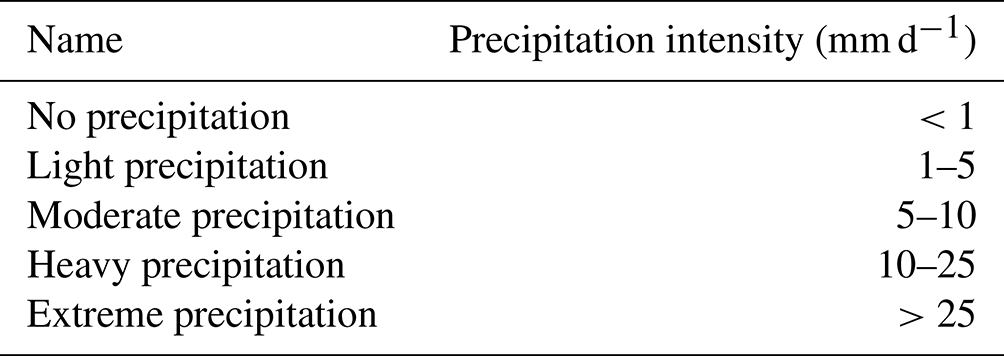
The categorical skill statistics were employed for five classes of precipitation intensity, including no precipitation ([0, 1) mm d−1), light precipitation ([1, 5) mm d−1), moderate precipitation ([5, 10] mm d−1), heavy precipitation ([10, 25] mm d−1), and extreme precipitation (25 mm d−1), as shown in Table 2 (Amjad et al., 2020).
4.1 Downscaling evaluation
This study applied the bilinear (BIL) interpolation technique to downscale SPPs and explanatory variables from a coarse spatial resolution (0.1 and 0.25°) to a fine resolution (0.01°) to reduce the imbalance with respect to scale between the pixel and rain gauge point. We evaluated the performance of SPPs before and after the interpolation step against the RG data to check if the interpolation techniques improved the quality of the original SPP data. The results presented in Table 3 show that the CC and PBIAS (percentage of bias) of downscaled SPPs range from 0.36 to 0.44 and from −8.1 to 13.3, respectively. In contrast, the CC and PBIAS value of the original SPPs range from 0.34 to 0.43 and from −8.4 to 16.8, respectively. These results indicate that the BIL interpolation technique has little influence on improving the original SPP data. The spatial pattern of the distribution of the mean annual precipitation data of the original and downscaled SPPs is shown in Fig. 5. Hence, the downscaling step offers a solid data foundation for training and testing for a later stage of the merging approach (Chen et al., 2018).
Table 3Mean values of CC, MAE, RMSE, and PBIAS for the original (ORI) and downscaled (BIL) SPPs using BIL interpolation techniques at the daily scale during the summer monsoon from 2001 to 2017 over the UTAB.
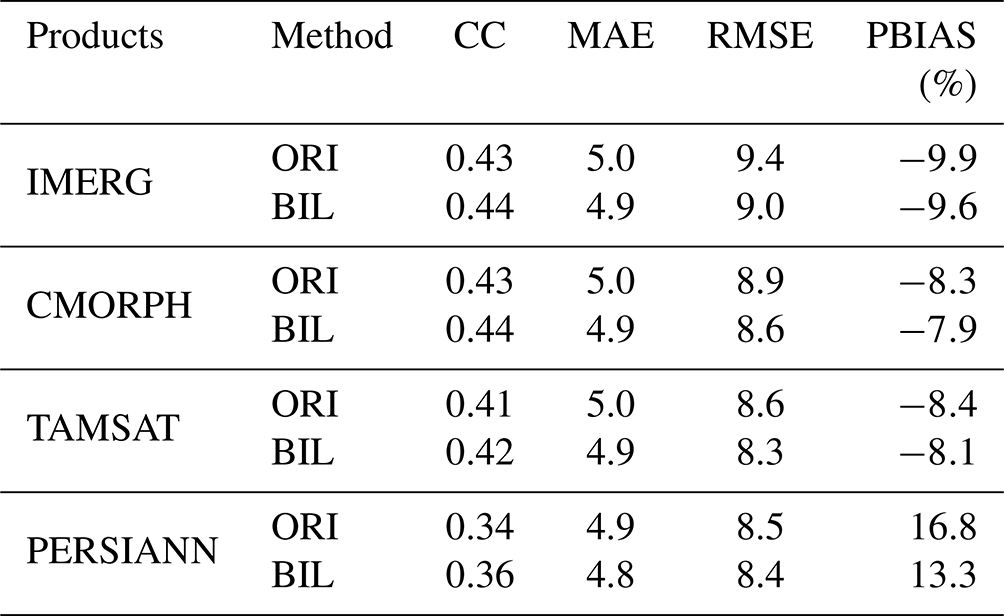
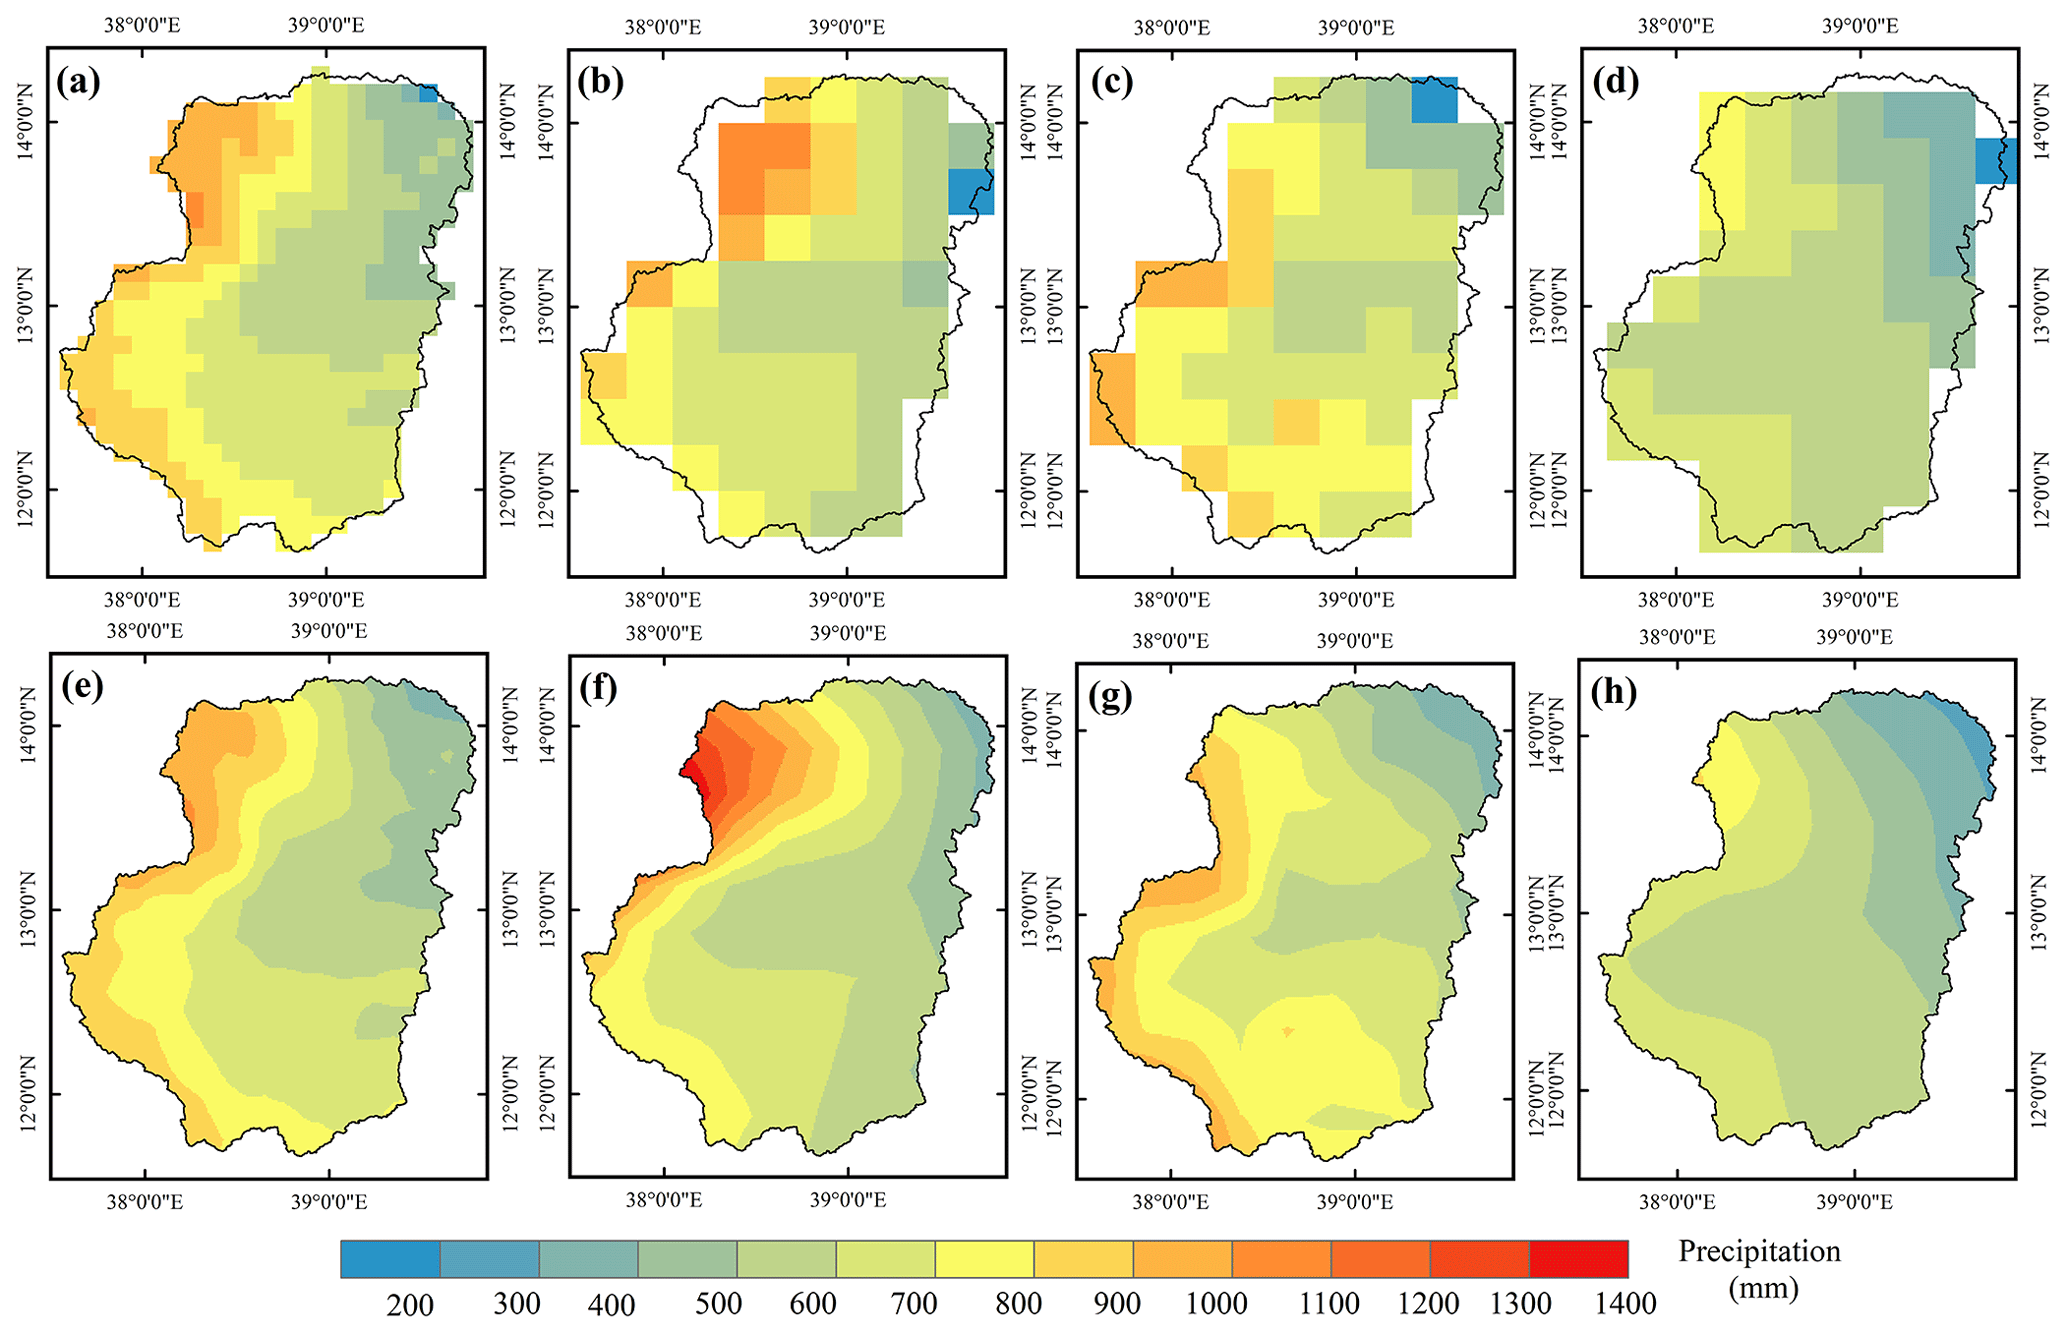
Figure 5Spatial pattern of the distribution of mean monsoon precipitation during 2001–2017 over the UTAB for (a–d) original SPPs with a coarse spatial resolution and (e–h) downscaled SPPs using the BIL interpolation technique for IMERG, CMORPH, TAMSAT, and PERSIANN, respectively.
4.2 Spatial distribution of monsoon precipitation
A critical factor in evaluating the abilities of satellite-based precipitation products (SPPs) is the characterization of the spatial heterogeneity of precipitation data (Haile et al., 2009). The minimum monsoon precipitation values are 256, 290, 300, and 324 mm for PERSIANN, TAMSAT, IMERG, and CMORPH, respectively, whereas the maximum corresponding monsoon precipitation values are 817, 1014, 1250, and 1384 mm (as shown in Fig. 5e–h). The mean monsoon precipitation in the UTAB ranges from 337 to 928 mm for the period from 2001 to 2017, with a decreasing distribution pattern from the southwest to the northeast, depending on the 10 RGs used in this study. The spatial distribution maps of the mean monsoon precipitation of downscaled SPPs (Fig. 5e–h) indicate an over- or underestimation of precipitation data compared with RGs (Fig. 6a). In particular, the TAMSAT, IMERG, and CMORPH products are remarkable with respect to their overestimation of precipitation data, whereas the PERSIANN product is characterized by an underestimation of precipitation data during the summer monsoon. The spatial pattern of precipitation distribution produced by SPPs varies significantly from that of RGs. As a result, the SPPs are incapable of capturing the large-spatial-scale attributes of the seasonal mean precipitation distribution pattern.
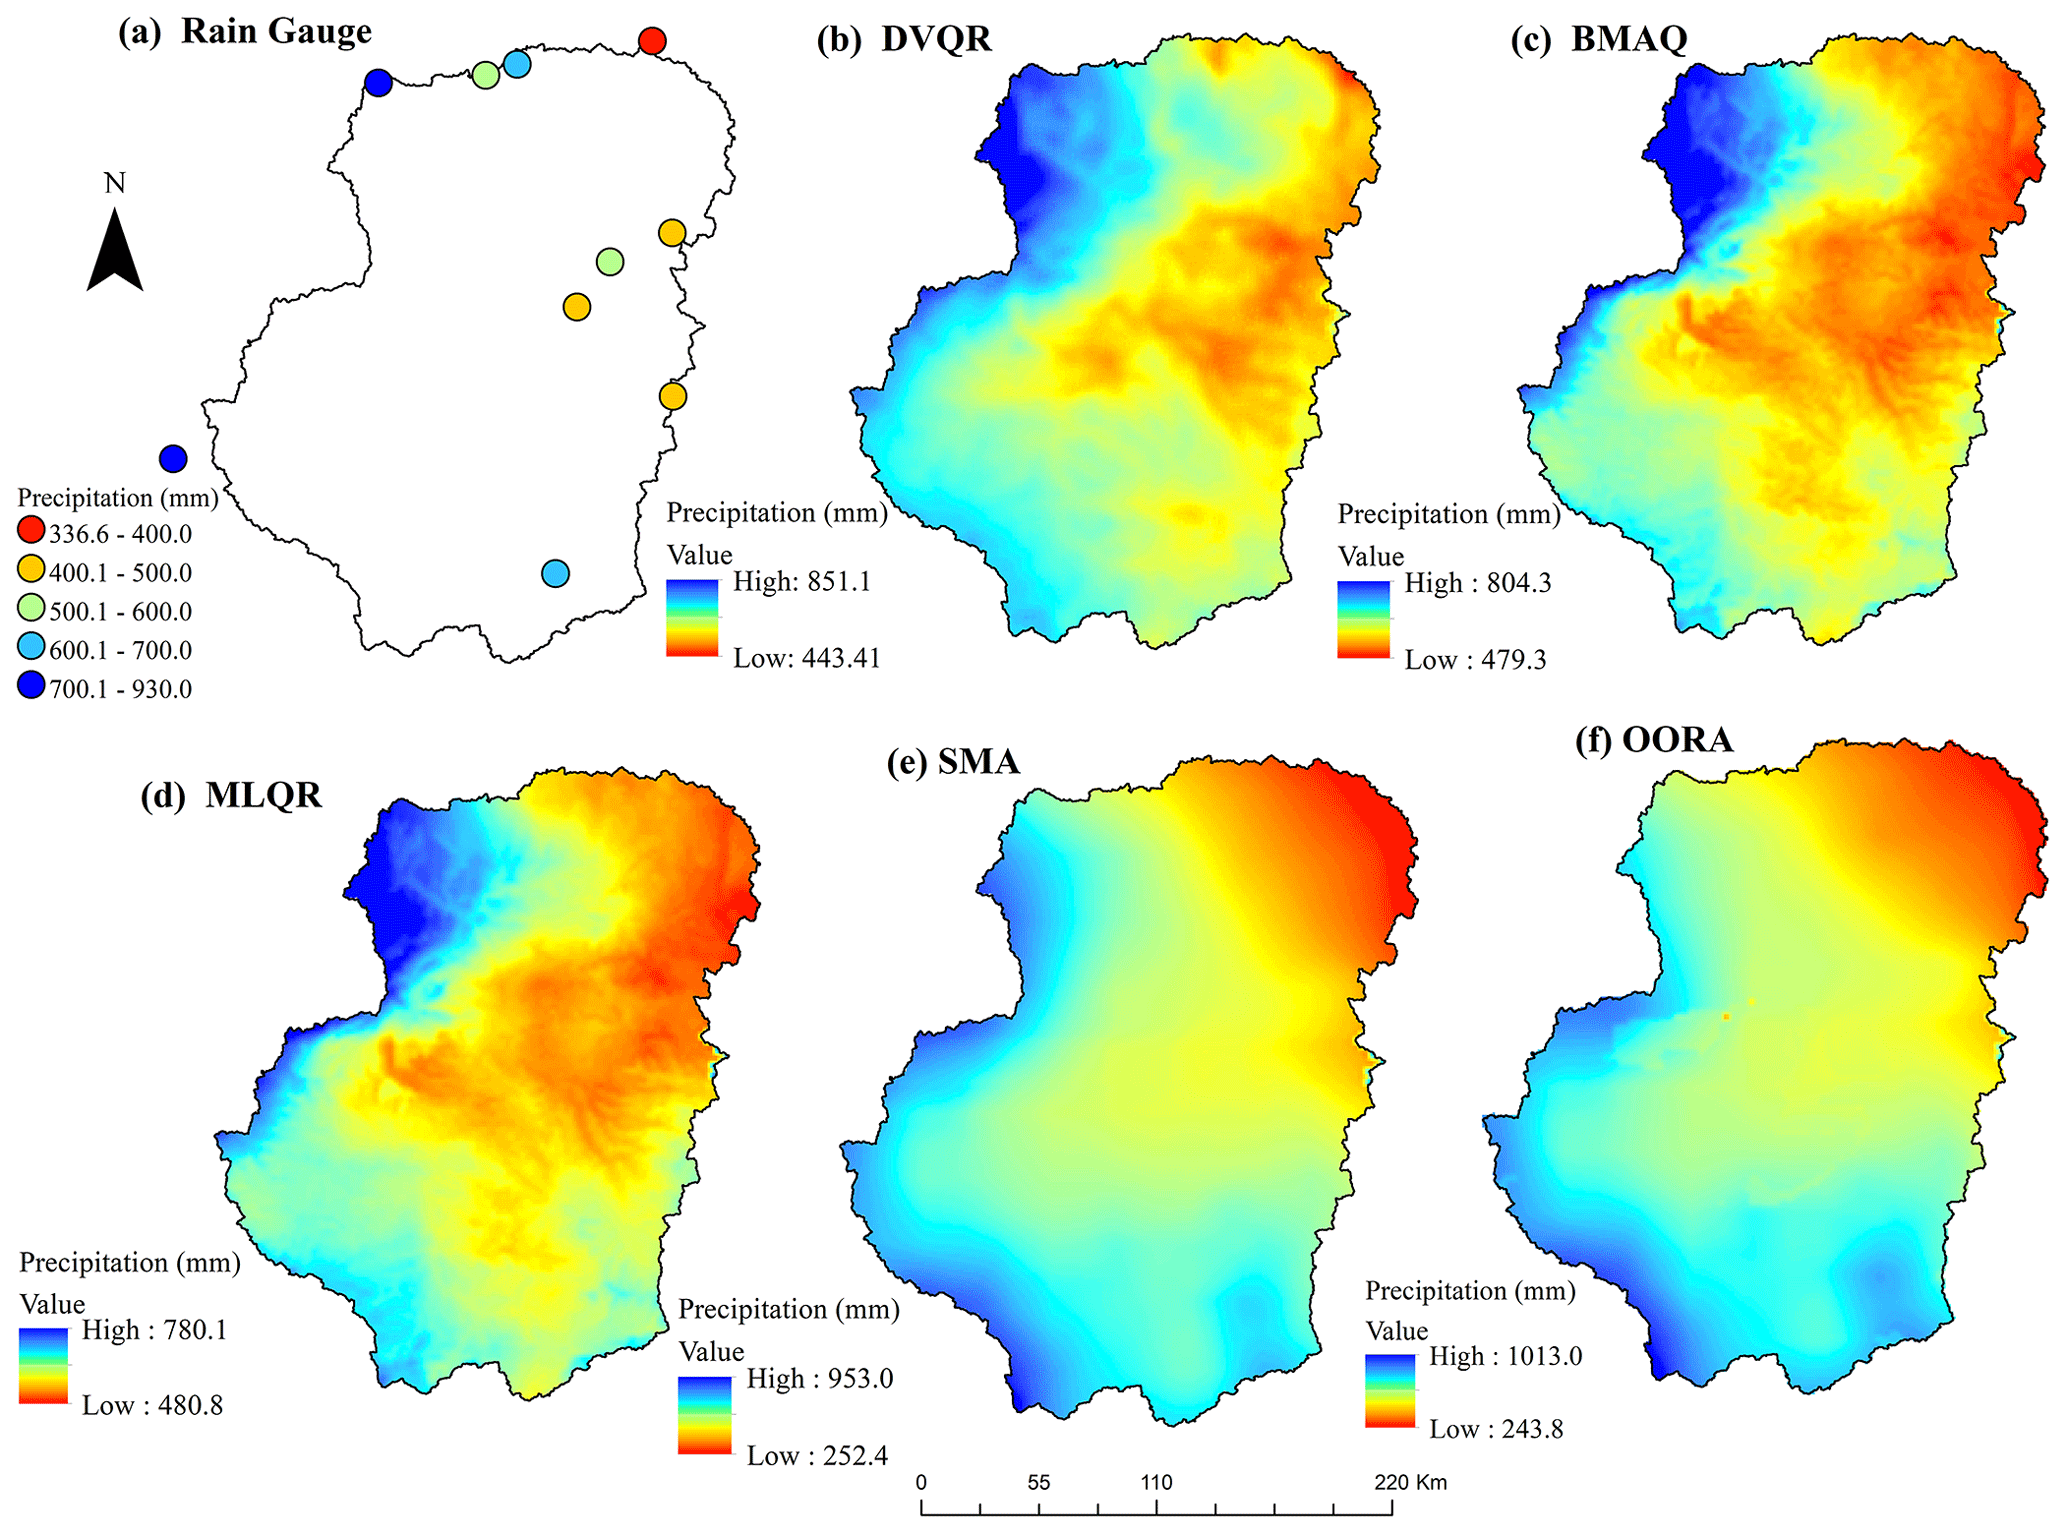
Figure 6Spatial pattern of the distribution of mean monsoon precipitation (in mm) from 2001 to 2017 for (a) rain gauges, (b) DVQR, (c) BMAQ, (d) MLQR, (e) SMA, and (f) OORA over the UTAB.
Additionally, we compared the spatial distribution produced by various merging approaches, as presented in Fig. 6b–f. The minimum mean monsoon precipitation values are 443, 479, 480, 250, and 243 (mm) for the DVQR, BMAQ, MLQR, SMA, and OORA models, respectively, whereas the corresponding maximum mean monsoon precipitation values are 851, 804, 780, 953, and 1013 (mm). We observed that both of the traditional merging methods (SMA and OORA) produced the amount of precipitation with an underestimation and an overestimation across the northeastern and southwestern parts of the region, respectively. Therefore, adopting another emerging approach is necessary, as traditional methods failed to produce satisfactory precipitation during summer monsoon periods over the UTAB. Compared with RGs, the results obtained by the DVQR model performed better than those from the BMAQ and MLQR models with respect to capturing monsoon precipitation's magnitude and spatial variability. Overall, the merged precipitation is uniform with RGs, underscoring the efficiency and reliability of the applied merging approaches.
4.3 Overall performance of the merged precipitation data
The present study proposes merging multiple SPPs with RGs and explanatory variables for the UTAB during the summer monsoon in the period from 2001 to 2017, as described in Sect. 3. Figure 7 shows the box plot of the distributions of descriptive statistics for the original SPPs and merged precipitation data (based on traditional merging methods and quantile regression models) against RGs. The main criteria of the box plot divide the dataset into four items based on the maximum, minimum, median, and two quartiles, whereas the median, which divides the statistical data into two equal portions, is indicated by the middle horizontal line. The mean CC values of downscaled SPPs are 0.44, 0.44, 0.43, and 0.36 for IMERG, CMORPH, TAMSAT, and PERSIANN, respectively. These results indicate that the daily precipitation data of downscaled SPPs have poor performance (CC < 0.5) compared with RGs. Moreover, the SMA and OORA methods performed better than downscaled SPPs: the CC is 0.49 and 0.47, respectively. The CC values of the three quantile regression models are 0.49, 0.50, and 0.50 for the DVQR, BMAQ, and MLQR models, respectively. Overall, quantile regression models' CC values for merged precipitation data are higher compared with traditional merging methods (SMA and OORA) or individual downscaled SPPs.
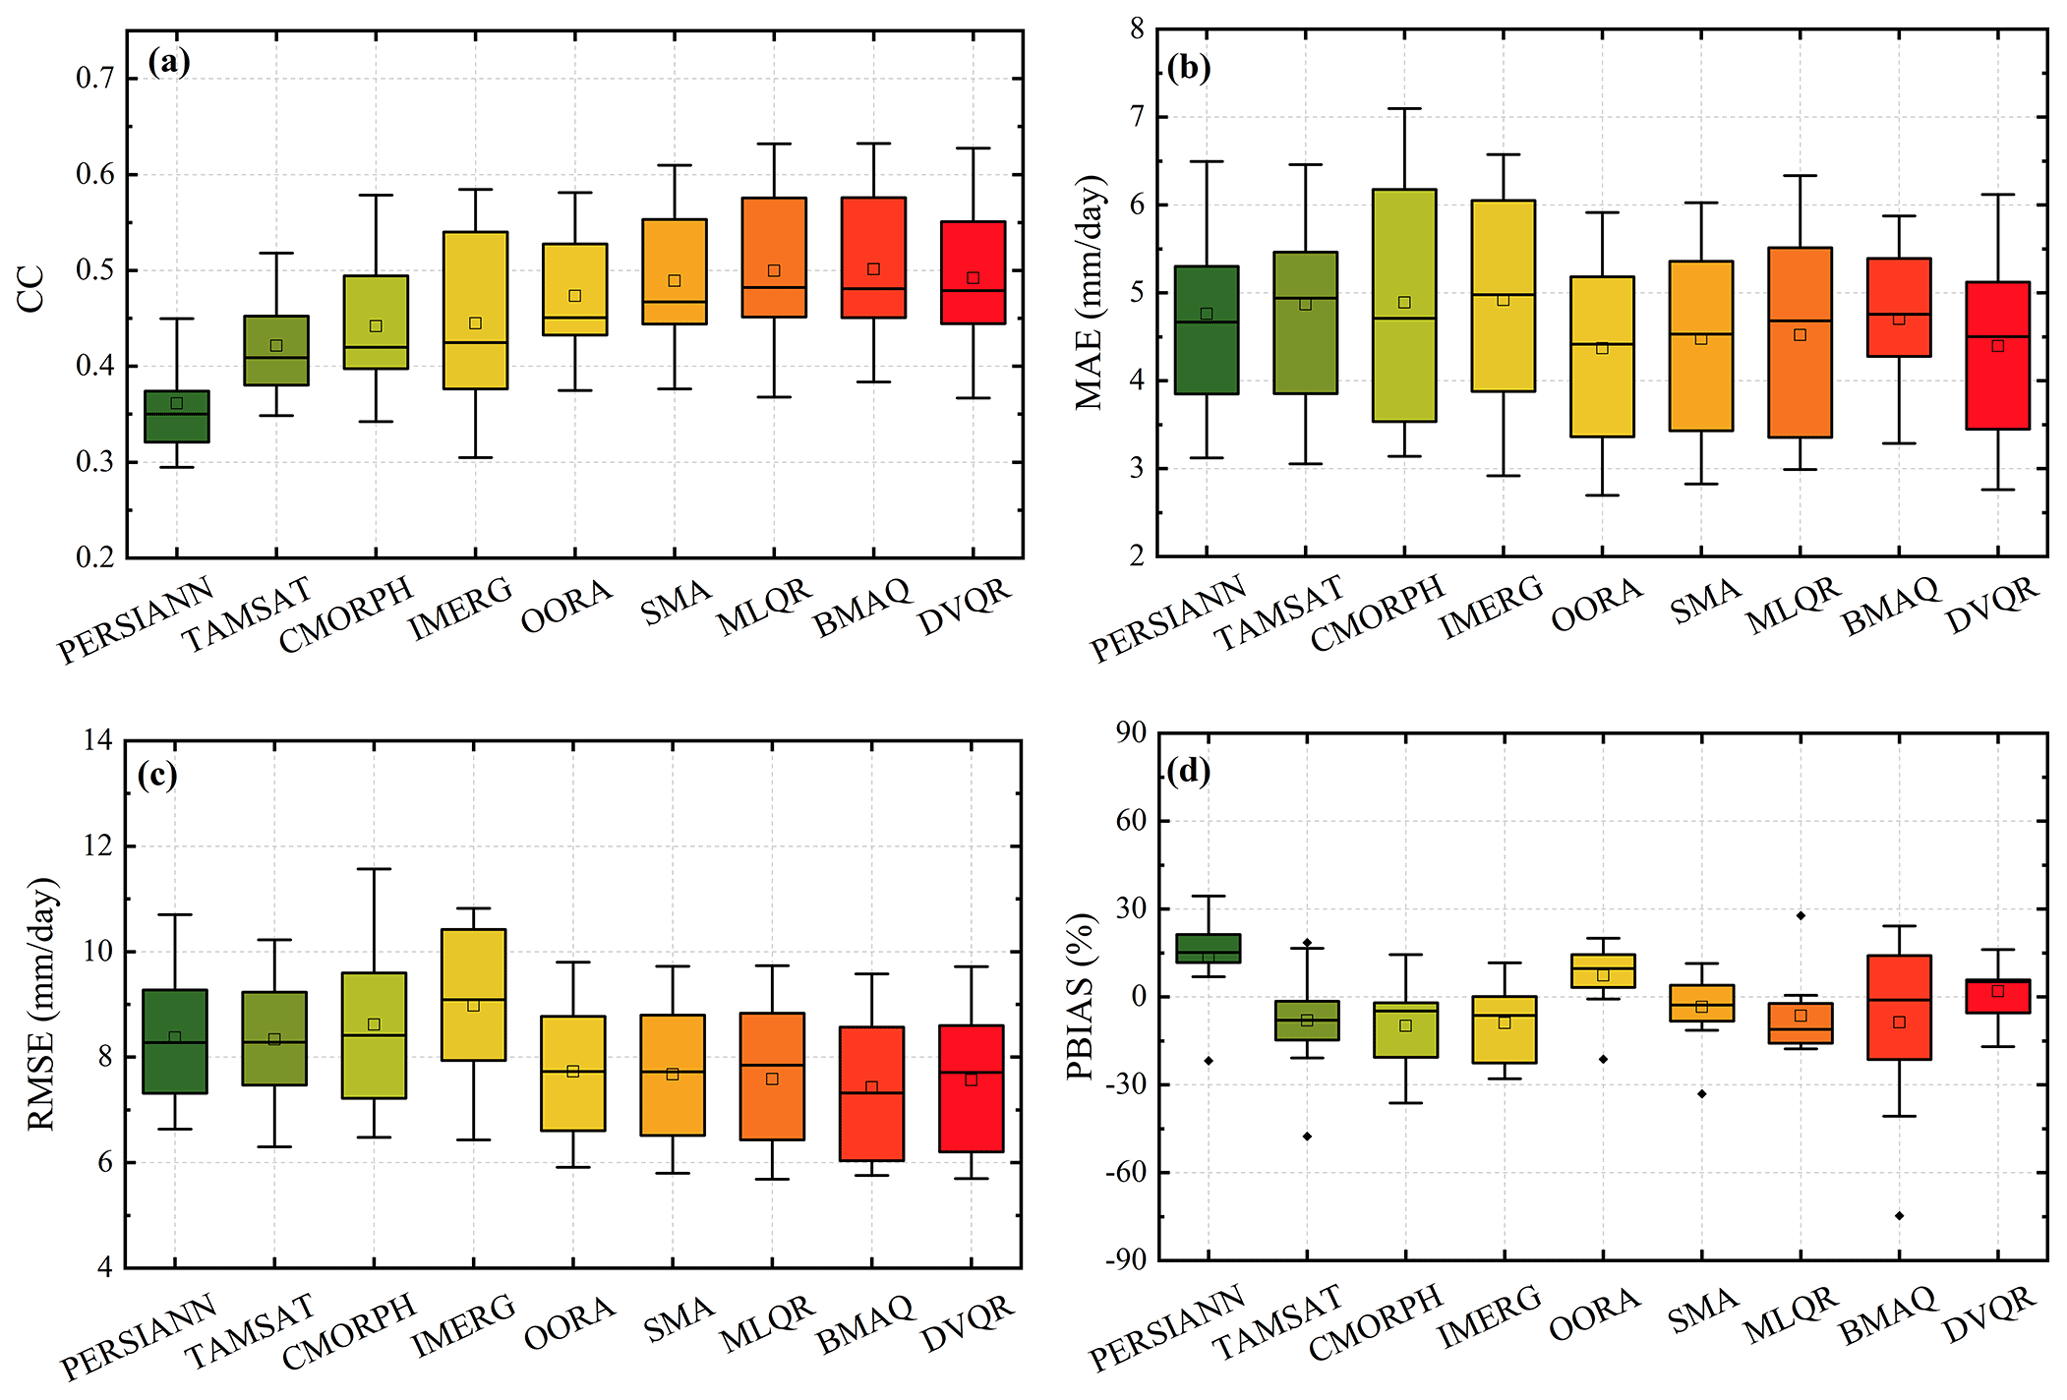
Figure 7Box plot distribution of the CC, MAE, RMSE, and PBIAS of individual downscaled SPPs and merged precipitation data based on traditional merging methods and quantile regression models during the summer monsoon from 2001 to 2017 over the UTAB.
The precipitation data merged using quantile regression models recorded the lowest MAE and RMSE values compared with downscaled SPPs (as shown in Fig. 7b and c, respectively). The DVQR model indicates lower MAE values, whereas the BMAQ model indicates lower RMSE values. In addition, based on the distribution of PBIAS in Fig. 7d, PERSIANN is characterized by an underestimation of precipitation data, whereas IMERG, CMORPH, and TAMSAT are characterized by an overestimation. Among the merging approaches, the DVQR model shows the lowest PBIAS followed by the SMA, BMAQ, MLQR, and OORA models. The precipitation data merged using the DVQR model generally showed better performance than the BMAQ and MLQR models.
Figure 8 shows the scatterplots of downscaled SPPs and merged precipitation data based on traditional merging methods and quantile regression models against RGs at a daily temporal scale during the summer monsoon for the whole study period. The NSE value of downscaled SPPs is less than 0.3, which is regarded as unsatisfactory (Sen Gupta and Tarboton, 2016), whereas the KGE is less than 0.6 for all downscaled SPPs. The merged precipitation data in Fig. 8e–i are relatively close to the 1:1 line, whereas the downscaled SPPs (in Fig. 8a–d) exhibit the most scattered precipitation data distribution, indicating that quality after merging is changed for the better. Furthermore, when it comes to merging approaches, the quantile regression models fit better than traditional merging methods and downscaled SPPs. On the other hand, the KGE values are 0.744, 0.749, 0.771, 0.657, and 0.785, while the NSE values are 0.501, 0.484, 0.543, 0.617, and 0.615 for the OORA, SMA, MLQR, BMAQ, and DVQR models, respectively. An NSE value greater than 0.5 is considered satisfactory (Sen Gupta and Tarboton, 2016); results suggest that the quantile regression models have significantly improved the accuracy of downscaled SPPs. Likewise, the precipitation data merged by the DVQR model were strongly correlated with RGs over the UTAB, which was more abundantly clear than in MLQR and BMAQ models (as seen in Fig. 8i).
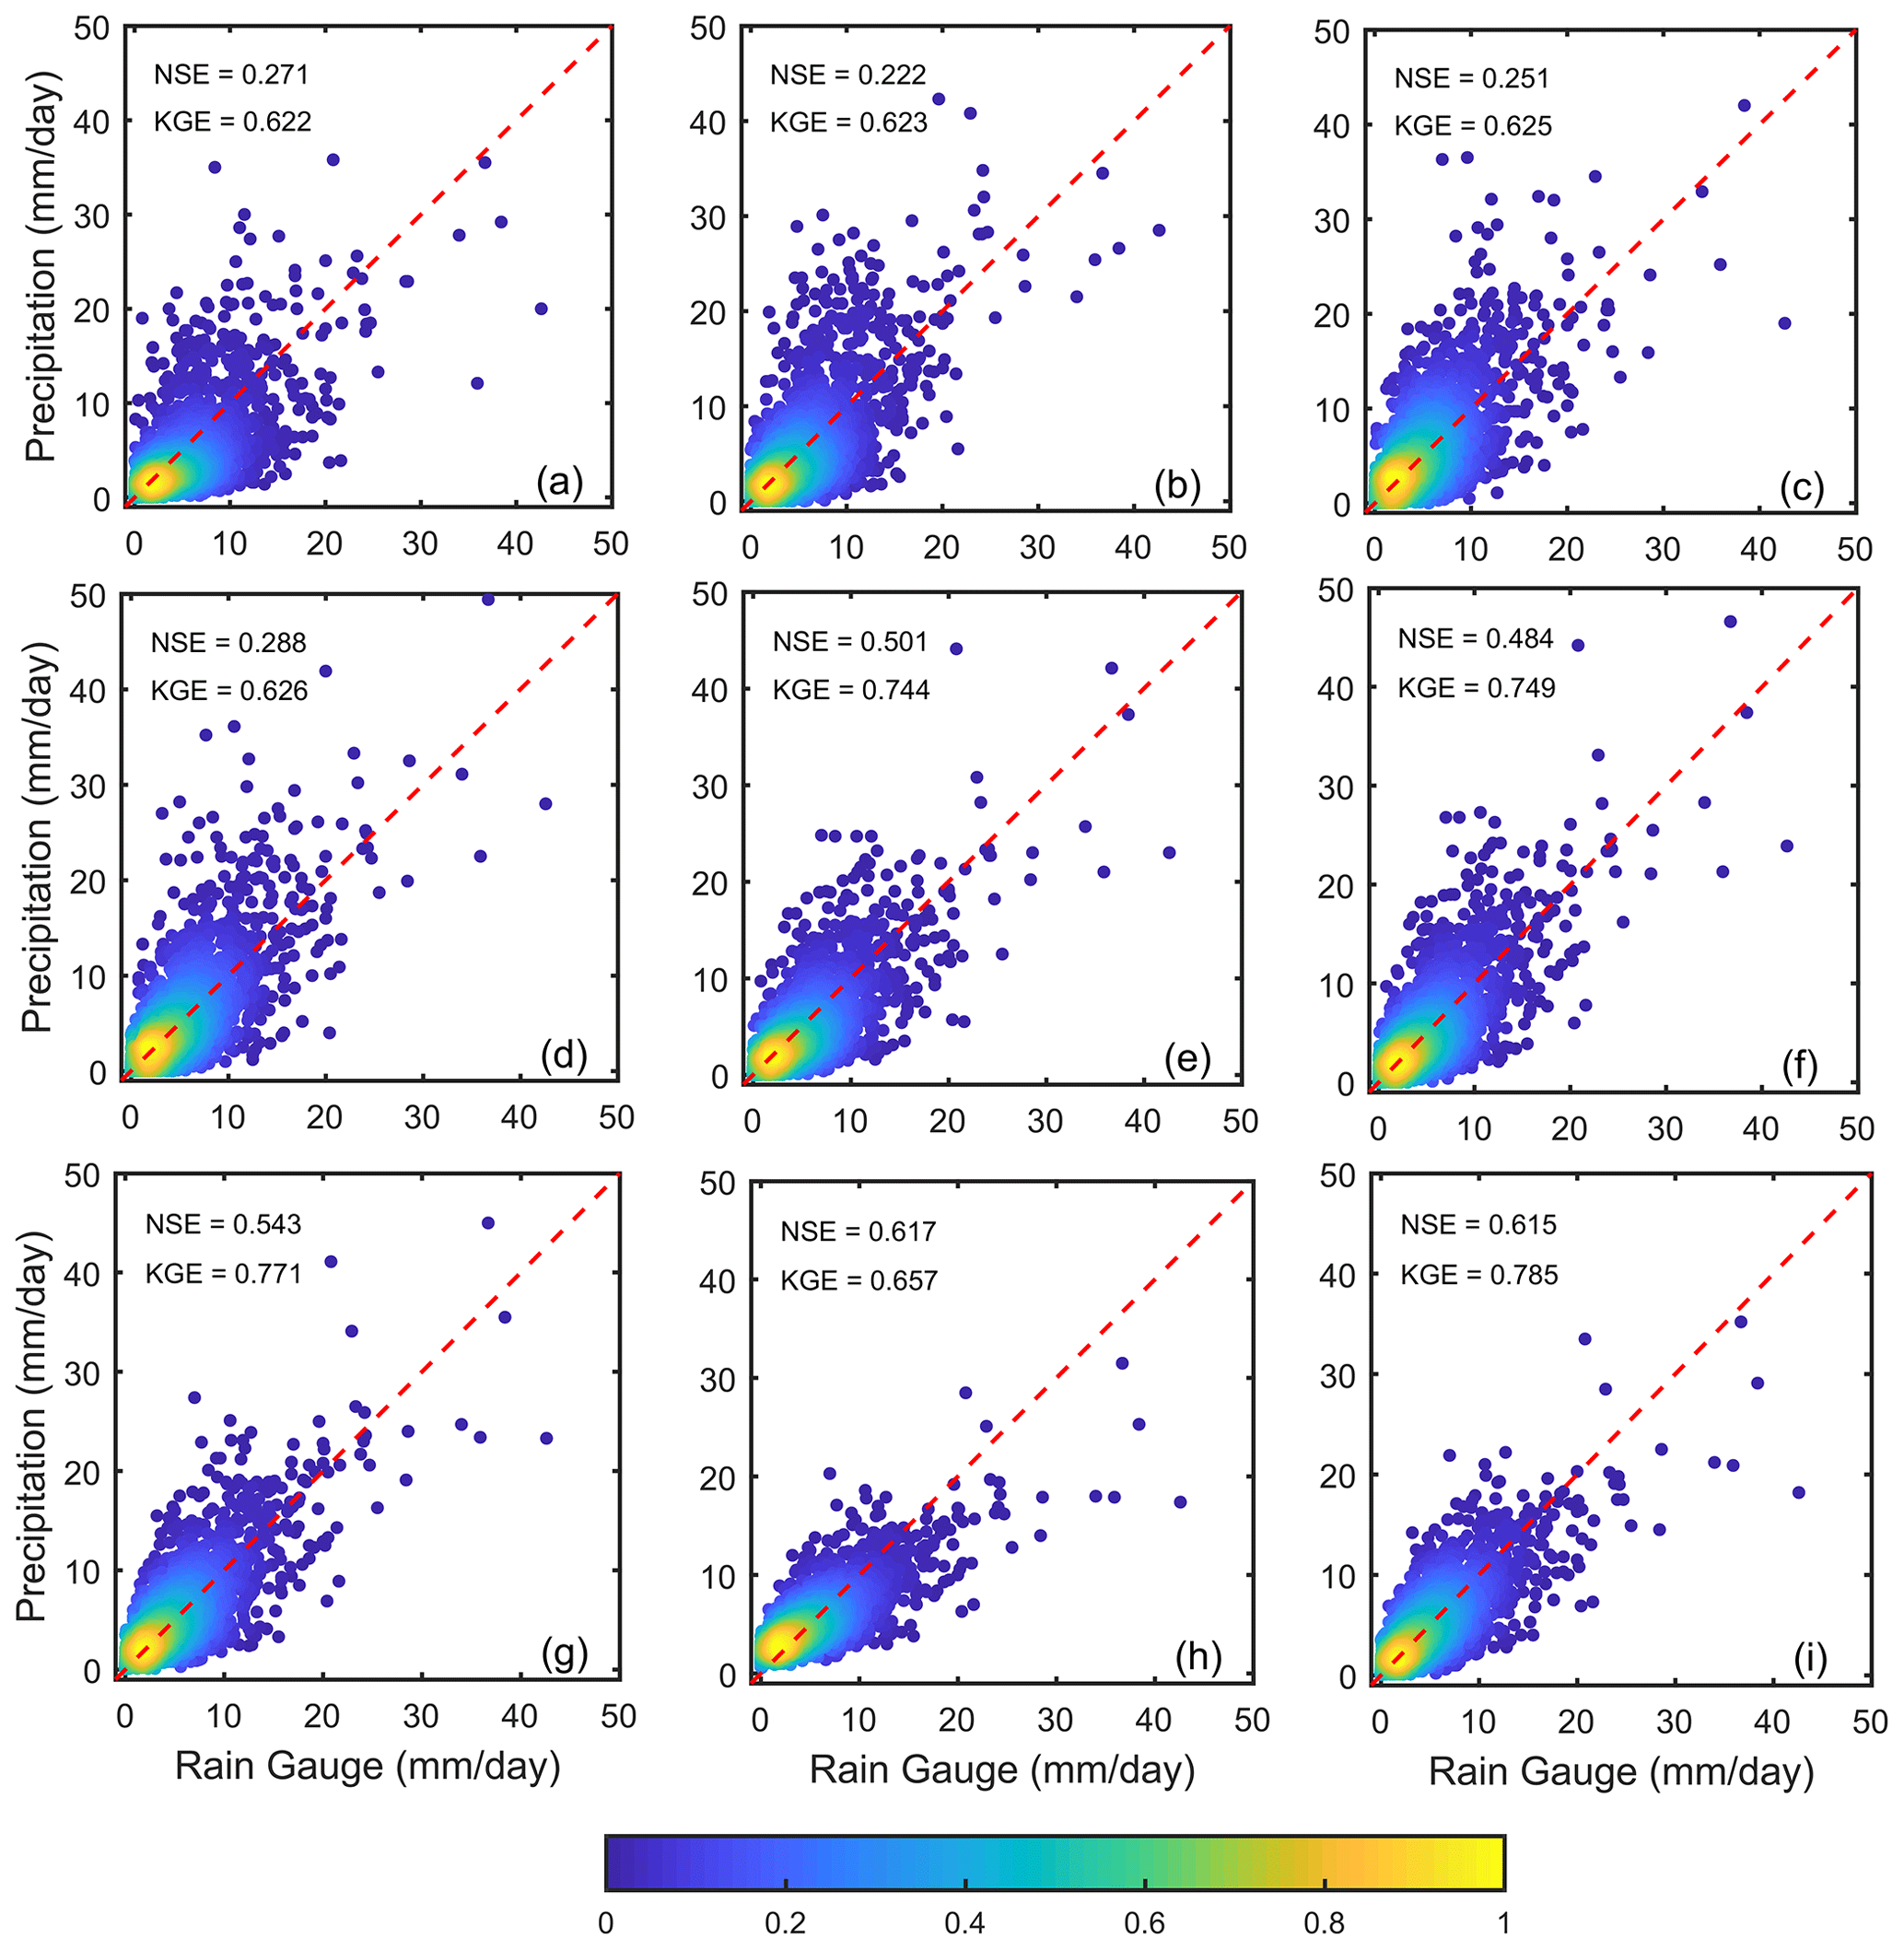
Figure 8Comparison of the average basin precipitation data of individual downscaled SPPs, including (a) PERSIANN, (b) TAMSAT, (c) CMORPH, and (d) IMERG; traditional merged methods, including (e) OORA and (f) SMA; and quantile regression models, including (g) MLQR, (h) BMAQ, and (i) DVQR, during summer monsoon from 2001 to 2017 over the UTAB.
Table 4Descriptive statistics (CC, MAE, RMSE, and PBIAS) of the original daily SPPs (PERSIANN, TAMSAT, CMORPH, and IMERG) and merged precipitation data using traditional merging methods (OORA and SMA) and quantile regression models (MLQR, BMAQ, and DVQR) during the summer monsoon from 2001 to 2017 over the UTAB.
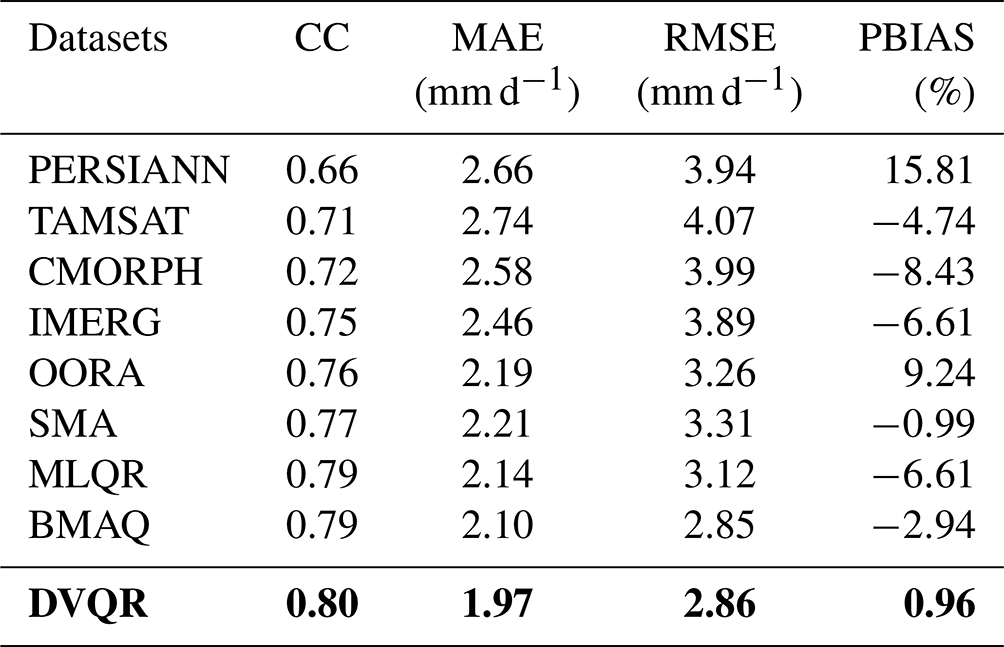
Note that the best descriptive statistics are highlighted in bold.
Table 4 shows the overall performance of downscaled SPPs, traditional methods, and quantile regression models against RGs during the summer monsoon from 2001 to 2017 over the UTAB. The CC values of downscaled SPPs are 0.66, 0.71, 0.72, and 0.75 for PERSIANN, TAMSAT, CMORPH, and IMERG, respectively, whereas the CC values for the traditional OORA and SMA merging methods are 0.76 and 0.77, respectively. However, the quantile regression models outperformed traditional merging methods and downscaled SPPs: CC values were 0.79, 0.79, and 0.80 for the MLQR, BMAQ, and DVQR models, respectively. These results indicate that all merged precipitation data have remarkable linear correlations with RGs compared with the downscaled SPPs. In addition, the quantile regression models have a notably high accuracy compared with precipitation data merged using traditional methods and downscaled SPPs. The MAE and RMSE values of the original SPPs decrease when using traditional merging methods (OORA and SMA) and quantile regression models (MLQR, BMAQ, and DVQR), while the DVQR model observed lower MAE and RMSE values than other merging models. Overall, the PBIAS values of downscaled SPPs are 15.81 %, −4.74 %, −8.43 %, and −6.61 % for PERSIANN, TAMSAT, CMORPH, and IMERG, respectively. The PBIAS values of the SMA and OORA methods are −0.99 % and 9.24 %, respectively, indicating that the SMA method improved the estimation of precipitation data. Generally, the SMA method showed the smallest PBIAS compared with the OORA method and downscaled SPPs. Regarding quantile regression models, the PBIAS values of the DVQR, MLQR, and BMAQ models are 0.96 %, −2.94 %, and −6.61 %, respectively. The DVQR model generally reduces the large error of downscaled SPPs and, notably, performs better than the MLQR and BMAQ models.
Generally, the DVQR model shows better performance than the other merging approaches, with significant improvements in all metrics. A Taylor diagram was used to evaluate the performance of the merging approaches to further provide a comprehensive evaluation of accuracy. Based on the CC, centered RMSE, and standard deviation (SD) statistical metrics, the Taylor diagram quantified the degree of correspondence between RGs and estimated precipitation (Wang et al., 2021). The closest points of estimated precipitation to the RG points represent the best accuracy. In addition, the Taylor diagram is a highly useful tool for analyzing the meteorological dataset with respect to comparing the performance between different datasets (Chao et al., 2021). Figure 9 shows the Taylor diagram of various precipitation sources, including downscaled SPPs, traditional merging methods, and quantile regression models during the summer monsoon over the UTAB. The IMERG product exhibits the best performance compared with other downscaled SPPs during summer monsoon over the UTAB. The merged precipitation data outperformed the downscaled SPPs over the study region. Moreover, the BMAQ and DVQR models show better performance than others in terms of the CC and RMSE; however, the BMAQ model indicates a lower SD than other models. The BMAQ and DVQR models outperformed all downscaled SPPs (IMERG, CMORPH, TAMSAT, and PERSIANN) according to the CC, RMSE, and SD across the UTAB.
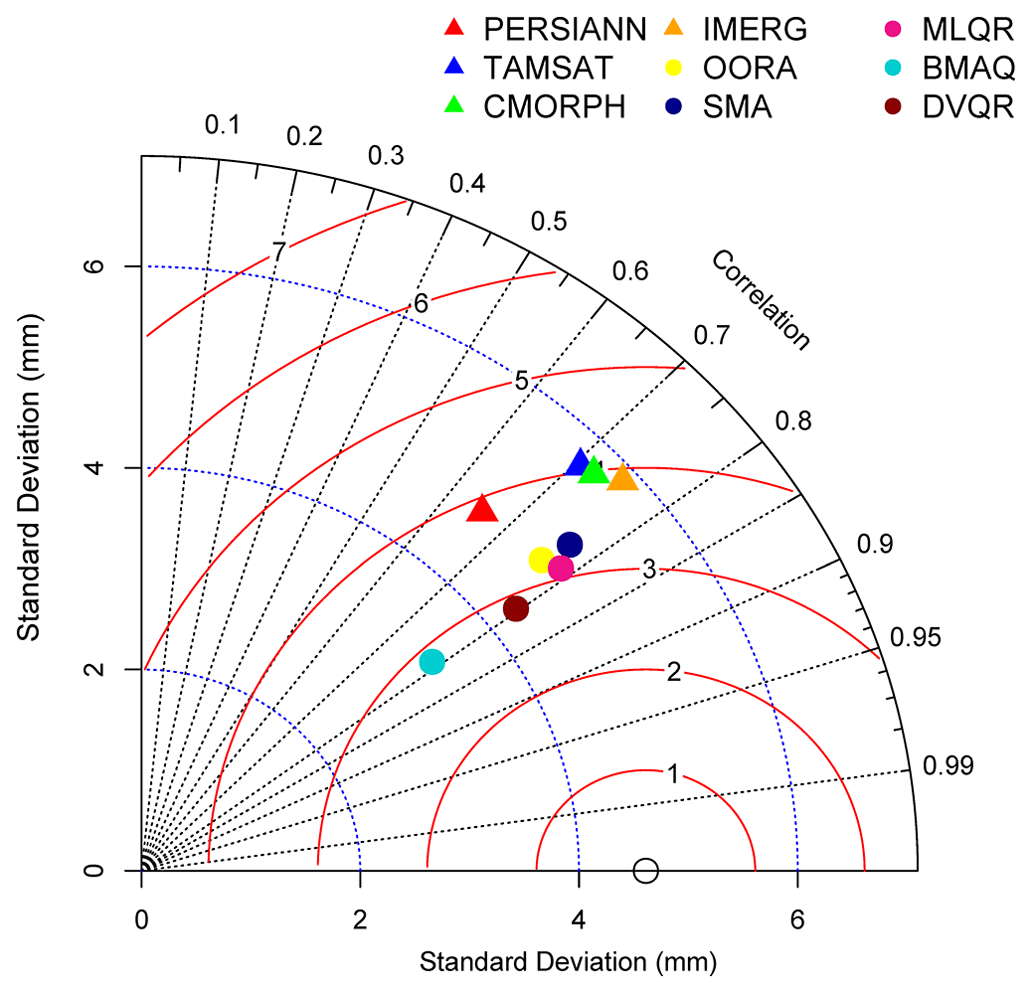
Figure 9Taylor diagram of downscaled SPPs, including PERSIANN (red triangle), TAMSAT (blue triangle), CMORPH (green triangle), and IMERG (orange triangle); traditional methods, including OORA (yellow dot) and SMA (dark blue dot); and quantile regression models, including MLQR (deep pink dot), BMAQ (aqua dot), and DVQR (brown dot)), for the whole summer monsoon period from 2001 to 2017. The black dashed lines indicate the CC, the red solid arcs denote the RMSE, and the blue dotted arcs are the standard deviation.
Nevertheless, the nonlinear DVQR model shows a high potential capability with respect to merging SPPs compared with the linear quantile regression (MLQR) model over the UTAB. However, it is inappropriate to figure out conditional quantiles scattered beyond the center range. Nonetheless, the D-vine copula approaches provide a way to forecast the highly nonlinear conditionally of the quantiles at the tails.
4.4 Monthly scale assessment
To show how the DVQR model improves the quality of merged precipitation data, we also evaluate the degree of fit of the daily precipitation data for each month during the summer monsoon over the UTAB. Figure 10 shows a group of Taylor diagrams to compare the quality of different precipitation sources according to the CC, RMSE, and SD during June, July, August, and September. Among the downscaled SPPs, the IMERG product showed the best performance compared with other products during June, July, and August, while the CMORPH product outperformed the others during September. In general, the precipitation data merged using quantile regression models and traditional merging methods outperform those from the downscaled SPPs across the UTAB. Interestingly, the precipitation data merged using traditional merging methods, including SMA and OORA, indicate better performance next to quantile regression models during all summer monsoon months (as seen in Fig. 10).
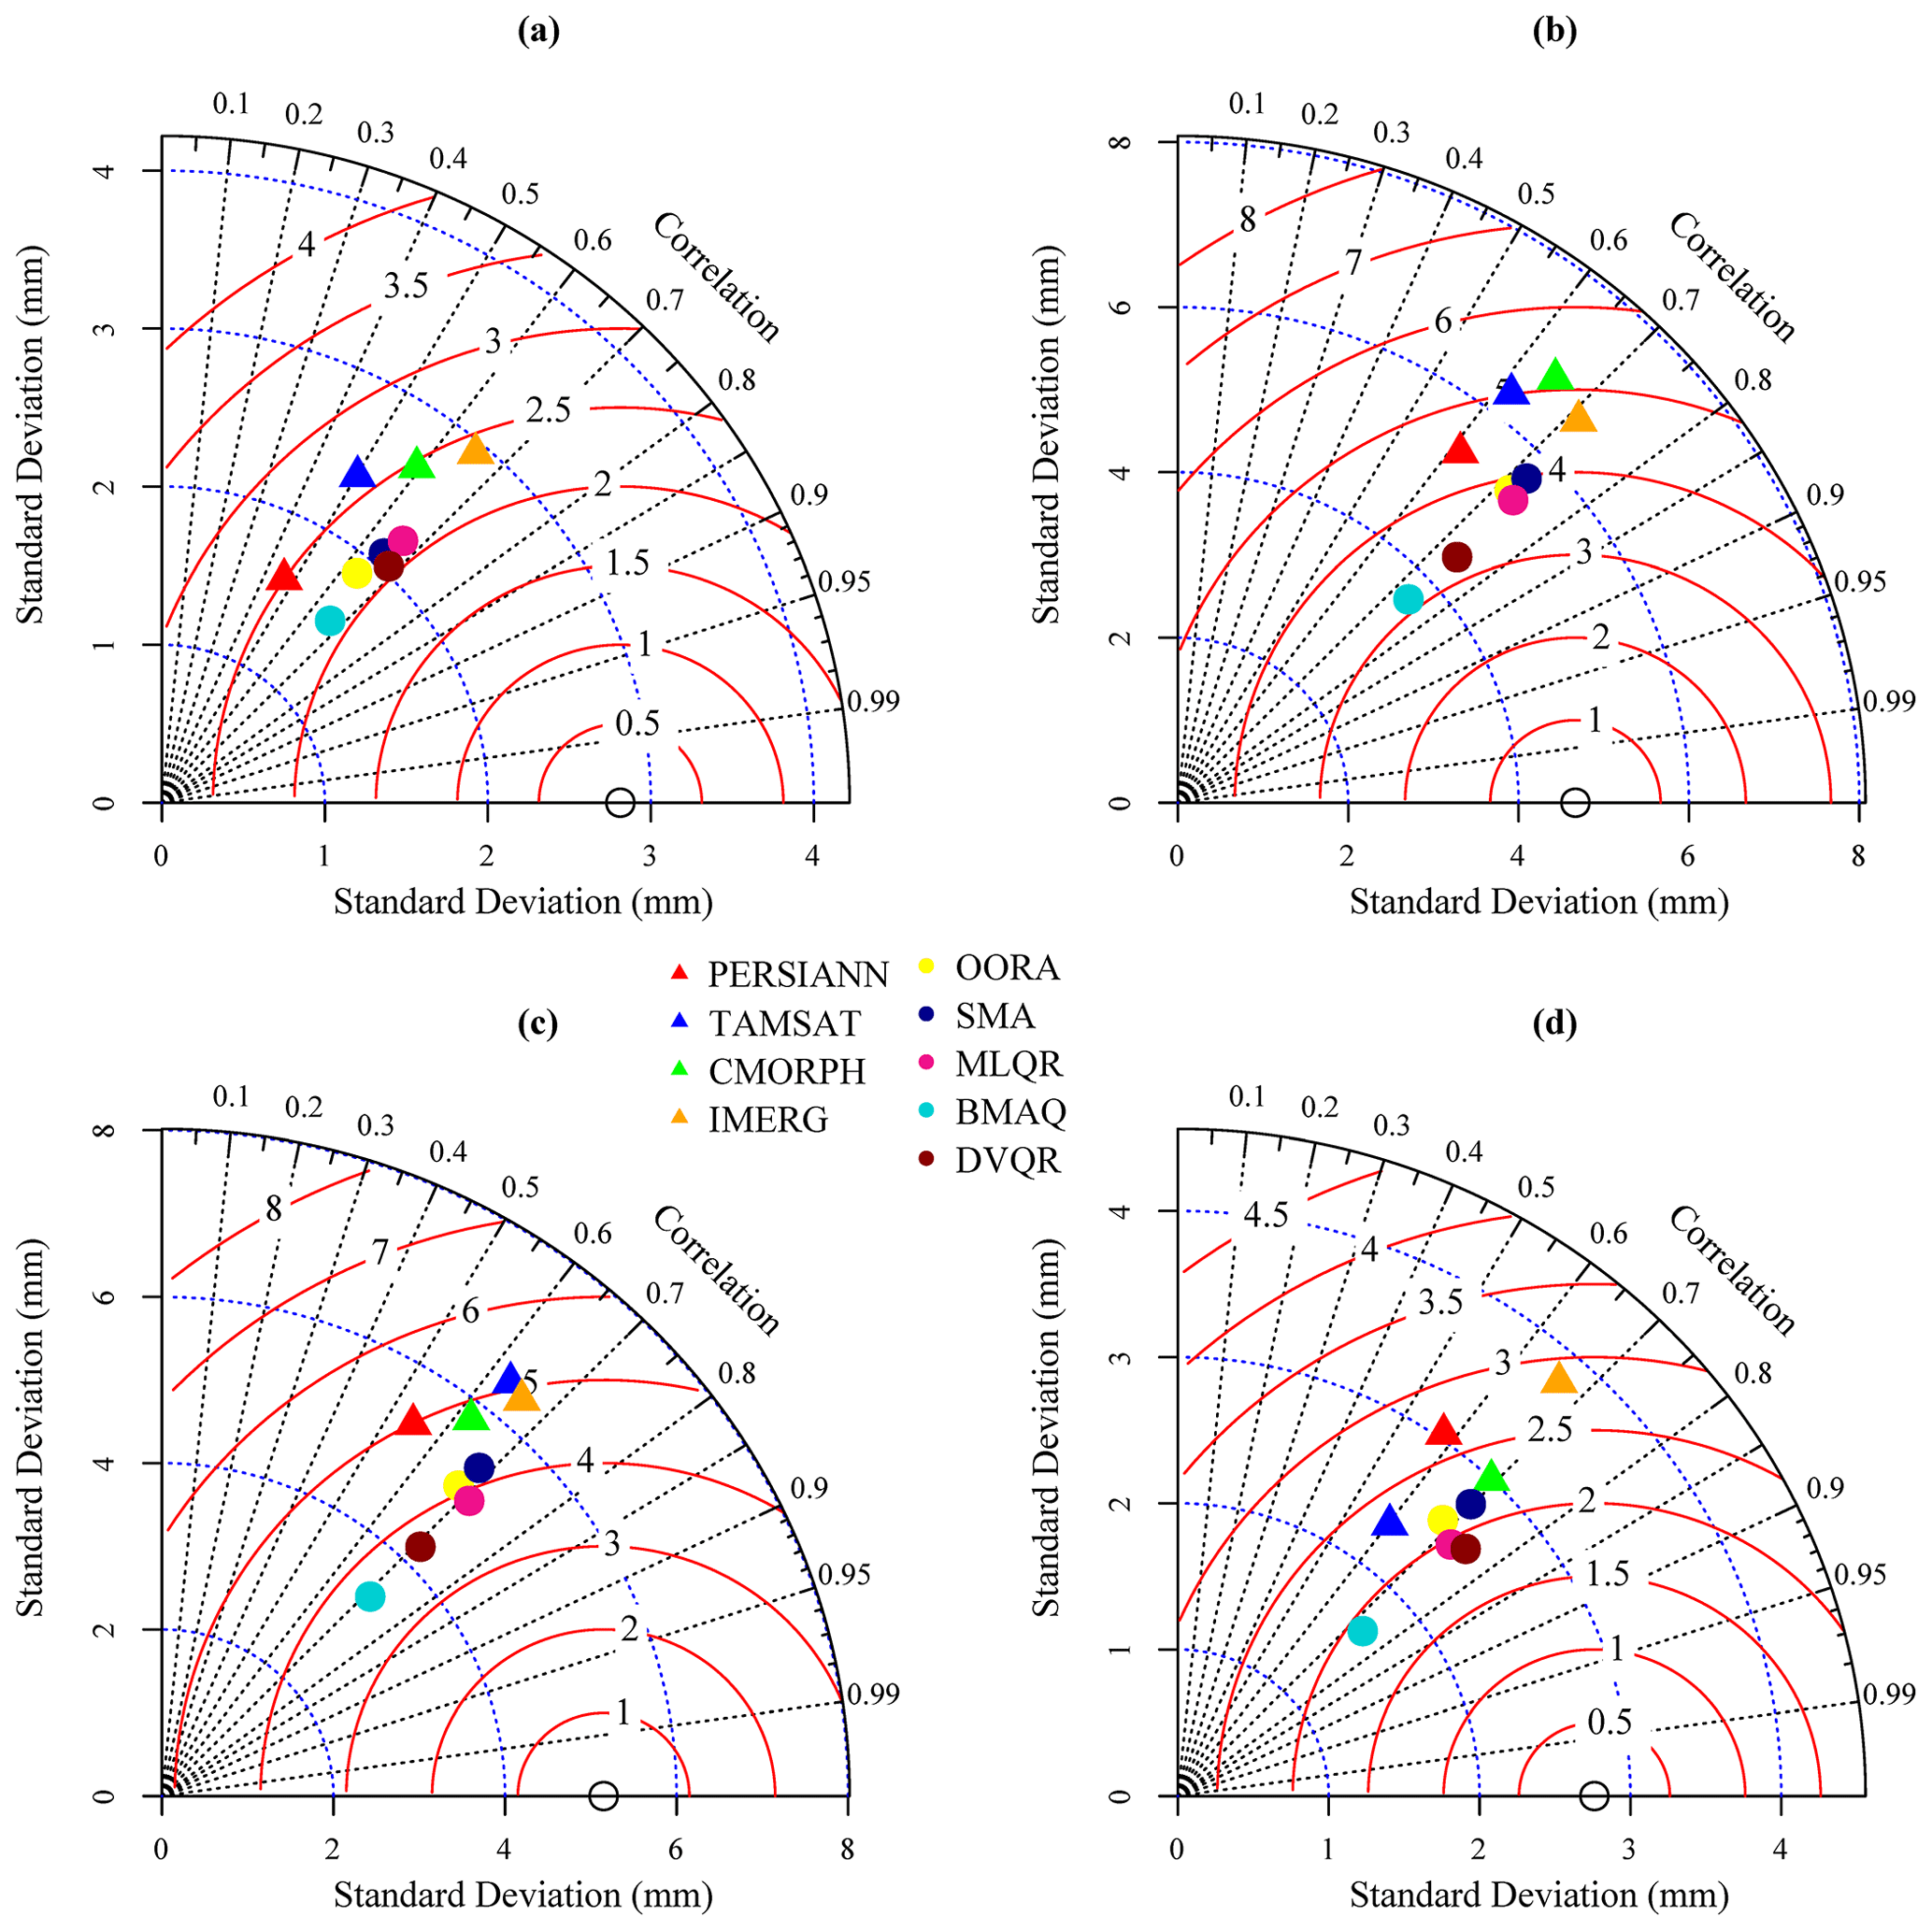
Figure 10Taylor diagram of downscaled SPPs, including PERSIANN (red triangle), TAMSAT (blue triangle), CMORPH (green triangle), and IMERG (orange triangle); traditional methods, including OORA (yellow dot) and SMA (dark blue dot); and quantile regression models, including MLQR (deep pink dot), BMAQ (aqua dot), and DVQR (brown dot), for (a) June, (b) July, (c) August, and (d) September for the whole study period from 2001 to 2017.
In addition, the results shown in Fig. 10 confirm that the quantile regression models have a high potential and are more capable of merging precipitation data during each month of the summer monsoon across rugged topography like the UTAB. Among the quantile regression models, the DVQR model outperforms the BMAQ and MLQR models based on the highest CC values, lower RMSE values, and close SD values compared to RGs. In particular, as we show in Fig. 10a–d, the CC values of the DVQR model are the highest, 0.68, 0.74, 0.71, and 0.75 during June, July, August, and September, respectively, while the CC values of the BMAQ model are 0.67, 0.74, 0.71, and 0.74 during the corresponding months. Overall, The DVQR model shows an equivalent capability and effectiveness to the BMAQ model based on the Taylor diagrams provided, but it was far more capable than the MLQR model and traditional merging methods.
Figure 11 shows the cross-validation of the original SPPs and merged precipitation data against RGs for each month during the summer monsoon from 2001 to 2017 over the UTAB. The DVQR model has the smallest PBIAS (close to 0) across July, August, and September compared with the other merging models and downscaled SPPs products. The BMAQ model shows the smallest PBIAS during June; moreover, we find that it has the highest bias during September, increasing the overestimation of precipitation data. In other words, traditional merging methods and quantile regression models dramatically increase the monthly NSE value of merged precipitation data compared with downscaled SPPs (as shown in Fig. 11b). The NSE values of downscaled SPPs range from −0.30 to 0.32 and are regarded as unsatisfactory. In contrast, the NSE values of traditional merging methods range from 0.27 to 0.39 and, as they are less than 0.5, are also regarded as unsatisfactory (Sen Gupta and Tarboton, 2016). Moreover, in terms of quantile regression models, the NSE values of the MLQR model are 0.41, 0.34, 0.41, and 0.49 for June, July, August, and September, respectively; those for the BMAQ model are 0.43, 0.54, 0.50, and 0.38 for June, July, August, and September, respectively; and those for the DVQR model are 0.42, 0.50, 0.49, and 0.53, for June, July, August, and September, respectively. These results indicate that the BMAQ and DVQR models improved precipitation data quality (NSE) during July, August, and September and resulted in NSE values higher than 0.50, which is considered satisfactory.
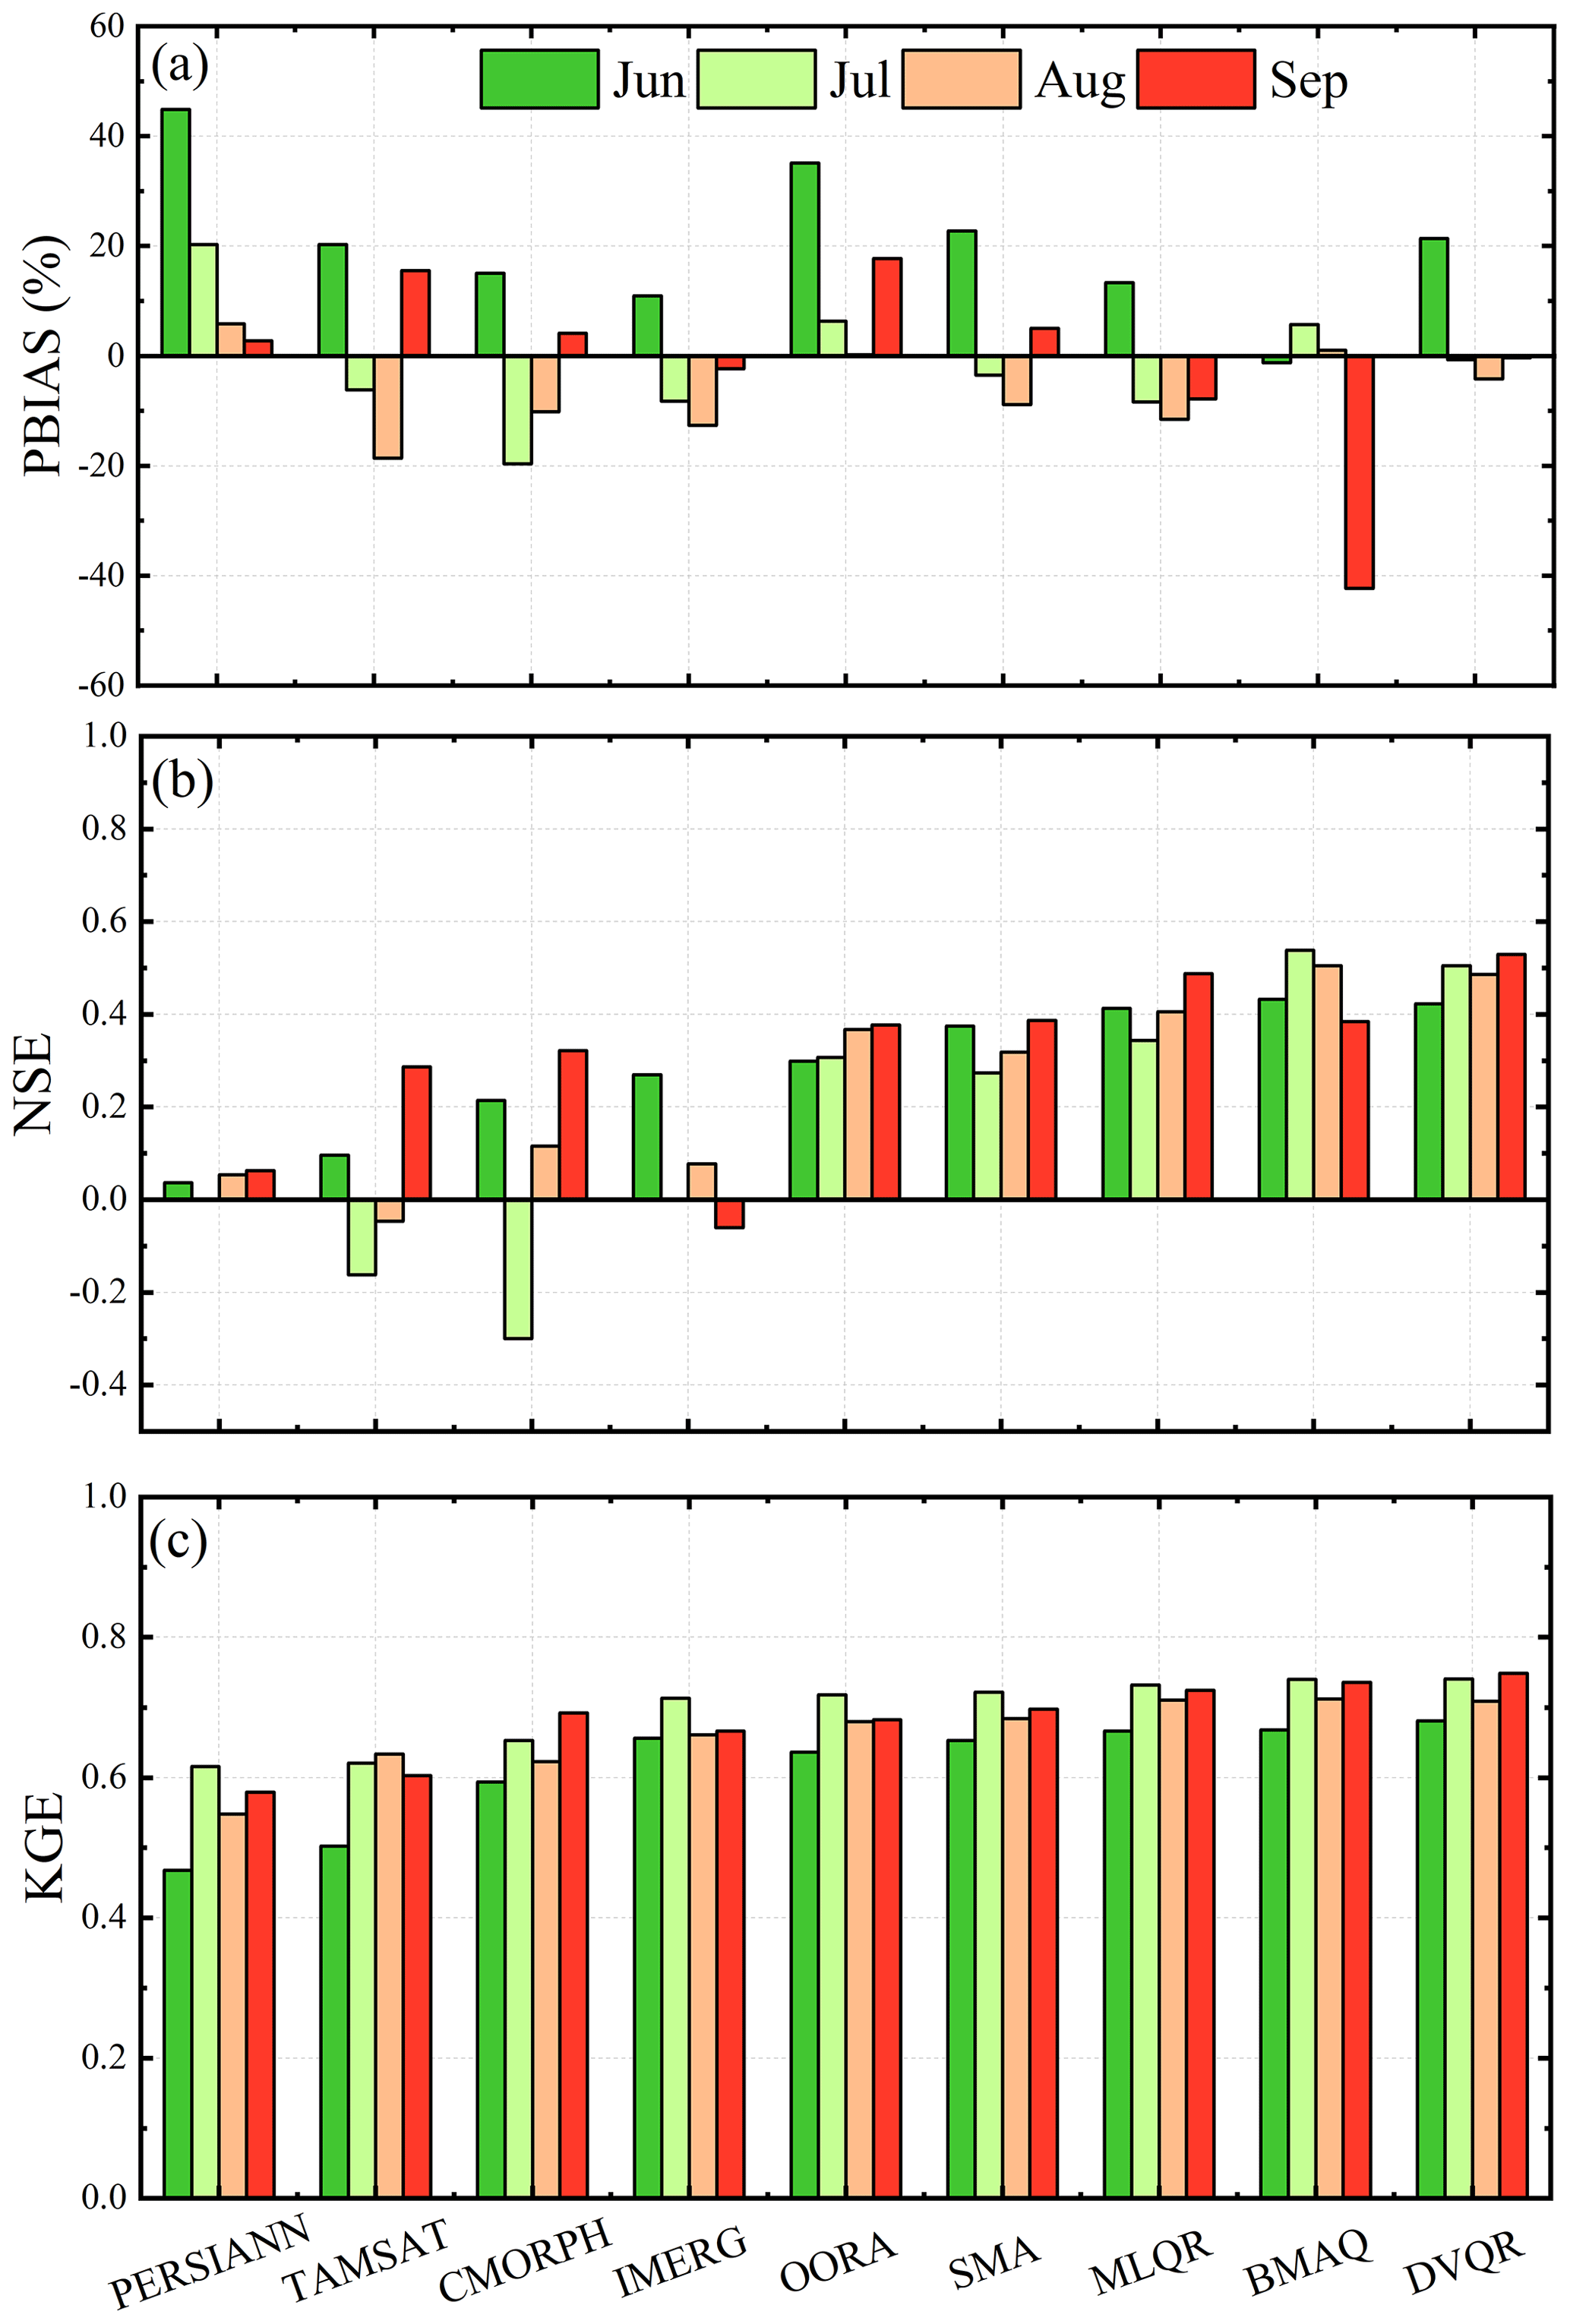
Figure 11Cross-validation statistical metrics of the (a) PBIAS, (b) NSE, and (c) KGE for downscaled daily SPPs (PERSIANN, TAMSAT, CMORPH, and IMERG) and merged precipitation data using traditional merging methods (OORA and SMA) and quantile regression models (MLQR, BMAQ, and DVQR) during June (green column), July (light green column), August (dark orange column), and September (red column) from 2001 to 2017 over the UTAB.
Furthermore, the KGE for traditional merging methods and quantile regression models is improved to values of 0.64–0.72 and 0.68–0.75, respectively, when compared with the downscaled SPPs (approximately 0.47–0.71), as shown in Fig. 11c. This suggests that the two merging approaches greatly improve the quality of the downscaled SPPs. Among the quantile regression models, the DVQR model exhibits a higher KGE value than the BMAQ and MLQR models during all summer monsoon months. Our results indicate that the DVQR model has a higher accuracy than the BMAQ model during the summer monsoon. This reflects the capability and robustness of high-dimensional (10-D) vine copula to capture nonlinear relationships among the input variables. Overall, the performance of statistical metrics, including the PBIAS, NSE, and KGE, during July and September was better than in June and August over the UTAB.
4.5 Precipitation detection assessment
Figure 12 shows the detection of the precipitation amount based on the different intensities of downscaled SPPs, traditional merging methods, and quantile regression models during the summer monsoon over the UTAB. Figure 12a shows that the POD decreases with increasing precipitation intensity for all of the data. The POD denotes binary response estimations, rather than continuous target estimations. The CMORPH product has the highest POD among the original SPPs, whereas the PERSIANN product has the lowest POD across all precipitation intensities. With respect to the traditional merging methods, the SMA method showed a higher POD than the OORA method and the downscaled SPPs across all precipitation intensities. The BMAQ model indicates the highest POD during light precipitation, the DVQR model shows the highest POD during moderate precipitation, and the MLQR model outperforms during heavy and extreme precipitation. The quantile regression models exhibit higher POD values than traditional methods and the original SPPs. The POD values of traditional merging methods (SMA and OORA) and the BMA model were higher than single downscaled SPPs.
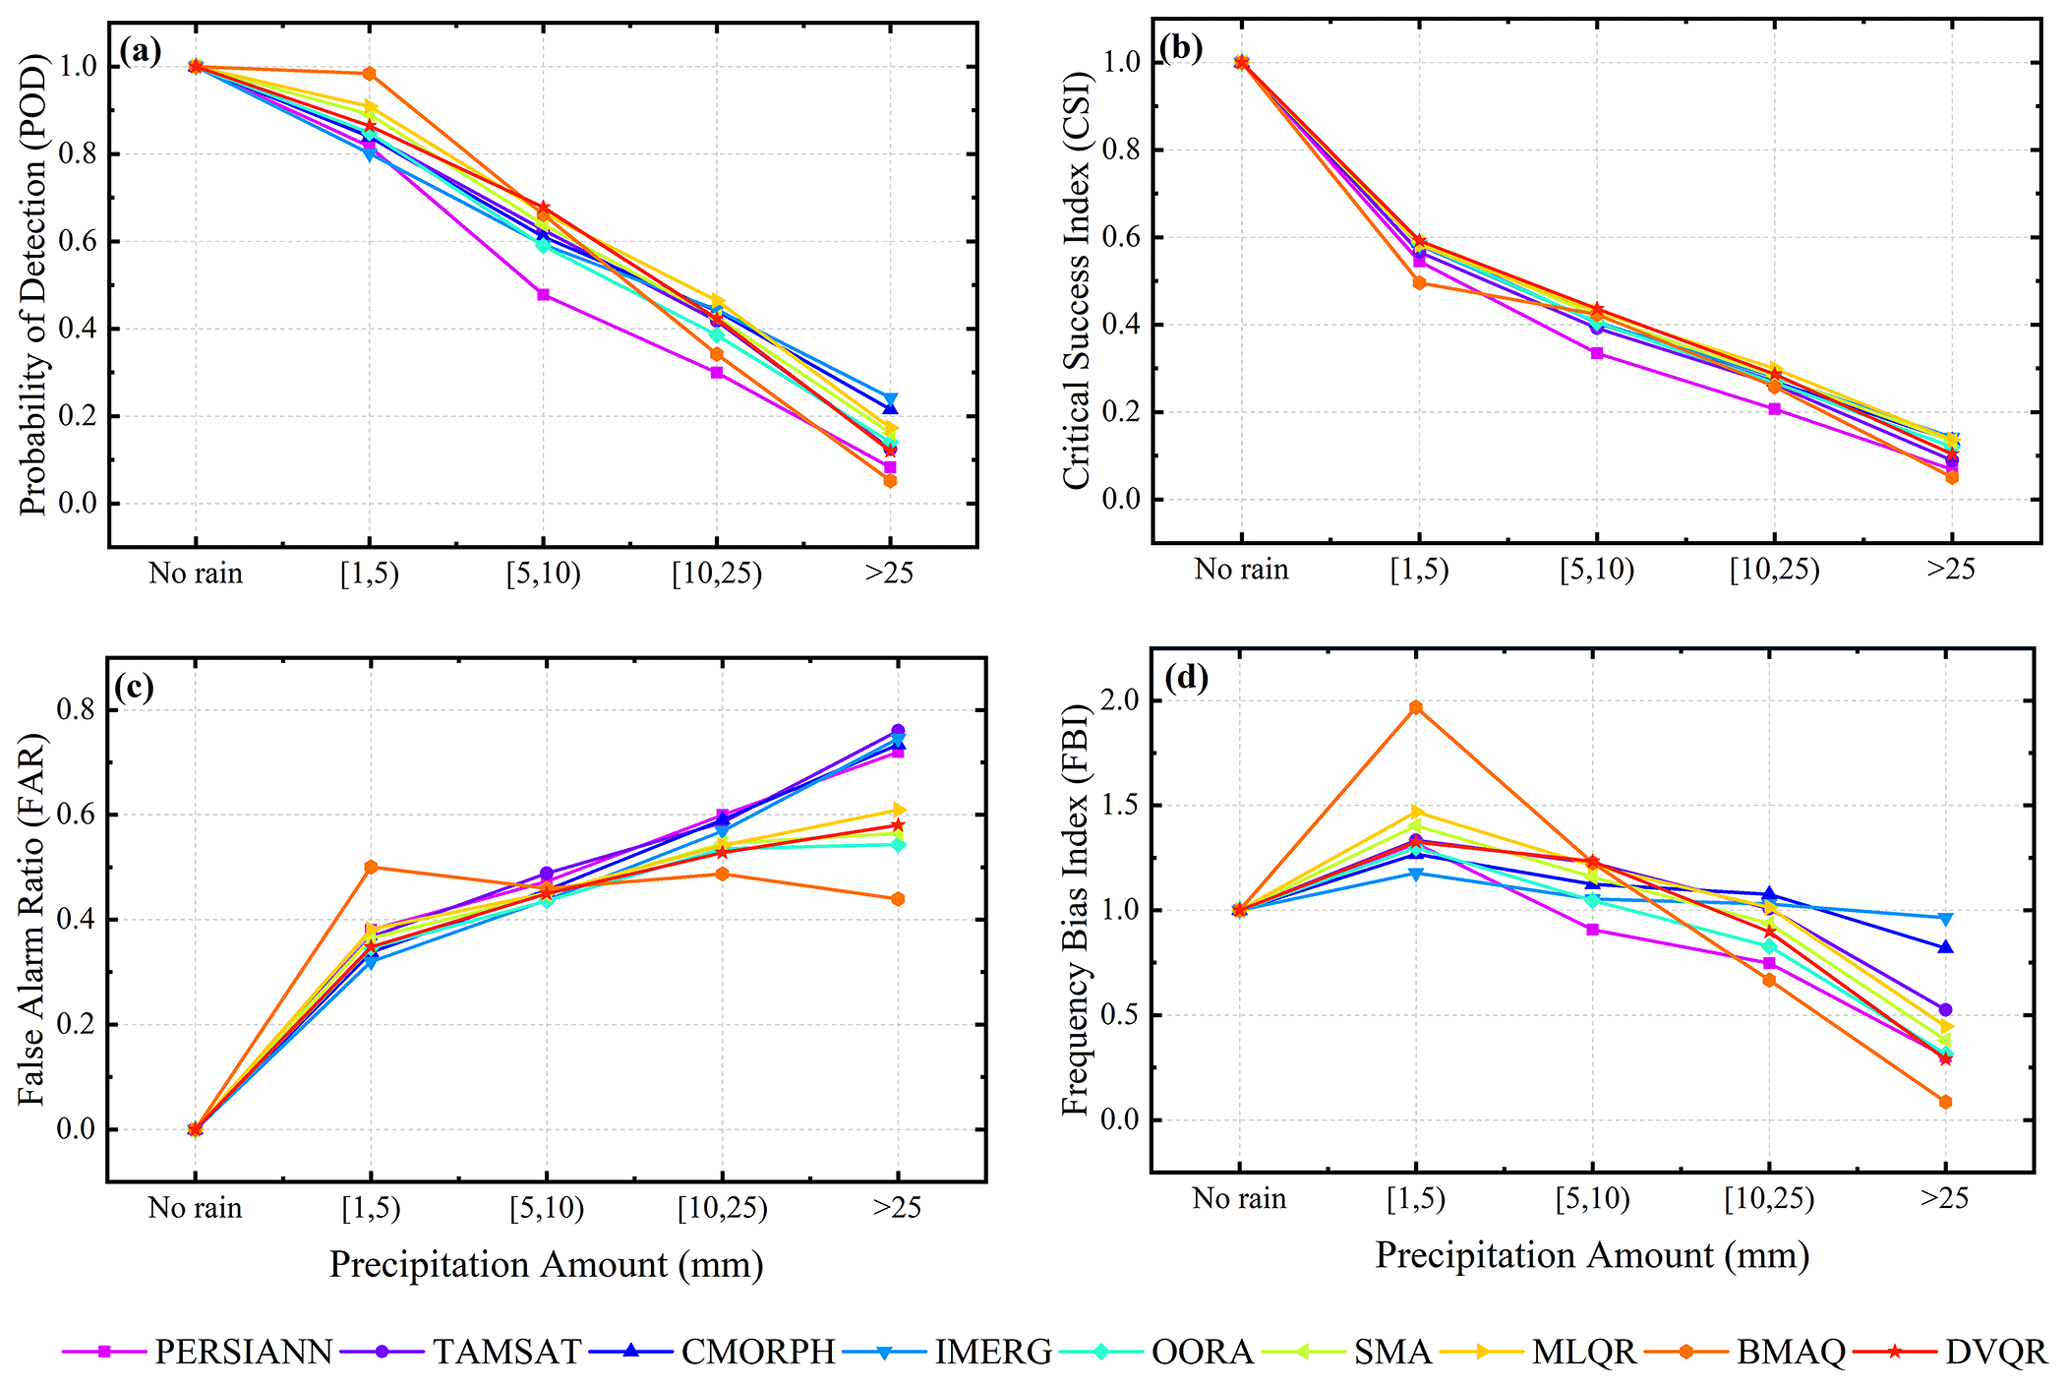
Figure 12Comparison of the detection of the precipitation amount of the downscaled SPPs, including PERSIANN (deep pink line), TAMSAT (magenta line), CMORPH (dark blue line), and IMERG (light blue line); traditional methods, including OORA (aquamarine line) and SMA (light green line); and quantile regression models, including MLQR (yellow line), BMAQ (orange line), and DVQR (red line), with respect to the (a) POD, (b) CSI, (c) FAR, and (d) FBI during summer monsoon from 2001 to 2017 over the UTAB.
Figure 12b shows the CSI of all precipitation intensities for downscaled SPPs, traditional merging methods, and quantile regression. Similarly, the CSI is the same as the POD, which decreases with increasing precipitation intensity for all precipitation data across the UTAB. Among the downscaled SPPs, CMORPH exhibits the highest CSI during light precipitation, while the IMERG product indicates the highest CSI during the other precipitation intensities. In other words, the SMA method shows a higher CSI than the OORA method across all precipitation intensities for the traditional merging methods during the summer monsoon. Furthermore, among the quantile regression models, the DVQR model exhibits a high CSI, while the MLQR model performs better for extreme precipitation (greater than 25 mm). However, the BMAQ model has the lowest CSI across all precipitation intensities.
Figure 12c shows the FAR of all precipitation intensities for the original SPPs, traditional merging methods, and quantile regression. The FAR increases with increasing precipitation intensities. Among the downscaled SPPs, the IMERG product indicates the lowest FAR. At the same time, CMORPH has the lowest expected precipitation (greater than 25 mm). With respect to the traditional merging methods, the OORA method outperforms the SMA method, which exhibits the lowest FAR across all of the precipitation intensities. The DVQR model is characterized by the lowest FAR for light and moderate precipitation, while the BMAQ model shows the lowest CSI for heavy- and extreme-precipitation data.
In terms of showing the underestimation and overestimation of precipitation intensity detection, the FBI was used, as seen in Fig. 12d. The FBI changed from an overestimation to an underestimation with increasing precipitation intensity. The IMERG product showed a better FBI with a very light overestimation to underestimation, followed by the CMORPH and TAMSAT products among the downscaled SPPs. At the same time, PERSIANN exhibited a high underestimation during heavy and extreme precipitation. The OORA method was characterized by the lowest overestimation of precipitation compared with the SMA method during light and moderate precipitation. In contrast, the SMA method indicated the lowest underestimation of precipitation compared with the OORA method during heavy and extreme precipitation. The DVQR model is more capable of detecting light precipitation compared with the other quantile regression models, while the MLQR model showed the lowest FBI compared with other models during all precipitation intensities except light precipitation. The downscaled SPPs, including the IMERG and CMORPH products, outperformed the two traditional merging methods and quantile regression models across all precipitation intensities over the UTAB. Generally, the POD, CSI, FAR, and FBI results across different precipitation intensities showed the benefits of merging the individual SPPs with RGs to reduce uncertainty and improve the detection of precipitation events.
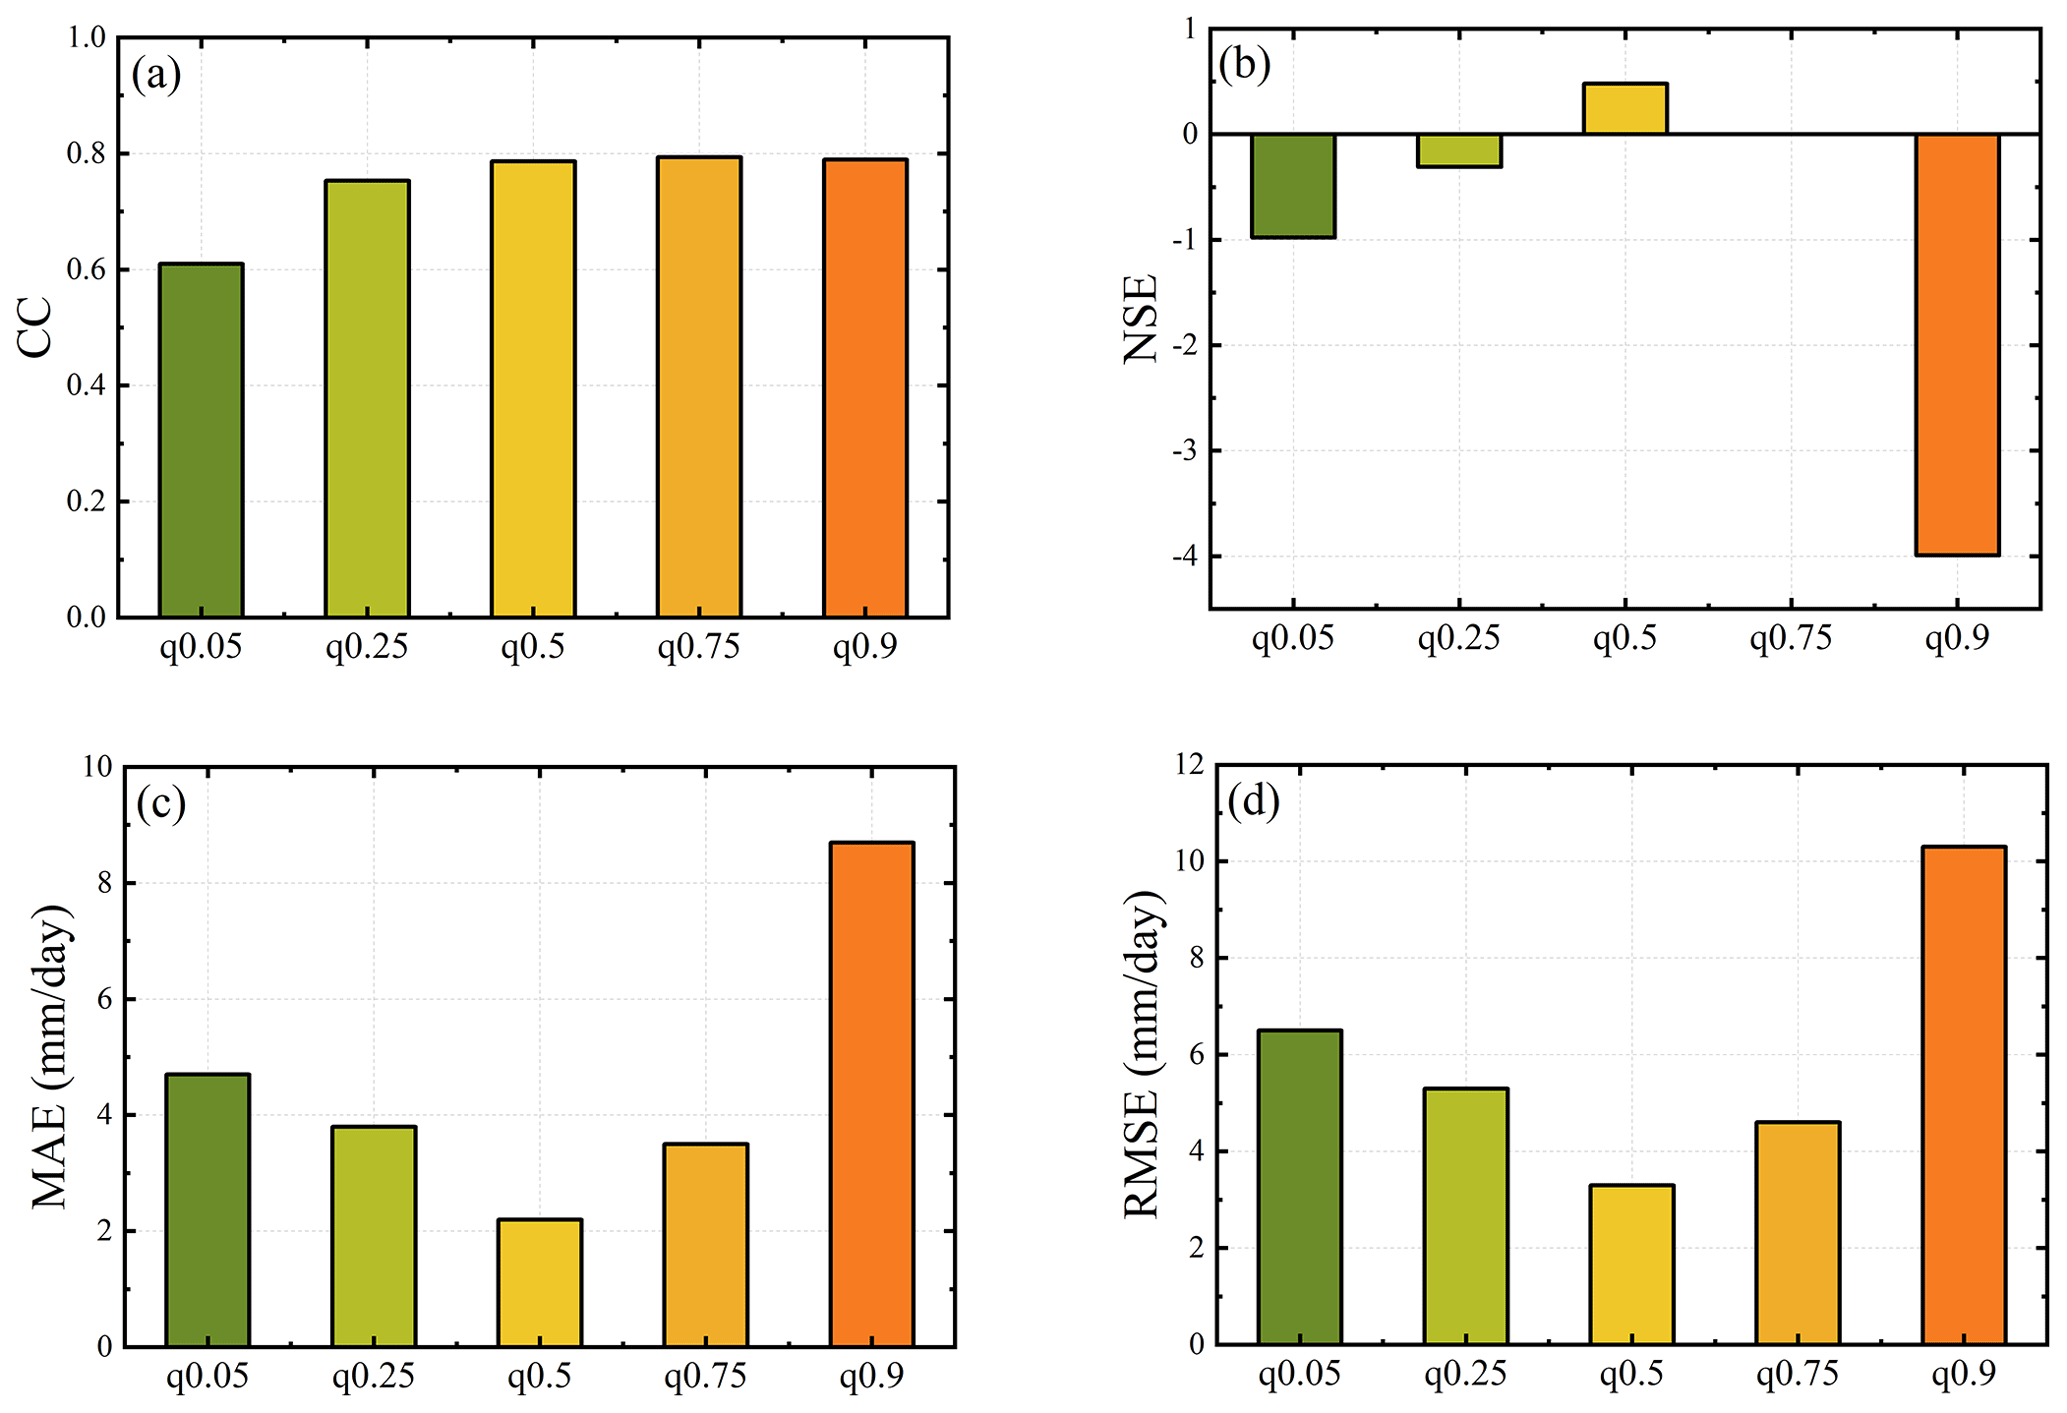
Figure 13Sensitivity analysis of the DVQR model using the CC, NSE, MAE, and RMSE for merged precipitation data estimated at different quantile levels during the summer monsoon over the UTAB.
4.6 Sensitivity analysis of merged SPPs using the DVQR model
A sensitivity analysis was carried to examine the accuracy of merged precipitation data using the DVQR model based on different quantile levels. Figure 13 shows the bar plots of statistical metrics of mean merged precipitation data against the RGs during the summer monsoon over the UTAB. The results reflect that the quality of merged precipitation data varies across the quantile levels. For example, q0.5, q0.75, and q0.9 notably have the highest CC, whereas q0.05 has the lowest CC (as shown in Fig. 13a). The median quantile level (q0.5) is remarkable due to its a positive NSE, which is regarded as a satisfactory, and quantile level q0.75 is characterized as 0. In contrast, other quantile levels are characterized by high negative NSE values (as seen in Fig. 13b); however, q0.05 and q0.90 are marked by the highest error.
In comparison, the median quantile level (q0.5) indicates the lowest error in the MAE and RMSE (as shown in Fig. 13c and d, respectively). Overall, the q0.5 level is remarkable, with the highest accuracy (CC and NSE) and lowest error (MAE and RMSE) than other arbitrary quantiles. The results of estimating merged daily precipitation data across different quantile levels reflects the sensitivity of the DVQR model.
The scale imbalance between gauge-observed precipitation and satellite pixel precipitation estimates is one of the most important reasons for the overestimation or underestimation of precipitation data provided by satellite products (Gebremedhin et al., 2021). SPPs are subject to mistakes, mostly due to significant daily precipitation variation and the scale imbalance between the RGs (points) and the SPPs (pixels) in the UTAB. The uncertainty of SPPs due to mismatching with RGs can appear in hydrological simulations, even with the scarce and uneven distribution of RGs across rugged topography (Rahman et al., 2020b; Gebremicael et al., 2022). BIL interpolation techniques were used to reduce the scale imbalance, and the results reveal that the downscaled precipitation data (1 km) are somewhat better than the original precipitation data. This finding is consistent with some previous studies (Din et al., 2008; Ulloa et al., 2017; Gebremedhin et al., 2021) which demonstrated that RGs were better correlated with downscaled SPP data using the BIL interpolation techniques than with the original satellite products.
The combination of natural constraints, such as latitude, altitude, and slope, with the addition of an orographic effect, determines the geographical distribution of precipitation (Blocken et al., 2006). The UTAB is characterized by rugged topography and a wide range of elevations; more than 50 % of the area is between 2000 and above 3000 m a.s.l. The rugged topography of the UTAB controls the overall pattern of precipitation, suggesting that the distribution of atmospheric moisture may be significantly changed to produce different precipitation regimes in the area (Dinku et al., 2007; Viste and Sorteberg, 2013). Sudden rises or falls in elevation may reduce air mass flow, resulting in a specific microclimate near the foothills, or induce an updraft across the mountains, resulting in orographic rains (Dinku et al., 2007). In mountainous areas, superior-resolution information can more accurately depict the effects of the topography, the movement of moisture, and how precipitation occurs (Chen et al., 2021). PERSIANN, TAMSAT, IMERG, and CMORPH are the most commonly evaluated satellite products across the Nile Basin. Dinku et al. (2008) assessed these abovementioned products over Zimbabwe and Ethiopia, two countries with highly different topographies. Their findings showed that SPPs performed poorly at a daily resolution, especially across Ethiopia's rugged topography. In the case of Dinku et al. (2011), poor efficiency might be related to a coarser spatial resolution, where pixels aggregated for dry and wet regions can be mistakenly recognized as “not-rained” pixels. The TAMSAT products provided much precipitation with great efficiency, lower random errors, and bias values < 10 % at different temporal scales across the Lake Tana basin (Fenta et al., 2018). Some studies have reported that the IMERG, CMORPH, PERSIANN, and TAMSAT products have significant errors over the Nile River basin (Abebe et al., 2020; Belete et al., 2020). Our results show that the spatial pattern of the precipitation distribution for the original and downscaled SPPs indicates an overestimation (TAMSAT, IMERG, and CMORPH) and an underestimation (PERSIANN) of precipitation data compared with RGs across the UTAB. Some studies have suggested that it is not possible for SPPs to effectively estimate precipitation in high-mountain regions due to the complicated link between cloud-top temperature and precipitation in such areas (Dinku et al., 2008; Haile et al., 2013; Diem et al., 2014; Fenta et al., 2018). In contrast, the underestimation of the precipitation amount by the thermal infrared (TIR) algorithm is probably caused by shallow circulation with warmer cloud-top temperatures (Young et al., 2014). Dinku et al. (2008) linked warm-rain phenomena over complicated topography to the underestimation of precipitation by the majority of TIR-based SPPs over significant portions of Ethiopia. The overestimation of SPP inputs to hydrological models significantly overestimated streamflow simulation over the UTAB (Gebremicael et al., 2022). As a result, SPPs are incapable of capturing the large-spatial-scale attributes of the seasonal mean pattern of the precipitation distribution.
Several approaches have been developed based on different statistical techniques to improve the capability of SPPs with respect to capturing the spatial and temporal precipitation variability with a higher accuracy than the original SPPs. For instance, merging precipitation data using traditional methods, such as SMA and OORA, performed better than the original SPPs (Tropical Rainfall Measuring Mission, TRMM; PERSIANN-CDR; and CMORPH) throughout the Tibetan Plateau region (Shen et al., 2014) and India's coastal Vamsadhara River basin (Yumnam et al., 2022). The SMA-based merging approach performs better than all satellite products with respect to hydrological simulation and weather variables (Raftery et al., 2005a; Duan and Phillips, 2010; Wu et al., 2012). The above studies are in line with our results, in which the SMA- and OORA-based merging methods reflect the best performance compared with the downscaled SPPs at different temporal scales across the UTAB. Additionally, Rahman et al. (2020a) constructed new precipitation data from multiple SPPs using the dynamic BMA (DBMA) technique and carried out analyses using different climate regions and seasons across Pakistan. In an area with few RGs and substantial precipitation variability, merging RGs with the weighted-average least squares (WALS) algorithm is a valuable method to improve precipitation data quality in arid and hyperarid regions (Rahman et al., 2020c). The merged precipitation data with the BMA model based on quantile, cluster, and dynamic techniques performed better than traditional merged methods (e.g., SMA, IEVW, OWA, and OORA) across the rugged topography and glacial, humid, arid, and hyperarid regions of China (Ma et al., 2018), in Pakistan (H. L. R. Rahman et al., 2020; Rahman et al., 2020a), and in India (Yumnam et al., 2022). In our study, the DVQR-based merging model produced the highest-quality merged precipitation data and outperformed the QBMA and MLQR models, traditional merging methods (SMA and OORA), and downscaled SPPs. The high accuracy of the DVQR model is related to the model's capability to capture the nonlinear relationship among the variables. In line with our study outcomes, the DVQR model is more capable of capturing complex relationships between meteorological variables to estimate daily reference evapotranspiration across hyperarid regions than the MLQR and QBMA models (Abdallah et al., 2022). Moreover, H. H. Nguyen et al. (2021) reported that the DVQR model outperformed the MLQR and QBMA models to improve the prediction of the soil moisture anomaly using vegetation cover across the contiguous United States. These results suggest that adding additional explanatory variables, such as wind speed and surface soil moisture, to quantile regression models can significantly reduce the uncertainty of downscaled SPPs (Chao et al., 2018; Kumar et al., 2019).
In conclusion, this study advances our awareness of merging multiple satellite-based precipitation products with RGs and explanatory variables over rugged topography using different approaches. However, the approach used in this work has several limitations. First, the quality and quantity of RGs are poor, with many data gaps. Second, the fixed values of DEM, ASP, SLP, and HSHD may affect the data-driven vine copula technique's predictive ability. Third, the D-vine copula structure and ONC family may not wholly replicate the complex dependencies between variables in the real world. The suggested DVQR model for merging SPPs with RGs and explanatory variables could improve the accuracy and spatial pattern of precipitation distribution and reduce the uncertainty of estimated daily precipitation over the UTAB. This research is essential for enhancing precipitation estimation from multiple SPPs, especially in basins with sparse and unevenly distributed RGs and rugged topography, such as the UTAB. Further research is necessary to get beyond those limitations, expand to greater scales and longer timescales, use other explanatory variables (vegetation cover), and use different copula families. Furthermore, the DVQR model could compare to other precipitation merging approaches, such as machine learning techniques (Baez-Villanueva et al., 2020; Shi et al., 2023), based on different temporal scales and climate conditions. It could also evaluate the capability of merged precipitation data in hydrological simulations and extreme-event analysis (Rahman et al., 2020b; Kumar et al., 2021).
SPPs are reasonable alternatives that offer massive advantages over RGs. However, their application is restricted due to insufficient quality compared with RGs at local and regional scales. The purpose of the present study was to merge multiple SPPs with RGs and couple them with explanatory variables using three quantile regression models (DVQR, MLQR, and BMAQ) and two traditional merging methods (SMA and OORA). Furthermore, the study provided insight into the capability and effectiveness of the DVQR model with respect to merging multiple SPPs over the rugged topography of the study basin. Below, we highlight the findings of the present study:
-
Downscaled SPPs cannot capture the large-spatial-scale attributes of the seasonal mean precipitation distribution, but the merging techniques improve the quality of estimated precipitation data.
-
The DVQR model shows larger improvements than the BMAQ and MLQR models in terms of capturing the magnitude and spatial variability in monsoon precipitation over rugged topography (in the UTAB). The largest improvements are observed in the CC, KGE, NSE, MAE, RMSE, and PBIAS, with values of 0.80, 0.785, 0.615, 1.97 (mm d−1), 2.68 (mm d−1), and 0.96 (%), respectively.
-
Cross-validation clearly shows that both the quantile regression models and traditional merging methods improved the estimation of daily precipitation data; however, all quantile regression models exhibit higher accuracy than traditional merging methods.
-
Based on a monthly analysis, the DVQR model outperforms the BMAQ, MLQR, SMA, and OORA models during June, July, August, and September. According to descriptive statistics, the performance of merged precipitation data during July and September was better than in June and August over the UTAB.
-
Regarding the POD and FAR, the DVQR merging approach does not significantly outperform the BMAQ, and MLQR approaches, but it has the best CSI and FBI values across all precipitation intensities.
-
The quantile level in the DVQR model is a sensitive parameter with respect to predicting merged precipitation data; the median quantile levels (q0.5) indicate lower uncertainty than other quantile levels.
The DEM was obtained from the Shuttle Radar Topography Mission: https://doi.org/10.5069/G9445JDF (NASA Shuttle Radar Topography Mission, 2013). Wind speed (WS) data were obtained from ERA5 (European Centre for Medium-Range Weather Forecasts – ECMWF): https://doi.org/10.24381/cds.adbb2d47 (Hersbach et al., 2023). Surface soil moisture (SSM) data were obtained from the Global Land Evaporation Amsterdam Model (GLEAM 3.6a): https://www.gleam.eu/ (GLEAM, 2024). CMORPH CRD data are available at https://www.ncei.noaa.gov/data/cmorph-high-resolution-global-precipitation-estimates/ (NOAA, 2024). IMERG V06 was downloaded from https://disc.gsfc.nasa.gov/ (NASA, 2024). PERSIANN-CDR is available from https://chrsdata.eng.uci.edu/ (CHRS, 2024). TAMSAT v3.1 (Maidment et al., 2014, 2017) was downloaded from http://www.tamsat.org.uk/data (University of Reading, 2024). Based on the Ethiopian National Meteorological Agency use policy, the rain gauge data cannot be shared publicly; however, they can be obtained from the following website: http://www.ethiomet.gov.et/ (The National Meteorological Agency, 2016). The merged data created using the applied methods are available from http://www.hydroshare.org/resource/d0d9140845144d73ac578d865411a10a (Abdallah, 2024). Three quantile regression models were conducted in R programming language using the vinereg package (https://tnagler.github.io/vinereg/, Nagler, 2024), the quantreg package (https://cran.r-project.org/web/packages/quantreg/, Koenker et al., 2018) and the BMA package (https://cran.r-project.org/web/packages/BMA, Raftery et al., 2005b).
MA: conceptualization, data curation, formal analysis, investigation, methodology, resources, software, visualization, and writing – original draft; KZ: conceptualization, investigation, methodology, funding acquisition, supervision, and writing – review and editing; LC, AO and KH: validation and writing – review and editing. KWR: data curation and validation. LL, TLT and OMN: validation and visualization.
The contact author has declared that none of the authors has any competing interests.
Publisher's note: Copernicus Publications remains neutral with regard to jurisdictional claims made in the text, published maps, institutional affiliations, or any other geographical representation in this paper. While Copernicus Publications makes every effort to include appropriate place names, the final responsibility lies with the authors.
The authors wish to thank the Ethiopian National Meteorological Agency (NMA) for providing the precipitation data.
This study was supported by the National Key Research and Development Program of China (grant no. 2023YFC3006500); the National Natural Science Foundation of China (grant no. 51879067); the Fundamental Research Funds for the Central Universities of China (grant no. B230202009); and the National Research Foundation of Korea (NRF), funded by the South Korean government (MSIT; grant nos. NRF-2022H1D3A2A02064319 and 2021H1D3A2A03097768).
This paper was edited by Xing Yuan and reviewed by two anonymous referees.
Aas, K., Czado, C., Frigessi, A., and Bakken, H.: Pair-copula constructions of multiple dependence, Insurance, 44, 182–198, https://doi.org/10.1016/j.insmatheco.2007.02.001, 2009.
Abbaszadeh, P., Gavahi, K., Alipour, A., Deb, P., and Moradkhani, H., Bayesian multi-modeling of deep neural nets for probabilistic crop yield prediction, Agr. Forest Meteorol., 314, 108773, https://doi.org/10.1016/j.agrformet.2021.108773, 2022.
Abdalla, E. M. H., Pons, V., Stovin, V., De-Ville, S., Fassman-Beck, E., Alfredsen, K., and Muthanna, T. M.: Evaluating different machine learning methods to simulate runoff from extensive green roofs, Hydrol. Earth Syst. Sci., 25, 5917–5935, https://doi.org/10.5194/hess-25-5917-2021, 2021.
Abdallah, M.: A D-vine copula-based quantile regression towards merging satellite precipitation products over a rugged topography: A case study at the upper Tekeze Atbara Basin of the Nile Basin, HydroShare [data set], http://www.hydroshare.org/resource/d0d9140845144d73ac578d865411a10a (last access: 25 February 2024), 2024.
Abdallah, M., Mohammadi, B., Zaroug, M. A. H., Omer, A., Cheraghalizadeh, M., Eldow, M. E. E., and Duan, Z.: Reference evapotranspiration estimation in hyper-arid regions via D-vine copula based-quantile regression and comparison with empirical approaches and machine learning models, J. Hydrol.: Reg. Stud., 44, 101259, https://doi.org/10.1016/j.ejrh.2022.101259, 2022.
Abebe, S. A., Qin, T. L., Yan, D. H., Gelaw, E. B., Workneh, H. T., Kun, W., Liu, S. S., and Dong, B. O.: Spatial and Temporal Evaluation of the Latest High-Resolution Precipitation Products over the Upper Blue Nile River Basin, Ethiopia, Water, 12, 20, https://doi.org/10.3390/w12113072, 2020.
Alfieri, L., Pappenberger, F., Wetterhall, F., Haiden, T., Richardson, D., and Salamon, P.: Evaluation of ensemble streamflow predictions in Europe, J. Hydrol., 517, 913–922, https://doi.org/10.1016/j.jhydrol.2014.06.035, 2014.
Amjad, M., Yilmaz, M. T., Yucel, I., and Yilmaz, K. K.: Performance evaluation of satellite- and model-based precipitation products over varying climate and complex topography, J. Hydrol., 584, 124707, https://doi.org/10.1016/j.jhydrol.2020.124707, 2020.
Baez-Villanueva, O. M., Zambrano-Bigiarini, M., Beck, H. E., McNamara, I., Ribbe, L., Nauditt, A., Birkel, C., Verbist, K., Giraldo-Osorio, J. D., and Thinh, N. X.: RF-MEP: A novel Random Forest method for merging gridded precipitation products and ground-based measurements, Remote Sens. Environ., 239, 111606, https://doi.org/10.1016/j.rse.2019.111606, 2020.
Barrett, E. C. and Martin, D. W.: Use of satellite data in rainfall monitoring, Academic Press, ISBN 0120796805, https://cir.nii.ac.jp/crid/1130000793777022720 (last access: 25 February 2024), 1981.
Belete, M., Deng, J. S., Wang, K., Zhou, M. M., Zhu, E. Y., Shifaw, E., and Bayissa, Y.: Evaluation of satellite rainfall products for modeling water yield over the source region of Blue Nile Basin, Sci. Total Environ., 708, 134834, https://doi.org/10.1016/j.scitotenv.2019.134834, 2020.
Bhuiyan, M. A. E., Nikolopoulos, E. I., Anagnostou, E. N., Quintana-Seguí, P., and Barella-Ortiz, A.: A nonparametric statistical technique for combining global precipitation datasets: Development and hydrological evaluation over the Iberian Peninsula, Hydrol. Earth Syst. Sci., 22, 1371–1389, https://doi.org/10.5194/hess-22-1371-2018, 2018.
Bhuiyan, M. A. E., Nikolopoulos, E. I., and Anagnostou, E. N.: Machine learning–based blending of satellite and reanalysis precipitation datasets: A multiregional tropical complex terrain evaluation, J. Hydrometeorol., 20, 2147–2161, https://doi.org/10.1175/JHM-D-19-0073.1, 2019.
Blocken, B., Poesen, J., and Carmeliet, J.: Impact of wind on the spatial distribution of rain over micro-scale topography: numerical modelling and experimental verification, Hydrol. Process., 20, 345–368, https://doi.org/10.1002/hyp.5865, 2006.
Bouyé, E. and Salmon, M.: Dynamic copula quantile regressions and tail area dynamic dependence in Forex markets, Eur. J. Finance, 15, 721–750, https://doi.org/10.1080/13518470902853491, 2009.
Chao, L. J., Zhang, K., Li, Z. J., Zhu, Y. L., Wang, J. F., and Yu, Z. B.: Geographically weighted regression based methods for merging satellite and gauge precipitation, J. Hydrol., 558, 275–289, https://doi.org/10.1016/j.jhydrol.2018.01.042, 2018.
Chao, L. J., Zhang, K., Wang, J. F., Feng, J., and Zhang, M. J.: A Comprehensive Evaluation of Five Evapotranspiration Datasets Based on Ground and GRACE Satellite Observations: Implications for Improvement of Evapotranspiration Retrieval Algorithm, Remote Sens., 13, 2414, https://doi.org/10.3390/rs13122414, 2021.
Chen, L. and Guo, S.: Copulas and its application in hydrology and water resources, Springer, ISBN 978-981-13-0573-3, https://doi.org/10.1007/978-981-13-0574-0, 2019.
Chen, Y., Sharma, S., Zhou, X., Yang, K., Li, X., Niu, X., Hu, X., and Khadka, N.: Spatial performance of multiple reanalysis precipitation datasets on the southern slope of central Himalaya, Atmos. Res., 250, 105365, https://doi.org/10.1016/j.atmosres.2020.105365, 2021.
Chen, Y. Y., Huang, J. F., Sheng, S. X., Mansaray, L. R., Liu, Z. X., Wu, H. Y., and Wang, X. Z.: A new downscaling-integration framework for high-resolution monthly precipitation estimates: Combining rain gauge observations, satellite-derived precipitation data and geographical ancillary data, Remote Sens. Environ., 214, 154–172, https://doi.org/10.1016/j.rse.2018.05.021, 2018.
CHRS: PERSIANN, https://chrsdata.eng.uci.edu/ (last access: 25 February 2024), 2024.
Diem, J. E., Hartter, J., Ryan, S. J., and Palace, M. W.: Validation of satellite rainfall products for western Uganda, Journal of Hydrometeorology, 15, 2030–2038, https://doi.org/10.1175/JHM-D-13-0193.1, 2014.
Din, S. U., Al-Dousari, A., Ramdan, A., and Al Ghadban, A.: Site-specific precipitation estimate from TRMM data using bilinear weighted interpolation technique: An example from Kuwait, J. Arid Environ., 72, 1320–1328, https://doi.org/10.1016/j.jaridenv.2007.12.013, 2008.
Dinku, T., Ceccato, P., Grover-Kopec, E., Lemma, M., Connor, S. J., and Ropelewski, C. F.: Validation of satellite rainfall products over East Africa's complex topography, Int. J. Remote Sens., 28, 1503–1526, https://doi.org/10.1080/01431160600954688, 2007.
Dinku, T., Chidzambwa, S., Ceccato, P., Connor, S. J., and Ropelewski, C. F.: Validation of high-resolution satellite rainfall products over complex terrain, Int. J. Remote Sens., 29, 4097–4110, https://doi.org/10.1080/01431160701772526, 2008.
Dinku, T., Ceccato, P., and Connor, S. J.: Challenges of satellite rainfall estimation over mountainous and arid parts of east Africa, Int. J. Remote Sens., 32, 5965–5979, https://doi.org/10.1080/01431161.2010.499381, 2011.
Duan, Q. and Phillips, T. J.: Bayesian estimation of local signal and noise in multimodel simulations of climate change, J. Geophys. Res.-Atmos., 115, D18123, https://doi.org/10.1029/2009JD013654, 2010.
Duan, Q. Y., Ajami, N. K., Gao, X. G., and Sorooshian, S.: Multi-model ensemble hydrologic prediction using Bayesian model averaging, Adv. Water Resour., 30, 1371–1386, https://doi.org/10.1016/j.advwatres.2006.11.014, 2007.
Fenta, A. A., Yasuda, H., Shimizu, K., Ibaraki, Y., Haregeweyn, N., Kawai, T., Belay, A. S., Sultan, D., and Ebabu, K.: Evaluation of satellite rainfall estimates over the Lake Tana basin at the source region of the Blue Nile River, Atmos. Res., 212, 43–53, https://doi.org/10.1016/j.atmosres.2018.05.009, 2018.
Gebremedhin, M. A., Lubczynski, M. W., Maathuis, B. P., and Teka, D.: Novel approach to integrate daily satellite rainfall with in-situ rainfall, Upper Tekeze Basin, Ethiopia, Atmos. Res., 248, 105135, https://doi.org/10.1016/j.atmosres.2020.105135, 2021.
Gebremicael, T. G., Mohamed, Y. A., van der Zaag, P., Gebremedhin, A., Gebremeskel, G., Yazew, E., and Kifle, M.: Evaluation of multiple satellite rainfall products over the rugged topography of the Tekeze-Atbara basin in Ethiopia, Int. J. Remote Sens., 40, 4326–4345, https://doi.org/10.1080/01431161.2018.1562585, 2019.
Gebremicael, T. G., Deitch, M. J., Gancel, H. N., Croteau, A. C., Haile, G. G., Beyene, A. N., and Kumar, L.: Satellite-based rainfall estimates evaluation using a parsimonious hydrological model in the complex climate and topography of the Nile River Catchments, Atmos. Res., 266, 105939, https://doi.org/10.1016/j.atmosres.2021.105939, 2022.
Genest, C. and MacKay, R.J.,: Fonctions de repartition an dimensions et leurs marges, Can. J. Stat., 8, 229–231, https://doi.org/10.2307/3314660, 1959.
GLEAM: Method Global Land Evaporation Amsterdam Model, https://www.gleam.eu/ (last access: 25 February 2024), 2024.
Haile, A. T., Rientjes, T., Gieske, A., and Gebremichael, M.: Rainfall Variability over Mountainous and Adjacent Lake Areas: The Case of Lake Tana Basin at the Source of the Blue Nile River, J. Appl. Meteorol. Clim., 48, 1696–1717, https://doi.org/10.1175/2009jamc2092.1, 2009.
Haile, A. T., Habib, E., and Rientjes, T.: Evaluation of the climate prediction center (CPC) morphing technique (CMORPH) rainfall product on hourly time scales over the source of the Blue Nile River, Hydrol. Process., 27, 1829–1839, https://doi.org/10.1002/hyp.9330, 2013.
Hersbach, H., Bell, B., Berrisford, P., Biavati, G., Horányi, A., Muñoz Sabater, J., Nicolas, J., Peubey, C., Radu, R., Rozum, I., Schepers, D., Simmons, A., Soci, C., Dee, D., and Thépaut, J.-N.: ERA5 hourly data on single levels from 1940 to present, Copernicus Climate Change Service (C3S) Climate Data Store (CDS) [data set], https://doi.org/10.24381/cds.adbb2d47, 2023.
Hou, A. Y., Kakar, R. K., Neeck, S., Azarbarzin, A. A., Kummerow, C. D., Kojima, M., Oki, R., Nakamura, K., and Iguchi, T.: The Global Precipitation Measurement Mission, B. Am. Meteorol. Soc., 95, 701–722, https://doi.org/10.1175/bams-d-13-00164.1, 2014.
Hsu, K. L., Gao, X. G., Sorooshian, S., and Gupta, H. V.: Precipitation estimation from remotely sensed information using artificial neural networks, J. Appl. Meteorol., 36, 1176–1190, https://doi.org/10.1175/1520-0450(1997)036<1176:Pefrsi>2.0.Co;2, 1997.
Huffman, G. J., Bolvin, D. T., Braithwaite, D., Hsu, K., Joyce, R., Xie, P. and Yoo, S. H.: NASA global precipitation measurement (GPM) integrated multi-satellite retrievals for GPM (IMERG), p. 30, https://gpm.nasa.gov/sites/default/files/2020-05/IMERG_ATBD_V06.3.pdf (last access: 24 February 2024), 2015.
Jennifer, A., David, M., Adrian, E. R., and Chris, V.: Bayesian model averaging: a tutorial, Stat. Sci., 14, 382–417, 1999.
Joyce, R. J., Janowiak, J. E., Arkin, P. A., and Xie, P. P.: CMORPH: A method that produces global precipitation estimates from passive microwave and infrared data at high spatial and temporal resolution, J. Hydrometeorol., 5, 487–503, https://doi.org/10.1175/1525-7541(2004)005<0487:Camtpg>2.0.Co;2, 2004.
Kidd, C. and Huffman, G.: Global precipitation measurement, Meteorol. Appl., 18, 334–353, https://doi.org/10.1002/met.284, 2011.
Kidd, C., Becker, A., Huffman, G. J., Muller, C. L., Joe, P., Skofronick-Jackson, G., and Kirschbaum, D. B.: So, how much of the Earth's surface is covered by rain gauges?, B. Am. Meteorol. Soc., 98, 69–78, https://doi.org/10.1175/BAMS-D-14-00283.1, 2017.
Kimani, M. W., Hoedjes, J. C. B., and Su, Z. B.: An Assessment of Satellite-Derived Rainfall Products Relative to Ground Observations over East Africa, Remote Sens., 9, 21, https://doi.org/10.3390/rs9050430, 2017.
Koenker, R. and Bassett, G.: Regression Quantiles, Econometrica, 46, 33–50, https://doi.org/10.2307/1913643, 1978.
Koenker, R. and Ng, P.: Inequality Constrained Quantile Regression. Sankhyā, 67, 418–440, 2005.
Koenker, R., Portnoy, S., Ng, P. T., Zeileis, A., Grosjean, P., and Ripley, B. D.: Package `quantreg', CRAN [code], https://cran.r-project.org/web/packages/quantreg/ (last access: 25 February 2024), 2018.
Kolluru, V., Kolluru, S., Wagle, N., and Acharya, T. D.: Secondary Precipitation Estimate Merging Using Machine Learning: Development and Evaluation over Krishna River Basin, India, Remote Sens., 12, 23, https://doi.org/10.3390/rs12183013, 2020.
Kraus, D. and Czado, C.: D-vine copula based quantile regression, Comput. Stat. Data Anal., 110, 1–18, https://doi.org/10.1016/j.csda.2016.12.009, 2017.
Kumar, A., Ramsankaran, R., Brocca, L., and Munoz-Arriola, F.: A Machine Learning Approach for Improving Near-Real-Time Satellite-Based Rainfall Estimates by Integrating Soil Moisture, Remote Sens., 11, 20, https://doi.org/10.3390/rs11192221, 2019.
Kumar, A., Ramsankaran, R., Brocca, L., and Muñoz-Arriola, F.: A simple machine learning approach to model real-time streamflow using satellite inputs: Demonstration in a data scarce catchment, J. Hydrol., 595, 126046, https://doi.org/10.1016/j.jhydrol.2021.126046, 2021.
Kurowicka, D. and Cooke, R. M.: Distribution-free continuous Bayesian belief, in: Modern statistical and mathematical methods in reliability, 10, World Scientific, p. 309. https://doi.org/10.1142/9789812703378_0022, 2005.
Li, Z., Yang, D. W., Gao, B., Jiao, Y., Hong, Y., and Xu, T.: Multiscale Hydrologic Applications of the Latest Satellite Precipitation Products in the Yangtze River Basin using a Distributed Hydrologic Model, J. Hydrometeorol., 16, 407–426, https://doi.org/10.1175/jhm-d-14-0105.1, 2015.
Lu, X., Tang, G., Wang, X., Liu, Y., Jia, L., Xie, G., Li, S., and Zhang, Y.: Correcting GPM IMERG precipitation data over the Tianshan Mountains in China, J. Hydrol., 575, 1239–1252, https://doi.org/10.1016/j.jhydrol.2019.06.019, 2019.
Ma, Y. Z., Zhang, Y. S., Yang, D. Q., and Bin Farhan, S.: Precipitation bias variability versus various gauges under different climatic conditions over the Third Pole Environment (TPE) region, Int. J. Climatol., 35, 1201–1211, https://doi.org/10.1002/joc.4045, 2015.
Ma, Y. Z., Yang, Y., Han, Z. Y., Tang, G. Q., Maguire, L., Chu, Z. G., and Hong, Y.: Comprehensive evaluation of Ensemble Multi-Satellite Precipitation Dataset using the Dynamic Bayesian Model Averaging scheme over the Tibetan plateau, J. Hydrol., 556, 634–644, https://doi.org/10.1016/j.jhydrol.2017.11.050, 2018.
Maidment, R. I., Grimes, D., Allan, R. P., Tarnavsky, E., Stringer, M., Hewison, T., Roebeling, R., and Black, E.: The 30 year TAMSAT African Rainfall Climatology And Time series (TARCAT) data set, J. Geophys. Res.-Atmos., 119, 10619–10644, https://doi.org/10.1002/2014jd021927, 2014.
Maidment, R. I., Grimes, D., Black, E., Tarnavsky, E., Young, M., Greatrex, H., Allan, R. P., Stein, T., Nkonde, E., Senkunda, S., and Alcantara, E. M. U.: Data Descriptor: A new, long-term daily satellite-based rainfall dataset for operational monitoring in Africa, Sci. Data, 4, 17, https://doi.org/10.1038/sdata.2017.63, 2017.
Manz, B., Buytaert, W., Zulkafli, Z., Lavado, W., Willems, B., Robles, L. A., and Rodríguez-Sánchez, J. P.: High-resolution satellite-gauge merged precipitation climatologies of the Tropical Andes, J. Geophys. Res.-Atmos., 121, 1190–1207, https://doi.org/10.1002/2015JD023788, 2016.
Mastrantonas, N., Bhattacharya, B., Shibuo, Y., Rasmy, M., Espinoza-Davalos, G., and Solomatine, D.: Evaluating the Benefits of Merging Near-Real-Time Satellite Precipitation Products: A Case Study in the Kinu Basin Region, Japan, J. Hydrometeorol., 20, 1213–1233, https://doi.org/10.1175/jhm-d-18-0190.1, 2019.
Moazami, S., Golian, S., Kavianpour, M. R., and Hong, Y.: Uncertainty analysis of bias from satellite rainfall estimates using copula method, Atmos. Res., 137, 145–166, https://doi.org/10.1016/j.atmosres.2013.08.016, 2014.
Mohammadi, B. and Aghashariatmadari, Z.: Estimation of solar radiation using neighboring stations through hybrid support vector regression boosted by Krill Herd algorithm, Arab. J. Geosci., 13, 16, https://doi.org/10.1007/s12517-020-05355-1, 2020.
Muhammad, W., Yang, H. B., Lei, H. M., Muhammad, A., and Yang, D. W.: Improving the Regional Applicability of Satellite Precipitation Products by Ensemble Algorithm, Remote Sens., 10, 19, https://doi.org/10.3390/rs10040577, 2018.
Nagler, T.: vinereg: D-Vine Quantile Regression, R package version 0.10.0, https://tnagler.github.io/vinereg/, GitHub [code], (last access: 25 February 2024), 2024.
NASA: GES DISC, https://disc.gsfc.nasa.gov/ (last access: 25 February 2024), 2024.
NASA Shuttle Radar Topography Mission – SRTM: Shuttle Radar Topography Mission (SRTM) Global, OpenTopography [data set], https://doi.org/10.5069/G9445JDF, 2013.
Nash, J. E. and Sutcliffe, J. V.: River flow forecasting through conceptual models part I – A discussion of principles, J. Hydrol., 10, 282–290, https://doi.org/10.1016/0022-1694(70)90255-6, 1970.
Nelsen, R. B.: An Introduction to Copulas, in: Springer Series in Statistics, Springer, ISBN 13:978-0387-28659-4, https://doi.org/10.1007/0-387-28678-0, 2005.
Nguyen, G. V., Le, X. H., Van, L. N., Jung, S., Yeon, M., and Lee, G.: Application of Random Forest Algorithm for Merging Multiple Satellite Precipitation Products across South Korea, Remote Sens., 13, 17, https://doi.org/10.3390/rs13204033, 2021.
Nguyen, H. H., Cho, S., Jeong, J., and Choi, M.: A D-vine copula quantile regression approach for soil moisture retrieval from dual polarimetric SAR Sentinel-1 over vegetated terrains, Remote Sens. Environ., 255, 112283, https://doi.org/10.1016/j.rse.2021.112283, 2021.
Niemierko, R., Toppel, J., and Trankler, T.: A D-vine copula quantile regression approach for the prediction of residential heating energy consumption based on historical data, Appl. Energy, 233, 691–708, https://doi.org/10.1016/j.apenergy.2018.10.025, 2019.
NOAA: Index of /data/cmorph-high-resolution-global-precipitation-estimates, NOAA [data set], https://www.ncei.noaa.gov/data/cmorph-high-resolution-global-precipitation-estimates/ (last access: 25 February 2024), 2024.
Parzen, E.: On estimation of a probability density function and mode, Ann. Math. Stat., 33, 1065–1076, 1962.
Pham, M. T., Vernieuwe, H., Baets, B. D., Willems, P., and Verhoest, N. E. C.: Stochastic simulation of precipitation-consistent daily reference evapotranspiration using vine copulas, Stoch. Environ. Res. Risk A., 30, 2197–2214, https://doi.org/10.1007/s00477-015-1181-7, 2016.
Pradhan, B., Jebur, M. N., Shafri, H. Z. M., and Tehrany, M. S.: Data fusion technique using wavelet transform and Taguchi methods for automatic landslide detection from airborne laser scanning data and quickbird satellite imagery, IEEE T. Geosci. Remote, 54, 1610–1622, https://doi.org/10.1109/TGRS.2015.2484325, 2015.
Qi, W., Zhang, C., Fu, G. T., Sweetapple, C., and Liu, Y. L.: Impact of robustness of hydrological model parameters on flood prediction uncertainty, J. Flood Risk Manage., 12, e12488, https://doi.org/10.1111/jfr3.12488, 2019.
Raftery, A. E., Gneiting, T., Balabdaoui, F., and Polakowski, M.: Using Bayesian model averaging to calibrate forecast ensembles, Mon. Weather Rev., 133, 1155—1174, https://doi.org/10.1175/mwr2906.1, 2005a.
Raftery, A. E., Painter, I. S., and Volinsky, C. T.: BMA: an R package for Bayesian model averaging, The Newsletter of the R Project Volume, CRAN [code], https://cran.r-project.org/web/packages/BMA (last access: 25 February 2024), 2005b.
Rahman, H. L. R., Shang, S. H., Shahid, M., Wen, Y. Q., and Khan, Z.: Application of a Dynamic Clustered Bayesian Model Averaging (DCBA) Algorithm for Merging Multisatellite Precipitation Products over Pakistan, J. Hydrometeorol., 21, 17–37, https://doi.org/10.1175/jhm-d-19-0087.1, 2020.
Rahman, K. U., Shang, S. H., Shahid, M., and Li, J.: Developing an Ensemble Precipitation Algorithm from Satellite Products and Its Topographical and Seasonal Evaluations Over Pakistan, Remote Sens., 10, 23, https://doi.org/10.3390/rs10111835, 2018.
Rahman, K. U., Shang, S. H., Shahid, M., and Wen, Y. Q.: An Appraisal of Dynamic Bayesian Model Averaging-based Merged Multi-Satellite Precipitation Datasets Over Complex Topography and the Diverse Climate of Pakistan, Remote Sens., 12, 30, hhttps://doi.org/10.3390/rs12010010, 2020a.
Rahman, K. U., Shang, S. H., Shahid, M., and Wen, Y. Q.: Hydrological evaluation of merged satellite precipitation datasets for streamflow simulation using SWAT: A case study of Potohar Plateau, Pakistan, J. Hydrol., 587, 125040, https://doi.org/10.1016/j.jhydrol.2020.125040, 2020b.
Rahman, K. U., Shang, S. H., Shahid, M., Wen, Y. Q., and Khan, A. J.: Development of a novel Weighted Average Least Squares-based ensemble multi-satellite precipitation dataset and its comprehensive evaluation over Pakistan, Atmos. Res., 246, 18, https://doi.org/10.1016/j.atmosres.2020.105133, 2020c.
Rahman, K. U., Shang, S. H., and Zohaib, M.: Assessment of Merged Satellite Precipitation Datasets in Monitoring Meteorological Drought over Pakistan, Remote Sens., 13, 37, https://doi.org/10.3390/rs13091662, 2021.
Reda, K. W., Liu, X. C., Tang, Q. H., and Gebremicael, T. G.: Evaluation of Global Gridded Precipitation and Temperature Datasets against Gauged Observations over the Upper Tekeze River Basin, Ethiopia, J. Meteorol. Res., 35, 673–689, https://doi.org/10.1007/s13351-021-0199-7, 2021.
Reda, K. W., Liu, X. C., Haile, G. G., Sun, S. A., and Tang, Q. H.: Hydrological evaluation of satellite and reanalysis-based rainfall estimates over the Upper Tekeze Basin, Ethiopia, Hydrol. Res., 53, 584–604, https://doi.org/10.2166/nh.2022.131, 2022.
Sen Gupta, A. and Tarboton, D. G.: A tool for downscaling weather data from large-grid reanalysis products to finer spatial scales for distributed hydrological applications, Environ. Model. Softw., 84, 50–69, https://doi.org/10.1016/j.envsoft.2016.06.014, 2016.
Sharifi, E., Saghafian, B., and Steinacker, R.: Copula-based stochastic uncertainty analysis of satellite precipitation products, J. Hydrol., 570, 739–754, https://doi.org/10.1016/j.jhydrol.2019.01.035, 2019.
Shen, Y., Xiong, A. Y., Hong, Y., Yu, J. J., Pan, Y., Chen, Z. Q., and Saharia, M.: Uncertainty analysis of five satellite-based precipitation products and evaluation of three optimally merged multi-algorithm products over the Tibetan Plateau, Int. J. Remote Sens., 35, 6843–6858, https://doi.org/10.1080/01431161.2014.960612, 2014.
Shi, Y., Chen, C., Chen, J., Mohammadi, B., Cheraghalizadeh, M., Abdallah, M., Mert Katipoğlu, O., Li, H., and Duan, Z.: Evaluation of the RF-MEP Method for Merging Multiple Gridded Precipitation Products in the Chongqing City, China, Remote Sens., 15, 4230, https://doi.org/10.3390/rs15174230, 2023.
Sun, R. C., Yuan, H. L., Liu, X. L., and Jiang, X. M.: Evaluation of the latest satellite-gauge precipitation products and their hydrologic applications over the Huaihe River basin, J. Hydrol., 536, 302–319, https://doi.org/10.1016/j.jhydrol.2016.02.054, 2016.
Sun, R. C., Yuan, H. L., and Yang, Y. Z.: Using multiple satellite-gauge merged precipitation products ensemble for hydrologic uncertainty analysis over the Huaihe River basin, J. Hydrol., 566, 406–420, https://doi.org/10.1016/j.jhydrol.2018.09.024, 2018.
Tan, J., Huffman, G. J., Bolvin, D. T., and Nelkin, E. J.: IMERG V06: Changes to the Morphing Algorithm, J. Atmos. Ocean. Tech., 36, 2471–2482, https://doi.org/10.1175/jtech-d-19-0114.1, 2019.
The National Meteorological Agency: Meteorological Station Information, http://www.ethiomet.gov.et/ (last access: 24 February 2024), 2016.
Ulloa, J., Ballari, D., Campozano, L., and Samaniego, E.: Two-Step Downscaling of Trmm 3b43 V7 Precipitation in Contrasting Climatic Regions With Sparse Monitoring: The Case of Ecuador in Tropical South America, Remote Sens., 9, 23, https://doi.org/10.3390/rs9070758, 2017.
University of Reading: TAMSAT, http://www.tamsat.org.uk/data (last access: 25 February 2024), 2024.
Viste, E. and Sorteberg, A.: Moisture transport into the Ethiopian highlands, Int. J. Climatol., 33, 249–263, https://doi.org/10.1002/joc.3409, 2013.
Wang, S., Zhang, K., Chao, L. J., Li, D. H., Tian, X., Bao, H. J., Chen, G. D., and Xia, Y.: Exploring the utility of radar and satellite-sensed precipitation and their dynamic bias correction for integrated prediction of flood and landslide hazards, J. Hydrol., 603, 126964, https://doi.org/10.1016/j.jhydrol.2021.126964, 2021.
WMO: Guide to hydrological practices: data aquisition and processing, analysis, forecasting and other applications, http://www.innovativehydrology.com/WMO-No.168-1994.pdf (last access: 24 February 2024), 1994.
Worqlul, A. W., Yen, H., Collick, A. S., Tilahun, S. A., Langan, S., and Steenhuis, T. S.: Evaluation of CFSR, TMPA 3B42 and ground-based rainfall data as input for hydrological models, in data-scarce regions: The upper Blue Nile Basin, Ethiopia, Catena, 152, 242–251, https://doi.org/10.1016/j.catena.2017.01.019, 2017.
Wu, H., Zhang, X., Liang, S., Yang, H., and Zhou, G.: Estimation of clear-sky land surface longwave radiation from MODIS data products by merging multiple models, J. Geophys. Res.-Atmos., 117, D22107, https://doi.org/10.1029/2012JD017567, 2012.
Wu, H., Yang, Q., Liu, J., and Wang, G.: A spatiotemporal deep fusion model for merging satellite and gauge precipitation in China, J. Hydrol., 584, 124664, https://doi.org/10.1016/j.jhydrol.2020.124664, 2020.
Wu, T., Bai, J., and Han, H.: Short-Term Agricultural Drought Prediction based on D-vine copula quantile regression in snow-free unfrozen surface area, China, Geocarto Int., 37, 9320–9338, https://doi.org/10.1080/10106049.2021.2017015, 2022.
Xiao, S., Xia, J., and Zou, L.: Evaluation of multi-satellite precipitation products and their ability in capturing the characteristics of extreme climate events over the Yangtze River Basin, China, Water, 12, 1179, https://doi.org/10.3390/w12041179, 2020.
Yong, B., Ren, L. L., Hong, Y., Wang, J. H., Gourley, J. J., Jiang, S. H., Chen, X., and Wang, W.: Hydrologic evaluation of Multisatellite Precipitation Analysis standard precipitation products in basins beyond its inclined latitude band: A case study in Laohahe basin, China, Water Resour. Res., 46, W07542, https://doi.org/10.1029/2009wr008965, 2010.
Young, M. P., Williams, C. J. R., Chiu, J. C., Maidment, R. I., and Chen, S.-H.: Investigation of discrepancies in satellite rainfall estimates over Ethiopia, J. Hydrometeorol., 15, 2347–2369, https://doi.org/10.1175/JHM-D-13-0111.1, 2014.
Yumnam, K., Guntu, R. K., Rathinasamy, M., and Agarwal, A.: Quantile-based Bayesian Model Averaging approach towards merging of precipitation products, J. Hydrol., 604, 127206, https://doi.org/10.1016/j.jhydrol.2021.127206, 2022.
Zhang, K., Xue, X. W., Hong, Y., Gourley, J. J., Lu, N., Wan, Z. M., Hong, Z., and Wooten, R.: iCRESTRIGRS: a coupled modeling system for cascading flood-landslide disaster forecasting, Hydrol. Earth Syst. Sci., 20, 5035–5048, https://doi.org/10.5194/hess-20-5035-2016, 2016.
Zubieta, R., Getirana, A., Espinoza, J. C., Lavado-Casimiro, W., and Aragon, L.: Hydrological modeling of the Peruvian–Ecuadorian Amazon Basin using GPM-IMERG satellite-based precipitation dataset, Hydrol. Earth Syst. Sci., 21, 3543–3555, https://doi.org/10.5194/hess-21-3543-2017, 2017.