the Creative Commons Attribution 4.0 License.
the Creative Commons Attribution 4.0 License.
 | 06 Mar 2023
Controls on flood managed aquifer recharge through a heterogeneous vadose zone: hydrologic modeling at a site characterized with surface geophysics
Gordon Osterman
Kate Maher
In water-stressed regions of the world, managed aquifer recharge (MAR), the process of intentionally recharging depleted aquifers, is an essential tool for combating groundwater depletion. Many groundwater-dependent regions, including the Central Valley in California, USA, are underlain by thick unsaturated zones (ca. 10 to 40 m thick), nested within complex valley-fill deposits that can hinder or facilitate recharge. Within the saturated zone, interconnected deposits of coarse-grained material (sands and gravel) can act as preferential recharge pathways, while fine-textured facies (silts and clays) accommodate the majority of the long-term increase in aquifer storage. However, this relationship is more complex within the vadose zone. Coarse facies can act as capillary barriers that restrict flow, and contrasts in matric potential can draw water from coarse-grained flow paths into fine-grained, low-permeability zones.
To determine the impact of unsaturated-zone stratigraphic heterogeneity on MAR effectiveness, we simulate recharge at a Central Valley almond orchard surveyed with a towed transient electromagnetic system. First, we identified three outcomes of interest for MAR sites: infiltration rate at the surface, residence time of water in the root zone and saturated-zone recharge efficiency, which is defined as the increase in saturated-zone storage induced by MAR. Next, we developed a geostatistical approach for parameterizing a 3D variably saturated groundwater flow model using geophysical data. We use the resulting workflow to evaluate the three outcomes of interest and perform Monte Carlo simulations to quantify their uncertainty as a function of model input parameters and spatial uncertainty. Model results show that coarse-grained facies accommodate rapid infiltration rates and that contiguous blocks of fine-grained sediments within the root zone are >20 % likely to remain saturated longer than almond trees can tolerate. Simulations also reveal that capillary-driven flow draws recharge water into unsaturated, fine-grained sediments, limiting saturated-zone recharge efficiency. Two years after inundation, fine-grained facies within the vadose zone retain an average of 37 % of recharge water across all simulations, where it is inaccessible to either plants or pumping wells. Global sensitivity analyses demonstrate that each outcome of interest is most sensitive to parameters that describe the fine facies, implying that future work to reduce MAR uncertainty should focus on characterizing fine-grained sediments.
- Article
(5162 KB) - Full-text XML
-
Supplement
(3233 KB) - BibTeX
- EndNote


Groundwater overdraft has accelerated throughout the 21st century, threatening water supply for nearly 49 % of the world’s population and 38 % of irrigated agricultural land (Bierkens and Wada, 2019; United Nations, 2022). Managed aquifer recharge (MAR), the process of intentionally recharging depleted aquifers, is an important tool for combating unsustainable groundwater extraction, with the potential to offset up to 100 % of overdraft in some groundwater basins (Alam et al., 2020). Of the many types of MAR, flood managed aquifer recharge (flood-MAR) – in which agricultural land and working landscapes (e.g., refuges and restored floodplains) are inundated with excess water (e.g., storm water, snowmelt and reservoir release) – holds great potential for expanding MAR implementation (He et al., 2021; Scanlon et al., 2016; CA DWR, 2018b, 2019).
However, identifying and evaluating suitable flood-MAR sites presents numerous challenges. The topography; water conveyance infrastructure; surface water availability; groundwater quality; land use history; local water policy; and, for agricultural land, crop types must all be considered when evaluating MAR potential. Previous studies have combined several of these factors into multi-criteria decision analyses to identify MAR sites at the regional scale (e.g., Rahman et al., 2012; Russo et al., 2015; O'Geen et al., 2015; Marwaha et al., 2021). Within California's Central Valley, O'Geen et al. (2015) developed the Soil Agricultural Groundwater Banking Index, which uses a soil map, digital elevation model and map of crop types to rank potential flood-MAR sites on agricultural land.
While these analyses provide a first-order constraint on site suitability, they only contain information on shallow soil layers and cannot account for deeper geologic heterogeneity, which can impact the timing and extent of the increase in aquifer storage induced by MAR (O'Leary et al., 2012; Maliva et al., 2015; Maples et al., 2019). Within the saturated zone, coarse-textured sediments can transmit recharge water orders of magnitude faster than fine-grained material, leading to a rapid increase in pressure in wells adjacent to MAR sites following inundation (O'Leary et al., 2012). Though fine-grained sediments are slow to transport water, they can account for the majority of the long-term increase in saturated-zone storage (Maples et al., 2019).
However, the impact of sediment texture on recharge becomes even more complex within the vadose zone. As in the saturated zone, interconnected coarse-grained sediments can act as preferential recharge pathways during MAR, as revealed through time-lapse geophysical imaging of flood-MAR (Sendrós et al., 2020b). By contrast, MAR modeling reveals that, in some cases, these sediments actually inhibit flow as capillary barriers (Sallwey et al., 2018; Russo et al., 2022). In addition, even when coarse facies accommodate preferential flow, contrasts in matric potential can draw water from high-permeability, coarse-grained flow paths into low-permeability zones, trapping up to 20 % of water applied at the surface (Bahar et al., 2021; Qi and Zhan, 2022). Neglecting these processes – and the lateral spreading they induce – can result in underestimating vadose-zone travel times by a factor of 2–3 (Fichtner et al., 2019).
Given the importance of quantifying geologic heterogeneity at recharge sites, near-surface geophysical methods have become a popular tool for MAR site evaluation, as they can provide cost-effective, high-resolution imaging of the subsurface. Common techniques include electrical resistivity tomography, transient electromagnetic, frequency domain electromagnetic, seismic reflection and nuclear magnetic resonance methods (Haines et al., 2009; Maliva et al., 2009; Gottschalk et al., 2017; Goebel and Knight, 2021; Sendrós et al., 2020a; Walsh et al., 2014; Parker et al., 2022). The use and availability of near-surface geophysical data are expected to continue growing in the future. For example, airborne electromagnetic surveys have been used for groundwater exploration in Denmark (Møller et al., 2009; Siemon et al., 2009), Botswana (Sattel and Kgotlhang, 2004; Podgorski et al., 2013) and Australia (Harrington et al., 2014). Within the United States, the California Department of Water Resources recently completed airborne electromagnetic surveys of all critically overdrafted groundwater basins in the state.
Despite their growing popularity, however, geophysical methods have historically only been used to qualitatively interpret subsurface lithology. In one of the first quantitative assessments of recharge sites with geophysical data, Pepin et al. (2022) evaluated recharge pathways using a ray-tracing approach at sites previously surveyed using a towed transient electromagnetic (tTEM) system. At each site, the authors developed 3D realizations of sediment type and measured the shortest path between the surface and the water table along coarse-grained facies. This technique is computationally efficient, but it focuses on a single outcome of interest (recharge) and assumes water percolates exclusively through coarse sediments, which may not reflect reality.
When combined with geophysical data, hydrologic modeling could be used for more robust, quantitative assessment of recharge sites. Modeling aquifer response to recharge is not uncommon (Niswonger et al., 2017; Russo et al., 2015; Ringleb et al., 2016; Alam et al., 2020), though few studies incorporate geologic heterogeneity into the model (e.g., Ganot et al., 2018; Maples et al., 2019; Rudnik et al., 2022). Using well logs and stochastic methods to approximate subsurface heterogeneity, Maples et al. (2019) simulated recharge at potential MAR sites in the northern Central Valley and showed that interconnected coarse-grained facies act as conduits for preferential flow. Through a three-parameter global sensitivity analysis, the authors also showed that recharge is more sensitive to the average vertical hydraulic conductivity beneath a site than to the hydraulic conductivity of either the coarse- or fine-grained facies alone (Maples et al., 2020). However, Maples et al. (2019) focused on regional-scale MAR projects using a model with variations in heterogeneity over hundreds of meters. The influence of meter-scale heterogeneity on recharge remains unclear, as even small blocks of fine-grained sediments can impact flow (Russo et al., 2022; Sallwey et al., 2018; Bahar et al., 2021).
In this work, to identify the impact of vadose-zone heterogeneity on flood-MAR, we use a 3D variably saturated flow model to simulate recharge processes at a site previously surveyed with a tTEM system. We develop a workflow for parameterizing a hydrologic model using high-resolution geophysical data (1–10 m pixel size), applying geostatistical methods to account for uncertainty in each step of the workflow. We then perform a suite of recharge simulations and quantify uncertainty on three distinct flood-MAR outcomes of interest. Global sensitivity analyses allow us to examine the extent to which the properties and distributions of fine-grained sediments control each outcome. They also determine the key subsurface properties that contribute to uncertainty in the simulation results, identifying the most important parameters to characterize when evaluating future MAR sites.
2.1 Recharge operations and outcomes
Inundation of a recharge site induces a complex response in the subsurface. During flood-MAR, temporary earthen levees are typically constructed around a parcel of land, which is flooded with surface water from a nearby river or canal (Fig. 1). Water then infiltrates from the surface into the shallow soil and creates a pressure wave that moves through the system. Subsequent redistribution processes then transport water laterally and vertically under capillary forces and downward due to gravity. As the recharge pressure wave reaches the saturated zone, it forms a characteristic groundwater mound below the site (Bouwer, 2002). Mounding of the water table then causes an increase in lateral saturated-zone flow away from the site, which increases storage in the broader aquifer (Fig. 1).
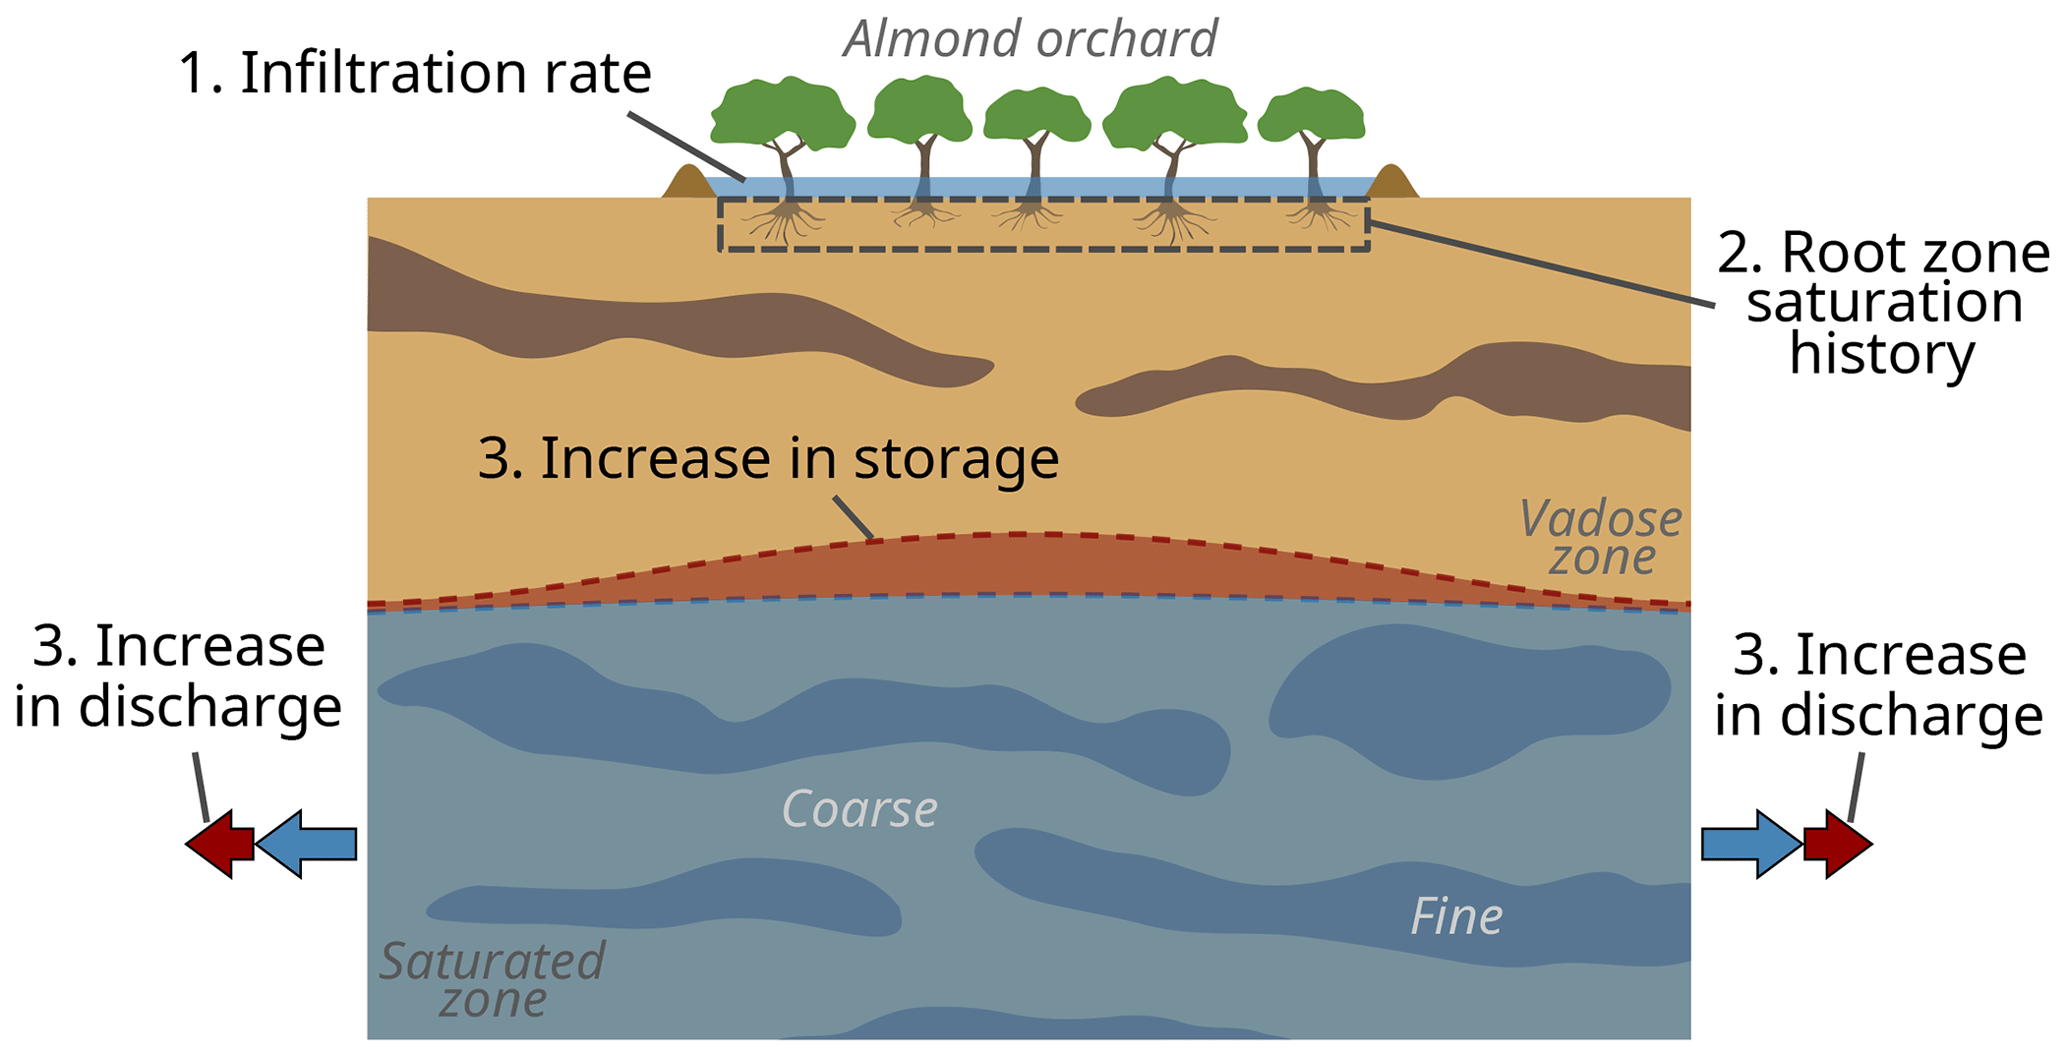
Figure 1Theoretical cross section of flood-MAR at an almond orchard, showing processes that determine the three outcomes of interest considered in this study: infiltration rate at the surface (1), root zone residence time (2) and saturated-zone recharge efficiency (3). Saturated-zone recharge efficiency consists of two components: storage recharge (the increase in saturated-zone storage below a site) and flux recharge (the increase in lateral discharge away from the site below the water table). Red colors indicate long-term changes from pre-inundation conditions.
Along with these potential benefits, flood-MAR can have adverse effects. Prolonged saturation of the root zone can lead to soil anoxia and greenhouse gas production (Levintal et al., 2023). Recharge can also degrade groundwater quality by mobilizing geogenic contaminants (Fakhreddine et al., 2021) or flushing salts, fertilizers, and pesticide byproducts from the vadose zone (Levintal et al., 2023).
Given these potential advantages and disadvantages of recharge, we quantify three primary outcomes of interest for flood-MAR: infiltration rate at the surface, root zone residence time and saturated-zone recharge efficiency. The infiltration rate across the surface – the rate of movement of ponded water into the shallow soil – can determine the success of a MAR project (Bouwer, 2002). Within California, high-magnitude flows used for flood-MAR typically only occur during short (<10 d) windows (Kocis and Dahlke, 2017). Sites with high infiltration rates can capture more water over these short windows, while also reducing the total area of land required for recharge. Moreover, maps of infiltration rate across a site are valuable for identifying high infiltration zones; if water managers can isolate and inundate a portion of a site but still have high recharge efficiency, they decrease operating costs (i.e., constructing fewer earthen levees) and limit crop risk.
The second metric, root zone residence time, accounts for the duration of root zone saturation and risk of soil anoxia. In agricultural settings, soil anoxia can inhibit root growth, root respiration, shoot growth, seed germination, nutrient uptake and crop yield (Kozlowski, 1997). Soil anoxia also promotes the production of organic and inorganic compounds that are toxic to some plants (Drew and Lynch, 1980). In addition, many tree crops have shallow root structures and can get blown over in high winds when the soil is saturated. The negative impacts of root zone saturation extend to non-agricultural recharge sites as well. Soil anoxia typically controls the removal of nitrogen species during soil aquifer treatment (e.g., Idelovitch and Michail, 1984) and is undesirable at any recharge site as it can increase the release of greenhouse gases like carbon dioxide and nitrous oxide.
Finally, there are many potential metrics for quantifying the recharge efficiency of a MAR project, including the average infiltration rate across the surface (Heilweil et al., 2015), the infiltration rate minus the evapotranspiration rate (Dahlke et al., 2018; Bachand et al., 2014), the fraction of applied water that reaches downgradient abstraction wells (Ganot et al., 2018), and the increase in hydraulic head across both the vadose and saturated zones (Russo et al., 2015; Maples et al., 2019). The primary goals of MAR – limiting water table decline, preventing land subsidence and increasing saturated-zone storage – entail replenishing water (or increasing pressure head) within the saturated zone (Morrell, 2014). Thus, we define recharge efficiency as the increase in saturated-zone storage that results from MAR operations. Depending on the scale of the model, this includes the increase in saturated-zone storage below a site as well as the increase in lateral saturated-zone flow away from the site (across model boundaries), which increases storage within the broader aquifer (Fig. 1). Note that this definition differs from previous work that equates recharge with deep percolation, which is the downward movement of water past the root zone. Though deep-percolation water will likely reach the water table, it may take years to do so. This time lag impacts water management decisions and can vary from site to site, so we focus on saturated-zone recharge. Due to a lack of water and sediment chemistry data, we do not consider changes in groundwater quality during recharge. More details on each metric are described in Sect. 3.4.1.
3.1 Study area
Our study site consists of an 800 m by 400 m almond orchard within the Tulare Irrigation District in the southern part of the Central Valley (Fig. 2) that was previously characterized with a towed transient electromagnetic system (Behroozmand et al., 2019). The Tulare Irrigation District is underlain by a complex alluvial sedimentary system typical of the Central Valley, consisting of interconnected layers of sand and gravel embedded in a matrix of fine-grained sediments (Mid-Kaweah GSA, 2019). Regional studies have shown that the upper 30 m of the subsurface typically consists of interbedded deposits of gravelly sand, silty sand and silt, with a higher percentage of less-permeable, clay-rich deposits below 30 m (Mid-Kaweah GSA, 2019). The depth to bedrock beneath the site is 350–400 m, though a low-permeability, laterally extensive aquitard, the Corcoran Clay, underlies the site at a depth of approximately 150 m (Mid-Kaweah GSA, 2019). The Soil Agricultural Groundwater Banking Index (SAGBI) rates the site as “poor” (score 21/100; O'Geen et al., 2015), due to slow soil drainage at the site. However, SAGBI derives soil drainage estimates from large-scale soil maps, which historically identify the correct soil type with only 50 % accuracy (Brevik et al., 2003). Thus, soil drainage may not actually be a limiting factor at this site.
The local, semiarid climate is characterized by dramatic deviations in precipitation from one year to the next (Dettinger et al., 2011). Between 1980 and 2021, total annual precipitation ranged from 60 mm (2013) to 420 mm (1998). Most annual precipitation falls between November and March, which is the season in which Central Valley MAR operations typically occur. The Tulare Irrigation District operates several recharge projects in the area and has plans to expand in the future, with a particular focus on on-farm recharge (Mid-Kaweah GSA, 2019). However, no recharge operations have occurred at this site in the past.
3.2 Geophysical and geostatistical methods
3.2.1 Geophysical data acquisition
To characterize subsurface heterogeneity, the study site was surveyed with a towed transient electromagnetic (tTEM) system in fall 2017 (Behroozmand et al., 2019). The tTEM system can rapidly map meter-scale variations in subsurface resistivity over large areas. Given the link between resistivity and sediment texture (Knight and Endres, 2005), tTEM is a natural choice for recharge site assessment. In total, 46 line kilometers of tTEM data were acquired in the almond orchard and an adjacent field (Fig. 2). Within the orchard, tTEM data were collected in rows ∼6.8 m apart and, after data processing, resulted in a sounding every ∼10 m along each row. In the adjacent field, tTEM data were collected in lines 25–40 m apart with a sounding every 5 m along each line. These data were inverted in Aarhus Workbench (Aarhus GeoSoftware) using a smooth, 1D spatially constrained approach (Auken et al., 2015). For each sounding, a global sensitivity threshold (Christiansen and Auken, 2012) was used to determine the depth of investigation (30–80 m), below which reliable estimates of resistivity cannot be recovered. The resulting resistivity model (Fig. 3a) contains 24 layers. Layer thicknesses increase from 1 m at the surface to 9.7 m at the maximum depth of investigation (81 m). The resistivity model was used to estimate the depth to the water table at the site (45 m; Goebel and Knight, 2021), which is in agreement with nearby water table measurements (44 m).
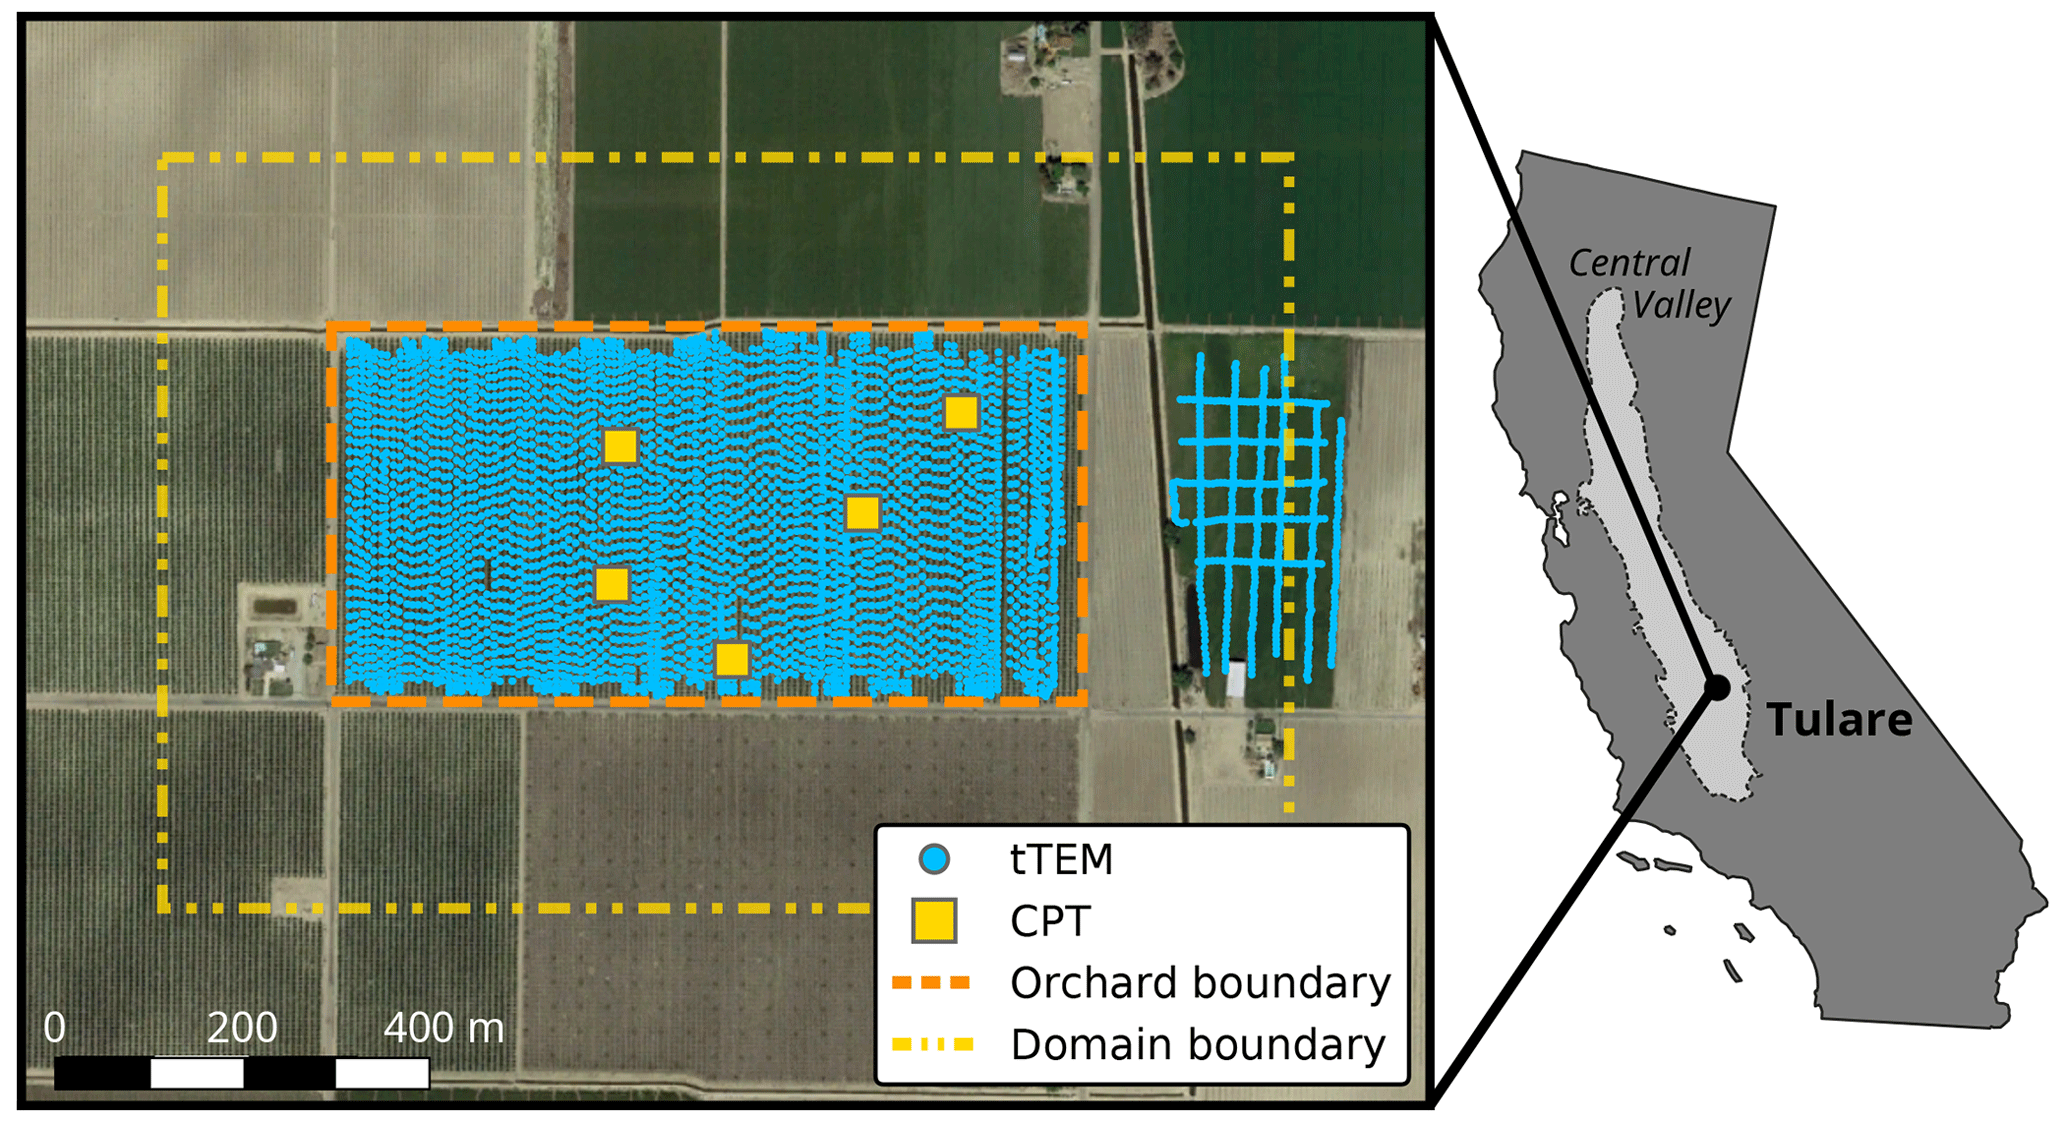
Figure 2An aerial image of the study site and a map of California showing the location of the site within the Central Valley (light gray area). Individual tTEM soundings are shown as blue circles, while the location of each cone penetration test (CPT) is represented as a yellow square. The extent of the hydrologic model domain (dashed yellow line) is 200 m larger in every direction than the extent of the almond orchard (dashed orange line). Satellite imagery © Google Earth 2023.
3.2.2 Interpolation and extrapolation of geophysical data
Following geophysical inversion, the resistivity model consists of irregularly spaced point data. To transform these data onto a rectilinear grid for use in a hydrologic model, we use sequential Gaussian simulation (SGSIM). SGSIM is a common technique for populating a grid with a Gaussian random variable without the smoothing effect of deterministic methods (e.g., ordinary kriging). Because the hydrologic model domain extends beyond the bounds of the resistivity model, this procedure includes both interpolation (between any soundings > 10 m apart) and extrapolation (vertically from the depth of investigation to 90 m and laterally up to 200 m away from the orchard boundaries). SGSIM accounts for the uncertainty in this process by generating multiple equally probable realizations of the variable of interest. The full workflow is shown in the Supplement (Fig. S1) and described briefly here.
First, resistivity values were transformed to a Gaussian distribution using a normal score transformation. An implicit assumption of SGSIM is stationarity, meaning that statistical properties of the random variable (e.g., the mean and variance) do not vary spatially throughout the domain. However, experimental variograms of the normal score values displayed a trend with depth. To account for this, we decomposed each normal score value (z(u), where u is a location in the domain) into trend (m(u)) and residual (r(u)) components (Wackernagel, 2003):
We modeled the trend using a radial basis function with a Gaussian kernel parameterized to capture the smooth, large-scale changes in normal score values. To extrapolate the trend laterally, for each geostatistical realization, 15 random 1D sounding profiles were copied from the tTEM survey to random locations outside the survey footprint. These 15 profiles are enough to ensure the extrapolated m(u) values exhibit a similar trend beyond the orchard as within it. This is a logical assumption given that the characteristic trend within the study area is a decrease in resistivity with depth, which is consistent with regional surveys of resistivity (Knight et al., 2018) and sediment type (Mid-Kaweah GSA, 2019). Next, we transformed the residuals to a Gaussian distribution and generated 600 realizations of z(u) on a m (width × length × depth) uniform grid using SGSIM. This number of realizations was chosen so as to satisfy the approximate number of simulations required for global sensitivity analyses, described in Sect. 3.4.2. For horizontal cell sizes, we used the approximate spacing between tTEM soundings (10 m). For the depth direction, we used the finest vertical cell size in the tTEM-derived resistivity model (1 m). Following SGSIM, each realization of z(u) was added to a unique realization of the extrapolated trend, m(u). Finally, the combined trend and residual values were back-transformed to resistivity units and downsampled to the vertical resolution of the tTEM-derived resistivity model. An example realization is displayed in Fig. 3b.

Figure 3One example realization at each step of the workflow for parameterizing a hydrologic model with tTEM data. Inversion of the tTEM soundings produces a resistivity model of irregularly spaced points (a). The geostatistical workflow (Sect. 3.2.2) then interpolates and extrapolates the resistivity model onto a rectilinear grid (b). A rock physics transform is then applied to create realizations of coarse fraction (c). Finally, after clustering each coarse-fraction realization into distinct facies, each facies is assigned specific parameter values, such as horizontal saturated hydraulic conductivity (d). All plots are shown with 10× vertical exaggeration.
3.2.3 Transforming resistivity to coarse fraction
To determine sediment properties from resistivity data, 1D tTEM resistivity profiles were compared with sediment types determined from collocated cone penetration test (CPT) logs. This procedure is described in detail in Goebel and Knight (2021) and briefly summarized below. At this site, CPT logs were acquired at five locations extending from the surface to depths of 19–32 m, with a sampling interval of 10 cm (Fig. 2). CPT logs were then used to determine the soil behavior type and horizontal hydraulic conductivity of each sampling interval (Robertson et al., 1992; Lunne et al., 1997; Robertson, 2009, 2016). Profiles of soil behavior type at these five locations were then compared to profiles of electrical resistivity recorded during CPT logging (Fig. S2a), and k-medoids clustering was used to classify soil behavior types with similar resistivity values (Goebel and Knight, 2021). This classification scheme resulted in a coarse-dominated cluster corresponding to high resistivity values (“clean sand to silty sand” and “gravelly sand to sand”) and a fine-dominated cluster corresponding to low resistivity values (all other soil behavior types). Clustering results were then used to convert soil behavior type logs to binary coarse–fine sediment logs (Fig. S2b).
The CPT data were then aggregated to the same resolution as the tTEM-derived resistivity model by calculating the fraction of coarse-classified sediment layers over a given depth interval, a statistic referred to as coarse fraction. Aggregating the CPT data resulted in 62 depth intervals with paired coarse-fraction and resistivity information. Though the logs do not extend to the full depth of investigation of the tTEM survey, the range of resistivity values in the overlapping profiles covered 97 % of all resistivity values in the tTEM resistivity model (Fig. 3a). The eddy currents induced in the subsurface during a TEM survey are primarily oriented horizontally. If we assume that sediment layers within a single tTEM cell are also oriented horizontally, we can model the electrical current flow through each cell as current flow through a set of resistors in parallel. Algebraically, the resistivity of a tTEM cell (ρtTEM) is described by the harmonic mean of the resistivity of the fine- and coarse-grained layers:
where CF is the fraction of coarse layers within a cell, ρcoarse is the resistivity of the coarse-grained layers, and ρfine is the resistivity of the fine-grained layers. Using the procedure of Knight et al. (2018), we then generate 1000 bootstrapped samples of 62 paired ρtTEM and CF values and use non-negative least squares to solve for ρcoarse and ρfine for each sample. This technique produces a distribution of the expected resistivity values for coarse-dominated and fine-dominated end-members (Fig. S3). The range of resistivity values for a given end-member represents both uncertainty in the field data and the variability in resistivity that exists for a given sediment type due to other factors (water content, salinity, etc.).
Typically, sediments exhibit different resistivity–lithology relationships above and below the water table (Knight et al., 2018; Knight and Endres, 2005). The procedure above was used to build resistivity–sediment-type distributions for the vadose zone but could not be used for the saturated zone as none of the CPT logs extend below the water table. Instead, we examined comparable resistivity–sediment-type distributions from airborne electromagnetic data over the site and nearby well logs (Knight et al., 2018). We then calculated the offset, in Ω m, between the vadose-zone and saturated-zone distributions for a given sediment type. We calculated separate scaling factors for coarse-dominated (10−0.118 Ω m) and fine-dominated (10−0.110 Ω m) sediments; the scaling factor for coarse sediments is expected to be of larger magnitude because the sediments typically exhibit a larger difference in saturation above and below the water table than do fine-grained sediments. We then applied this scaling factor to the vadose-zone CPT-derived resistivity–sediment-type distribution to generate equivalent distributions for the saturated zone (Fig. S3a).
Next, we used the vadose-zone and saturated-zone resistivity–sediment-type distributions to transform resistivity to coarse-fraction values between 0 and 1. Using increments of 0.001, for each coarse-fraction value in this range we calculated ρtTEM 10 000 times using Eq. (2), with ρcoarse and ρfine randomly sampled from the distributions in Fig. S3a. Paired coarse-fraction and ρtTEM values (Fig. S3b) were then aggregated into bins by resistivity and used to calculate the distribution of coarse-fraction values within each bin. Finally, we used the binned distributions to transform each geostatistical realization of resistivity (Sect. 3.2.2) to coarse fraction. For each geostatistical realization, we iterated through all resistivity bins and sampled from each bin's coarse-fraction distribution. To vary the transform between each realization, we chose random quantiles at which to evaluate the coarse-fraction distributions for the lowest and highest resistivity values observed in that realization (lowresq and highresq, respectively). We then used linear interpolation between lowresq and highresq to determine quantiles at which to evaluate coarse-fraction distributions for all resistivity bins between the two end points. This random sampling is advantageous over other methods (e.g., choosing the maximum likelihood value from each distribution) because it accounts for the uncertainty in the distribution of coarse-fraction values corresponding to a single value of resistivity. The end result is a suite of 600 realizations of coarse fraction, several of which are presented in Figs. 3c and S4.
3.3 Hydrologic model development
To model recharge at the site, we use ParFlow–CLM, which is a coupling of ParFlow, a hydrologic model, and the Common Land Model (CLM), a land surface model. ParFlow simultaneously solves the three-dimensional Richards equation and the shallow water equations, while CLM uses a mass transfer approach to simulate water and energy fluxes from soil, snow and leaf surfaces. For details on the governing equations of each model, readers are referred to previous work describing ParFlow (Ashby and Falgout, 1996; Jones and Woodward, 2001; Kollet and Maxwell, 2006), CLM (Dai et al., 2003) and the coupling between the two (Kollet and Maxwell, 2008; Maxwell and Miller, 2005). In this study, we use the kinematic wave approximation to simulate shallow overland flow (Kollet and Maxwell, 2006) and a van Genuchten model (van Genuchten, 1980) to describe the relationship between pressure head and both saturation and relative permeability.
3.3.1 Boundary conditions and discretization
The hydrologic modeling domain measures 1200 m × 800 m × 150 m in width, length and depth, respectively, with uniform, 10 m horizontal cell sizes. In the upper 90 m, cell thicknesses in the depth direction match the resolution of the tTEM cells (1–9.7 m). Below that depth, we add a single layer of 60 m thick cells to account for the estimated thickness of the unconfined aquifer below the tTEM depth of investigation (Mid-Kaweah GSA, 2019). In total, the domain contains 240 000 grid cells ( cells). The impact of this discretization scheme on model output is discussed further in the Supplement (Fig. S7 and Table S1).
We impose a no-flow boundary on the bottom of the domain, which approximates the depth to the Corcoran Clay, an aquitard. On the sides, we apply a constant-head boundary equal to the estimated depth of the water table (45 m). During model development, we adjusted the lateral boundaries as far as 1000 m from the edge of the almond orchard and found that constant-head boundaries 200 m away (Fig. 2) are sufficiently far to have minimal impact on model results (Table S2). The boundary conditions used at the top of the model vary depending on the model stage and are described below.
3.3.2 Model parameterization
The geophysical and geostatistical workflow above (Sect. 3.2.1–3.2.3) results in 600 unique realizations of one sediment property, coarse fraction, below the site. To estimate hydrologic properties of the subsurface (hydraulic conductivity, porosity, etc.) from this metric, we assume that there are only two end-member sediment types at the site – coarse and fine – and that each cell is a mixture of the two. We then define parameters for each end-member and an averaging procedure to calculate properties of cells that are a mix of the two end-members. This approach has been applied to Central Valley groundwater flow models in the past (e.g., Phillips and Belitz, 1991; Belitz and Phillips, 1995; Faunt, 2009) and is supported by the observation that sediment texture and hydraulic properties are spatially correlated in geologic media (Russo and Bouton, 1992). Nonetheless, this assumption is a simplification of the real groundwater system; its implications are discussed more fully in Sect. 6.
Due to a paucity of site-specific data, we compile a range of potential parameter values and averaging schemes using literature data from the Central Valley (rows 1–12 in Table 1), with a preference towards published research in the vicinity of the site. For most parameters, we approximate prior uncertainty using a uniform or log-uniform distribution, with lower and upper bounds as the minimum and maximum of the range of values reported in the literature. The one exception is horizontal hydraulic conductivity, described below. Once each parameter's prior uncertainty has been defined, we use Latin hypercube sampling to sample from each distribution, jointly varying all parameters between every simulation. Latin hypercube sampling has some statistical advantages over random sampling (Saltelli, 2008) and ensures that all regions of the parameter space are sampled.
Table 1Parameter ranges sampled during Monte Carlo simulations.
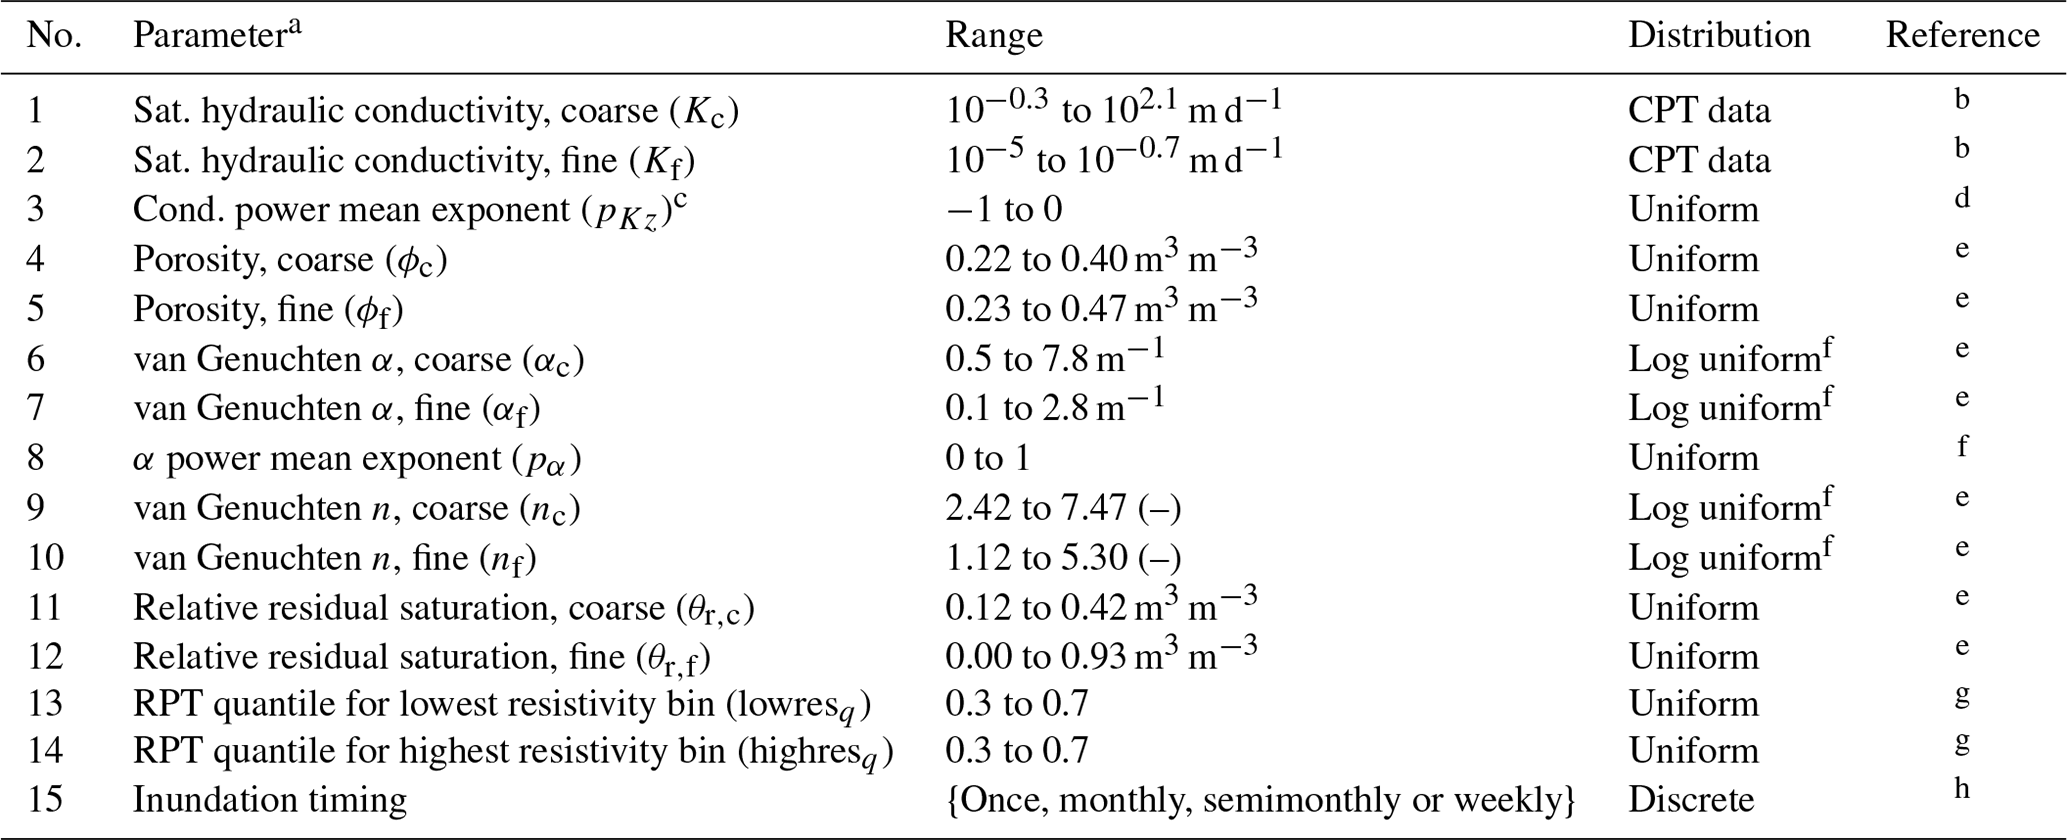
a Principal component scores from principal component analysis of all coarse-fraction realizations are also included in global sensitivity analyses but are not shown in the table. b Lunne et al. (1997) and Robertson et al. (1992). c Only used for averaging vertical conductivity. p=0 indicates geometric mean and indicates harmonic mean. d Freeze and Cherry (1979), Fogg et al. (2000), and Faunt (2009). e Botros et al. (2009). f Zhu and Mohanty (2002). g These are the quantiles used to evaluate the rock physics transform (RPT) for the lowest and highest bins of resistivity values. See Sect. 3.2.3. h Bachand et al. (2019), Ganot and Dahlke (2021), Murphy et al. (2021), and Ma et al. (2022).
For hydraulic conductivity, we approximate prior uncertainty as the distribution of conductivity values calculated from cone penetration test logs, with separate distributions for coarse- and fine-dominated sediments. Previous work has shown that cone penetration tests can effectively estimate hydraulic conductivity in alluvial sediments (Gribb et al., 1998; Voyiadjis and Song, 2003; Shen et al., 2015) and that the range of values in each distribution agrees with previous conductivity estimates within the southern Central Valley (Botros et al., 2009; Faunt, 2009; Belitz and Phillips, 1995; Bertoldi et al., 1991; Johnson et al., 1968; Zamora, 2008). To calculate hydraulic conductivity in cells that are a mix of fine and coarse sediments, we assume a horizontally layered system and use the arithmetic mean for horizontal hydraulic conductivity (flow parallel to layers). A harmonic mean is typically used for flow perpendicular to layers (Freeze and Cherry, 1979), though the geometric mean may be more applicable in systems with interconnected coarse facies, like the Central Valley (Fogg et al., 2000; Faunt, 2009). Given this uncertainty, we use a power mean function to calculate vertical hydraulic conductivity and include the power mean exponent as an additional parameter during Monte Carlo simulations (row 3 in Table 1), with values between −1 (harmonic mean) and 0 (geometric mean). Because we use different horizontal and vertical hydraulic conductivity averaging schemes, conductivity is anisotropic in cells with coarse fraction between 0 and 1.
Parameter ranges for porosity, residual saturation, van Genuchten α and van Genuchten n (van Genuchten, 1980) are derived from a database of 97 sediment cores collected on the east side of the southern Central Valley (Botros et al., 2009). We use the arithmetic mean when averaging porosity and residual saturation across sediment types. To average van Genuchten parameters, we use the arithmetic mean for n and a power mean averaging scheme for α (Zhu and Mohanty, 2002), with exponent values ranging from 0 (geometric mean) to 1 (arithmetic mean).
Before applying each parameter set to a realization of coarse fraction, we classify each domain into discrete hydrogeologic units. First, we bin coarse-fraction values in each realization into five groups using k-means clustering. Cluster centers vary between each realization given that each realization contains a slightly different distribution of coarse-fraction values. We then iterate through each cluster and replace all coarse-fraction values within that bin with the bin mean. We define a sixth hydrofacies for the bottom layer of model cells (90–150 m depth) and assume that coarse fraction in this facies is equal to the mean coarse fraction in the rest of the domain. Previous work modeling Central Valley recharge has relied on a similar facies designation for deep portions of an aquifer with limited geologic information (Maples et al., 2019).
3.3.3 Model stages
Recharge modeling at the site consists of three separate stages:
-
spin up to steady state using constant forcing;
-
spin up for 1 year with meteorological forcing using CLM;
-
followed by
- a.
for flood-MAR simulations, inundation, then a relaxation period with meteorological forcing or
- b.
for reference simulations, 2 years of meteorological forcing without any inundation.
- a.
To initialize pressure head throughout the model domain, each simulation is spun up to steady state using a specified flux of 0.15 m yr−1 applied at the surface. This value represents the net recharge rate (precipitation + irrigation − evapotranspiration) of a hypothetical almond orchard in the southern San Joaquin Valley, calculated using precipitation and reference evapotranspiration data from the California Irrigation Management Information System (CIMIS; http://www.cimis.water.ca.gov/, last access: 4 August 2022) and localized irrigation data from the California Department of Water Resources (CA DWR, 2018a). Reference evapotranspiration was converted to crop evapotranspiration using monthly crop coefficients for almonds within the Central Valley (Doll and Shackel, 2015). Given the spatial variability of evapotranspiration and irrigation, we calculated separate recharge rates for 15 CIMIS stations between 1998 and 2015 (Fig. S5); the final rate used for model spin-up (0.15 m yr−1) is a weighted average of these 15 individual rates, with stations weighted according to their proximity to the study site. This value constitutes the best estimate of modern recharge rates, though it is of the same order of magnitude as the long-term-average deep-percolation rate across the entirety of the Central Valley (0.27 m yr−1; Faunt, 2009). We apply this forcing to each simulation until the annual change in subsurface storage is <0.01 % (Ajami et al., 2014), which takes between 8 and 131 years depending on the simulation.
Next, each model is run for 1 year using meteorological forcing (Xia et al., 2012; Rodell et al., 2004) covering 1 February 2010 to 31 January 2011. We chose this time period so that inundation occurs in spring 2011, when there was surplus surface water available in the southern Central Valley for flood-MAR (Bachand et al., 2014). The timing of inundation is important, given that antecedent soil moisture may have an impact on recharge rates. Though realistic, springtime inundation may introduce increased crop risk, as recharge operations may overlap with the growing season. During this step, we also simulate crop transpiration and irrigation using CLM. Irrigation is applied between 07:00 and 17:00 LT from March through October, with daily irrigation rates set to 105 % of daily crop evapotranspiration (Doll and Shackel, 2015).

The pressure distribution at the end of the CLM spin-up period is then used as the initial condition for two separate simulations, run concurrently: a flood-MAR simulation and a reference simulation without MAR. Among Central Valley almond orchards, on-farm recharge varies both in the amount of water applied during a season (0.065–0.76 m) and in the frequency of recharge events, ranging from weekly to once per season (Ganot and Dahlke, 2021; Bachand et al., 2014; Murphy et al., 2021). To investigate the effects of flood frequency on each outcome of interest, we vary the frequency of inundation as an additional parameter (Table 1). In all cases, a total of 256 000 m3 (0.8 m3 m−2) of water is applied to the orchard between February and May 2011, though we vary the number and frequency of events across four scenarios (Table 2).
To implement each recharge event in ParFlow, we apply a specified head at the upper boundary to cells within the almond orchard and a no-flow boundary condition to the cells outside it. At the start of an inundation step, the specified head over the orchard is equal to the total amount of water applied for that event (e.g., 0.20 m for monthly inundation). For each subsequent time step, the specified head is decreased by the amount of water that infiltrated below ground in the previous time step. This loop is then repeated until no water is left on the surface. This scheme is a computationally efficient approximation of a falling-head infiltration that allows for heterogeneous infiltration with ponded water that flows laterally towards preferential flow paths. Water applied to the orchard cannot move laterally over the surface outside the bounds of the orchard, which mimics an on-farm recharge operation that uses check dams to isolate the recharge area.
Between subsequent recharge events and following the final recharge event, we implement a relaxation phase in which meteorological and irrigation forcing is applied at the surface using CLM. Each flood-MAR simulation consists of a single season of recharge in spring 2011 followed by a relaxation period until 1 February 2013, 2 years after initial inundation. To investigate changes in recharge efficiency beyond 2 years, 10 randomly selected simulations were run for an additional 8 years (ending on 1 February 2021) using meteorological and irrigation forcing without any additional recharge events.
Reference simulations cover the same time period as flood-MAR simulations but do not include any inundation. Meteorological and irrigation forcing is applied for the entire 2-year period using CLM. Comparing reference simulations to simulations with flood-MAR permits differentiating the effects of recharge from other model processes that occur naturally over the same time period, such as an increase in vadose-zone storage due to above-average precipitation.
3.4 Model output analysis
3.4.1 Evaluating recharge outcomes
As discussed in Sect. 2.1, for each simulation, we evaluate three recharge outcomes of interest.
-
Infiltration rate at the surface. To create maps of infiltration rate across the almond orchard, for each simulation we compute the time-varying volumetric flux of water across the surface into the domain. This is a spatially resolved flux, with variable infiltration rates from one surface cell to the next. We then tabulate the cumulative volume of water that flowed into each individual surface cell across all recharge events. To more easily compare infiltration maps with ponded depth, we divide cumulative volume by surface area and represent the infiltrated volume as a length.
-
Root zone residence time. To evaluate the duration of root zone saturation, we analyze the time series of water content within the root zone for each simulation. Although maximum rooting depth of almond trees can extend to 2 m, effective rooting depth typically ranges from 0.3–1.0 m (Andreu et al., 1997; Koumanov et al., 2006), so we define the root zone as the upper 1 m of the subsurface. Depending on the variety of rootstock, almonds can tolerate 2–14 d of anoxia before bud break (December–early February) and 48 h after bud break (late February–November) without decreased plant growth or crop yield (O'Geen et al., 2015). In our simulations, most recharge events occur after bud break, so we assume that trees can only withstand 48 h of anoxia. During MAR, soil anoxia can develop at water saturation values less than 100 % (Ganot and Dahlke, 2021). Thus, for each root zone cell, we calculate the percentage of simulations in which the cell exceeded 48 h of >90 % saturation over the 2-year inundation–relaxation cycle. Note that this 48 h threshold does not directly account for the risk of tree mortality during high-wind events – which can occur even during brief periods of saturation – though simulations that exceed the threshold have higher risk than those that do not.
-
Saturated-zone recharge efficiency. We define the final outcome of interest, recharge efficiency, as the increase in saturated-zone storage below a site plus the increase in lateral saturated-zone flow away from the site, which increases storage in the broader aquifer system. The two components of recharge are conceptualized in Fig. 1 and contribute to the recharge efficiency, Reff, at time t as
where is the saturated-zone flux out of the domain at time i for the simulation with recharge, is the lateral saturated-zone flux at time i for the simulation without MAR, Δt is the time step, is total saturated-zone storage at time t for the MAR simulation and is the saturated-zone storage at time t for the reference simulation. Thus, flux recharge ( is cumulative over time, while storage recharge () is transient. Note that we divide the volumetric recharge at time t by the total volume of water applied (Vapp) and multiply it by 100 to report it as a percentage.
To facilitate comparison with previous work, we also quantify deep percolation induced by MAR. Deep percolation is calculated using a modified version of Eq. (3) in which we replace saturated-zone storage with storage below the root zone (below 2 m) and saturated-zone flux with lateral flux out of the domain below the root zone. As with saturated-zone recharge efficiency, we then normalize this volume by the volume of water applied at the surface and express it as a percentage.
3.4.2 Global sensitivity analyses
To identify key parameters and processes affecting recharge, we perform a global sensitivity analysis for each outcome of interest. We utilize distance-based generalized sensitivity analysis (DGSA; Fenwick et al., 2014; Park et al., 2016), a computationally efficient technique that has been successfully applied to groundwater flow and transport models in the past (Hermans et al., 2018; Hoffmann et al., 2019; Perzan et al., 2021). We chose this form of sensitivity analysis because DGSA can take discrete parameters as input (e.g., inundation frequency) and can analyze high-dimensional model responses (e.g., an infiltration map), but it only requires a limited number of model simulations compared to other techniques, like variance-based methods.
In DGSA, simulations are clustered into groups with similar model responses (e.g., similar recharge efficiency) using the pairwise distance between responses. The distribution of an input parameter (e.g., porosity of the fine-grained end-member) is then compared between each cluster; if the prior distribution of a parameter is significantly different from the parameter's distribution within a cluster, then the model is said to be sensitive to that parameter. The area between empirical cumulative distribution functions (CDFs), referred to as the CDF distance, is used to quantify the degree of similarity between parameter distributions. Large CDF distances could result either from model sensitivity or from random model variability due to the limited sample size, so a bootstrapping procedure is used to test the statistical significance of observed CDF distances. If the observed distance is larger than the bootstrapped distance at a chosen significance level, then that parameter is said to be influential (sensitivity metric > 1). If the observed distance is smaller than the bootstrapped distance, the parameter is insignificant (sensitivity metric < 1).
In the present study, we cluster simulations on the pairwise Euclidean distance between model responses with k-medoids clustering, using a different distance for each outcome of interest. For saturated-zone recharge efficiency, we compute distances directly on each simulation's Reff value at 2 years. For infiltration and root zone residence time, we first reduce the dimension of each model response (80 × 40 pixel images) using a form of principal component analysis known as eigenimage decomposition. We then compute the distance between each simulation's eigenimage scores, using the minimum number of scores required to explain 98 % of variance (typically, 40–50 components). Finally, we cluster simulations using these distances and perform the bootstrapping procedure described above to calculate sensitivity metrics.
In each sensitivity analysis, we include all model input parameters listed in Table 1. For a given simulation, a change in model response can result either from explicit perturbation of these input parameters or from the particular spatial configuration of hydrofacies for that simulation. For example, one stochastic realization of the model domain may have a higher percentage of fine-grained facies than another, limiting recharge. To account for this spatial variability in sensitivity analyses, we perform principal component analysis across all realizations of coarse fraction (Fig. 3c) and include each simulation's principal component scores as additional input parameters to DGSA.
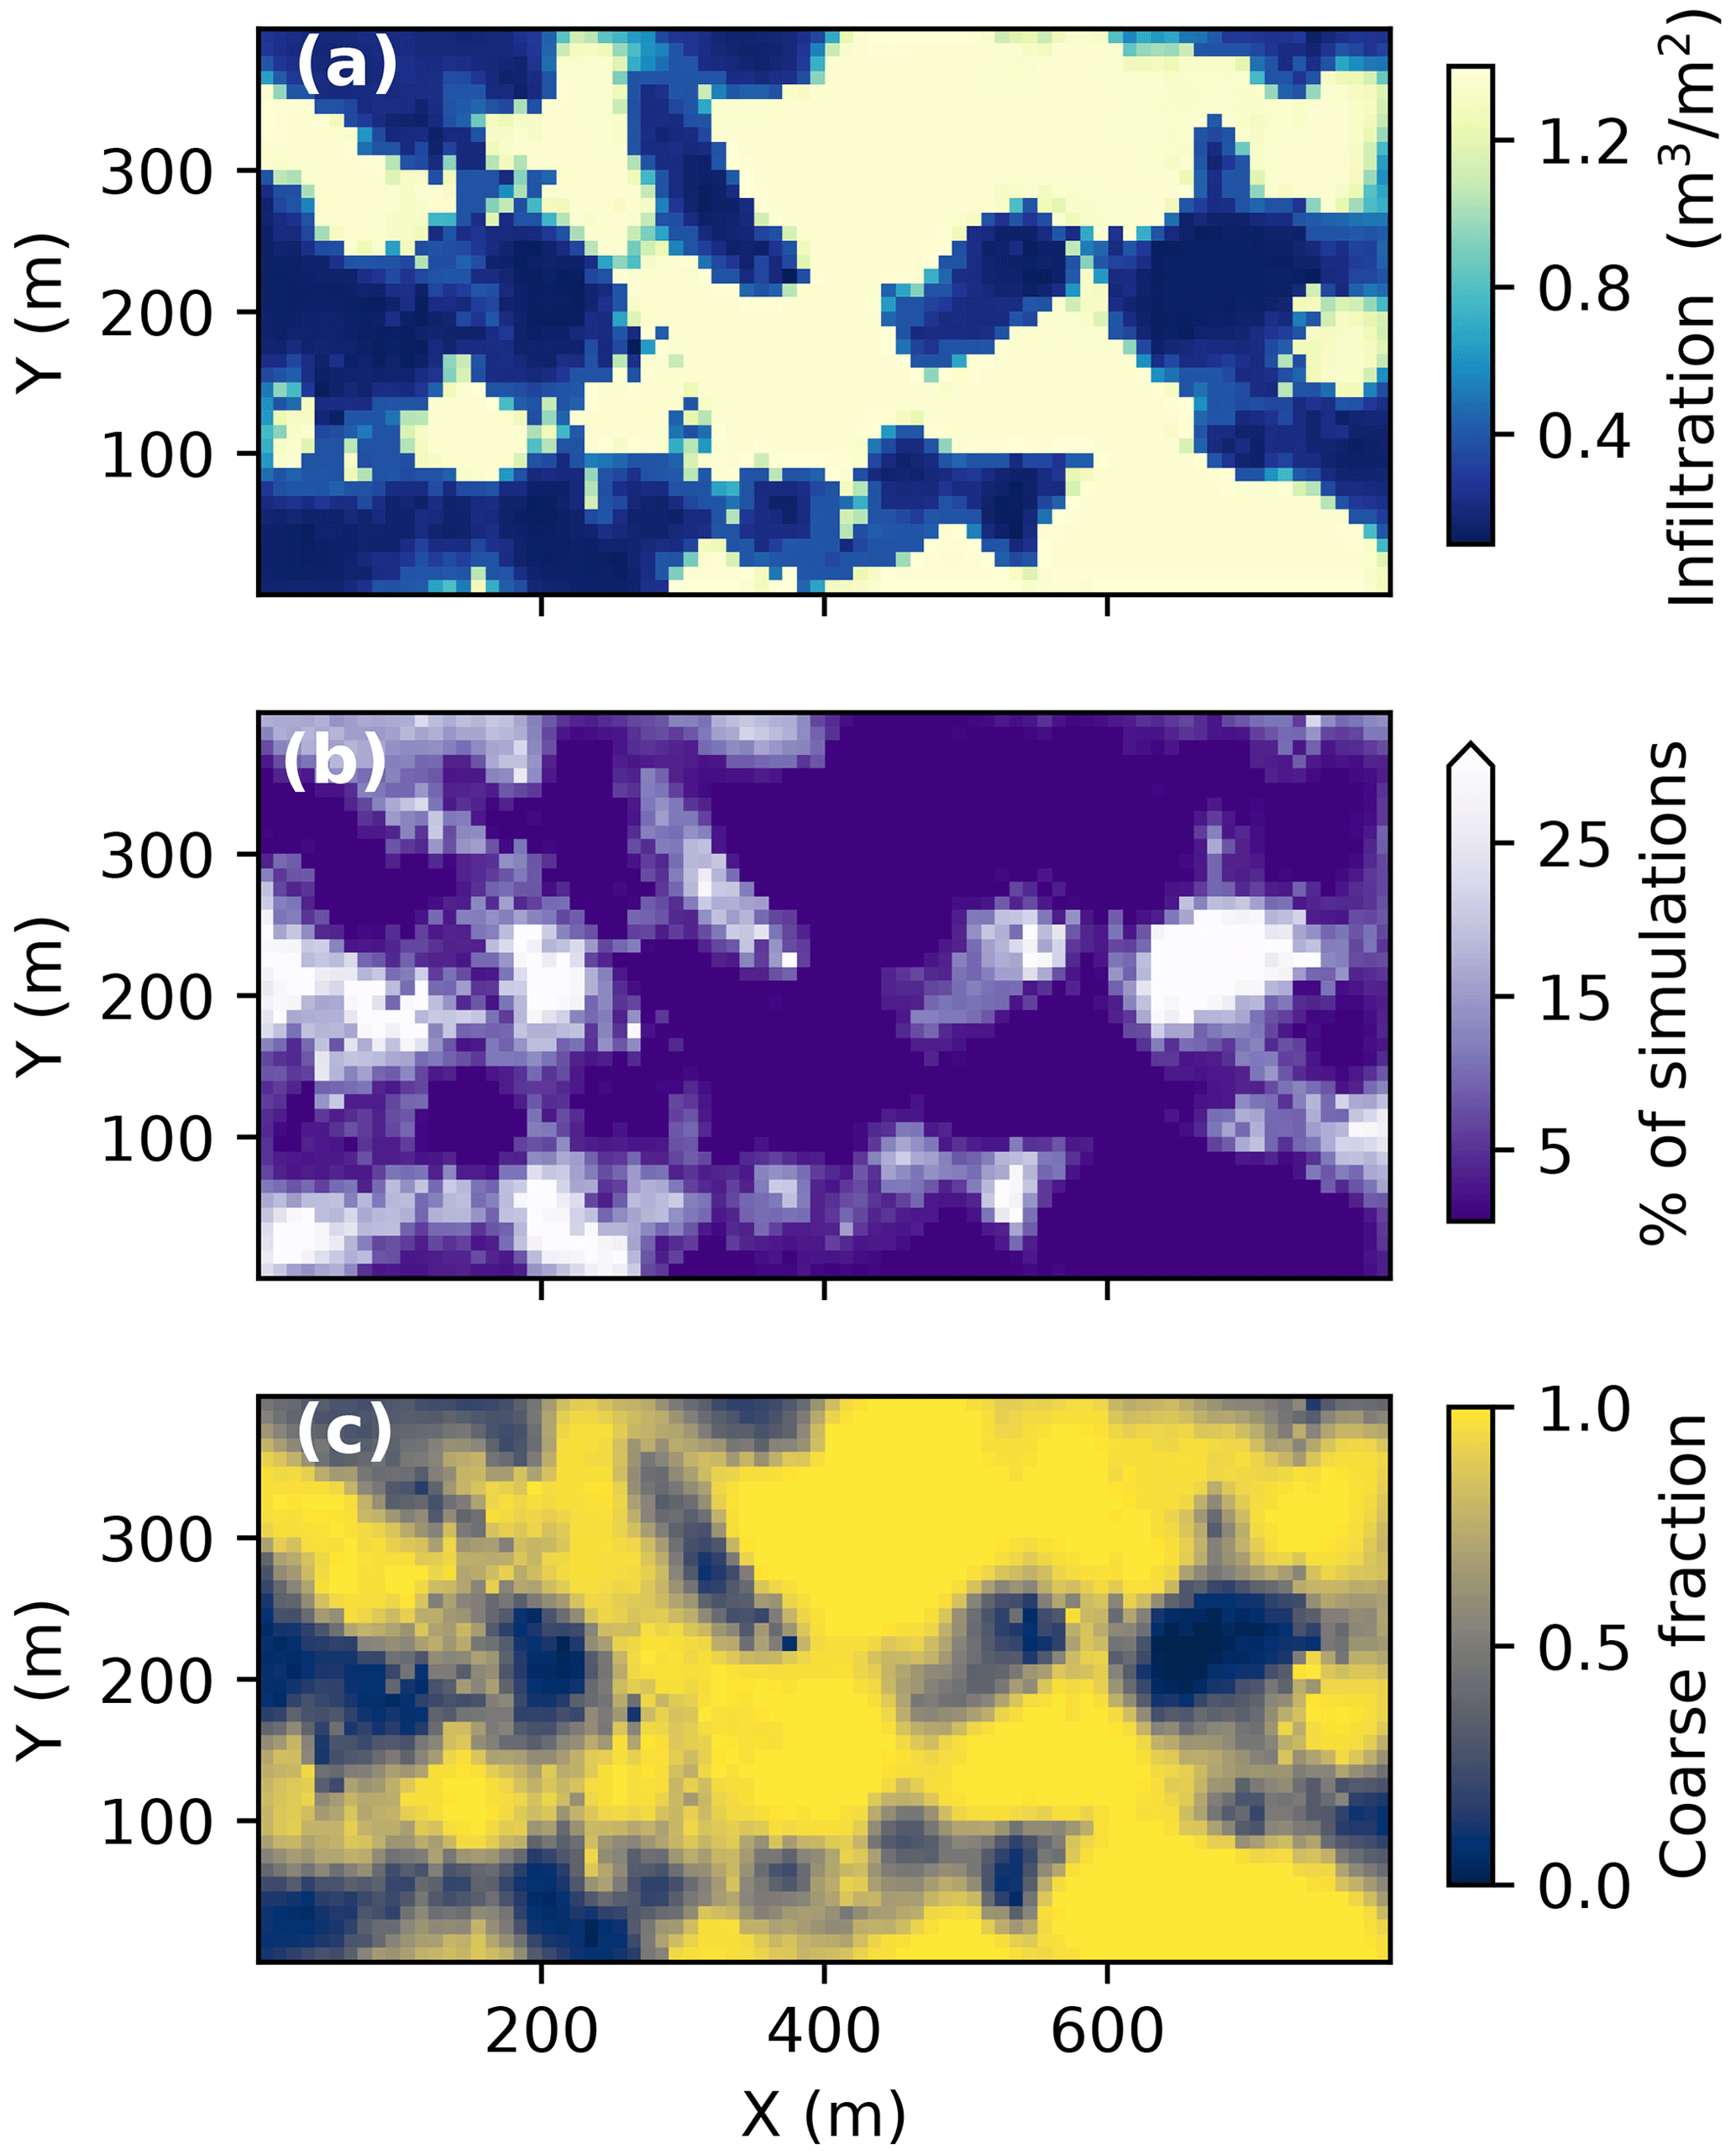
Figure 4Maps of the first two outcomes of interest, aggregated across all 284 simulations. All simulations received 0.8 m of inundation, though the median volume of water that infiltrated into each surface cell (a) ranges from 0.10 to 1.40 m3 m−2. The percent of simulations in which each surface cell exceeded the 48 h root zone saturation threshold is shown in panel (b), with the median coarse fraction of each surface cell shown in panel (c). Note that each map only shows the portion of the model domain immediately below the almond orchard.
4.1 Coarse-fraction models
The geostatistical workflow described in Sect. 3.2.1–3.2.3 produced 600 realizations of coarse fraction across the model domain, four of which are shown in Fig. S4. The upper portion of the domain is dominated by coarse materials (mean coarse fraction 0.52 from 0–14 m depth), with a higher proportion of fine-grained sediments at depth (mean coarse fraction of 0.14 from 28–90 m depth). However, pockets of fine-grained sediments as large as 100 m diameter occur throughout the domain, even within the coarse-dominated shallow vadose zone. Each realization displays similar coarse-fraction values immediately below the orchard (standard deviation ∼ 0.04), with increasing variance towards the domain boundaries (standard deviation ∼ 0.40; Fig. S6). Within the tTEM survey footprint, variance is highest at the transition zones between 100 % coarse and 100 % fine-grained sediments (standard deviation 0.2; Fig. S6). Finally, even though tTEM data were acquired at a lower density within the adjacent field than within the almond orchard (Fig. 2), uncertainty on coarse fraction is similarly low within both regions (Fig. S6).
4.2 Outcomes of interest
In total, we performed 600 unique model simulations. Of these, 316 (53 %) failed to complete all modeling stages, either due to invalid parameter combinations or because the ParFlow solvers failed to converge. Approximately half of the failed simulations did not complete initial model spin-up (stage 1 in Sect. 3.3.3) because permeability was too low to accommodate the specified flux across the surface, leading to a buildup of pressure in the top layer of model cells. Given that this specified flux was calculated from observed data, we presume that these failed simulations reflect implausible parameter combinations for this site. Outcomes of interest calculated from the remaining successful simulations are discussed below.
4.2.1 Surface infiltration rate
Across all simulations, the average infiltration rate during flood-MAR is 0.15±0.29 m h−1 (mean ± standard deviation). Infiltration rates are typically higher for simulations with smaller, more frequent inundation events: a mean of 0.06 m h−1 for simulations with a single 80 cm recharge event as compared to a mean of 0.24 m h−1 for simulations with weekly 5 cm recharge events. Within each recharge event, infiltration rates slow down over time; among simulations with a single 80 cm recharge event, on average, the infiltration rate during the last time step is 17 % of the initial rate.
Infiltration rates also vary with sediment type; on average, cells with coarse fraction > 0.6 account for 91 % of the volume of water that infiltrates into the subsurface even though they only make up 67 % of the orchard surface area. Maps of infiltration below the orchard (Figs. 4a and S8) show that water preferentially infiltrates through coarse-grained cells, with 1.8–458 (median 10.7) times more water infiltrating into 100 % coarse cells than into 100 % fine-grained cells. Eigenimage decomposition and k-medoids clustering of all infiltration maps reveals two distinct groups of simulations. Simulations in both clusters exhibit preferential infiltration through coarse facies, though the extent of preferential infiltration is greater in one cluster than the other (Fig. S8).
For a small subset of simulations (1.8 %), the initial infiltration rate through fine-grained facies is faster than through coarse-grained facies. However, this relationship quickly switches once sediments become saturated (<1 h), implying that coarse facies briefly acted as capillary barriers. Within each simulation, the greatest infiltration rates typically occur within coarse-grained cells on the edge of the orchard. These cells have higher infiltration capacity because – once below the surface – water can spread laterally into adjacent, dry cells beyond the orchard boundary.
4.2.2 Root zone saturation
In 65 % of simulations, at least one root zone model cell remains saturated longer than 48 h, which is the estimated time almond trees can endure soil anoxia without diminished growth or yield. Of the cells that exceed this threshold, 81 % are predominantly fine-grained, with coarse fraction < 0.6 (Fig. S9). Conversely, in 8 % of simulations (), at least one 100 % coarse-grained cell exceeds the saturation threshold. Aggregating results across simulations reveals a similar trend; contiguous blocks of fine-grained sediments are >20 % likely to remain saturated for at least 2 d following inundation (Fig. 4). Collectively, this area accounts for 9 % of the orchard or 2.85 ha.
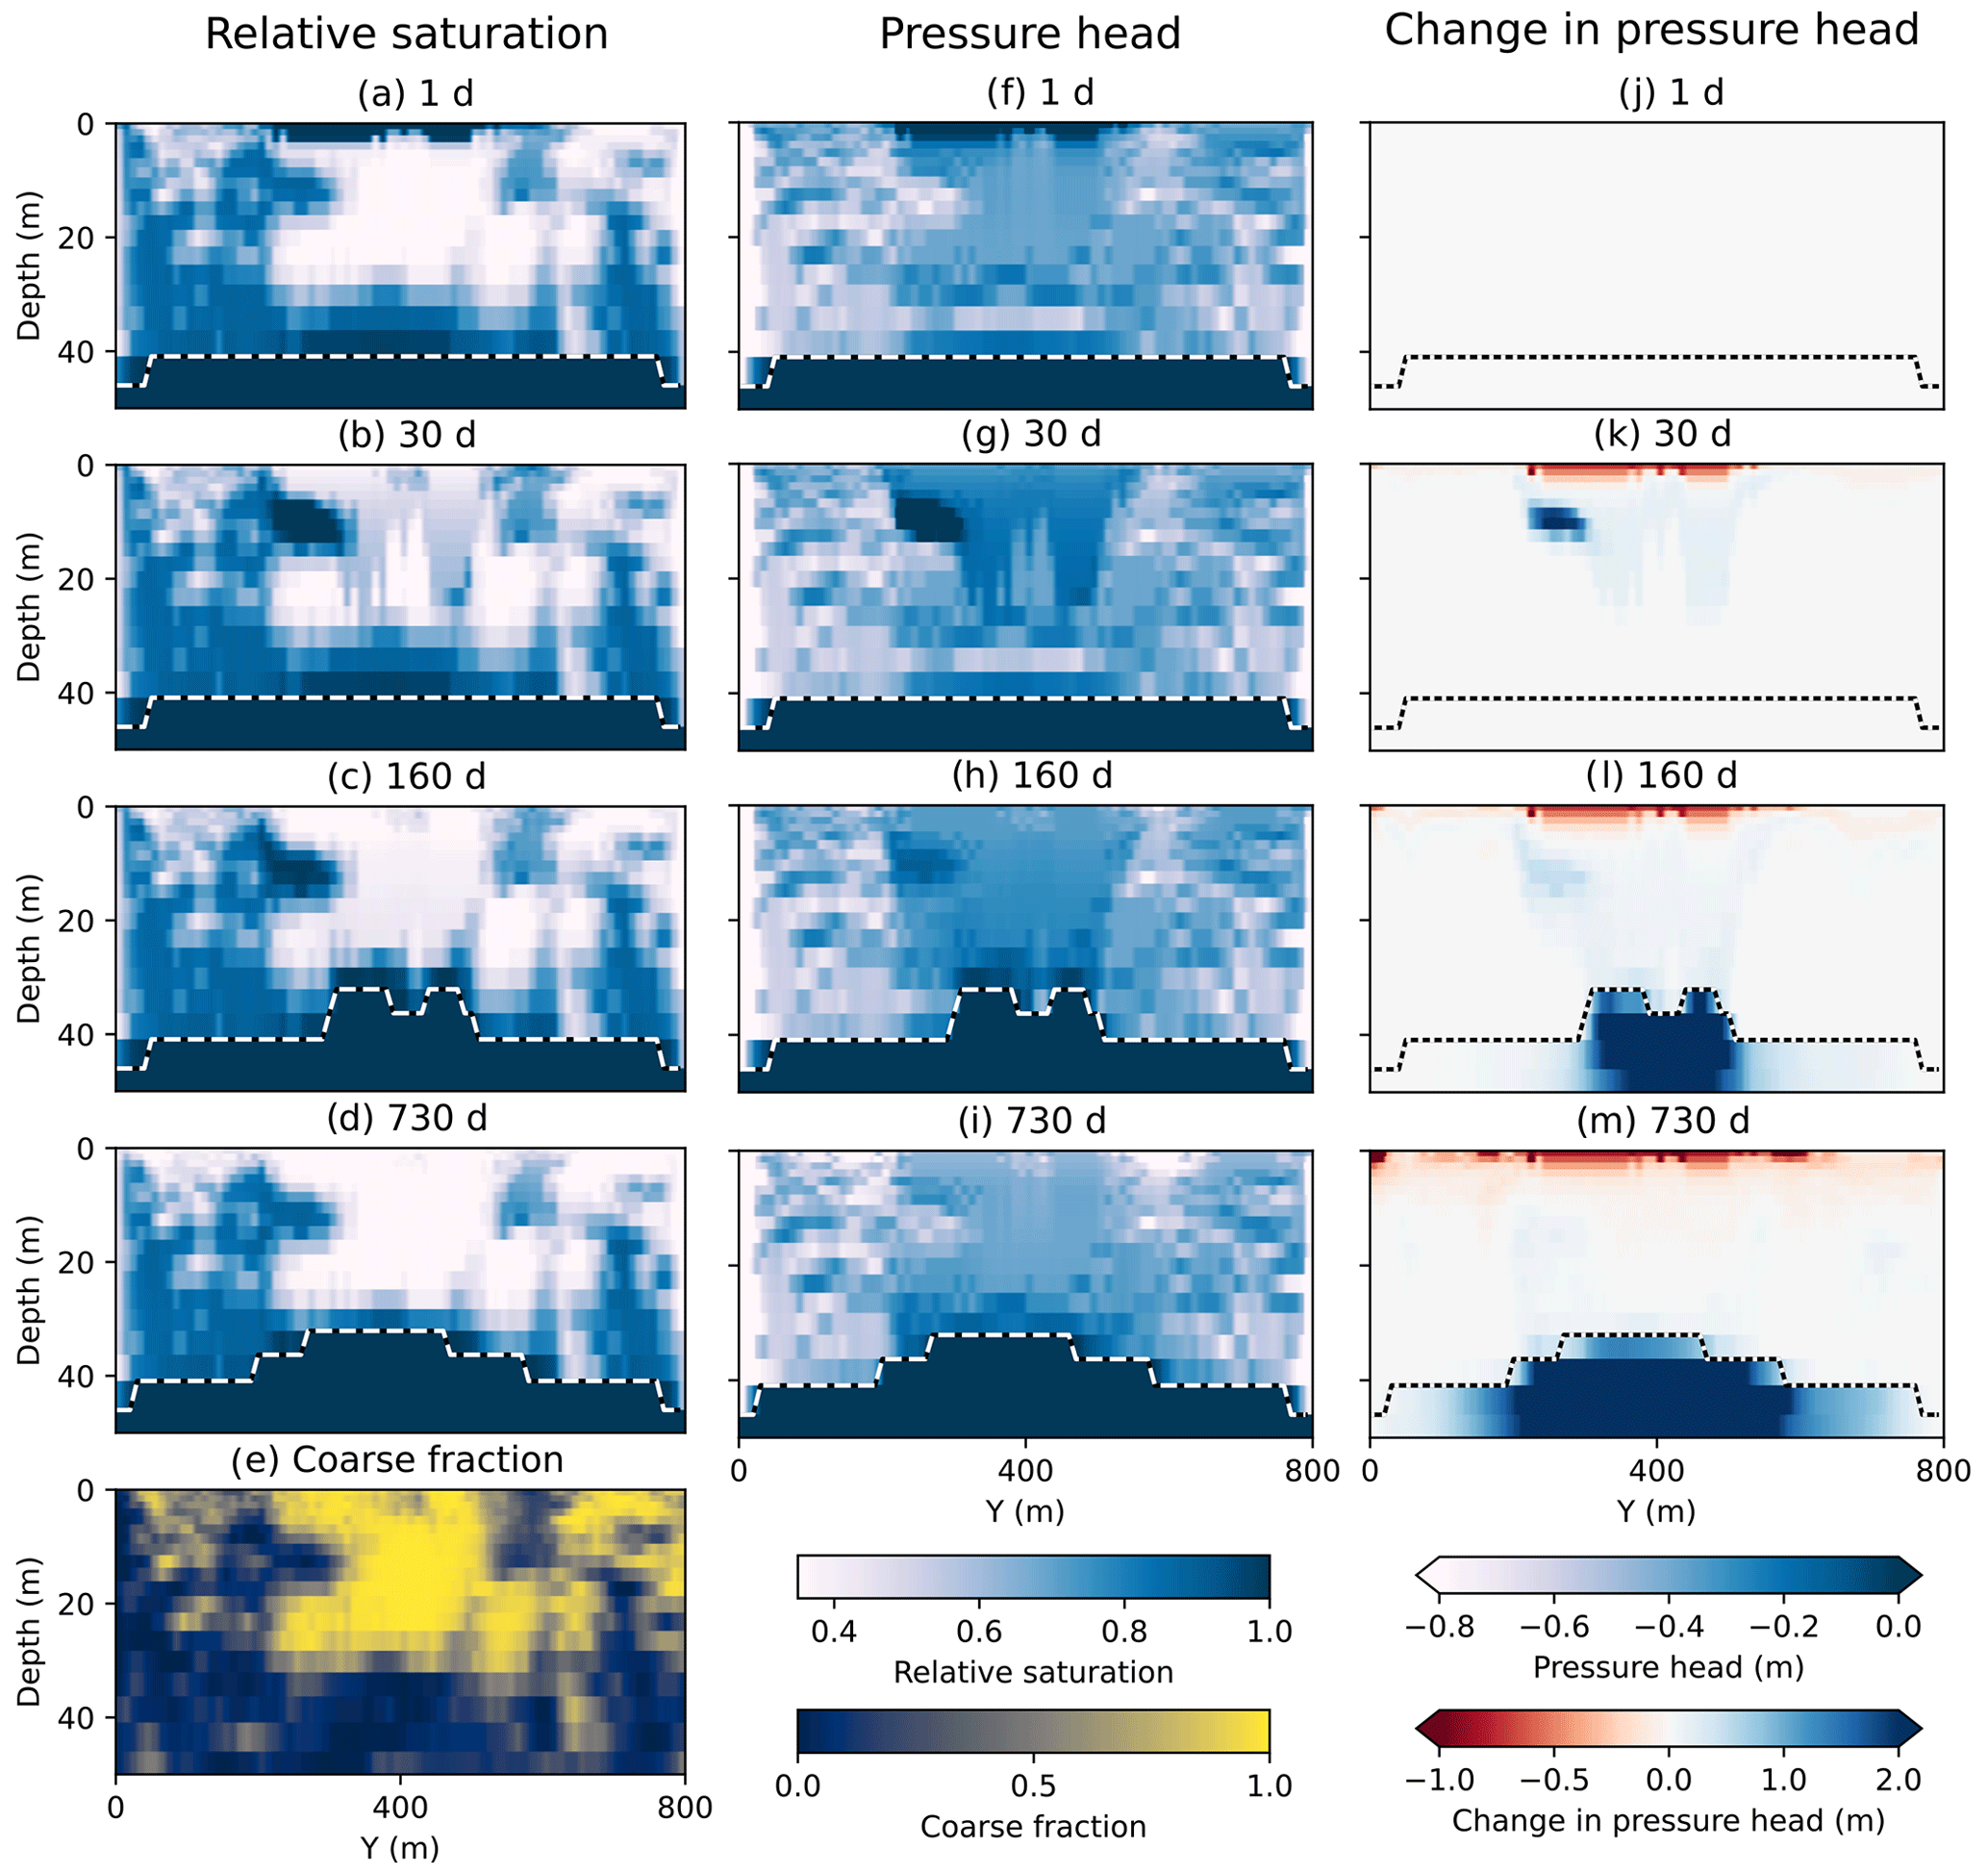
Figure 5Vertical cross sections of relative saturation (a–d), coarse fraction (e), pressure head (f–i) and the change in pressure head since day 0 (j–m) for a single simulation for 2 years (730 d) following a single 0.8 m inundation event. Transient increases in saturation within coarse-grained sediments can be observed at 30 d and within fine-grained sediments at 30 and 60 d. The dashed line shows the position of the water table, with obvious water table mounding at 160 and 730 d. Only the upper 50 m of the model domain is shown.
The increase in root zone saturation also drives a minor increase in transpiration within the almond orchard. In the first week after inundation, transpiration is an average of 37 % higher in flood-MAR simulations than in reference simulations (2.16 mm d−1 vs. 1.57 mm d−1), which is reflective of the early growing season in California's Mediterranean climate. After 7 d, the difference decreases, and mean transpiration for the remainder of the growing season is only slightly higher (2.2 % or 0.09 mm d−1). Over the whole simulation period, increased transpiration only accounts for ∼4.8 % (0.038 m) of the total applied water.
4.2.3 Saturated-zone recharge efficiency
Inundation at the surface produces a pressure pulse that cascades through the subsurface, resulting in a transient increase in saturation throughout the vadose zone (Fig. 5). The pulse moves rapidly past the root zone towards the water table. It is important to note, however, that this rapid change in storage corresponds to the transmission of pressure and not to the direct movement of water particles. Water applied at the surface displaces water in the root zone, which displaces water below the root zone and so on. Thus, though saturation may increase at 30 m depth, it does not necessarily indicate that water particles applied at the surface have moved to this depth.
As the pressure pulse moves deeper, it causes the water table to rise (Fig. 5), which represents an increase in saturated-zone storage (storage recharge; Fig. 1). Mounding of the water table induces an increase in discharge out the sides of the domain, which constitutes recharge to the broader aquifer system (flux recharge). Temporal changes in these two components of recharge are plotted for a single simulation in Fig. 6. Storage recharge is the first component to increase following inundation, starting to rise between 34 and 683 d (mean 214 d) after the first inundation event. As storage recharge peaks and slowly decreases, flux recharge decreases as well. However, since flux recharge is cumulative over time (Eq. 3), overall saturated-zone recharge efficiency continues to increase until the end of the simulation (Fig. 6).
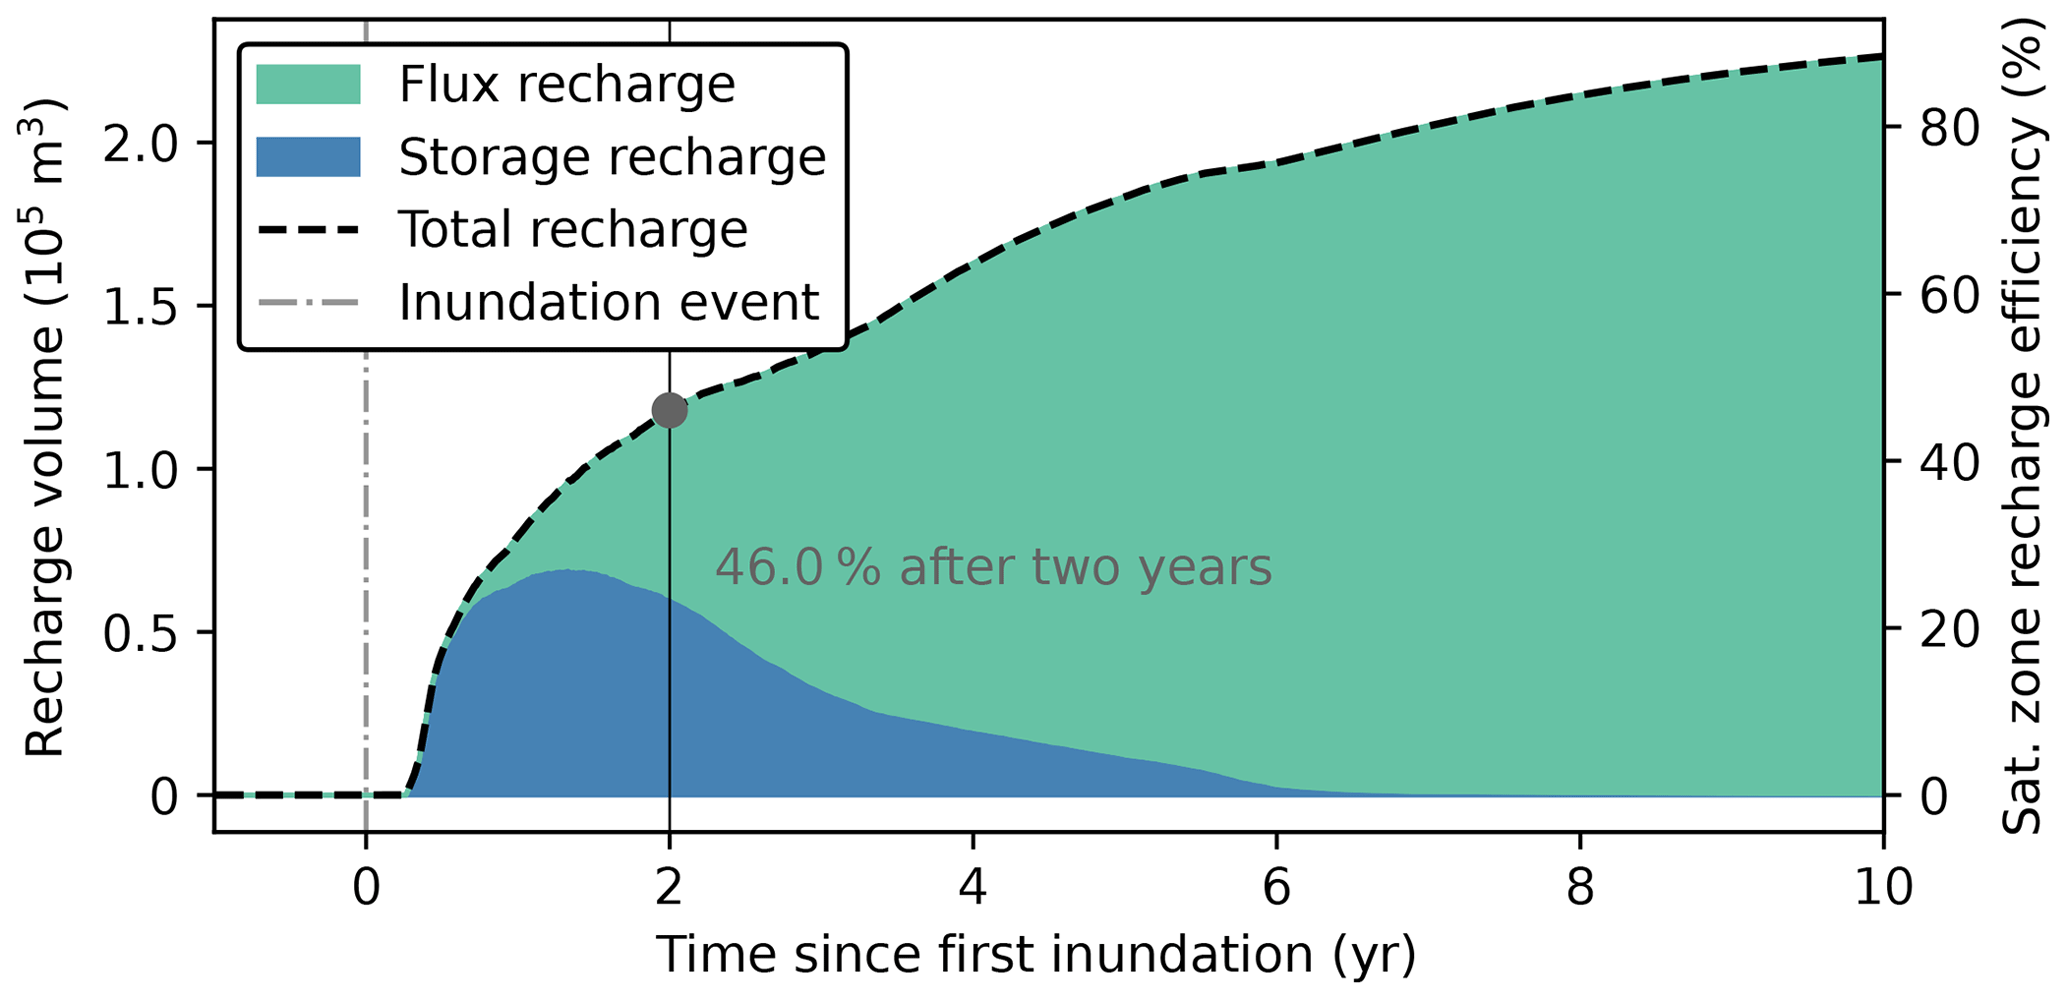
Figure 6Temporal changes in the two components of saturated-zone recharge efficiency – storage recharge (blue) and flux recharge (green) – for a single simulation for 10 years following inundation. Flux recharge is cumulative over time, while storage recharge is transient. Thus, even after the water table returns to its pre-MAR level at ∼6 years, water content in the vadose zone remains higher than in simulations without recharge. As this water percolates to the saturated zone, it contributes to flux recharge. The recharge efficiency of this simulation is 46 % after 2 years, which is higher than the median across all simulations (32.7 %).
Among all simulations, deep percolation increases rapidly following inundation. Fourteen days after the final inundation event, the increase in deep percolation accounts for 88.3±17 % of the volume of water applied at the surface (Fig. 7a). By comparison, saturated-zone recharge efficiency is 32.7±26.3 % after 2 years (Fig. 7b). Ten of these simulations were run for an additional 8 years (total of 10 years post-inundation), and results show that saturated-zone recharge efficiency continues to increase beyond 2 years (Fig. 6). However, none of the simulations reach 100 % recharge, and, though some get close, they plateau around 95 % (e.g., Fig. S10). Given this paper's focus on short-term recharge outcomes (<2 years), more long-term simulations are needed to confirm that these results are consistent across the full parameter space.
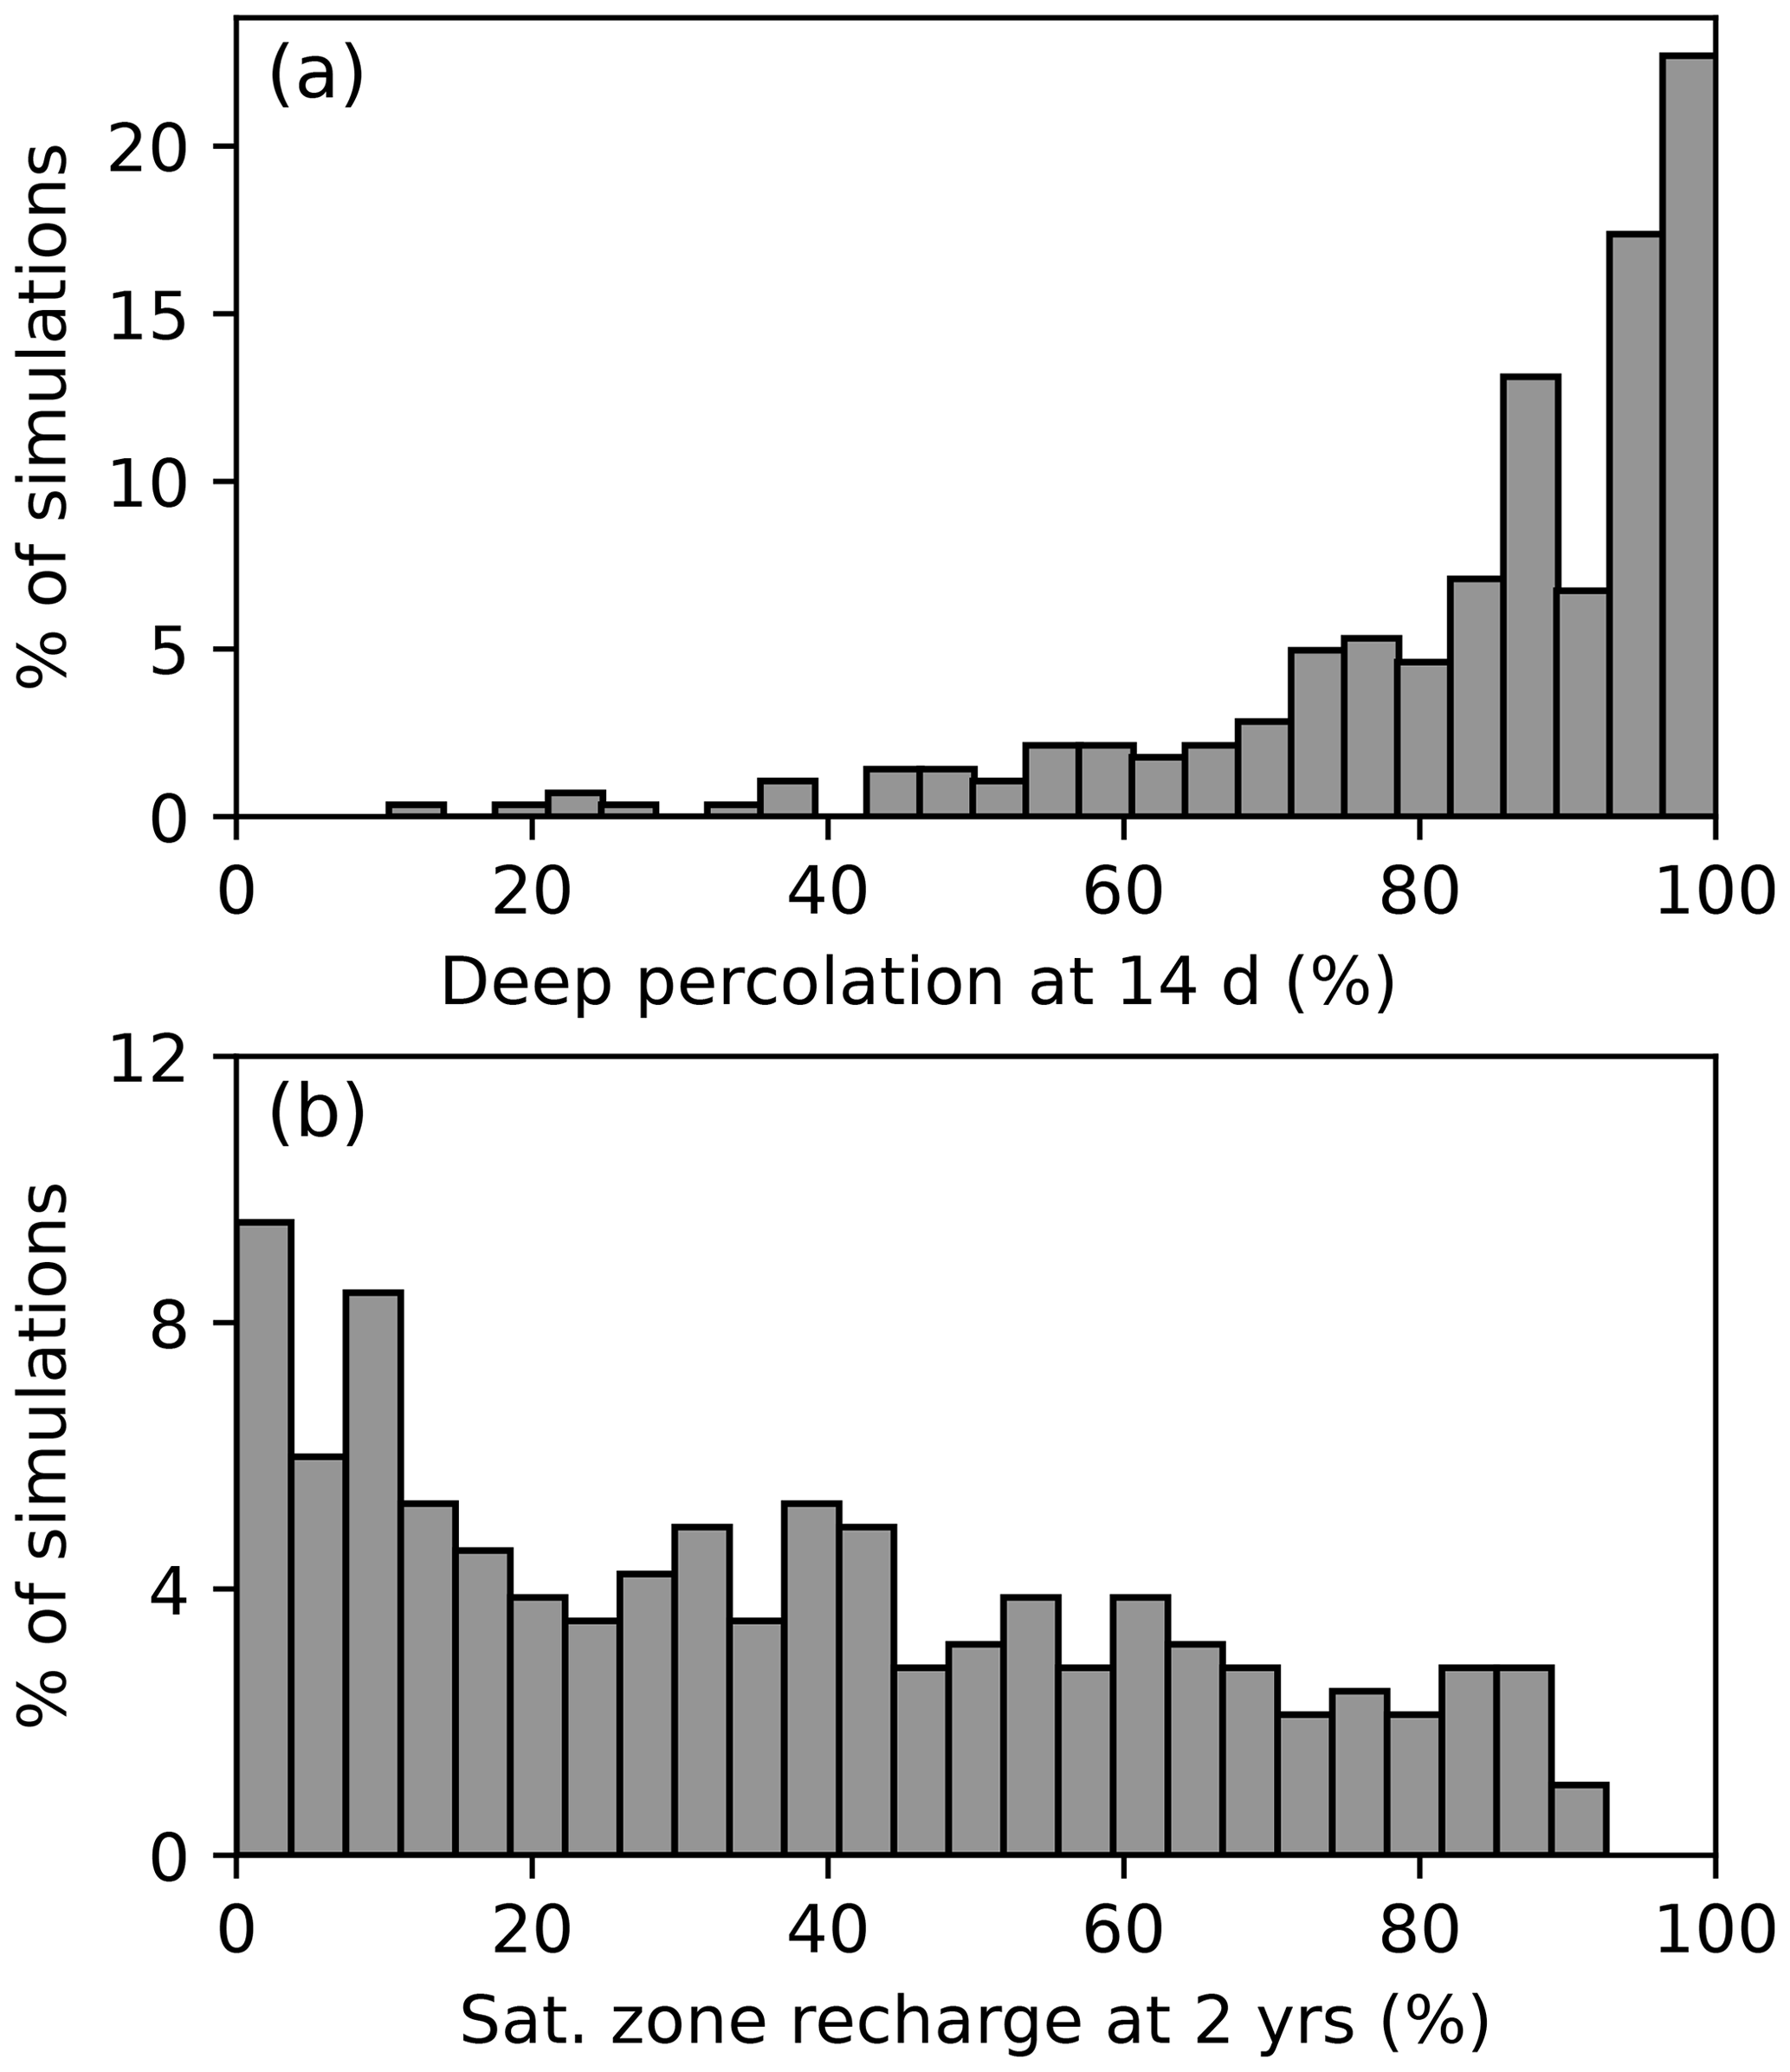
Figure 7Histogram of deep-percolation efficiency at 14 d (a) and saturated-zone recharge efficiency at 2 years (b) for all 284 simulations. Deep percolation refers to the proportion of water applied at the surface that has moved beyond the root zone within 14 d of the final inundation event. Saturated-zone recharge efficiency ranges from 0.28 % to 87.7 % (median 32.7 %), though the distribution is skewed towards lower values.
Coarse- and fine-grained facies respond differently to recharge, especially between the bottom of the root zone (2 m) and the water table (45 m). Coarse facies in this zone respond rapidly to inundation; on average, water content begins increasing 3.5 d after the first recharge event and peaks 11.2 d after the last event (Fig. 8a). In contrast, water content in the fine facies begins increasing after 22.2 d and peaks 246 d after the final inundation event. Fine-grained sediments are also slow to drain following inundation; 2 years after the first recharge event, storage in fine facies between 2 and 45 m depth is a median of 94 000 m3 higher than in reference simulations, which represents 37 % of the volume of water applied at the surface (Fig. 8b). By comparison, coarse facies hold significantly less water than the fine facies after 2 years (P<0.001, paired t test), which is a median increase of 10 700 m3 (4.2 % of applied water) relative to reference simulations.
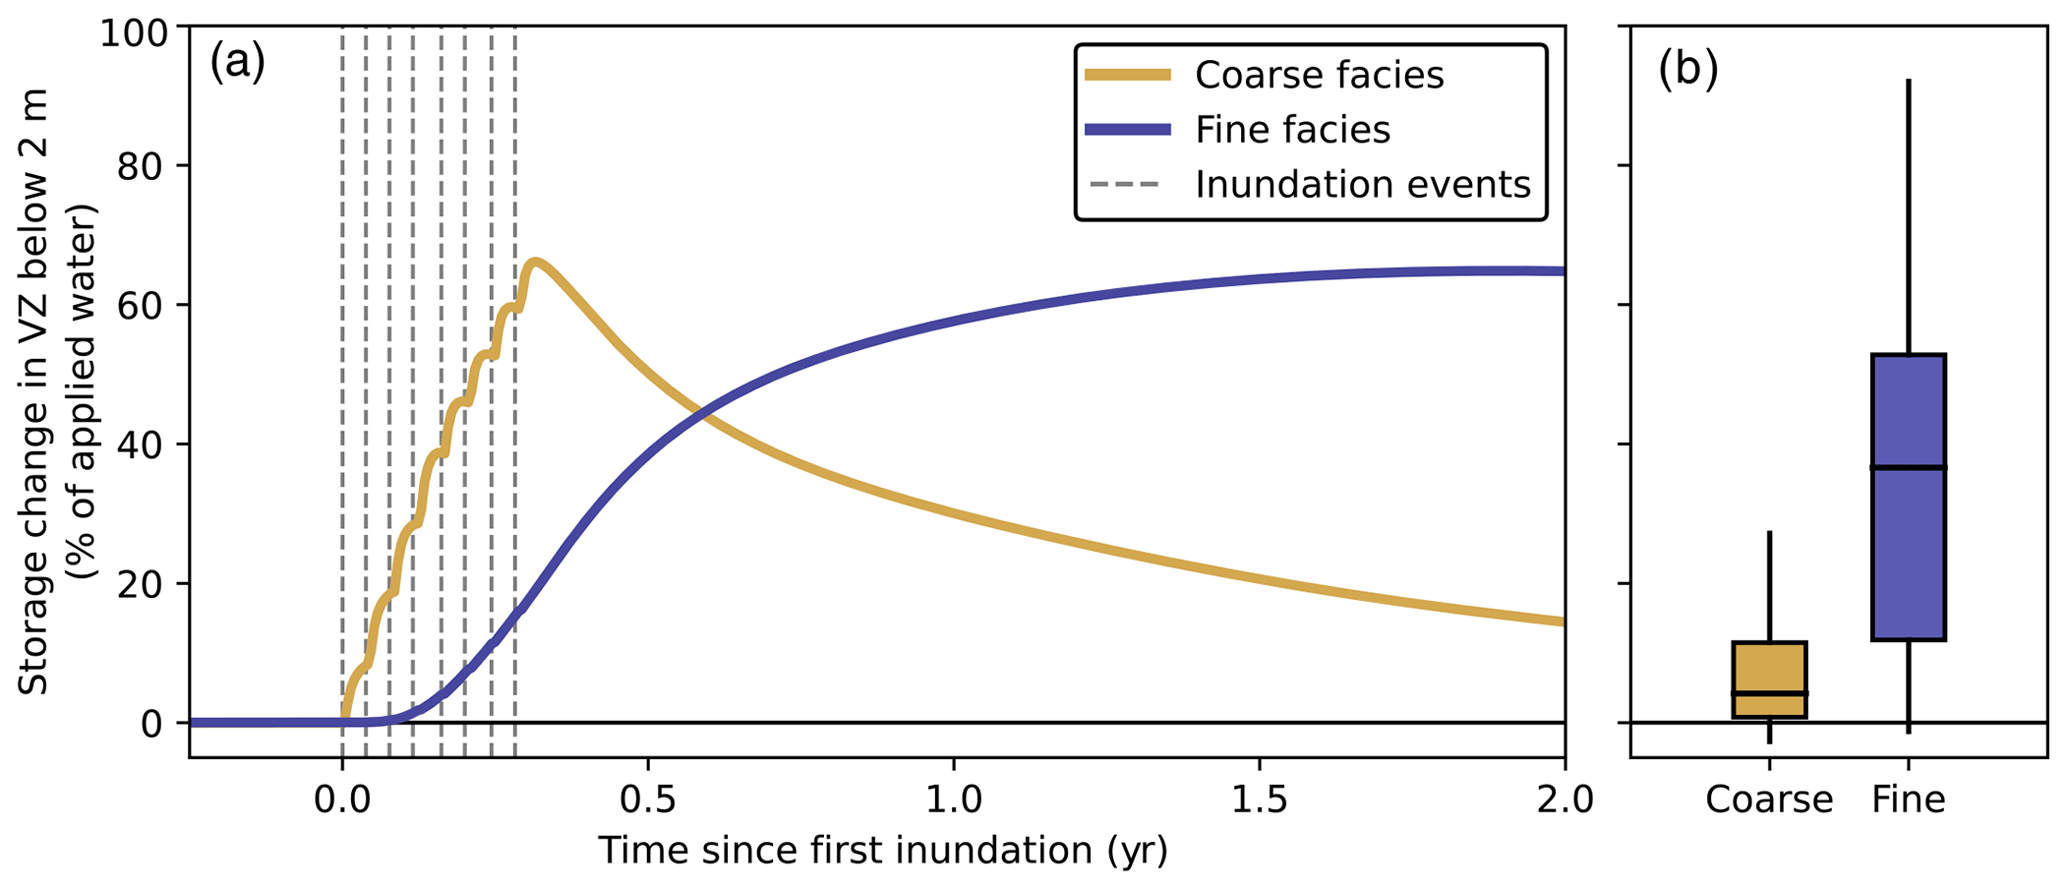
Figure 8Storage change in the vadose zone (VZ) below 2 m (a) for a simulation with low saturated-zone recharge efficiency (8.7 % after 2 years). The percent change in vadose-zone storage at 2 years for all 284 simulations is shown as a box plot in panel (b). Results of the paired t test indicate that the difference in the two populations in panel (b) is statistically significant (P<0.001). In both subplots, coarse facies (yellow) are defined as any model cells with coarse fraction ≥ 0.5; fine facies (blue) correspond to coarse fraction < 0.5.
4.3 Global sensitivity analyses
Global sensitivity analysis results are presented in Fig. 9. For each outcome of interest, the most influential parameter is the hydraulic conductivity of the fine facies. Saturated-zone recharge efficiency is also sensitive to the porosity and residual saturation of the fine facies, while root zone residence time is sensitive to residual saturation of the fine facies and the power mean exponent used to average vertical hydraulic conductivity in cells with coarse fraction between 0 and 1 (Sect. 3.3.2). Infiltration rate is the only outcome of interest sensitive to parameters that explicitly describe coarse facies; both the hydraulic conductivity and porosity of coarse-grained sediments are influential. Other parameters, like inundation frequency and the quantiles used for geophysical inversion (lowresq and highresq), are not influential. Similarly, none of the outcomes of interest are sensitive to metrics describing spatial uncertainty (mean coarse fraction, variance in coarse fraction, or coarse-fraction principal component scores), implying that the subsurface heterogeneity at this site is well characterized via tTEM. Finally, the sensitivity metrics of some parameters were statistically inconclusive (white bars in Fig. 9). While these parameters may impact the outcomes of interest, they are not as influential as the critical parameters discussed above (red bars in Fig. 9).
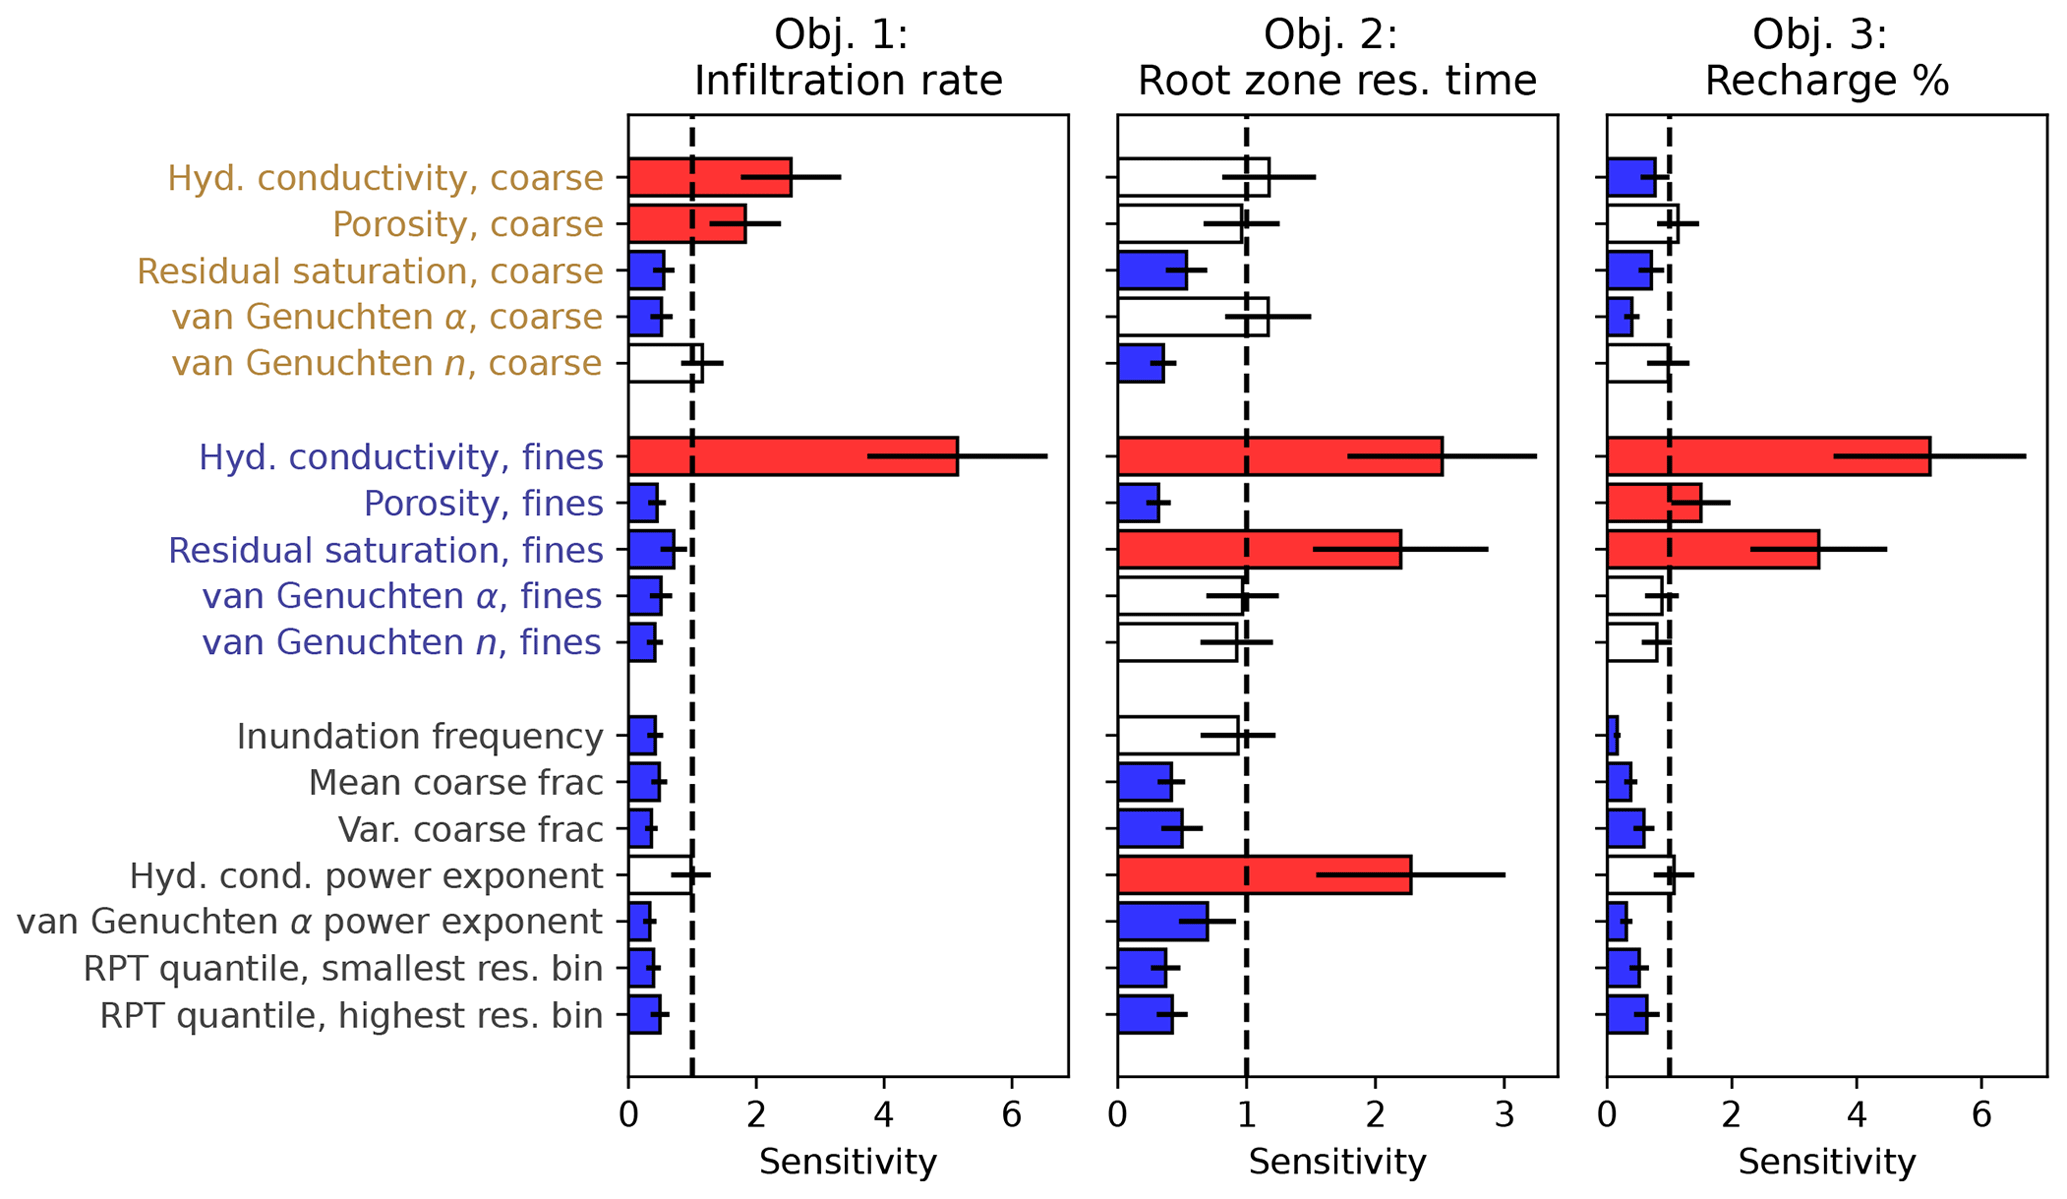
Figure 9Results of distance-based generalized sensitivity analysis (DGSA) for three outcomes of interest. Parameters are grouped according to whether they describe coarse facies (yellow labels), describe fine facies (blue labels) or are universal (black labels). Bars are colored according to whether a parameter is influential (red, sensitivity metric > 1), insignificant (blue, sensitivity metric < 1) or in between (white, sensitivity metric confidence interval includes 1). The principal component scores on coarse fraction for each simulation were included as additional parameters in DGSA but are not shown here as none are influential.
Managed aquifer recharge is an essential management tool for combating groundwater depletion within overdrafted groundwater basins (Alam et al., 2020), but successful implementation requires selecting a suitable recharge site. The results presented here demonstrate a workflow for performing detailed recharge site evaluation using geophysical data and hydrologic modeling. Results also highlight key subsurface processes that can either inhibit or facilitate recharge. Previous work has shown that subsurface heterogeneity often determines the efficiency of a recharge site (Maples et al., 2019). Many of the results herein support these findings, while furthering the discussion by identifying additional important processes that can limit recharge.
5.1 Outcomes of interest
As expected, maps of infiltration rate and root zone residence time align closely with maps of sediment texture, with coarser sediments yielding higher infiltration rates and shorter periods of saturation. Average infiltration rates are comparable to those measured during flood-MAR in the Central Valley (Bachand et al., 2014; Ganot and Dahlke, 2021) and are within the range of values suitable for surface spreading sites (Bouwer, 2002), implying that infiltration rate is unlikely to be a limiting factor at this site. Infiltration rate results also suggest that coarse facies briefly acted as capillary barriers in a small fraction of simulations (1.8 %), which supports previous work showing that capillary barriers can form during MAR (Sallwey et al., 2018; Russo et al., 2022).
Root zone saturation risk, on the other hand, may discourage flood-MAR implementation, given that 9 % of the orchard is >20 % likely to remain saturated long enough to decrease crop yields. Given the high annual revenue (USD 3800–7900 per acre per year) and narrow profit margins of most almond orchards (USDA, 2022), even a small amount of crop risk represents a large financial risk to growers. Quantifying this risk (e.g., Fig. 4) allows water managers to appropriately incentivize farmers to implement flood-MAR. Moreover, growers can use risk maps to develop an implementation strategy, enabling them to compare the cost of constructing additional earthen levees to isolate inundation to low-risk zones with the corresponding decrease in crop risk.
Importantly, the correlation between sediment type and both infiltration rate and root zone saturation implies that these two outcomes of interest can be approximated directly from coarse-fraction data, as long as precise estimates are not required. In our simulations, cells with coarse fraction < 0.6 are 8.7 times more likely to experience extended root zone saturation and have infiltration rates 4.7 times lower than cells with coarse fraction > 0.6. Given these statistics, this coarse-fraction threshold could be used to identify areas with high infiltration rates and low saturation risk, limiting the need for hydrologic modeling. It is important, however, to select a threshold coarse fraction rather than a threshold resistivity value because resistivity–lithology relationships differ from site to site (Knight et al., 2018).
While the relationship between sediment texture and infiltration rate is relatively straightforward, the influence of sediment texture on saturated-zone recharge efficiency is more nuanced. In the short term, the recharge-induced pressure pulse moves most rapidly through coarse facies, which agrees with previous work (e.g., Maples et al., 2019). However, over the long term, fine-grained sediments within the vadose zone absorb a large fraction of recharge water. This trapping of water limits saturated-zone recharge efficiency, as fine facies between the bottom of the root zone and the water table can take years to drain (Fig. 8). In the meantime, water within these sediments is inaccessible to either plants or pumping wells. In addition, though the pressure pulse initially moves downward through coarse facies, the subsequent redistribution of pressure occurs in three dimensions. This implies that, even if inundation is restricted to coarse-grained sediments, adjacent fine-grained facies may limit recharge by drawing pressure (and water) laterally away from interconnected, coarse-grained flow paths.
5.2 Global sensitivity analyses
Global sensitivity analyses further highlight the importance of capillary trapping of water in fine-grained sediments. Saturated-zone recharge efficiency is most sensitive to changes in residual saturation, porosity and hydraulic conductivity of the fine facies – parameters that control how much water fine-grained sediments retain (residual saturation and porosity) and how quickly they drain (hydraulic conductivity). The large uncertainty on these three metrics (Table 1) combines to produce large overall uncertainty on recharge efficiency (Fig. 7).
Across all three outcomes of interest, DGSA results show that parameters that describe fine-grained sediments are more influential than those that describe the coarse deposits (Fig. 9). The prior uncertainty of parameters that describe fine facies is often greater than that of those that describe coarse facies (Table 1), which may contribute to this difference in model sensitivity. However, the difference in prior uncertainty between coarse and fine facies is not unique to our field site; in general, fine-grained sediments can exhibit a wider range of porosity and hydraulic conductivity values than coarse sediments (Freeze and Cherry, 1979). This phenomenon is exacerbated by the fact that fine-grained sediments are poorly characterized in well logs (Faunt et al., 2010) and by pumping tests (Neuman and Witherspoon, 1972). In addition, these results highlight an important nuance in recharge site evaluation; sites with a higher percentage of coarse deposits will typically have higher recharge efficiency, but the properties of the fine-grained sediments control uncertainty on expected recharge efficiency at an individual site. Thus, future site evaluation efforts should focus on identifying sites with a high proportion of coarse-grained material and characterizing the fine-grained facies at those sites. More specifically, measuring the hydraulic conductivity, porosity and residual saturation (or antecedent water content) of fine-grained sediments will reduce uncertainty on projected recharge efficiency. Fine-grained facies with low porosity and high antecedent water content will not be able to trap as much recharge water, leading to higher recharge efficiency.
DGSA results also show that none of the three outcomes of interest are sensitive to inundation frequency. This insensitivity arises because successive inundation events stack on top of one another and reach the water table as one cohesive pulse (Fig. 5). Water managers use a complex list of criteria when allocating surface water for MAR (Alam et al., 2020); this result helps simplify that list by allaying concerns over applying inundation at an ideal recurrence interval. However, inundation frequency may impact other flood-MAR concerns not described here, such as nitrate leaching from the root zone (Murphy et al., 2021; Waterhouse et al., 2021). Moreover, the large uncertainty on other parameters in the sensitivity analysis (Table 1) may dilute variability due to inundation frequency. In other words, inundation frequency may impact root zone residence time, but uncertainty on other parameters (e.g., hydraulic conductivity of the fine-grained sediments) contributes more strongly to the observed variability in each outcome of interest at this site.
Model output is also insensitive to parameters describing spatial uncertainty, which implies that the line spacing of this tTEM survey is dense enough that interpolation between lines does not impact modeling results. In addition, the similarity in the standard deviation of coarse fraction (Fig. S6) between the orchard (6.8 m tTEM line spacing) and the adjacent field (25–40 m line spacing) implies that future surveys can use a coarser line spacing, which will speed up data acquisition and reduce costs.
5.3 Importance of appropriately defining recharge
The retention of water in fine-grained vadose-zone sediments highlights the importance of choosing an appropriate metric for evaluating recharge sites. One popular statistic is the infiltration rate minus the evapotranspiration rate – an approximation of deep percolation. However, this metric counts increases in both vadose-zone storage and saturated-zone storage as recharge, even though the goals of most MAR projects – limiting water table decline, preventing land subsidence and increasing saturated-zone storage (Morrell, 2014) – predominantly relate to the saturated zone. The difference between the two metrics is significant; our simulation results show that median deep-percolation efficiency is 88.3 % after 14 d, while median saturated-zone recharge efficiency is only 32.7 % after 2 years.
While water below the root zone will likely reach the water table, the time that it takes to do so is important. For example, in California, USA, the Sustainable Groundwater Management Act requires groundwater agencies to implement plans to mitigate groundwater overdraft and avoid undesirable consequences of overpumping by 2034 (Morrell, 2014). In addition, the negative effects of groundwater overdraft (e.g., subsidence) will continue to occur until the recharge pressure pulse reaches the saturated zone. Accurately quantifying saturated-zone recharge rates allows water managers to make an informed decision on whether to perform flood-MAR at a site or to use a different MAR technique with a more immediate impact, such as recharge through injection wells. Because two sites could have similar deep-percolation rates but different saturated-zone recharge rates, flood-MAR site evaluation should strive to quantify saturated-zone recharge when possible. We recognize, however, that calculating this metric at the field scale can be difficult and that other recharge metrics are still valuable in some instances, given their simplicity. Finally, the extent of capillary trapping of recharge water in fine-grained sediments likely decreases with successive recharge events. Future work should strive to quantify the increase in saturated-zone recharge efficiency with repeat inundation events over successive years.
While modeling results are promising, we acknowledge several limitations of our approach. First, we generate all coarse-fraction realizations using a single inversion of the tTEM signal, even though the inversion process is nonunique. To account for this uncertainty, future work could use multiple, equally probable inverted resistivity models (Fig. 3a) as conditioning data for sequential Gaussian simulation. Second, CPT locations were chosen so as to sample a wide range of resistivity values, but all cone penetration tests hit refusal before reaching the water table. The lack of lithology data from the saturated zone may represent additional uncertainty in the resistivity–lithology transform. However, the range of resistivity values observed in overlapping CPT and tTEM profiles encompasses 97 % of all resistivity values in the tTEM resistivity model, so we do not believe this uncertainty is appreciable. Moreover, the large-scale aquifer structures in our coarse-fraction realizations agree with nearby well logs (Mid-Kaweah GSA, 2019) as well as with hydrostratigraphic sections derived from an airborne electromagnetic survey line over the site (Knight et al., 2018). Third, the tTEM unit is unable to capture decimeter-scale heterogeneity within the root zone that may impact infiltration rates. Detailed site investigations could combine a tTEM survey with a high-resolution soil survey to fully describe soil heterogeneity within the root zone.
In addition, model parameterization relies on the assumption that there are only two end-member sediment types at the site (coarse and fine) and that each cell is a mix of the two end-members. In reality, CPT logs show heterogeneity within each end-member, especially among sediments classified as fine grained (Fig. S2). We account for some of the uncertainty in this assumption by varying end-member hydrologic parameters between each simulation. Future work could improve upon our workflow by varying parameters within blocks of sediment classified as 100 % fine grained or 100 % coarse grained.
Finally, our implementation of falling-head infiltration within ParFlow is a simplification of true flood-MAR operations. We assume that water is instantaneously and equally redistributed over the orchard between one time step and the next. While this assumption is likely valid with larger ponding depths and greater time steps, it may exaggerate the extent of preferential infiltration towards the end of inundation; in reality, surface roughness and microtopography restrict the redistribution of surface water, especially as ponding depth decreases. Moreover, the ponding head in simulations with a single 0.8 m inundation event may overestimate infiltration rates during true flood-MAR operations. Rather than performing a falling-head infiltration with high initial ponding head, many flood-MAR projects will perform a constant-head infiltration with lower initial ponding head (e.g., allowing 0.7 m of water to infiltrate under a constant head of 0.1 m, followed by 0.1 m falling head for a 0.8 m recharge event).
This paper explores recharge processes during managed aquifer recharge (MAR) through a highly heterogeneous vadose zone typical of many alluvial sedimentary systems. We present a geostatistical and hydrologic modeling workflow for evaluating three outcomes of interest – infiltration rate at the surface, residence time of water in the root zone and saturated-zone recharge efficiency – at MAR sites surveyed with geophysical data. We apply the workflow to an almond orchard in the southern Central Valley, California, USA, and use the results to identify key processes to consider when planning a MAR project. Based on our simulation results, we conclude the following.
-
Vadose-zone heterogeneity strongly impacts recharge processes and should be considered when selecting a MAR site. Water infiltrates into the subsurface primarily through coarse-textured sediments, while fine-grained facies accommodate a disproportionately large fraction of the long-term increase in saturated-zone storage.
-
Within the vadose zone, capillary-driven flow traps water in fine-grained sediments following inundation. These sediments take years to drain, limiting recharge to the aquifer. Two years after inundation, the saturation increase in fine-grained sediments below the root zone and above the water table – where water is unavailable to either plants or pumping wells – accounts for an average of 37 % of the water applied at the surface. Importantly, this process occurs in three dimensions, implying that even if inundation is limited to coarse sediments, fine facies may still pull water away from coarse flow paths.
-
Because vadose-zone processes can limit recharge, care needs to be taken when selecting a metric for evaluating recharge sites. When the goals of a MAR project focus on changes in the saturated zone, researchers should evaluate sites using metrics that directly quantify changes in saturated-zone storage.
-
Model output is more sensitive to changes in parameters that describe fine-grained facies than those that describe coarse-grained facies. Fine-grained sediments are often poorly characterized in hydrogeologic studies; water managers can reduce uncertainty in forecasted MAR outcomes with improved measurements of the hydraulic conductivity, porosity and van Genuchten parameters of fine facies, as well as measurements of their antecedent water content.
-
Altering the frequency of inundation events over a 4-month span (e.g., a single 80 cm flood or sixteen 5 cm floods) did not impact net recharge to the aquifer or the duration of root zone saturation at this site. This result implies that water managers may be able to inundate MAR sites whenever water is available, without worrying about an optimal recurrence interval for inundation. Other factors at a site, like the saturated hydraulic conductivity of the fine-grained sediments, are stronger determinants of MAR outcomes.
All simulations were performed with ParFlow–CLM v3.10.0 (https://doi.org/10.5281/zenodo.6413322; Smith et al., 2020). The model input, selected raw model output, processed model output and software code are available to the public via the Stanford Digital Repository (https://doi.org/10.25740/hj302gv2126; Perzan et al., 2023).
The supplement related to this article is available online at: https://doi.org/10.5194/hess-27-969-2023-supplement.
ZP: conceptualization, methodology, formal analysis, software, visualization and writing (original draft); GO: data curation, methodology, software and writing (review and editing); KM: conceptualization, methodology, funding acquisition and writing (review and editing).
The contact author has declared that none of the authors has any competing interests.
Publisher's note: Copernicus Publications remains neutral with regard to jurisdictional claims in published maps and institutional affiliations.
We would like to thank Aaron Fukuda of the Tulare Irrigation District for input on the primary outcomes of interest, Meredith Goebel and Rosemary Knight of Stanford University for feedback on the resistivity–lithology transform, and Stanford University and the Stanford Research Computing Center for providing computational resources and support that contributed to these research results.
This research has been supported by the Division of Graduate Education (grant no. 1656518), the Office of the Vice Provost for Graduate Education, Stanford University (Lieberman), and the Stanford Woods Institute for the Environment (REIP).
This paper was edited by Brian Berkowitz and reviewed by two anonymous referees.
Ajami, H., McCabe, M. F., Evans, J. P., and Stisen, S.: Assessing the impact of model spin-up on surface water-groundwater interactions using an integrated hydrologic model, Water Resour. Res., 50, 2636–2656, https://doi.org/10.1002/2013WR014258, 2014. a
Alam, S., Gebremichael, M., Li, R., Dozier, J., and Lettenmaier, D. P.: Can Managed Aquifer Recharge Mitigate the Groundwater Overdraft in California's Central Valley?, Water Resour. Res., 56, e2020WR027244, https://doi.org/10.1029/2020WR027244, 2020. a, b, c, d
Andreu, L., Hopmans, J., and Schwankl, L.: Spatial and temporal distribution of soil water balance for a drip-irrigated almond tree, Agr. Water Manage., 35, 123–146, https://doi.org/10.1016/S0378-3774(97)00018-8, 1997. a
Ashby, S. F. and Falgout, R. D.: A Parallel Multigrid Preconditioned Conjugate Gradient Algorithm for Groundwater Flow Simulations, Nucl. Sci. Eng., 124, 145–159, https://doi.org/10.13182/NSE96-A24230, 1996. a
Auken, E., Christiansen, A. V., Kirkegaard, C., Fiandaca, G., Schamper, C., Behroozmand, A. A., Binley, A., Nielsen, E., Effersø, F., Christensen, N. B., Sørensen, K., Foged, N., and Vignoli, G.: An overview of a highly versatile forward and stable inverse algorithm for airborne, ground-based and borehole electromagnetic and electric data, Explor. Geophys., 46, 223–235, https://doi.org/10.1071/EG13097, 2015. a
Bachand, P. A. M., Roy, S. B., Choperena, J., Cameron, D., and Horwath, W. R.: Implications of Using On-Farm Flood Flow Capture To Recharge Groundwater and Mitigate Flood Risks Along the Kings River, CA, Environ. Sci. Technol., 48, 13601–13609, https://doi.org/10.1021/es501115c, 2014. a, b, c, d
Bachand, S., Hossner, R., and Bachand, P.: Effects on soil hydrology and salinity, and potential implications on soil oxygen, Final 2017 OFR Comprehensive Report no. 38, Bachand & Associates, 1–39, https://northkingsgsa.org/documents/2017-demo-site-monitoring-and-analyses-effects-on-soil (last access: 23 February 2023), 2019. a
Bahar, T., Oxarango, L., Castebrunet, H., Rossier, Y., and Mermillod-Blondin, F.: 3D modelling of solute transport and mixing during managed aquifer recharge with an infiltration basin, J. Contam. Hydrol., 237, 103758, https://doi.org/10.1016/j.jconhyd.2020.103758, 2021. a, b
Behroozmand, A. A., Auken, E., and Knight, R.: Assessment of Managed Aquifer Recharge Sites Using a New Geophysical Imaging Method, Vadose Zone J., 18, 1–13, https://doi.org/10.2136/vzj2018.10.0184, 2019. a, b
Belitz, K. and Phillips, S. P.: Alternative to Agricultural Drains in California's San Joaquin Valley: Results of a Regional-Scale Hydrogeologic Approach, Water Resour. Res., 31, 1845–1862, https://doi.org/10.1029/95WR01328, 1995. a, b
Bertoldi, G., Johnston, R., and Evenson, K.: Ground water in the Central Valley, California – A summary report, US Geological Survey Professional Paper 1401-A, US Geological Survey, Washington, DC, https://doi.org/10.3133/pp1401A 1991. a
Bierkens, M. F. P. and Wada, Y.: Non-renewable groundwater use and groundwater depletion: a review, Environ. Res. Lett., 14, 063002, https://doi.org/10.1088/1748-9326/ab1a5f, 2019. a
Botros, F. E., Harter, T., Onsoy, Y. S., Tuli, A., and Hopmans, J. W.: Spatial Variability of Hydraulic Properties and Sediment Characteristics in a Deep Alluvial Unsaturated Zone, Vadose Zone J., 8, 276–289, https://doi.org/10.2136/vzj2008.0087, 2009. a, b, c
Bouwer, H.: Artificial recharge of groundwater: hydrogeology and engineering, Hydrogeol. J., 10, 121–142, https://doi.org/10.1007/s10040-001-0182-4, 2002. a, b, c
Brevik, E. C., Fenton, T. E., and Jaynes, D. B.: Evaluation of the Accuracy of a Central Iowa Soil Survey and Implications for Precision Soil Management, Precis. Agricult., 4, 331–342, https://doi.org/10.1023/A:1024960708561, 2003. a
CA DWR: California Water Plan: Update 2018, Tech. ep., California Department of Water Resources, Sacramento, CA, https://water.ca.gov/programs/california-water-plan/update-2018 (last access: 23 February 2023), 2018a. a
CA DWR: Flood-MAR: Using Flood Water for Managed Aquifer Recharge to Support Sustainable Water Resources, Tech. rep., California Department of Water Resources, Sacramento, CA, https://water.ca.gov/programs/all-programs/flood-mar (last access: 23 February 2023), 2018b. a
CA DWR: Flood-MAR research and data development plan, Tech. rep., California Department of Water Resources, Sacramento, CA, https://water.ca.gov/programs/all-programs/flood-mar (last access: 23 February 2023), 2019. a
Christiansen, A. V. and Auken, E.: A global measure for depth of investigation, Geophysics, 77, 171–177, https://doi.org/10.1190/geo2011-0393.1, 2012. a
Dahlke, H. E., Brown, A. G., Orloff, S., Putnam, D., and O'Geen, T.: Managed winter flooding of alfalfa recharges groundwater with minimal crop damage, California Agricult., 72, 1–11, https://doi.org/10.3733/ca.2018a0001, 2018. a
Dai, Y., Zeng, X., Dickinson, R. E., Baker, I., Bonan, G. B., Bosilovich, M. G., Denning, A. S., Dirmeyer, P. A., Houser, P. R., Niu, G., Oleson, K. W., Schlosser, C. A., and Yang, Z. L.: The common land model, B. Am. Meteorol. Soc., 84, 1013–1023, https://doi.org/10.1175/BAMS-84-8-1013, 2003. a
Dettinger, M. D., Ralph, F. M., Das, T., Neiman, P. J., and Cayan, D. R.: Atmospheric Rivers, Floods and the Water Resources of California, Water, 3, 445–478, https://doi.org/10.3390/w3020445, 2011. a
Doll, D. and Shackel, K.: Drought Tip: Drought Management for California Almonds, ANR Publication 8515, University of California, Agriculture and Natural Resources, https://doi.org/10.3733/ucanr.8515, 2015. a, b
Drew, M. C. and Lynch, J. M.: Soil Anaerobiosis, Microorganisms, and Root Function, Annu. Re. Phytopathol., 18, 37–66, https://doi.org/10.1146/annurev.py.18.090180.000345, 1980. a
Fakhreddine, S., Prommer, H., Scanlon, B. R., Ying, S. C., and Nicot, J.-P.: Mobilization of Arsenic and Other Naturally Occurring Contaminants during Managed Aquifer Recharge: A Critical Review, Environ. Sci. Technol., 55, 2208–2223, https://doi.org/10.1021/acs.est.0c07492, 2021. a
Faunt, C. C. (Ed.): Groundwater availability of the Central Valley Aquifer, California, no. 1766 in Professional paper/US Geological Survey, US Geological Survey, Reston, VA, ISBN 978-1-4113-2515-9, https://pubs.usgs.gov/pp/1766/ (last access: 23 February 2023), 2009. a, b, c, d, e
Faunt, C. C., Belitz, K., and Hanson, R. T.: Development of a three-dimensional model of sedimentary texture in valley-fill deposits of Central Valley, California, USA, Hydrogeol. J., 18, 625–649, https://doi.org/10.1007/s10040-009-0539-7, 2010. a
Fenwick, D., Scheidt, C., and Caers, J.: Quantifying Asymmetric Parameter Interactions in Sensitivity Analysis: Application to Reservoir Modeling, Math. Geosci., 46, 493–511, https://doi.org/10.1007/s11004-014-9530-5, 2014. a
Fichtner, T., Barquero, F., Sallwey, J., and Stefan, C.: Assessing Managed Aquifer Recharge Processes under Three Physical Model Concepts, Water, 11, 107, https://doi.org/10.3390/w11010107, 2019. a
Fogg, G. E., Carle, S. F., and Green, C.: Connected-network paradigm for the alluvial aquifer system, in: Theory, modeling, and field investigation in hydrogeology: a special volume in honor of Shlomo P, Neumans 60th birthday, edited by: Zhang, D. and Winter, C. L., no. 348 in Geological Society of America Special Paper, Geological Society of America, Boulder, Colorado, 25–42, https://doi.org/10.1130/0-8137-2348-5.25, 2000. a, b
Freeze, R. A. and Cherry, J. A.: Groundwater, Prentice-Hall, ISBN 978-0-13-365312-0, 1979. a, b, c
Ganot, Y. and Dahlke, H. E.: Natural and forced soil aeration during agricultural managed aquifer recharge, Vadose Zone J., 20, e20128, https://doi.org/10.1002/vzj2.20128, 2021. a, b, c, d
Ganot, Y., Holtzman, R., Weisbrod, N., Bernstein, A., Siebner, H., Katz, Y., and Kurtzman, D.: Managed aquifer recharge with reverse-osmosis desalinated seawater: modeling the spreading in groundwater using stable water isotopes, Hydrol. Earth Syst. Sci., 22, 6323–6333, https://doi.org/10.5194/hess-22-6323-2018, 2018. a, b
Goebel, M. and Knight, R.: Recharge site assessment through the integration of surface geophysics and cone penetrometer testing, Vadose Zone J., 20, e20131, https://doi.org/10.1002/vzj2.20131, 2021. a, b, c, d
Gottschalk, I. P., Hermans, T., Knight, R., Caers, J., Cameron, D. A., Regnery, J., and McCray, J. E.: Integrating non-colocated well and geophysical data to capture subsurface heterogeneity at an aquifer recharge and recovery site, J. Hydrol., 555, 407–419, https://doi.org/10.1016/j.jhydrol.2017.10.028, 2017. a
Gribb, M. M., Šimůnek, J., and Leonard, M. F.: Development of Cone Penetrometer Method to Determine Soil Hydraulic Properties, J. Geotech. Geoenviron. Eng., 124, 820–829, https://doi.org/10.1061/(ASCE)1090-0241(1998)124:9(820), 1998. a
Haines, S. S., Pidlisecky, A., and Knight, R.: Hydrogeologic structure underlying a recharge pond delineated with shear‐wave seismic reflection and cone penetrometer data, Near Surf. Geophys., 7, 329–340, https://doi.org/10.3997/1873-0604.2009036, 2009. a
Harrington, G. A., Gardner, W. P., and Munday, T. J.: Tracking Groundwater Discharge to a Large River using Tracers and Geophysics, Groundwater, 52, 837–852, https://doi.org/10.1111/gwat.12124, 2014. a
He, X., Bryant, B. P., Moran, T., Mach, K. J., Wei, Z., and Freyberg, D. L.: Climate-informed hydrologic modeling and policy typology to guide managed aquifer recharge, Sci. Adv., 7, eabe6025, https://doi.org/10.1126/sciadv.abe6025, 2021. a
Heilweil, V. M., Benoit, J., and Healy, R. W.: Variably saturated groundwater modelling for optimizing managed aquifer recharge using trench infiltration: Variably saturated modelling for optimizing trench infiltration, Hydrol. Process., 29, 3010–3019, https://doi.org/10.1002/hyp.10413, 2015. a
Hermans, T., Nguyen, F., Klepikova, M., Dassargues, A., and Caers, J.: Uncertainty Quantification of Medium-Term Heat Storage From Short-Term Geophysical Experiments Using Bayesian Evidential Learning, Water Resour. Res., 54, 2931–2948, https://doi.org/10.1002/2017WR022135, 2018. a
Hoffmann, R., Dassargues, A., Goderniaux, P., and Hermans, T.: Heterogeneity and Prior Uncertainty Investigation Using a Joint Heat and Solute Tracer Experiment in Alluvial Sediments, Front. Earth Sci., 7, 108, https://doi.org/10.3389/feart.2019.00108, 2019. a
Idelovitch, E. and Michail, M.: Soil-Aquifer Treatment: A New Approach to an Old Method of Wastewater Reuse, J. Water Pollut. Control Federat., 56, 936–943, 1984. a
Johnson, A. I., Moston, R. P., and Morris, D. A.: Physical and hydrologic properties of water-bearing deposits in subsiding areas in central California, US Geological Survey Professional Paper 497-A, US Geological Survey, Washington, DC, https://doi.org/10.3133/pp497A, 1968. a
Jones, J. E. and Woodward, C. S.: Newton–Krylov-multigrid solvers for large-scale, highly heterogeneous, variably saturated flow problems, Adv. Water Resour., 24, 763–774, https://doi.org/10.1016/S0309-1708(00)00075-0, 2001. a
Knight, R., Smith, R., Asch, T., Abraham, J., Cannia, J., Viezzoli, A., and Fogg, G.: Mapping Aquifer Systems with Airborne Electromagnetics in the Central Valley of California, Groundwater, 56, 893–908, https://doi.org/10.1111/gwat.12656, 2018. a, b, c, d, e, f
Knight, R. J. and Endres, A. L.: An Introduction to Rock Physics Principles for Near-Surface Geophysics, in: Near-Surface Geophysics, Investigations in Geophysics, Society of Exploration Geophysicists, 31–70, https://doi.org/10.1190/1.9781560801719.ch3, 2005. a, b
Kocis, T. N. and Dahlke, H. E.: Availability of high-magnitude streamflow for groundwater banking in the Central Valley, California, Environ. Res. Lett., 12, 084009, https://doi.org/10.1088/1748-9326/aa7b1b, 2017. a
Kollet, S. J. and Maxwell, R. M.: Integrated surface–groundwater flow modeling: A free-surface overland flow boundary condition in a parallel groundwater flow model, Adv. Water Resour., 29, 945–958, https://doi.org/10.1016/j.advwatres.2005.08.006, 2006. a, b
Kollet, S. J. and Maxwell, R. M.: Capturing the influence of groundwater dynamics on land surface processes using an integrated, distributed watershed model, Water Resour. Res., 44, W02402, https://doi.org/10.1029/2007WR006004, 2008. a
Koumanov, K. S., Hopmans, J. W., and Schwankl, L. W.: Spatial and temporal distribution of root water uptake of an almond tree under microsprinkler irrigation, Irrig. Sci., 24, 267–278, https://doi.org/10.1007/s00271-005-0027-3, 2006. a
Kozlowski, T. T.: Responses of woody plants to flooding and salinity, Tree Physiol., 17, 490, https://doi.org/10.1093/treephys/17.7.490, 1997. a
Levintal, E., Kniffin, M. L., Ganot, Y., Marwaha, N., Murphy, N. P., and Dahlke, H. E.: Agricultural managed aquifer recharge (Ag-MAR) – a method for sustainable groundwater management: A review, Crit. Rev. Environ. Sci. Technol., 53, 291–314, https://doi.org/10.1080/10643389.2022.2050160, 2023. a, b
Lunne, T., Powell, J. J. M., and Robertson, P. K.: Cone Penetration Testing in Geotechnical Practice, CRC Press, London, UK, https://doi.org/10.1007/s11204-010-9072-x, 1997. a, b
Ma, X., Dahlke, H., Duncan, R., Doll, D., Martinez, P., Lampinen, B., and Volder, A.: Winter flooding recharges groundwater in almond orchards with limited effects on root dynamics and yield, California Agriculture, 0008-0845, 1–7, https://doi.org/10.3733/ca.2022a0008, 2022. a
Maliva, R. G., Clayton, E. A., and Missimer, T. M.: Application of advanced borehole geophysical logging to managed aquifer recharge investigations, Hydrogeol. J., 17, 1547–1556, https://doi.org/10.1007/s10040-009-0437-z, 2009. a
Maliva, R. G., Herrmann, R., Coulibaly, K., and Guo, W.: Advanced aquifer characterization for optimization of managed aquifer recharge, Environ. Earth Sci., 73, 7759–7767, https://doi.org/10.1007/s12665-014-3167-z, 2015. a
Maples, S. R., Fogg, G. E., and Maxwell, R. M.: Modeling managed aquifer recharge processes in a highly heterogeneous, semi-confined aquifer system, Hydrogeol. J., 27, 2869–2888, https://doi.org/10.1007/s10040-019-02033-9, 2019. a, b, c, d, e, f, g, h, i
Maples, S. R., Foglia, L., Fogg, G. E., and Maxwell, R. M.: Sensitivity of hydrologic and geologic parameters on recharge processes in a highly heterogeneous, semi-confined aquifer system, Hydrol. Earth Syst. Sci., 24, 2437–2456, https://doi.org/10.5194/hess-24-2437-2020, 2020. a
Marwaha, N., Kourakos, G., Levintal, E., and Dahlke, H. E.: Identifying Agricultural Managed Aquifer Recharge Locations to Benefit Drinking Water Supply in Rural Communities, Water Resour. Res., 57, e2020WR028811, https://doi.org/10.1029/2020WR028811, 2021. a
Maxwell, R. M. and Miller, N. L.: Development of a Coupled Land Surface and Groundwater Model, J. Hydrometeorol., 6, 233–247, https://doi.org/10.1175/JHM422.1, 2005. a
Mid-Kaweah GSA: Groundwater Sustainability Plan, Groundwater Sustainability Plan, Mid-Kaweah Groundwater Sustainability Agency, Tulare, CA, https://www.midkaweah.org/_files/ugd/55be79_0dd4bb3a882641efa526ccc63e4c07a0.pdf (last access: 23 February 2023), 2019. a, b, c, d, e, f, g
Møller, I., Søndergaard, V. H., Jørgensen, F., Auken, E., and Christiansen, A. V.: Integrated management and utilization of hydrogeophysical data on a national scale, Near Surf. Geophys., 7, 647–659, https://doi.org/10.3997/1873-0604.2009031, 2009. a
Morrell, M.: Sustainable Groundwater Management Act, http://www.leginfo.ca.gov/pub/13-14/bill/sen/sb_1151-1200/sb_1168_bill_20140822_amended_asm_v92.html (last access: 23 February 2023), 2014. a, b, c
Murphy, N. P., Waterhouse, H., and Dahlke, H. E.: Influence of agricultural managed aquifer recharge on nitrate transport: The role of soil texture and flooding frequency, Vadose Zone J., 20, e20150, https://doi.org/10.1002/vzj2.20150, 2021. a, b, c
Neuman, S. P. and Witherspoon, P. A.: Field determination of the hydraulic properties of leaky multiple aquifer systems, Water Resour. Res., 8, 1284–1298, https://doi.org/10.1029/WR008i005p01284, 1972. a
Niswonger, R. G., Morway, E. D., Triana, E., and Huntington, J. L.: Managed aquifer recharge through off-season irrigation in agricultural regions: Managed aquifer recharge in agriculture, Water Resour. Res., 53, 6970–6992, https://doi.org/10.1002/2017WR020458, 2017. a
O'Geen, A., Saal, M., Dahlke, H., Doll, D., Elkins, R., Fulton, A., Fogg, G., Harter, T., Hopmans, J. W., Ingels, C., Niederholzer, F., Solis, S. S., Verdegaal, P., and Walkinshaw, M.: Soil suitability index identifies potential areas for groundwater banking on agricultural lands, California Agricult., 69, 75–84, https://doi.org/10.3733/ca.v069n02p75, 2015. a, b, c, d
O'Leary, D. R., Izbicki, J. A., Moran, J. E., Meeth, T., Nakagawa, B., Metzger, L., Bonds, C., and Singleton, M. J.: Movement of Water Infiltrated from a Recharge Basin to Wells, Ground Water, 50, 242–255, https://doi.org/10.1111/j.1745-6584.2011.00838.x, 2012. a, b
Park, J., Yang, G., Satija, A., Scheidt, C., and Caers, J.: DGSA: A Matlab toolbox for distance-based generalized sensitivity analysis of geoscientific computer experiments, Comput. Geosci., 97, 15–29, https://doi.org/10.1016/j.cageo.2016.08.021, 2016. a
Parker, T. K., Jansen, J., Behroozmand, A., Halkjaer, M., and Thorn, P.: Applied Geophysics for Managed Aquifer Recharge, Groundwater, 60, 606–618, https://doi.org/10.1111/gwat.13235, 2022. a
Pepin, K., Knight, R., Goebel‐Szenher, M., and Kang, S.: Managed aquifer recharge site assessment with electromagnetic imaging: Identification of recharge flow paths, Vadose Zone J., 21, e20192, https://doi.org/10.1002/vzj2.20192, 2022. a
Perzan, Z., Babey, T., Caers, J., Bargar, J. R., and Maher, K.: Loca and Global Sensitivity Analysis of a Reactive Transport Model Simulating Floodplain Redox Cycling, Water Resour. Res., 57, e2021WR029723, https://doi.org/10.1029/2021WR029723, 2021. a
Perzan, Z., Osterman, G., and Maher, K.: Data-model files associated with the manuscript “Controls on flood managed aquifer recharge through a heterogeneous vadose zone”, Stanford Digital Repository [data set], https://doi.org/10.25740/hj302gv2126, 2023. a
Phillips, S. P. and Belitz, K.: Calibration of a Texture-Based Model of a Ground-Water Flow System, Western San Joaquin Valley, California, Groundwater, 29, 702–715, https://doi.org/10.1111/j.1745-6584.1991.tb00562.x, 1991. a
Podgorski, J. E., Auken, E., Schamper, C., Vest Christiansen, A., Kalscheuer, T., and Green, A. G.: Processing and inversion of commercial helicopter time-domain electromagnetic data for environmental assessments and geologic and hydrologic mapping, Geophysics, 78, E149–E159, https://doi.org/10.1190/geo2012-0452.1, 2013. a
Qi, C. and Zhan, H.: Soil Property and Subsurface Heterogeneity Control on Groundwater Recharge of Vadose Zone Injection Wells, J. Hydrol. Eng., 27, 04021052, https://doi.org/10.1061/(ASCE)HE.1943-5584.0002158, 2022. a
Rahman, M. A., Rusteberg, B., Gogu, R., Lobo Ferreira, J., and Sauter, M.: A new spatial multi-criteria decision support tool for site selection for implementation of managed aquifer recharge, J. Environ. Manage., 99, 61–75, https://doi.org/10.1016/j.jenvman.2012.01.003, 2012. a
Ringleb, J., Sallwey, J., and Stefan, C.: Assessment of Managed Aquifer Recharge through Modeling – A Review, Water, 8, 579, https://doi.org/10.3390/w8120579, 2016. a
Robertson, P.: Cone penetration test (CPT)-based soil behaviour type (SBT) classification system – an update, Can. Geotech. J., 53, 1910–1927, https://doi.org/10.1139/cgj-2016-0044, 2016. a
Robertson, P. K.: Interpretation of cone penetration tests – a unified approach, Can. Geotech. J., 46, 1337–1355, https://doi.org/10.1139/T09-065, 2009. a
Robertson, P. K., Sully, J. P., Woeller, D. J., Lunne, T., Powell, J. J. M., and Gillespie, D. G.: Estimating coefficient of consolidation from piezocone tests, Can. Geotech. J., 29, 539–550, 1992. a, b
Rodell, M., Houser, P. R., Jambor, U., Gottschalck, J., Mitchell, K., Meng, C.-J., Arsenault, K., Cosgrove, B., Radakovich, J., Bosilovich, M., Entin, J. K., Walker, J. P., Lohmann, D., and Toll, D.: The Global Land Data Assimilation System, B. Am. Meteorol. Soc., 85, 381–394, https://doi.org/10.1175/BAMS-85-3-381, 2004. a
Rudnik, G., Rabinovich, A., Siebner, H., Katz, Y., and Kurtzman, D.: Exploring Predictive Uncertainty at a Double-Source Managed Aquifer Recharge Site via Stochastic Modeling, Water Resour. Res., 58, e2021WR031241, https://doi.org/10.1029/2021WR031241, 2022. a
Russo, D. and Bouton, M.: Statistical analysis of spatial variability in unsaturated flow parameters, Water Resour. Res., 28, 1911–1925, https://doi.org/10.1029/92WR00669, 1992. a
Russo, D., Kurtzman, D., and Nachshon, U.: Hydraulic Issues Concerning Injection of Harvested Rainwater to the Subsurface Through Drywells: Insight From Numerical Simulations of Flow in a Realistic Combined Vadose Zone-Groundwater Flow System, Water Resour. Res., 58, e2021WR031881, https://doi.org/10.1029/2021WR031881, 2022. a, b, c
Russo, T. A., Fisher, A. T., and Lockwood, B. S.: Assessment of Managed Aquifer Recharge Site Suitability Using a GIS and Modeling, Groundwater, 53, 389–400, https://doi.org/10.1111/gwat.12213, 2015. a, b, c
Sallwey, J., Glass, J., and Stefan, C.: Utilizing unsaturated soil zone models for assessing managed aquifer recharge, Sustain. Water Resour. Manage., 4, 383–397, https://doi.org/10.1007/s40899-018-0214-z, 2018. a, b, c
Saltelli, A., ed.: Global sensitivity analysis: the primer, John Wiley, Chichester, England, Hoboken, NJ, https://doi.org/10.1002/9780470725184, 2008. a
Sattel, D. and Kgotlhang, L.: Groundwater exploration with AEM in the Boteti Area, Botswana, Explo. Geophys., 35, 147–156, https://doi.org/10.1071/EG04147, 2004. a
Scanlon, B. R., Reedy, R. C., Faunt, C. C., Pool, D., and Uhlman, K.: Enhancing drought resilience with conjunctive use and managed aquifer recharge in California and Arizona, Environ. Res. Lett., 11, 049501, https://doi.org/10.1088/1748-9326/11/4/049501, 2016. a
Sendrós, A., Himi, M., Lovera, R., Rivero, L., Garcia-Artigas, R., Urruela, A., and Casas, A.: Geophysical Characterization of Hydraulic Properties around a Managed Aquifer Recharge System over the Llobregat River Alluvial Aquifer (Barcelona Metropolitan Area), Water, 12, 3455, https://doi.org/10.3390/w12123455, 2020a. a
Sendrós, A., Himi, M., Lovera, R., Rivero, L., Garcia‐Artigas, R., Urruela, A., and Casas, A.: Electrical resistivity tomography monitoring of two managed aquifer recharge ponds in the alluvial aquifer of the Llobregat River (Barcelona, Spain), Near Surf. Geophys., 18, 353–368, https://doi.org/10.1002/nsg.12113, 2020b. a
Shen, S.-L., Wang, J.-P., Wu, H.-N., Xu, Y.-S., Ye, G.-L., and Yin, Z.-Y.: Evaluation of hydraulic conductivity for both marine and deltaic deposits based on piezocone testing, Ocean Eng., 110, 174–182, https://doi.org/10.1016/j.oceaneng.2015.10.011, 2015. a
Siemon, B., Christiansen, A. V., and Auken, E.: A review of helicopter‐borne electromagnetic methods for groundwater exploration, Near Surf. Geophys., 7, 629–646, https://doi.org/10.3997/1873-0604.2009043, 2009. a
Smith, S., reedmaxwell, i-ferguson, Engdahl, N., Gasper, F., Avery, P., Chennault, C., Jourdain, S., grapp1, Condon, L., Kulkarni, K., Bansal, V., xy124, Bennett, A., basileh, Thompson, D., Lazzeri Kitware, D., Swilley, J., Beisman, J., alanquits, Coon, E., Bertolacci, I. M. S., Lührs, S., arezaii, aureliayang, and cswoodward: parflow/parflow: ParFlow Version 3.10.0 (v3.10.0), Zenodo [code], https://doi.org/10.5281/zenodo.6413322, 2022. a
United Nations: The United Nations World Water Development Report 2022: Groundwater: Making the invisible visible, UNESCO, Paris, France, ISBN 978-92-3-100507-7, 2022. a
USDA: California Almond Objective Measurement Report, Objective Measurement Report, United States Department of Agriculture, National Agricultural Statistics Service, Sacramento, CA, https://www.almonds.com/sites/default/files/2022-07/2022_ObjectiveReport.pdf (last access: 23 February 2023), 2022. a
van Genuchten, M. T.: A Closed-form Equation for Predicting the Hydraulic Conductivity of Unsaturated Soils, Soil Sci. Soc. Am. J., 44, 892–898, https://doi.org/10.2136/sssaj1980.03615995004400050002x, 1980. a, b
Voyiadjis, G. Z. and Song, C. R.: Determination of Hydraulic Conductivity Using Piezocone Penetration Test, Int. J. Geomech., 3, 217–224, https://doi.org/10.1061/(ASCE)1532-3641(2003)3:2(217), 2003. a
Wackernagel, H.: Multivariate geostatistics, in: 3rd Edn., Springer, Berlin, Heidelberg, ISBN 978-3-540-44142-7, 2003. a
Walsh, D. O., Grunewald, E. D., Turner, P., Hinnell, A., and Ferre, T. P.: Surface NMR instrumentation and methods for detecting and characterizing water in the vadose zone, Near Surf. Geophys., 12, 271–284, https://doi.org/10.3997/1873-0604.2013066, 2014. a
Waterhouse, H., Arora, B., Spycher, N. F., Nico, P. S., Ulrich, C., Dahlke, H. E., and Horwath, W. R.: Influence of Agricultural Managed Aquifer Recharge (AgMAR) and Stratigraphic Heterogeneities on Nitrate Reduction in the Deep Subsurface, Water Resour. Res., 57, e2020WR029148, https://doi.org/10.1029/2020WR029148, 2021. a
Xia, Y., Mitchell, K., Ek, M., Sheffield, J., Cosgrove, B., Wood, E., Luo, L., Alonge, C., Wei, H., Meng, J., Livneh, B., Lettenmaier, D., Koren, V., Duan, Q., Mo, K., Fan, Y., and Mocko, D.: Continental-scale water and energy flux analysis and validation for the North American Land Data Assimilation System project phase 2 (NLDAS-2): 1. Intercomparison and application of model products: Water and energy flux analysis, J. Geophys. Res.-Atmos., 117, D03109, https://doi.org/10.1029/2011JD016048, 2012. a
Zamora, C.: Estimating Water Fluxes Across the Sediment–Water Interface in the Lower Merced River, California, Scientific Investigations Report 2007-5216, US Geological Survey, Reston, VA, https://pubs.usgs.gov/sir/2007/5216/ (last access: 23 February 2023), 2008. a
Zhu, J. and Mohanty, B. P.: Spatial Averaging of van Genuchten Hydraulic Parameters for Steady-State Flow in Heterogeneous Soils: A Numerical Study, Vadose Zone J., 1, 261–272, https://doi.org/10.2136/vzj2002.2610, 2002. a, b