the Creative Commons Attribution 4.0 License.
the Creative Commons Attribution 4.0 License.
 | 02 Feb 2023
Assimilation of transformed water surface elevation to improve river discharge estimation in a continental-scale river
Menaka Revel
Xudong Zhou
Dai Yamazaki
Shinjiro Kanae
Quantifying continental-scale river discharge is essential for understanding the terrestrial water cycle, but it is susceptible to errors caused by a lack of observations and the limitations of hydrodynamic modeling. Data assimilation (DA) methods are increasingly used to estimate river discharge in combination with emerging river-related remote sensing products (e.g., water surface elevation (WSE), water surface slope, river width, and flood extent). However, directly comparing simulated WSE to satellite altimetry data remains challenging (e.g., because of large biases between simulations and observations or uncertainties in parameters), and large errors can be introduced when satellite observations are assimilated into hydrodynamic models. In this study we performed direct, anomaly, and normalized value assimilation experiments to investigate the capacity of DA to improve river discharge within the current limitations of hydrodynamic modeling. We performed hydrological DA using a physically based empirical localization method applied to the Amazon basin. We used satellite altimetry data from ENVISAT, Jason 1, and Jason 2. Direct DA was the baseline assimilation method and was subject to errors due to biases in the simulated WSE. To overcome these errors, we used anomaly DA as an alternative to direct DA. We found that the modeled and observed WSE distributions differed considerably (e.g., differences in amplitude, seasonal flow variation, and a skewed distribution due to limitations of the hydrodynamic models). Therefore, normalized value DA was performed to improve discharge estimation. River discharge estimates were improved at 24 %, 38 %, and 62 % of stream gauges in the direct, anomaly, and normalized value assimilations relative to simulations without DA. Normalized value assimilation performed best for estimating river discharge given the current limitations of hydrodynamic models. Most gauges within the river reaches covered by satellite observations accurately estimated river discharge, with the Nash–Sutcliffe efficiency (NSE) > 0.6. The amplitudes of WSE variation were improved in the normalized DA experiment. Furthermore, in the Amazon basin, normalized assimilation (median NSE =0.50) improved river discharge estimation compared to open-loop simulation with the global hydrodynamic model (median NSE =0.42). River discharge estimation using direct DA methods was improved by 7 % with calibration of river bathymetry based on NSE. The direct DA approach outperformed the other DA approaches when runoff was considerably biased, but anomaly DA performed best when the river bathymetry was erroneous. The uncertainties in hydrodynamic modeling (e.g., river bottom elevation, river width, simplified floodplain dynamics, and the rectangular cross-section assumption) should be improved to fully realize the advantages of river discharge DA through the assimilation of satellite altimetry. This study contributes to the development of a global river discharge reanalysis product that is consistent spatially and temporally.
- Article
(11955 KB) - Full-text XML
-
Supplement
(2675 KB) - BibTeX
- EndNote


River discharge plays a pivotal role in the global water cycle and thereby affects human livelihoods (Oki and Kanae, 2006). River discharge records can be used to assess water resources, biogeochemistry, and the carbon cycle in terrestrial waters, and are the single most important parameter affecting the flow dynamics of rivers (Gleason and Durand, 2020). The ability to measure global river discharge via in situ gauging is limited by a lack of accurate, complete, and freely available data (Hannah et al., 2011; Shiklomanov et al., 2002; Vörösmarty et al., 2001). Because of the limited temporal coverage and spatial heterogeneity of in situ gauging networks, elucidating the terrestrial water cycle is essential.
As a result of recent computational advances, global hydrodynamic models (GHMs) have been used extensively to study the terrestrial water cycle (Döll et al., 2016; Sood and Smakhtin, 2015). Simulated water dynamics obtained from GHMs are used to complement unavailable ground observations. GHMs simulate water dynamics in discretized river segments to increase computational efficiency. Nevertheless, they are subject to numerous limitations, including simplified model structures, imperfect external forcing, and uncertainties in model parameters (Liu and Gupta, 2007; Renard et al., 2010). These inadequacies are due to both a lack of information about physical processes and simplifications made to limit computational costs. There are considerable uncertainties in model parameters such as river bottom elevation due to a lack of measurements or limitations of estimation methods that affect model outputs (Brêda et al., 2019). Uncertainties in the forcing are also partially responsible for uncertainty in the surface water dynamics (Emery et al., 2020c). In combination, these constraints result in unavoidable uncertainties in GHM simulations of water dynamics.
Given the current limitations of GHMs and in situ measurements, satellite altimetry observations provide an alternative method of estimating the surface water dynamics (Feng et al., 2021). Satellite altimetry quantifies the water surface elevation (WSE) by measuring the time required for the electromagnetic (e.g., radar or laser) pulse to travel between the satellite and the water surface. Beginning with GEOS-3 in 1975, numerous satellite altimetry missions have been deployed to obtain measurements of terrestrial water surfaces. Although some of these satellites were developed for other purposes (i.e., observing the sea surface), their application has expanded to include river and lake observations (Birkett et al., 2002; Crétaux et al., 2009; Santos da Silva et al., 2010). Commonly used satellite missions for river observations are ENVISAT, Jason 1, Jason 2, Sentinel 3A, and Sentinel 3B (Bannoura, 2001; Resti et al., 2002; Zwally et al., 2002). The Surface Water and Ocean Topography (SWOT) satellite will provide an unprecedented amount of data for the first time on terrestrial waters (Biancamaria et al., 2016; Fu et al., 2012). The greatest impediment to the use of these satellites is their limited spatial and temporal coverage, which ranges from a few days to several months between successive observations of specific locations. Hence, satellite altimetry observations may not provide a comprehensive view of the terrestrial water cycle because of their spatial and temporal sparseness.
Surface water dynamics can be clarified by combining remote sensing data with a limited amount of observational data in continental-scale hydrodynamic models. Data assimilation (DA) is a mathematical technique that combines a physical model with external observations, accounting for their uncertainties, to improve model outputs or replicate the evaluation of an actual system (Emery et al., 2020a). By leveraging remote sensing data, DA methods can be used to bridge the gap between models and ground observations. DA approaches are widely used in meteorology and oceanography (e.g., Anderson, 2007; Evensen and van Leeuwen, 2002; Miyoshi and Yamane, 2007) and have recently been used in large-scale hydrology (e.g., Clark et al., 2008; Emery et al., 2018; Michailovsky et al., 2013; Paiva et al., 2013a; Revel et al., 2021; Wongchuig et al., 2019). They have also been used to correct hydrodynamic parameters such as river bathymetry (Brêda et al., 2019; Yoon et al., 2012), Manning's coefficient (Emery et al., 2020a; Pedinotti et al., 2014), and floodplain bathymetry and slope (Durand et al., 2008). Emery et al. (2020c) used DA to improve the accuracy of runoff forcing by integrating discharge observations. Using operation system simulation experiments, researchers have thoroughly investigated the potential for improving river discharge through the assimilation of remote sensing data (Andreadis et al., 2007; Andreadis and Schumann, 2014; Biancamaria et al., 2011; Revel et al., 2019, 2021). In situ (Clark et al., 2008; Paiva et al., 2013a; Wongchuig et al., 2019) or remotely sensed (Emery et al., 2020b; Feng et al., 2021; Ishitsuka et al., 2020) discharge assimilation performs better, but the unavailability of ground observations and the limitations of remotely sensed river discharge values may hamper the performance of these DA schemes. Thus, DA approaches based on remotely sensed data can be used to improve the performance of global hydrodynamic models.
Although DA approaches can improve model performance, hydrodynamic models are not yet mature enough to directly assimilate satellite altimetry data (Emery et al., 2020a). Because of ambiguity in digital elevation models (DEMs), flaws in hydraulic parameters (e.g., river bathymetry), and the simplification of cross-section parameters, simulated WSEs may have substantial errors. Several methods have been used to circumvent these limitations when assimilating satellite altimetry into large-scale hydrodynamic models, including assimilating anomalies (i.e., removing the long-term mean WSE) and using a common datum (e.g. Emery et al., 2020a; Michailovsky et al., 2013; Paiva et al., 2013a; Wongchuig-Correa et al., 2020). To improve river discharge estimation in the Brahmaputra River, Michailovsky et al. (2013) assimilated measurements from the ENVISAT satellite into a rainfall-runoff model using a common reference for satellite altimetry and simulated river depth (i.e., adding the difference between the modeled river depth and the altimetry elevation to satellite altimetry). Likewise, anomalies from ENVISAT observations were assimilated into a continental-scale hydrologic/hydrodynamic model and compared to in situ and remotely sensed river discharge data in the Amazon basin (Paiva et al., 2013a). Moreover, global-scale hydrodynamic modeling studies have used anomaly assimilation to eliminate biases in the simulated WSE (Brêda et al., 2019; Emery et al., 2020a; Paiva et al., 2013a; Wongchuig-Correa et al., 2020). However, anomaly assimilation does not provide accurate river discharge estimates for the Amazon basin (Paiva et al., 2013a), as it cannot compensate for discrepancies in flow dynamics between observations and simulations. These differences in flow dynamics can be attributed to several factors, including differences in amplitude due to limited river width (De Paiva et al., 2013; Yamazaki et al., 2012), differences in seasonal flow due to a failure to capture anthropogenic activity (Hanazaki et al., 2022; Pokhrel et al., 2018; Shin et al., 2020), and differences in flow variation due to the assumption of rectangular cross-sections (Neal et al., 2015; Saleh et al., 2013). Given such uncertainties in parameters and the structural simplification of current hydrodynamic models, anomaly assimilation of satellite altimetry may not be effective for estimating river discharge (Liu et al., 2012; Paiva et al., 2013a). Therefore, alternative approaches to direct and anomaly assimilation are required to integrate satellite altimetry into existing hydrodynamic models.
In the present study, we evaluated the potential of assimilating satellite altimetry into a global-scale hydrodynamic model to improve river discharge estimation. We investigated methods of assimilating satellite altimetry data into a hydrodynamic model (within current limitations) without contamination from the errors in simulated WSE. Large biases between satellite altimetry and simulated WSE are driven by uncertainties in parameters, whereas simplified physics and a lack of representation of anthropogenic activity (e.g., reservoir operations) introduce differences in the WSE distribution between simulations and observations. To effectively replace direct value assimilation, we propose alternative methods for DA in the Amazon basin, including anomaly and normalized value assimilation. The hydrodynamic model used in this study was the Catchment-based Macro-scale Floodplain model (CaMa-Flood: Yamazaki et al., 2011) with the local ensemble transform Kalman filter (LETKF: Hunt et al., 2007), which we used to assimilate satellite altimetry using a physically based empirical localization approach (Revel et al., 2019). The methodology is described in Sect. 2, and the findings are presented in Sect. 3. The discussion and conclusion are presented in Sects. 4 and 5, respectively.
2.1 Data assimilation framework
Using a physically based empirical localization approach, we developed a DA framework to incorporate satellite altimetry into a hydrodynamic model (Revel et al., 2021). The DA framework developed in this study is represented schematically in Fig. 1a. A collection of runoffs created with Earth2Observe's (E2O) Global Earth Observation for Integrated Water Resource Assessment, a tier-2 water resources reanalysis (WRR2) runoff data set, forced the ensemble simulations. As runoff is the single largest source of error in hydrodynamic modeling (Paiva et al., 2013a; Wongchuig et al., 2019), we simply perturbed the runoff forcing (“runoff ensemble”). CaMa-Flood (Yamazaki et al., 2011) was the hydrodynamic core of the DA scheme, and LETKF (Hunt et al., 2007) was the DA algorithm. CaMa-Flood simulations provide the current water state (i.e., WSE) and correct that value using satellite altimetry. The assimilation scheme takes advantage of physically based empirical local patches (Revel et al., 2019). The initial water state at time and the runoff are used to simulate the forecasted water state at time using the CaMa-Flood hydrodynamic model. The water status is then updated to via DA, and any modifications are transferred to the initial condition of the following time step. In anomaly and normalized value assimilation scenarios, the forecasted water state is transformed to anomalies or normalized values using the long-term mean and standard deviation for the assimilation of converted (anomalies or normalized values) satellite altimetry. Then the assimilated water states expressed as anomalies or normalized values are converted into natural values (i.e., the corrected WSE). Further information about the transformation of water states is presented in Sect. 2.3.
To match the WSE obtained from satellite altimetry, we allocated virtual stations (VSs) to the CaMa-Flood river network, accounting for the Multi-Error-Removed Improved-Terrain DEM (MERIT DEM; Yamazaki et al., 2017, 2019) elevations and river size. The methods used to allocate VSs to the CaMa-Flood river network are illustrated in Fig. 1b. First, we digitized the VS locations to high-resolution (i.e., 3 arcsec) MERIT Hydro (conditioned DEM) map by using latitude and longitude information to identify the nearest river. The high-resolution locations were then mapped to coarse-resolution river reaches, which were used in CaMa-Flood simulations. Finally, VSs with considerable variation in the mean WSE compared to the MERIT Hydro (Yamazaki et al., 2017, 2019) elevation (expressed as riverbank height) were filtered through comparison of mean observations and riverbank heights (i.e., VSs with mean WSEs above or below the 10 m riverbank height of the MERIT river network were removed). Next, all satellite altimetry elevations were converted into EGM96 from EGM08 via geoid conversion. Allocation of VSs to the CaMa-Flood river network is a vital step in the assimilation framework.

Figure 1(a) Data assimilation framework, (b) schematic diagram of satellite altimetry preprocessing, and (c) derivation of the localization parameters.
Using simulated long-term WSE values, we determined the localization parameters (i.e., local patch and observation localization weights; Fig. 1c). Deriving empirical localization parameters involved simulating WSE with CaMa-Flood, processing the data, running semi-variogram analyses, and assigning a threshold to spatial dependence weights. The physically based empirical localization DA approach outperformed traditional localization methods (Revel et al., 2019). Hence, when combined with LETKF, these localization parameters provide a foundation for efficient continental-scale DA.
2.2 Hydrodynamic model
To diagnose the time-varying water states in the DA scheme, we used CaMa-Flood (Yamazaki et al., 2011), which is a large-scale distributed hydrodynamic model. CaMa-Flood uses a local inertial flow equation, which is a computationally efficient variant of the shallow-water equation (Bates et al., 2010; Yamazaki et al., 2011), to determine river hydrodynamics (e.g., discharge, WSE, flood depth, flooded area). Runoff (surface and subsurface flow of water per unit area) from a land surface model (LSM) forces the model, and water is routed through the river network at adaptive time steps (Yamazaki et al., 2013). CaMa-Flood is capable of simulating floodplain dynamics and complex hydrodynamics such as the backwater effect (Yamazaki et al., 2011, 2012) and bifurcation flow (Yamazaki et al., 2014b). It is a physically based model that can simulate WSE; combining CaMa-Flood with MERIT DEM (Yamazaki et al., 2017, 2019) improves its performance relative to satellite altimetry. Consequently, the CaMa-Flood hydrodynamic model is appropriate for the DA framework described in Sect. 2.1.
We used CaMa-Flood version 4.0, which was developed with MERIT DEM and MERIT Hydro (Yamazaki et al., 2017, 2019) at a spatial resolution of 0.1∘. The simulations used the standard parameters (river channel depth, river width, roughness coefficient, and floodplain profile) of CaMa-Flood. The river channel depth was estimated using a power law relationship with prior river discharge (Sect. S3 in the Supplement, Eq. 1) (Yamazaki et al., 2011; Zhou et al., 2022). River widths were determined using remote sensing for rivers wider than 300 m (Yamazaki et al., 2014a); for narrower rivers, river width was empirically determined (Yamazaki et al., 2011). The roughness coefficient was approximated as a global constant (0.03). MERIT DEM and MERIT Hydro were used to construct the river network (Yamazaki et al., 2017, 2019).
2.3 Water surface elevation transformation
Because of the large biases in simulated WSE, direct comparison with satellite altimetry is difficult. Figure 2a presents an example of WSE bias and a comparison of satellite altimetry with simulated WSE. This figure shows that direct DA can introduce additional biases into assimilated WSE. These biases are caused by inaccuracies in parameters such as riverbank elevation height errors and river bathymetry errors as well as differences in elevation due to hydrodynamic model resolution (i.e., models assume the unit-catchment outlet elevation as the riverbank elevation of the river reach). Converting WSE into anomalies can reduce the challenges created by large differences between simulated and observed WSE values. WSE anomalies were generated by subtracting the time-averaged reference WSE (i.e., the long-term mean) from the current WSE. Therefore, each ensemble member had a different reference WSE value.
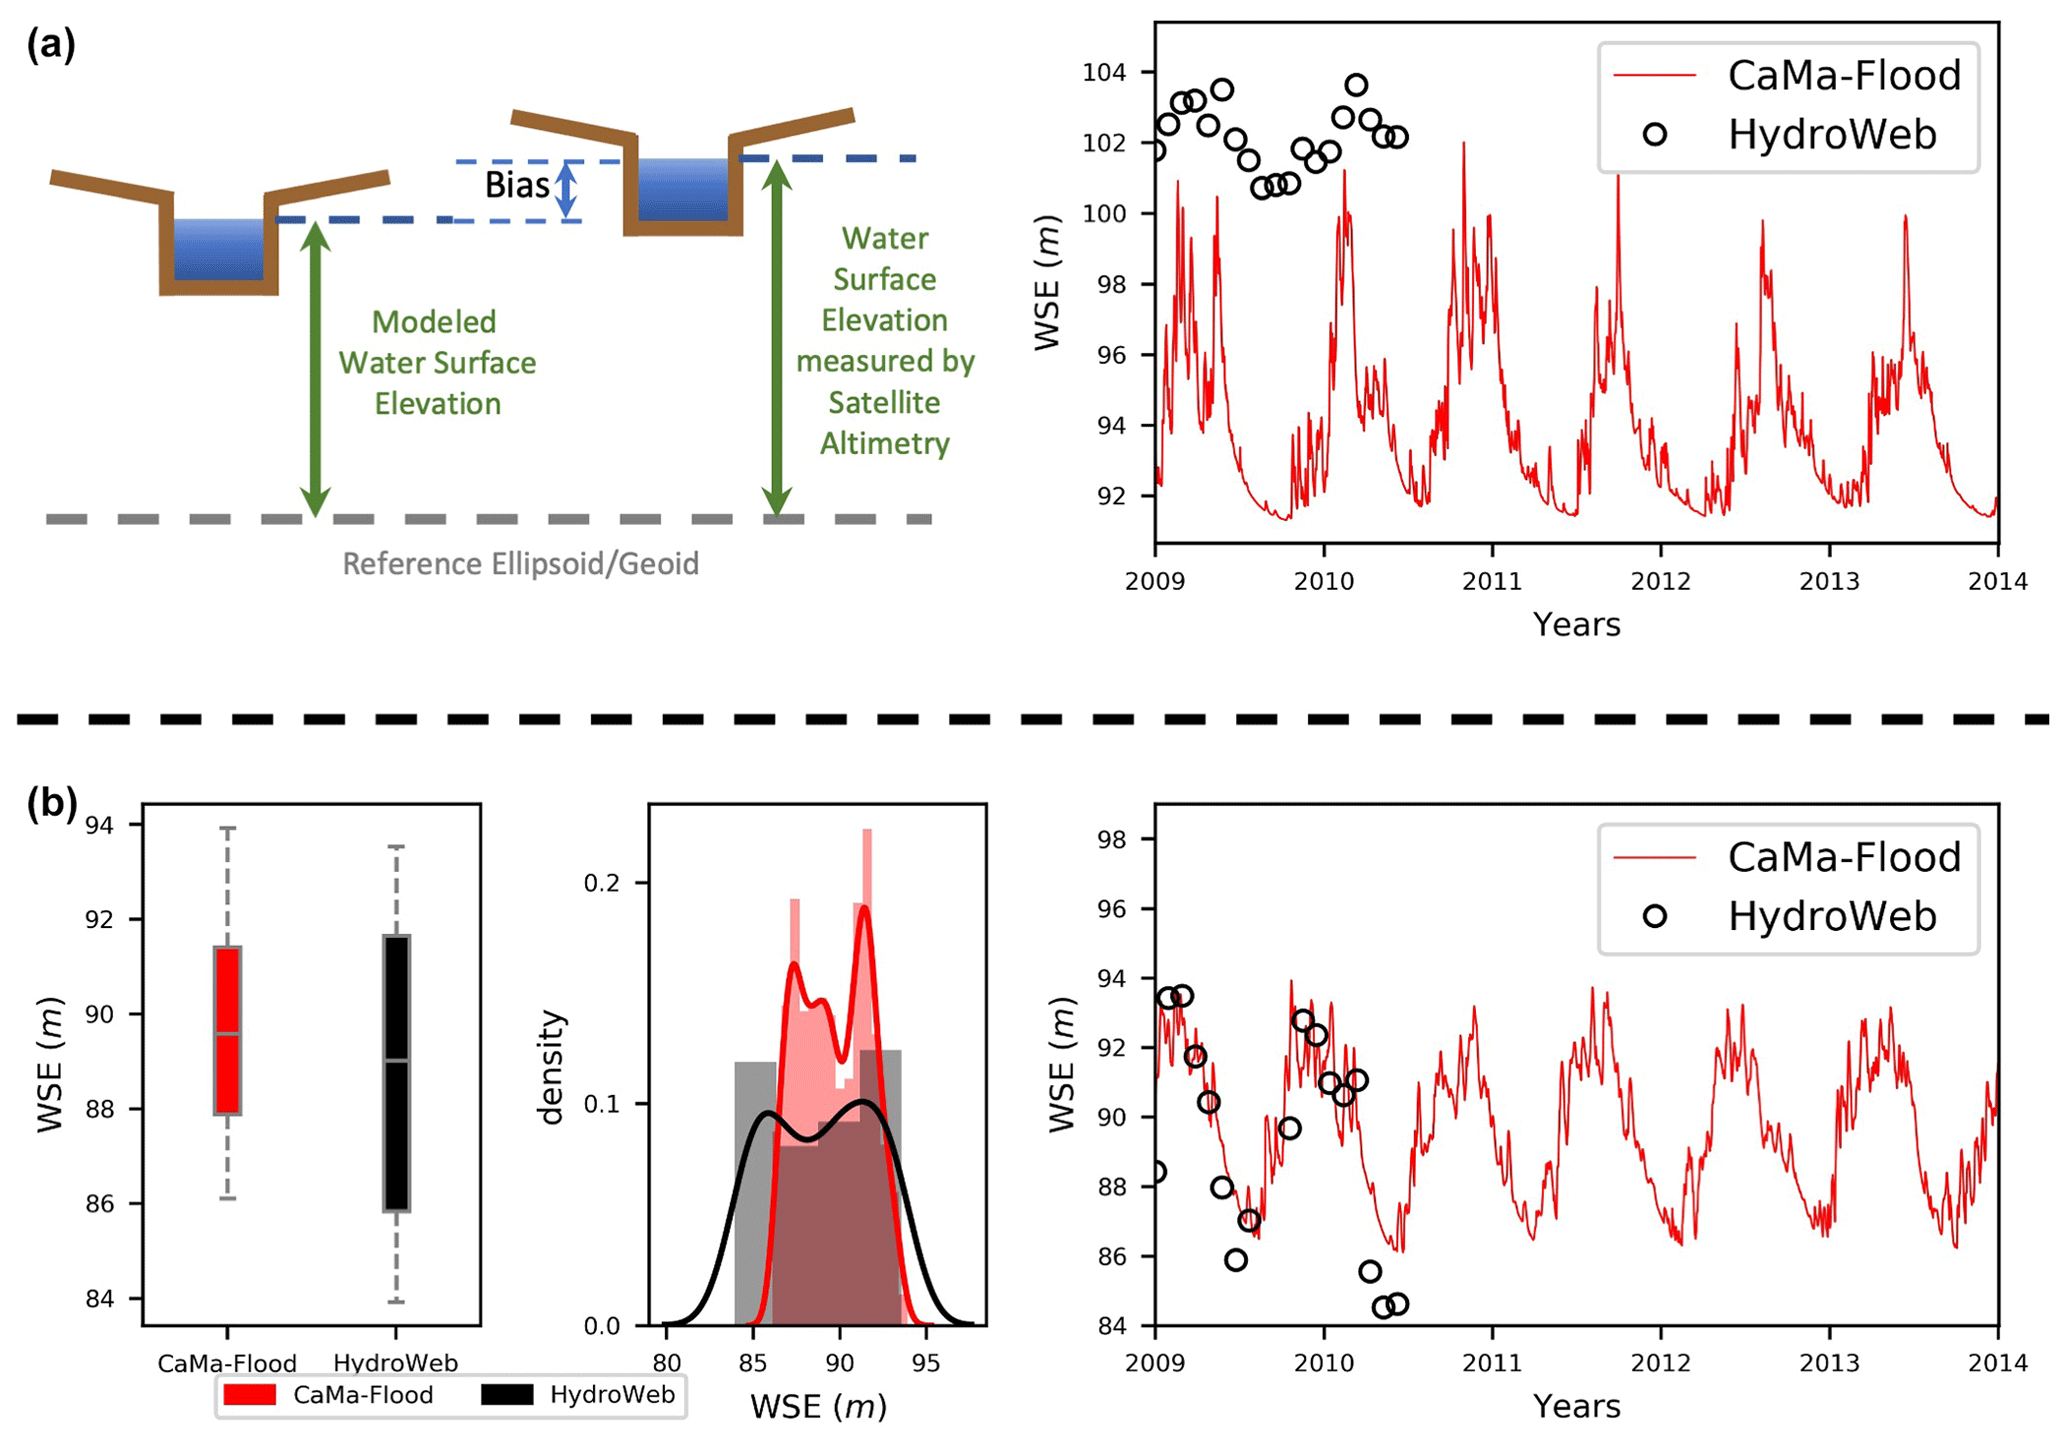
Figure 2(a) Schematic diagram of the bias between the simulated and observed WSE, and an example of the bias between the simulated and observed water surface elevation (WSE) at the HydroWeb VS R_AMAZONAS_JARI_KM0529. (b) The differences in surface water dynamics shown as a boxplot, probability distribution of simulated and observed WSE, and an example of the difference in amplitude between simulated and observed WSE at the HydroWeb VS R_AMAZONAS_ JUTAI_KM3182.
Although the use of anomalies can overcome the bias between observations and simulations, differences in flow variation between simulated and observed WSE remain (e.g., a difference in the amplitude of WSE variation, upstream water regulations that are not represented in the model). An example of a difference in flow variation is presented in Fig. 2b. The flow dynamic variation between simulations and observations can be overcome by using normalized values (i.e., subtracting the long-term mean and dividing by the standard deviation) when assimilating satellite altimetry into contemporary hydrodynamic models. To compensate more accurately for distribution discrepancies and estimate the river discharge, we used normalized value assimilation. We normalized the current WSE values using the time-averaged reference WSE and the standard deviation of WSE for each perturbation in the ensemble. Hence, each perturbation had a unique reference WSE and standard deviation of WSE.
2.4 Local ensemble transformation Kalman filter
DA aims to overcome differences between observations and simulations by combining uncertain and complementary information from observations. In this study, LETKF (Hunt et al., 2007), which is a computationally efficient variant of the ensemble Kalman filter (EnKF: Evensen, 2003), an advanced Kalman filter (Kalman, 1960), was used as the DA method. We used a physically based empirical localization approach (Revel et al., 2019, 2021) to enhance the computational efficiency of global-scale DA.
The LETKF is a commonly used DA algorithm (e.g., Feng et al., 2021; Ishitsuka et al., 2020; Revel et al., 2019, 2021b; Wongchuig-Correa et al., 2020) for nonlinear models, which are needed for modeling hydrodynamic processes. The nonlinear hydrodynamic model can be shown in discrete form as follows:
where x, u, and ϑ represent the vector of the state variable, the model forcing, and the model parameters, respectively. The nonlinear model operator, M, is related to the time interval of tk to tk+1, whereas errors in the model structure, parameters, forcing, and antecedent states are represented by qk. All state variables in CaMa-Flood, such as river discharge, WSE, flooded area, flood height, and storage, are included within the vector x. The model states can be related to the observations as follows:
where y is the observation vector; ε is the vector of observation errors; and H is the linear observation operator, which relates the model states (x) to the observations (y). In this study, the observations were WSEs obtained from satellite altimetry. In the anomaly and normalized value assimilations, the observed and forecasted states were transformed into anomalies and normalized values, respectively (Sect. 2.3, Fig. 2). The LETKF assimilation algorithm was used to obtain the optimal estimate of the model state vector X considering the model and observation errors. Here, the model state vector X was composed of WSE values. LETKF analysis is expressed as
where Xa is the posterior state estimator (or analysis); Xf is the prior state estimator (or forecast); Yo is the observation (i.e., the WSE value obtained from satellite altimetry); H is the observation operator corresponding to WSE, which is a subset of ℋ; m is the ensemble size; Ef is the prior state error covariance obtained directly from the perturbations; R is the observation error covariance determined from the uncertainty of the measurements; w is the weighting term for observation localization calculated with semi-variogram analysis of the simulated WSE (Revel et al., 2019); and VDVT is defined as
where I is the unit matrix of dimension m×m, representing the number of perturbations. VD−1VT and are calculated through eigenvalue decomposition of VDVT. The overbar represents the ensemble mean vector.
2.5 Generation of ensembles
CaMa-Flood diagnoses terrestrial water dynamics forced by surface and subsurface runoff values simulated using LSMs. LSMs are subject to flaws such as simplified physics, e.g., hill slope dynamics (Fan et al., 2019) and uncertainty in the forcing data. We stochastically perturbed the runoff forcing of the CaMa-Flood hydrodynamic model. The errors in runoff can be attributed to the limitations of LSM physics and uncertainty in the forcing data sets. We assumed that the uncertainty of the LSM's physical processes could be represented by the variability of the multi-model runoff diagnosed in the E2O WRR2 data set (Dutra et al., 2017). The uncertainty of the forcing (e.g., precipitation, radiation) was represented by normally distributed random numbers with a standard deviation calculated from the ensemble spread of the 20th-century atmospheric model ensemble (ERA20CM: Hersbach et al., 2015) runoff data set. We multiplied each runoff from the E2O WRR2 data set (seven runoff data sets from E2O WRR2 were used) by a random number from a normal distribution with a mean of 1 and a standard deviation of 0.1 according to the ERA20CM runoff ensemble. We used seven runoff outputs from the models HTESSEL (Balsamo et al., 2011), PCR-GLOBWB (Van Beek et al., 2011; Sutanudjaja et al., 2014), JULES (Best et al., 2011; Clark et al., 2011), LISFLOOD (Burek et al., 2013; Van Der Knijff et al., 2008), ORCHIDEE (d'Orgeval et al., 2008), WaterGAP3 (Flörke et al., 2013; Verzano, 2009), and W3 (Van Dijk et al., 2013) of E2O WRR2 (Dutra et al., 2017). The SURFEX-TRIP (Vergnes et al., 2014) model outputs were not used since they were incompatible with the CaMa-Flood hydrodynamic model. Therefore, 49 perturbations were used to prepare the runoff ensembles (Fig. 1) using runoff fields from the E2O WRR2 runoff product, which generally produce a reasonable ensemble of runoff forcing for global DA.
2.6 Experimental design
We performed three types of experiments: direct DA (DIR), anomaly DA (ANO), and normalized DA (NOM). ANO was performed because assimilating WSE anomalies rather than direct values can overcome the errors associated with direct DA. Although anomalies can overcome the biases between observations and simulations, differences in flow variation between simulated and observed WSE could not be overcome by the anomaly DA method (Fig. 2b). To overcome the flow dynamic variation between simulations and observations, we performed NOM. Both forecasted values and observations were transformed into anomalies (ANO) and normalized values (NOM) for the DA experiments. The three assimilation approaches were used to identify the optimal assimilation methodology for improving discharge estimation within the present limits of hydrodynamic modeling. The anomalies and normalized values were calculated from the long-term (2000–2014) mean and standard deviation of the WSE for the anomaly and normalized value DA experiments. The statistics (i.e., mean and standard deviation) for satellite altimetry were determined from the period when observations were available. However, for WSE simulations, we obtained statistics using simulations from 2000 to 2014. For all experiments, simulations began on 1 January 2009 and ran through 31 December 2014. The year 2008 was used for spin-up. Moreover, we conducted biased runoff (Sect. S2, Fig. S4) and corrupted river bathymetry (Sect. S3, Fig. S5) experiments to further understand DA performance under different model conditions.
We selected the Amazon basin as the test area for our DA experiments (Sect. S1, Fig. S1). The Amazon basin is the world's largest hydrological system, with a catchment area of approximately 6 million km2 (Reis et al., 2019), and contributes nearly one-fifth of the total freshwater discharged into the ocean (Paiva et al., 2013a). The flow dynamics of the Amazon basin, which range from seasonal flooding (Papa et al., 2010; Prigent et al., 2020) to complex river hydraulics such as hysteresis in the stage–discharge relationship driven by the backwater effect (Paiva et al., 2013b; De Paiva et al., 2013), have been studied extensively. This basin receives substantial annual rainfall (≈2200 mm) with high spatial heterogeneity, and experiences distinct rainy and dry seasons in the southern and eastern portions (Builes-Jaramillo and Poveda, 2018; Espinoza Villar et al., 2009). The major advantage of analyzing the Amazon basin is the availability of a large number of remote sensing observations (Fassoni-Andrade et al., 2021).
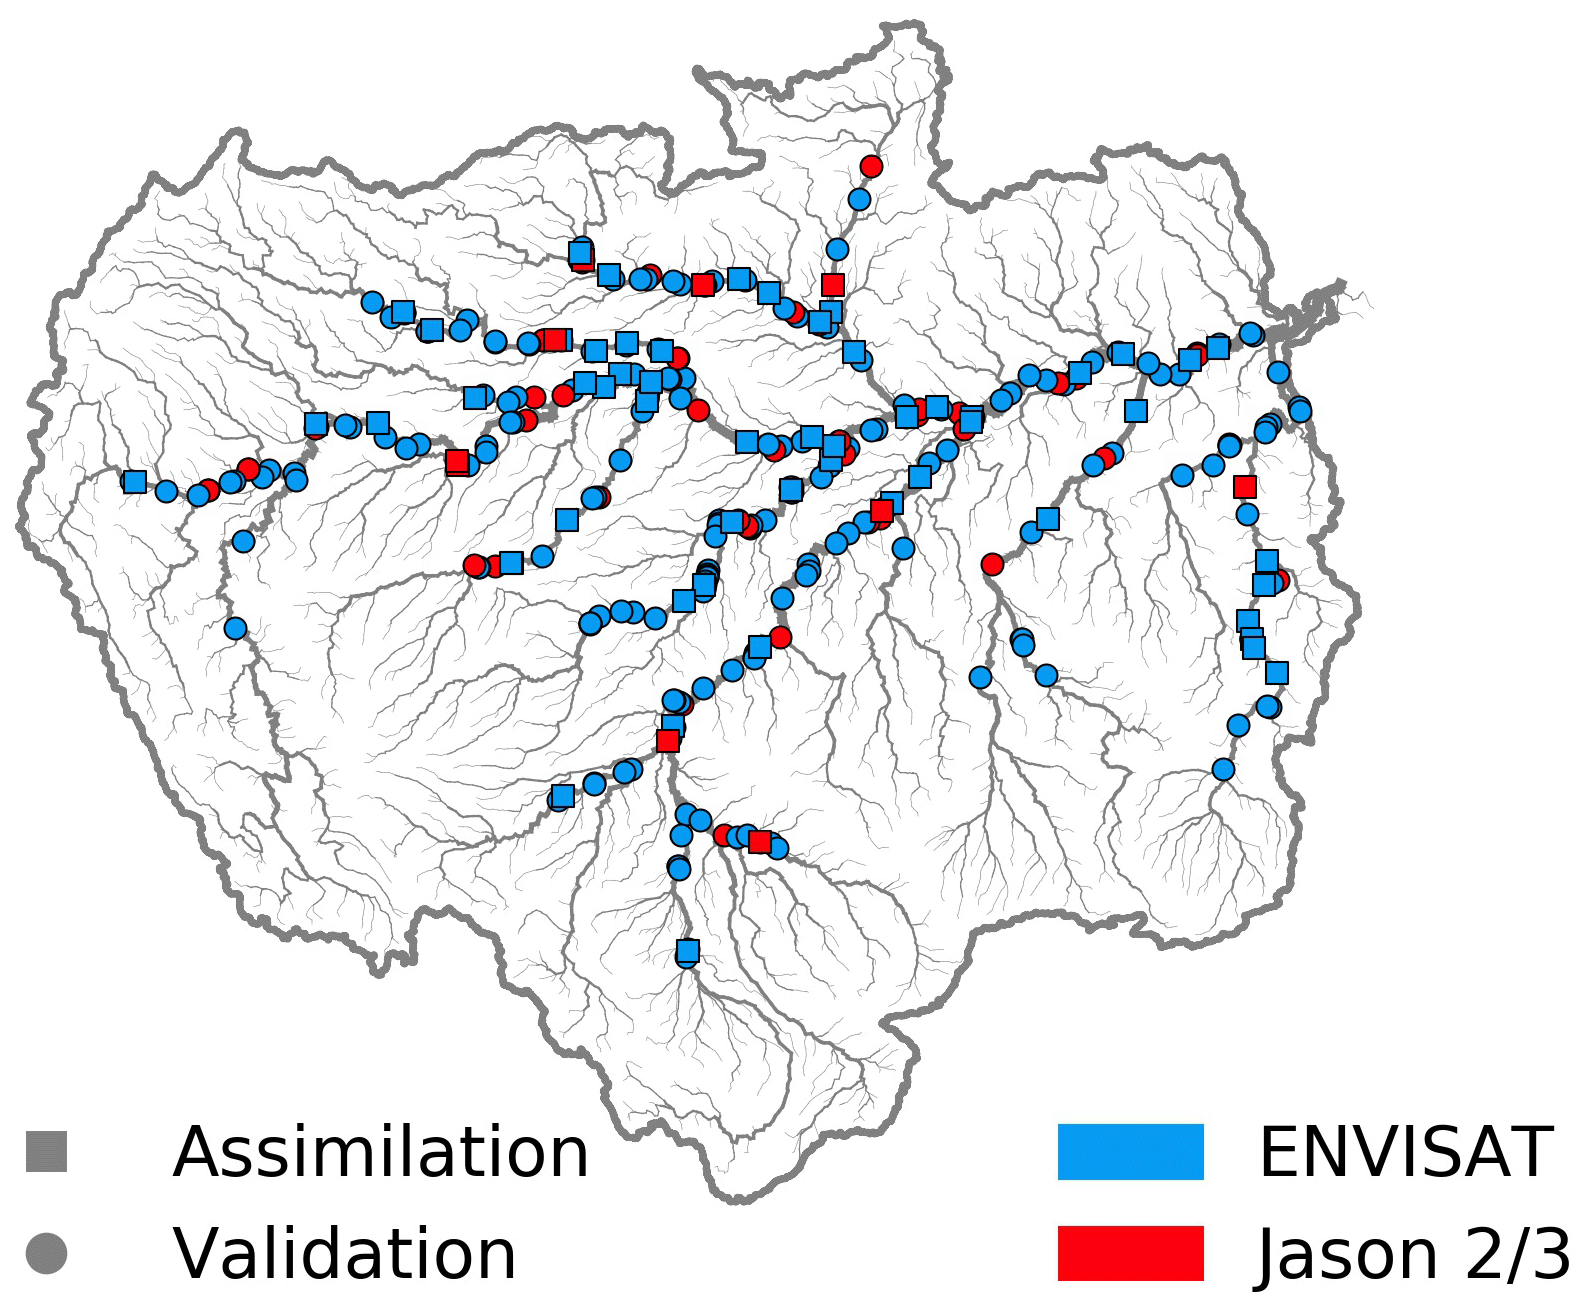
Figure 3Spatial distribution of the satellite virtual stations (VSs) used in this study. ENVISAT VSs are shown in red, and Jason 1 and Jason 2 VSs are in blue. VSs used for assimilation and validation are indicated with squares and circles, respectively.
2.7 Observational data
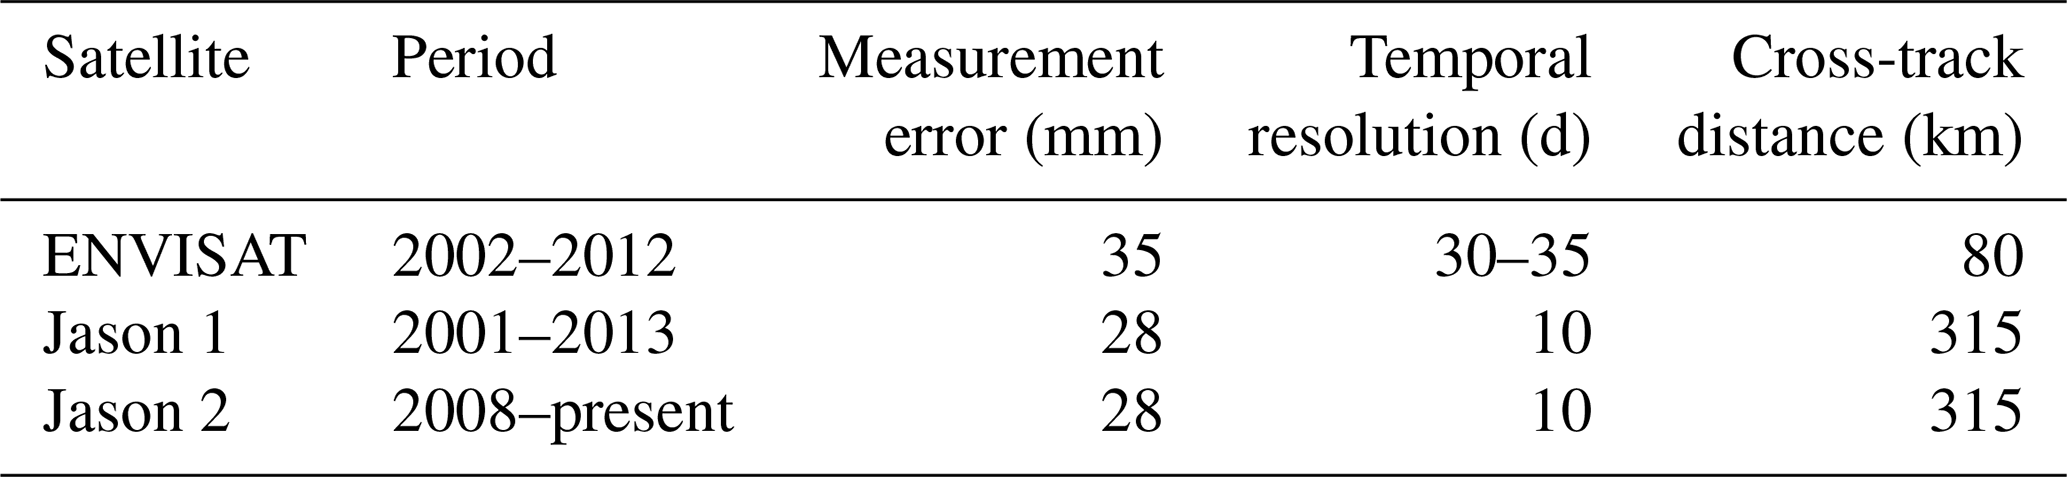
We used satellite altimetry as observations for all DA experiments (Sect. 2.6). Satellite altimetry was originally developed to observe ocean surfaces, but its application has expanded through the creation of algorithms to detect surface water dynamics (Birkett et al., 2002; Crétaux et al., 2009; Santos da Silva et al., 2010). Satellite altimetry data were obtained from HydroWeb (https://hydroweb.theia-land.fr/ last access: 14 December 2022). Satellite altimetry measurements from ENVISAT and Jason 1 and 2 were used depending on the data availability during the simulation period (2009–2014), as listed in Table 1. Table 1 summarizes the availability periods, temporal resolutions, cross-track distances, and measurement errors of the satellites used in this study. The spatial distribution of VSs is illustrated in Fig. 3. Using the methodology described in Sect. 2.1, we allocated the VSs to river pixels in CaMa-Flood (Fig. 1b). Preprocessing excluded around 3 % of VSs from analyses, which may have generated considerable inaccuracies, in particular in the experiments with direct value assimilation (DIR). These VSs were in narrow rivers at relatively high elevations. The WSE data obtained from satellite altimetry were converted from EGM08 to EGM96, as the EGM96 geoid model is used in MERIT DEM/MERIT Hydro (Yamazaki et al., 2017, 2019).
As we assimilated only WSEs from satellite altimetry, we used Global Runoff Data Centre (GRDC) river discharge data for validation. We used river discharge gauges located in the main river reaches (upstream catchment area > 1000 km2) and gauges with observational data covering at least 1 year of the simulation period. Furthermore, we randomly chose 80 % of the VSs in the Amazon basin for assimilation, while the remaining 20 % were preserved for WSE validation (Fig. 3). Consequently, we used only 80 % of the 324 VSs in the Amazon basin for the DA.
Table 1Summary of the satellite altimetry data used in this study. Periods of availability, measurement errors, temporal resolutions, and cross-track distances are shown.
2.8 Evaluation diagnostics
We evaluated the relative assimilation efficiency using several diagnostics. The difference in correlation coefficient (Δr) between assimilated and open-loop simulations was assessed to evaluate the improvement in the flow pattern of the discharge. Δr was calculated as
where the correlation coefficients of the assimilated and open-loop simulations are represented by rasm and ropn, respectively. Then the relative efficacy of WSE was assessed with the relative root mean square error (rRMSE):
where RMSEasm and RMSEopn are the RMSE values of the assimilated and open-loop simulations, respectively. s and o are simulation results and observations, respectively. N is the number of observations in the time series. The Nash–Sutcliffe (Nash and Sutcliffe, 1970) efficiency-based assimilation index (NSEAI; Revel et al., 2021) was used to evaluate the improvement in river discharge with DA:
where NSEasm and NSEopn are the Nash–Sutcliffe (Nash and Sutcliffe, 1970) efficiencies for the assimilated and open-loop simulations, respectively. Similarly, the Kling–Gupta (KGE: Kling and Gupta, 2009) efficiency-based assimilation index (KGEAI) was used to evaluate the improvement. The relative interval skill score (rISS) was used to compare the ensemble spreads of the assimilated and open-loop simulations. rISS is defined as follows:
where ISSasm and ISSopn are the ISS values (Gneiting and Raftery, 2007) of the assimilated and open-loop simulations, respectively. u and l are the upper and lower confidence intervals for the estimate, o is the observed value, and α is the significance level. N is the number of observations. By rewarding narrow confidence intervals and penalizing observations outside the nominal confidence intervals, the ISS incorporates both sharpness (i.e., the size of the confidence interval) and reliability (i.e., the proportion of observations that fall within the nominal confidence interval specified). When balancing sharpness and reliability, a relative comparison of ISS (rISS) allows for the evaluation of ensemble models; those with better performance have lower ISS values (Michailovsky et al., 2013). The significance level (α) was set to 0.05 in this study. Furthermore, relative sharpness (rSharpness) and difference in reliability (ΔReliability) were used to evaluate the relative assimilation performance. rSharpness is calculated as
where Sharpnessasm and Sharpnessopn are Sharpness values of the assimilated and open-loop simulations, respectively. ΔReliability is defined as
where Reliabilityasm and Reliabilityopn are reliability values of the assimilated and open-loop simulations, respectively. Reliability is the number of observations within the bounds u and l.
We used NSE (Nash and Sutcliffe, 1970) and KGE (Kling and Gupta, 2009) to evaluate the overall performance of river discharge. Furthermore, RMSE, the absolute bias between the means of the observations and simulation results (BIAS) and the difference in amplitude (ΔA) of WSE were evaluated.
3.1 Relative performance evaluation
In this section, we present the relative performance of each assimilation approach, considering the direct (DIR), anomaly (ANO), and normalized value (NOM) DA experiments in that order. Here we analyze the performance of assimilated values with respect to the open-loop simulation. Δr represents the relative change in r between the open-loop or assimilation results and observations. rRMSE represents the deviation in the RMSE of assimilation relative to that of open-loop simulation. rISS, rSharpness, and ΔReliability are used to assess changes in ensemble spread between the open-loop and assimilated simulations, followed by a comparison of the relative performance (i.e., Δr, NSEAI, KEGAI, rISS, rSharpness, and ΔReliability) of the experiments (i.e., DIR, ANO, NOM).
3.1.1 Direct assimilation of satellite altimetry
In DIR, we assimilated direct satellite altimetry measurements into the CaMa-Flood hydrodynamic model. Figure 4a shows the improvement (degradation) in the correlation coefficient in green (violet) for river discharge at the GRDC locations in this study. r improved in 8.1 % of GRDC locations out of the 86 used for evaluating river discharge, whereas half of the gauges (48.8 %) showed no difference. r was reduced (Δr<0) at several locations along the Madeira, Negro, and Purus tributaries (accounting for 43.0 % of all gauges). The relative change in RMSE between observed and simulated WSE (rRMSE) was used to evaluate WSE performance, as illustrated in Fig. 4b. Large negative (positive) values for rRMSE indicate better (worse) performance of the DA scheme, which is denoted by blue (red). Overall, 56.4 % and 50.8 % of the assimilation and validation VSs, respectively, showed reductions in RMSE with the assimilation of satellite altimetry into a hydrodynamic model. The WSE estimates obtained from the assimilated simulation with direct DA into a model were degraded (assimilation: 39.0 %, validation: 41.5 %) relative to the open-loop simulation in the Amazon mainstem and the Negro, Branco, Madeira, and Xingu rivers (Fig. 4b). A limited number of gauges demonstrated no change with direct DA.
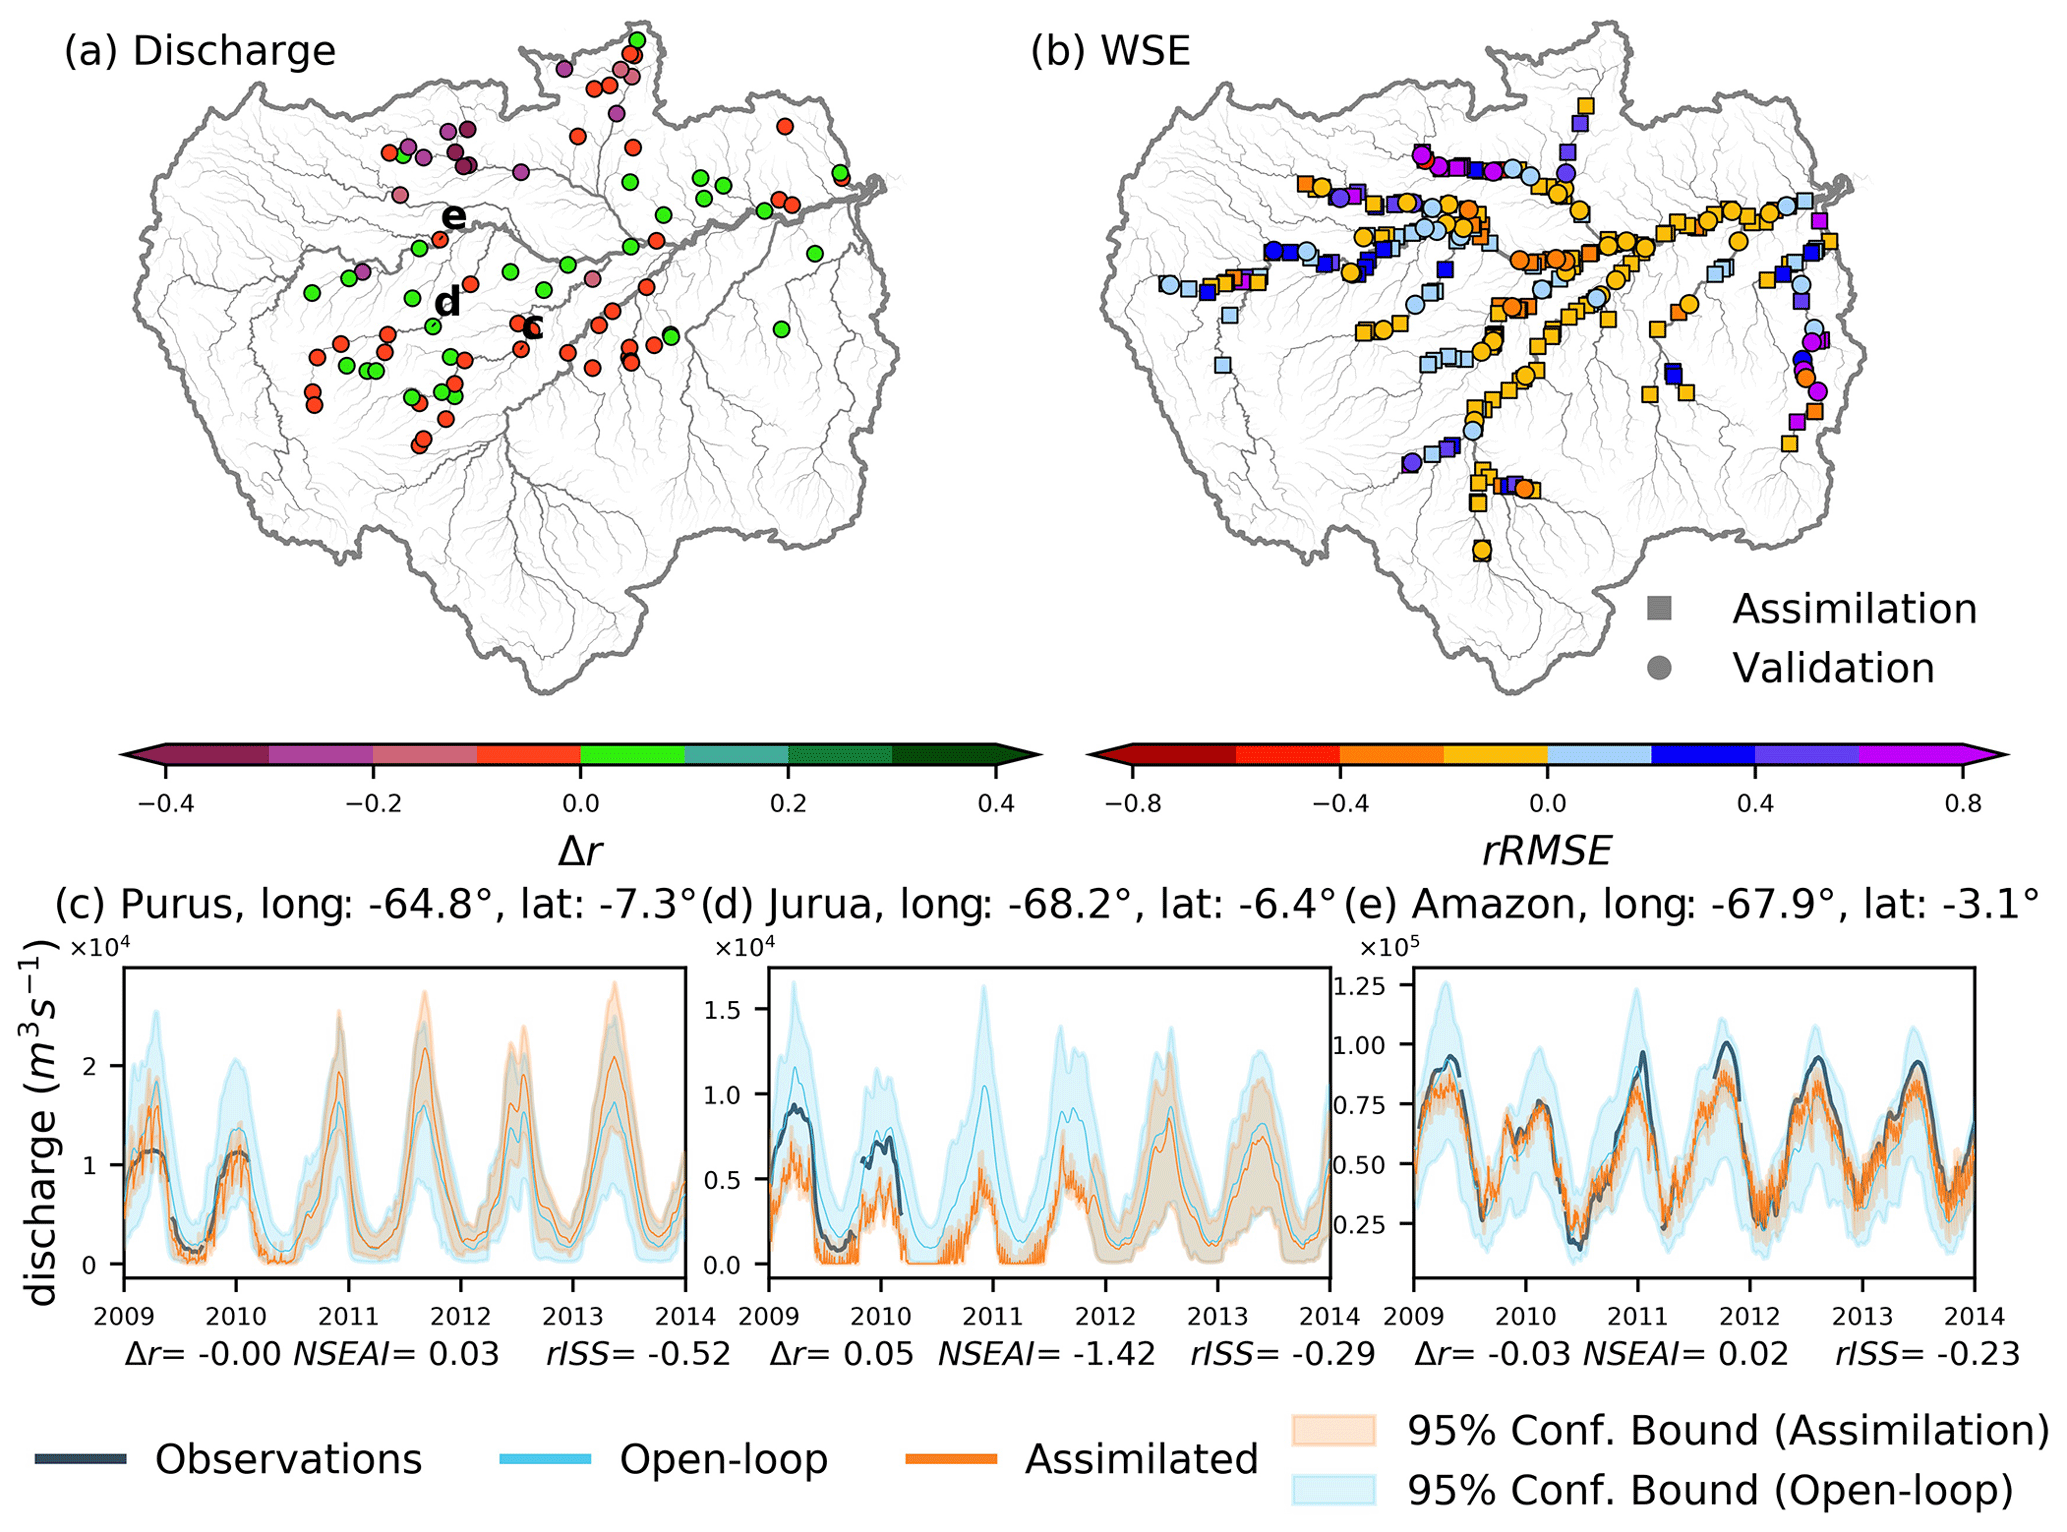
Figure 4(a) Difference in the correlation coefficient of river discharge (Δr) and (b) the relative root mean square error (rRMSE) in water surface elevation for DIR. Circles indicate virtual stations used for data assimilation, and squares are virtual stations used for validation on the WSE plots. Hydrographs recorded at Labera on the Purus River, Santos Dumont on the Jurua River, and Santo Antonio Do Ica on the Amazon River are presented in panels (c), (d), and (e), respectively. The locations of the hydrographs shown in panels (c), (d), and (e) are presented in panel (a). Discharge observations are shown in black, assimilated simulation results in orange, and open-loop simulation results in blue. The color range indicates the 95 % confidence interval used to calculate the relative interval skill score (rISS). Δr, the Nash–Sutcliffe efficiency-based assimilation index (NSEAI), and rISS are shown at the bottom of each panel.
Figure 4c, d, and e depict hydrographs at Labera in the Purus River, Santos Dumont in the Jurua River, and Santo Antonio Do Ica in the Amazon River, in that order. Each panel shows observations (black line), open-loop simulation results (blue line), assimilated discharge (orange line), and 95 % confidence bounds for the assimilated and open-loop river discharge. The discharge at Labera station (Fig. 4c) improved in terms of NSE and ISS but not r. Substantial improvement in the 95 % ensemble spread was evident until mid-2010, when the ENVISAT satellite was available. However, confidence intervals became larger after 2010. DA marginally improved NSE scores, with low flows well replicated but peak flows showing some fluctuations. Santos Dumont (Fig. 4d) showed an improvement in the correlation coefficient of river discharge, although NSE suffered from a substantial underestimation of high flow. ISS increased by 29 %, primarily because of an improvement in sharpness, but reliability decreased. Figure 4e illustrates the variation in discharge at a station located in the mainstem of the Amazon River (Santo Antonio Do Ica), showing an improvement in NSE values but a weakening of the correlation coefficient. At this location, the tradeoff between reliability and sharpness is strong. Sharpness is often enhanced when direct satellite altimetry measurements are assimilated into an uncalibrated hydrodynamic model, but reliability is reduced.
In summary, direct DA improved flow dynamics when the simulations were within comparable limits of satellite observations. When direct satellite altimetry measurements were assimilated into the hydrodynamic model, the sharpness of river discharge improved. Furthermore, the accuracy of WSE estimates also improved with DA.
3.1.2 Anomaly assimilation of satellite altimetry
In ANO, anomalies of satellite altimetry were assimilated to anomalies of simulated WSE, with both anomalies produced using long-term means (for satellite altimetry: the mean of the available period; for WSE simulation: 2000–2014). Figure 5a depicts the Δr of river discharge in ANO, with green indicating an improved r relative to the open-loop simulation, which accounted for around 53.5 % of the GRDC gauges used to evaluate river discharge. Some degradation (purple) in r was observed in the Madeira and Purus rivers, Amazon mainstem, and smaller river reaches. WSE estimates improved in 76.1 % of assimilation VSs and 80.0 % of validation VSs (Fig. 5b). WSE performance decreased (in terms of RMSE) in the Jurua and Purus rivers, although nearly all other river reaches showed increases in the accuracy of WSE calculations with DA.
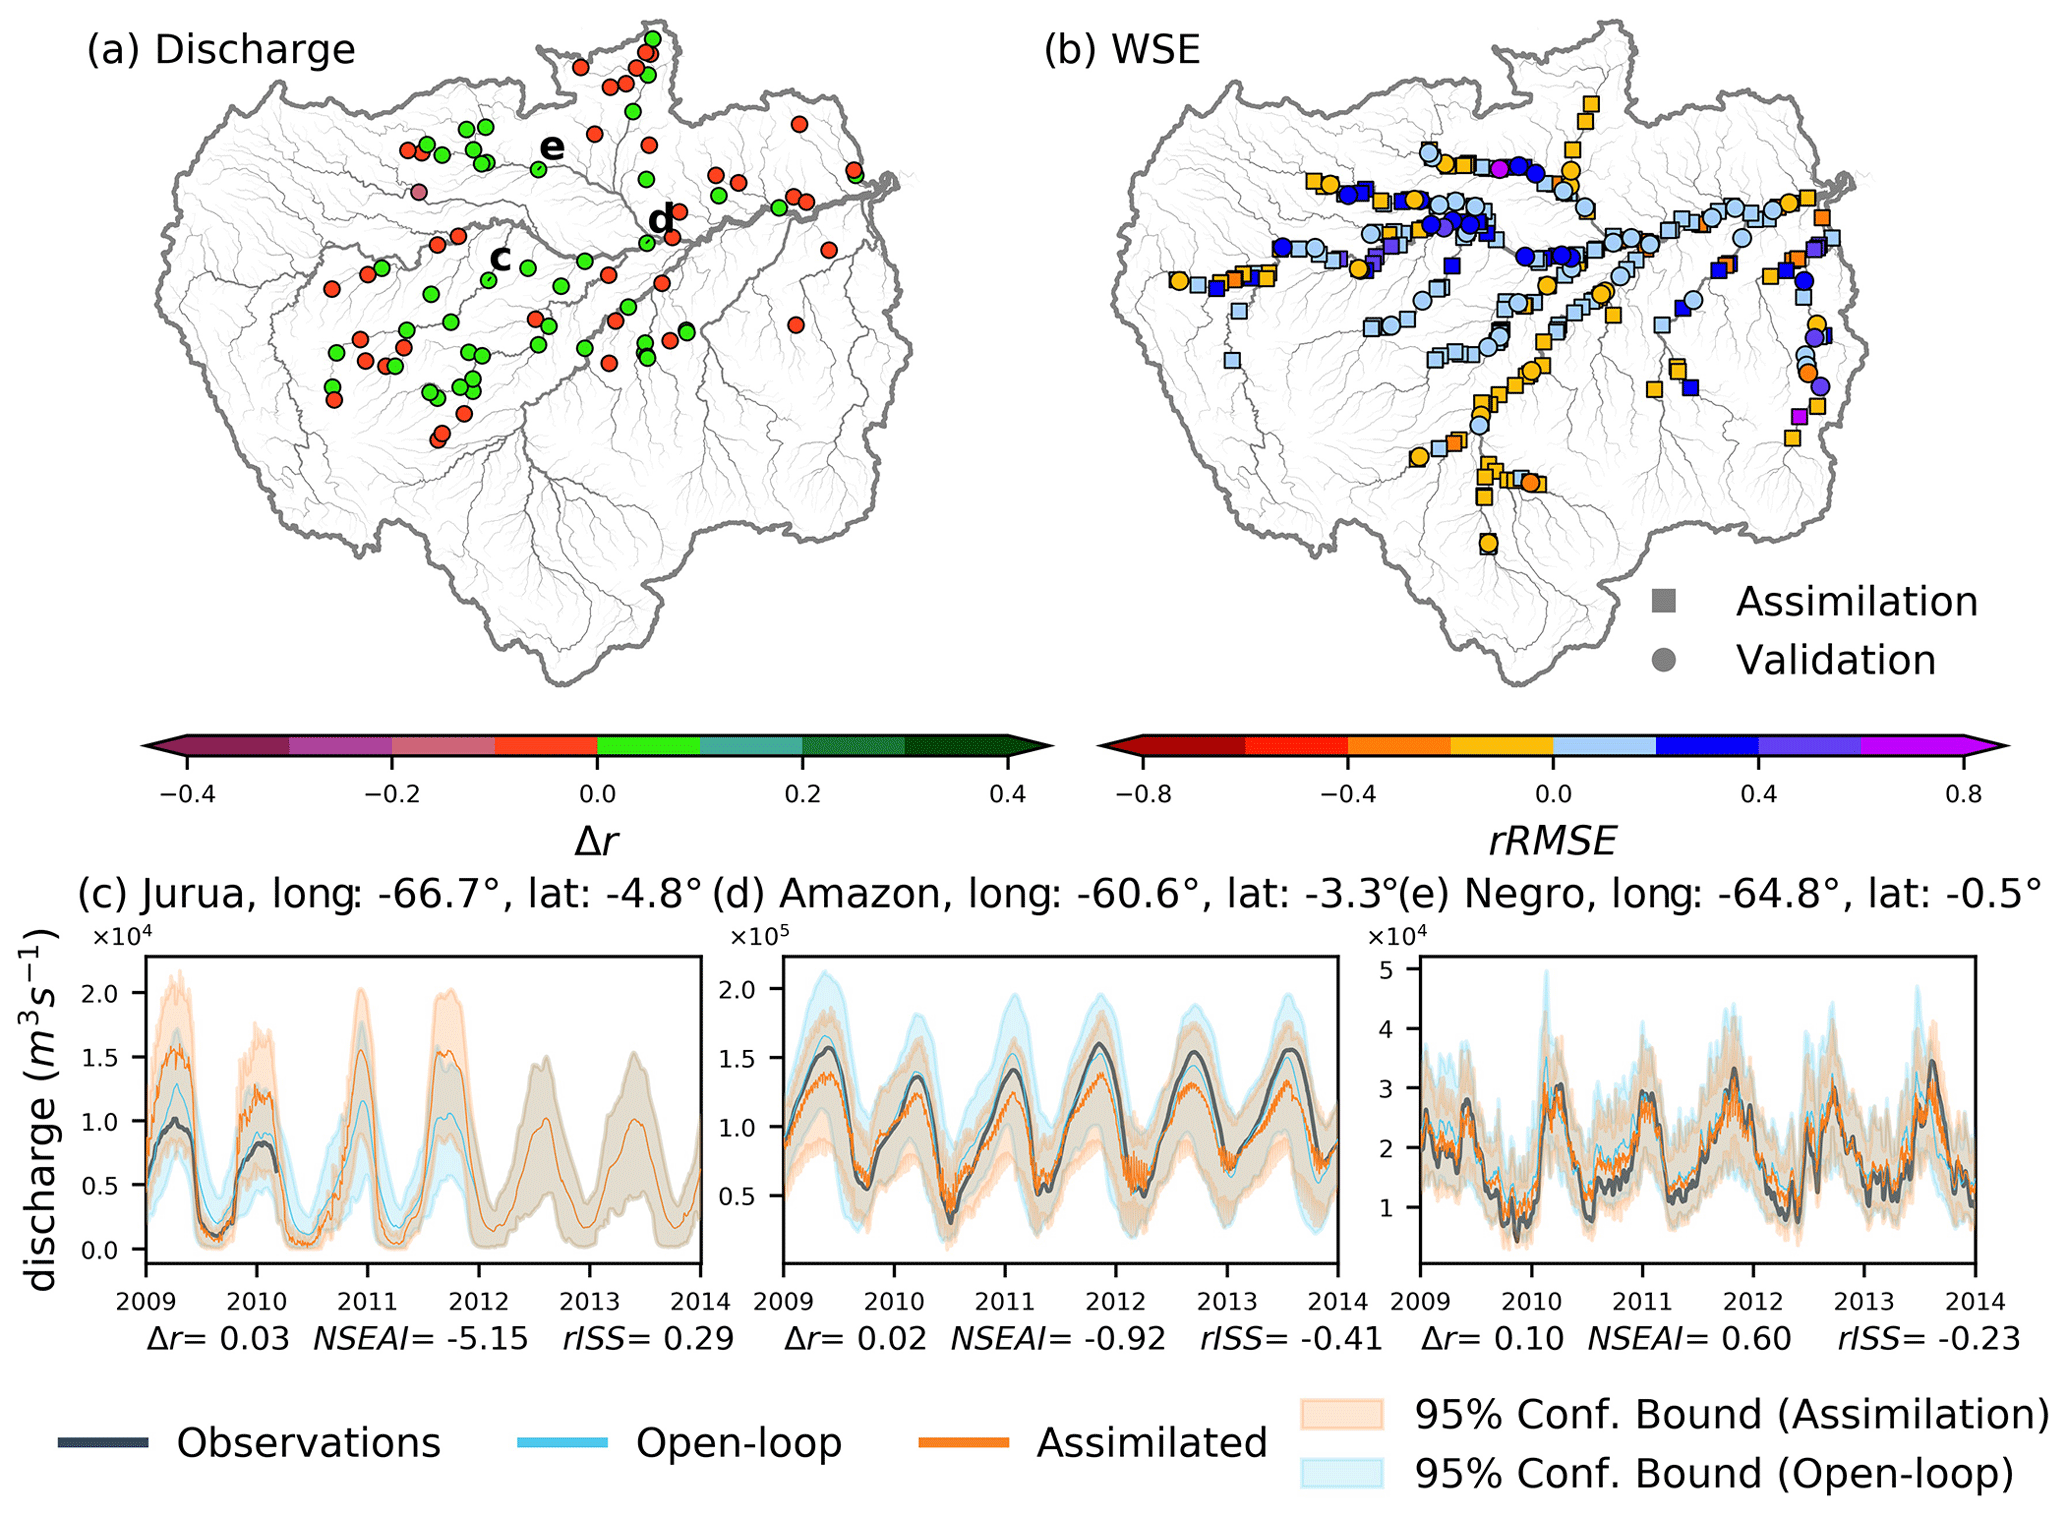
Figure 5(a) Difference in the correlation coefficient of river discharge (Δr) and (b) the relative root mean square error (rRMSE) in water surface elevation for ANO. Circles indicate virtual stations used for data assimilation, and squares are virtual stations used for validation on the WSE plots. Hydrographs recorded at Gaviao on the Jurua River, Manacapuru on the Amazon River, and Serrinha on the Negro River are presented in panels (c), (d), and (e), respectively. The locations of the hydrographs shown in panels (c), (d), and (e) are presented in panel (a). Discharge observations are shown in black, assimilated simulation results in orange, and open-loop simulation results in blue. The color range indicates the 95 % confidence interval used to calculate the relative interval skill score (rISS). Δr, the Nash–Sutcliffe efficiency-based assimilation index (NSEAI), and rISS are shown at the bottom of each panel.
Figure 5c–e displays hydrographs of the Jurua (Gaviao), Amazon (Manacapuru), and Negro (Serrinha) rivers, respectively. At Gaviao station (Fig. 5c), the r of river discharge increased slightly, whereas NSEAI and rISS decreased. Although low flows were adequately characterized during the brief observation period, peaks were exaggerated, resulting in low NSE and high ISS for the assimilated simulation. River discharge in the Amazon mainstem, notably at Manacapuru gauge (Fig. 5d), was well characterized, with improvements in r and ISS but a deterioration of NSE values. By contrast, the flow variation was accurately defined at Serrinha station in the Negro River (Fig. 5e) with anomaly DA and an uncalibrated hydrodynamic model (Δr, NSEAI, and rISS were improved). Through anomaly assimilation into an uncalibrated hydrodynamic model, the flow dynamics (characterized by r) of the Amazon basin improved, although NSE and ISS values worsened slightly.
Overall, the discharge estimates improved at some GRDC gauging stations (35 %) with the assimilation of WSE anomalies into the hydrodynamic model. The seasonality of river discharge improved considerably in most river reaches with anomaly assimilation. Furthermore, the WSE calculation was improved in many Amazon basin river reaches.
3.1.3 Normalized assimilation of satellite altimetry
In NOM, we assimilated normalized values of WSE. Long-term statistics (the mean and standard deviation of WSE for 2000–2014) were used to generate normalized values of DA for NOM. Figure 6a and b represent the Δr of river discharge and the rRMSE of WSE, respectively, for NOM. A total of 60.5 % of the GRDC gauges demonstrated a positive Δr, whereas decreases were evident in the Purus and Madeira rivers as well as the Amazon mainstem. A considerable number of VSs showed an improvement in WSE calculations with the normalized DA technique (85.6 % for both assimilation and validation VSs; Fig. 6b).
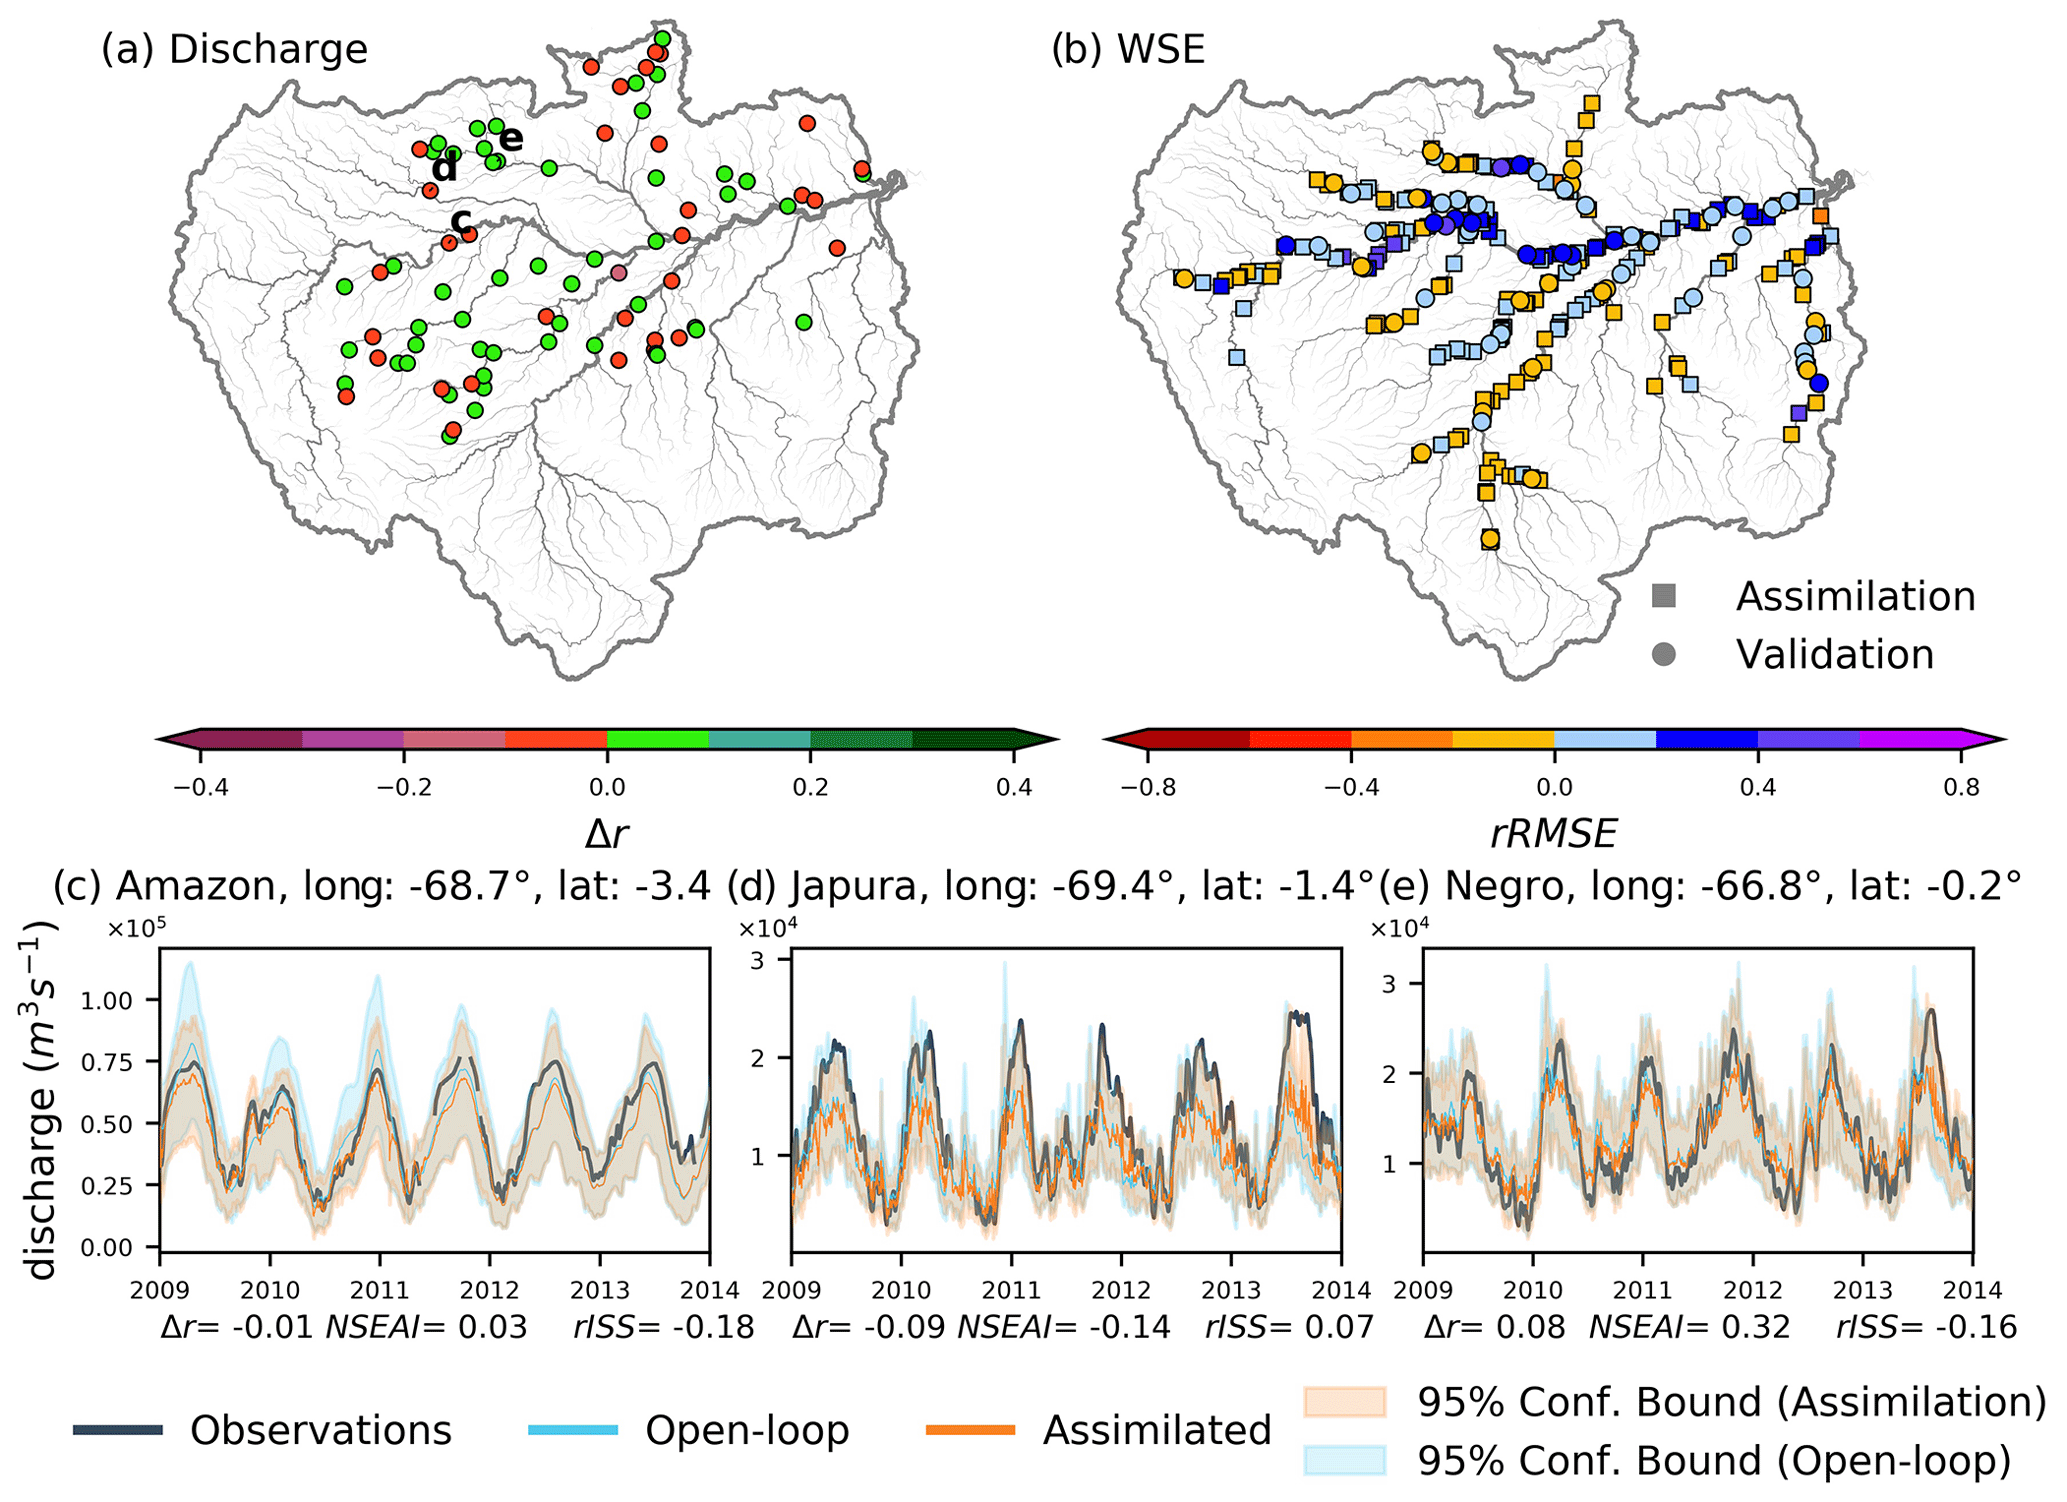
Figure 6(a) Difference in the correlation coefficient of river discharge (Δr) and (b) the relative root mean square error (rRMSE) of water surface elevation for NOM. Circles indicate virtual stations used for data assimilation, and squares are virtual stations used for validation in the WSE plots. Hydrographs recorded at Sao Paulo De Olivenca on the Amazon River, Vila Bittencourt on the Japura River, and Curicuriari on the Negro River are presented in panels (c), (d), and (e), respectively. The locations of the hydrographs shown in panels (c), (d), and (e) are presented in panel (a). Discharge observations are in black, assimilated simulation results are in orange, and open-loop simulation results are in blue. The color range indicates the 95 % confidence interval used to calculate the relative interval skill score (rISS). Δr, the Nash–Sutcliffe efficiency-based assimilation index (NSEAI), and rISS are shown at the bottom of each panel.
The lower panels of Fig. 6 illustrate flow dynamics along the Amazon mainstem (Sao Paulo De Olivenca; Fig. 6c) and the Japura (Vila Bittencourt; Fig. 6d) and Negro (Curicuriari; Fig. 6e) rivers. The discharge at Sao Paulo De Olivenca station in the Amazon mainstem (Fig. 6d) resembled the observed river discharge. Although NSEAI and rISS were both enhanced, Δr was marginally degraded. Note that the normalized value DA replicated the flow dynamics of the observations well, showing a secondary peak (e.g., October 2009) at the Sao Paulo De Olivenca station that was absent in the open-loop simulation. Although low flows and other fluctuations were accurately portrayed along the Japura River (Vila Bittencourt; Fig. 6d), the relative assimilation efficiency metrics had low values. Figure 6e illustrates a hydrograph of the Curicuriari gauge along the Negro River. The discharge at Curicuriari was well characterized, with a positive Δr and NSEAI and a negative rISS. Normalized DA using an uncalibrated hydrodynamic model improved the characterization of river discharge in terms of seasonal dynamics, overall accuracy, and the tradeoff between sharpness and reliability.
The normalized DA approach improves flow variation in most river reaches. In the normalized assimilation experiment, WSE estimates improved in most Amazon basin river reaches.
3.1.4 Comparison of assimilation experiments
To evaluate the relative improvement associated with DA, we evaluated only those GRDC gauges located in river reaches observed through satellite altimetry (satellite coverage; Fig. S2). The effectiveness of assimilation for GRDC gauges located outside the area of the satellite observations is poor, with very little difference between open-loop and assimilated simulations. Approximately 75 % of the 86 GRDC gauges lay outside the satellite coverage area (Fig. S2). The 21 gauges within the satellite coverage area were used to assess the relative improvement among experiments. Table 2 presents median relative performance statistics for river discharge estimates for all experiments. Positive values for Δr, NSEAI, KGEAI, and ΔReliability indicate that DA improved river discharge estimation. Negative values for rISS and rSharpness, in contrast, demonstrate an improvement in river discharge estimation with DA. For all experiments, Fig. 7a displays the kernel density estimate of the probability density function for the Δr of the river discharge. All experiments except DIR showed improvement in the median Δr (>0), demonstrating improvement in the flow regime with DA for at least 50 % of the gauges. The Δr for river discharge in DIR showed a left-skewed distribution, which suggests a deterioration in seasonality at many gauges (75 %). Approximately 70 % of the gauges showed improvements in flow regime characterization in the anomaly and normalized value DA experiments. However, only NOM had a positive median NSEAI, which indicates that at least 50 % of the gauges had improved NSE values with normalized value DA (Table 2). Figure 7b shows boxplots of NSEAI for all experiments that demonstrate considerable improvement in the DA experiments with normalized value assimilation. KGEAI followed the same pattern, with positive median values for NOM.
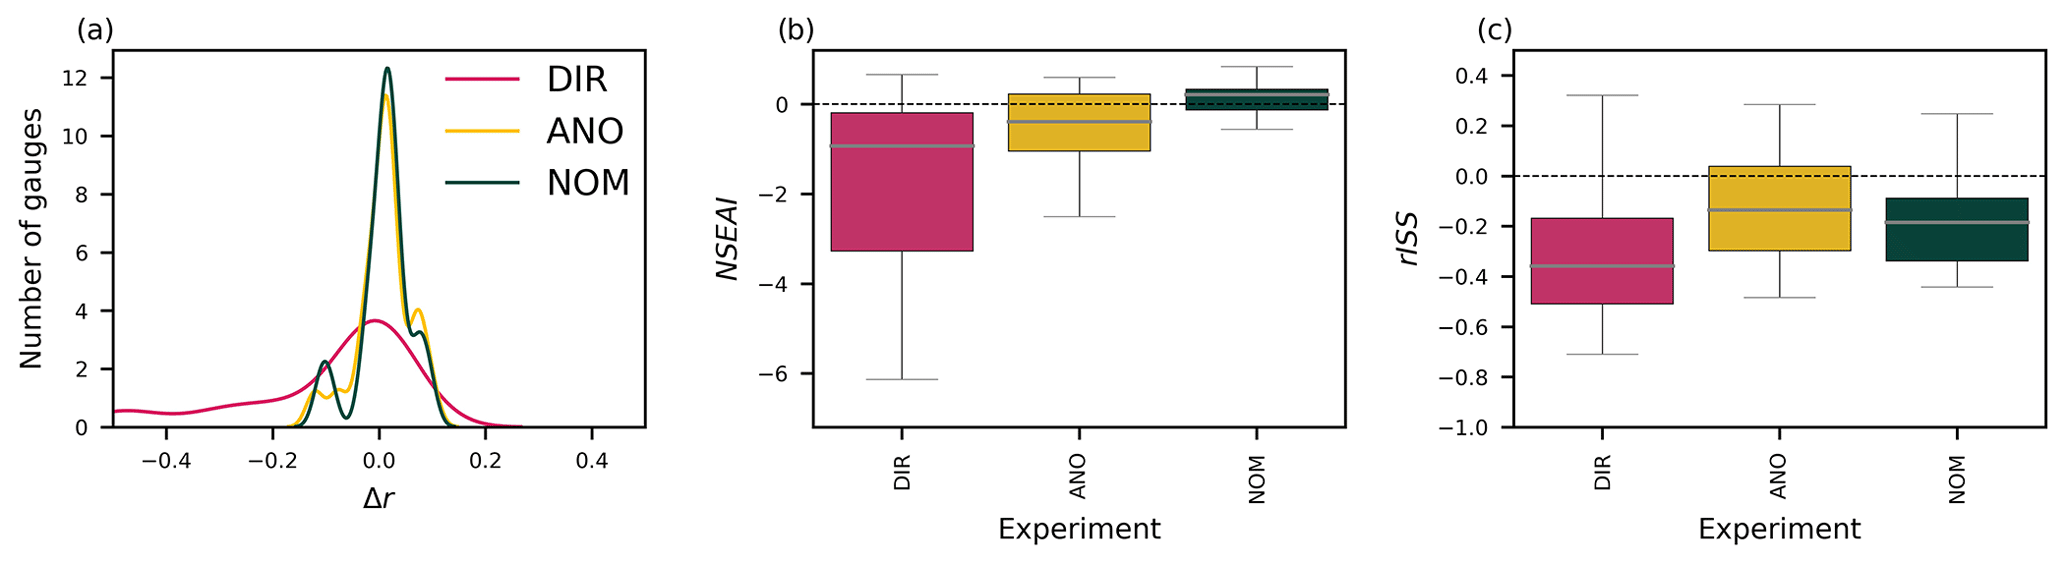
Figure 7(a) Probability distribution of the correlation coefficient (Δr) for each experiment, shown in blue, yellow, and red for direct (DIR), anomaly (ANO), and normalized value (NOM) experiments, respectively. (b) Boxplots of the Nash–Sutcliffe efficiency-based assimilation index (NSEAI) and (c) relative interval skill score (rISS) of assimilated discharge compared to those of open-loop discharge for all the experiments. Boxes in blue, yellow, and red indicate direct (DIR), anomaly (ANO), and normalized value (NOM), respectively.
Table 2Summary of relative DA efficiency statistics for river discharge in each experiment. The difference in the correlation coefficient (Δr), Nash–Sutcliffe efficiency-based assimilation index (NSEAI), Kling–Gupta efficiency-based assimilation index (KGEAI), relative interval skill score (rISS), relative sharpness (rSharpness), and difference in reliability (ΔReliability) are shown. Positive values for Δr, NSEAI, KGEAI, and reliability represent better performance of DA, and lower values for rISS and sharpness indicate improvements due to DA. Improvements in each relative performance metric with DA are highlighted in bold.
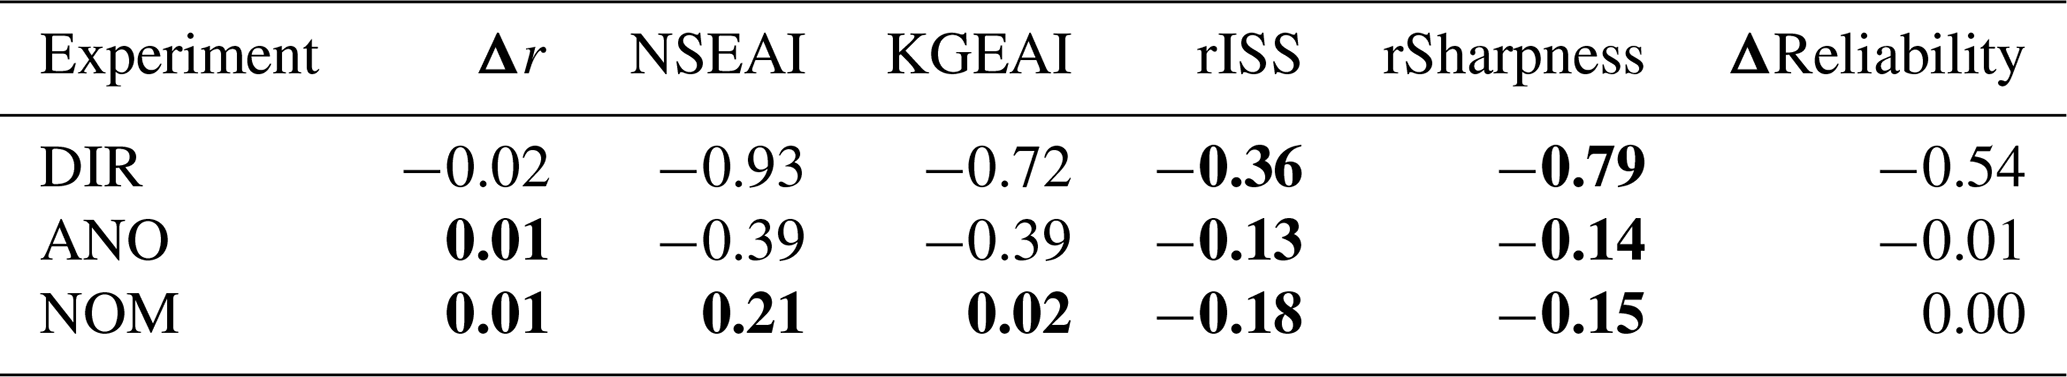
Compared to Δr, NSEAI, and KGEAI, rISS showed the opposite trend (Fig. 7c, Table 2), with major improvements resulting from direct DA. A negative rISS means that the ISS of assimilated discharge was improved, as a lower ISS indicates better performance with DA. Direct assimilation (DIR) led to a lower median rISS value (−0.36), whereas both anomaly and normalized value assimilation had values of −0.13 and −0.18, respectively. When evaluating rISS, one must consider changes in sharpness (i.e., the width of the confidence interval) and reliability (i.e., the percentage of observations that fall within the predicted nominal confidence interval; Michailovsky et al., 2013). A large reduction in sharpness was observed in the direct assimilation experiment (DIR), mainly because the assimilation was conducted using direct values in DIR (Fig. 4c–e), whereas the ANO and NOM reprojected the assimilated values to WSE values. The lowest reliability reduction was obtained in the normalized value assimilation experiment (NOM). The reliability of direct assimilation was reduced by 54 %, whereas sharpness improved by 79 % in DIR compared to the open-loop simulation (i.e., the 95 % confidence interval was larger in the open-loop simulation: Fig. S2b–c). Although the confidence bounds (i.e., sharpness) were narrower with direct DA compared to the anomaly and normalized value DA experiments, reliability was degraded by more than 50 %.
In summary, considering the improvements measured using multiple evaluation metrics (e.g., NSEAI, KGEAI), normalized value assimilation (NOM) showed the greatest improvement relative to the open-loop simulation, whereas the smallest improvement was obtained from the direct DA experiment (DIR). However, the tradeoff between sharpness and reliability was better in the direct DA experiment, as the assimilations were performed directly. Sharpness was substantially improved in DIR. In anomaly and normalized value assimilations, WSE space is affected by the calculation of anomalies or normalized values. Hence, given the current condition of hydrodynamic modeling (i.e., the limitations of hydrodynamic models), normalized value assimilation performed best.
3.2 Absolute performance evaluation
In this section, we explore the absolute performance of river discharge and WSE. When analyzing absolute performance, we consider the r, NSE, and KGE values for river discharge; RMSE, BIAS, and ΔA are used for WSE. r is used to assess the seasonality of river discharge estimates, whereas NSE and KGE are used to evaluate the overall performance of river discharge estimation. RMSE is used to evaluate the overall error of WSE estimation against satellite altimetry observations. Long-term bias is assessed with BIAS, and the difference in amplitude between the simulated and observed WSE is examined using ΔA. The absolute performance of daily discharge estimates is presented in Sect. 3.2.1, and the absolute performance of WSE estimation is described in Sect. 3.2.2.
3.2.1 Estimation of the daily river discharge
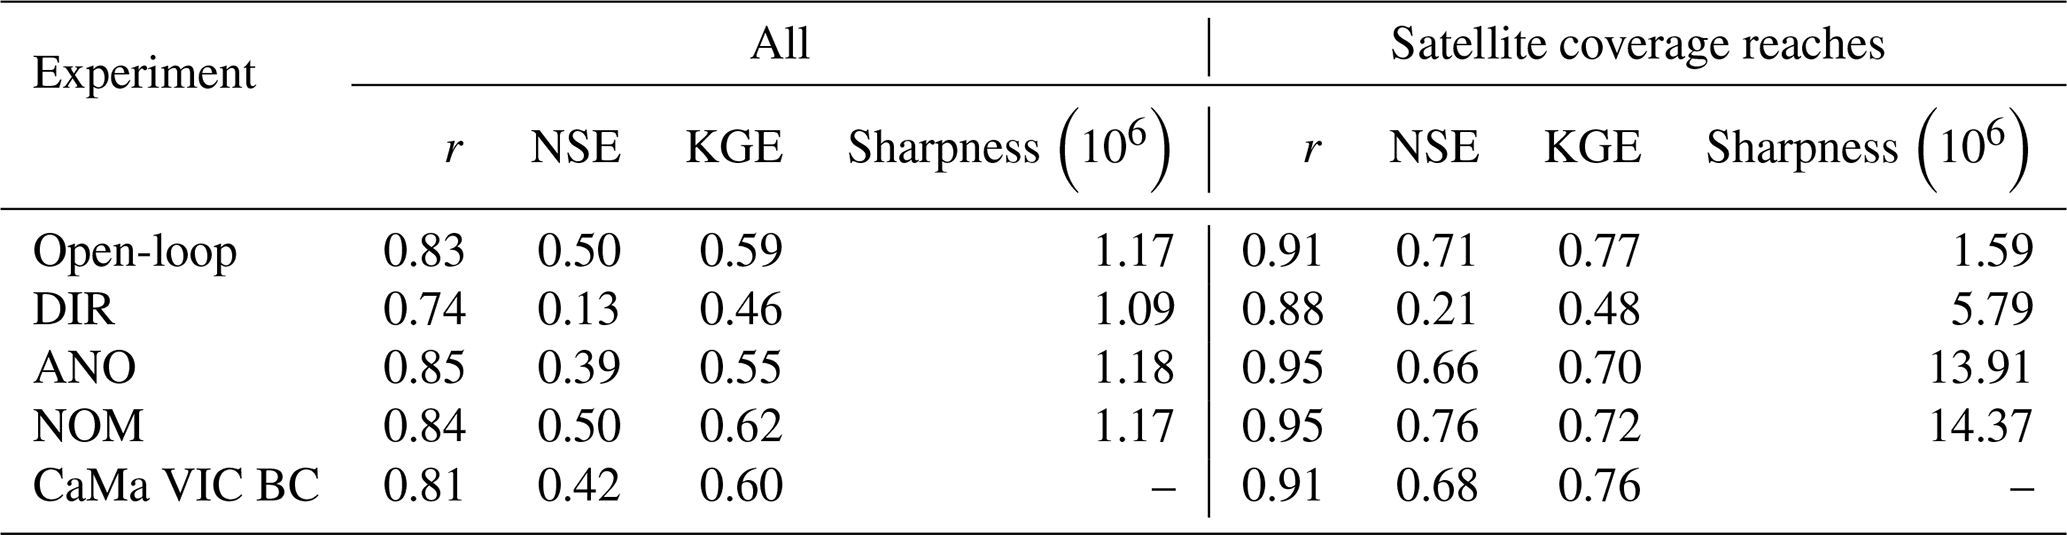
We used r, NSE, KGE, and Sharpness to evaluate daily assimilated river discharge across all experiments, and Table 3 presents the median statistics for each metric. We obtained the reported median values using all GRDC gauges in the Amazon basin (all) and, more conservatively, using river reaches with satellite altimetry observations (satellite coverage reaches), so the impact of assimilation on river reaches outside the satellite observation area was minimal. In general, the median performance metrics in satellite coverage river reaches were better than the median performance of all discharge gauges, whereas median Sharpness was worse in satellite coverage river reaches. Sharpness was determined with the average confidence bounds, and river reaches with satellite coverage have a high discharge, resulting in larger confidence intervals. Consequently, the median Sharpness estimate for river reaches with satellite coverage was inevitably large. When only river reaches with satellite observations were considered, the NSE of DIR was reduced. Flow patterns improved with the shift from direct to anomaly or normalized value DA. However, the differences between the anomaly and normalized DA experiments were marginal. Median NSE and KGE values increased in the following order: direct, anomaly, and normalized value DA experiments. However, the direct DA experiments efficiently improved Sharpness, thereby increasing confidence in the assimilated river discharge when reliability is higher. DIR had the lowest sharpness values for both the entire river and satellite-covered reaches.
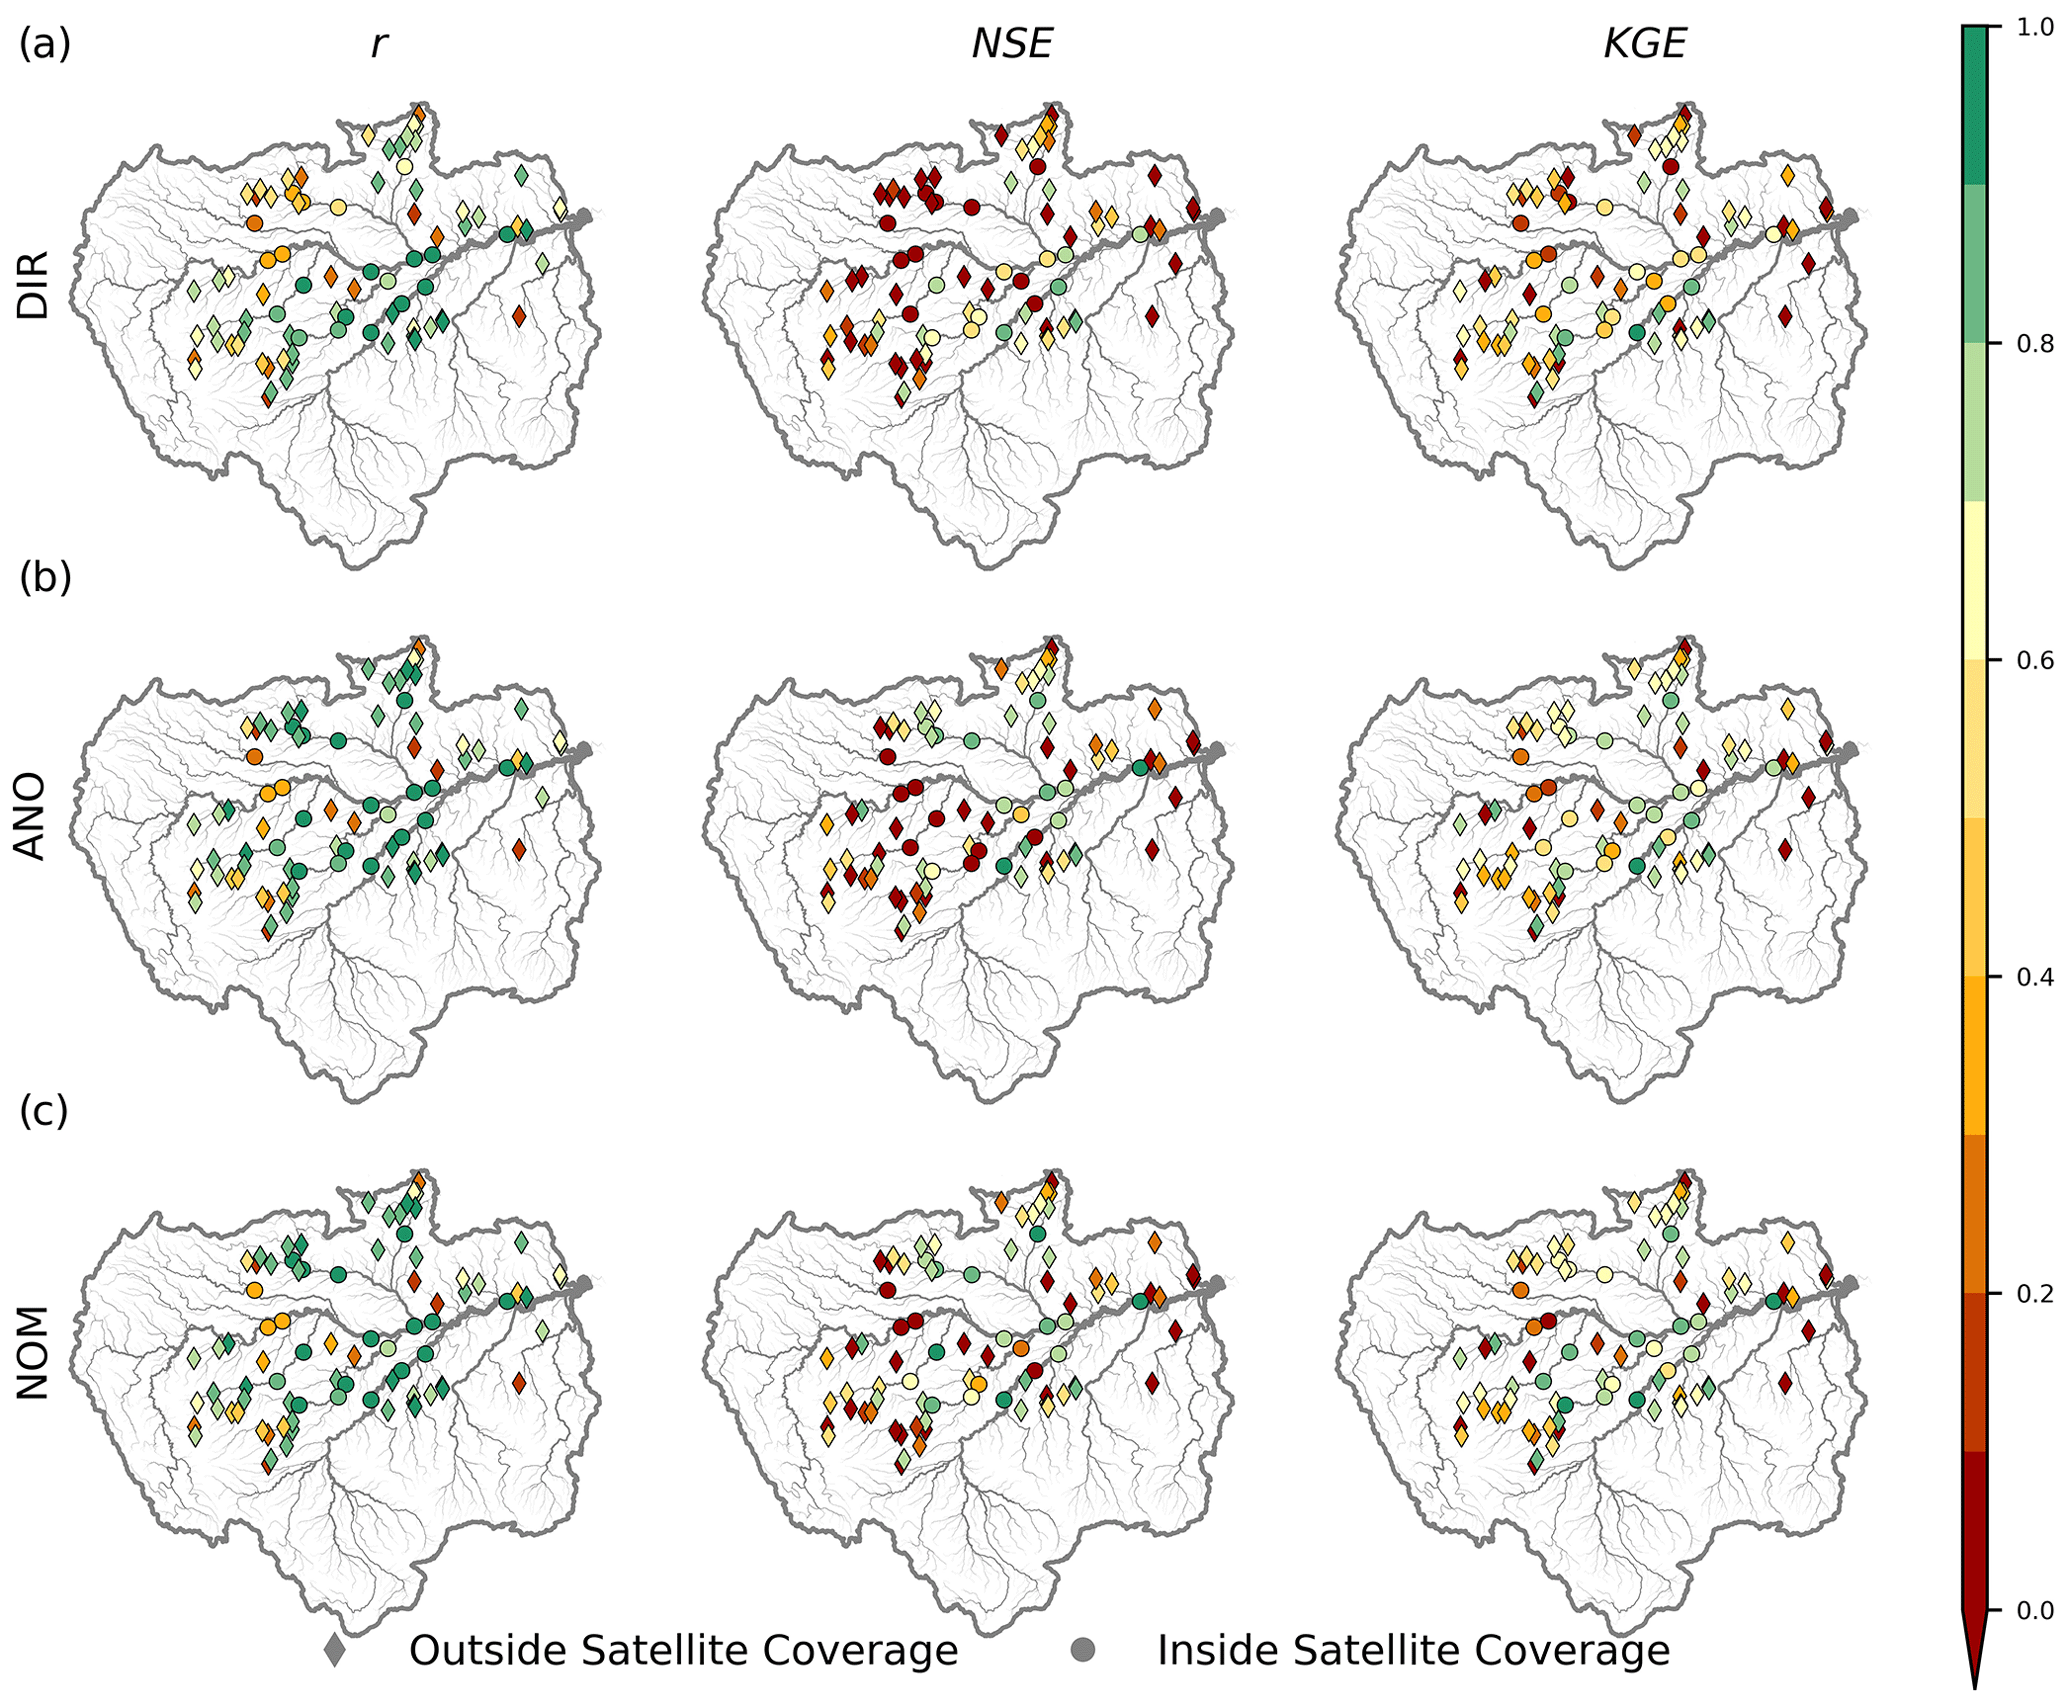
Figure 8Performance of daily discharge in terms of the correlation coefficient (r), Nash–Sutcliffe efficiency (NSE), and Kling–Gupta efficiency (KGE) for (a) DIR, (b) ANO, and (c) NOM. Diamonds and circles indicate the gauges outside and inside the satellite altimetry coverage, respectively.
Figure 8 shows the spatial distributions of absolute performance metrics (e.g., r, NSE, and KGE) for daily river discharge in all DA experiments (DIR, ANO, and NOM). Figure 8a depicts the spatial distribution of the absolute performance of river discharge estimates obtained in the direct DA experiment (DIR). The r of river discharge estimation for several GRDC gauges was >0.8 (approximately 38 %), with a median r of 0.74. NSE and KGE were >0.6 in 22 % and 34 % of gauges, respectively, and the median NSE and KGE were 0.13 and 0.46, respectively. Some gauges along the Negro, Jurua, and Upper Solimoes rivers had low accuracy for estimating river discharge through direct DA (DIR).
The spatial distribution of the absolute performance of river discharge estimation through anomaly DA is shown in Fig. 8b. Anomaly DA (ANO) produced r values of river discharge that were >0.8 in 84 % of gauges, with a median r=0.85. In the Amazon basin, overall river discharge was well characterized by anomaly DA (35 % of stations with NSE>0.6 and 48 % of stations with KGE>0.6).
Figure 8c illustrates the performance of NOM, showing better performance in large river reaches (catchment area>1000 km2). Nearly 57 % of the GRDC gauges had r>0.8, with a median r of 0.84 in NOM. The preponderance of gauges (76 %) had NSE>0.6, with a median NSE of 0.47. KGE values were greater than 0.6 for 92 % of the gauges, with a median of 0.62. Most gauges along the Amazon mainstem and Negro, Purus, Madeira, and Jurua rivers reliably estimated river discharge with assimilation of satellite altimetry using the normalized value DA method.
Table 3Median performance metrics for daily discharge estimates obtained from DA experiments. Median values for the correlation coefficient (r), Nash–Sutcliffe efficiency (NSE), Kling–Gupta efficiency (KGE), and width of the confidence interval (Sharpness) are presented for all GRDC gauges and for gauges in the satellite coverage area.
3.2.2 Estimation of water surface elevation
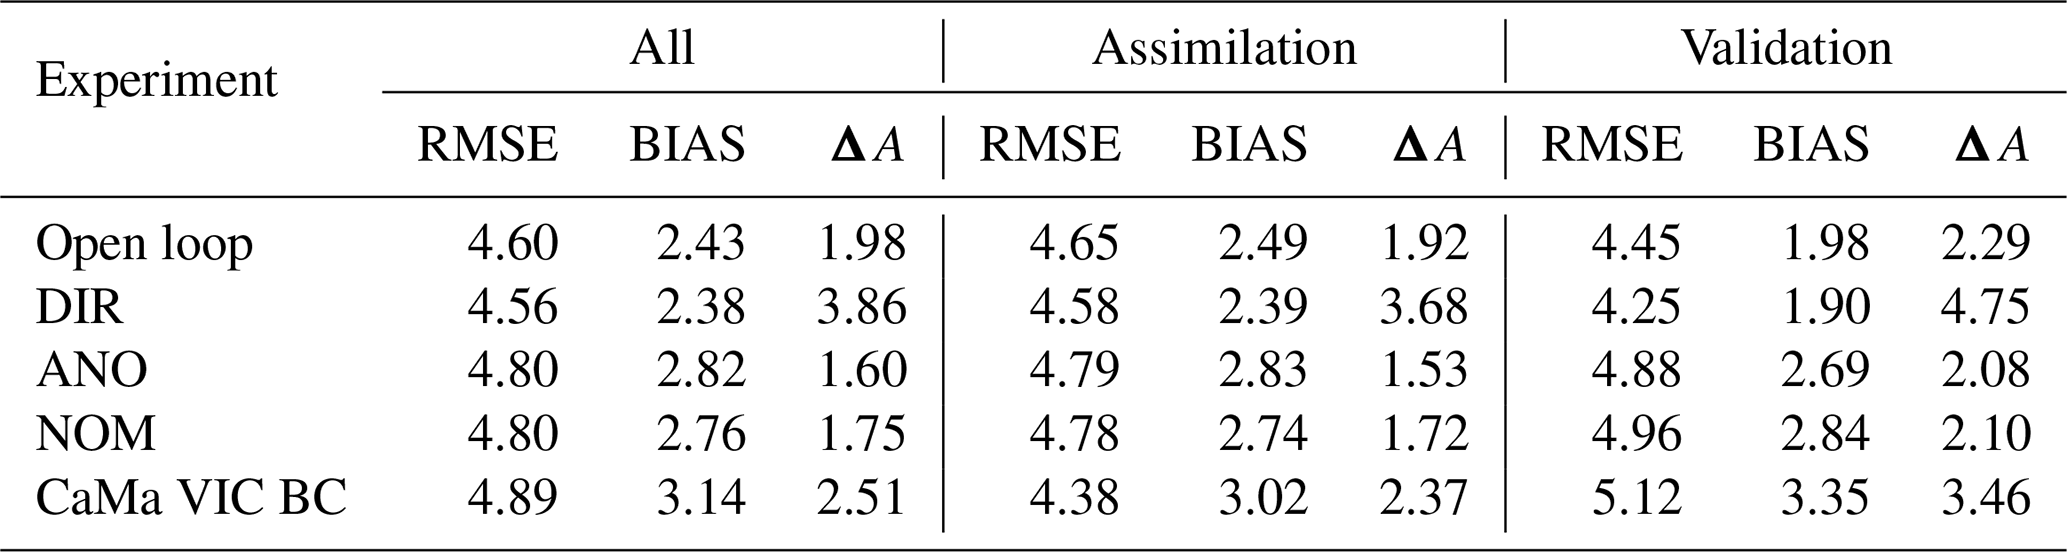
Although we used the river discharge to evaluate assimilation efficiency, WSE is an important water dynamic estimator, in particular for predicting floods. Table 4 summarizes the evaluation results of the assimilated WSE satellite altimetry measurements. We evaluated the RMSE, BIAS, and ΔA of WSE between assimilated and observed values. RMSE represents the total departure from observations, whereas BIAS denotes the difference in long-term mean values between simulation results and observations. The mean difference in the variation in the yearly peak and trough of the hydrograph was identified with ΔA. Transitioning from direct to normalized value assimilation did not reduce the RMSE or BIAS. Nevertheless, the anomaly and normalized assimilation methods improved the amplitude of WSE more than direct DA. Similar patterns were observed for the assimilation and validation VSs. The BIAS of WSE, which accounts for a considerable portion of the RMSE, was not corrected in the anomaly or normalized value assimilations.
Figure 9 illustrates the spatial distributions of the RMSE, BIAS, and ΔA of WSE for DIR (Fig. 9a), ANO (Fig. 9b), and NOM (Fig. 9c). Median RMSE and BIAS were lowest with direct DA (DIR), but ΔA was larger than in the anomaly and normalized value DA experiments for all, assimilation, and validation VSs. RMSE and BIAS were lower along the lower Amazon mainstem and Negro River compared to other river reaches. However, ΔA (>4 m) was less accurately estimated with direct DA than with other methods.
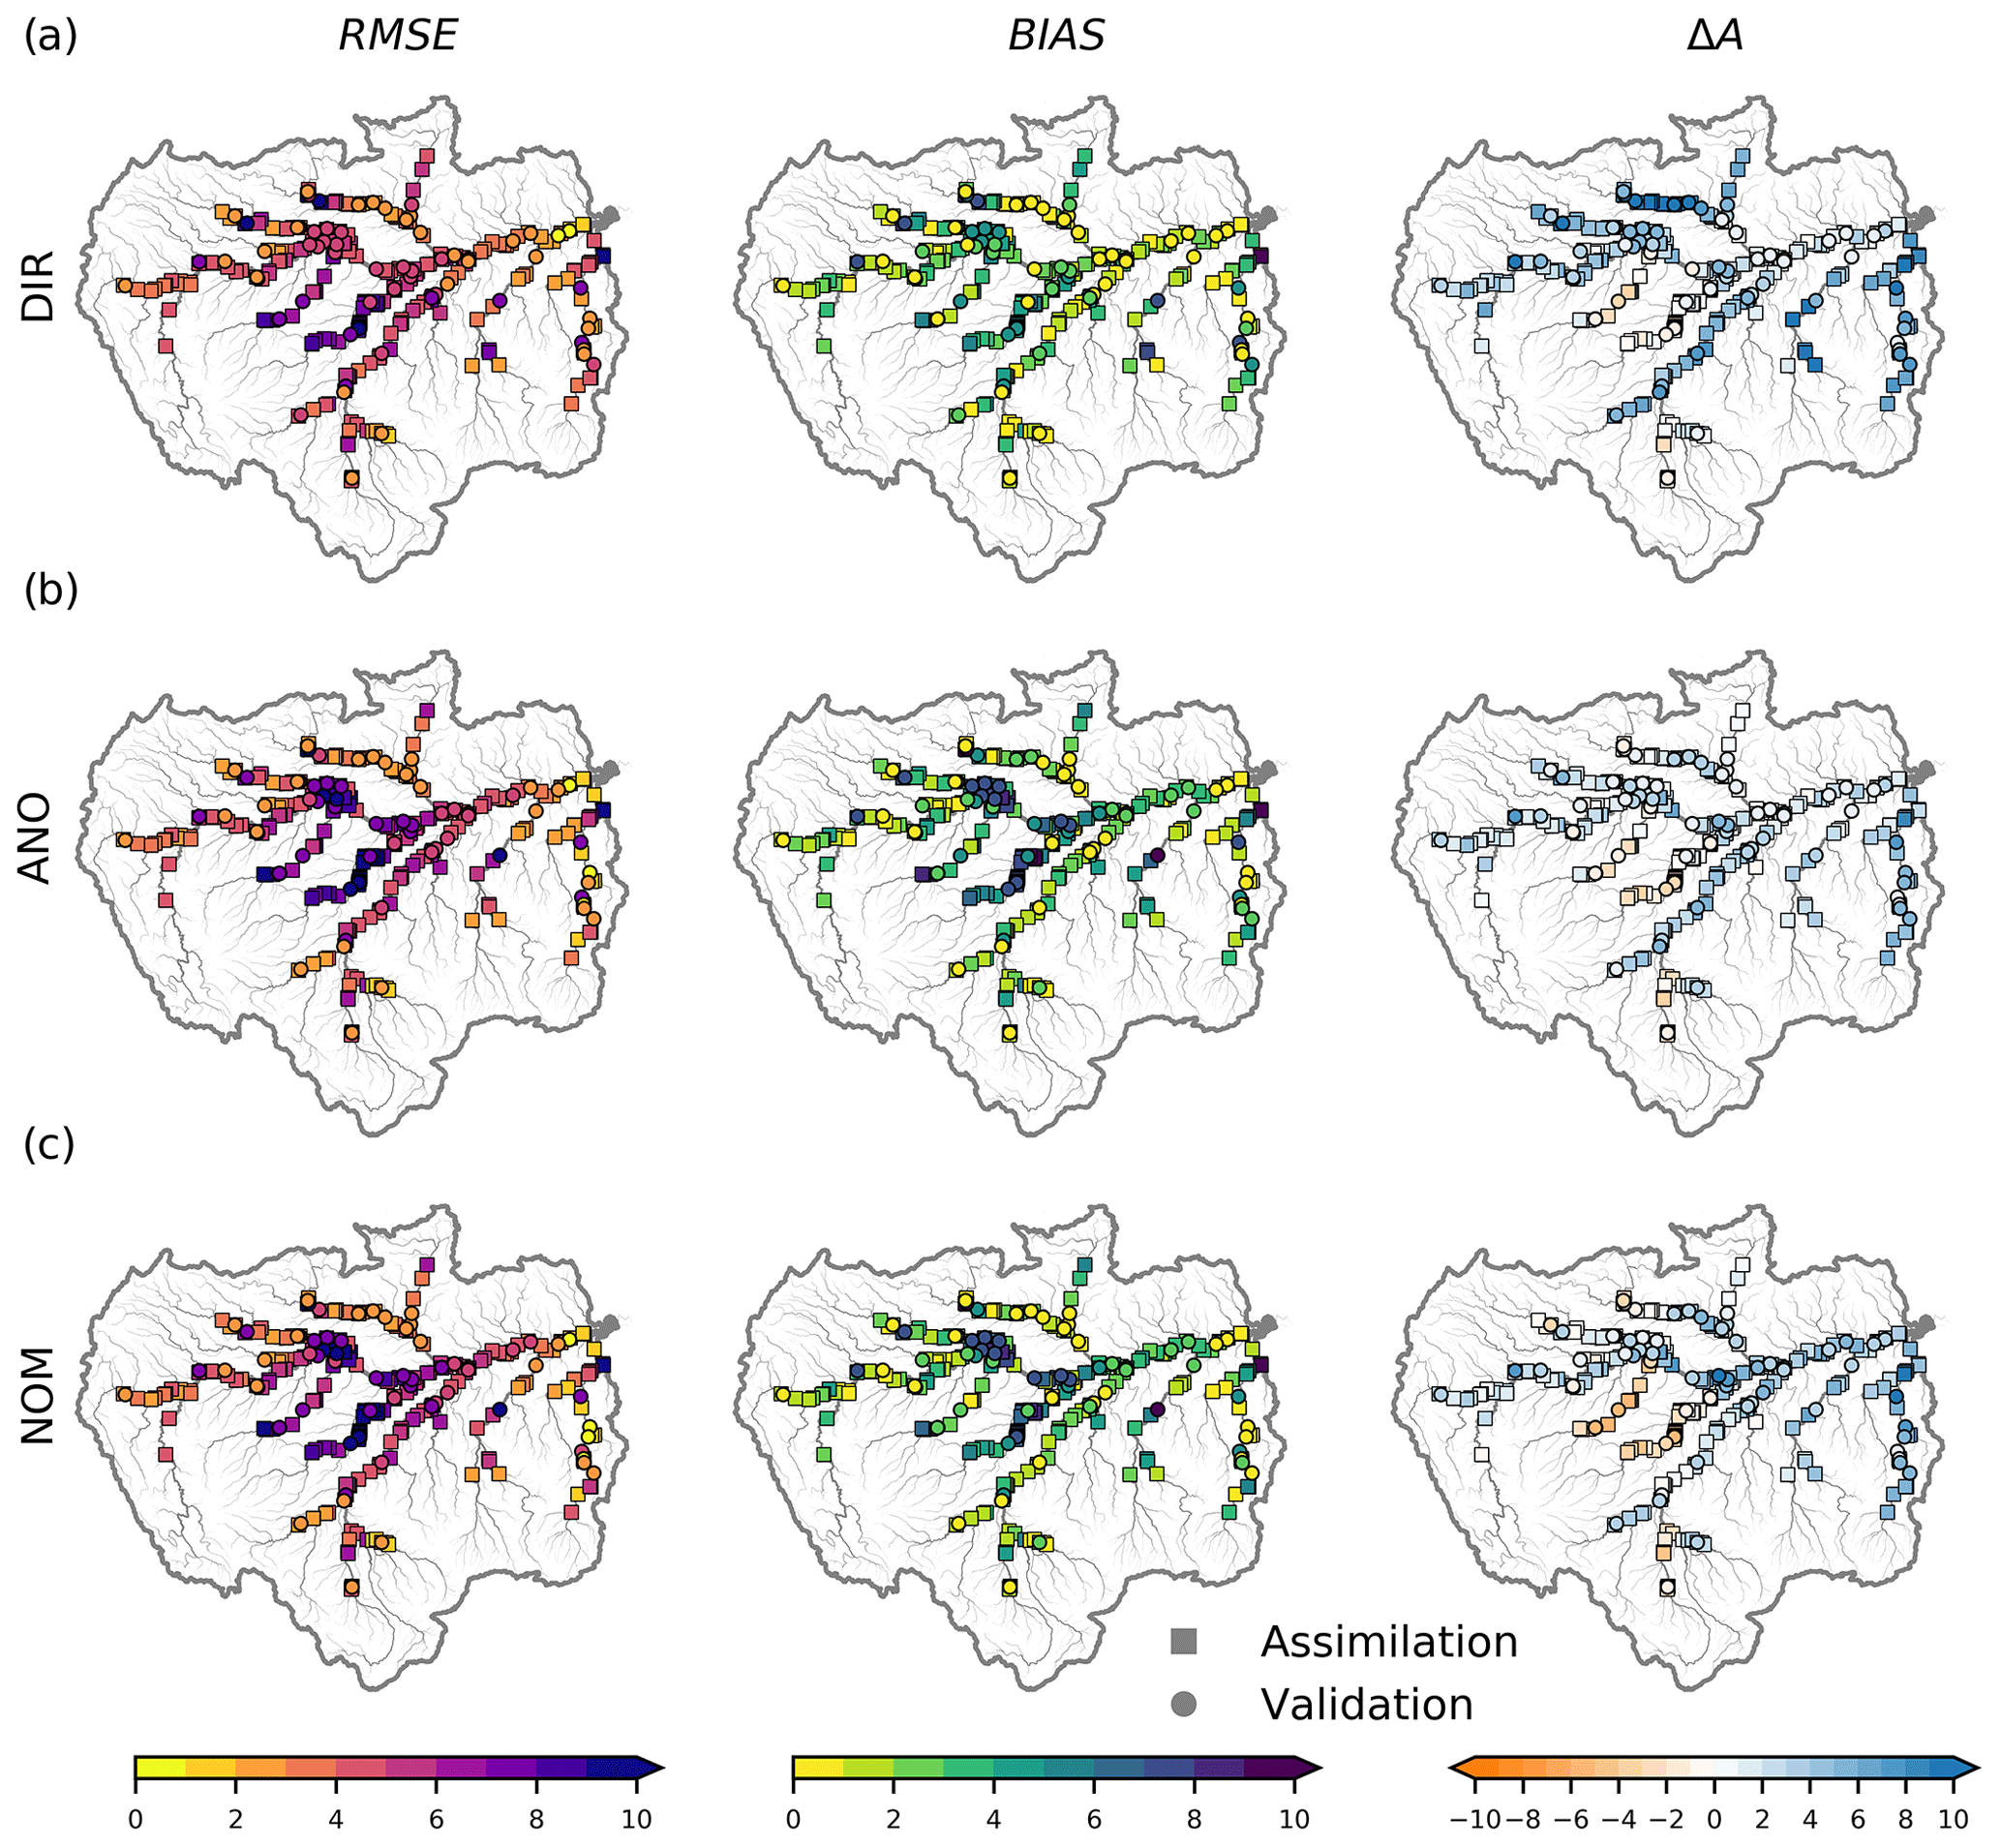
Figure 9Performance of water surface elevation estimation in terms of the root mean square error (RMSE), bias between assimilation results and observations (BIAS), and mean differences in amplitude between assimilation results and observations (ΔA) for (a) DIR, (b) ANO, and (c) NOM.
Large RMSE values (>4 m) were obtained for the Madeira, upper Purus, and upper Solimoes rivers in anomaly DA (ANO; Fig. 9b). Large BIAS values occurred in the Amazon mainstem, Purus River, and Japura River, with BIAS>4 m. The annual variation in WSE (amplitude) differed considerably in some areas of the Amazon and Negro River mainstems (ΔA>8 m).
With normalized DA (NOM), a large RMSE(>4 m) was observed in the Madeira River, downstream reaches of the Amazon mainstem, and upper Purus River. Large BIAS values occurred in the mid-section of the Amazon mainstem and Japura River (BIAS>6 m). ΔA was particularly high in some sections of the Amazon mainstem and Negro River (|ΔA|>8 m). In summary, direct DA estimated WSE with low RMSE and BIAS values, whereas the best ΔA was obtained with anomaly DA.
Table 4Median performance metrics for water surface elevation estimates obtained from DA experiments. Median values for the root mean square error (RMSE), long-term bias (BIAS), and difference in amplitude (ΔA) are presented for all, assimilation, and validation VSs.
3.3 Comparison of discharge products
To investigate the accuracy of river discharge estimation using DA compared to state-of-the-art hydrodynamic modeling, we compared the river discharge obtained from CaMa-Flood forced with bias-corrected variable infiltration capacity LSM (Liang et al., 1994) runoff data (VIC BC: Lin et al., 2019). We used VIC BC runoff (Lin et al., 2019) to force the discharge without DA, whereas the ensemble mean discharge was examined for all DA experiments (direct DA (DIR), anomaly DA (ANO), and normalized value DA (NOM)). VIC BC runoff is produced with sparse cumulative density function matching, and combining VIC BC runoff with the CaMa-Flood hydrodynamic model yields more accurate discharge estimates (Lin et al., 2019). A comparison of boxplots showing the NSE for various discharge products is presented in Fig. 10. The median NSE for discharge determined using CaMa-Flood standard settings (CaMa VIC BC) was 0.42. Normalized value assimilation (NOM) provided the best river discharge estimates, with a median NSE of 0.50, whereas direct and anomaly DA produced medians of 0.13 and 0.39, respectively. For normalized value DA, NSE values of river discharge were confined to around 0.5, with many of the gauges demonstrating NSE values greater than zero. Hence, normalized value assimilation improved the NSE of river discharge compared to standard CaMa-Flood modeling and the other DA methods tested (i.e., anomaly and direct assimilation).
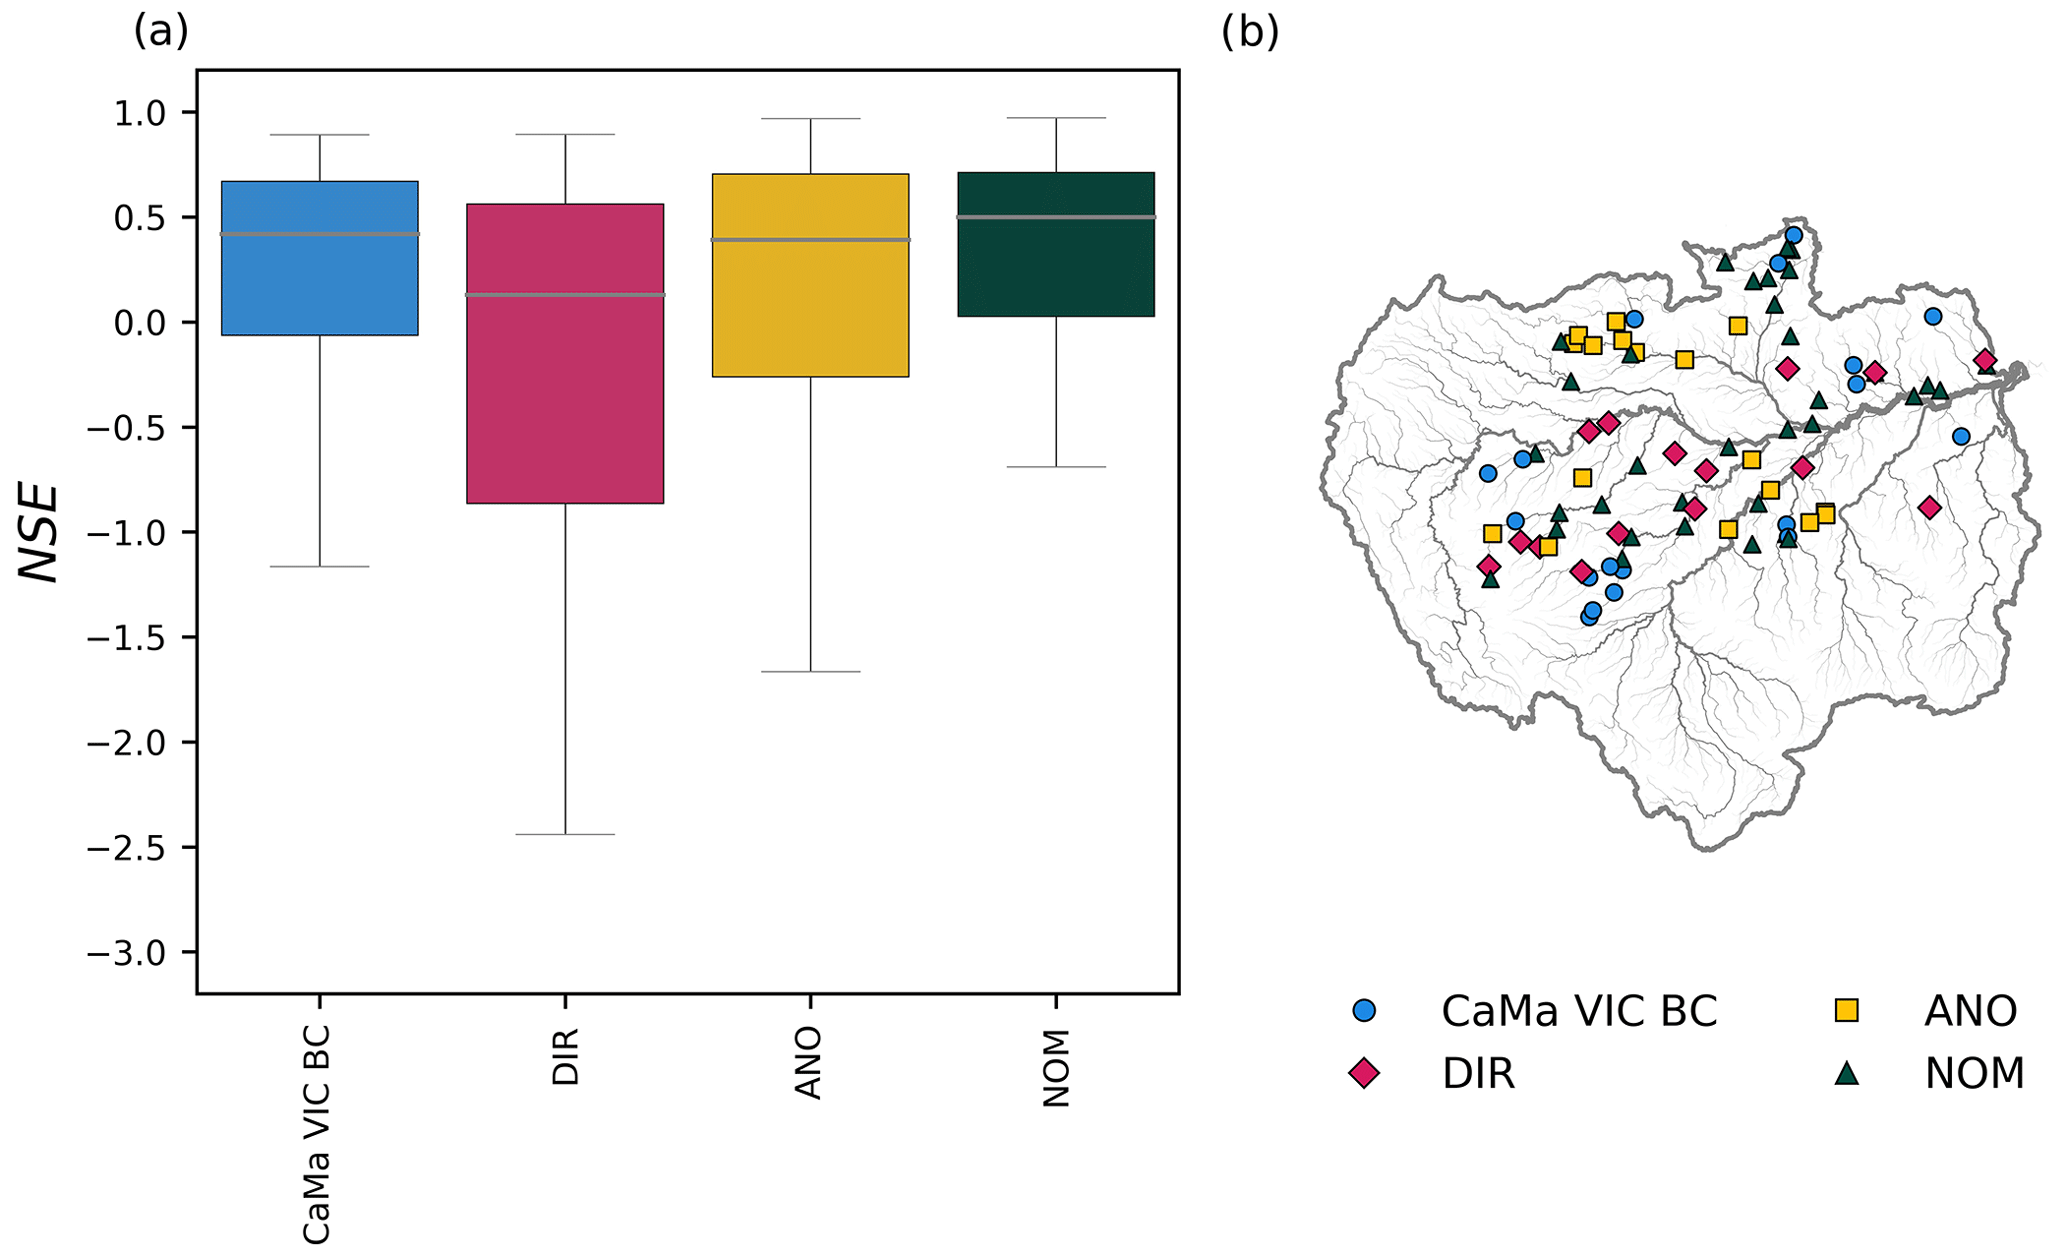
Figure 10(a) Boxplot of Nash–Sutcliffe efficiency (NSE) for discharge simulated using CaMa-Flood with VIC bias-corrected runoff (CaMa-Flood VIC BC), ensemble mean assimilated river discharge with direct DA (DIR), ensemble mean assimilated river discharge with anomaly DA (ANO), and ensemble mean assimilated river discharge with normalized value DA (NOM). (b) Spatial distribution of the best discharge estimates among CaMa VIC BC, DIR, ANO, and NOM based on NSE.
Assessing the spatial distribution of the optimal discharge product is critical to improving discharge estimates globally. Figure 10b shows the heterogeneity of the optimal discharge estimate among the four products. River discharge was compared based on the NSE of each discharge product. NOM, which accounted for 44 % of the gauges, most accurately estimated discharge overall. ANO estimated river discharge more accurately for 24 % of the GRDC gauges. Direct DA provided better estimates for 23 % of the gauges, whereas CaMa VIC BC estimated river discharge accurately for 8 % of the gauges. Note that the discharge estimates of some of the gauges located on the Amazon mainstem were better without DA. Most gauges with the most accurate discharge estimates of CaMa-Flood VIC BC were located outside of the satellite-observed river reaches and were marginally affected by DA.
In conclusion, normalized value DA (NOM) performed best for estimating river discharge, but uncalibrated CaMa-Flood simulations without DA (i.e., CaMa VIC BC) were more accurate than other DA methods (i.e., direct and anomaly assimilation). Hence, assimilating satellite altimetry can improve the accuracy of river discharge estimates compared to current state-of-the-art hydrodynamic modeling.
4.1 DA performance with current hydrodynamic models
We compared several DA methods to overcome the errors associated with assimilating satellite altimetry observations directly into a hydrodynamic model. Through the assimilation of anomalies or normalized values, river discharge estimation was improved considerably compared to direct DA (Fig. 7). Although WSE was correctly assimilated with direct DA (Fig. 9a), river discharge estimates were inaccurate because of parameter errors and discrepancies in flow dynamics driven by limited representation of actual physical phenomena (as illustrated in Fig. 2). These biases can be caused by discrepancies in parameters such as riverbank full height and river bottom elevations. For example, when river channel depth was overestimated in the model, the simulated WSE was lower than the observations. When assimilated WSE was converted into the CaMa-Flood prognostic variable (i.e., storage), the initial condition could be erroneous. Such errors were propagated to river discharge. In areas where the simulated water dynamics (e.g., amplitude and flow regime) were similar to observations, anomaly assimilation limited the extent to which the biases affected assimilation (Emery et al., 2020a; Paiva et al., 2013a; Wongchuig-Correa et al., 2020). Although spurious errors (due to limited ensemble size) were regulated using physically based empirical localization patches (Revel et al., 2019), direct DA was adulterated because of the biases and dynamic differences in WSE simulations.
Normalized value assimilation showed better assimilation efficiency in terms of NSEAI, representing the overall accuracy of discharge estimation, compared to the anomaly DA method (Fig. 7). Currently the CaMa-Flood hydrodynamic model cannot accurately represent the dynamics of WSE because of limitations in the model framework (e.g., a lack of representation of water regulations, diversions, and lake dynamics) and the impacts of water dynamics other than river flow. These limitations also exist for most global hydrodynamic models, which do not accurately represent reservoirs, diversions, and lakes (Fleischmann et al., 2021). For example, when reservoir operations are not represented in a hydrodynamic model, assimilating observations obtained during reservoir operation will alter the flow regime. In addition, errors related to the model structure hamper the prediction of surface water dynamics and may produce a different flow dynamic than the observations. Therefore, normalized value assimilation provided the best estimates of river discharge given the current limitations of models such as biases and poor representation of flow dynamics.
Moreover, the assimilation framework is computationally efficient and effective at removing spurious correlations. LETKF is a computationally efficient filtering method that uses a local area for the assimilation (Hunt et al., 2007; Miyoshi and Yamane, 2007). In addition, we used a physically based empirical localization technique (Revel et al., 2019) to reduce erroneous correlations and assimilate observations in significantly correlated areas. It has been found that the physically based empirical localization method performed better than the conventional square-shaped local patches in hydrodynamic DA schemes (El Gharamti et al., 2021; Ishitsuka et al., 2020; Revel et al., 2019; Wongchuig et al., 2019). Hence, the assimilation framework is capable of estimating river discharge at the global scale provided satellite observations are available. Once the SWOT satellite is launched, the methods developed in this study will be valuable for accurately estimating river discharge.
4.2 DA performance under various conditions
To examine DA performance under model conditions such as biased runoff forcing and corrupted river bathymetry, we performed biased runoff and corrupted bathymetry experiments. An artificial bias of −50 % was introduced into the ensemble mean of the “runoff ensemble” (Fig. 1a) for each assimilation approach, namely, direct DA, anomaly DA, and normalized value DA (Sect. S2, Fig. S4 in the Supplement). Because of the bias introduced by the runoff forcing, river discharge was approximately 50 % lower in the open-loop simulation than in the observations. We artificially corrupted the river bathymetry to represent errors in the hydrodynamic model (Sect. S3, Fig. S5 in the Supplement). River channel depth was increased by 25 % in the corrupted bathymetry experiment. Then we assimilated satellite altimetry into the hydrodynamic model with corrupted river bathymetry through the direct, anomaly, and normalized value DA methods. In general, the WSE was reduced by approximately 25 % of the river channel depth. For simplicity, we used only a single runoff (HTESSEL; Balsamo et al., 2011) from E2O WRR2 to prepare the runoff ensemble. The HTESSEL runoff from E2O WRR2 is fairly unbiased (Dutra et al., 2017; Revel et al., 2021), and the default bathymetry parameter of CaMa-Flood should provide adequate WSE estimates (Yamazaki et al., 2012). Simulations using the default CaMa-Flood bathymetry parameter and HTESSEL runoff are referred to as “normal conditions”.

Figure 11Comparison of the Nash–Sutcliffe efficiency (NSE) of assimilated river discharge under various conditions: (a) without runoff bias or bathymetry error, (b) without runoff bias and with bathymetry error, (c) with runoff bias and without bathymetry error, and (d) with runoff bias and bathymetry error. The direct, anomaly, and normalized value DA results are represented in blue, yellow, and red, respectively.
Runoff bias and bathymetry errors affect the accuracy of assimilated river discharge in different ways, and Fig. 11 compares boxplots of NSE values for different DA methods with different error conditions. When neither runoff nor bathymetry was erroneous, the normalized value DA method performed best (median NSE=0.83) at estimating river discharge in terms of NSE (Fig. 11a). When the bathymetry contained some errors but runoff was unbiased (Fig. 11b), none of the DA methods were able to improve the river discharge from open-loop simulation. The performance of river discharge in the open-loop simulation was not affected much by the river bathymetry corruption, as river discharge is not influenced much by the river bathymetry (Modi et al., 2022). But when the satellite altimetry was assimilated into the hydrodynamic model, the accuracy of the river discharge estimates was degraded. In the direct DA, assimilated WSE values were higher than the observed WSE, resulting in river discharge overestimation when the bathymetry has errors (Sect. S5, Fig. S7 in the Supplement). In contrast, anomaly and normalized value DA were affected by the bias in the open-loop statistics (i.e., mean and standard deviation) used for generating anomalies and normalized values (Sect. S5, Fig. S7 in the Supplement). Bias in the runoff ensemble strongly affected the accuracy of river discharge estimation with anomaly and normalized value DA, as bias in the runoff causes bias in the mean and standard deviation used to generate WSE anomalies and normalized values (Fig. 11c). Direct DA provided the best discharge estimation (median NSE=0.68) when runoff was biased. When both runoff and river bathymetry were erroneous, none of the DA methods produced better discharge estimates than open-loop simulation. Therefore, the normalized DA method worked well under normal conditions, but anomaly DA produced better discharge estimates when the river bathymetry had errors, and the direct DA method performed best under runoff-biased conditions. Simple calibration of the hydrodynamic model is recommended for successful normalized value DA (i.e., bias correction of runoff to obtain the mean discharge and river bathymetry calibration to accurately determine the mean WSE).
4.3 DA performance with calibrated river bathymetry
Investigating the performance of DA with corrected bathymetry is essential, as river bathymetry is the most influential parameter for WSE (Brêda et al., 2019). Calibrating the river bathymetry increases the accuracy of the hydraulic relationship between discharge and WSE (i.e., the rating curve; Zhou et al., 2022), thereby improving discharge estimation with direct DA (median ; Fig. 12). Minimization of the WSE bias attributable to river bathymetry improved discharge estimates obtained with the direct DA method, although the anomaly and normalized value DA approaches had little effect on the estimation of river discharge (Fig. 12b and c). River discharge estimation can be improved by updating river-related parameters. However, anomaly and normalized value assimilation (with and without river bathymetry calibration) had greater assimilation efficiencies than direct DA with the calibrated model. Therefore, correcting river-related parameters is essential to achieving good river discharge estimates with direct DA.

Figure 12Boxplot comparison of Nash–Sutcliffe efficiency-based assimilation index (NSEAI) values for uncalibrated and calibrated models with (a) direct DA, (b) anomaly DA, and (c) normalized value DA.
Furthermore, the bathymetry parameters calibrated with the rating curve approach were the most accurate values attainable under current conditions (Zhou et al., 2022). However, direct DA was not capable of producing more accurate river discharge estimates than other DA approaches (i.e., anomaly and normalized value DA; Fig. 12). This finding indicates that calibrating a single parameter (i.e., river bathymetry) may be insufficient to improve the overall accuracy of river discharge estimation using direct DA. Hence, calibrating other river-related parameters (e.g., riverbank height, floodplain profile, and cross-sectional shape) is necessary to increase assimilation efficiency (median NSEAI>0) when assimilating satellite altimetry data directly into large-scale hydrodynamic models such as CaMa-Flood.
Direct DA offers several benefits over anomaly or normalized value assimilation. Although the direct DA approaches reduced overall accuracy, the sharpness of the ensemble spread was substantially reduced compared to the anomaly and normalized value DA approaches (e.g., Fig. 4c–e). In addition, the improvement in the accuracy of river discharge estimates with the anomaly or normalized value assimilation was lower in river reaches with high biases in open-loop runoff estimation (Sect. S4, Fig. S6 in the Supplement). This finding suggests that direct DA methods can be used to correct river discharge values in river reaches where runoff causes large biases but the river bathymetry parameter is reasonably accurate. By contrast, the reliability of discharge estimates in the anomaly and normalized DA experiments was highly dependent on the quality of the runoff ensemble. Therefore, direct assimilation has several advantages, such as greater confidence in DA-estimated river discharge and accurate discharge estimation even when the runoff ensemble is biased.
4.4 Potential and limitations of river hydrodynamics DA
The development of a discharge reanalysis product (such as those described by Feng et al., 2021 and Wongchuig et al., 2019) is crucial to evaluating the reliability of the assimilated discharge product within the capabilities of current hydrodynamic modeling. In addition, reanalyses of river discharge play an important role in biodiversity and biogeochemistry research (Messager et al., 2021). Discharge estimated from the assimilation of satellite altimetry characterized the flow dynamics of the Amazon basin better than estimates from a state-of-the-art hydrodynamic model (Fig. 10). However, CaMa-Flood modeled river discharge better than the assimilated product in certain river reaches along the Amazon mainstem. These discrepancies are primarily due to the limitations of hydrodynamic modeling, as the assimilated WSEs were adequately represented in the assimilated simulation. As we assimilated WSE and corrected the initial conditions of the following time step using CaMa-Flood parameters (e.g., riverbank height, river bathymetry, river width, and floodplain profile), the errors of the modeling framework may have propagated into the river discharge estimates at the next time step. These limitations can be circumvented through the assimilation of in situ or remotely sensed river discharge observations into hydrodynamic models (Emery et al., 2020b; Feng et al., 2021; Paiva et al., 2013a; Wongchuig et al., 2019). Yet, with decreasing numbers of in situ gauges (Hannah et al., 2011; Shiklomanov et al., 2002; Vörösmarty et al., 2001) and the low accuracy of remotely sensed river discharge estimates (Bjerklie et al., 2018; Gleason and Durand, 2020; Gleason and Smith, 2014), obtaining consistent and reliable observations can be difficult.
DA of satellite altimetry had several advantages over hydrodynamic modeling, in particular when it came to accurately estimating low flows and unanticipated peaks that were not reflected in the runoff forcing (Fig. S8). These unexpected peaks, which were not as large as annual peaks, were characterized well by DA methods (Fig. S8), although the open-loop simulation did not identify them. Low flows were estimated well with normalized assimilation (Sect. S6, Fig. S9 in the Supplement) and further improved through calibration of the river bottom elevation (Sect. S4, Fig. S6 in the Supplement). Hence, the DA scheme accurately represented low flows and unforeseen secondary peaks.
The normalized DA approach may have been unable to accurately predict other variables, such as WSE and flood extent, as the assimilation was performed in transformed space. WSE estimation using normalized value DA had lower overall accuracy than direct DA (Fig. 7) based on median RMSE (Table 4). Moreover, flood extent would be better estimated with direct DA than other DA methods, as flood extent is diagnosed with WSE in the CaMa-Flood hydrodynamic model. Hence, normalized DA may be unable to effectively predict various important variables (e.g., WSE and flood extent).
This study explored strategies for assimilating satellite altimetry data into a contemporary hydrodynamic model. As existing large-scale hydrodynamic models either are too conceptual or have uncertainties in their parameter schemes, direct or anomaly assimilation of satellite altimetry may introduce inaccuracies due to discrepancies between satellite altimetry and simulated WSE. We assessed direct, anomaly, and normalized value DA schemes using a continental-scale hydrodynamic model, CaMa-Flood (Yamazaki et al., 2011). We used the physically based localization approach of LETKF to assimilate satellite altimetry data in the Amazon basin. Normalized value assimilation performed better than other approaches to estimating river discharge in this continental-scale basin. River discharge was accurately estimated with normalized value assimilation in most river reaches covered by satellite observations (NSE>0.6).
We investigated the capacity of DA approaches to reliably estimate river discharge through cutting-edge hydrodynamic modeling. River discharge was well characterized in the normalized value assimilation experiment, with a median NSE of ≈0.50, which was better than the river discharge produced by the uncalibrated model with default parameters using VIC BC runoff (Lin et al., 2019) (median NSE≈0.42). The median NSE of river discharge improved by 19 % with the assimilation of satellite altimetry into a continental-scale hydrodynamic model. Improvements were evident across the entire Amazon basin; however, some degradation occurred due to the underestimation of peak river discharge in the Amazon mainstem. This underestimation of peaks may be attributable to uncertainties in other parameters of the hydrodynamic model.
The estimation of river discharge using DA methods is variable and depends on the state of the runoff data (i.e., biased runoff state) and the accuracy of river cross-sectional parameters (e.g., river bathymetry). In the current condition of the hydrodynamic model with perturbed HTESSEL runoff from the E2O WRR2 data set, the normalized value DA method performed best among other DA methods. But when the runoff was biased without river bathymetry error, the direct DA approach performed best. However, when the river bathymetry was erroneous, none of the DA methods performed better than open-loop simulation. Hence, different DA approaches should be used depending on the runoff and river bathymetry. To realize the advantages of the normalized value DA approach, basic model calibration is necessary, such as calibration of the runoff to capture the mean discharge and moderate calibration of bathymetry to capture WSE patterns.
River bathymetry calibration enhanced the accuracy of the river discharge estimates produced using the direct DA method but had minimal effect on normalized assimilation. Zhou et al. (2022) used a calibration strategy to increase the accuracy of river bathymetry by decreasing the WSE error by utilizing the stage–discharge relationship; they found that the approach does not necessarily improve river discharge accuracy. In addition, when the calibrated model was forced by runoff with large errors, normalized DA did not improve the estimation of river discharge because of bias in the mean discharge and WSE. The quality of runoff perturbation data should be evaluated before they are used in anomaly or normalized value assimilations.
The use of precise river cross-section estimates and floodplain dynamic processes may improve peak discharge estimates. To represent the river discharge more accurately, some improvements to the CaMa-Flood hydrodynamic model may be necessary. Furthermore, assimilating multiple variables such as river discharge, WSE, and the flooded area may improve discharge estimates further. Overall, the methods developed in this study demonstrate great potential for using available satellite altimetry to improve river discharge estimation in continental-scale rivers within the limitations of current hydrodynamic models.
The DA code is open source and freely available from https://github.com/MenakaRevel/HydroDA.git (last access: 14 December 2022) or https://doi.org/10.5281/zenodo.6506861 (Revel et al., 2022b). CaMa-Flood is freely available from https://doi.org/10.5281/zenodo.4609654 (Yamazaki et al., 2021) or https://github.com/global-hydrodynamics/CaMa-Flood_v4 (last access: 14 December 2022) (Yamazaki et al., 2011).
The key data sets used in this study are available from https://doi.org/10.4211/hs.08e1b18aa9f240758dd13d9ac875621f (Revel et al., 2022a). Satellite altimetry data used in this study can be obtained from https://hydroweb.theia-land.fr/ (Hydroweb, 2022). GRDC river discharge observations are available from https://portal.grdc.bafg.de (GRDC, 2022). Runoff data from E2O WRR2 can be accessed at https://wci.earth2observe.eu (earth2observe, 2022).
MR and DY designed the experiments. MR developed the code for the simulations. XZ provided data for the experiments. MR, XZ, DY, and SK reviewed and edited the manuscript.
The contact author has declared that none of the authors has any competing interests.
Publisher’s note: Copernicus Publications remains neutral with regard to jurisdictional claims in published maps and institutional affiliations.
We thank Daiki Ikeshima, Tokyo Institute of Technology, Japan for his technical support for this study. We also would like to thank three anonymous reviewers.
This work was supported by the Japan Society for the Promotion of Science (JSPS) under KIBAN-S grant nos. 21H05002 and JSPS KIBAN-B 20H02251.
This paper was edited by Albrecht Weerts and reviewed by three anonymous referees.
Anderson, J. L.: Exploring the need for localization in ensemble data assimilation using a hierarchical ensemble filter, Physica D, 230, 99–111, https://doi.org/10.1016/j.physd.2006.02.011, 2007.
Andreadis, K. M. and Schumann, G. J. P.: Estimating the impact of satellite observations on the predictability of large-scale hydraulic models, Adv. Water Resour., 73, 44–54, https://doi.org/10.1016/j.advwatres.2014.06.006, 2014.
Andreadis, K. M., Clark, E. A., Lettenmaier, D. P., and Alsdorf, D. E.: Prospects for river discharge and depth estimation through assimilation of swath-altimetry into a raster-based hydrodynamics model, Geophys. Res. Lett., 34, L10403, https://doi.org/10.1029/2007GL029721, 2007.
Balsamo, G., Dutra, E., Beljaars, A. and Viterbo, P.: Evolution of land-surface processes in the IFS, ECMWF Newsl., 127, 17–22, https://doi.org/10.21957/x1j3i7bz, 2011.
Bannoura, W. J.: NOAA Ocean Surface Topography Mission Jason-2 Project Overview Dwaraka Nath Srinivas The OSTM/Jason-2 Mission Phases Mission Roles & Responsibilities Jason-2 System Overview, Proceedings of OCEANS 2005 MTS/IEEE, 1–5, 2001.
Bates, P. D., Horritt, M. S. and Fewtrell, T. J.: A simple inertial formulation of the shallow water equations for efficient two-dimensional flood inundation modelling, J. Hydrol., 387, 33–45, https://doi.org/10.1016/j.jhydrol.2010.03.027, 2010.
Best, M. J., Pryor, M., Clark, D. B., Rooney, G. G., Essery, R. L. H., Ménard, C. B., Edwards, J. M., Hendry, M. A., Porson, A., Gedney, N., Mercado, L. M., Sitch, S., Blyth, E., Boucher, O., Cox, P. M., Grimmond, C. S. B., and Harding, R. J.: The Joint UK Land Environment Simulator (JULES), model description – Part 1: Energy and water fluxes, Geosci. Model Dev., 4, 677–699, https://doi.org/10.5194/gmd-4-677-2011, 2011.
Biancamaria, S., Durand, M., Andreadis, K. M., Bates, P. D., Boone, A., Mognard, N. M., Rodríguez, E., Alsdorf, D. E., Lettenmaier, D. P., and Clark, E. A.: Assimilation of virtual wide swath altimetry to improve Arctic river modeling, Remote Sens. Environ., 115, 373–381, https://doi.org/10.1016/j.rse.2010.09.008, 2011.
Biancamaria, S., Lettenmaier, D. P. and Pavelsky, T. M.: The SWOT Mission and Its Capabilities for Land Hydrology, Surv. Geophys., 37, 307–337, https://doi.org/10.1007/s10712-015-9346-y, 2016.
Birkett, C. M., Mertes, L. A. K., Dunne, T., Costa, M. H., and Jasinski, M. J.: Surface water dynamics in the Amazon Basin: Application of satellite radar altimetry, J. Geophys. Res.-Atmos., 107, LBA 26-1–LBA 26-21, https://doi.org/10.1029/2001JD000609, 2002.
Bjerklie, D. M., Birkett, C. M., Jones, J. W., Carabajal, C., Rover, J. A., Fulton, J. W., and Garambois, P. A.: Satellite remote sensing estimation of river discharge: Application to the Yukon River Alaska, J. Hydrol., 561, 1000–1018, https://doi.org/10.1016/j.jhydrol.2018.04.005, 2018.
Brêda, J. P. L. F., Paiva, R. C. D., Bravo, J. M., Passaia, O. A., and Moreira, D. M.: Assimilation of Satellite Altimetry Data for Effective River Bathymetry, Water Resour. Res., 55, 7441–7463, https://doi.org/10.1029/2018WR024010, 2019.
Builes-Jaramillo, A. and Poveda, G.: Conjoint Analysis of Surface and Atmospheric Water Balances in the Andes-Amazon System, Water Resour. Res., 54, 3472–3489, https://doi.org/10.1029/2017WR021338, 2018.
Burek, P., Van Der Knijff, M., J., and de Roo, A.: LISFLOOD distributed water balance and flood simulation model revised user manual, Joint Research Centre, Ispra, Italy, https://doi.org/10.2788/24719, 2013.
Clark, D. B., Mercado, L. M., Sitch, S., Jones, C. D., Gedney, N., Best, M. J., Pryor, M., Rooney, G. G., Essery, R. L. H., Blyth, E., Boucher, O., Harding, R. J., Huntingford, C., and Cox, P. M.: The Joint UK Land Environment Simulator (JULES), model description – Part 2: Carbon fluxes and vegetation dynamics, Geosci. Model Dev., 4, 701–722, https://doi.org/10.5194/gmd-4-701-2011, 2011.
Clark, M. P., Rupp, D. E., Woods, R. A., Zheng, X., Ibbitt, R. P., Slater, A. G., Schmidt, J., and Uddstrom, M. J.: Hydrological data assimilation with the ensemble Kalman filter: Use of streamflow observations to update states in a distributed hydrological model, Adv. Water Resour., 31, 1309–1324, https://doi.org/10.1016/j.advwatres.2008.06.005, 2008.
Crétaux, J. F., Calmant, S., Romanovski, V., Shabunin, A., Lyard, F., Bergé-Nguyen, M., Cazenave, A., Hernandez, F., and Perosanz, F.: An absolute calibration site for radar altimeters in the continental domain: Lake Issykkul in Central Asia, J. Geodesdy, 83, 723–735, https://doi.org/10.1007/s00190-008-0289-7, 2009.
De Paiva, R. C. D., Buarque, D. C., Collischonn, W., Bonnet, M. P., Frappart, F., Calmant, S., and Bulhões Mendes, C. A.: Large-scale hydrologic and hydrodynamic modeling of the Amazon River basin, Water Resour. Res., 49, 1226–1243, https://doi.org/10.1002/wrcr.20067, 2013.
Döll, P., Douville, H., Güntner, A., Müller Schmied, H., and Wada, Y.: Modelling Freshwater Resources at the Global Scale: Challenges and Prospects, Surv. Geophys., 37, 195–221, https://doi.org/10.1007/s10712-015-9343-1, 2016.
d'Orgeval, T., Polcher, J., and de Rosnay, P.: Sensitivity of the West African hydrological cycle in ORCHIDEE to infiltration processes, Hydrol. Earth Syst. Sci., 12, 1387–1401, https://doi.org/10.5194/hess-12-1387-2008, 2008.
Durand, M., Andreadis, K. M., Alsdorf, D. E., Lettenmaier, D. P., Moller, D. and Wilson, M.: Estimation of bathymetric depth and slope from data assimilation of swath altimetry into a hydrodynamic model, Geophys. Res. Lett., 35, L20401, https://doi.org/10.1029/2008GL034150, 2008.
Dutra, E., Gianpaolo, B., Jean-Christophe, C., Munier, S., Burke, S., Fink, G., Van Dijk, A., Martinez-de la Torre, A., van Beek, R., De Roo, A., and Polcher, J.: Report on the improved water resources reanalysis Deliverable, http://earth2observe.eu/files/PublicDeliverables/D5.2 - Report on the Improved Water Resources Reanalysis (WRRtier 2).pdf (last access: 12 December 2022), 2017.
earth2observe: Runoff data E2O WRR2, earth2observe [data set], https://wci.earth2observe.eu, last access: 14 December 2022.
El Gharamti, M., McCreight, J. L., Noh, S. J., Hoar, T. J., RafieeiNasab, A., and Johnson, B. K.: Ensemble streamflow data assimilation using WRF-Hydro and DART: novel localization and inflation techniques applied to Hurricane Florence flooding, Hydrol. Earth Syst. Sci., 25, 5315–5336, https://doi.org/10.5194/hess-25-5315-2021, 2021.
Emery, C. M., Paris, A., Biancamaria, S., Boone, A., Calmant, S., Garambois, P.-A., and Santos da Silva, J.: Large-scale hydrological model river storage and discharge correction using a satellite altimetry-based discharge product, Hydrol. Earth Syst. Sci., 22, 2135–2162, https://doi.org/10.5194/hess-22-2135-2018, 2018.
Emery, C. M., Biancamaria, S., Boone, A., Ricci, S., Rochoux, M. C., Pedinotti, V., and David, C. H.: Assimilation of wide-swath altimetry water elevation anomalies to correct large-scale river routing model parameters, Hydrol. Earth Syst. Sci., 24, 2207–2233, https://doi.org/10.5194/hess-24-2207-2020, 2020a.
Emery, C. M., Paris, A., Biancamaria, S., Boone, A., Calmant, S., Garambois, P.-A., Da Silva, J. S., and David, C. H.: Discharge Estimation via Assimilation of Multisatellite-Based Discharge Products: Case Study Over the Amazon Basin, IEEE Geosci. Remote S., 19, 1–5, https://doi.org/10.1109/lgrs.2020.3020285, 2020b.
Emery, C. M., David, C. H., Andreadis, K. M., Turmon, M. J., Reager, J. T., Hobbs, J. M., Pan, M., Famiglietti, J. S., Beighley, E., and Rodell, M.: Underlying Fundamentals of Kalman Filtering for River Network Modeling, J. Hydrometeorol., 21, 453–474, https://doi.org/10.1175/JHM-D-19-0084.1, 2020c.
Espinoza Villar, J. C., Ronchail, J., Guyot, J. L., Cochonneau, G., Naziano, F., Lavado, W., De Oliveira, E., Pombosa, R., and Vauchel, P.: Spatio-temporal rainfall variability in the Amazon basin countries (Brazil, Peru, Bolivia, Colombia, and Ecuador), Int. J. Climatol., 29, 1574–1594, https://doi.org/10.1002/joc.1791, 2009.
Evensen, G.: The Ensemble Kalman Filter: Theoretical formulation and practical implementation, Ocean Dynam., 53, 343–367, https://doi.org/10.1007/s10236-003-0036-9, 2003.
Evensen, G. and van Leeuwen, P. J.: An Ensemble Kalman Smoother for Nonlinear Dynamics, Mon. Weather Rev., 128, 1852–1867, https://doi.org/10.1175/1520-0493(2000)128<1852:aeksfn>2.0.co;2, 2002.
Fan, Y., Clark, M., Lawrence, D. M., Swenson, S., Band, L. E., Brantley, S. L., Brooks, P. D., Dietrich, W. E., Flores, A., Grant, G., Kirchner, J. W., Mackay, D. S., McDonnell, J. J., Milly, P. C. D., Sullivan, P. L., Tague, C., Ajami, H., Chaney, N., Hartmann, A., Hazenberg, P., McNamara, J., Pelletier, J., Perket, J., Rouholahnejad-Freund, E., Wagener, T., Zeng, X., Beighley, E., Buzan, J., Huang, M., Livneh, B., Mohanty, B. P., Nijssen, B., Safeeq, M., Shen, C., van Verseveld, W., Volk, J. and Yamazaki, D.: Hillslope Hydrology in Global Change Research and Earth System Modeling, Water Resour. Res., 55, 1737–1772, https://doi.org/10.1029/2018WR023903, 2019.
Fassoni-Andrade, A. C., Fleischmann, A. S., Papa, F., Paiva, R. C. D. de, Wongchuig, S., Melack, J. M., Moreira, A. A., Paris, A., Ruhoff, A., Barbosa, C., Maciel, D. A., Novo, E., Durand, F., Frappart, F., Aires, F., Abrahão, G. M., Ferreira-Ferreira, J., Espinoza, J. C., Laipelt, L., Costa, M. H., Espinoza-Villar, R., Calmant, S., and Pellet, V.: Amazon Hydrology From Space: Scientific Advances and Future Challenges, Rev. Geophys., 59, 1–97, https://doi.org/10.1029/2020RG000728, 2021.
Feng, D., Gleason, C. J., Lin, P., Yang, X., Pan, M., and Ishitsuka, Y.: Recent changes to Arctic river discharge, Nat. Commun., 12, 1–9, https://doi.org/10.1038/s41467-021-27228-1, 2021.
Fleischmann, A. S., Brêda, J. P. F., Passaia, O. A., Wongchuig, S. C., Fan, F. M., Paiva, R. C. D., Marques, G. F., and Collischonn, W.: Regional scale hydrodynamic modeling of the river-floodplain-reservoir continuum, J. Hydrol., 596, 126114, https://doi.org/10.1016/j.jhydrol.2021.126114, 2021.
Flörke, M., Kynast, E., Bärlund, I., Eisner, S., Wimmer, F. and Alcamo, J.: Domestic and industrial water uses of the past 60 years as a mirror of socio-economic development: A global simulation study, Global Environ. Chang., 23, 144–156, https://doi.org/10.1016/j.gloenvcha.2012.10.018, 2013.
Fu, L.-L., Alsdorf, D., Morrow, R., Rodriguez, E., and Mognard, N.: SWOT: The Surface Water and Ocean Topography Mission Wide-Swath Altimetric Measurement of Water Elevation on Earth, http://hdl.handle.net/2014/41996 (last access: 14 December 2022), 2012.
Gleason, C. J. and Durand, M. T.: Remote sensing of river discharge: A review and a framing for the discipline, Remote Sens., 12, 1–28, https://doi.org/10.3390/rs12071107, 2020.
Gleason, C. J. and Smith, L. C.: Toward global mapping of river discharge using satellite images and at-many-stations hydraulic geometry, P. Natl. Acad. Sci. USA, 111, 4788–4791, https://doi.org/10.1073/pnas.1317606111, 2014.
Gneiting, T. and Raftery, A. E.: Strictly proper scoring rules, prediction, and estimation, J. Am. Stat. Assoc., 102, 359–378, https://doi.org/10.1198/016214506000001437, 2007.
GRDC: GRDC river discharge observations, GRDC [data set], https://portal.grdc.bafg.de, last access: 14 December 2022.
Hanazaki, R., Yamazaki, D., and Yoshimura, K.: Development of a Reservoir Flood Control Scheme for Global Flood Models, J. Adv. Model. Earth Sy., 14, e2021MS002944, https://doi.org/10.1029/2021ms002944, 2022.
Hannah, D. M., Demuth, S., van Lanen, H. A. J., Looser, U., Prudhomme, C., Rees, G., Stahl, K., and Tallaksen, L. M.: Large-scale river flow archives: Importance, current status and future needs, Hydrol. Process., 25, 1191–1200, https://doi.org/10.1002/hyp.7794, 2011.
Hersbach, H., Peubey, C., Simmons, A., Berrisford, P., Poli, P. and Dee, D.: ERA-20CM: A twentieth-century atmospheric model ensemble, Q. J. Roy. Meteorol. Soc., 141, 2350–2375, https://doi.org/10.1002/qj.2528, 2015.
Hunt, B. R., Kostelich, E. J., and Szunyogh, I.: Efficient data assimilation for spatiotemporal chaos: A local ensemble transform Kalman filter, Physica D, 230, 112–126, https://doi.org/10.1016/j.physd.2006.11.008, 2007.
Hydroweb: Satellite altimetry data, Hydroweb [data set], https://hydroweb.theia-land.fr/, last access: 14 December 2022.
Ishitsuka, Y., Gleason, C. J., Hagemann, M. W., Beighley, E., Allen, G. H., Feng, D., Lin, P., Pan, M., Andreadis, K., and Pavelsky, T. M.: Combining optical remote sensing, McFLI discharge estimation, global hydrologic modelling, and data assimilation to improve daily discharge estimates across an entire large watershed, Water Resour. Res., 57, 1–20, https://doi.org/10.1029/2020wr027794, 2020.
Kalman, R. E.: A New Approach to Linear Filtering and Prediction Problems, J. Basic Eng., 82, 35, https://doi.org/10.1115/1.3662552, 1960.
Kling, H. and Gupta, H.: On the development of regionalization relationships for lumped watershed models: The impact of ignoring sub-basin scale variability, J. Hydrol., 373, 337–351, https://doi.org/10.1016/j.jhydrol.2009.04.031, 2009.
Liang, X., Lettenmaier, D. P., Wood, E. F., and Burges, S. J.: A simple hydrologically based model of land surface water and energy fluxes for general circulation models, J. Geophys. Res., 99, 14415, https://doi.org/10.1029/94jd00483, 1994.
Lin, P., Pan, M., Beck, H. E., Yang, Y., Yamazaki, D., Frasson, R., David, C. H., Durand, M., Pavelsky, T. M., Allen, G. H., Gleason, C. J., and Wood, E. F.: Global Reconstruction of Naturalized River Flows at 2.94 Million Reaches, Water Resour. Res., 55, 6499–6516, https://doi.org/10.1029/2019WR025287, 2019.
Liu, Y. and Gupta, H. V.: Uncertainty in hydrologic modeling: Toward an integrated data assimilation framework, Water Resour. Res., 43, 1–18, https://doi.org/10.1029/2006WR005756, 2007.
Liu, Y., Weerts, A. H., Clark, M., Hendricks Franssen, H.-J., Kumar, S., Moradkhani, H., Seo, D.-J., Schwanenberg, D., Smith, P., van Dijk, A. I. J. M., van Velzen, N., He, M., Lee, H., Noh, S. J., Rakovec, O., and Restrepo, P.: Advancing data assimilation in operational hydrologic forecasting: progresses, challenges, and emerging opportunities, Hydrol. Earth Syst. Sci., 16, 3863–3887, https://doi.org/10.5194/hess-16-3863-2012, 2012.
Messager, M. L., Lehner, B., Cockburn, C., Lamouroux, N., Pella, H., Snelder, T., Tockner, K., Trautmann, T., Watt, C., and Datry, T.: Global prevalence of non-perennial rivers and streams, Nature, 594, 391–397, https://doi.org/10.1038/s41586-021-03565-5, 2021.
Michailovsky, C. I., Milzow, C., and Bauer-Gottwein, P.: Assimilation of radar altimetry to a routing model of the Brahmaputra River, Water Resour. Res., 49, 4807–4816, https://doi.org/10.1002/wrcr.20345, 2013.
Miyoshi, T. and Yamane, S.: Local Ensemble Transform Kalman Filtering with an AGCM at a T159/L48 Resolution, Mon. Weather Rev., 135, 3841–3861, https://doi.org/10.1175/2007MWR1873.1, 2007.
Modi, P., Revel, M., and Yamazaki, D.: Multivariable Integrated Evaluation of Hydrodynamic Modeling: A Comparison of Performance Considering Different Baseline Topography Data, Water Resour. Res., 58, 1–20, https://doi.org/10.1029/2021WR031819, 2022.
Nash, J. E. and Sutcliffe, J. V: River Flow Forecasting Through Conceptual Models Part I – a Discussion of Principles, J. Hydrol., 10, 282–290, https://doi.org/10.1016/0022-1694(70)90255-6, 1970.
Neal, J. C., Odoni, N. A., Trigg, M. A., Freer, J. E., Garcia-Pintado, J., Mason, D. C., Wood, M., and Bates, P. D.: Efficient incorporation of channel cross-section geometry uncertainty into regional and global scale flood inundation models, J. Hydrol., 529, 169–183, https://doi.org/10.1016/j.jhydrol.2015.07.026, 2015.
Oki, T. and Kanae, S.: Global Hydrological Cycles and World Water Resources, Science, 5790, 1068–1072, https://doi.org/10.1126/science.1128845, 2006.
Paiva, R. C. D., Collischonn, W., Bonnet, M.-P., de Gonçalves, L. G. G., Calmant, S., Getirana, A., and Santos da Silva, J.: Assimilating in situ and radar altimetry data into a large-scale hydrologic-hydrodynamic model for streamflow forecast in the Amazon, Hydrol. Earth Syst. Sci., 17, 2929–2946, https://doi.org/10.5194/hess-17-2929-2013, 2013a.
Paiva, R. C. D., Collischonn, W., and Buarque, D. C.: Validation of a full hydrodynamic model for large-scale hydrologic modelling in the Amazon, Hydrol. Process., 27, 333–346, https://doi.org/10.1002/hyp.8425, 2013b.
Papa, F., Prigent, C., Aires, F., Jimenez, C., Rossow, W. B. and Matthews, E.: Interannual variability of surface water extent at the global scale, 1993-2004, J. Geophys. Res.-Atmos., 115, D12111, https://doi.org/10.1029/2009JD012674, 2010.
Pedinotti, V., Boone, A., Ricci, S., Biancamaria, S., and Mognard, N.: Assimilation of satellite data to optimize large-scale hydrological model parameters: a case study for the SWOT mission, Hydrol. Earth Syst. Sci., 18, 4485–4507, https://doi.org/10.5194/hess-18-4485-2014, 2014.
Pokhrel, Y., Shin, S., Lin, Z., Yamazaki, D., and Qi, J.: Potential Disruption of Flood Dynamics in the Lower Mekong River Basin Due to Upstream Flow Regulation, Sci. Rep.-UK, 8, 1–13, https://doi.org/10.1038/s41598-018-35823-4, 2018.
Prigent, C., Jimenez, C., and Bousquet, P.: Satellite-Derived Global Surface Water Extent and Dynamics Over the Last 25 Years (GIEMS-2), J. Geophys. Res.-Atmos., 125, 1–18, https://doi.org/10.1029/2019JD030711, 2020.
Reis, V., Hermoso, V., Hamilton, S. K., Bunn, S. E., Fluet-Chouinard, E., Venables, B., and Linke, S.: Characterizing seasonal dynamics of Amazonian wetlands for conservation and decision making, Aquat. Conserv., 29, 1073–1082, https://doi.org/10.1002/aqc.3051, 2019.
Renard, B., Kavetski, D., Kuczera, G., Thyer, M., and Franks, S. W.: Understanding predictive uncertainty in hydrologic modeling: The challenge of identifying input and structural errors, Water Resour. Res., 46, 1–22, https://doi.org/10.1029/2009WR008328, 2010.
Resti, A., Benveniste, J., Roca, M., Milagro-Perez, M. P., and Levrini, G.: The Envisat Radar Altimeter System (RA-2), ESA Bull., 98, 94–101, https://doi.org/10.1117/12.452745, 2002.
Revel, M., Ikeshima, D., Yamazaki, D. and Kanae, S.: A Physically Based Empirical Localization Method for Assimilating Synthetic SWOT Observations of a Continental-Scale River: A Case Study in the Congo Basin, Water, 11, 829, https://doi.org/10.3390/w11040829, 2019.
Revel, M., Ikeshima, D., Yamazaki, D., and Kanae, S.: A Framework for Estimating Global-Scale River Discharge by Assimilating Satellite Altimetry, Water Resour. Res., 57, 1–34, https://doi.org/10.1029/2020WR027876, 2021.
Revel, M., Zhou, X., Yamazaki, D. and Kanae, S.: HydroDA v1.0, HydroShare [data set], https://doi.org/10.4211/hs.08e1b18aa9f240758dd13d9ac875621f, 2022a.
Revel, M., Zhou, X., Yamazaki, D., and Kanae, S.: HydroDA 1.0., Zenodo [code], https://doi.org/10.5281/zenodo.6506861, 2022b.
Saleh, F., Ducharne, A., Flipo, N., Oudin, L., and Ledoux, E.: Impact of river bed morphology on discharge and water levels simulated by a 1D Saint-Venant hydraulic model at regional scale, J. Hydrol., 476, 169–177, https://doi.org/10.1016/j.jhydrol.2012.10.027, 2013.
Santos da Silva, J., Calmant, S., Seyler, F., Rotunno Filho, O. C., Cochonneau, G., and Mansur, W. J.: Water levels in the Amazon basin derived from the ERS 2 and ENVISAT radar altimetry missions, Remote Sens. Environ., 114, 2160–2181, https://doi.org/10.1016/j.rse.2010.04.020, 2010.
Shiklomanov, A. I., Lammers, R. B., and Vörösmarty, C. J.: Widespread decline in hydrological monitoring threatens Pan-Arctic Research, EOS T. Am. Geophys. Un., 83, 13, https://doi.org/10.1029/2002EO000007, 2002.
Shin, S., Pokhrel, Y., Yamazaki, D., Huang, X., Torbick, N., Qi, J., Pattanakiat, S., Ngo-Duc, T., and Duc Tuan, N.: High Resolution Modeling of River-floodplain-reservoir Inundation Dynamics in the Mekong River Basin, Water Resour. Res., 56, e2019WR026449, https://doi.org/10.1029/2019wr026449, 2020.
Sood, A. and Smakhtin, V.: Revue des modèles hydrologiques globaux, Hydrolog. Sci. J., 60, 549–565, https://doi.org/10.1080/02626667.2014.950580, 2015.
Sutanudjaja, E. H., Van Beek, L. P. H., De Jong, S. M., Van Geer, F. C., and Bierkens, M. F. P.: Calibrating a large-extent high-resolution coupled groundwater-land surface model using soil moisture and discharge data, Water Resour. Res., 50, 687–705, https://doi.org/10.1002/2013WR013807, 2014.
Van Beek, L. P. H., Wada, Y. and Bierkens, M. F. P.: Global monthly water stress: 1. Water balance and water availability, Water Resour. Res., 47, W07517, https://doi.org/10.1029/2010WR009791, 2011.
Van Der Knijff, J. M., Younis, J., and De Roo, A. P. J.: LISFLOOD: a GIS-based distributed model for river basin scale water balance and flood simulation, Int. J. Geogr. Inf. Sci., 24, 189–212, https://doi.org/10.1080/13658810802549154, 2008.
Van Dijk, A. I. J. M., Peña-Arancibia, J. L., Wood, E. F., Sheffield, J. and Beck, H. E.: Global analysis of seasonal streamflow predictability using an ensemble prediction system and observations from 6192 small catchments worldwide, Water Resour. Res., 49, 2729–2746, https://doi.org/10.1002/wrcr.20251, 2013.
Vergnes, J.-P., Decharme, B., and Habets, F.: Introduction of groundwater capillary rises using subgrid spatial variability of topography into the ISBA land surface model, J. Geophys. Res.-Atmos., 119, 11065–11086, https://doi.org/10.1002/2014JD021573, 2014.
Verzano, K.: Climate change impacts on flood related hydrological processes: Further development and application of a global scale hydrological model, Hamburg, Germany, https://doi.org/10.17617/2.993926, 2009.
Vörösmarty, C., Askew, A., Grabs, W., Barry, R. G., Birkett, C., Döll, P., Goodison, B., Hall, A., Jenne, R., Kitaev, L., Landwehr, J., Keeler, M., Leavesley, G., Schaake, J., Strzepek, K., Sundarvel, S. S., Takeuchi, K. and Webster, F.: Global water data: A newly endangered species, EOS, 82, 1999–2001, https://doi.org/10.1029/01EO00031, 2001.
Wongchuig, S. C., de Paiva, R. C. D., Siqueira, V., and Collischonn, W.: Hydrological reanalysis across the 20th century: A case study of the Amazon Basin, J. Hydrol., 570, 755–773, https://doi.org/10.1016/j.jhydrol.2019.01.025, 2019.
Wongchuig-Correa, S., Cauduro Dias de Paiva, R., Biancamaria, S., and Collischonn, W.: Assimilation of future SWOT-based river elevations, surface extent observations and discharge estimations into uncertain global hydrological models, J. Hydrol., 590, 125473, https://doi.org/10.1016/j.jhydrol.2020.125473, 2020.
Yamazaki, D., Kanae, S., Kim, H., and Oki, T.: A physically based description of floodplain inundation dynamics in a global river routing model, Water Resour. Res., 47, 1–21, https://doi.org/10.1029/2010WR009726, 2011.
Yamazaki, D., Lee, H., Alsdorf, D. E., Dutra, E., Kim, H., Kanae, S., and Oki, T.: Analysis of the water level dynamics simulated by a global river model: A case study in the Amazon River, Water Resour. Res., 48, 1–15, https://doi.org/10.1029/2012WR011869, 2012.
Yamazaki, D., De Almeida, G. A. M., and Bates, P. D.: Improving computational efficiency in global river models by implementing the local inertial flow equation and a vector-based river network map, Water Resour. Res., 49, 7221–7235, https://doi.org/10.1002/wrcr.20552, 2013.
Yamazaki, D., O'Loughlin, F., Trigg, M. A., Miller, Z. F., Pavelsky, T. M., and Bates, P. D.: Development of the Global Width Database for Large Rivers, Water Resour. Res., 50, 3467–3480, https://doi.org/10.1002/2013WR014664, 2014a.
Yamazaki, D., Sato, T., Kanae, S., Hirabayashi, Y., and Bates, P. D.: Regional flood dynamics in a bifurcating mega delta simulated in a global river model, Geophys. Res. Lett., 41, 3127–3135, https://doi.org/10.1002/2014GL059744, 2014b.
Yamazaki, D., Ikeshima, D., Tawatari, R., Yamaguchi, T., O'Loughlin, F., Neal, J. C., Sampson, C. C., Kanae, S., and Bates, P. D.: A high-accuracy map of global terrain elevations, Geophys. Res. Lett., 44, 5844–5853, https://doi.org/10.1002/2017GL072874, 2017.
Yamazaki, D., Ikeshima, D., Sosa, J., Bates, P. D., Allen, G., and Pavelsky, T.: MERIT Hydro: A high-resolution global hydrography map based on latest topography datasets, Water Resour. Res., 55, 2019WR024873, https://doi.org/10.1029/2019WR024873, 2019.
Yamazaki, D., Revel, M., Hanazaki, R., Zhou, X. and Nitta, T.: CaMa-Flood, Zenodo [code], https://doi.org/10.5281/zenodo.4609654, 2021.
Yoon, Y., Durand, M., Merry, C. J., Clark, E. A., Andreadis, K. M., and Alsdorf, D. E.: Estimating river bathymetry from data assimilation of synthetic SWOT measurements, J. Hydrol., 464–465, 363–375, https://doi.org/10.1016/j.jhydrol.2012.07.028, 2012.
Zhou, X., Revel, M., Modi, P., Shiozawa, T., and Yamazaki, D.: Correction of river bathymetry parameters using the stage-discharge rating curve, Water Resour. Res., 58, 1–26, https://doi.org/10.1029/2021WR031226, 2022.
Zwally, H. J., Schutz, B., Abdalati, W., Abshire, J., Bentley, C., Brenner, A., Bufton, J., Dezio, J., Hancock, D., Harding, D., Herring, T., Minster, B., Quinn, K., Palm, S., Spinhirne, J., and Thomas, R.: ICESat's laser measurements of polar ice, atmosphere, ocean, and land, J. Geodyn., 34, 405–445, https://doi.org/10.1016/S0264-3707(02)00042-X, 2002.