the Creative Commons Attribution 4.0 License.
the Creative Commons Attribution 4.0 License.
 | 20 Dec 2023
The most extreme rainfall erosivity event ever recorded in China up to 2022: the 7.20 storm in Henan Province
Yuanyuan Xiao
Shuiqing Yin
Bofu Yu
Conghui Fan
Wenting Wang
Yun Xie
Severe water erosion occurs during extreme storm events. Such an exceedingly severe storm occurred in Zhengzhou in central China on 20 July 2021 (the 7.20 storm). The magnitude and frequency of occurrence of this storm event were examined in terms of how erosive it was. To contextualize this extreme event, hourly rainfall data from 2420 automatic meteorological stations in China from 1951 to 2021 were analyzed to (1) characterize the spatial and temporal distribution of the rainfall amount and rainfall erosivity of the 7.20 storm, (2) evaluate the average recurrence interval of the maximum daily and event rainfall erosivity, and (3) establish the geographical distribution of the maximum daily and event rainfall erosivity in China. The center of the 7.20 storm moved from southeast to northwest in Henan Province, and the most intense period of rainfall occurred in the middle and late stages of the storm. Zhengzhou Meteorological Station happened to be aligned with the center of the storm, with a maximum daily rainfall of 552.5 mm and a maximum hourly rainfall intensity of 201.9 mm h−1. The average recurrence intervals of the maximum daily rainfall erosivity (43 354±1863 MJ mm ha−1 h−1) and the maximum event rainfall erosivity (58 874±2351 MJ mm ha−1 h−1) were estimated to be about 19 200 and 53 700 years, respectively, assuming the log-Pearson type-III distribution, and these were the maximum rainfall erosivities ever recorded among 2420 meteorological stations in mainland China up to 2022. The 7.20 storm suggests that the most erosive of storms does not necessarily occur in the wettest places in southern China, and these can occur in mid-latitude around 35∘ N with a moderate mean annual rainfall of 566.7 mm in Zhengzhou.
- Article
(7946 KB) - Full-text XML
-
Supplement
(1032 KB) - BibTeX
- EndNote


Soil erosion is a land degradation process that can affect food production, biodiversity, carbon stocks and ecosystem services (Kebede et al., 2021; Panagos et al., 2015). Soil erosion models are powerful tools to evaluate the rate of erosion and the effect of soil and water conservation measures for decision makers. The Universal Soil Loss Equation (USLE) (Wischmeier and Smith, 1965, 1978), the revised USLE (Renard et al., 1997; USDA–ARS, 2013) and the Chinese Soil Loss Equation (CSLE, Liu et al., 2002) are widely used empirical soil erosion prediction models for estimating the long-term average amount of soil loss. Rainfall erosivity quantifies the potential ability of rainfall and runoff to erode the soil and represents the climatic effect on soil erosion as one of the factors in the USLE, RUSLE and CSLE (Yin et al., 2017).
Most studies have focused on the long-term average of rainfall and rainfall erosivity characteristics (Gu et al., 2020; Li et al., 2008; Liu et al., 2018; Yin et al., 2019) and have assessed the intensity and frequency of extreme rainfall events at the regional, national and global scales (Alexander et al., 2007; Almagro et al., 2017; Evans et al., 2016; Nearing et al., 2004). The long-term average value cannot fully represent the severity of the soil erosion process, and a few severe soil erosion events can contribute a great deal to the total amount of soil lost over many years (Bezak et al., 2021; Borrelli et al., 2016; Meusburger et al., 2012; Petek et al., 2018). For example, field observations at the plot scale in eastern Austria showed that the three largest erosion events from 1994 to 2019 accounted for 79 % of the total soil loss over the same period (Klik and Rosner, 2020). Zhou and Wang (1992) reported that high-intensity, short-duration heavy-precipitation events accounted for about 90 % of the total annual soil erosion in the Loess Plateau region.
Extreme rainfall, which varies a great deal in space and time, can lead to severe flooding, with far-reaching implications for socio-economic and human activities (Fishman, 2016). With global warming, the frequency and intensity of extreme-precipitation events are increasing mostly in mid-latitudes (Fang et al., 2017; IPCC, 2023; Liao et al., 2019; Liu et al., 2017). Extreme rainfall, especially rainfall events with high intensity, is often more erosive (Fang et al., 2018; Huang et al., 2016a, b, c). Many studies reported that satellite-based products tended to underestimate the extreme rainfall, which can have an important effect on the estimation of rainfall erosivity using satellite-based products (Jiang et al., 2019; Palharini et al., 2020; Rahmawati and Lubczynski, 2018). For example, Bezak et al. (2022) showed that Climate Prediction Center MORPHing (CMORPH) estimates had a marked tendency to underestimate rainfall erosivity in highly erosive areas when compared to the Global Rainfall Erosivity Database (GloREDa) estimates. In addition, underestimation of extreme rainfall from climate models will lead to conservative projections of erosivity in highly erosive areas in the future (Panagos et al., 2022). Therefore, it is of great interest to examine the magnitude and frequency of the occurrence of rainfall and rainfall erosivity of extreme storm events.
An extraordinarily heavy rainfall event occurred between 17 and 22 July 2021 in Henan Province. Such a rare event was never experienced or recorded up to 2022 in China. Record daily rainfall was observed at 10 meteorological stations in Zhengzhou, Xinxiang, Kaifeng, Zhoukou, Luoyang and other cities in Henan Province. Zhang et al. (2021) reported that the storm was influenced by several weather systems including the eastward extension of the South Asian high, the abnormal northerly subtropical high, the Bengal Bay Depression at low latitude, the typhoon Chapaca in the South China Sea and the typhoon Fireworks in the Western Pacific. The strengthened and eastward extension of the South Asia high leads to an obvious divergence area of the upper atmosphere over Henan Province, which is conducive to the upward movement of the lower atmosphere. The subtropical high, which is northward moving and stronger than usual for the same period, the no. 6 typhoon Fireworks and the no. 7 typhoon Chapaca in low latitudes, and the low pressure in Bengal Bay have led to the stable and lasting transmission of warm and humid airflow to Henan Province (Zhang et al., 2021; Qian et al., 2022). Taihang Mountains and Funiu Mountains in the northwestern and western Henan Province blocked the airflow, and a strong convergence formed in front of the mountains, resulting in this extreme rainfall event.
The maximum hourly rainfall between 16:00 and 17:00 BJT on 20 July reached 201.9 mm at Zhengzhou Meteorological Station, the highest ever recorded in China up to 2022 (Zhang et al., 2021). It has been widely reported that this extreme storm caused extensive flooding and landslides with damages to infrastructure and loss of human lives (Jin et al., 2022; Zhang et al., 2022). Event total rainfall and daily and hourly rainfall of the 7.20 storm have been reported elsewhere (Zhang et al., 2021), whereas rainfall erosivity associated with this extreme storm has not. The 7.20 storm presents a rare opportunity to examine the extreme rainfall erosivity in China. For this study, hourly rainfall data were used to evaluate the maximum daily and event rainfall erosivity, to estimate its average recurrence interval, to contextualize geographically the extreme erosivity of the 7.20 storm, to demonstrate how extreme the erosivity value of the 7.20 storm was and how large event rainfall erosivity could be in China, and to highlight the need to pay attention to extreme storm events and the huge erosion risk associated with them in the future.
2.1 Data source and pre-processing
Observed hourly rainfall data from 1951 to 2021 for 2420 meteorological stations in China (Fig. 1) were collected by siphon rain gauges or tipping-bucket rain gauges. The instrument used by China Meteorological Administration (CMA) is SL3-1 tipping-bucket rain sensors, and precipitation was measured according to the operation manual at all stations. Tipping-bucket rain gauges have a rainfall bearing diameter of 200 mm, and their resolution is 0.1 mm. The maximum allowable rainfall intensity is 4 mm min−1, and the maximum allowable rainfall error is ±4 mm for every 100 mm. A multi-sensor system was used for precipitation measurement. The system consists of three separate SL3-1 tipping-bucket rain sensors. Multi-sensor automatic weather stations detect abnormal or missing rainfall data caused by rain sensor failures to ensure precipitation data quality (He and Huang, 2015). The rainfall data were acquired from CMA, and the data were quality-controlled by CMA's National Meteorological Information Center. However, we found some outliers in the data so we checked hourly with daily observations from rain gauges. Hourly observations in early days were mainly digitized from precipitation autographic charts on paper. From 2000 to 2005, automatic weather stations were put into use, and their introduction was gradually accelerated. Since 2005, nearly all observations were recorded with automatic weather stations. Hourly rainfall data from 796 meteorological stations in Henan and its surrounding nine provinces (municipalities) from 20:00 BJT (Beijing time) on 16 July and to 20:00 BJT on 22 July 2021 were used to characterize the 7.20 storm. Hourly rainfall data from 1951 to 2020 were used to calculate the annual maximum daily and event rainfall erosivity. To reduce the impact of missing values on the result, years with missing data were discarded. A year with missing data was defined as follows: if there were 4 or more hours of missing records on a given day, it was considered to be a missing day, and if the number of missing days in a month was ≥ six, it was considered to be a missing month. Since most of the rainfall in the north of China (north of 32∘ N) is concentrated from May to September, the year with any month from May to September missing was defined as a missing year. In southern China (south of 32∘ N), the year with any month from April to October missing was defined as a missing year. Missing years were removed, and missing values in effective years were input as zero values.
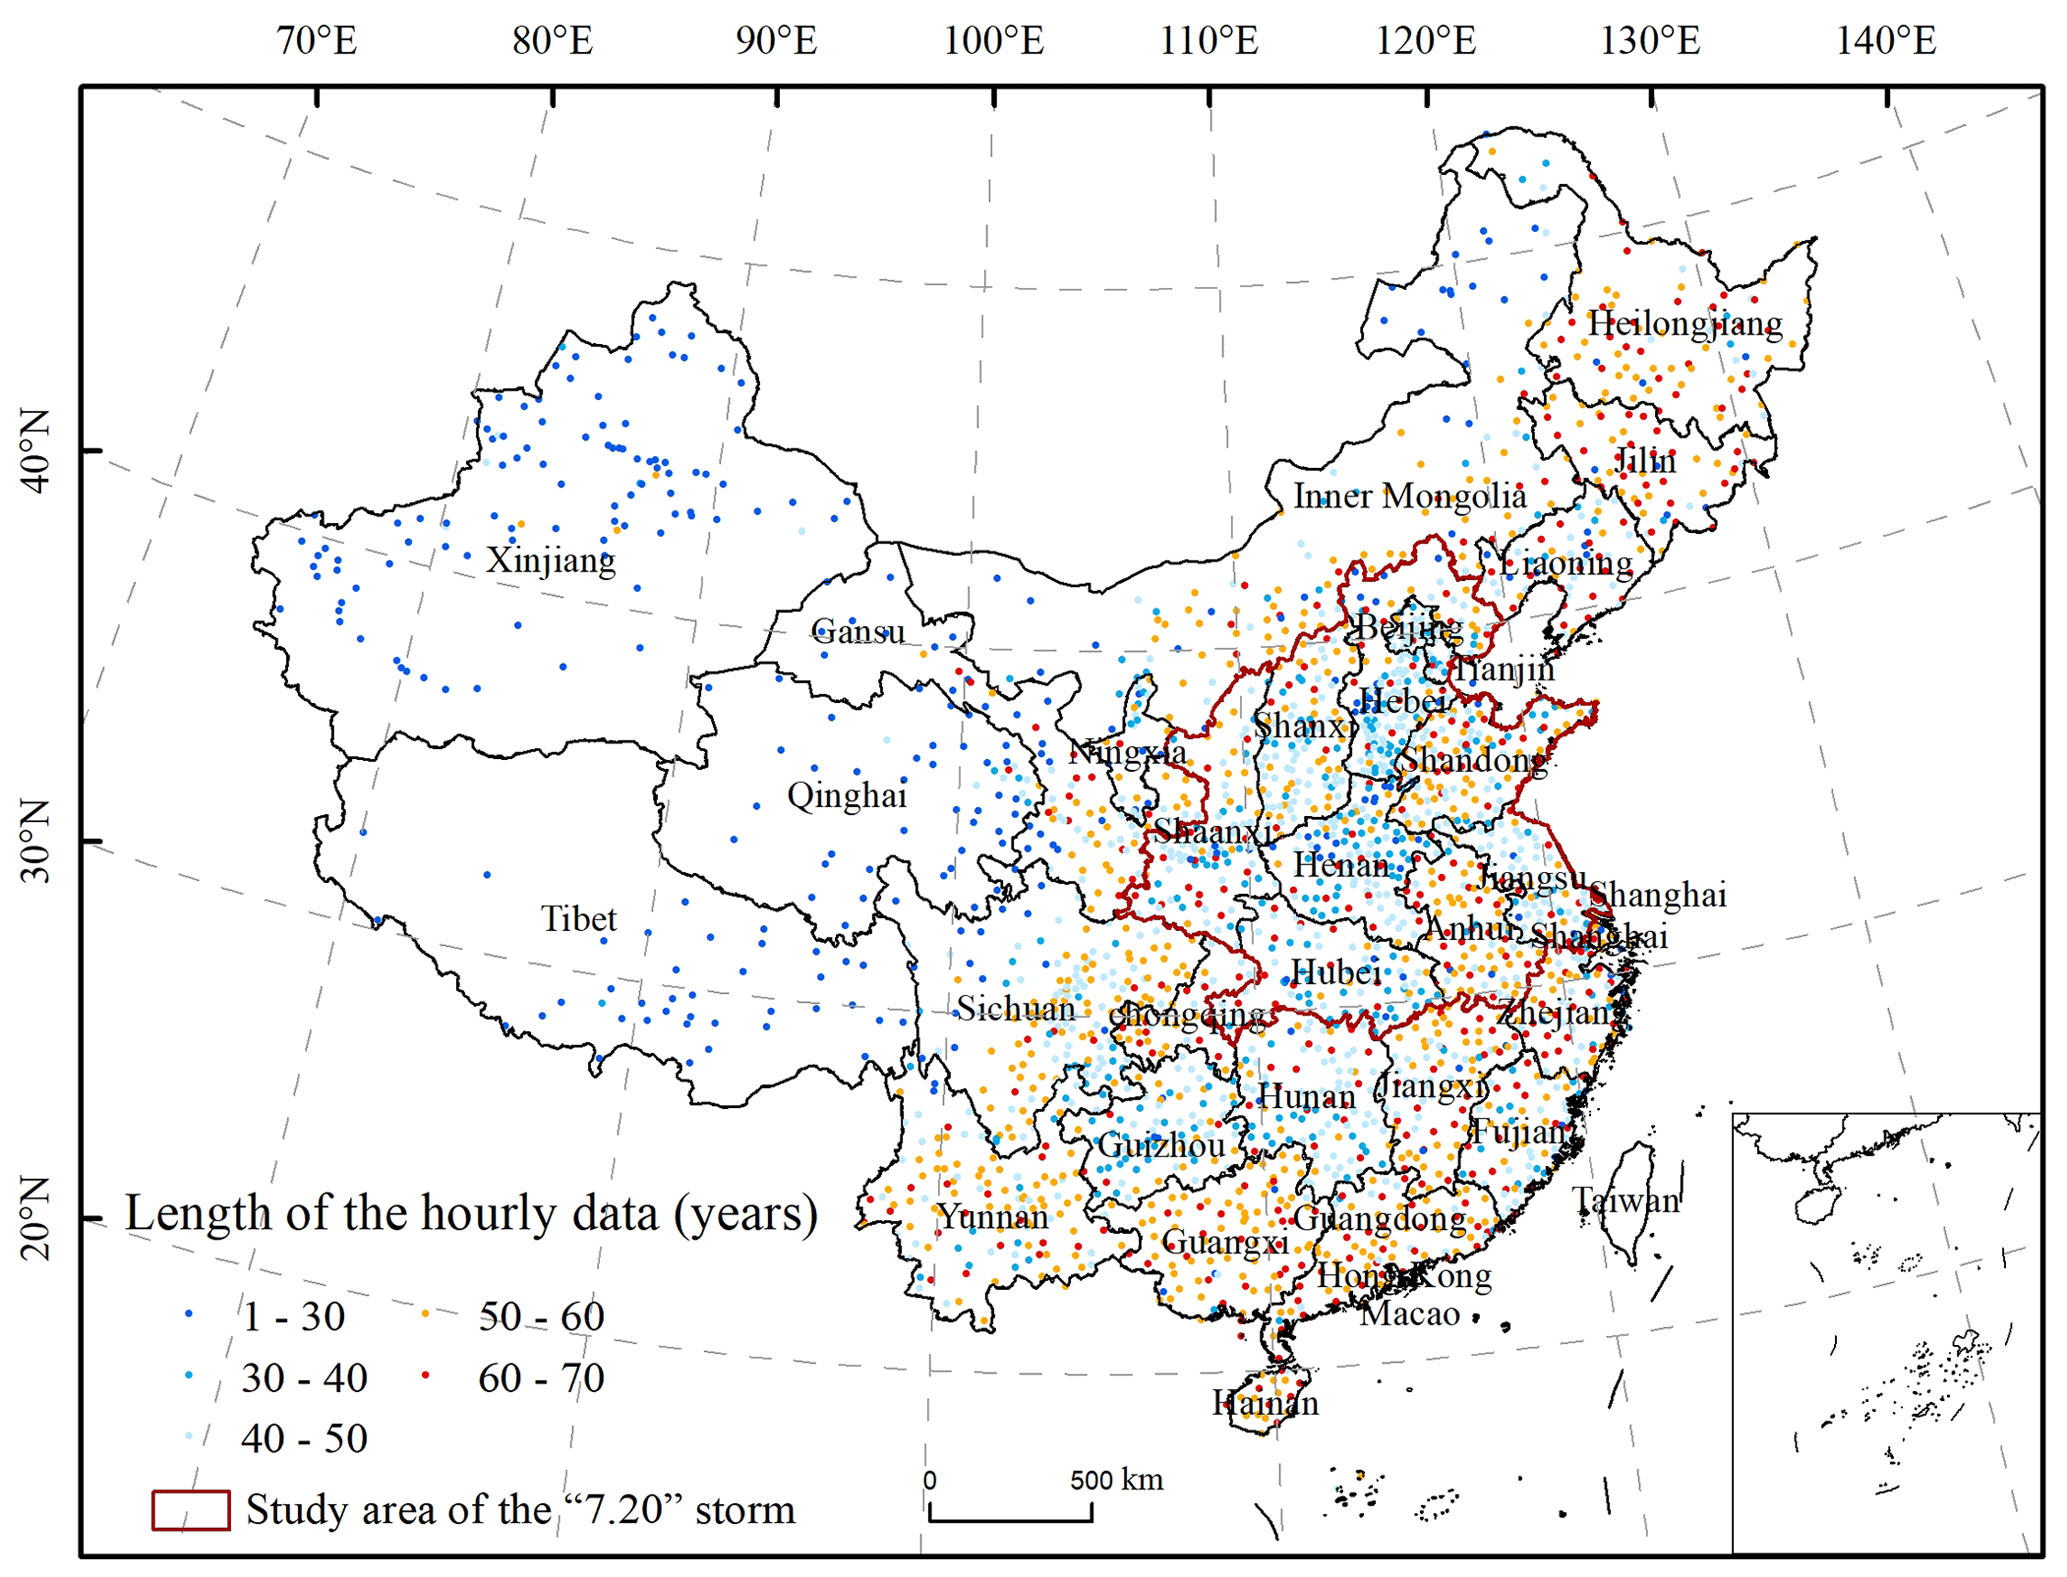
Figure 1Spatial distribution of stations with hourly rainfall data and the record length. Publisher's remark: please note that the above figure contains disputed territories.
2.2 Framework of study
2.2.1 Definition of rainfall events and rainfall parameters
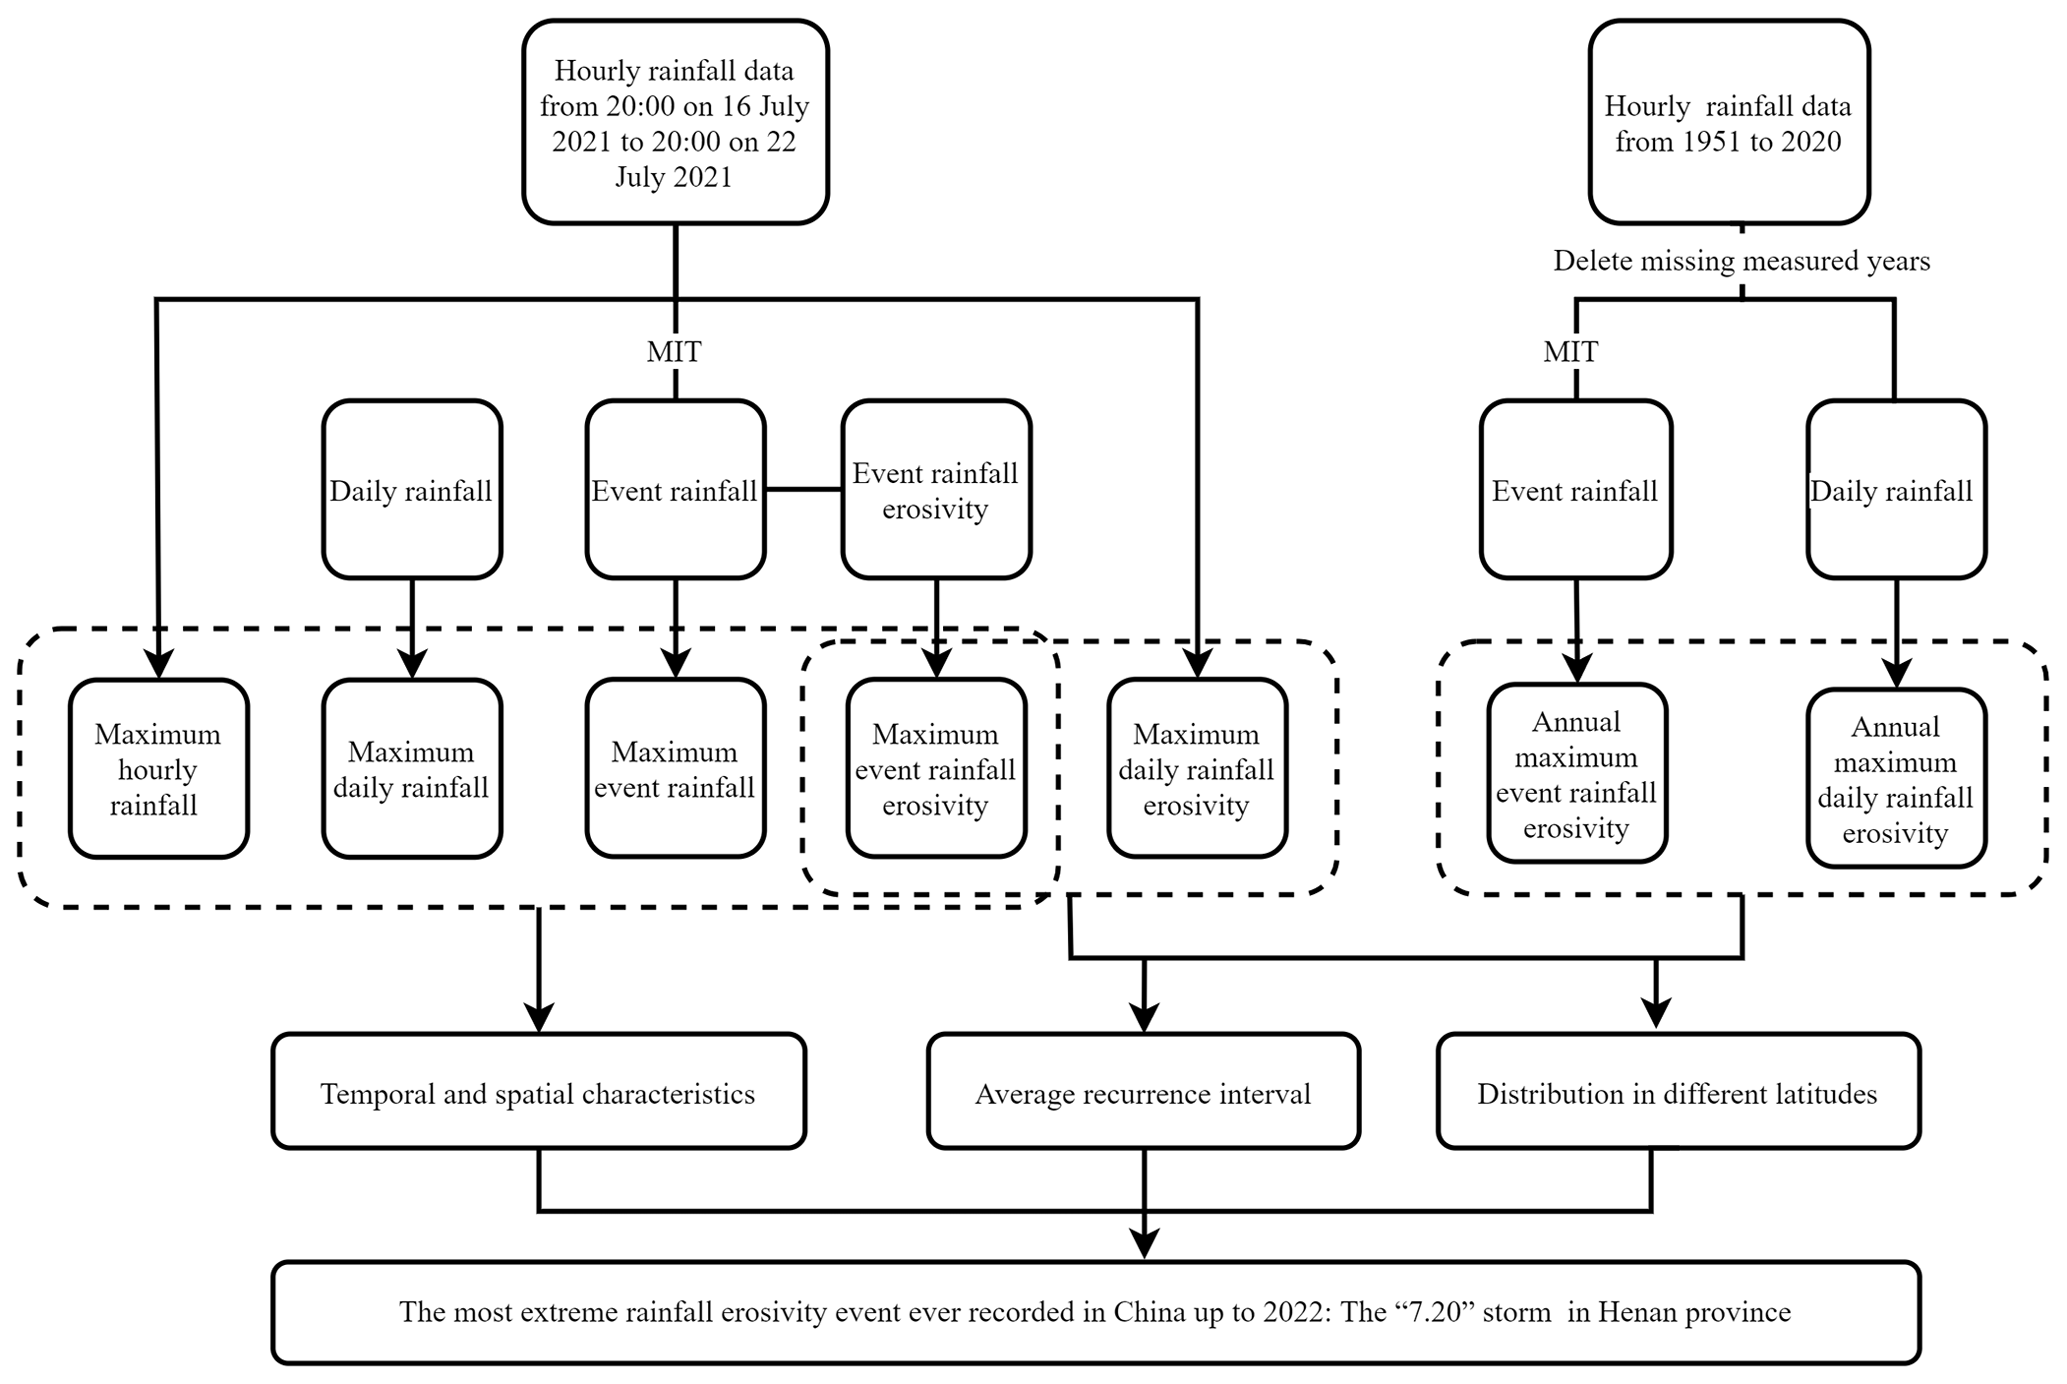
An event was defined as a period of rainfall separated by dry periods greater than the minimum inter-event time (MIT). The MIT in the USLE and RUSLE2 is 6 h. In this study, MIT of 6 h was used to define rainfall events. The maximum event rainfall, maximum daily rainfall, maximum hourly rainfall and maximum event rainfall erosivity were computed following the framework shown in Fig. 2. Since there were multiple events over the 6 d period during the 7.20 storm, the maximum event rainfall was the maximum rainfall amount of all events over the 6 d period. Maximum event rainfall erosivity was similarly defined.
2.2.2 Calculation of the energy and daily and event rainfall erosivity
Hourly data were used to calculate the rainfall erosivity EI30 (MJ mm ha−1 h−1) for each event, which is the product of the event energy and peak 30 min intensity. All the hourly data for the day (20:00 to 20:00 BJT) were used to compute daily rainfall erosivity.
Rainfall kinetic energy is used by most erosion models for assessing the capacity of rainfall to produce erosion. Rainfall kinetic energy is a function of raindrop size and falling velocity. Because the direct measurement of kinetic energy (KE) requires complex and expensive instruments, many different estimation methods have been developed. These methods use logarithmic, exponential or power-law formulas to derive kinetic-energy–intensity (KE–I) relationships. The most widely accepted kinetic-energy–intensity relationship is the exponential model proposed by Kinnell (1981). This equation has the following general form:
where emax, a and b are empirical constants. Among them, the coefficients a and emax determine the minimum kinetic energy content. On the other hand, the coefficient b defines the general shape of the curve (Kinnell, 1981).
The rainfall kinetic energy is calculated by Eq. (3), which includes the modification suggested by McGregor et al. (1995). The total energy (EN, MJ ha−1) of an erosive event was computed using the following equations (USDA–ARS, 2013):
where a rainfall event is divided into l periods, each with an intensity ir (mm h−1); Pr (mm) is the rainfall amount for the rth period, and er (MJ mm−1 ha−1) is the energy per unit rainfall per unit area for the rth period.
The event rainfall erosivity can be estimated with EN and I1 h (USDA–ARS, 2013):
where I1 h is the peak 1 h rainfall intensity for the erosive event, and c is the calibrated conversion factor for the rainfall erosivity from 1 h data to 1 min data. Yue et al. (2020) used hourly rainfall data to calculate a conversion coefficient of 1.489 for the 1-in-10-year EI30, which is suitable for evaluating extreme rainfall erosivity on average. The conversion factor for individual stations in China ranged from 1.321 to 4.601, and the conversion factor for Zhengzhou Meteorological Station was 2.029, higher than the average or expected for the conversion factor used for this study (Fig. S2.1 in the Supplement). We have included the standard error ± 0.064 for the conversion factor to indicate the likely uncertainty associated with this conversion factor.
Total rainfall and energy over the 6 d of the 7.20 storm for 796 stations were interpolated spatially at 100 m spatial resolution, and the regional averages for Henan Province and the study area (Henan Province and its surrounding nine provinces or municipalities) were calculated and compared with Zhengzhou Meteorological Station.
The rainfall and rainfall erosivity maps were generated by the interpolation of rainfall and rainfall erosivity values from at-site rainfall observations by geostatistics techniques, such as the inverse distance weighting or ordinal Kriging (Panagos et al., 2015; Sadeghi et al., 2017; Yin et al., 2019). We used inverse distance weighting (IDW) to interpolate point data to map rainfall and rainfall erosivity distributions for the region. The IDW method computes precipitation at the interpolating point by assigning larger weights to observation stations closer to the target grid (Shepard, 1968).
2.2.3 Log-Pearson type-III distribution
An annual series is defined here as a collection of maxima, one from each calendar year. Annual series of the maximum daily and event rainfall erosivity from the period 1951–2020 (n=67 due to 3 missing years) for Zhengzhou Meteorological Station were sorted in a descending order, with the largest being assigned a rank of 1. The empirical return period, or the average recurrence interval, of each observation in the annual series was calculated according to the following formula (Bobeé and Robitaille, 1977):
where RP is the empirical return period in years, n is the number of years or the sample size, and m is the rank (m=1 for the largest).
The probability distribution used to fit the annual series was the log-Pearson type-III (LP-III) distribution. The LP-III distribution is considered to be a suitable model for flood frequency estimation in many investigations (Bobeé and Robitaille, 1977; England et al., 2003, 2019). The logarithms of the annual series of the maximum daily rainfall erosivity and the maximum event rainfall erosivity from 1951–2020 for Zhengzhou Meteorological Station were used to fit the Pearson type-III distribution (P-III). The probability density function (PDF) and cumulative distribution function (CDF) of P-III distribution model are as follows:
where x is the random variable of interest, a0 is the location parameter, α is the shape parameter, and β is the scale parameter. Γ(α) is the gamma function. The basic parameters, mean , coefficient of variation CV, and skewness coefficient CS, were used to estimate parameters a0, α and β (Viessman and Lewis, 2002) (Eqs. 9–11), and the 95 % confidence interval was also estimated (Kite, 1975).
3.1 Temporal and spatial characteristics of the 7.20 storm
3.1.1 Characteristics of the 7.20 storm
The extreme event occurred in Henan Province between 20:00 BJT on 16 July and 20:00 BJT on 22 July 2021. The center of the storm was mainly located around Zhengzhou. The storm duration was long, and accumulated rainfall was huge. The spatial pattern of the accumulated rainfall of the 7.20 storm is shown in Fig. 3a. The top three rainfall stations were Zhengzhou (817.3 mm), Huixian (755.2 mm) and Xinmi (723.5 mm). Additionally, among the 797 automatic meteorological stations in the study area, 58 meteorological stations had accumulated rainfall of more than 250 mm, of which 50 are located in Henan Province. Rainfall mass curves for these three stations are shown in Fig. 3b. Obviously, the rainstorms at Zhengzhou Meteorological Station and Xinmi Station contributed more than 50 % of the rainfall in the middle period, while the rainstorm at Huixian Station contributed more than 50 % of the rainfall in the last period. Wang et al. (2016) have demonstrated that different rainstorm patterns with rainfall peaks in the early, middle and late stages have different effects on soil erosion process under the natural rainfall conditions. In that study, storms were classified into four patterns: the advanced, intermediate, delayed and uniform, depending on when rainfall was most concentrated. The dimensionless durations were separated into three equal periods. The advanced pattern, intermediate pattern and delayed pattern were when more than 40 % of the rainfall occurred in the first, second and third periods, respectively. The rainfall temporal distribution is regarded to have the uniform pattern otherwise. Wang's research showed that, given the same EI30, the rainstorm pattern with a rainfall peak at the later stage produced more soil loss than the other patterns (Wang et al., 2016).
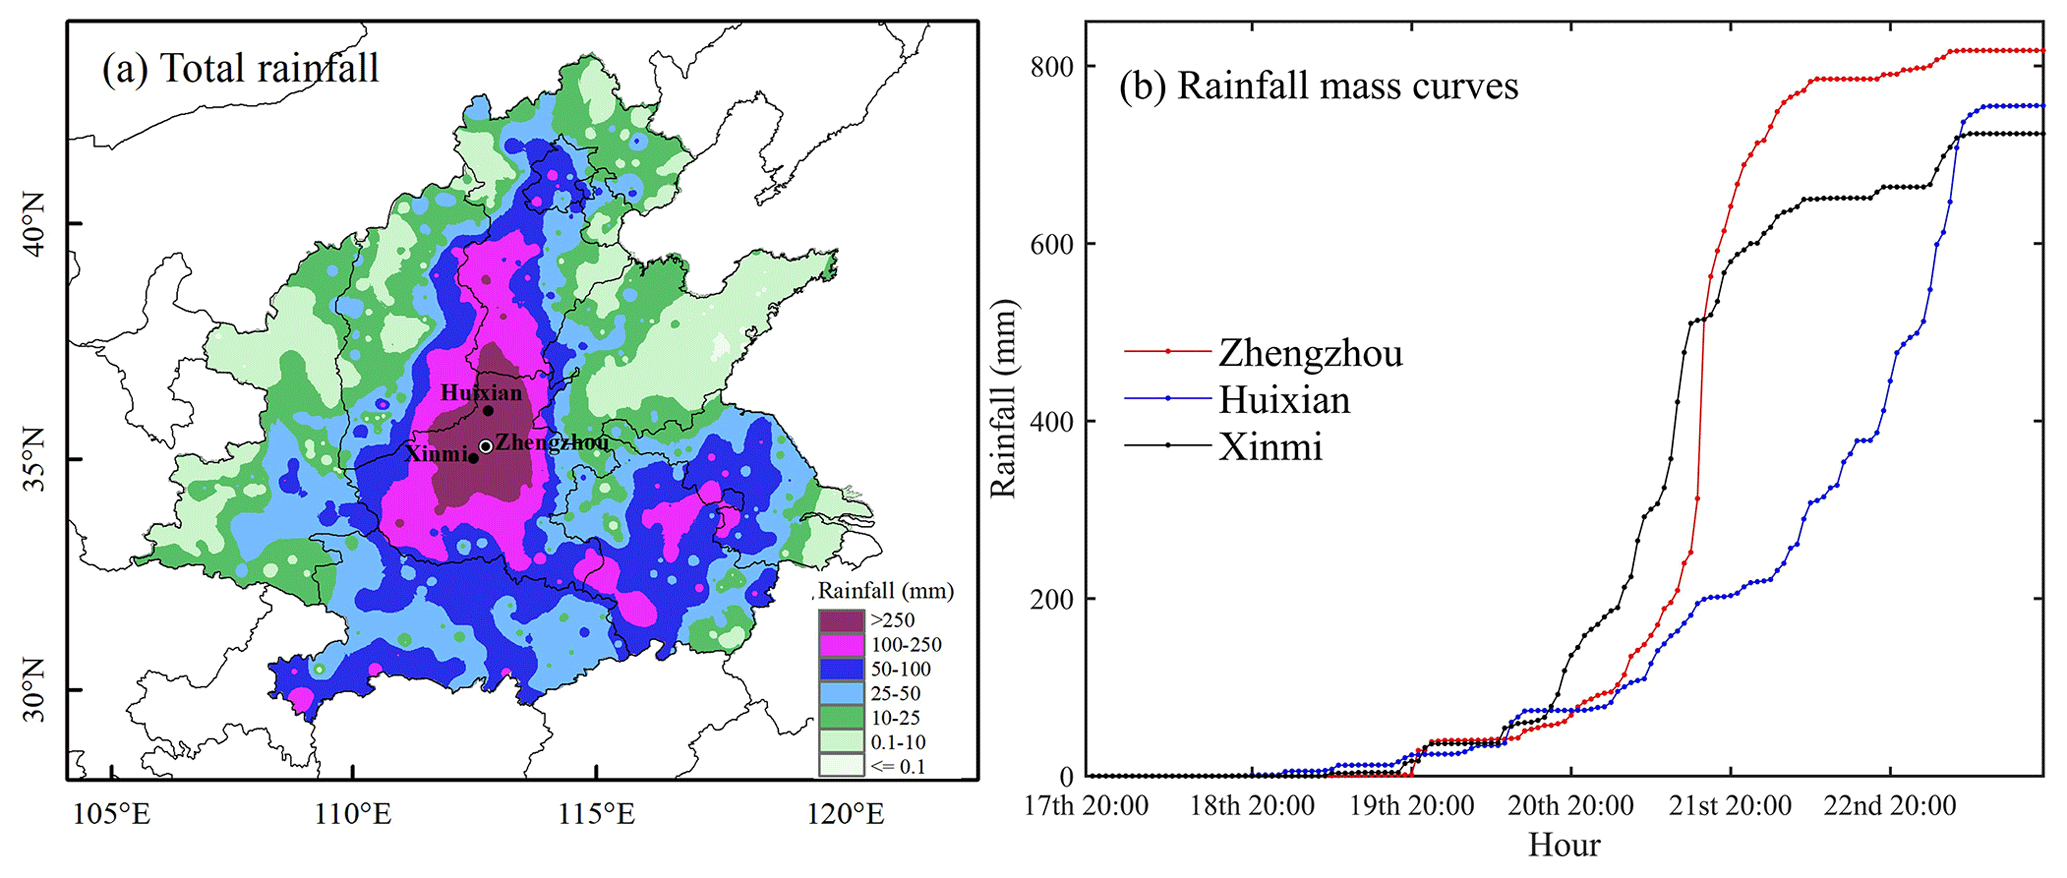
Figure 3A map of total rainfall over the study area and rainfall mass curves for three stations with the largest rainfall totals.
The spatial pattern of the daily rainfall of the 7.20 storm in the study area is shown in Fig. 4. Heavy rainfall mainly occurred in the middle and late stages of the event. The maximum daily rainfall (Zhengzhou, 552.5 mm) occurred on 20 July (Fig. 4d), while the storm was most extensive on 21 July (Fig. 4e). The storm was initially concentrated in Anhui Province (Fig. 4a) and then dispersed somewhat on 18 July (Fig. 4b). On 19 July, the storm re-appeared in the central region of Henan Province (Fig. 4c). On 20 July, the storm began to intensify and expand its spatial extent (Fig. 4d). The daily rainfall at 39 meteorological stations exceeded 100 mm, and the daily rainfall of 7 meteorological stations exceeded 250 mm on 20 July. On 21 July (Fig. 4e), the center of the storm began to move northward, the rainfall intensity started to dissipate, and the storm now covered a large area with the storm center drifting north to Tangyin (388.2 mm) in Henan Province; recorded rainfall at 48 meteorological stations exceeded 100 mm, and at 6 meteorological stations, it exceeded 250 mm. The rainfall decreased considerably by 22 July (Fig. 4f). The storm center was located in the north of Henan Province, and the rainfall at 16 meteorological stations exceeded 100 mm.
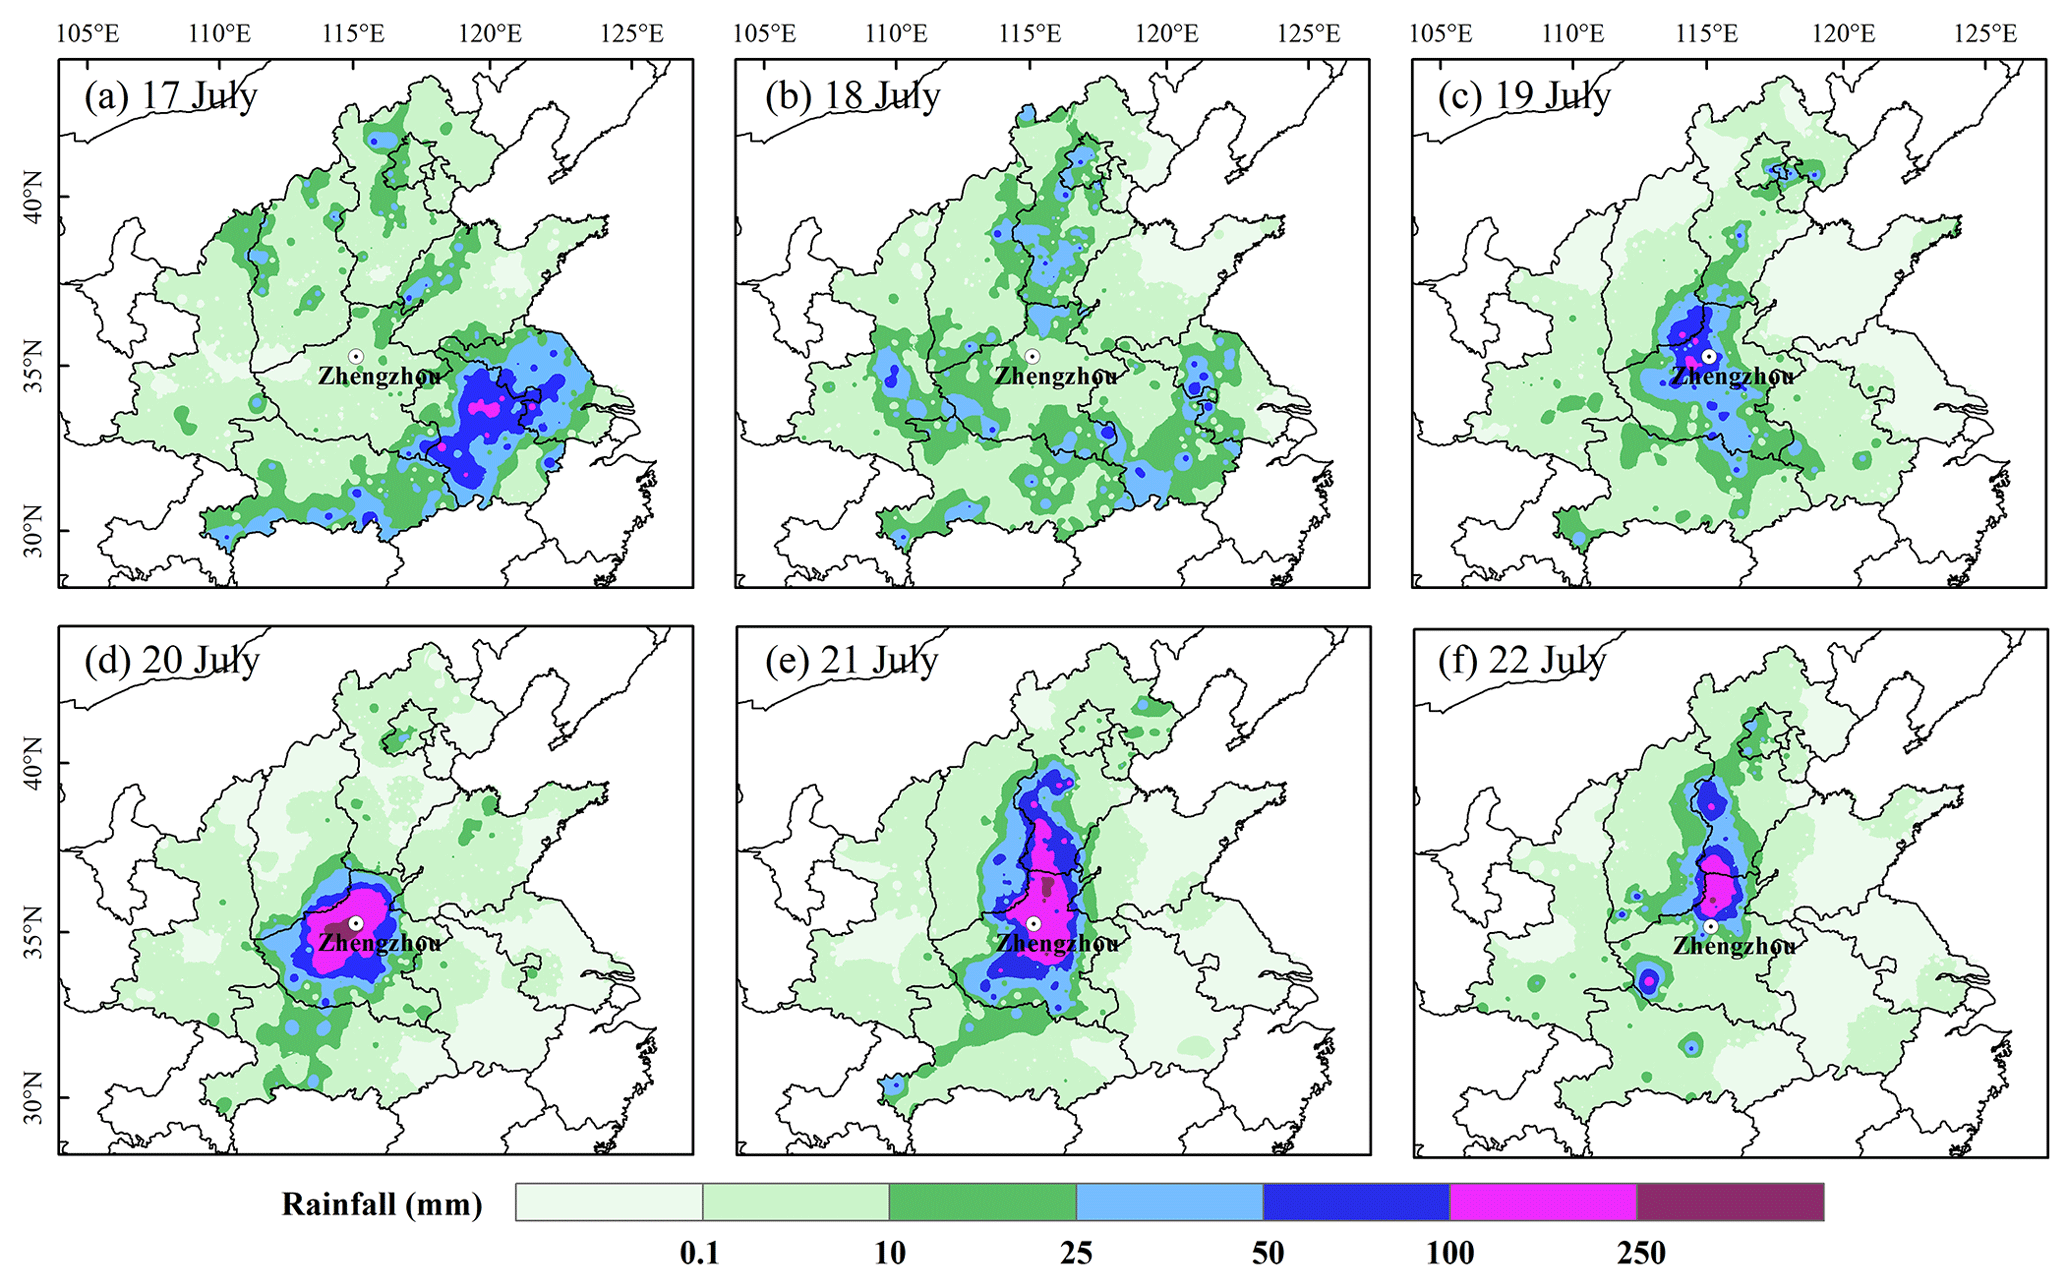
Figure 4Spatial distribution of daily rainfall in the study area. Daily rainfall is rainfall accumulation over a 24 h period; e.g., daily rainfall on 20 July is the total rainfall from 20:00 BJT on 19 July to 20:00 BJT on 20 July.
3.1.2 The spatial distribution of rainfall parameters and rainfall erosivity
The spatial distribution of maximum daily and hourly rainfall amounts and the maximum event rainfall and rainfall erosivity are shown in Fig. 5. At the center of the storm, a maximum event rainfall amount of 785.1 mm and a maximum daily rainfall amount of 552.5 mm on 20 July were recorded at Zhengzhou Meteorological Station. From 16:00 to 17:00 BJT on 20 July, maximum hourly rainfall reached 201.9 mm at Zhengzhou Meteorological Station and created a new hourly rainfall intensity record (201.9 mm h−1) in mainland China. The maximum event rainfall erosivity in the area with Zhengzhou Meteorological Station reached 58 874 MJ mm ha−1 h−1. Due to the uncertainty with the conversion factor, the maximum rainfall erosivity could range from 56 343 to 61 405 MJ mm ha−1 h−1.
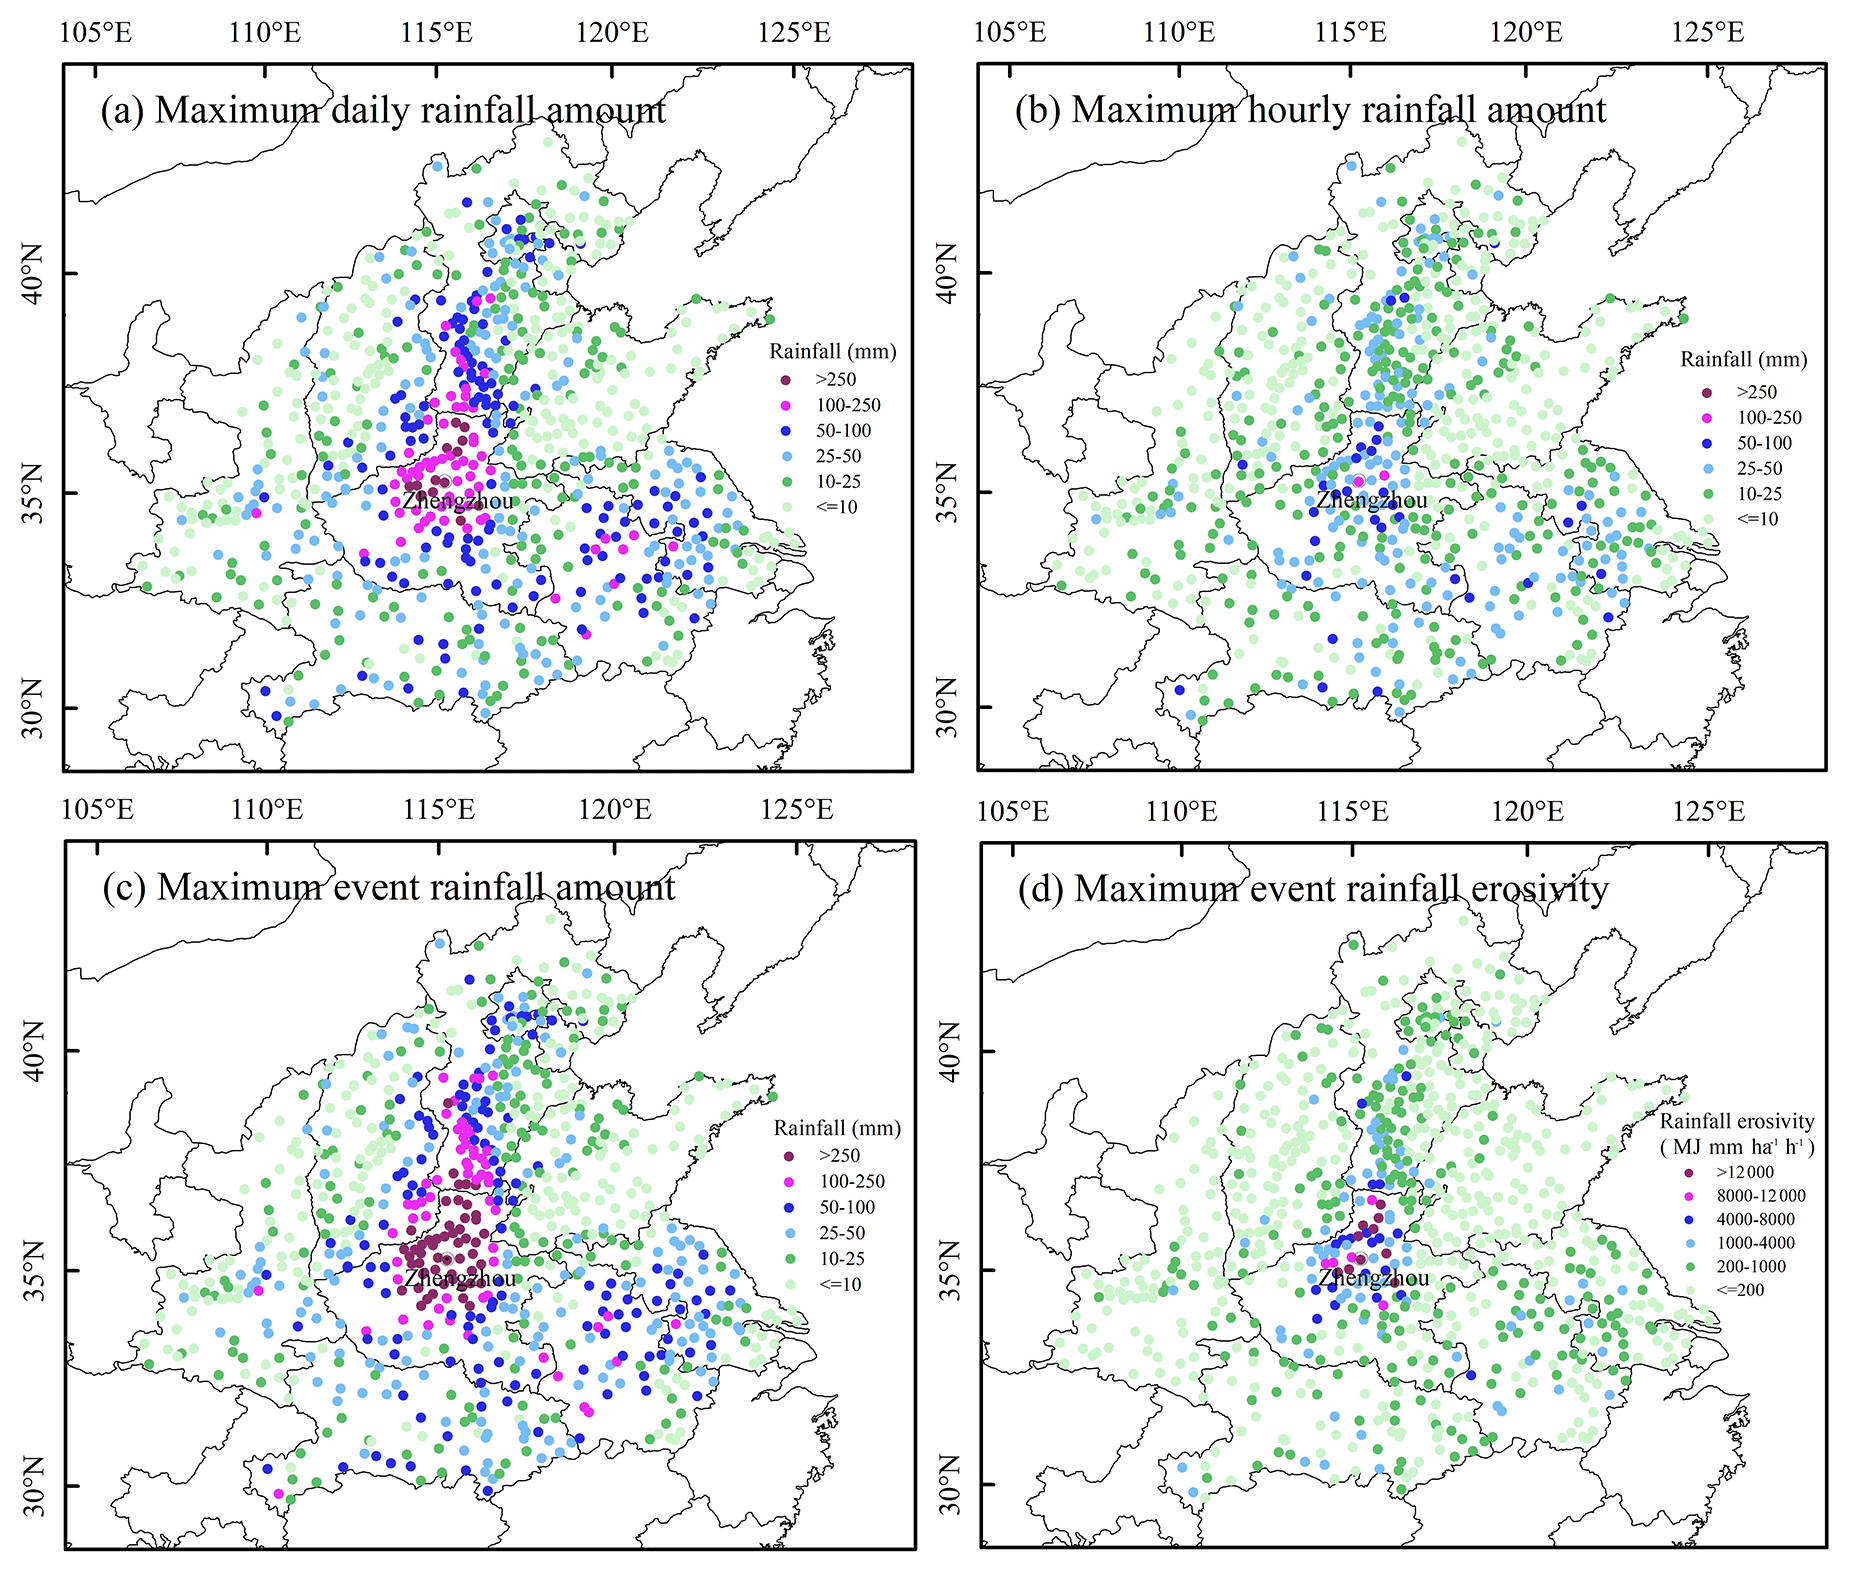
Figure 5Spatial distribution of rainfall amount and rainfall erosivity associated with the 7.20 storm.
3.1.3 Rainfall's total kinetic energy
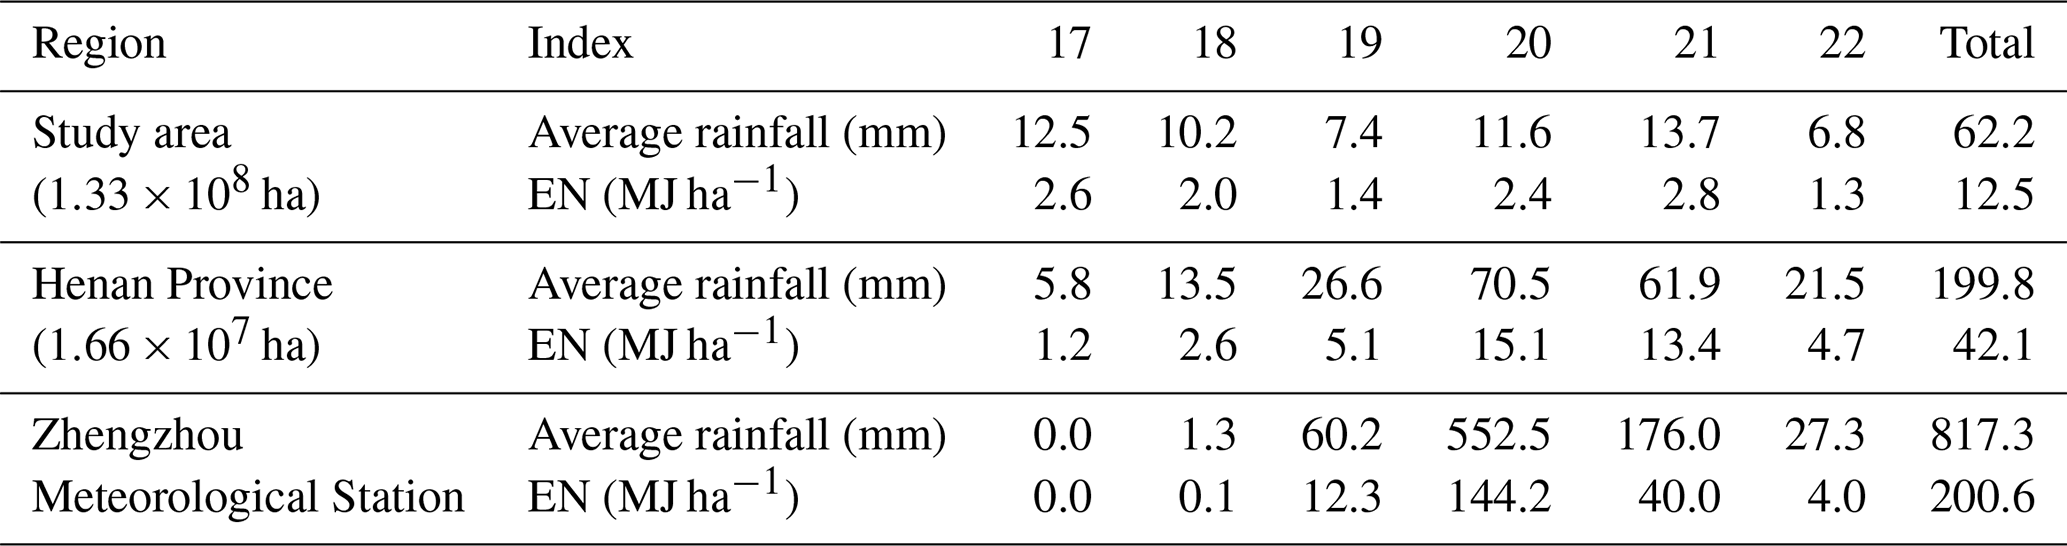
The detachment of soil particles from the soil mass and the transportation of detached particles by raindrop impact and surface water flow are the two main processes of soil erosion. Rainfall energy reflects the impact of raindrop detachment on the soil. The average rainfall and energy for each meteorological day over different regions of the 7.20 storm were listed in Table 1. Comparing the three regions, the average rainfall and EN in the study area on 17 July are higher than those in Henan Province and Zhengzhou Meteorological Station, indicating that the rainstorm center may have been outside Henan Province at this time. With the movement of the rainstorm center, the average rainfall and EN of Henan Province and Zhengzhou Meteorological Station gradually increased. The average rainfall and EN of Henan province reached the peak on 20 July at 70.5 mm and 15.1 MJ ha−1, respectively. The average rainfall and EN of Zhengzhou Meteorological Station reached the peak on 20 July at 552.5 mm and 144.2 MJ ha−1, respectively. The energy of Zhengzhou Meteorological Station on 20 July was 11 times the average energy in Henan Province.
Table 1The composition of average rainfall and energy in different regions from 20:00 BJT on 16 July to 20:00 BJT on 22 July 2021.
In summary, an extraordinarily heavy rainfall event occurred in Henan Province between 20:00 BJT on 16 July and 20:00 BJT on 22 July 2021. Among them, the observations of Zhengzhou Meteorological Station show that the maximum event rainfall was 785.1 mm, the maximum daily rainfall was 552.5 mm, the maximum hourly rainfall intensity was 201.9 mm h−1 and the maximum event rainfall erosivity was 58 874±2351 MJ mm ha−1 h−1. The storm was initially concentrated in the southeast of Henan and Anhui provinces, and the rainfall and rainfall intensity reached their peaks on 20 July. At the same time, the rainstorm center moved to the north of Henan Province with Zhengzhou as the center of the rainstorm. The EN of Zhengzhou Meteorological Station reached 144.2 MJ ha−1 on 20 July. It can be seen that the 7.20 storm had the characteristics of long duration, heavy cumulative rainfall, a wide range of heavy rainfall and extremely strong short-term rainfall. It is a particularly serious natural disaster that caused serious urban waterlogging, mountain floods, landslides and other disasters, resulting in heavy casualties and serious economic losses.
3.2 How extreme was the event recorded at Zhengzhou meteorological station?
3.2.1 Frequency of occurrence and the maximum daily and event rainfall erosivity
Annual maximum daily rainfall erosivity and the annual maximum event rainfall erosivity at Zhengzhou Meteorological Station from 1951 to 2020 are shown in Figs. 6 and 7 along with the fitted LP-III distribution. Using the fitted LP-III distribution, the average recurrence interval of the maximum daily rainfall erosivity of the 7.20 storm is estimated to be about 53 700 years, with the lower limit of the 95 % confidence interval being 1229 years and the ratio of the observed daily erosivity (43 354±1863 MJ mm ha−1 h−1) over the 1-in-100-year daily erosivity (6009 MJ mm ha−1 h−1) being 7.21. Similarly, the average recurrence interval of the maximum event rainfall erosivity is estimated to be about 19 200 years, with the lower limit of the 95 % confidence interval being 744 years; the observed event erosivity of the 7.20 storm (58 874±2351 MJ mm ha−1 h−1) is 7.75 times larger than the 1-in-100-year event erosivity (7596 MJ mm ha−1 h−1). Based on the 95 % confidence interval for the LP-III distribution, the estimated return period of the maximum daily and event rainfall erosivity is most likely to be at least 1229 and 744 years. Evidently, compared with observations in the past decades (1951–2020), the maximum daily and event rainfall erosivity of the 7.20 storm in 2021 is extraordinary, and the event is so rare and extreme that it should be regarded as an outlier among observations in other years.
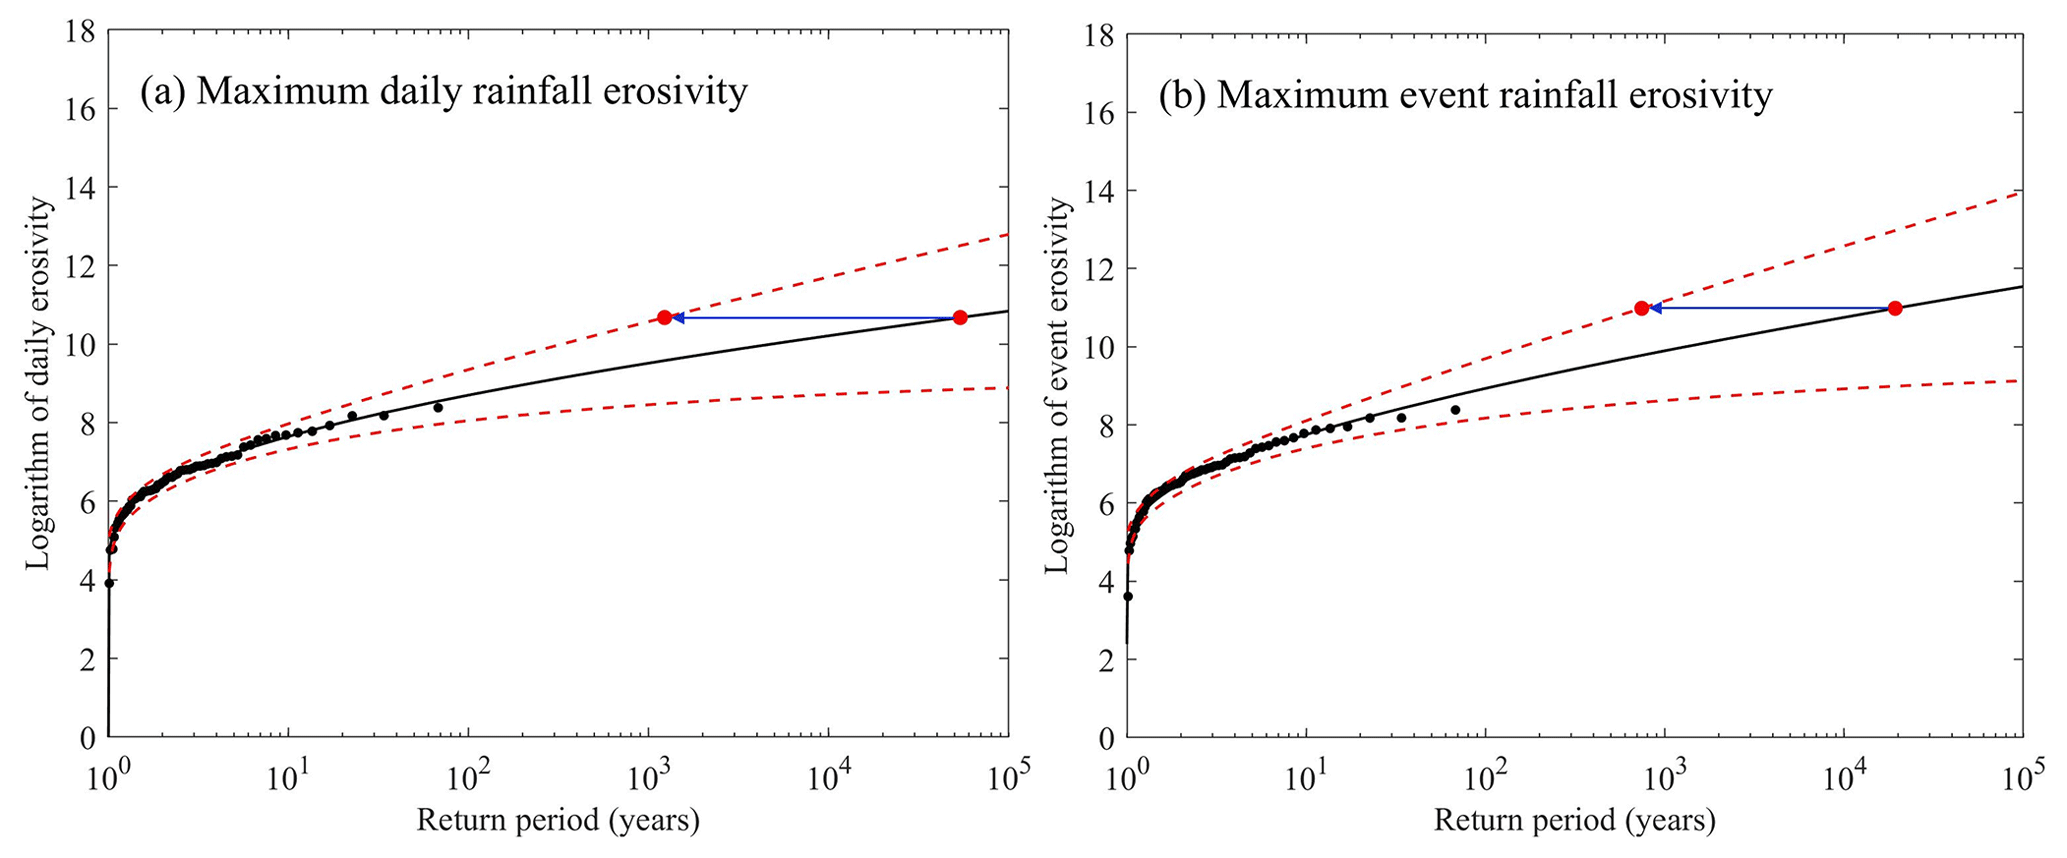
Figure 6The logarithm of observed daily (a) and event (b) rainfall erosivity as a function of the return period assuming LP-III for Zhengzhou Meteorological Station. Solid black circles are observations from the period 1951–2020, the solid red circles indicate the 7.20 storm in 2021, the dotted red lines are the upper and lower limits of the 95 % confidence interval, and the solid lines in black represent the fitted P-III distribution using the logarithm of observations from 1951–2020.
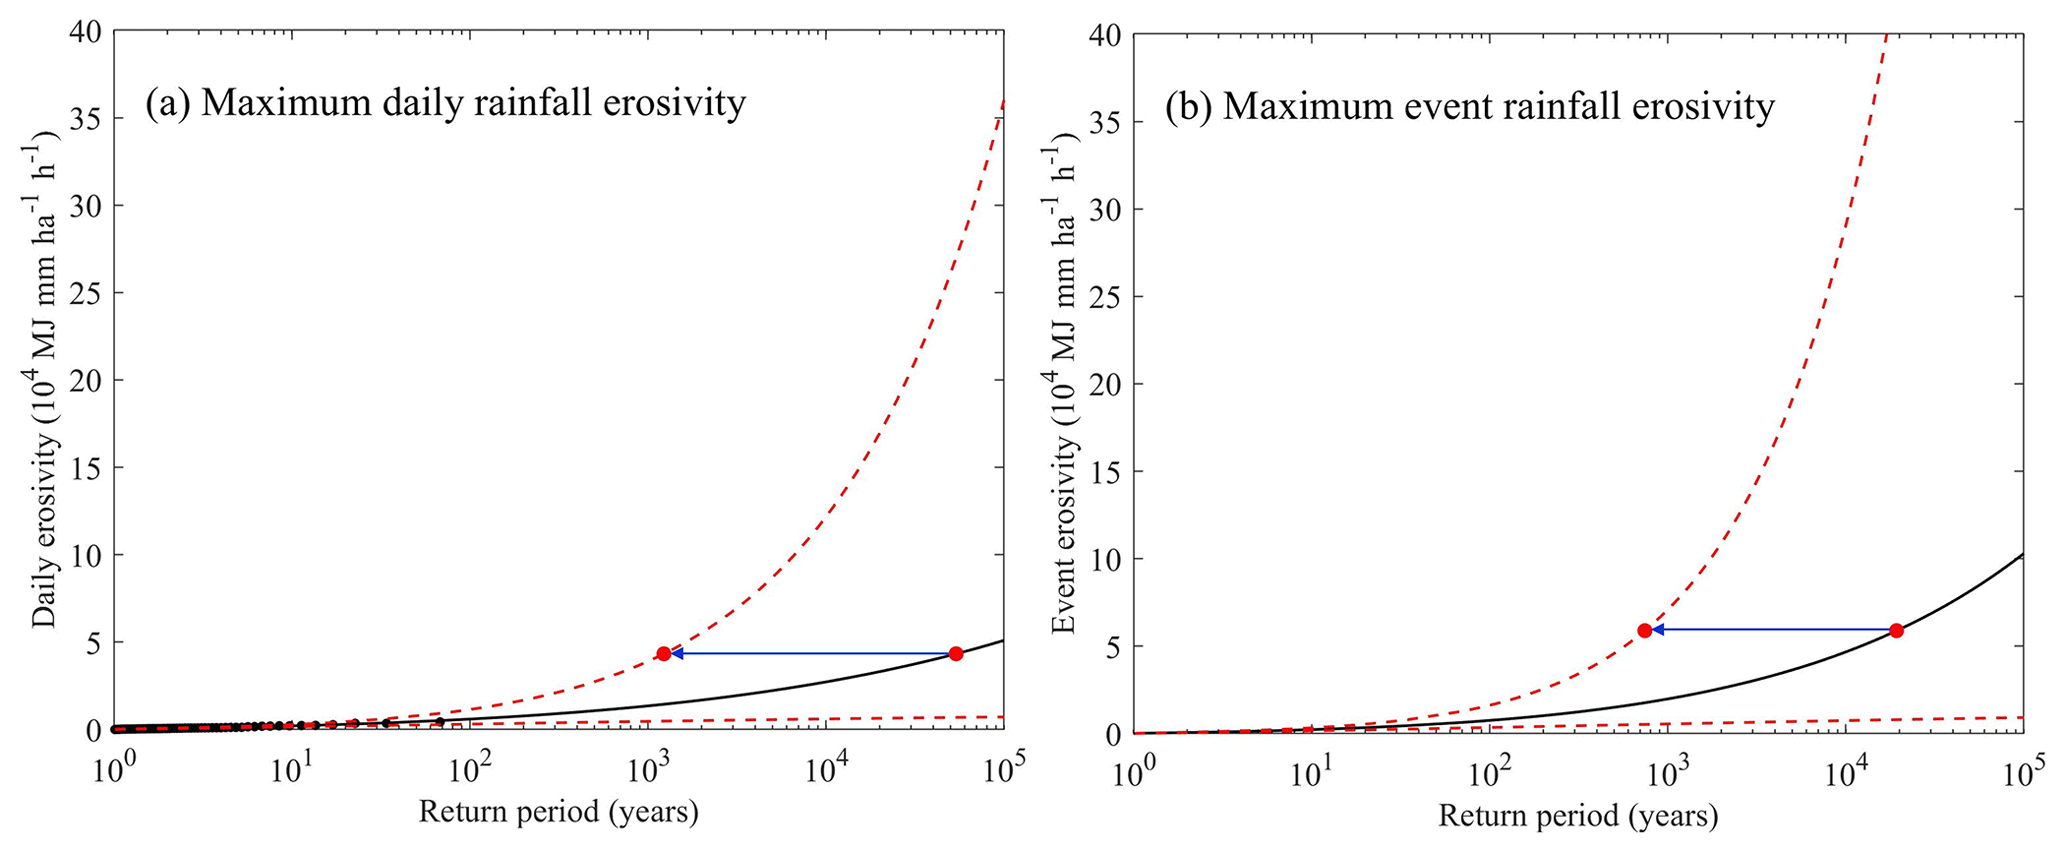
Figure 7Observed daily (a) and event (b) rainfall erosivity as a function of the return period assuming LP-III for Zhengzhou Meteorological Station (performed anti-logarithm conversion for Fig. 6).
The map of the return period of the maximum daily and event rainfall erosivity of the 7.20 storm in Henan Province is shown in Fig. 8. Similarly to Zhengzhou Meteorological Station, the map of the return period of the rainfall erosivity of the 7.20 storm in the study area was drawn by fitting the LP-III distribution. The map shows that the return periods of daily (15 stations) and event (17 stations) rainfall erosivity at some meteorological stations exceed the 1-in-100-year erosivity, mainly in the northern region of Henan Province, with Zhengzhou Meteorological Station being at the center of the 7.20 storm.
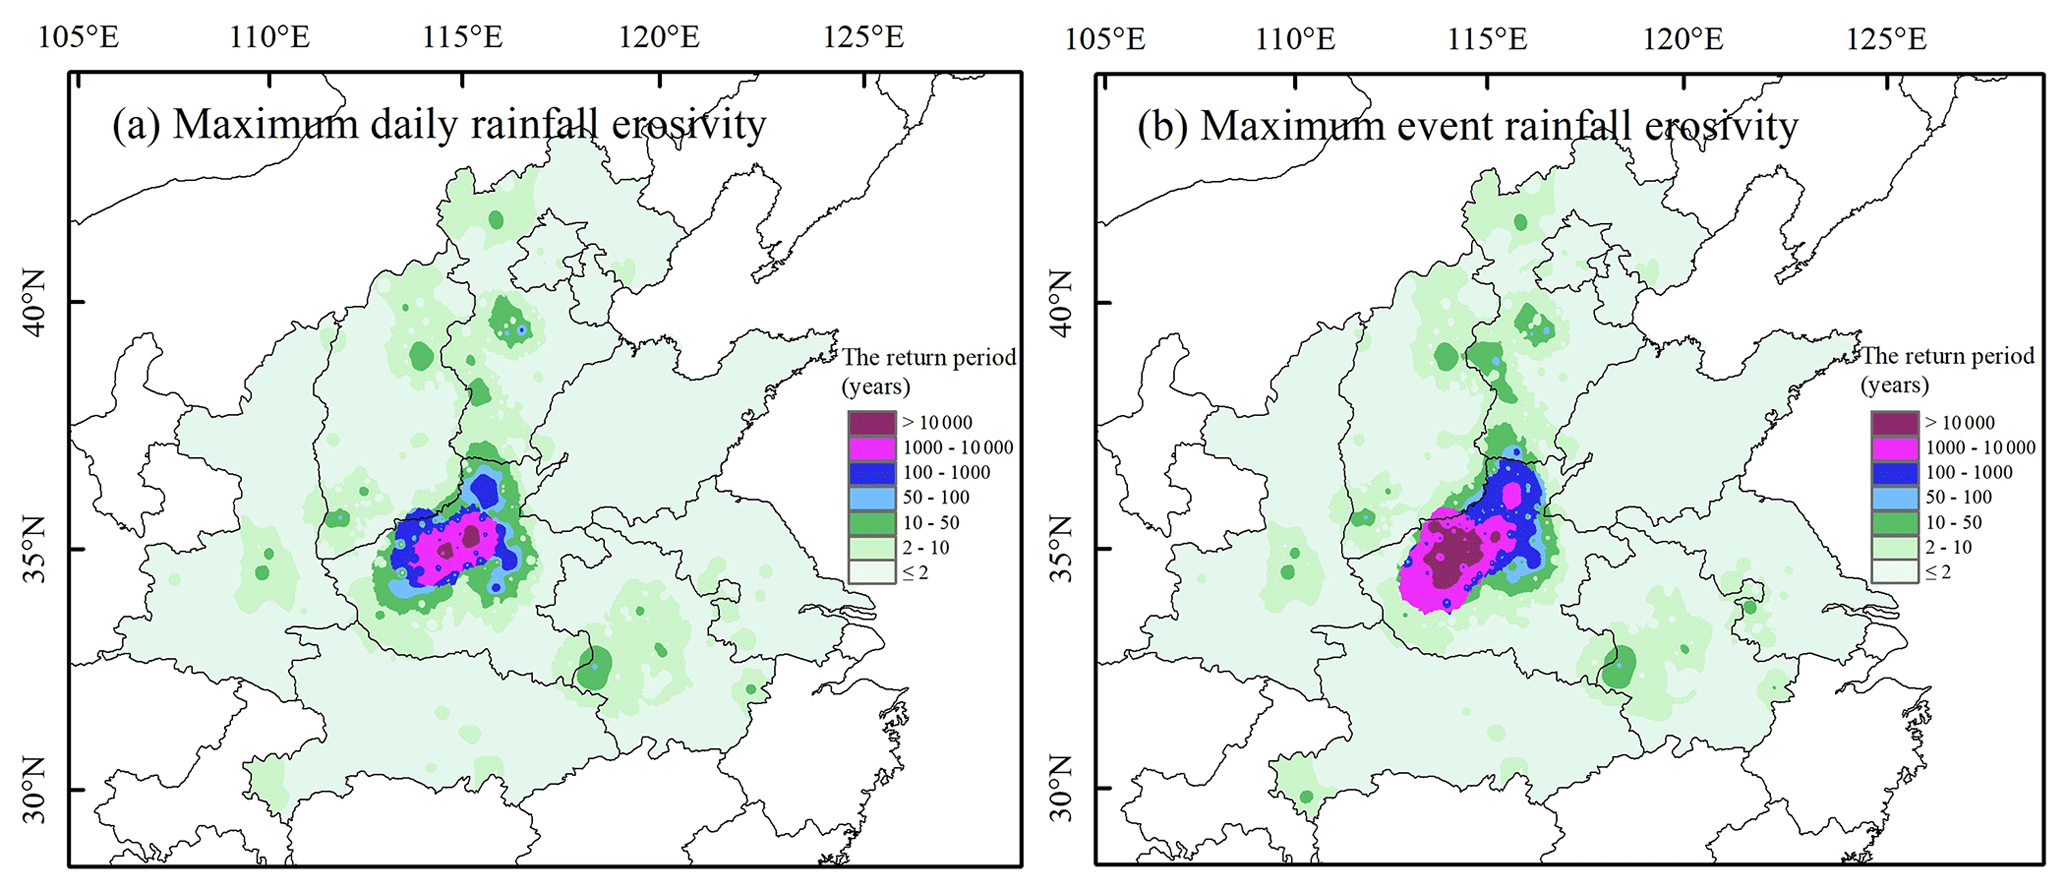
Figure 8The return period of daily (a) and event (b) rainfall erosivity of the 7.20 storm in the study area.
3.2.2 Distribution of the maximum rainfall erosivity at different latitudes
The geographical distribution of the maximum daily rainfall erosivity ever recorded at each of 2420 meteorological stations in China up to 2022 is shown as a function of the latitude in Fig. 9. Envelope curves I and II are drawn for the scatter plot, and the stations and the corresponding daily rainfall and rainfall erosivity values that were used to define these envelope curves are given in Table 2. The two envelope curves overlap at three stations at low latitudes and one at high latitude, and the change from curve I to II in the middle latitude is entirely a result of the 7.20 storm in 2021. Prior to the 7.20 storm, curve I shows that the maximum recorded daily rainfall erosivity decreased from about 20∘ N as the latitude increased, and the maximum daily erosivity value was 36 802 MJ mm ha−1 h−1, recorded at Qingyuan Meteorological Station in Guangdong Province (23.72∘ N) on 12 May 1982. Because of the 7.20 storm, the maximum daily rainfall erosivity ever recorded was increased to 43 354±1863 MJ mm ha−1 h−1, an increase of more than 10 %, at Zhengzhou Meteorological Station (34.72∘ N) on 20 July 2021.
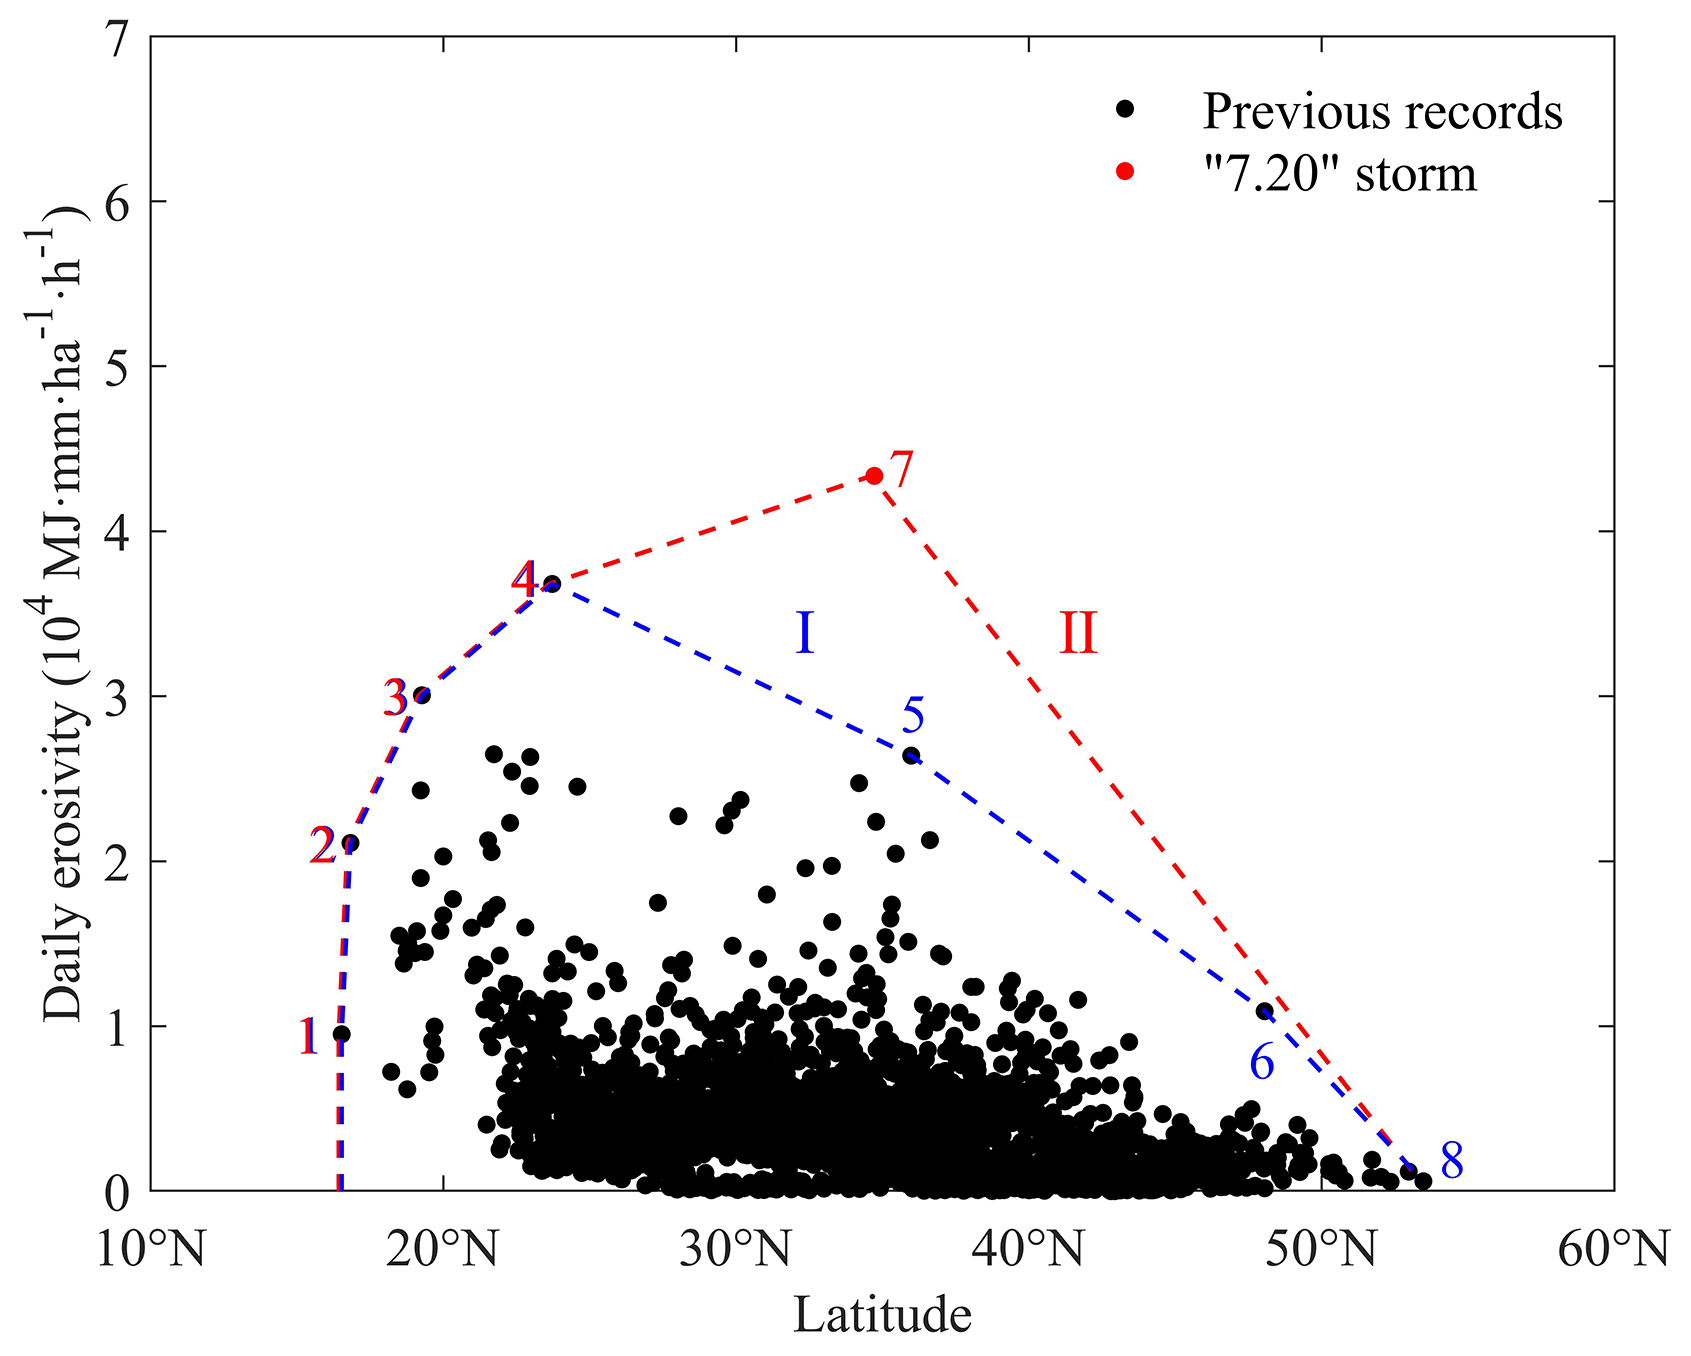
Figure 9The maximum recorded daily rainfall erosivity as a function of latitude for China. The point enclosed by the envelope curve I is the maximum daily rainfall erosivity of each station from 1951 to 2020. The point enclosed by envelope curve II is the maximum daily rainfall erosivity of each station from 1951 to 2021.
Table 2The mean annual rainfall, maximum daily rainfall and rainfall erosivity for stations to define envelope curves.
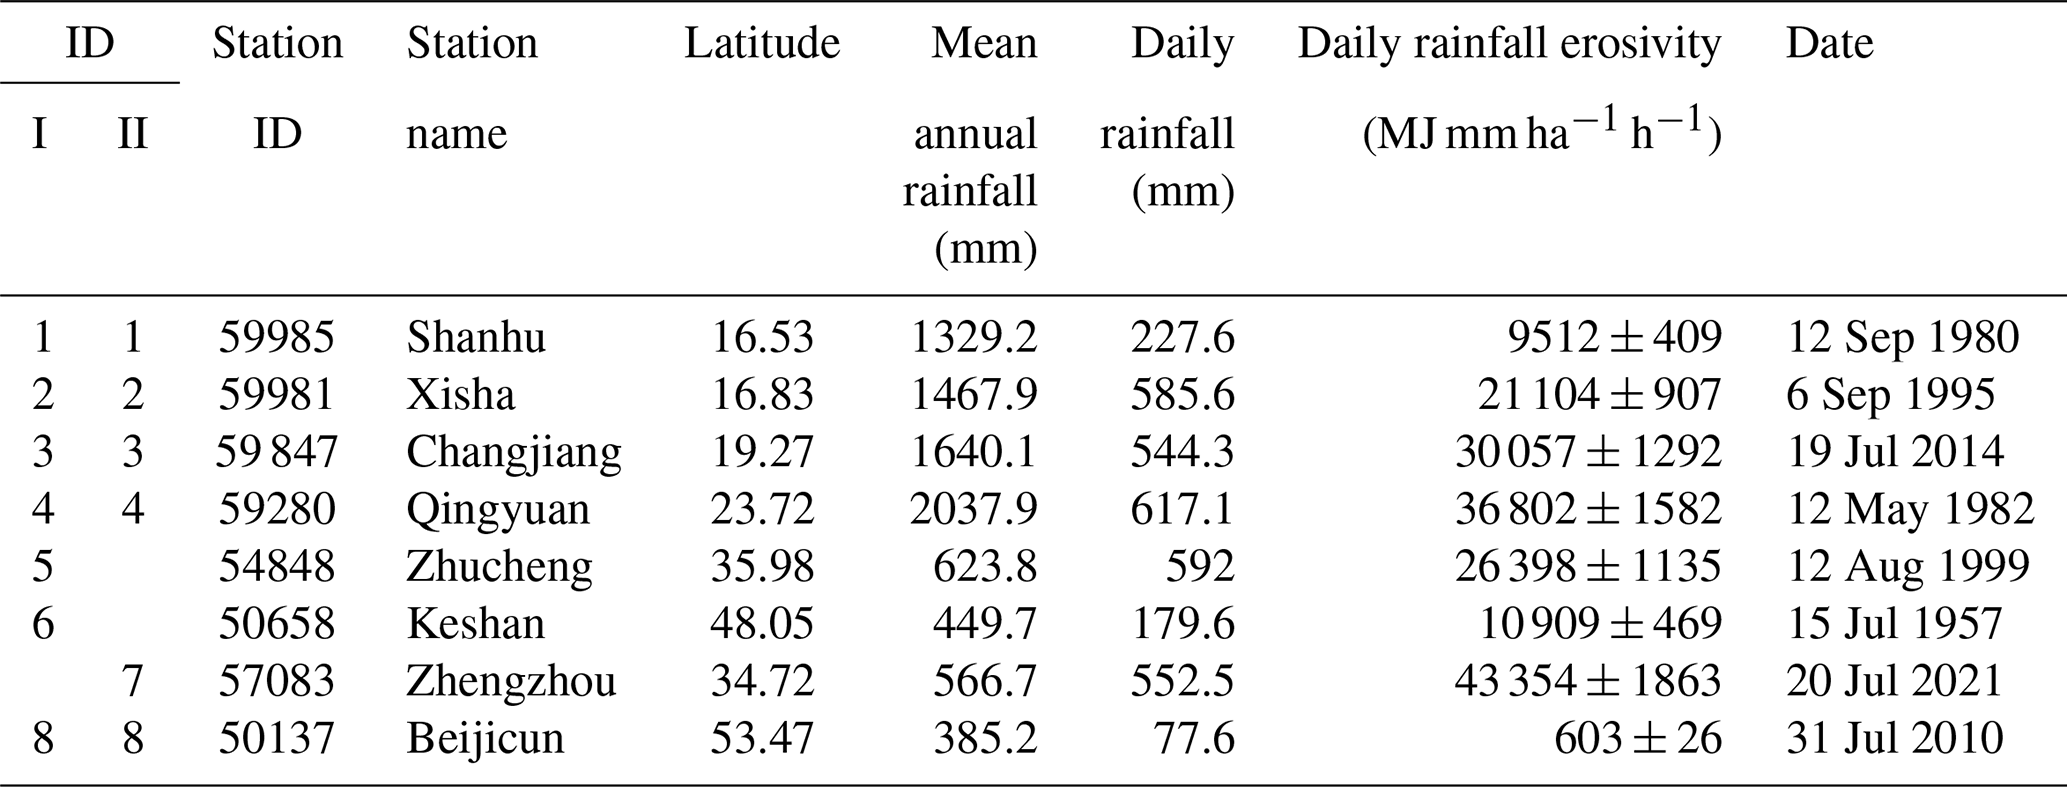
Table 3The mean annual rainfall, maximum event rainfall and rainfall erosivity for stations to define envelope curves.
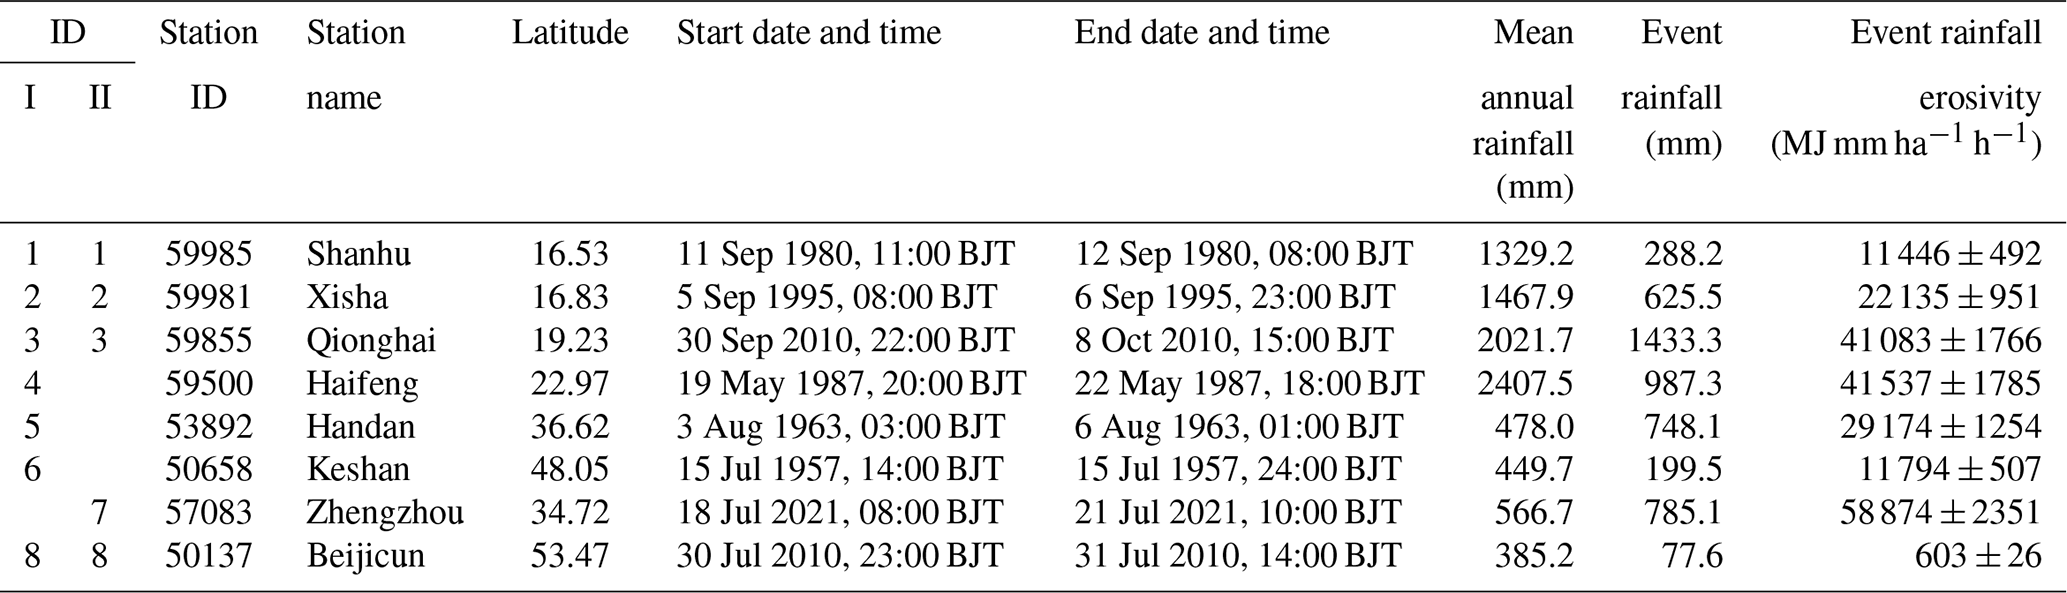
The geographical distribution of the maximum event rainfall erosivity ever recorded at each of the 2420 meteorological stations in China up to 2022 is shown as a function of the latitude in Fig. 10. Envelope curves I and II are drawn for the scatter plot, and the stations and the corresponding event rainfall and rainfall erosivity values that were used to define these envelope curves are given in Table 3. The two envelope curves overlap at three stations at low latitudes and one at high latitude, and the change from curve I to II in the middle latitude is entirely a result of the extreme 7.20 storm in 2021. Prior to the 7.20 storm, curve I shows that the maximum recorded event rainfall erosivity decreased from about 20∘ N as the latitude increased, and the maximum ever event erosivity value was 41 537 MJ mm ha−1 h−1, recorded at Maoming Meteorological Station in Guangdong Province (21.75∘ N) from 20:00 BJT on 19 May to 18:00 BJT on 22 May 1987. Because of the 7.20 storm, the maximum event rainfall erosivity ever recorded was increased to 58 874±2351 MJ mm ha−1 h−1, an increase of more than 40 %, at Zhengzhou Meteorological Station (34.72∘ N) on 20 July 2021.
A large number of studies have shown that the mean annual rainfall and rainfall erosivity, i.e., the R factor, decrease from southeast to northwest in China (Yin et al., 2019; Yue et al., 2022); that is, the mean annual rainfall and rainfall erosivity are the highest at low latitudes in China. Like rainfall, the average rainfall intensity for a given storm duration also tends to be high at low latitudes and low at high latitudes in China (Kong et al., 2017). Thus, one would expect that maximum daily and event rainfall erosivity tend to decrease with the latitude, a trend largely supported by the envelope curve I in Figs. 9 and 10. The 7.20 storm may have fundamentally changed the nature and distribution of extreme daily and event erosivity in China as we knew them up to now. This is consistent with the research of Wang and Luo (2006), and the storm extreme value does not always conform to the pattern of decreasing from low latitudes to high latitudes. For example, based on measured and surveyed rainfall records, the maximum 24 h rainfall depth occurred at Linzhuang in Henan Province in the mid-latitudes on 5–7 August 1975 (Ding, 2015). The occurrence of this 7.20 storm in 2021 around Zhengzhou has important implications. First, Figs. 9 and 10 suggest that extreme event erosivity may be the highest in mid-latitudes around 35∘ N despite the fact the mean annual rainfall and rainfall intensity are by no means the highest in mid-latitudes in China. Second, the 7.20 storm was out of the ordinary in that the event was seemingly unrelated to the underlying climatology. Finally, the 7.20 storm has led us to realize that such extreme erosive events could and may occur anywhere in eastern China, with further implications for soil conservation planning.
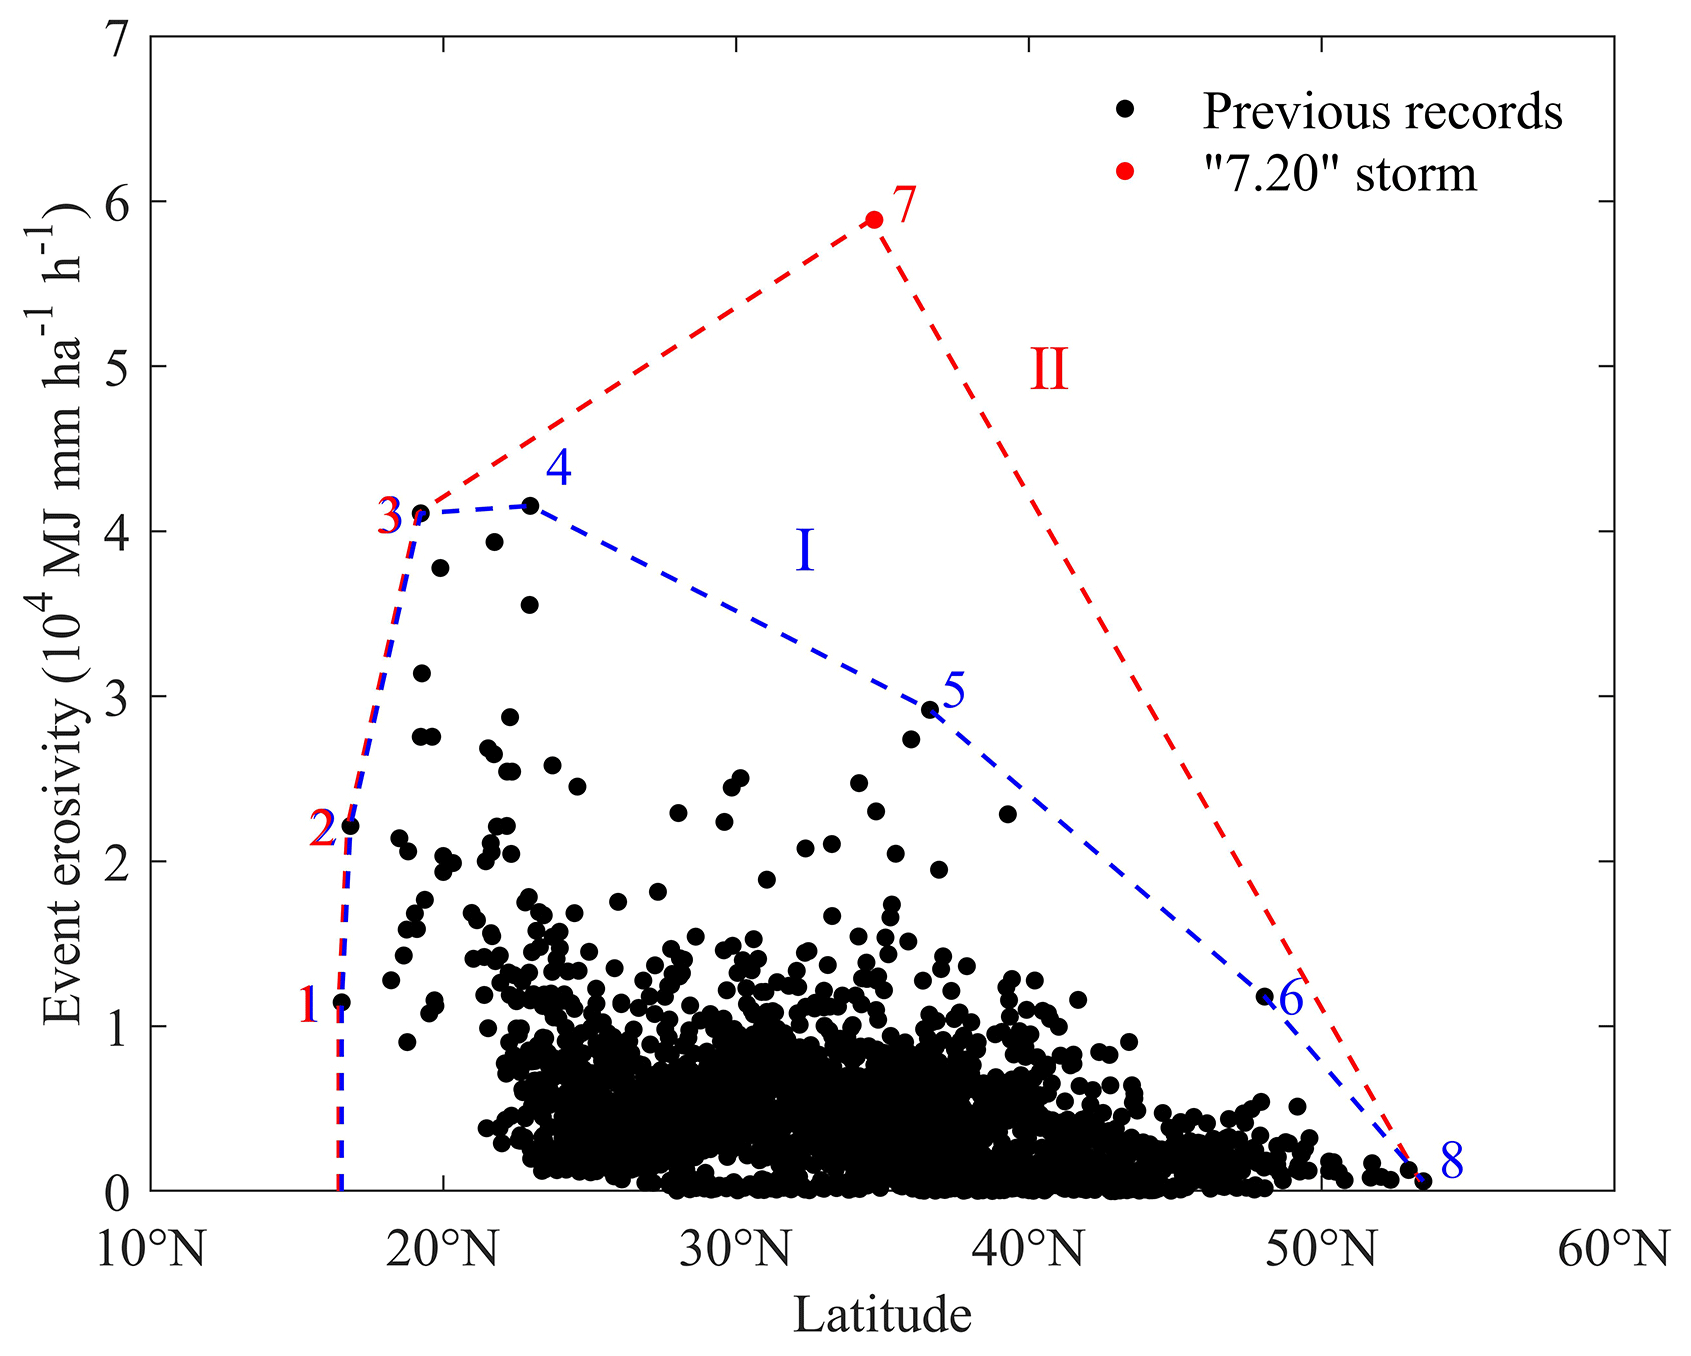
Figure 10The maximum recorded event rainfall erosivity as a function of latitude for China. The point enclosed by the envelope curve I is the maximum event rainfall erosivity of each station from 1951 to 2020. The point enclosed by envelope curve II is the maximum event rainfall erosivity of each station from 1951 to 2021.
The above analysis shows that the 7.20 storm is the largest in terms of the rainfall erosivity among 2420 meteorological stations in mainland China up to 2022. However, there are limitations and uncertainties in our assessment due to the KE–I equations, EI30 conversion factors and probability distributions used.
Firstly, soil erosion processes are related to rainfall kinetic energy, which is a function of the size and fall velocity of raindrops. Different KE–I relationships were recommended in different versions of the USLE, and yet more location-specific KE–I relationships were noted for various regions around the world (van Dijk et al., 2002). Using different KE–I relationships, including those for the USLE and RUSLE and from van Dijk et al. (2002) in addition to the RUSLE2 equation adopted for the study shows that other KE–I relationships would underestimate kinetic energy. Storm energy for the 7.20 storm using other KE–I relationships was 3.1 % to 8.2 % smaller than that reported in the study, and the annual maximum event kinetic energy from 1951 to 2020 differed by −16.9 % to 28.7 % from that reported in the study (Table S1.2). The uncertainty associated with different KE–I relationships does not increase with the magnitude of the rainfall event, as shown in Fig. S1.1 in the Supplement. Similarly, there are considerable differences in the estimated return periods of the event in terms of rainfall erosivity using different KE–I equations (Fig. S1.2). The return period of the 7.20 storm varied from about 20 000 to more than 50 000 years. The relatively small difference in event KE can lead to considerable differences in the return period for such an extreme event when the KE value of the event exceeds all other KE values for the site by at least 1 order of magnitude. These large uncertainties associated with the return period of extreme precipitation have been noted in Germany (Grieser et al., 2007).
Secondly, rainfall erosivity is usually calculated using long-term precipitation records from rain gauges and depends strongly on the temporal resolution of the precipitation data used. Data at a higher temporal resolution would be more desirable to compute rainfall erosivity at a high temporal resolution. However, such data are in short supply, short in length and sparse in spatial coverage. R-factor values decrease with decreasing temporal resolution because intensities are reduced when the precipitation amount is aggregated over longer time intervals (Fischer et al., 2018). Therefore, it is necessary to use conversion factors to adjust the computed EI30 value using data of low temporal resolution. The conversion factor for the 1-in-10-year EI30 computed with the 1 min resolution rainfall data is 1.489, which was appropriate for evaluating extreme rainfall erosivity in this study. To allay the reviewers' concerns, we collected 1 min temporal resolution rainfall data from Zhengzhou Meteorological Station from 2005 to 2016. The annual maximum EI30 values estimated using 1 min and 1 h data were compared (Fig. S2.2). The conversion factor for the annual maximum EI30 at Zhengzhou Meteorological Station is 1.974, which is very close to the conversion factor of the 1-in-10-year EI30 (2.029).
Finally, the estimated return period depends on the selected probability distribution function. Different probability distribution functions can produce quite different estimates for large return periods (Laio et al., 2011). Three frequency distributions were considered and tested, namely the generalized extreme value (GEV), P-III and LP-III; the latter was found to be the most appropriate (Table S3.1). All three distributions fitted the observations well, and performance indicator values did not suggest a single distribution that was consistently and significantly superior to others (Table S3.2). The return periods estimated by the three probability distributions are quite different. The average recurrence intervals of the maximum event rainfall erosivity of GEV and P-III for the 7.20 storm exceed 340 600 years, which is far greater than that reported in the study. The estimated return period of around 20 000 years for the 7.20 storm is conservative. The estimated return period would be much higher if we use other KE–I equations and other probability distributions. Given that LP-III was widely recommended for extreme precipitation and flood events in China (Chen et al., 2012), LP-III was used to assess the return period of this 7.20 storm. Estimating return periods comes with large uncertainties, especially for return periods exceeding the length of the observational record (Bloemendaal et al., 2020).
This study assessed an extreme rainfall event in Henan Province from 20:00 BJT on 16 July to 20:00 BJT on 22 July 2021 using hourly rainfall data from 796 stations in Henan and surrounding provinces. Based on hourly rainfall data of 2420 meteorological stations in China from 1951 to 2021, the annual maximum daily and event rainfall erosivity of Zhengzhou Meteorological Station were fitted with the LP-III distribution to evaluate the magnitude and frequency of occurrence of this extreme event in terms of rainfall amount and erosivity values. The following conclusions can be drawn as a result of this research:
-
The maximum event rainfall (785.1 mm), maximum daily rainfall (552.5 mm), maximum hourly rainfall intensity (201.9 mm h−1) and maximum event rainfall erosivity (58 874±2351 MJ mm ha−1 h−1) of the 7.20 storm all occurred and were recorded at Zhengzhou Meteorological Station. The period of the highest rainfall intensity was mainly concentrated in the middle and late stages of the storm, reaching its peak on 20 July, producing a daily total of 144.2 MJ ha−1 energy.
-
Based on long-term observations for the period 1951–2020 and the fitted LP-III distribution, the 7.20 storm was estimated to have an average recurrence interval in excess of 10 000 years, and the annual maximum daily and event rainfall erosivity were about 7 times larger than the 1-in-100-year erosivity values.
-
This extreme event recorded at the Zhengzhou Meteorological Station has set a new record for daily and event rainfall erosivity values in mainland China. The 7.20 storm in 2021 was extremely rare and suggested to us that extreme erosive events could and may occur anywhere in eastern China rather than in low latitudes with high rainfall amounts and rainfall intensities, as we previously knew and expected.
Observed hourly rainfall data from the National Meteorological Information Center of the China Meteorological Administration were used (NMIC, http://data.cma.cn, last access: 18 December 2023). The hourly precipitation data set derived from national operational rain gauges are not publicly available for legal and ethical reasons but are available to researchers subject to a non-disclosure agreement on reasonable request.
The supplement related to this article is available online at: https://doi.org/10.5194/hess-27-4563-2023-supplement.
YX, SY and BY conceived and designed this study. YX undertook data analysis and interpretation, prepared all the diagrams, and drafted the paper. SY and BY guided the data analysis and interpretation. All the authors reviewed and edited the paper.
The contact author has declared that none of the authors has any competing interests.
Publisher's note: Copernicus Publications remains neutral with regard to jurisdictional claims made in the text, published maps, institutional affiliations, or any other geographical representation in this paper. While Copernicus Publications makes every effort to include appropriate place names, the final responsibility lies with the authors.
This research has been supported by the National Key Research and Development Program of China (grant no. 2021YFE0113800), the National Natural Science Foundation of China (grant no. 41877068), and the Austrian Federal Government (grant no. KR20AC0K17974).
This paper was edited by Matjaz Mikos and reviewed by three anonymous referees.
Alexander, L. V., Hope, P., Collins, D., Trewin, B., Lynch, A., and Nicholls, N.: Trends in Australia's climate means and extremes: a global context, Aust. Meteorol. Mag., 56, 1–18, 2007.
Almagro, A., Oliveira, P. T. S., Nearing, M. A., and Hagemann, S.: Projected climate change impacts in rainfall erosivity over Brazil, Sci. Rep., 7, 8130, https://doi.org/10.1038/s41598-017-08298-y, 2017.
Bezak, N., Mikoš, M., Borrelli, P., Liakos, L., and Panagos, P.: An in-depth statistical analysis of the rainstorms erosivity in Europe, Catena, 206, 105577, https://doi.org/10.1016/j.catena.2021.105577, 2021.
Bezak, N., Borrelli, P., and Panagos, P.: Exploring the possible role of satellite-based rainfall data in estimating inter- and intra-annual global rainfall, Hydrol. Earth Syst. Sci., 26, 1907–1924, https://doi.org/10.5194/hess-26-1907-2022, 2022.
Bloemendaal, N., de Moel, H., Muis, S., Haigh, I. D., and Aerts, J. C. J. H.: Estimation of global tropical cyclone wind speed probabilities using the STORM dataset, Sci. Data, 7, 377, https://doi.org/10.1038/s41597-020-00720-x, 2020.
Bobeé, B. B., and Robitaille, R.: The Use of the Pearson Type 3 and Log Pearson Type 3 Distributions Revisited, Water Resour. Res., 13, 427–443, https://doi.org/10.1029/WR013i002p00427, 1977.
Borrelli, P., Diodato, N., and Panagos, P.: Rainfall erosivity in Italy: a national scale spatio-temporal assessment, Int. J. Digit. Earth, 9, 835–850, https://doi.org/10.1080/17538947.2016.1148203, 2016.
Chen, L., Singh, V. P., Guo, S. L., Hao, Z. C., and Li, T. Y.: Flood coincidence risk analysis using multivariate copula functions, J. Hydrol. Eng., 17, 742–755, https://doi.org/10.1061/(ASCE)HE.1943-5584.0000504, 2012.
Ding, Y. H.: On the study of the unprecedented heavy rainfall in Henan Province during 4–8 August 1975: Review and assessment, Acta Meteorol. Sin., 73, 411–424, https://doi.org/10.11676/qxxb2015.067, 2015.
England Jr., J. F., Salas, J. D., and Jarrett, R. D.: Comparisons of two moments-based estimators that utilize historical and paleoflood data for the log Pearson type III distribution, Water Resour. Res., 39, 1243, https://doi.org/10.1029/2002WR001791, 2003.
England Jr., J. F., Cohn, T. A., Faber, B. A., Stedinger, J. R., Thomas Jr., W. O., Veilleux, A. G., Kiang, J. E., and Mason, R.: Guidelines for Determining Flood Flow Frequency-Bulletin 17C, Techniques and Methods 4-B5, US Geological Survey, Reston, VA, USA, https://doi.org/10.3133/tm4B5, 2019.
Evans, J. P., Arguesco, D., Olson, R., and Di Luca, A.: Bias-corrected regional climate projections of extreme rainfall in south-east Australia, Theor. Appl. Climatol., 130, 1085–1098, https://doi.org/10.1007/s00704-016-1949-9, 2016.
Fang, W., Huang, Q., Huang, S. Z., Yang, J., Meng, E. H., and Li, Y. Y.: Optimal sizing of utility-scale photovoltaic power generation complementarily operating with hydropower: a case study of the World's largest hydro-photovoltaic plant, Energy Convers. Manage., 136, 161–172, https://doi.org/10.1016/j.enconman.2017.01.012, 2017.
Fang, W., Huang, S. Z., Huang, Q., Huang, G. H., Meng, E. H., and Luan, J. K.: Reference evapotranspiration forecasting based on local meteorological and global climate information screened by partial mutual information, J. Hydrol., 561, 764–779, https://doi.org/10.1016/j.jhydrol.2018.04.038, 2018.
Fischer, F. K., Winterrath, T., and Auerswald, K.: Temporal-and spatial-scale and positional effects on rain erosivity derived from point-scale and contiguous rain data, Hydrol. Earth Syst. Sci., 22, 6505–6518, https://doi.org/10.5194/hess-22-6505-2018, 2018.
Fishman, R.: More uneven distributions overturn benefits of higher precipitation for crop yields, Environ. Res. Lett., 11, 024004, https://doi.org/10.1088/1748-9326/11/2/024004, 2016.
Grieser, J., Staeger, T., and Schonwiese, C.-D.: Estimates and uncertainties of return periods of extreme daily precipitation in Germany, Meteorol. Z., 16, 553–564, https://doi.org/10.1127/0941-2948/2007/0235, 2007.
Gu, Z. J., Feng, D. T., Duan, X. W., Gong, K. F., Li, Y. W., and Yue, T. Y.: Spatial and Temporal Patterns of Rainfall Erosivity in the Tibetan Plateau, Water, 12, 200, https://doi.org/10.3390/w12010200, 2020.
He, Y. L. and Huang, F. L.: Data fusion effect and advantage analysis of multi-sensor automatic weather station, Meteorol. Monogr., 41, 1028–1035, 2015.
Huang, S. Z., Chang, J. X., Huang, Q., Chen, Y. T., and Leng, G. Y.: Quantifying the relative contribution of climate and human impacts on runoff change based on the Budyko hypothesis and SVM model, Water Resour. Manage., 30, 2377–2390, https://doi.org/10.1007/s11269-016-1286-x, 2016a.
Huang, S., Huang, Q., Chang, J. X., and Leng, G. Y.: Linkages between hydrological drought, climate indices and human activities: a case study in the Columbia River basin, Int. J. Climatol., 36, 280–290, https://doi.org/10.1002/joc.4344, 2016b.
Huang, S., Huang, Q., Leng, G. Y., and Chang, J. X.: A hybrid index for characterizing drought based on a nonparametric kernel estimator, J. Appl. Meteorol. Clim., 55, 1377–1389, https://doi.org/10.1175/JAMC-D-15-0295.1, 2016c.
IPCC – Intergovernmental Panel on Climate Change: Climate Change 2021 – The Physical Science Basis: Working Group I Contribution to the Sixth Assessment Report of the Intergovernmental Panel on Climate Change, Cambridge University Press, Cambridge, https://doi.org/10.1017/9781009157896, 2023.
Jiang, Q., Li, W., Wen, J., Fan, Z., Chen, Y., Scaioni, M., and Wang, J.: Evaluation of satellite-based products for extreme rainfall estimations in the eastern coastal areas of China, J. Integr. Environ. Sci., 16, 191–207, https://doi.org/10.1080/1943815X.2019.1707233, 2019.
Jin, S. Y., Guo, S. M., and Huo, W. B.: Analysis on the return period of “7.20” rainstorm in the Xiaohua section of the Yellow River in 2021, Water, 14, 2444, https://doi.org/10.3390/w14152444, 2022.
Kebede, S. Y., Endalamaw, T. N., Sinshaw, G. B., and Atinkut, B. H.: Modeling soil erosion using RUSLE and GIS at watershed level in the upper beles, Ethiopia, Environ. Challeng., 2, 100009, https://doi.org/10.1016/j.envc.2020.100009, 2021.
Kinnel, P. I. A.: Rainfall intensity-kinetic energy relationships for soil loss prediction, Soil Sci. Soc. Am. J., 45, 153–155, https://doi.org/10.2136/sssaj1981.03615995004500010033x, 1981.
Kite, G. W.: Confidence limits for design events, Water Resour. Res., 11, 48–53, https://doi.org/10.1029/WR011i001p00048, 1975.
Klik, A. and Rosner, J.: Long-term experience with conservation tillage practices in Austria: Impacts on soil erosion processes, Soil Till. Res., 203, 104669, https://doi.org/10.1016/j.still.2020.104669, 2020.
Kong, F., Lu, L. L., and Fang, J.: Spatiotemporal pattern of hourly heavy rainfall in China and its spatial correlation with urbanization factors during 1991–2010, Clim. Environ. Res., 22, 355–364, https://doi.org/10.3878/j.issn.1006-9585.2017.16139, 2017.
Laio, F., Ganora, D., Claps, P., and Galeati, G.: Spatially smooth regional estimation of the flood frequency curve (with uncertainty), J. Hydrol., 408, 67–77, https://doi.org/10.1016/j.jhydrol.2011.07.022, 2011.
Li, J., Liu, Z. H., and Li, R.: Temporal and spatial characteristics of rainfall erosivity with different geomorphology types on the loess plateau, Bull. Soil Water Conserv., 28, 124–127, https://doi.org/10.13961/j.cnki.stbctb.2008.03.025, 2008.
Liao, X., Xu, W., Zhang, J., Li, Y., and Tian, Y.: Global exposure to rainstorms and the contribution rates of climate change and population change, Sci. Total Environ., 663, 644–653, https://doi.org/10.1016/j.scitotenv.2019.01.290, 2019.
Liu, B. Y., Zhang, K. L., and Xie, Y.: An empirical soil loss equation, in: Proceedings – Process of Soil Erosion and its Environment Effect, Vol. II, 12th international soil conservation organization conference, 26–31 May 2002, Beijing, China, 21–25, https://www.tucson.ars.ag.gov/isco/isco12/VolumeII/AnEmpiricalSoilLossEquation.pdf (last access: 16 December 2023), 2002.
Liu, S. L., Huang, S. Z., Xie, Y. Y., Leng, G. Y., Huang, Q., Wang, L., and Xue, Q.: Spatial-temporal changes of rainfall erosivity in the loess plateau, China: Changing patterns, causes and implications, Catena, 166, 279–289, https://doi.org/10.1016/j.catena.2018.04.015, 2018.
Liu, S. Y., Huang, S. Z., Huang, Q., Xie, Y. Y., Leng, G. Y., Luan, J. K., Song, X. Y., Wei, X., and Li, X. Y.: Identification of the non-stationarity of extreme precipitation events and correlations with large-scale ocean-atmospheric circulation patterns: A case study in the Wei River Basin, China, J. Hydrol., 548, 184–195, https://doi.org/10.1016/j.jhydrol.2017.03.012, 2017.
McGregor, K. C., Bingner, R. L., Bowie, A. J., and Foster, G. R.: Erosivity index values for northern Mississippi, T. ASAE, 38, 1039–1047, https://doi.org/10.13031/2013.27921, 1995.
Meusburger, K., Steel, A., Panagos, P., Montanarella, L., and Alewell, C.: Spatial and temporal variability of rainfall erosivity factor for Switzerland, Hydrol. Earth Syst. Sci., 16, 167–177, https://doi.org/10.5194/hess-16-167-2012, 2012.
Nearing, M. A., Pruski, F. F., and O'Neal, M. R.: Expected climate change impacts on hillslope erosion rates: a review, J. Soil Water Conserv., 59, 43–50, 2004.
NMIC: Basic ground meteorological observation data, http://data.cma.cn (last access: 18 December 2023), 2023.
Palharini, R. S. A., Vila, D. A., Rodrigues, D. T., Quispe, D. P., Palharini, R. C., de Siqueira, R. A., and de Sousa Afonso, J. M.: Assessment of the extreme precipitation by satellite estimates over South America, Remote Sens., 12, 2085, https://doi.org/10.3390/rs12132085, 2020.
Panagos, P., Ballabio, C., Borrelli, P., Meusburger, K., Klik, A., Rousseva, S., Tadic, M. P., Michaelides, S., Hrabalikova, M., Olsen, P., Aalto, J., Lakatos, M., Rymszewicz, A., Dumitrescu, A., Begueria, S., and Alewell, C.: Rainfall erosivity in Europe, Sci. Total Environ., 511, 801–814, https://doi.org/10.1016/j.scitotenv.2015.01.008, 2015.
Panagos, P., Borrelli, P., Matthews, F., Liakos, L., Bezak, N., Diodato, N., and Ballabio, C.: Global rainfall erosivity projections for 2050 and 2070, J. Hydrol., 610, 127865, https://doi.org/10.1016/j.jhydrol.2022.127865, 2022.
Petek, M., Mikoš, M., and Bezak, N.: Rainfall erosivity in Slovenia: Sensitivity estimation and trend detection, Environ. Res., 167, 528–535, https://doi.org/10.1016/j.envres.2018.08.020, 2018.
Qian, H. W., Kong, H. J., Zhao, P. J., Ren, J. J., and Zhang, Y. Y.: Anomaly-based versus full-field-based weather analysis on the extraordinary storm in Henan province in July 2021, Chinese J. Geophys., 65, 4208–4224, https://doi.org/10.6038/cjg2022P0631, 2022.
Rahmawati, N. and Lubczynski, M. W.: Validation of satellite daily rainfall estimates in complex terrain of Bali Island, Indonesia, Theor. Appl. Climatol., 134, 513–532, https://doi.org/10.1007/s00704-017-2290-7, 2018.
Renard, K. G., Foster, G. R., Weesies, G. A., McCool, D. K., and Yoder, D. C.: Predicting soil erosion by water: a guide to conservation planning with the revised universal soil loss equation (RUSLE), Agriculture Handbook no. 703, US Department of Agriculture, Washington, DC, https://ntrl.ntis.gov/NTRL/dashboard/searchResults/titleDetail/PB97153704.xhtml (last access: 16 December 20230, 1997.
Sadeghi, S. H., Hazbavi, Z., Zabihi, M., Larionov, G. A., Krasnov, S. F., Gorobets, A. V., Levi, Y., Erpul, G., Birkel, C., Hoyos, N., Naipal, V., Oliveira, P. T. S., Bonilla, C. A., Meddi, M., Nel, W., Al Dashti, H., Boni, M., Diodato, N., Van Oost, K., Nearing, M., and Ballabio, C.: Global rainfall erosivity assessment based on high-temporal resolution rainfall records, Sci. Rep., 7, 4175, https://doi.org/10.1038/s41598-017-04282-8, 2017.
Shepard, D.: A two-dimensional interpolation function for irregularly-spaced data, in: Proceedings of the 1968 23rd ACM National Conference, ACM, 27–29 August 1968, New York, NY, USA, 517–524, https://doi.org/10.1145/800186.810616, 1968.
USDA–ARS.: Science documentation: Revised universal soil loss equation version 2 (RUSLE2), US Department of Agriculture, Agricultural Research Service, Washington, DC, https://www.ars.usda.gov/ARSUserFiles/60600505/RUSLE/RUSLE2_Science_Doc.pdf (last access: 16 December 2023), 2013.
van Dijk, A. I. J. M., Bruijnzeel, L. A., and Rosewell, C. J.: Rainfall intensity-kinetic energy relationships: a critical literature appraisal, J. Hydrol., 261, 1–23, https://doi.org/10.1016/S0022-1694(02)00020-3, 2002.
Viessman Jr., W. and Lewis, G.: Introduction to hydrology, Pearson Education Inc, San Antonio, USA, ISBN 13 978-0673993373, 2002.
Wang, J. Q. and Luo, C. C.: Research on the characteristics of rainstorms and floods in China, J. China Hydrol., 26, 33–36, https://doi.org/10.3969/j.issn.1000-0852.2006.03.009, 2006.
Wang, W. T., Yin, S. Q., Xie, Y., Liu, B. Y., and Liu, Y. N.: Effects of four storm patterns on soil loss from five soils under natural rainfall, Catena, 141, 56–65, https://doi.org/10.1016/j.catena.2016.02.019, 2016.
Wischmeier, W. H. and Smith, D. D.: Predicting rainfall erosion losses from cropland east of the Rocky Mountains: Guide for selection of practices for soil and water conservation, Agriculture Handbook no. 282, US Department of Agriculture ,Washington, DC, https://www.govinfo.gov/app/details/GOVPUB-A-PURL-gpo22285 (last access: 16 December 2023), 1965.
Wischmeier, W. H. and Smith, D. D.: Predicting rainfall erosion losses: A guide to conservation planning, Agriculture Handbook no. 537, US Department of Agriculture, Washington, DC, https://www.govinfo.gov/app/details/GOVPUB-A-PURL-gpo31516 (last access: 16 December 2023), 1978.
Yin, S. Q., Xue, X. C., Yue, T. Y., Xie, Y., and Gao, G.: Spatiotemporal distribution and return period of rainfall erosivity in China, T. Chinese Soc. Agricult. Eng., 35, 105–113, https://doi.org/10.11975/j.issn.1002-6819.2019.09.013, 2019.
Yin, S. Q., Nearing, M. A., Borrelli, P., and Xue, X. C.: Rainfall Erosivity: An Overview of Methodologies and Applications, Vadose Zone J., 16, 1–16, https://doi.org/10.2136/vzj2017.06.0131, 2017.
Yue, T. Y., Xie, Y., Yin, S. Q., Yu, B. F., Miao, C. Y., and Wang, W. T.: Effect of time resolution of rainfall measurements on the erosivity factor in the USLE in China, Int. Soil Water Conserv. Res., 8, 373–382, https://doi.org/10.1016/j.iswcr.2020.06.001, 2020.
Yue, T. Y., Yin, S. Q., Xie, Y., Yu, B. F., and Liu, B. Y.: Rainfall erosivity mapping over mainland China based on high-density hourly rainfall records, Earth Syst. Sci. Data, 14, 665–682, https://doi.org/10.5194/essd-14-665-2022, 2022.
Zhang, X., Yang, H., Wang, X. M., Shen, L., Wang, D., and Li, H.: Analysis on characteristic and abnormality of atmospheric circulations of the July 2021 extreme precipitation in Henan, T. Atmos. Sci., 44, 672–687, https://doi.org/10.13878/j.cnki.dqkxxb.20210907001, 2021.
Zhang, X. K., Feng, L. C., and Cui, X. L.: Study on urban resilient waterlogging control system under 7.20 rainstorm in Zhengzhou – Core area of Fuzhou Binhai New Town, J. Catastrophol., 37, 79–83, https://doi.org/10.3969/j.issn.1000-811X.2022.02.014, 2022.
Zhou, P. H. and Wang, Z. L.: A study on rainstorm causing soil erosion in the Loess Plateau, J. Soil Water Conserv., 6, 1–5, https://doi.org/10.13870/j.cnki.stbcxb.1992.03.001, 1992.