the Creative Commons Attribution 4.0 License.
the Creative Commons Attribution 4.0 License.
 | 20 Dec 2023
Uncertainty assessment of satellite remote-sensing-based evapotranspiration estimates: a systematic review of methods and gaps
Johannes van der Kwast
Solomon Seyoum
Remko Uijlenhoet
Graham Jewitt
Marloes Mul
Satellite remote sensing (RS) data are increasingly being used to estimate total evaporation, often referred to as evapotranspiration (ET), over large regions. Since RS-based ET (RS-ET) estimation inherits uncertainties from several sources, many available studies have assessed these uncertainties using different methods. However, the suitability of methods and reference data subsequently affects the validity of these evaluations. This study summarizes the status of the various methods applied for uncertainty assessment of RS-ET estimates, discusses the advances and caveats of these methods, identifies assessment gaps, and provides recommendations for future studies. We systematically reviewed 676 research papers published from 2011 to 2021 that assessed the uncertainty or accuracy of RS-ET estimates. We categorized and classified them based on (i) the methods used to assess uncertainties, (ii) the context where uncertainties were evaluated, and (iii) the metrics used to report uncertainties. Our quantitative synthesis shows that the uncertainty assessments of RS-ET estimates are not consistent and comparable in terms of methodology, reference data, geographical distribution, and uncertainty presentation. Most studies used validation methods using eddy-covariance (EC)-based ET estimates as a reference. However, in many regions such as Africa and the Middle East, other references are often used due to the lack of EC stations. The accuracy and uncertainty of RS-ET estimates are most often described by root-mean-squared errors (RMSEs). When validating against EC-based estimates, the RMSE of daily RS-ET varies greatly among different locations and levels of temporal support, ranging from 0.01 to 6.65 mm d−1, with a mean of 1.18 mm d−1. We conclude that future studies need to report the context of validation, the uncertainty of the reference datasets, the mismatch in the temporal and spatial scales of reference datasets to those of the RS-ET estimates, and multiple performance metrics with their variation in different conditions and their statistical significance to provide a comprehensive interpretation to assist potential users. We provide specific recommendations in this regard. Furthermore, extending the application of RS-ET to regions that lack validation will require obtaining additional ground-based data and combining different methods for uncertainty assessment.
- Article
(3205 KB) - Full-text XML
-
Supplement
(816 KB) - BibTeX
- EndNote


Evapotranspiration (ET) is the key variable linking the water, energy, and carbon cycles of the Earth (Fisher et al., 2017). In the terrestrial water cycle, it is the second-largest flux after precipitation (Korzoun et al., 1978), which predominates the demand side of water resources. It is associated with latent heat flux in the surface energy balance. ET combines the evaporation of water from soil, free water surfaces, and plants and, thus, depends on many factors, such as the atmospheric and vegetation conditions, the availability of water in the soil, waterbodies, canopy, and surface roughness (Monteith, 1965; Shuttleworth and Wallace, 1985). The complexity of measuring ET directly makes it difficult and expensive to routinely measure and capture its spatial variation as this requires a dense network of in situ gauging stations. Therefore, satellite remote sensing (RS) observations have been increasingly used for estimating ET spatially.
As ET cannot be directly measured by sensors from space, retrieval algorithms or models are needed to estimate ET from other variables observed by RS (Fisher et al., 2017). These models estimate ET from visible and/or thermal infrared RS data and include now-well-known models such as SEBAL (Bastiaanssen et al., 1998), TSEB (Kustas and Norman, 1999), SEBS (Su, 2002), METRIC (Allen et al., 2007), ALEXI (Anderson et al., 2011), PT-JPL (Fisher et al., 2008), and GLEAM (Miralles et al., 2011a). The diversity of models, input RS data sources, and processing techniques results in a wide range of RS-based ET estimates (Jiménez et al., 2011; Long et al., 2014; Chen et al., 2014).
While many studies have evaluated the performance of RS-based ET (RS-ET) models, none of them have concluded that a single model performs best in all situations (e.g., Ferguson et al., 2010; Vinukollu et al., 2011a). Furthermore, retrieving ET estimates requires access to the data, software or source code, and expertise in these models. The limited accessibility of RS-ET models leads to significant challenges to operational applications of RS-ET estimates (e.g., irrigation scheduling and drought monitoring). Driven by community needs, several projects have provided platforms to increase public access to various data products which are generated by these RS-ET models. These projects and outputs include MODIS16 (Mu et al., 2011), SSEBop (Senay et al., 2013), GLEAM (Miralles et al., 2011a), WaPOR (FAO, 2018), ECOSTRESS (Fisher et al., 2020), and OpenET (Melton et al., 2021).
Given that more RS-ET data products are becoming available, information about the uncertainties in RS-ET estimates is important for data users (i.e., water managers and policymakers) to apply them properly. Uncertainty assessment helps data users know what level of confidence they can have in ET estimates and the inferred information about water resources (e.g., crop water consumption, water depletion). Inferences based on RS-ET data products are limited by their spatio-temporal resolution, latency, and specifications.
Previous reviews have discussed RS-ET estimates and uncertainty, which are relevant to this review (Fig. 1). Table S2 in the Supplement summarizes the main topics of these reviews. Many of these reviews focused on outlining the methods to estimate ET using RS-based models (e.g., Kustas and Norman, 1996; Courault et al., 2005; Wang and Dickinson, 2012; Zhang et al., 2016) and sometimes discussed the uncertainties in the estimation (Kalma et al., 2008; Glenn et al., 2011; Karimi and Bastiaanssen, 2015). However, none of these explored how uncertainties in RS-ET estimates are currently being assessed, which is an important issue in remote sensing and the production of spatial data (Bielecka and Burek, 2019; Wu et al., 2019a; Mayr et al., 2019). In an overview of global RS-based essential climate variables, Bayat et al. (2021) concluded that RS-ET data products lack a good practice protocol for operational validation compared to other variables. Meanwhile, in situ measurements of ET also suffer from errors and uncertainty (Allen et al., 2011a) and, thus, require complete documentation that provides sufficient information to ascertain the expected accuracy and representativeness of the reported ET estimates (Allen et al., 2011b).
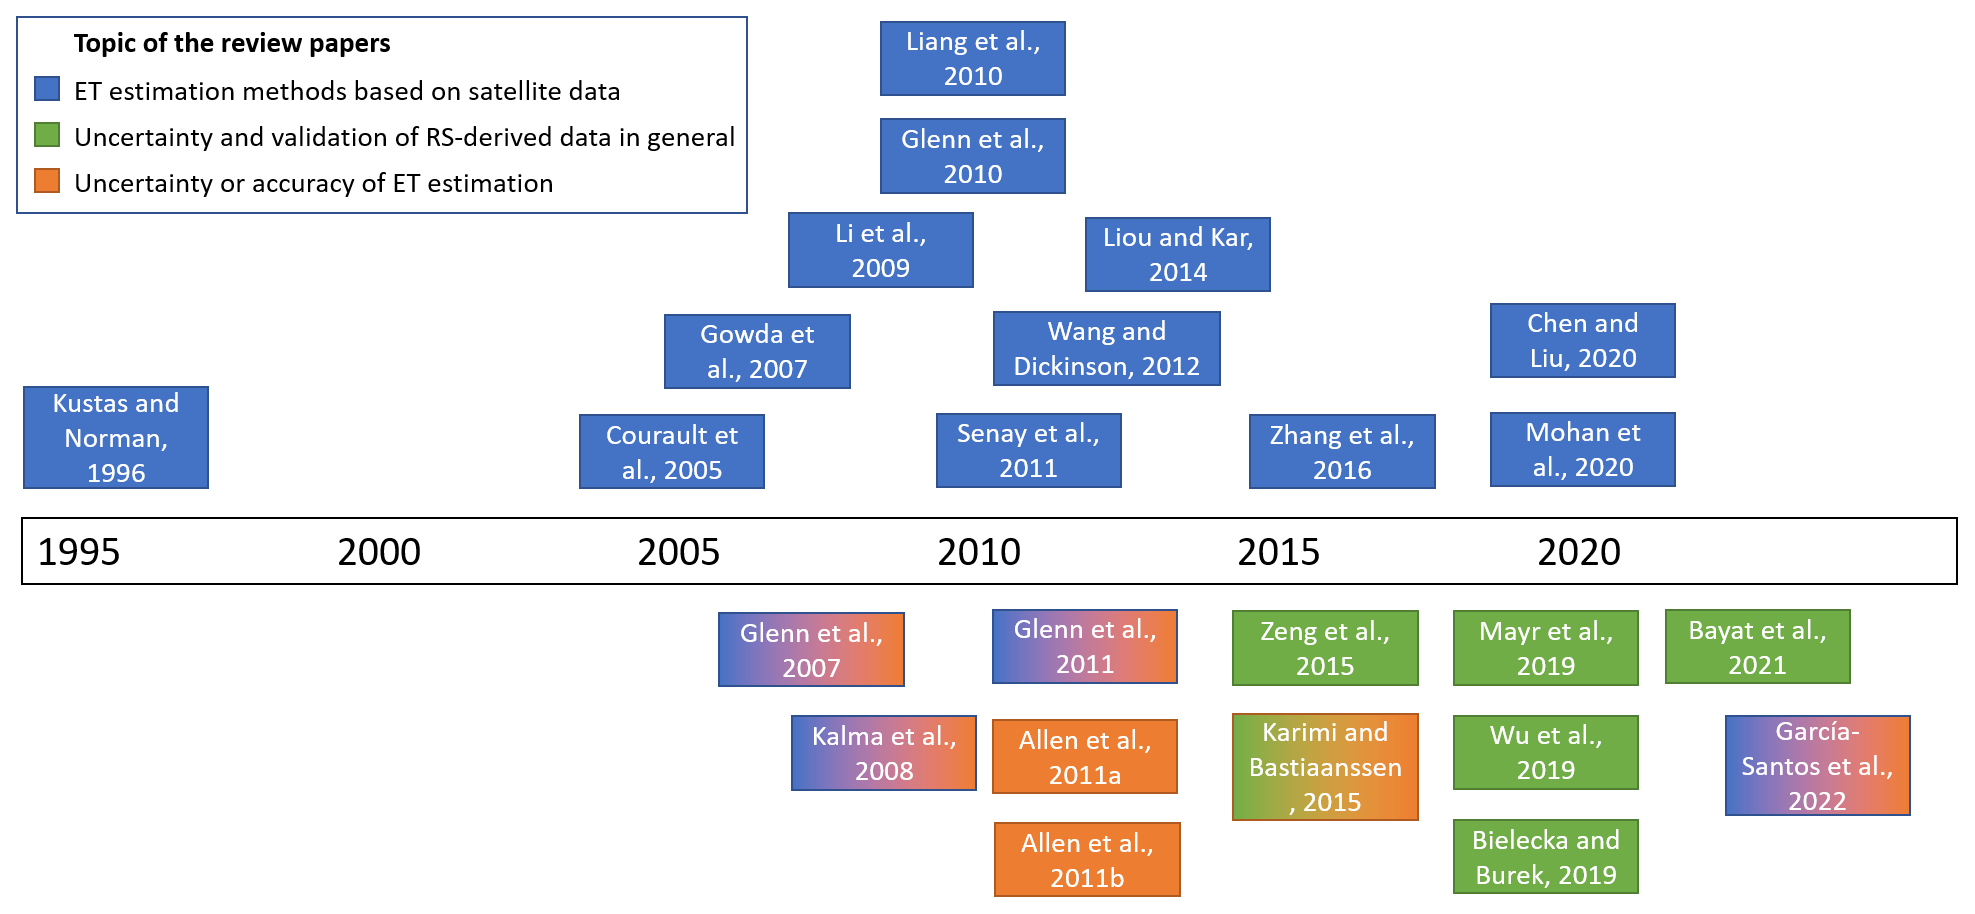
Figure 1Previous literature reviews on RS-ET estimation, uncertainty, and validation of RS-derived data.
These reviews highlight the need to better advance the uncertainty assessment of RS-ET, leading to the following research questions:
-
What are the common and emerging methods used to assess uncertainty in RS-ET estimates?
-
In which contexts are the uncertainties of RS-ET assessed with these methods?
-
What is the typical range of uncertainty in RS-ET estimates globally based on previous studies?
To answer these questions and build on existing literature, we surveyed previous studies that assessed the uncertainty or accuracy of RS-ET models or the output data products of these models. Given that many literature reviews on the uncertainty or accuracy of ET estimation have been published until 2011 (Fig. 1), we focus on the period from 2011 to evaluate whether the studies in this period adopted the valuable contributions and recommendations from these previous reviews. Given the growing volume of literature published in the field, we followed a systematic quantitative review approach to avoid subjectivity or bias towards particular products, authors, or approaches. We identified research articles with a set of predetermined criteria and categorized these articles based on (i) the methods used to assess uncertainties, (ii) the context where uncertainties were evaluated, and (iii) the metrics used to report uncertainties. We then quantified the number of articles per category to identify any trends or gaps in literature. Furthermore, we appraised the advances and caveats of the existing methods and provided recommendations for future studies.
The rest of this paper is organized as follows: Sect. 2 provides the theoretical basis for the research and clarifies the key terms that we use to analyze literature using the methods described in Sect. 3. The results of the literature analysis, concerning assessment methods and the context when these methods are used, are discussed in Sects. 4 and 5. Based on the categorized literature, Sect. 6 discusses the use of uncertainty metrics and shows the typical range of uncertainty in RS-ET estimates. Finally, Sect. 7 summarizes the key points and recommendations for future research.
2.1 Uncertainty definition and representation
Uncertainty is generally defined as the state of being not completely confident or sure of something. The terms error, accuracy, bias, and precision are sometimes used to characterize the uncertainty. All these terms are quantifiable information about what is certain or uncertain. However, they are different from uncertainty by definition (Foody and Atkinson, 2003; Heuvelink, 1998; Loew et al., 2017). Error represents the difference between what is measured and its true value (JCGM, 2012). The true value is the exact value according to the theoretical definition of the variable being measured or estimated. If we perfectly know the true value, we have no measurement error, which eliminates uncertainty. Therefore, uncertainty stems from unknown true values and errors.
When a measurement can be repeated, its uncertainty can be described using probability distributions of the measured values or measurement errors compared to a reference (Montanari, 2007; Foody and Atkinson, 2003; Povey and Grainger, 2015). Figure 2 illustrates the relationship between uncertainty and other related terms when uncertainty is described by the probability distribution of the measured value or error. When accuracy is defined as the expectation (i.e., expected value) of overall error (e.g., Foody and Atkinson, 2003), bias (i.e., the difference between the expected value of an estimator and the true value of a parameter) is considered to be a measure of inaccuracy. Likewise, precision can be described using the standard deviation and variance of the probability distribution of measured values since they both denote error spread around the mean.
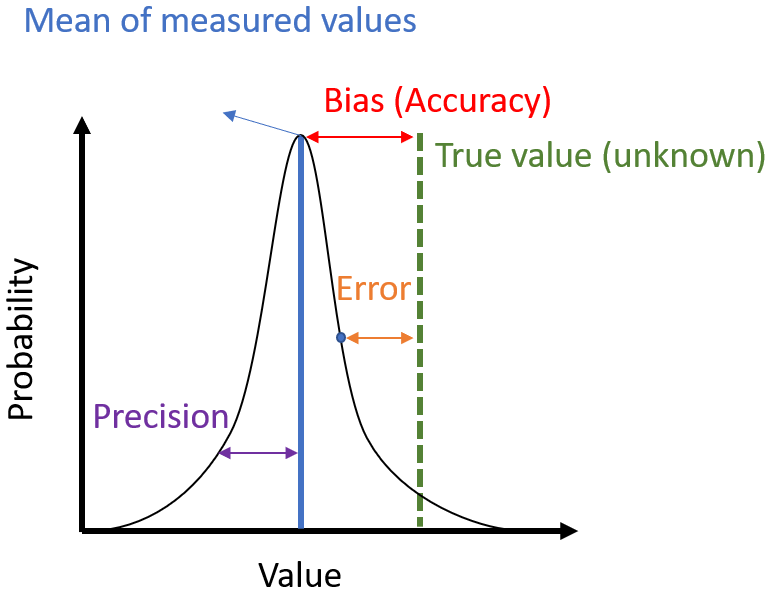
Figure 2Uncertainty as described by the probability distribution of measured values. Adapted from Povey and Grainger (2015) and JCGM (2012).
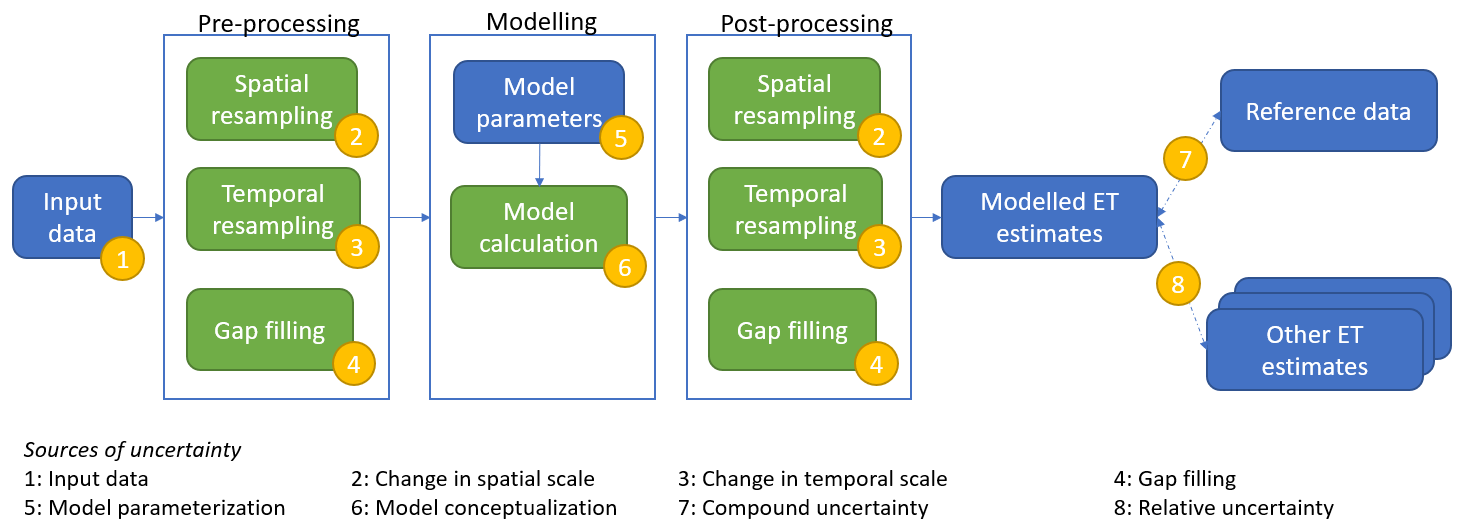
Figure 3The sources of uncertainty in ET estimates from the typical workflow in remote-sensing-based models. Compound uncertainty is the aggregation of all uncertainties from input data, the change in the temporal and spatial scale, gap filling, model parameterization, and model conceptualization.
Some uncertainties cannot be described using a probability distribution function in modeling or measurement. These are called the “known, unquantifiable unknowns” (i.e., what we know to exist but are not able to quantify) and the “unknown unknowns” (i.e., what we do not know to “exist” because we cannot observe) (Povey and Grainger, 2015). The suitability of probability theory for quantifying uncertainty is widely debated in hydrological science (e.g., Beven, 2016; Nearing et al., 2016). Nearing et al. (2016) argue that there is epistemological uncertainty before selecting probability theory as the framework to estimate epistemic uncertainty (i.e., what we do not know certainly). Their uncertainty classification includes philosophical and linguistic types that are hardly quantifiable. Uncertainty assessment of satellite remote sensing data typically reports quantifiable errors but not unknown and unquantifiable errors (Povey and Grainger, 2015).
2.2 Sources of uncertainties in RS-ET data production
Raw satellite imagery undergoes a chain of processing and analysis (retrieval model) to generate useful data and information for applications (Fig. 3). ET is not directly measured by sensors but is derived from models; thus, it is considered to be high-level processing by data providers (ESA, 2021; NASA, 2021). The retrieval models of low-level data (e.g., radiance, vegetation indices) share common formulas and usually require only raw satellite images. High-level data like RS-ET rely on various models with different concepts, assumptions, and data sources. Therefore, the uncertainty of RS-ET data products is strongly linked to model uncertainty (from model conceptualization and parameters) and input data uncertainty.
RS-ET data are typically acquired during satellite passes over specific areas of interest, resulting in essentially instantaneous estimates of remote-sensing-based evapotranspiration (RS-ET). Because many operational applications necessitate ET estimates over longer time intervals, such as daily, 10 d, or monthly totals, various methods have been developed to upscale these instantaneous RS-ET estimates to daily values (Jiang et al., 2021). Moreover, the designated resolution and the return interval of satellites might not be suitable for operational applications; thus, gap-filling and spatial-downscaling steps are common in many RS-ET retrieval models.
Changes in the spatial and temporal scales1 and gap filling during data pre- and post-processing steps also introduce more uncertainty. Modeled estimates are typically validated against a more accurate reference. The errors compared to the reference are referred to as compound uncertainty in this research since this aggregates all sources of uncertainty. Meanwhile, comparison with other equivalent estimates results in relative uncertainty. Although validation essentially yields relative uncertainty due to imperfections in the reference data, we trust it to represent compound uncertainty more than other estimates.
2.3 Uncertainty assessment
Uncertainty assessment refers to the estimation of quantifiable uncertainties. The uncertainty from input factors (e.g., parameters and input data) can be quantified with uncertainty analysis, also called uncertainty propagation or error propagation (Crosetto et al., 2001; Heuvelink, 1998; Wadoux et al., 2020). There are many techniques for uncertainty propagation, and their suitability depends on several factors, including the number of uncertain inputs, uncertainty distribution and correlation of input variables, and model linearity (Mohammadi and Cremaschi, 2022). For RS-based models, analytical techniques which are based on the propagation of moment formulas (Taylor, 1997) are often not suitable because these models have complex relationships, and input uncertainty is not always normally distributed. Numerical techniques are generally applicable to RS-based models (Heuvelink, 1998; Crosetto et al., 2001).
The contribution of each input factor to the total uncertainty in the model output is determined by sensitivity analysis (Crosetto et al., 2001; Saltelli et al., 2021). Such analysis is primarily used to identify the factors that contribute most to the model uncertainty (Saltelli et al., 2019). There are two main approaches to sensitivity analysis: local and global sensitivity analysis. Local sensitivity analysis defines the model's sensitivity to an input factor (e.g., parameter or variable) as the first-order partial derivative of the model with respect to this input factor (Saltelli et al., 2019). In contrast, global sensitivity analysis explores the whole variation range of the input factors (Razavi and Gupta, 2015).
Validation is often applied to confirm a data product's fitness for purpose instead of sensitivity analysis and uncertainty analysis of its retrieval model (Crosetto et al., 2001). The definition of validation in modeling is context dependent and has become more well defined over time (Bellocchi et al., 2011). Model validation does not prove that the model is true but rather proves that it is empirically adequate (Oreskes et al., 1994). A valid model is one that does not contain known or detectable flaws and is internally consistent rather than being an assertion of the actual reality. Meanwhile, validation of model results involves quantifying the accuracy compared to a reference (often in situ datasets), which proves the validity of the data for its intended application. In RS, validation often only refers to the data itself and not the model (Bayat et al., 2021; Loew et al., 2017; Wu et al., 2019a). Because RS-derived data products are model results, their validation depends on the quality and quantity of input parameters and the accuracy of auxiliary hypotheses that were used to derive them (Oreskes et al., 1994). Therefore, validating an RS-ET model does not imply that the model can be applied with any forcing data or settings to produce accurate outputs.
In this literature review, we specifically focus on how the quantifiable uncertainty in the RS-ET estimate has been assessed in recent years (2011–2021). In this paper, we employed Pickering and Byrne's (2014) systematic quantitative literature review method, which includes systematic search, categorization, and quantification of literature. We chose this approach to objectively highlight trends and gaps in current RS-ET uncertainty assessment methods through quantitative results. The literature search is systematic but undeniably not exhaustive; thus, certain papers may be omitted if they do not meet the specified inclusion criteria.
3.1 Identification and database search
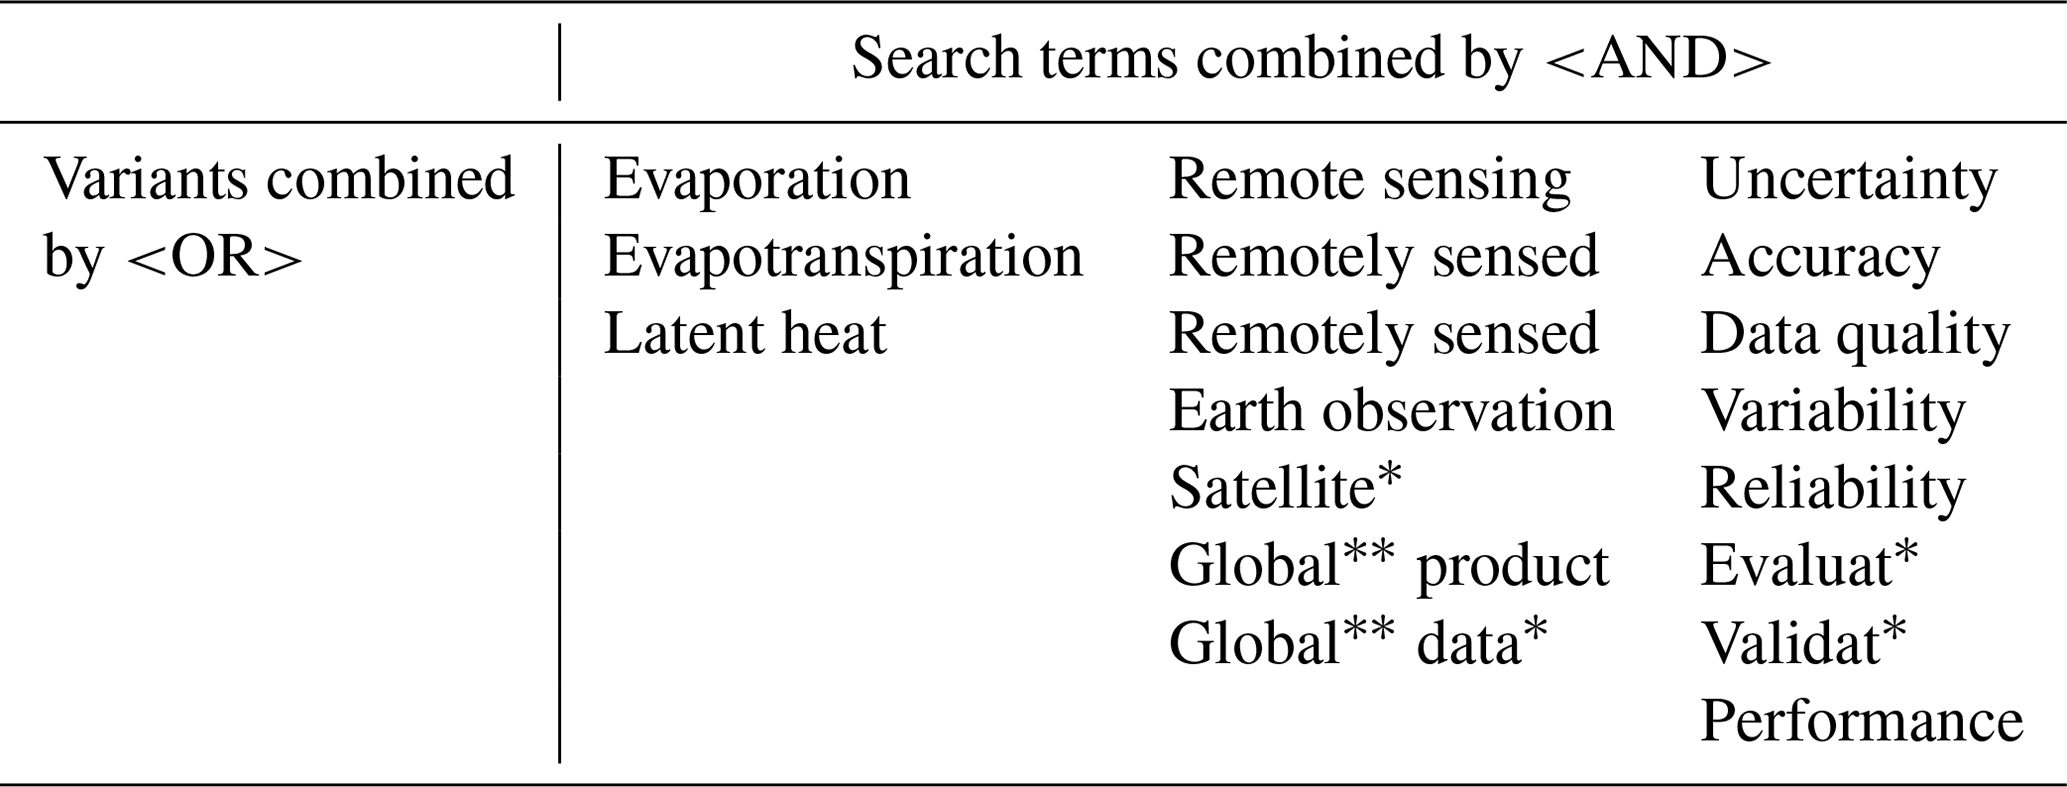
The academic electronic databases Web of Science and Scopus were searched (https://www.webofscience.com/, last access: 24 July 2023 and https://www.scopus.com/, last access: 24 July 2023) using the combination of the three search terms evapotranspiration, remote sensing, and uncertainty or their variants (Table 1). The terms transpiration and interception were not used since they only represent components of ET. Since different terms for satellite remote sensing, evaporation, and uncertainty can be used in the title and abstract, the variants of search terms were identified based on a set of 34 prior articles (Sect. S1 in the Supplement).
Table 1Search terms and variants. Search terms were combined using the AND operator, and variants were combined using the OR operator. The asterisk * was used to include similar terms.
The search results were limited to publication dates from 2011 to 2021, and duplicates were removed. Only English articles (>99 % of results) that reported original research and were published in scientific peer-reviewed journals were considered. Review papers, conference proceedings, and gray literature were not included because they have different formats and provide limited details of the methods used for uncertainty assessment.
3.2 Relevance and eligibility screening
From the search results, we identified papers that attempted to assess the accuracy or uncertainty of one or more satellite remote-sensing-based estimations of terrestrial ET, either from model simulations or analysis-ready data products. The models of interest were diagnostic RS-ET models,2 such as the models that were reviewed by Courault et al. (2005), Zhang et al. (2016), and Chen and Liu (2020). To identify relevant papers, we screened the title and abstract using the ASReview software, a semi-automated screening system that incorporates an active-learning classifier to rank the order of papers based on their relevance to the articles that were included previously (van de Schoot et al., 2021; website: https://asreview.nl/, last access: 7 August 2023). ASReview can help find 95 % of the eligible studies after screening between only 8 % to 33 % of the studies (van de Schoot et al., 2021). Based on the number of articles and the efficiency of ASReview, we established criteria to stop screening when 100 irrelevant records had been found consecutively (3 % of the total records) and when at least 10 % of the total records had been screened. After screening titles and abstracts, we assessed the eligibility of each paper by reading the full-text articles and finally included 676 articles in our review (Fig. 4). A brief bibliometric analysis of these articles is provided in Sect. S2.
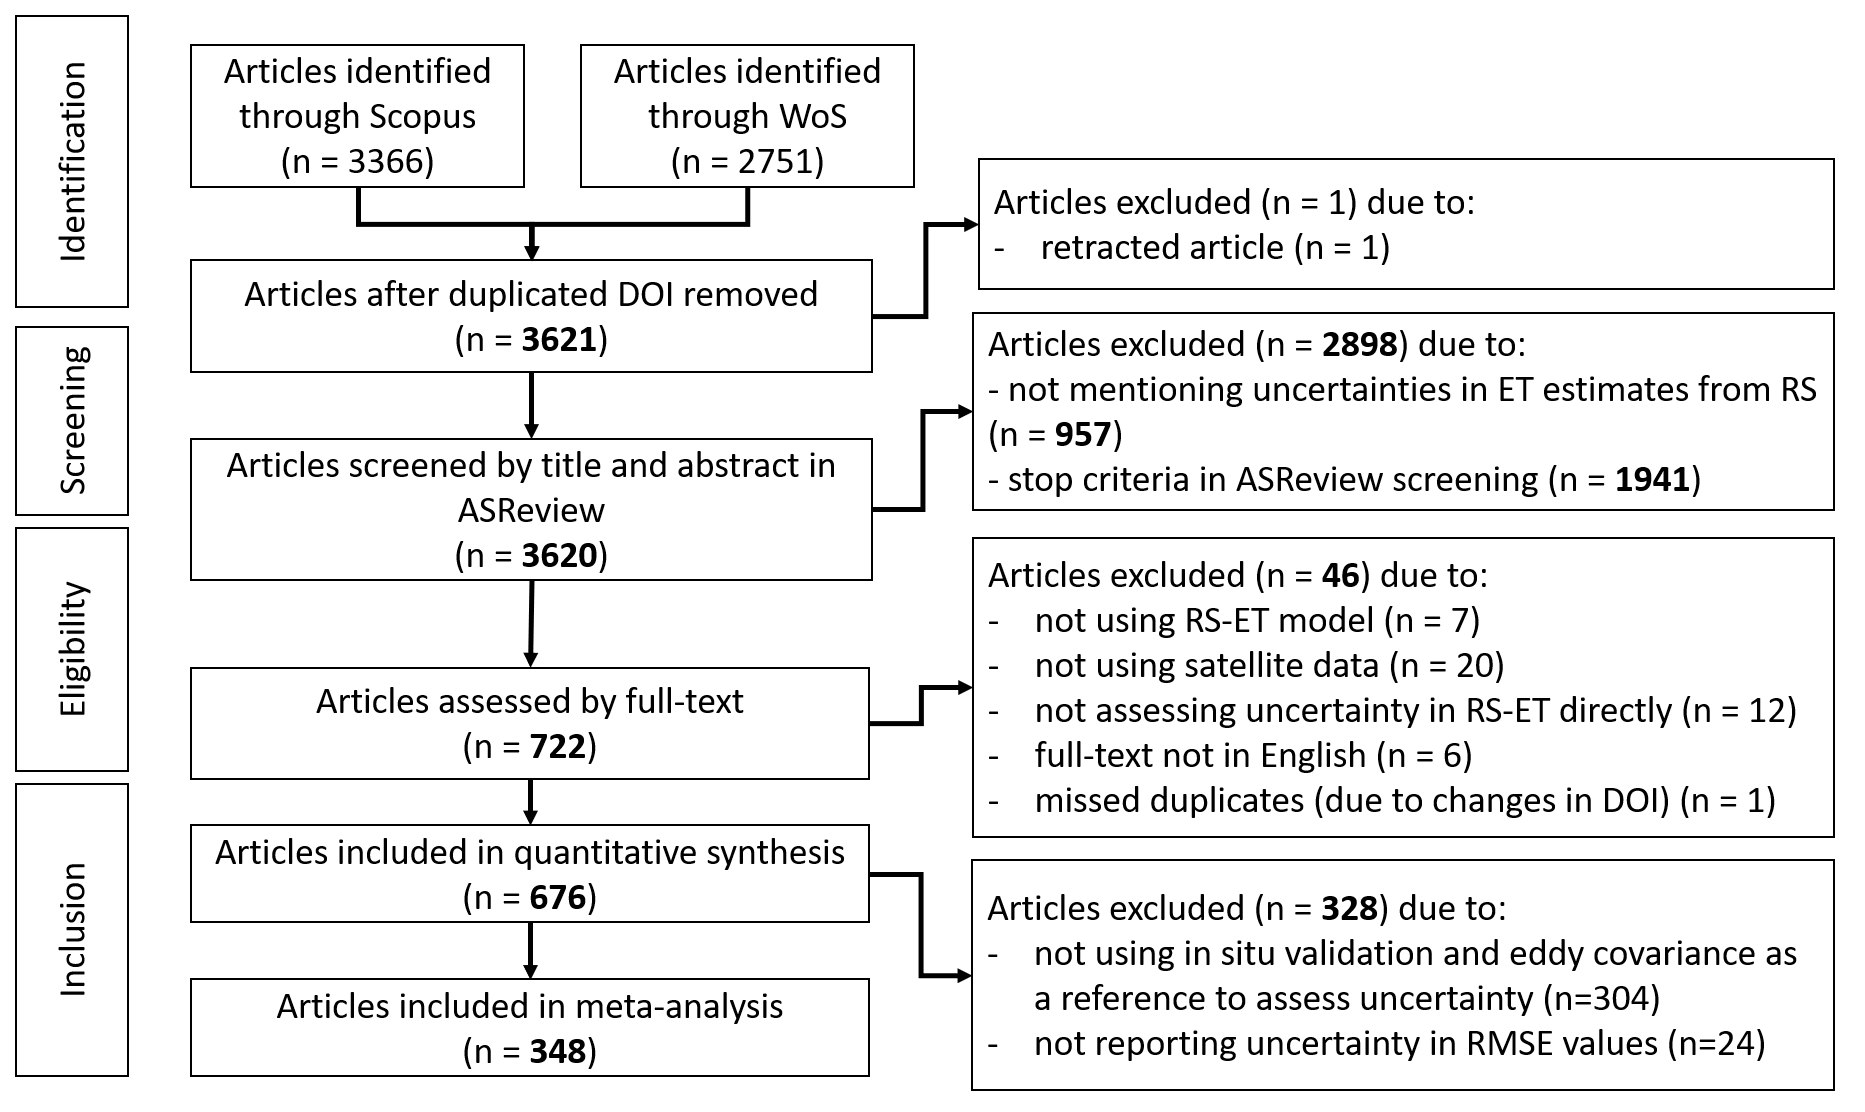
Figure 4Results of article selection from database search (identification), title and abstract screening (screening), and full-text assessment (eligibility).
3.3 Article organization and analysis
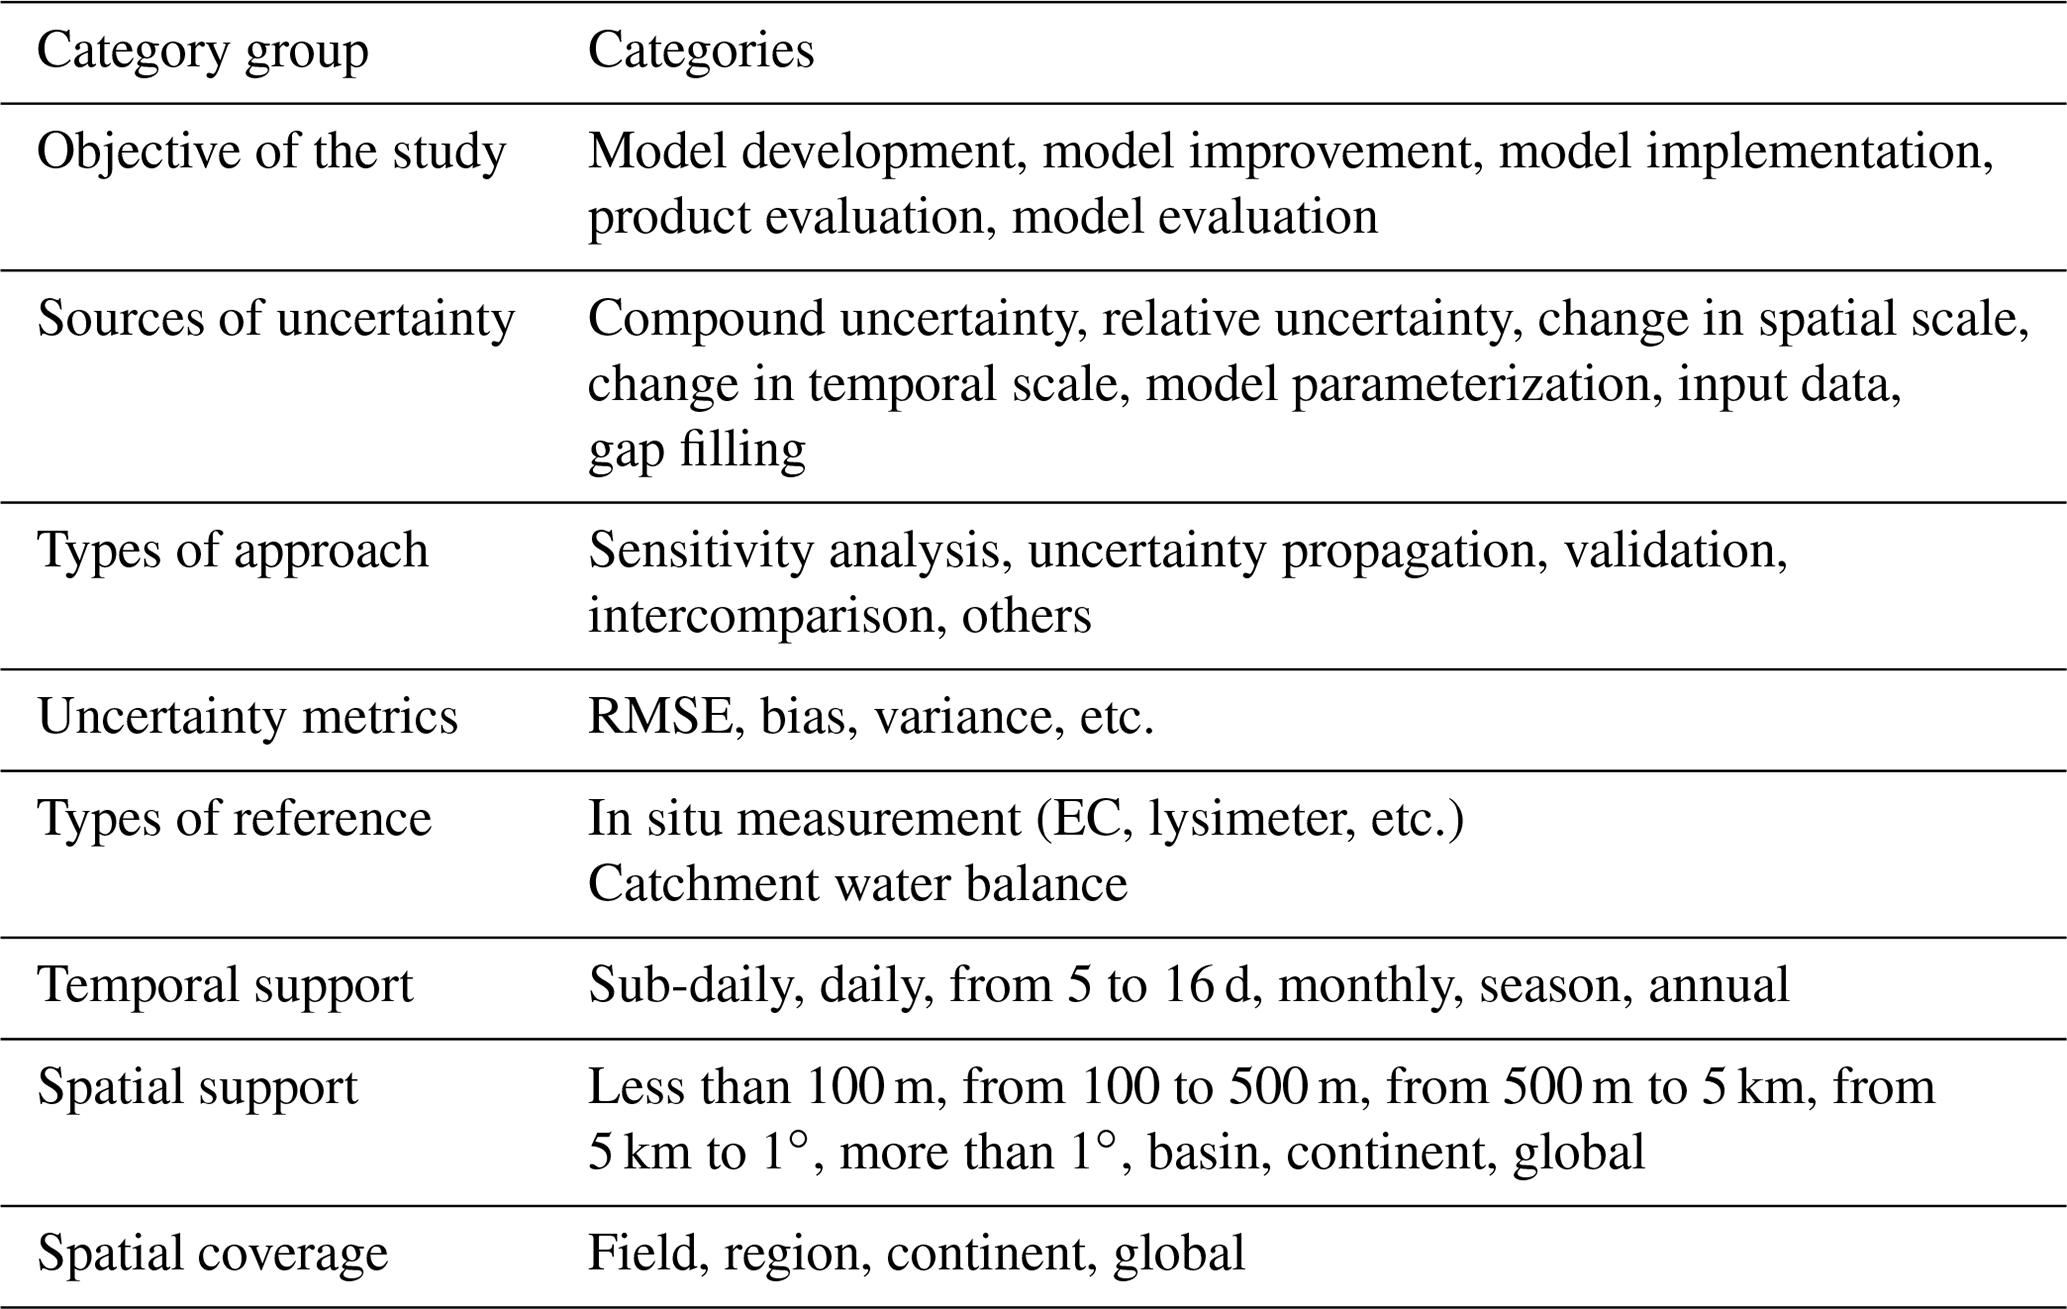
Each included article was classified into categories based on methods, objectives of the study, and results (Table 2). The total number and percentage of research papers per category were then synthesized from the literature database, and the patterns and trends in assessing the uncertainty of RS-ET were discerned. In addition, the most common method for uncertainty assessment was identified, and articles that used this method were included in a meta-analysis to derive the typical range of uncertainty in RS-ET estimates.
Table 2Categories and subcategories used to organize the included papers.
The selected articles assess uncertainty in RS-ET using mainly eight approaches: (1) validation, (2) intercomparison, (3) sensitivity analysis, (4) evaluation of input data, (5) uncertainty propagation, (6) three-cornered hat and triple collocation (TCH and TC), (7) physical consistency, and (8) ensemble of estimates. Figure 5 shows the upset plot (Lex et al., 2014) of all reviewed articles categorized by the approach of uncertainty assessment and the intersections of more than one approach. The majority of articles (532 out of 601) used a validation approach. There are a few other approaches that were less frequently used, often in combination with validation, as shown by the number of intersections with “validation” (Fig. 5).
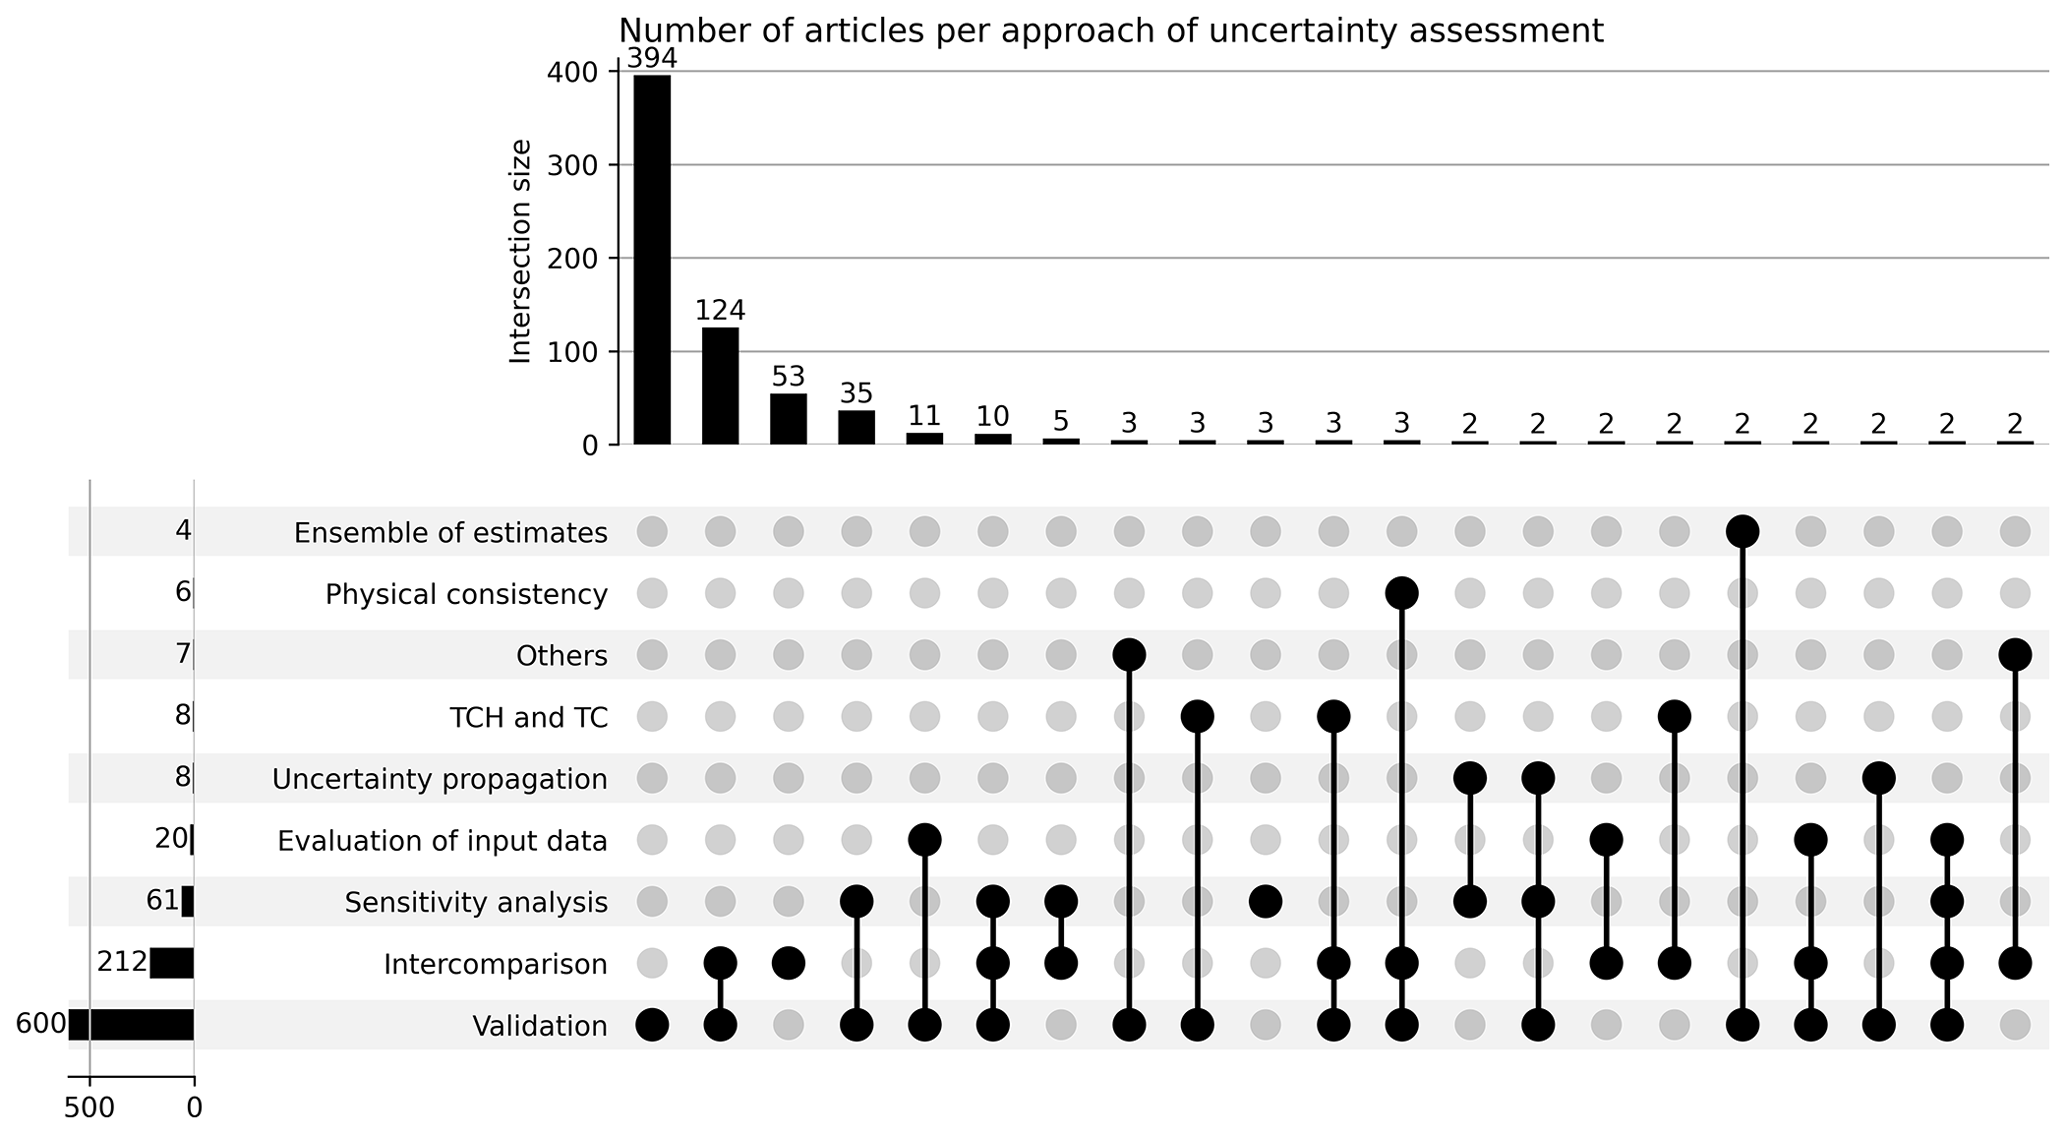
Figure 5Uncertainty assessment approaches used in the reviewed articles (N=676). The horizontal bar chart displays the number of articles using specific approaches (categories), while the vertical bar chart represents article counts within the intersections of multiple categories. Each vertical bar corresponds to an intersection in the column beneath it. Black circles denote the categories in the respective rows present in the intersection, while gray circles signify categories absent from the intersection. Intersections with less than two articles were excluded from the graph for improved presentation. TCH and TC stand for three-cornered hat and triple collocation. “Others” refers to approaches that are used only once, which are recorded in the Data availability section.
Except for the validation and intercomparison approach, other approaches showed no increasing or a decreasing proportion in selected literature from 2011 to 2021 (Fig. 6). Approaches other than validation and intercomparison have only been used by a small group of researchers and have not been applied widely or increasingly. The following sub-sections will discuss the application of the most common uncertainty assessment approaches.
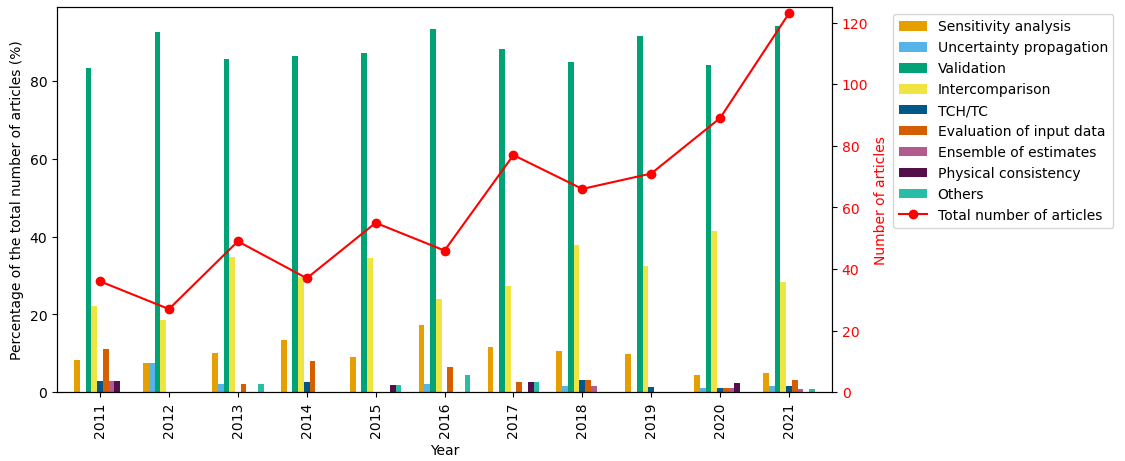
Figure 6The proportion of reviewed articles per year for each approach to assessing RS-ET uncertainties.
4.1 Validation
In validation, RS-ET model results are compared to a reference method that is considered by the researcher to be the best or most valid measure. The choice of the reference method introduces subjectivity into the model evaluation (Melsen et al., 2019). In the case of RS-ET, three types of reference are typically used: (1) in situ measurements (N=572), (2) catchment water balance (N=83), and (3) output from models run with ground-based input data (N=9). Almost all articles that used the validation approach considered an in situ measurement as their reference (Fig. 7), while other types of reference data were much less considered.
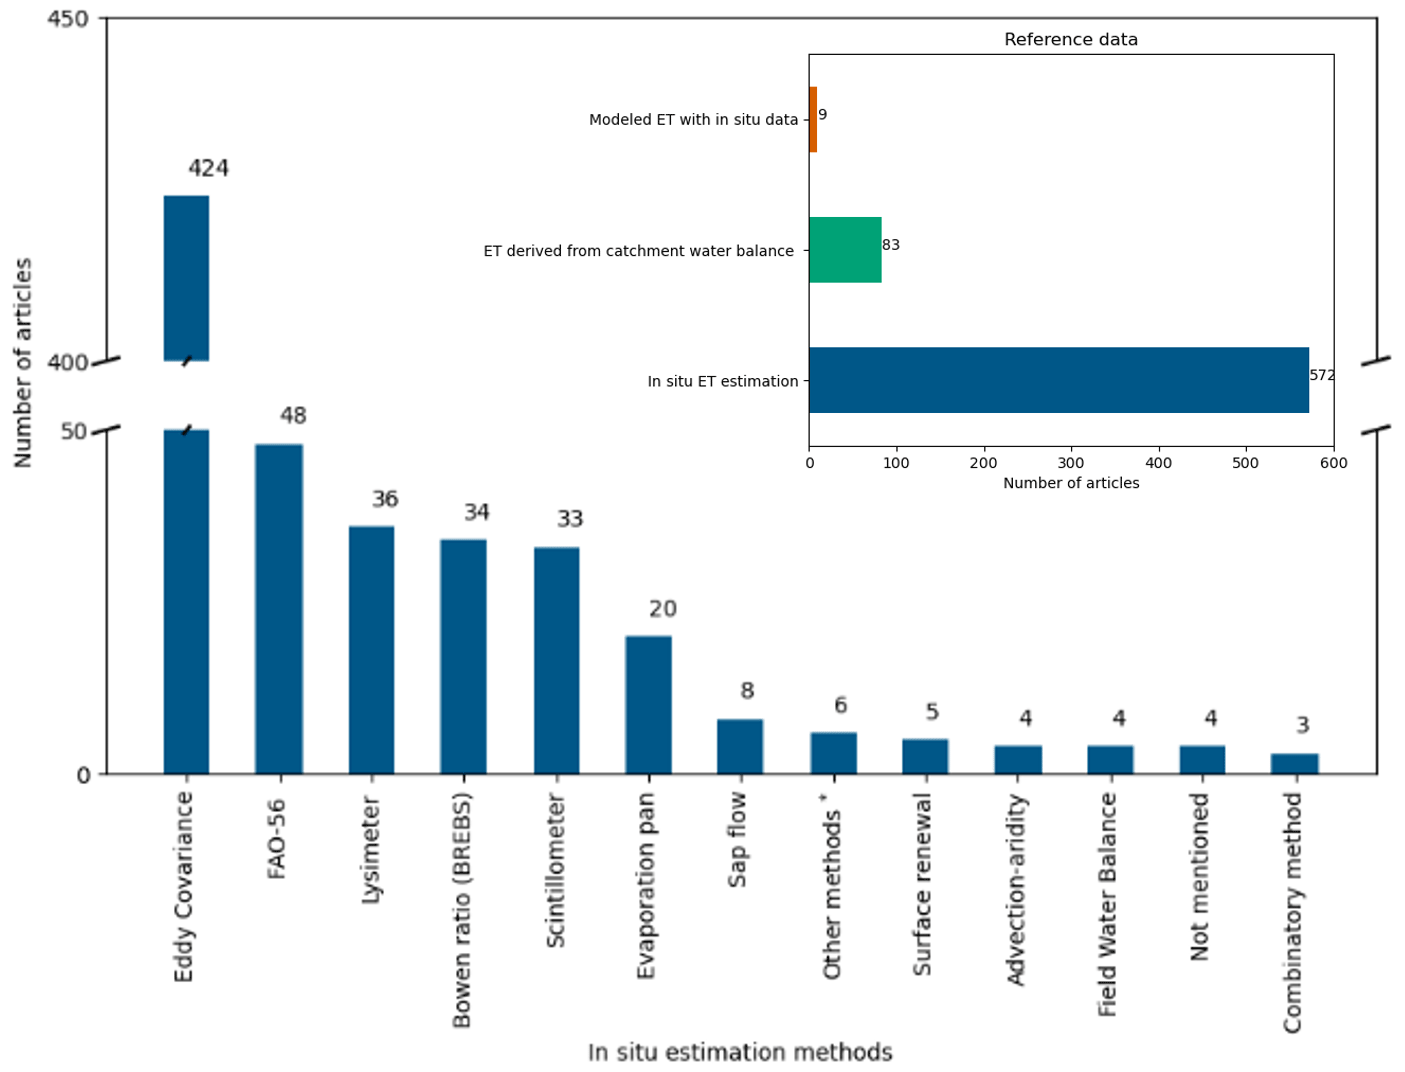
Figure 7Different reference data and in situ methods used for RS-ET validation in reviewed articles (N=600). * Other methods for in situ ET estimation include the volumetric soil water content difference (N=1), canopy temperature and meteorology monitoring systems (N=1), portable chambers (N=1), atmometer (N=1), open-top chambers (N=1), and crop coefficient methods using reference ET equations other than FAO-56 (N=1).
4.1.1 Using in situ measurements as the validation reference
Several in situ methods have been developed to estimate ET on the ground, including eddy covariance (EC), lysimeters, the Bowen ratio energy balance system (BREBS), etc. (Table S3). These measurements are often considered to be the observation or reference to validate RS-ET. Among these, EC is the predominant method for validation and was considered in 424 out of 600 articles (Fig. 7). Four factors explain the popularity of the EC method: (1) its relatively large network of stations, (2) long-term temporal coverage of flux towers, (3) open-access nature of data (e.g., FLUXNET, EuroFlux, AmeriFlux, and OzFlux), and (4) direct measurement of water vapor concentration and vertical wind speed of the air parcels to calculate latent heat flux.
Using in situ methods for validation faces three main challenges: (1) the cost to set up and maintain measuring stations, (2) the mismatch between the source area of measurements and the spatial resolution of an RS-based estimate, and (3) errors in measurements and assumptions. For example, the cost of a complete EC system is about 10 times the cost of a weather station with basic meteorological instruments. Although the EC method can be used to monitor other fluxes (e.g., carbon dioxide and nitrogen oxide), the high cost of the EC system still limits the number of sampling points and regions (Oliphant, 2012; FLUXNET, 2017). The low sampling density can be compensated for with low-cost systems (Markwitz and Siebicke, 2019) but at the expense of lower accuracy. In order to obtain validation data at a global scale, EC networks need to be expanded in many regions (e.g., Africa, southern Asia, the Middle East, and South America).
Spatial support of in situ measurements often does not overlap with the pixel footprint of the RS images (i.e., the area the pixel value represents). The spatial support of in situ measurements varies among methods, from 1 m2 (micro-lysimetry) to a few square kilometers depending on the wind speed and wind direction (eddy covariance and scintillometry). Certain methods for measuring components of ET have more limited spatial support (e.g., sap flow measurement for transpiration). For homogeneous pixels (with the same geophysical and ecological characteristics), in situ measurements can be representative of an entire pixel. However, when the pixel covers a large area, RS-ET validation frequently involves heterogeneous pixels. Therefore, multiple sites and upscaling methods are required to best aggregate site-specific to pixel-scale information (e.g., Liu et al., 2016; Li et al., 2018).
Every in situ measurement technique is subject to uncertainty and error. Even the most widely used technique, the EC flux tower, has limitations in terms of measurements (10 %–20 % error) and spatial support (Glenn et al., 2011; Wang et al., 2015). All methods have common sources of error and uncertainty, such as sensor response (detection limit), calibration error (sensor drift over time), noise (spurious random spikes in the signal from the sensor), and poor installation and maintenance (Allen et al., 2011a). Additionally, each method has specific sources of error and uncertainty due to its theoretical assumptions. For example, the EC method requires fully developed turbulent fluxes to ensure that the net vertical transfer of water vapor is caused by eddies, and the area must be horizontal and uniform. Moreover, the lack of energy balance closure in EC measurements needs particular attention since the gap can be up to 30 % of available energy (Wilson et al., 2002; Vendrame et al., 2020; Bambach et al., 2022; Allen et al., 2011b). The problem is due to the scale mismatch of energy balance components and unaccounted exchange fluxes on heterogenous landscapes (Foken, 2008).
Dealing with scale mismatch and uncertainty of reference in situ measurements is challenging, and there is no consistent method in the reviewed literature. Some studies only mentioned these issues when discussing the validation result. The information about the spatial support and uncertainty of in situ measurements is not always available to researchers if they acquire reference data from other sources. However, without reporting the spatial support and uncertainty of measurements, we might easily draw biased conclusions: when the validation results are good, we conclude that the model is good without questioning the quality of our reference, but when the results are not so good, we conclude that it is because of the imperfect reference measurements and that the model still is good. Hence, it is important to accompany validation results with the best knowledge about the uncertainty and scale mismatch of reference datasets.
4.1.2 Using the residual of the water balance as the validation reference
ET of an area can be estimated as the residual of the water balance (WB) when the inflow (e.g., precipitation, irrigation supply), change in storage, and outflows of water (e.g., runoff, water conveyance) of that area are known. This approach is mainly used for assessment at a river basin scale. It assumes that the residual from the basin WB should be the total ET of the basin: , where P is precipitation, Q is river discharge, and is the total change in basin water storage over the time period. This water balance approach assumes that there are no other water inflows or outflows across the catchment boundary. In some studies, is assumed to be negligible over a long period of time (a year or longer), which results in a more simplified water balance .
For long-term periods (e.g., years, decades), total water storage change (TWSC) over time () is assumed to be zero, such that ET estimates are then validated with only P−Q (e.g., Vinukollu et al., 2011a). However, this assumption does not hold true in many regions of the world where groundwater is being overexploited at an accelerated rate. For short-term periods (i.e., months), TWSC is often estimated from GRACE RS-based total water storage anomaly (TWSA) products. However, the TWSA products only cover the period from 2002, with a gap of 11 months from 2017 to 2018 between the GRACE and GRACE-FO missions. Some techniques have been developed to reconstruct this gap in the GRACE time series (e.g., Yang et al., 2021). However, the uncertainties in gap-filled estimates are still less known than uncertainties in the initial estimates from GRACE and GRACE-FO (Boergens et al., 2022).
The uncertainty in ET estimated by this approach depends on the choice and data quality of other variables (e.g., precipitation and river discharge) in the WB (Senay et al., 2011). Lehmann et al. (2022) have compared the residual calculated from 1694 combinations of P, Q, and ET datasets with derived from GRACE and found that none of these combinations can close the WB in all tested basins. They also suggested that using some combinations of P, Q, and ET datasets cancels out their errors in the GRACE-based WB. Because of the errors in the P, Q, and components, studies that use WB-derived ET as a reference to validate ET without accounting for uncertainties in the P, Q, and components risk biased conclusions.
In order to account for errors in P, Q, and , some researchers have tried to use multiple datasets (e.g., Weerasinghe et al., 2020). Recently, Schoups and Nasseri (2021) proposed treating uncertainties in datasets as unknown random variables. Instead of using the WB to determine these uncertainties, they estimated ET (and other water fluxes) by combining WB constraints and uncertainty estimation into a comprehensive probabilistic model. Although only applicable for river basins where the GRACE resolution is suitable, this could be a good direction for future research on these water fluxes.
4.2 Intercomparison
Intercomparison is the second most widely used method (212 out of 676 studies). In intercomparison, the RS-ET estimates from multiple models are compared without assuming a superior one. This approach is mainly used to evaluate the relative uncertainty of a model compared to others (170 out of 212 studies). Intercomparison has also been used to evaluate other sources of uncertainty. For example, uncertainty from a change in spatial support can be evaluated by comparing model outputs using different input-upscaling methods (e.g., Ershadi et al., 2013; Sharma et al., 2016). Intercomparison has also been used to evaluate uncertainty due to the choice of input datasets (e.g., Long et al., 2011; Wang et al., 2016; Badgley et al., 2015).
Since the RS-ET datasets have both temporal and spatial dimensions, comparing RS-ET models or products is usually done by aggregating over one or two dimensions (i.e., resampling to a lower resolution). The simplest method of intercomparison involves aggregating ET estimates both temporally and spatially into one value (e.g., global annually averaged ET) and then comparing this value from different models or products (e.g., Mueller et al., 2013; Pan et al., 2020). Other methods of intercomparison involve comparing time series of spatially aggregated ET (e.g., monthly basin-scale ET). Aggregating over one of the two spatial dimensions is sometimes applied (e.g., Pan et al., 2020; Chen et al., 2019). The time series can also be aggregated by land cover classes (e.g., Weerasinghe et al., 2020) or climate zones (e.g., Trambauer et al., 2014), describing how RS-ET uncertainty varies under different conditions. For spatial intercomparison, temporally aggregated RS-ET maps can be compared visually (e.g., Weerasinghe et al., 2020) or by using simple map algebra (e.g., M. Jung et al., 2019). Only a few studies have applied metrics to evaluate the spatial similarity between two datasets, such as the spatial efficiency metric (SPAEF) (Stisen et al., 2021; H. C. Jung et al., 2019) and the degree correlation measure of spherical harmonic coefficients (López et al., 2017). None of these methods can characterize uncertainty in RS-ET fully; thus, combining them would provide a more comprehensive intercomparison.
4.3 Sensitivity analysis
Sensitivity analysis is the third most used approach in the reviewed literature but is only applied a in a small proportion of the reviewed studies (61 out of 676 articles). Out of these, only seven studies applied global sensitivity analysis (GSA). Sobol's (2001) method was applied to the parameters of the MODIS16 algorithm (Zhang et al., 2019), the TSEB model (Burchard-Levine et al., 2020), and three RS-ET models (PT-DTsR, MODIS16 algorithm, and PML) (Cao et al., 2021). This method was also applied to input variables of RS-ET models alone (e.g., Gomis-Cebolla et al., 2019). Elhag (2016) applied a similar variance-based sensitivity measure for the SEBS model but did not refer to Sobol's method. The extended Fourier amplitude sensitivity test has also been applied for GSA (García et al., 2013). This limited number of studies shows that the application of GSA to RS-ET models has been under-researched during the last decade despite the importance of GSA in environmental modeling (Saltelli et al., 2021).
The majority of articles that applied sensitivity analysis (54 out of 61) did not mention or apply a GSA method and thus were considered to be local sensitivity analyses (LSA). In most of these studies, LSA was done by changing one parameter at a time (one-at-a-time method) and calculating the ratio of the change in ET over the change in parameter (e.g., Long et al., 2011). In the reviewed articles, the one-at-a-time method has been implemented differently in terms of three factors: (1) the selection of parameters for LSA according to their importance, as judged by the researchers; (2) the range of values over which parameters are allowed to vary; and (3) the calculation of sensitivity for specific land covers. This suggests that LSA is influenced by the subjectivity of the researchers.
4.4 Evaluation of input data
The uncertainties of key input datasets are sometimes evaluated by researchers in studies that assess uncertainty in RS-ET without explicitly being propagated to model outputs. This approach ranked fourth in the number of articles, with 20 out of 676. The key input datasets considered by researchers include air temperature, incoming shortwave radiation, incoming longwave radiation, wind speed, and land surface temperature (e.g., Vinukollu et al., 2011b; Pardo et al., 2014; Peng et al., 2016; Li et al., 2017). Input datasets were evaluated through validation with their in situ counterpart. Although other input datasets like vegetation indices are also important in RS-ET models, the in situ measurements of these are often not available for evaluation (Vinukollu et al., 2011b). Some of the forcing datasets of RS-ET models are not remotely sensed data but are products from atmospheric data assimilation systems (e.g., Global Land Data Assimilation System (GLDAS) and ECMWF atmospheric reanalysis (ERA)), which are sometimes provided with uncertainty estimates from data providers. Evaluating the input data provides crucial a priori information for propagating uncertainty to ET estimates. Furthermore, even if uncertainty propagation is not conducted, these assessments can help to identify sources of uncertainty in RS-ET; as the saying goes, “garbage in, garbage out”.
4.5 Uncertainty propagation
Only 8 out of 676 articles applied the uncertainty propagation approach, mainly the Monte Carlo methods (MCMs), to evaluate uncertainty in RS-ET. In MCMs, the model inputs are randomly sampled from their distributions and fed into the model to generate outputs repeatedly. The variance of the output distribution will then be considered to be the uncertainty in the model output (i.e., ET estimate) associated with the input variables. The limited application of uncertainty propagation can be attributed to its complexity and computational demand. Sensitivity analysis and uncertainty propagation are ideally carried out in tandem (Crosetto et al., 2001; Saltelli et al., 2019), but only five out of eight articles combined these approaches. The uncertainty propagation approach was also used for investigations beyond uncertainty quantification. For example, Talsma et al. (2018) used MCM to determine the uncertainties in ET partitioning (i.e., soil evaporation, interception, and transpiration) in three RS-ET models (MOD16, PT-JPL, and GLEAM) due to the relative uncertainty in the key variables.
In the reviewed studies, uncertainty propagation was done only at one or a few fixed locations by assuming the probability distribution of the input variables then simulating a range of ET values at these locations. This approach is computationally inexpensive but does not fully characterize uncertainties in a spatial field of ET. To fully quantify uncertainty in a scene, Cawse-Nicholson et al. (2020) introduced a method based on MCM and spatial–statistical models (Cressie, 1993). With this method, the probability distribution of ET per pixel in a satellite scene can be quantified and presented as percentile maps. This distribution was almost always non-Gaussian for all pixels in ET scenes, which means simple linear error propagation is not possible (Cawse-Nicholson et al., 2020). Future studies of RS-ET would benefit from the development of new methods to quantify uncertainty spatially.
4.6 Triple collocation and three-cornered hat method
The three-cornered hat method (TCH) (Premoli and Tavella, 1993) and triple collocation (TC) (Stoffelen, 1998; McColl et al., 2014) are related to the intercomparison approach in the sense that these techniques assess the relative uncertainty of three datasets without assuming one is the best. Therefore, these techniques are useful when there is a lack of a high-quality reference dataset. Both TC and TCH methods require a set of three datasets with the assumption that their errors are independent (Sjoberg et al., 2021). The difference between TCH and TC is that TC can only be used to assess uncertainties of uncorrelated datasets, while TCH can be used when there are correlations with proper constraints (Xu et al., 2019; Sjoberg et al., 2021). However, to date, few studies have evaluated uncertainties in RS-ET using TC (Miralles et al., 2011b; Barraza Bernadas et al., 2018; Khan et al., 2018; and Kibria et al., 2021) and TCH (Long et al., 2014; Xu et al., 2019; and He et al., 2020). The proportion of studies that used these methods is less than 2 % of the total reviewed articles and is not increasing (Fig. 6). This low adoption might be attributed to the limitations of these methods: (1) the lack of information about biases and the estimation of only random errors (e.g., RMSE, standard deviation, or variances), (2) the required conditions to achieve reliable error estimates (large samples, similar scales and magnitudes of errors between datasets) (Sjoberg et al., 2021), and (3) the reliability of TCH as an alternative to direct validation (Wu et al., 2019b).
4.7 Physical consistency
Physical consistency can be understood as the plausibility that an ET estimate is consistent with the physical conditions or characteristics of the area it represents. A consistency check or physical validation was proposed by Zeng et al. (2015) as the final step in a general validation process for big remote sensing datasets. When there are limited reference data and ground-based measurements, physical validation is critical to assess the quality of data products (Blatchford et al., 2020). Although physical validation does not quantify uncertainty using metrics, it provides an evaluation of the data quality. This is useful for identifying the regions and conditions in which RS estimates are more uncertain and where more effort in direct validation approaches is required.
Only six studies in the selected literature have attempted to quantify this plausibility (Fig. 6), but they defined physical consistency differently. For example, Rwasoka et al. (2011) used FAO Penman–Monteith potential ET estimates as a threshold to decide whether ET estimates from the SEBS model were physically inconsistent. Blatchford et al. (2020) used the ratio and water availability (P−Q) to evaluate the physical consistency of the WaPOR ET product. López et al. (2017) developed a technique to assess the hydrological consistency of ET by transforming both ET and P data into spherical harmonics and then using spherical harmonic coefficients to calculate the degree correlation. These studies are not the same as validating RS-ET with P−Q or as discussed previously since these residuals were not considered to be the best reference of ET.
Another method to assess physical plausibility without an explicit water balance is through the Budyko curve. The Budyko curve describes the semi-empirical relationship between long-term ET and its limiting factors, i.e., precipitation and potential ET (PET), for river basins (Budyko, 1974). Koppa and Gebremichael (2017) validated the physical consistency of ET by calculating the RMSE of the Euclidean distance between the data points and the Budyko curve in and space. Weerasinghe et al. (2020) simply calculated the mean difference (bias) between RS-ET and Budyko-derived ET to evaluate which RS-ET product exceeds the energy and water limit defined by the Budyko curve. They also noticed that, if a data point does not align with the Budyko curve, it might also mean that the ET of the basin exceeds the water or energy limit, for example, due to human activities. Therefore, the interpretation of physical plausibility needs to consider the actual knowledge about water resources in the basin instead of focusing only on model-generated numbers.
4.8 Using ensemble of RS-ET estimates
Intercomparison studies sometimes lead to ensemble-mean products of all available products on the basis of the assumption that no model performs best so an ensemble of them would be preferable (Bhattarai et al., 2019; Elnashar et al., 2021). This approach has been used the least in the reviewed articles (Fig. 6). Some researchers have evaluated the uncertainty in an ensemble (a set) of RS-ET estimates from different models by calculating the average and range of all members in the ensemble (Vinukollu et al., 2011b; Elnashar et al., 2021; Guo et al., 2020). This approach is the same as the multi-model ensembles in climate modeling. The model structural uncertainty can only be quantified if independent models are sampled from the entire possible model space and avoid the over-representation of one model structure (Abramowitz and Gupta, 2008). For example, Vinukollu et al. (2011b) selected three RS-ET models, namely SEBS (Su, 2002), PM-Mu or MODIS16 (Mu et al., 2007), and PT-Fi or PT-JPL (Fisher et al., 2008), which are based on distinct equations used to estimate ET.
Using an ensemble of RS-ET estimates provides uncertainties of the ensemble but not of each individual member of the ensemble. Thus, some studies went further by merging the datasets of the ensemble and calculating the difference between this merged dataset with each ensemble member (Baik et al., 2018; Elnashar et al., 2021). If simply averaging all the ET products, the bias of different models can be canceled in regions where they perform differently but accumulated in regions where they perform in the same manner. Hence, the ensemble products may arguably produce better estimation in some areas (Yao et al., 2017) but not a better understanding of the physical processes and drivers needed to improve RS-ET (Yao et al., 2014; Zhang et al., 2016). Therefore, it is considered to be more useful to use the range of the ensemble to identify the outlier data products or the uncertainty of all data products.
The context in which the uncertainty of RS-ET is assessed determines which method is selected and how it is applied. This context includes the objective of the RS-ET estimates, the spatial and temporal support at which ET is assessed, the geographic location, and the availability of reference datasets. This section describes the context in which 676 reviewed articles assessed uncertainties in RS-ET.
5.1 Objectives of the reviewed articles
The review shows that uncertainties in RS-ET estimates were assessed at all stages, from developing a new model to evaluating its data product. Uncertainty in RS-ET was assessed in the context of model implementation (34 % of reviewed articles), model development (13 % of all reviewed articles), model improvement (17 %), model evaluation (19 %), and product evaluation (16 %) (Fig. 8). Here, model implementation means that a pre-existing model was applied to new case studies or to achieve some specific research objective without considerable modification or further development of the model. The prominence of model implementation as the main objective in the reviewed articles could be due to a perceived need to assess the uncertainty of RS-ET estimates for each application despite previous validation. This is an important attitude in the research community since it helps to provide feedback on appropriate application and improvement of RS-ET models. Therefore, studies in the context of model implementation should not be overlooked.
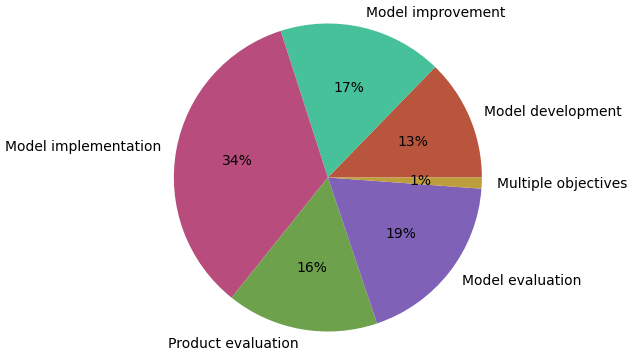
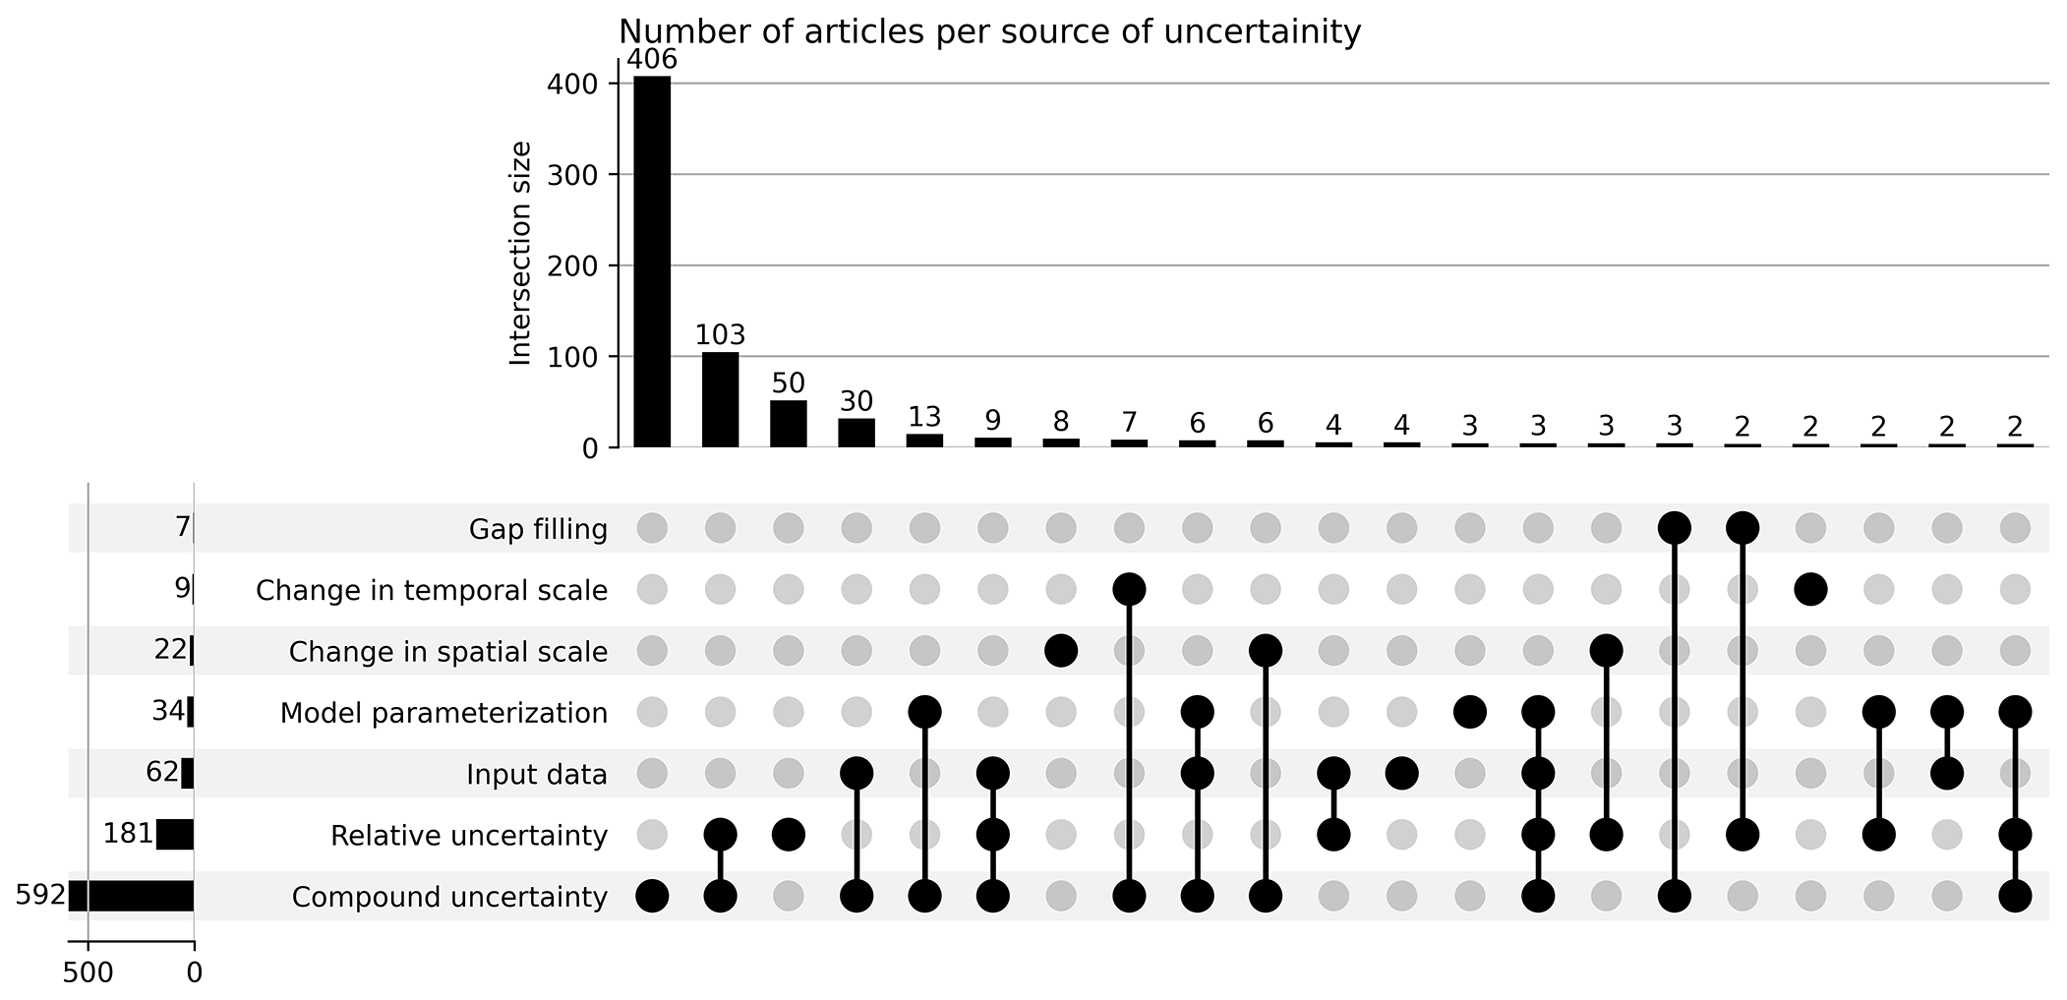
Figure 9The source of uncertainty assessed in reviewed articles (N=676). The horizontal bar chart displays the number of articles assessing specific sources of uncertainty (categories), while the vertical bar chart represents article counts within the intersections of multiple categories. Each vertical bar corresponds to an intersection in the column beneath it. Black circles denote the categories in the respective rows present in the intersection, while gray circles signify categories absent from the intersection. Intersection with less than two articles were excluded from the graph for improved presentation.
5.2 Sources of uncertainty evaluated
The reviewed articles evaluated all sources of uncertainty as categorized in the theoretical framework (Fig. 3), with a strong focus on compound uncertainty. Figure 9 shows that the majority (406 out of 676) of reviewed articles assessed only compound uncertainty without disaggregating into other sources. The second largest set of articles assessed both compound uncertainty and the relative uncertainty of RS-ET estimates. Other sources of uncertainty are remarkably less evaluated in the selected literature. According to the number of articles in each set (Fig. 9), the level of interest in different sources of uncertainty can be ranked as follows: compound, relative, input data, model parameterization, change of spatial support, change of temporal support, and finally gap filling. This does not necessarily show the ranking of importance of the uncertainty sources but rather the availability of methods and the data needed to assess them.
The uncertainties due to temporal upscaling are affected by several factors related to location (Jiang et al., 2021). These factors includes vegetation cover, soil moisture (Gentine et al., 2007; Hoedjes et al., 2008), cloud coverage (as discussed in research by Van Niel et al., 2012), cloud frequency (as explored in studies by Xu et al., 2015), air pollution effects (as indicated in research by Zhang et al., 2013), the return interval of the satellite (Alfieri et al., 2017), the timing of the overpass (Jiang et al., 2021), and the number of instantaneous values used for upscaling (Liu, 2021). Consequently, applying a single temporal-upscaling method for the entire globe results in spatially varying uncertainties in RS-ET estimates.
5.3 Spatial and temporal support of uncertainty assessment
Uncertainties in RS-ET estimates are specific for different spatial and temporal supports. The reviewed studies evaluated RS-ET uncertainties at spatial supports ranging from less than 100 m up to global and temporal supports ranging from sub-daily to annual (Fig. 10). Most studies evaluated RS-ET uncertainties at spatial supports of 500 m to 5 km (268 out of 676) and less than 100 m (191 out of 676). This can be attributed to the availability of RS datasets that are widely used to estimate ET, such as MODIS (250 m to 1 km) and Landsat (30 to 100 m). In the case of validation, the spatial support of uncertainty assessment was determined by the spatial support of the ground truth reference. For temporal support, uncertainty was mostly evaluated by daily ET (365 out of 676), although RS datasets provide observations at the time of the satellite overpass with a temporal resolution of 5–16 d. This shows that the temporal support of uncertainty assessment is driven more by practical needs and less by the availability of datasets.
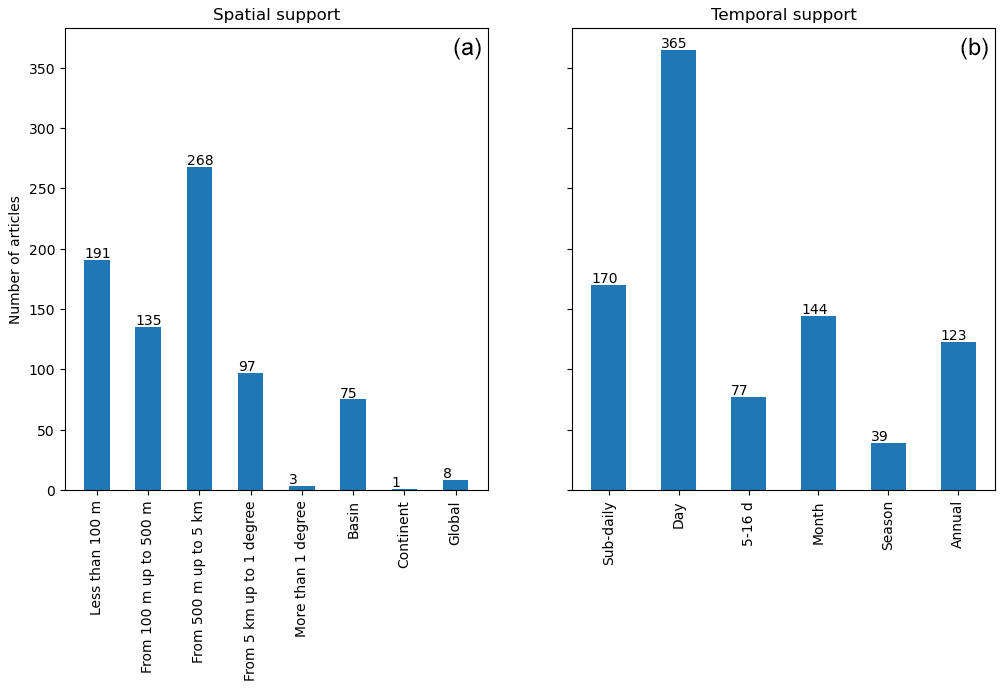
Figure 10Number of articles per range of spatial (a) and temporal (b) support at which uncertainty in RS-ET was assessed (total number of articles N=676).
5.4 Geographical distribution
Assessment of RS-ET uncertainties is not evenly distributed over the globe. The number of articles per country where uncertainties in RS-ET were assessed is shown in Fig. 11. Each article was tagged by the country where the sites of study are located. The highest number of articles assessed ET in China. Because the most common approach is validation and the most common reference used is EC measurements, ET was mainly assessed where there are EC stations (i.e., AmeriFlux, AsiaFlux, ChinaFlux, OzFlux, EuroFlux, FLUXNET). Even when the studies aimed to validate RS-ET globally, the estimated uncertainty is not universal since these networks do not cover many regions. These studies were also included in Fig. 11.
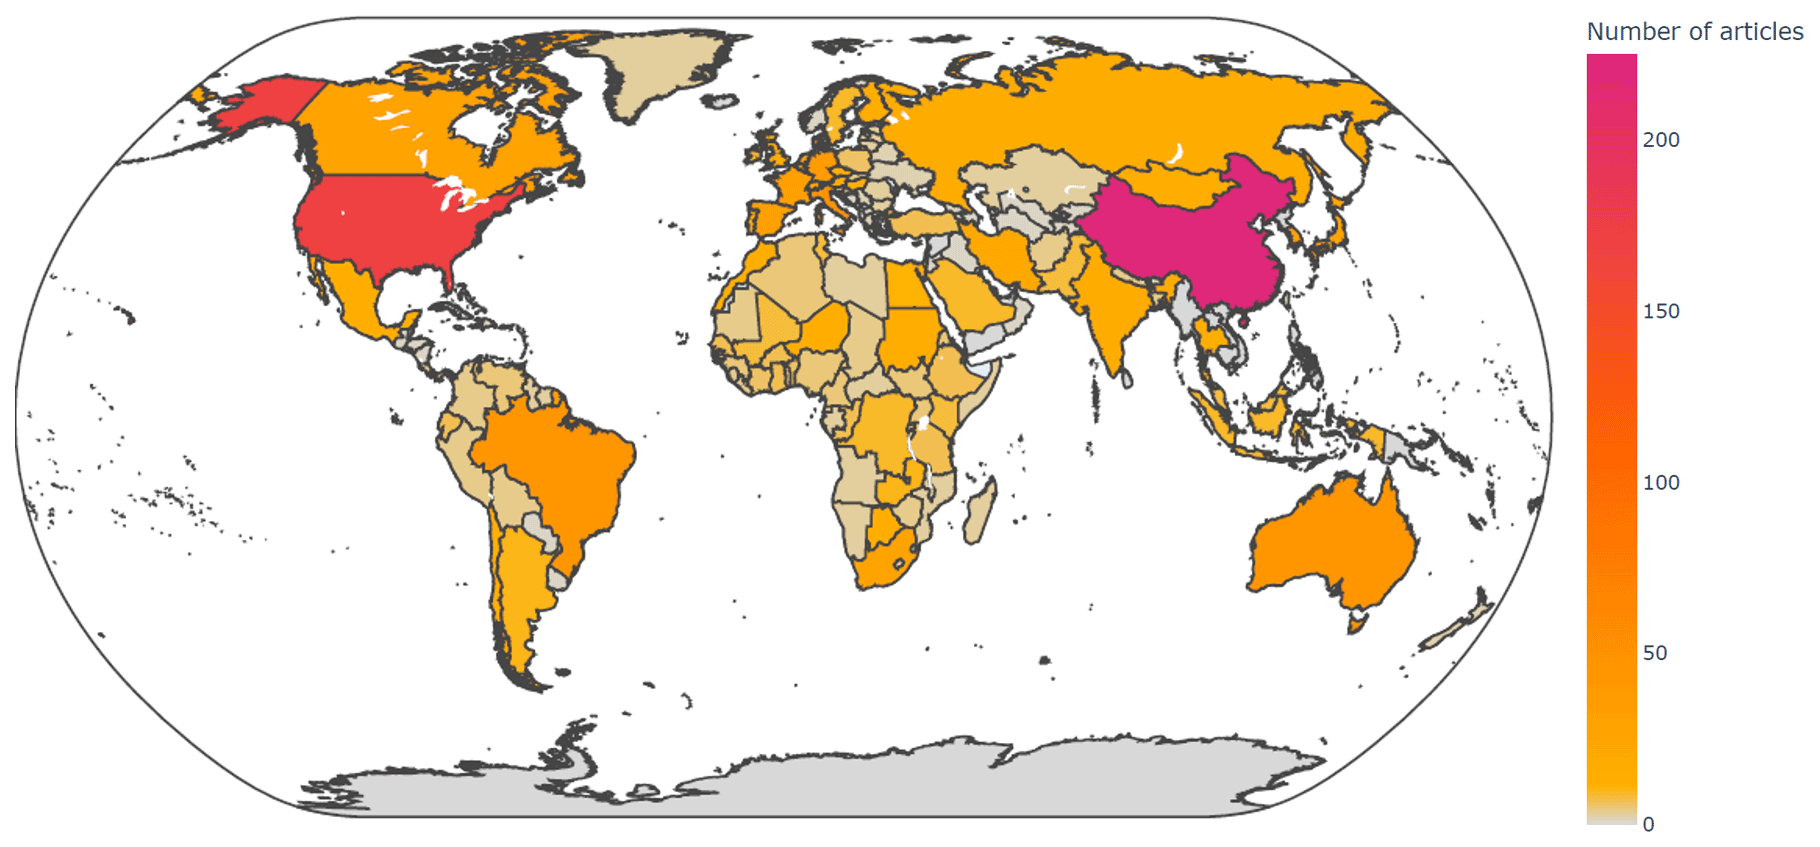
Figure 11Number of articles per country where uncertainties in RS-ET were assessed.
Based on its popularity, EC can be considered to be the de facto standard ET estimation approach for validation of RS-ET. However, this popularity is mainly driven by the number of publications in countries where EC towers are more densely distributed (e.g., China and the United States of America). In countries where there are very few or no EC towers available, the most common reference used for validation of RS-ET is the water balance method (Fig. 12). In a few countries in northern Africa and the Middle East, the most common method is to use the FAO-56 method (Allen et al., 1998) in combination with crop coefficients to estimate ground-based references for validation (e.g., Egypt and Iran).
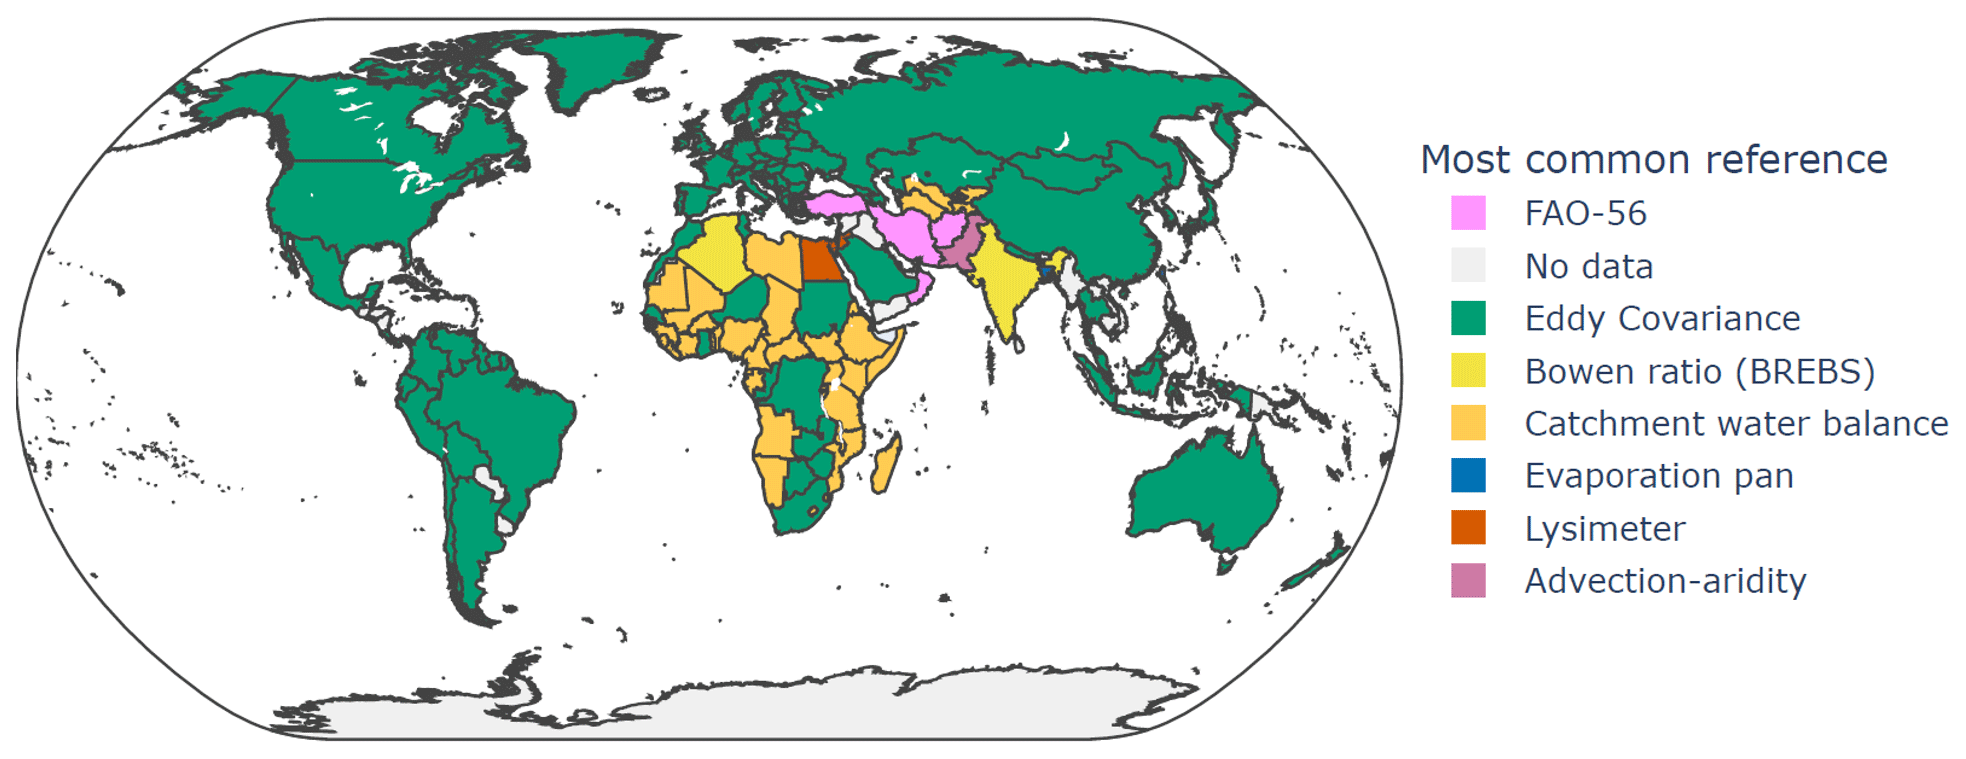
Figure 12The most common reference used for validation of RS-ET per country.
6.1 Uses of uncertainty metrics
The reviewed articles that assess uncertainty in RS-ET mainly report accuracy (RMSE), bias (mean error), and the goodness of fit with a reference dataset (R2) (Fig. 13). Although quantifiable uncertainty in measurement is theoretically represented as a probability distribution, this has rarely been done in the literature. The reviewed studies used a wide range of metrics to report their uncertainty assessment (33 metrics). Most studies used 3 metrics, while some used up to 12. Larger numbers of metrics provide more descriptions of uncertainty, but some metrics might be challenging to interpret.
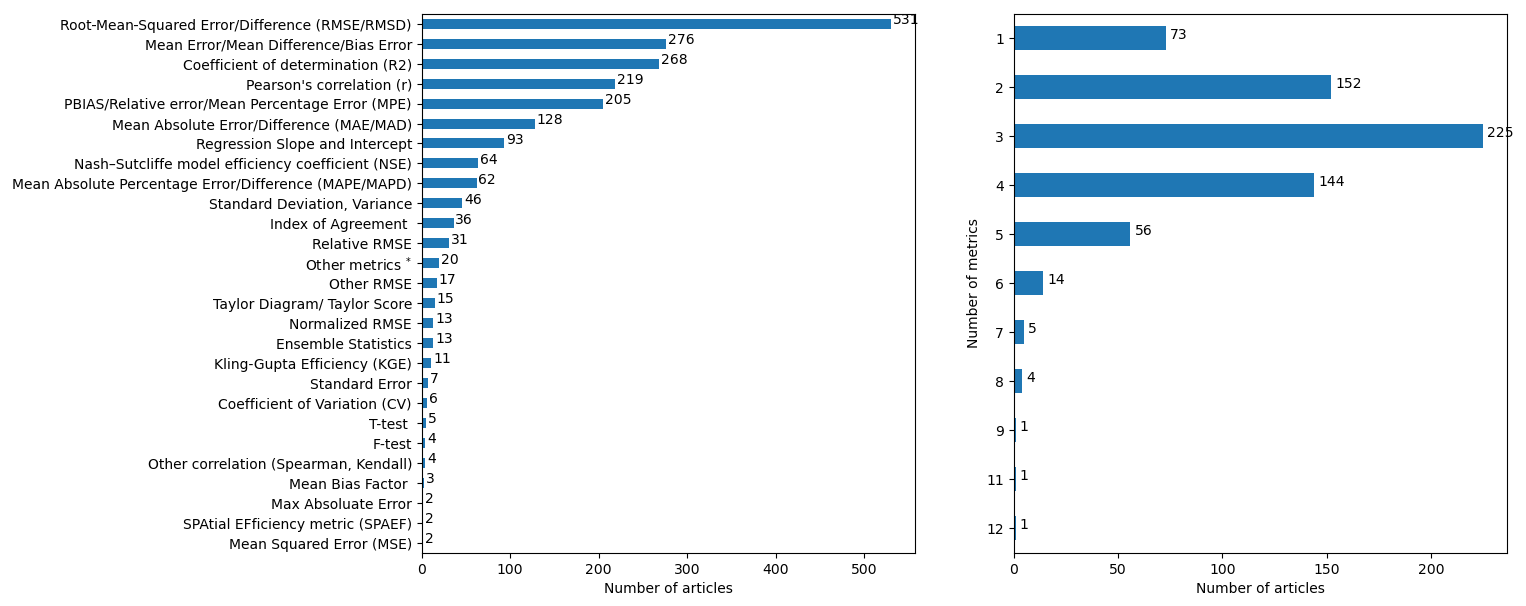
Figure 13Number of studies per choice of metric to report uncertainty and the number of metrics used.
Root-mean-square Error (RMSE) is the most widely used metric in the reviewed articles (531 out of 676 articles). Metrics related to RMSE include normalized RMSE (normalized by standard deviation) and relative RMSE (as a percentage of mean ET). Very few studies (17 articles) used modified RMSE to report more robust results, and few consider random errors and systematic errors, such as robust RMSE (Bisquert et al., 2016), systematic and unsystematic RMSE (Yebra et al., 2013), and biased and unbiased RMSE (Martens et al., 2017). RMSE has the unit of the estimates so it can be expressed in millimeters (mm) for ET or watts per square meter (W m−2) for latent heat flux. Therefore, to compare reported RMSEs between different studies, unit conversion is needed.
Inconsistent use of metrics such as R2 might cause misinterpretation of results, especially when comparing studies. For example, the second most used evaluation metric was referred to using many names including mean error, mean difference, bias error, or bias. Meanwhile, the coefficient of determination (R2) has the opposite issue in which the same term was used with different formulas. R2 is a measure of the goodness of fit for regression models. There are at least eight formulas for R2 in the literature (Kvålseth, 1985), but only one formula can be used for any type of model fitting (i.e., in Kvålseth, 1985). Since many studies did not report which formula they used, we did not distinguish between different R2 formulas in Fig. 13. Nevertheless, we observed that at least four different formulas of R2 were used in the reviewed articles, including the squared coefficient of correlation (Table S4).
No matter which metrics are used, the validation metrics that compare estimates with references only represent the actual error if the reference is the absolute truth. This is never the case because in situ measurements and upscaling methods are never perfect. Wu et al. (2019a) suggested that validation should be performed in conjunction with uncertainty associated with in situ measurements and the statistical significance of performance metrics.
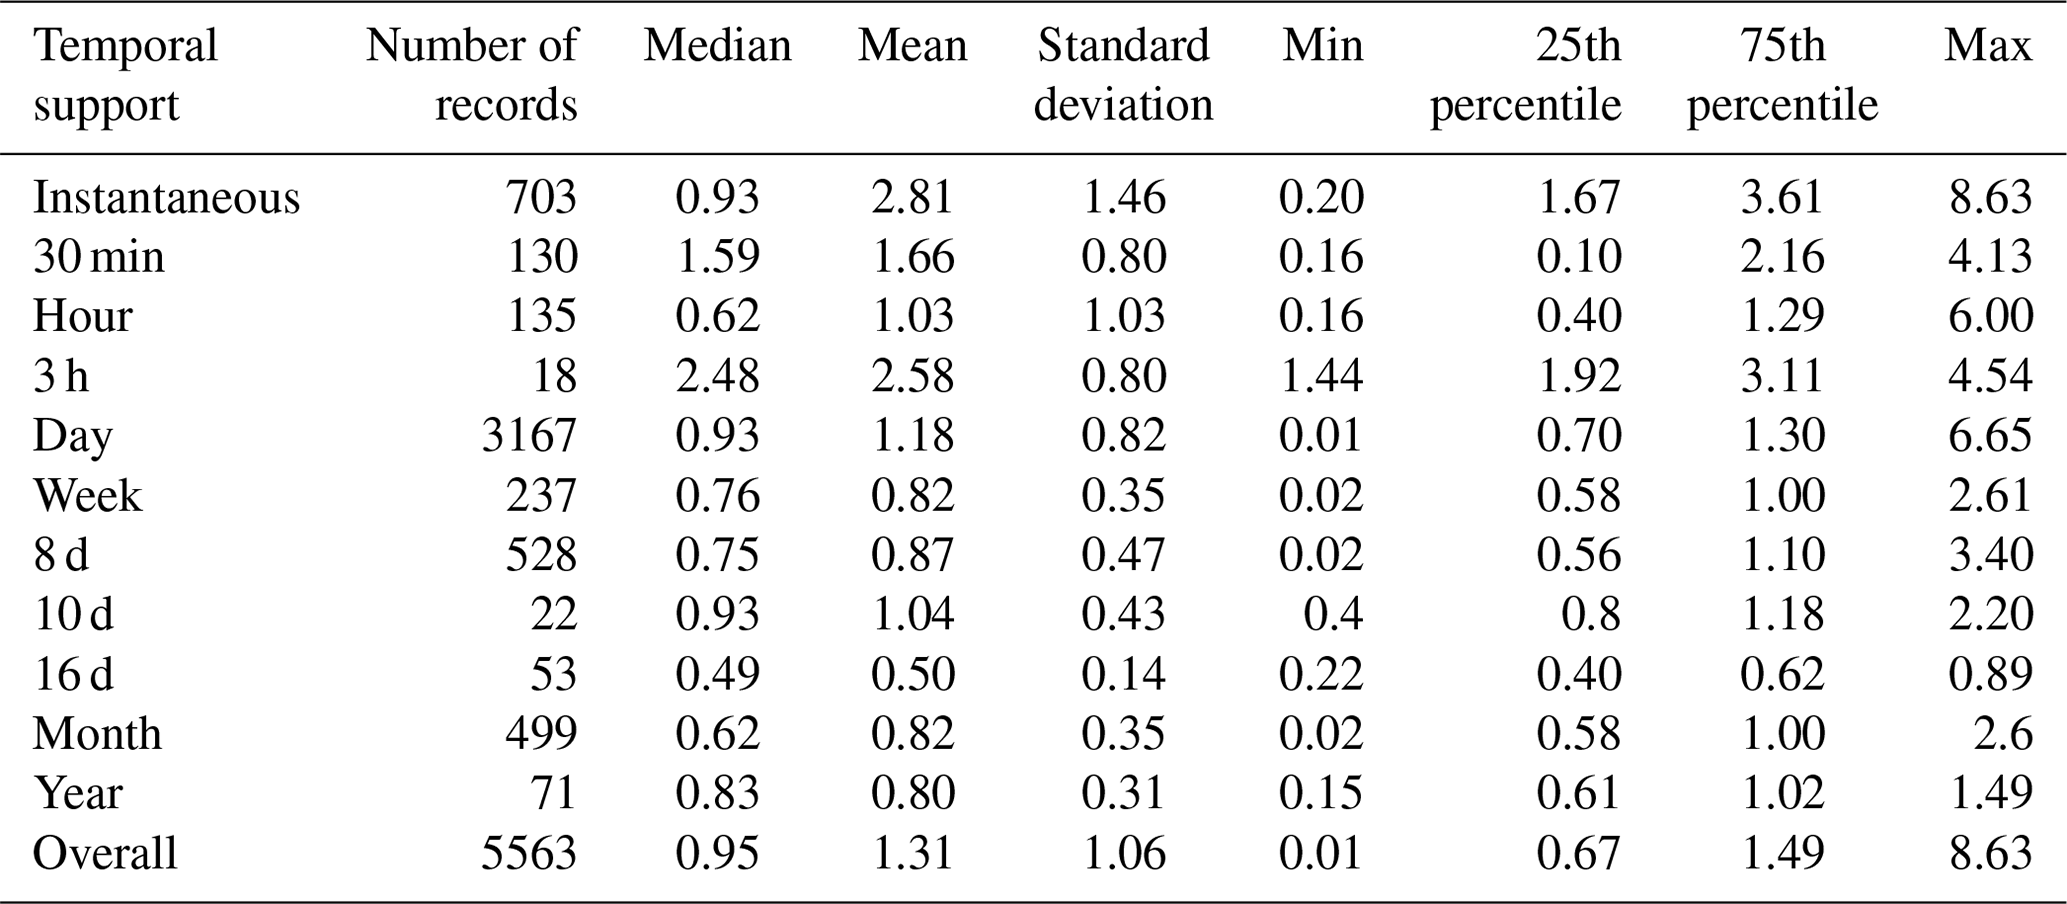
Table 3Descriptive statistics of reported RMSE values (in mm d−1) in reviewed articles (N=348) with validation of RS-ET with EC flux towers.
6.2 Synthesizing reported RS-ET uncertainty from reviewed studies
Although there are a large number of papers assessing the uncertainty of RS-ET data, only a few attempted to synthesize their results. For example, a review by Karimi and Bastiaanssen (2015) used meta-analysis (i.e., using statistical methods to synthesize the results of independent studies) to estimate the probability density function of mean absolute percentage error (MAPE) in 46 studies that validate RS-ET estimates in seasonal cycles. Kalma et al. (2008) summarized the relative error and RMSE of the RS-ET reported in 30 studies. These syntheses are limited in terms of the number of studies (<50) and the fact that the selection of studies was not systematic. Another limitation of synthesizing these results is that the selected studies used different validation data and field instruments, which do not have equivalent spatial support and accuracy.
Synthesizing results of the reviewed articles in this study will provide a useful reference for future studies to evaluate the results of RS-ET uncertainty assessment. For a meta-analysis, selected studies should use the same validation data and report the same metric; thus, we selected the most used validation data and metric. Since the majority of studies used EC flux towers and RMSE to report uncertainty (372 out of 676), we selected these studies for meta-analysis of reported RS-ET uncertainty. From 372 articles, 348 articles that reported the RMSE of RS-ET from validation with EC flux towers were included. The remainder were excluded because the RMSE was not reported in figures with extractable values (Fig. 4). RMSE values in units other than millimeters per day (mm d−1) were converted to millimeters per day (mm d−1) assuming a constant rate of ET over the temporal support. For example, 365 mm yr−1 was converted to 1 mm d−1, and 0.1 mm h−1 was converted to 2.4 mm d−1.
The reported RMSE values for daily ET (N=3167) range from 0.01 to 6.65 mm d−1, with a mean value of 1.18 mm d−1 (Table 3), which is comparable with RMSEs previously reported by Kalma et al. (2008). When converting RMSE values from the reported unit to a common unit of millimeters per day, the mean RMSE is the highest for the validation of instantaneous RS-ET (2.81 mm d−1) and the lowest for monthly (0.78 mm d−1). In general, studies with larger temporal support of validation have lower mean RMSEs in millimeters per day. For the validation at temporal supports of 3 h, 10 d, and weekly, less can be concluded due to the small number of studies and records. Overall, the decrease in RMSE with increasing temporal support is due to the averaging and corrective effect of temporal upscaling. Therefore, improving temporal-upscaling and gap-filling methods are crucial for reducing uncertainty in RS-ET estimates.
Figure 14 shows that very high RMSE values were mainly from validation approaches that used a single EC site. Validation using data from a greater number of EC sites tends to yield lower RMSE values. This might be attributed to the fact that, when papers only report average RMSE values across multiple EC sites, the average RMSE is lower than the highest individual RMSE. Moreover, the random errors at each site are likely to be uncorrelated or partially cancel each other out when averaging them, which further reduces the overall RMSE. As RMSE is inherently dependent on the scale of ET, sites with lower ET values or the practice of averaging ET across multiple sites are more likely to exhibit lower average RMSE values. Unfortunately, only a limited number of studies provided information on the relative RMSE or the average ET corresponding to RMSE values, which hindered the derivation of scale-independent RMSE values across all studies.
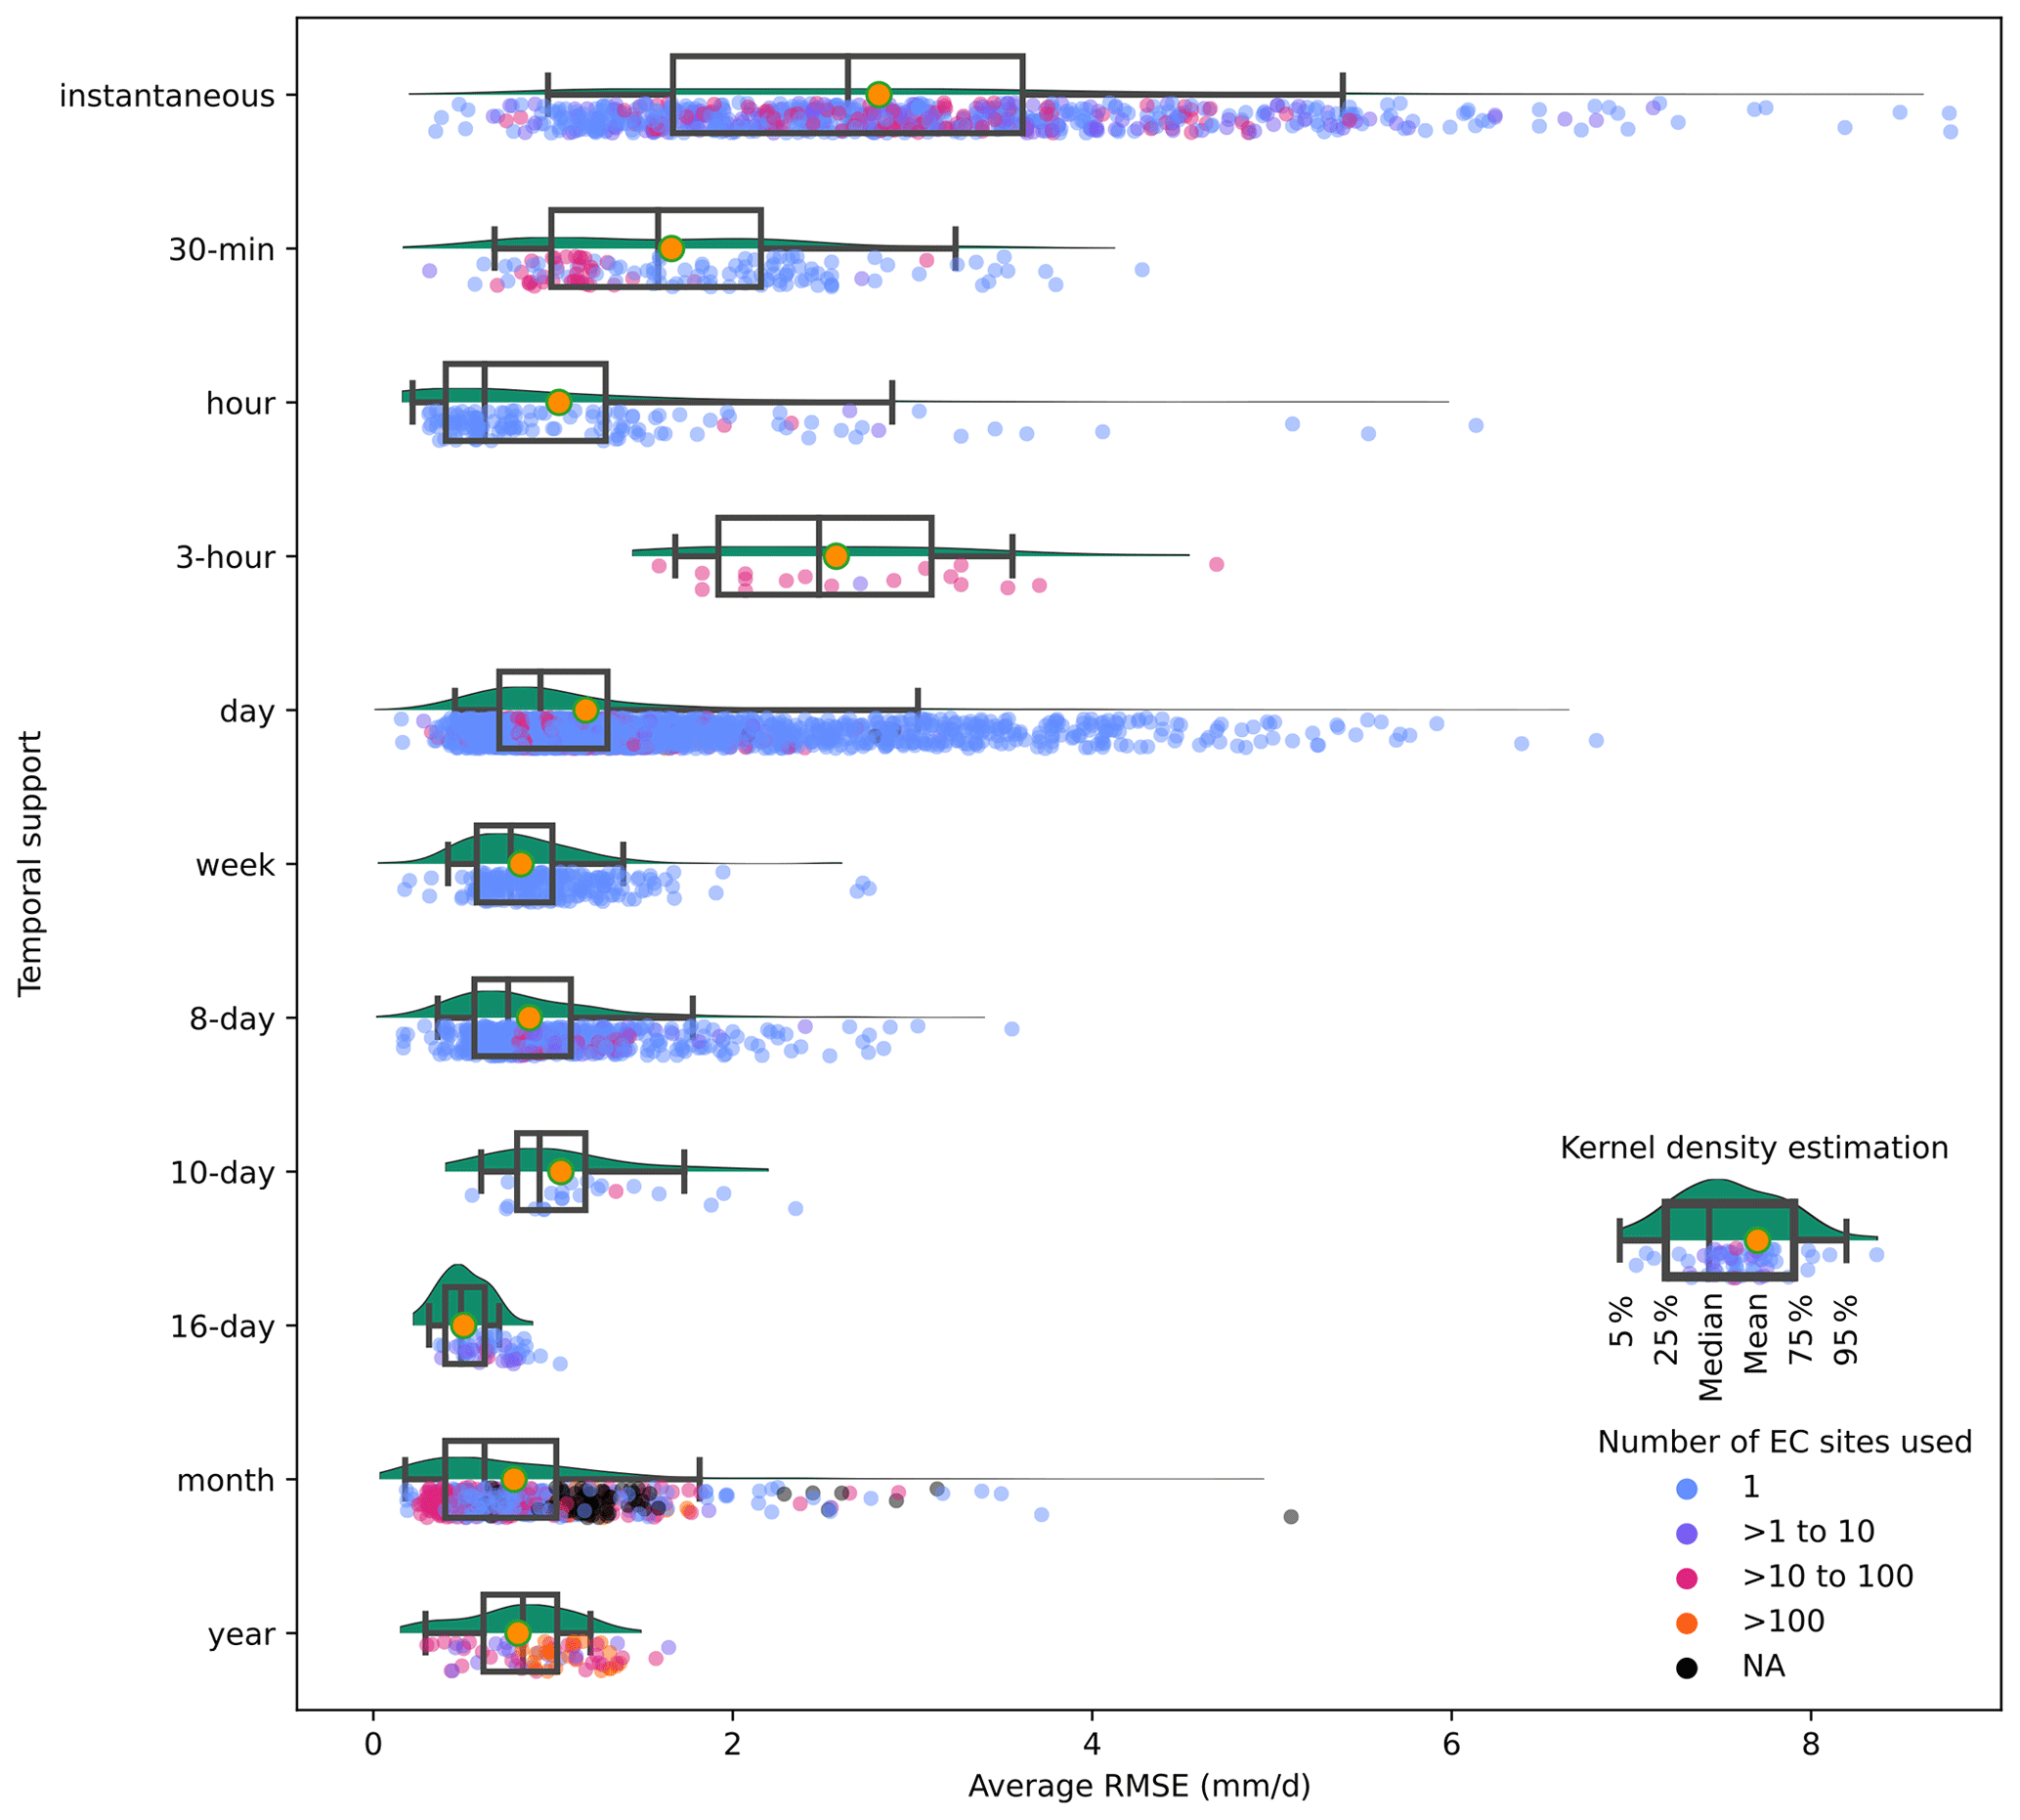
Figure 14RMSE (mm d−1) of RS-ET based on validation with eddy covariance (EC) observations in reviewed articles (N=348). The scattered dots represent RMSE values reported in articles. The dot color shows the number of EC sites used in validation. The green area under the curve represents the kernel density estimation of the underlying probability distribution. The box-and-whisker plot represents the 5th, 25th, 50th (median), 75th, and 95th percentiles of the distribution. The orange circle inside the box-and-whisker plot represents mean value.
The control factors of ET and the uncertainty in their estimates are not the same globally (Zhang et al., 2016). As the distribution of validation sites is concentrated in regions where EC flux towers are available (Fig. 12), the results of the validation are thus not necessarily transferable to other areas. Therefore, when interpreting the uncertainty of RS-ET based on validation, we should consider the validation metrics at each site individually and the variation of these metrics among all locations.
The large range of RMSE values obtained from the meta-analysis can be explained by the diversity of reviewed studies in terms of models, resampling methods, and validation context (e.g., temporal scales, land cover, climate, amount of data). For example, some studies validate RS-ET estimates from global products, while others validate RS-ET estimates from models that were calibrated to reduce RMSE. Moreover, many studies reported the RMSE of latent heat flux (in W m−2 or MJ m−2 d−1) averaged from estimates at the time of satellite overpass. The accuracy of RS-ET varies at different times of the day due to weather conditions and is thus not representative of the entire day. We converted these values to millimeters per day (mm d−1) (Table 3) only for comparison between different temporal supports. The range of RMSEs presented in Fig. 14 and Table 3 should only be considered as a baseline for typical errors in RS-ET. Using only RMSE to compare RS-ET model performance across different studies or validation sites is not recommended.
This paper identifies and appraises methods for uncertainty assessment of RS-ET estimates by applying a systematic quantitative literature review approach. The majority of reviewed articles assess uncertainty in RS-ET estimates by validation against EC measurements. In regions where in situ measurements are limited, most studies used the residual of the water balance as a reference for validation. Making use of existing EC networks is important for global validation of RS-ET estimates. However, there is still a gap in the availability of in situ data for global validation as most data are concentrated in North America, eastern Asia, and Europe. Moreover, the challenges in terms of energy balance closure and scale mismatch persist through the reviewed studies. The future of RS-ET is geared toward enhancing spatiotemporal resolutions (Fisher et al., 2017) thanks to progresses in thermal infrared missions (e.g., ECOSTRESS, LSTM, SBG, TRISHNA, and HydroSat), along with the development of small satellite constellations (e.g., Landsat Next and Copernicus Contributing Missions). Consequently, there is a need for methods to resample in situ measurements to the spatiotemporal resolution of these satellite systems to assess the uncertainties of RS-ET data derived from these sources.
Since the uncertainty in RS-ET in the literature is most often reported in terms of the RMSE of RS-ET estimates compared to EC observations, we provide the typical range of uncertainty in RS-ET based on a meta-analysis of 317 articles that reported this metric. RMSE varies a lot among studies due to different models, resampling methods, and site conditions. Moreover, validation with multiple sites reported a lower average and smaller variation in RMSE values than validation at a single site. While RMSE stands as the most commonly employed metric in the literature, it is unsuitable for comparing uncertainties in RS-ET across different studies due to its inherent scale dependency. Therefore, validation metrics only reflect the uncertainty of RS-ET at specific locations. The RMSE range reported in our study should be used only as a baseline for future studies that validate RS-ET estimates using EC.
Comparing the performance of RS-ET models and investigating the sources and geographical distribution of uncertainty in their ET estimates remains an important research endeavor for many applications. Global assessments provide a broad perspective on RS-ET uncertainties by considering factors that affect data quality on a large scale, such as satellite sensor characteristics, model characteristics, and geographical and climatic factors. Local assessments, on the other hand, focus on specific study areas, which may have unique conditions and sources of uncertainty that are overlooked in global assessments. Therefore, future research should combine local and global evaluation efforts.
For validation of RS-ET estimates with in situ methods, we provide specific recommendations:
-
The uncertainty of the reference datasets, including corrections for surface energy balance closure, should be evaluated and reported.
-
RS-ET estimates should be converted to values at the temporal and spatial scales of reference datasets.
-
The four common metrics (RMSE, bias or mean error, correlation coefficient, coefficient of determination) and mean ET should be reported in validation studies.
-
The statistical significance of validation metrics should be tested, and the number of data points used should be reported.
-
In addition, uncertainties in RS-ET estimates should be characterized using multiple metrics that are scale independent to facilitate comparison of RS-ET uncertainty across regions with different ET ranges.
-
Validation of RS-ET models and data products should be reported at different levels of spatial and temporal scales, covering multiple locations.
We recommend combining multiple approaches for uncertainty assessment of spatiotemporal RS-ET data when validation datasets are limited. These approaches include intercomparisons, sensitivity analyses, uncertainty propagations, physical consistency checks, evaluations of input, triple collocations, and the ensemble of estimates. Both sensitivity analysis and uncertainty propagation approaches were shown to be useful for the advancement of RS-ET techniques by identifying and quantifying the sources of uncertainty. However, our review shows that there are very few studies that applied sensitivity analysis and uncertainty propagation techniques for RS-ET estimates and that most studies employed less computationally demanding options. This impedes the ability to assess a detailed spatiotemporal distribution of RS-ET uncertainty. Therefore, future research on uncertainty in RS-ET estimates needs to develop or apply more advanced sensitivity analysis and uncertainty propagation methods.
Since uncertainty in RS-ET is an attribute of any spatiotemporal dataset, the remaining challenge is to characterize uncertainty spatially and temporally. This means not only quantifying the overall expected errors of the dataset but also identifying where and when high uncertainty is most likely to occur. Several studies have aimed to offer spatially explicit uncertainty in thematic classifications, such as land cover and soil type. These studies, like the ones mentioned by Woodcock (2002), have primarily focused on qualitative mapping techniques. However, for quantitative remote sensing, which involves mapping continuous variables like ET, there is a need for methods that can effectively characterize spatially explicit uncertainty. Therefore, we strongly recommend the development and application of methods to evaluate spatiotemporal uncertainty in RS-ET datasets.
The systematic categorization and analysis of the reviewed articles are available at https://doi.org/10.4121/797dcaff-56e3-45ae-a931-f6f4a3135d26.v2 (Tran, 2023).
The reported RMSE data from the reviewed articles that used eddy covariance to validate remote-sensing-based estimates of evapotranspiration are available at https://doi.org/10.4121/e6e1713a-0c2b-4775-a7f4-9e6e0b2cf40f.v2 (Tran and Mul, 2023).
The supplement related to this article is available online at: https://doi.org/10.5194/hess-27-4505-2023-supplement.
BT and JvdK conceptualized the review approach; BT, JvdK, SSe, MM, and GJ designed the methodology; BT collected and categorized the literature; BT and MM conducted the data collection for meta-analysis; BT analyzed the data; BT and SSe visualized the results; BT wrote the paper draft; BT, JvdK, SSe, MM, GJ, and RU reviewed and edited the paper; GJ, MM, and RU supervised the research activities; MM acquired funding and managed the project.
One of the authors is a member of the editorial board of Hydrology and Earth System Sciences. The peer-review process was guided by an independent editor, and the authors also have no other competing interests to declare.
Publisher's note: Copernicus Publications remains neutral with regard to jurisdictional claims made in the text, published maps, institutional affiliations, or any other geographical representation in this paper. While Copernicus Publications makes every effort to include appropriate place names, the final responsibility lies with the authors.
This paper was improved with comments and suggestions from Joshua B. Fisher and two anonymous reviewers. We also thank Claire I. Michailovsky for the discussions that led to many improvements to the paper.
This research has been supported by the monitoring land and water productivity by remote sensing (WaPOR phase 2) project, which is funded by the Ministry of Foreign Affairs of the Netherlands (grant no. GCP/INT/729/NET).
This paper was edited by Alexander Gruber and reviewed by Joshua Fisher and two anonymous referees.
Abramowitz, G. and Gupta, H.: Toward a model space and model independence metric, Geophys. Res. Lett., 35, L05705, https://doi.org/10.1029/2007GL032834, 2008.
Alfieri, J. G., Anderson, M. C., Kustas, W. P., and Cammalleri, C.: Effect of the revisit interval and temporal upscaling methods on the accuracy of remotely sensed evapotranspiration estimates, Hydrol. Earth Syst. Sci., 21, 83–98, https://doi.org/10.5194/hess-21-83-2017, 2017.
Allen, R. G., Pereira, L. S., Raes, D., and Smith, M.: Crop evapotranspiration – Guidelines for computing crop water requirements-FAO Irrigation and drainage paper 56, FAO, Rome, https://www.fao.org/3/x0490e/x0490e00.htm (last access: 7 September 2023), 1998.
Allen, R. G., Tasumi, M., and Trezza, R.: Satellite-Based Energy Balance for Mapping Evapotranspiration with Internalized Calibration (METRIC) – Model, J. Irrig. Drain. Eng. 133, 380–394, https://doi.org/10.1061/(ASCE)0733-9437(2007)133:4(380), 2007.
Allen, R. G., Pereira, L. S., Howell, T. A., and Jensen, M. E.: Evapotranspiration information reporting: I. Factors governing measurement accuracy, Agr. Water Manage., 98, 899–920, https://doi.org/10.1016/j.agwat.2010.12.015, 2011a.
Allen, R. G., Pereira, L. S., Howell, T. A., and Jensen, M. E.: Evapotranspiration information reporting: II. Recommended documentation, Agr. Water Manage., 98, 921–929, https://doi.org/10.1016/j.agwat.2010.12.016, 2011b.
Anderson, M. C., Kustas, W. P., Norman, J. M., Hain, C. R., Mecikalski, J. R., Schultz, L., González-Dugo, M. P., Cammalleri, C., d'Urso, G., Pimstein, A., and Gao, F.: Mapping daily evapotranspiration at field to continental scales using geostationary and polar orbiting satellite imagery, Hydrol. Earth. Syst. Sci. 15, 223–239, https://doi.org/10.5194/hess-15-223-2011, 2011.
Badgley, G., Fisher, J. B., Jiménez, C., Tu, K. P., and Vinukollu, R.: On uncertainty in global terrestrial evapotranspiration estimates from choice of input forcing datasets, J. Hydrometeorol., 16, 1449–1455, https://doi.org/10.1175/JHM-D-14-0040.1, 2015.
Baik, J., Liaqat, U. W., and Choi, M.: Assessment of satellite-and reanalysis-based evapotranspiration products with two blending approaches over the complex landscapes and climates of Australia, Agr. Forest Meteorol., 263, 388–398, https://doi.org/10.1016/j.agrformet.2018.09.007, 2018.
Bambach, N., Kustas, W., Alfieri, J., Prueger, J., Hipps, L., McKee, L., Castro, S. J., Volk, J., Alsina, M. M., and McElrone, A. J.: Evapotranspiration uncertainty at micrometeorological scales: the impact of the eddy covariance energy imbalance and correction methods, Irrig Sci., 40, 445–461, https://doi.org/10.1007/s00271-022-00783-1, 2022.
Barraza Bernadas, V., Grings, F., Restrepo-Coupe, N., and Huete, A.: Comparison of the performance of latent heat flux products over southern hemisphere forest ecosystems: estimating latent heat flux error structure using in situ measurements and the triple collocation method, Int. J. Remote Sens., 39, 6300–6315, https://doi.org/10.1080/01431161.2018.1458348, 2018.
Bastiaanssen, W. G. M., Menenti, M., Feddes, R. A., and Holtslag, A. A. M.: A remote sensing surface energy balance algorithm for land (SEBAL). 1. Formulation, J. Hydrol., 212–213, 198–212, https://doi.org/10.1016/S0022-1694(98)00253-4, 1998.
Bayat, B., Camacho, F., Nickeson, J., Cosh, M., Bolten, J., Vereecken, H., and Montzka, C.: Toward operational validation systems for global satellite-based terrestrial essential climate variables, Int. J. Appl. Earth Obs. Geoinf., 95, 102240, https://doi.org/10.1016/j.jag.2020.102240, 2021.
Bellocchi, G., Rivington, M., Donatelli, M., and Matthews, K.: Validation of Biophysical Models: Issues and Methodologies, in: Sustainable Agriculture Volume 2, edited by: Lichtfouse, E., Hamelin, M., Navarrete, M., and Debaeke, P., Springer Netherlands, Dordrecht, 577–603, https://doi.org/10.1007/978-94-007-0394-0_26, 2011.
Beven, K.: Facets of uncertainty: epistemic uncertainty, non-stationarity, likelihood, hypothesis testing, and communication, Hydrolog. Sci. J., 61, 1652–1665, https://doi.org/10.1080/02626667.2015.1031761, 2016.
Bhattarai, N., Mallick, K., Stuart, J., Vishwakarma, B. D., Niraula, R., Sen, S., and Jain, M.: An automated multi-model evapotranspiration mapping framework using remotely sensed and reanalysis data, Remote Sens. Environ., 229, 69–92, https://doi.org/10.1016/j.rse.2019.04.026, 2019.
Bielecka, E. and Burek, E.: Spatial data quality and uncertainty publication patterns and trends by bibliometric analysis, Open Geosci., 11, 219–235, https://doi.org/10.1515/geo-2019-0018, 2019.
Bisquert, M., Sánchez, J. M., López-Urrea, R., and Caselles, V.: Estimating high resolution evapotranspiration from disaggregated thermal images, Remote Sens. Eenviron., 187, 423–433, 2016.
Blatchford, M. L., Mannaerts, C. M., Njuki, S. M., Nouri, H., Zeng, Y., Pelgrum, H., Wonink, S., and Karimi, P.: Evaluation of WaPOR V2 evapotranspiration products across Africa, Hydrol. Process., 34, 3200–3221, https://doi.org/10.1002/hyp.13791, 2020.
Boergens, E., Kvas, A., Eicker, A., Dobslaw, H., Schawohl, L., Dahle, C., Murböck, M., and Flechtner, F.: Uncertainties of GRACE-Based Terrestrial Water Storage Anomalies for Arbitrary Averaging Regions, J. Geophys. Res.-Solid, 127, e2021JB022081, https://doi.org/10.1029/2021JB022081, 2022.
Budyko, M. I.: Climate and life, Academic Press, ISBN 0121394506, 1974.
Burchard-Levine, V., Nieto, H., Riaño, D., Migliavacca, M., El-Madany, T. S., Perez-Priego, O., Carrara, A., and Martín, M. P.: Seasonal adaptation of the thermal-based two-source energy balance model for estimating evapotranspiration in a semiarid tree-grass ecosystem, Remote Sens., 12, 904, https://doi.org/10.3390/rs12060904, 2020.
Cao, M., Wang, W., Xing, W., Wei, J., Chen, X., Li, J., and Shao, Q.: Multiple sources of uncertainties in satellite retrieval of terrestrial actual evapotranspiration, J. Hydrol., 601, 126642, https://doi.org/10.1016/j.jhydrol.2021.126642, 2021.
Cawse-Nicholson, K., Braverman, A., Kang, E. L., Li, M., Johnson, M., Halverson, G., Anderson, M., Hain, C., Gunson, M., and Hook, S.: Sensitivity and uncertainty quantification for the ECOSTRESS evapotranspiration algorithm – DisALEXI, Int. J. Appl. Earth Obs. Geoinf., 89, 102088, https://doi.org/10.1016/j.jag.2020.102088, 2020.
Chen, J. M. and Liu, J.: Evolution of evapotranspiration models using thermal and shortwave remote sensing data, Remote Sens. Environ., 237, 111594, https://doi.org/10.1016/j.rse.2019.111594, 2020.
Chen, X., Su, Z., Ma, Y., and Middleton, E. M.: Optimization of a remote sensing energy balance method over different canopy applied at global scale, Agr. Forest Meteorol., 279, 107633, https://doi.org/10.1016/j.agrformet.2019.107633, 2019.
Chen, Y., Xia, J., Liang, S., Feng, J., Fisher, J. B., Li, Xin, Li, Xianglan, Liu, S., Ma, Z., Miyata, A., Mu, Q., Sun, L., Tang, J., Wang, K., Wen, J., Xue, Y., Yu, G., Zha, T., Zhang, L., Zhang, Q., Zhao, T., Zhao, L., and Yuan, W.: Comparison of satellite-based evapotranspiration models over terrestrial ecosystems in China, Remote Sens. Environ., 140, 279–293, https://doi.org/10.1016/j.rse.2013.08.045, 2014.
Courault, D., Seguin, B., and Olioso, A.: Review on estimation of evapotranspiration from remote sensing data: From empirical to numerical modeling approaches, Irrig. Drain. Syst.., 19, 223–249, https://doi.org/10.1007/s10795-005-5186-0, 2005.
Cressie, N. A. C.: Statistics for Spatial Data (Revised Edition), John Wiley Sons, Inc., ISBN 1119115183, 1993.
Crosetto, M., Moreno Ruiz, J. A., and Crippa, B.: Uncertainty propagation in models driven by remotely sensed data, Remote Sens. Environ., 76, 373–385, https://doi.org/10.1016/S0034-4257(01)00184-5, 2001.
Elhag, M.: Inconsistencies of SEBS model output based on the model inputs: global sensitivity contemplations, J. Indian Soc. Remote Sens., 44, 435–442, 2016.
Elnashar, A., Wang, L., Wu, B., Zhu, W., and Zeng, H.: Synthesis of global actual evapotranspiration from 1982 to 2019, Earth Syst. Sci. Data, 13, 447–480, https://doi.org/10.5194/essd-13-447-2021, 2021.
Ershadi, A., McCabe, M. F., Evans, J. P., and Walker, J. P.: Effects of spatial aggregation on the multi-scale estimation of evapotranspiration, Remote Sens. Environ., 131, 51–62, https://doi.org/10.1016/j.rse.2012.12.007, 2013.
ESA – European Space Agency: User Guides – Sentinel-2 MSI – Processing Levels, https://sentinels.copernicus.eu/web/sentinel/user-guides/sentinel-2-msi/processing-levels (last ccess: 22 February 2023), 2021.
FAO – Food and Agriculture Organization of the United Nations: WaPOR Database Methodology: Level 2, Remote Sensing for Water Productivity, Rome, ISBN 978-92-5-130057-2, https://www.fao.org/3/I8225EN/i8225en.pdf (lsat access: 18 December 2023), 2018.
Ferguson, C. R., Sheffield, J., Wood, E. F., and Gao, H.: Quantifying uncertainty in a remote sensing-based estimate of evapotranspiration over continental USA, Int. J. Remote Sens., 31, 3821–3865, https://doi.org/10.1080/01431161.2010.483490, 2010.
Fisher, J. B., Tu, K. P., and Baldocchi, D. D.: Global estimates of the land–atmosphere water flux based on monthly AVHRR and ISLSCP-II data, validated at 16 FLUXNET sites, Remote Sens. Environ., 112, 901–919, 2008.
Fisher, J. B., Melton, F., Middleton, E., Hain, C., Anderson, M., Allen, R., McCabe, M. F., Hook, S., Baldocchi, D., Townsend, P. A., and Kilic, A.: The future of evapotranspiration: Global requirements for ecosystem functioning, carbon and climate feedbacks, agricultural management, and water resources, Water Resour. Res., 53, 2618–2626, 2017.
FLUXNET: Site Summary, https://fluxnet.org/sites/site-summary (last access: 20 January 2023), 2017.
Fisher, J. B., Lee, B., Purdy, A. J., Halverson, G. H., Dohlen, M. B., Cawse-Nicholson, K., Wang, A., Anderson, R. G., Aragon, B., Arain, M. A., and Baldocchi, D. D.: ECOSTRESS: NASA's next generation mission to measure evapotranspiration from the international space station, Water Resour. Res., 56, e2019WR026058, https://doi.org/10.1029/2019WR026058, 2020.
Foken, T.: The energy balance closure problem: An overview, Ecol. Appl., 18, 1351–1367, 2008.
Foody, G. M. and Atkinson, P. M.: Uncertainty in Remote Sensing and GIS, John Wiley & Sons, ISBN 978-0-470-85924-7, 2003.
García, M., Sandholt, I., Ceccato, P., Ridler, M., Mougin, E., Kergoat, L., Morillas, L., Timouk, F., Fensholt, R., and Domingo, F.: Actual evapotranspiration in drylands derived from in-situ and satellite data: Assessing biophysical constraints, Remote Sens. Environ., 131, 103–118, 2013.
García-Santos, V., Sánchez, J. M., and Cuxart, J.: Evapotranspiration Acquired with Remote Sensing Thermal-Based Algorithms: A State-of-the-Art Review, Remote Sens., 14, 3440, https://doi.org/10.3390/rs14143440, 2022.
Gentine, P., Entekhabi, D., Chehbouni, A., Boulet, G., and Duchemin, B.: Analysis of evaporative fraction diurnal behaviour, Agr. Forest Meteorol., 143, 13–29, https://doi.org/10.1016/j.agrformet.2006.11.002, 2007.
Glenn, E. P., Huete, A. R., Nagler, P. L., Hirschboeck, K. K., and Brown, P.: Integrating Remote Sensing and Ground Methods to Estimate Evapotranspiration, Crit. Rev. Plant Sci., 26, 139–168, https://doi.org/10.1080/07352680701402503, 2007.
Glenn, E. P., Nagler, P. L., and Huete, A. R.: Vegetation Index Methods for Estimating Evapotranspiration by Remote Sensing, Surv. Geophys., 31, 531–555, https://doi.org/10.1007/s10712-010-9102-2, 2010.
Glenn, E. P., Doody, T. M., Guerschman, J. P., Huete, A. R., King, E. A., McVicar, T. R., Dijk, A. I. J. M. V., Niel, T. G. V., Yebra, M., and Zhang, Y.: Actual evapotranspiration estimation by ground and remote sensing methods: the Australian experience, Hydrol. Process., 25, 4103–4116, https://doi.org/10.1002/hyp.8391, 2011.
Gomis-Cebolla, J., Jimenez, J. C., Sobrino, J. A., Corbari, C., and Mancini, M.: Intercomparison of remote-sensing based evapotranspiration algorithms over amazonian forests, Int. J. Appl. Earth Obs. Geoinf., 80, 280–294, https://doi.org/10.1016/j.jag.2019.04.009, 2019.
Gowda, P. H., Chávez, J. L., Colaizzi, P. D., Evett, S. R., Howell, T. A., and Tolk, J. A.: Remote sensing based energy balance algorithms for mapping ET: current status and future challenges, T. ASABE, 50, 6, https://doi.org/10.13031/2013.23964, 2007.
Guo, X., Yao, Y., Zhang, Y., Lin, Y., Jiang, B., Jia, K., Zhang, X., Xie, X., Zhang, L., Shang, K., and Yang, J.: Discrepancies in the simulated global terrestrial latent heat flux from glass and merra-2 surface net radiation products, Remote Sens., 12, 2763, https://doi.org/10.3390/rs12172763, 2020.
He, X., Xu, T., Xia, Y., Bateni, S. M., Guo, Z., Liu, S., Mao, K., Zhang, Y., Feng, H., and Zhao, J.: A Bayesian three-cornered hat (BTCH) method: improving the terrestrial evapotranspiration estimation, Remote Sens., 12, 878, https://doi.org/10.3390/rs12050878, 2020.
Heuvelink, G. B. M.: Error Propagation in Environmental Modelling with GIS, CRC Press, London, https://doi.org/10.4324/9780203016114, 1998.
Hoedjes, J. C. B., Chehbouni, A., Jacob, F., Ezzahar, J., and Boulet, G.: Deriving daily evapotranspiration from remotely sensed instantaneous evaporative fraction over olive orchard in semi-arid Morocco, J. Hydrol., 354, 53–64, https://doi.org/10.1016/j.jhydrol.2008.02.016, 2008.
JCGM – Joint Committee for Guides in Metrology: International vocabulary of metrology – Basic and general concepts and associated terms, BIPM, Sèvres, France, https://www.bipm.org/documents/20126/2071204/JCGM_200_2012.pdf (last access: 15 December 2023), 2012.
Jiang, L., Zhang, B., Han, S., Chen, H., and Wei, Z.: Upscaling evapotranspiration from the instantaneous to the daily time scale: Assessing six methods including an optimized coefficient based on worldwide eddy covariance flux network, J. Hydrol., 596, 126135, https://doi.org/10.1016/j.jhydrol.2021.126135, 2021.
Jiménez, C., Prigent, C., Mueller, B., Seneviratne, S. I., McCabe, M. F., Wood, E. F., Rossow, W. B., Balsamo, G., Betts, A. K., Dirmeyer, P. A., Fisher, J. B., Jung, M., Kanamitsu, M., Reichle, R. H., Reichstein, M., Rodell, M., Sheffield, J., Tu, K., and Wang, K.: Global intercomparison of 12 land surface heat flux estimates, J. Geophys. Res.-Atmos., 116, D02102, https://doi.org/10.1029/2010JD014545, 2011.
Jung, H. C., Getirana, A., Arsenault, K. R., Holmes, T. R., and McNally, A.: Uncertainties in evapotranspiration estimates over West Africa, Remote Sens., 11, 892, https://doi.org/10.3390/rs11080892, 2019.
Jung, M., Koirala, S., Weber, U., Ichii, K., Gans, F., Camps-Valls, G., Papale, D., Schwalm, C., Tramontana, G., and Reichstein, M.: The FLUXCOM ensemble of global land-atmosphere energy fluxes, Sci. Data, 6, 1–14, https://doi.org/10.1038/s41597-019-0076-8, 2019.
Kalma, J. D., McVicar, T. R., and McCabe, M. F.: Estimating Land Surface Evaporation: A Review of Methods Using Remotely Sensed Surface Temperature Data, Surv. Geophys., 29, 421–469, https://doi.org/10.1007/s10712-008-9037-z, 2008.
Karimi, P. and Bastiaanssen, W. G. M.: Spatial evapotranspiration, rainfall and land use data in water accounting – Part 1: Review of the accuracy of the remote sensing data, Hydrol. Earth. Syst. Sci., 19, 507–532, https://doi.org/10.5194/hess-19-507-2015, 2015.
Khan, M. S., Liaqat, U. W., Baik, J., and Choi, M.: Stand-alone uncertainty characterization of GLEAM, GLDAS and MOD16 evapotranspiration products using an extended triple collocation approach, Agr. Forest Meteorol., 252, 256–268, 2018.
Kibria, S., Masia, S., Sušnik, J., and Hessels, T. M.: Critical comparison of actual evapotranspiration estimates using ground based, remotely sensed, and simulated data in the USA, Agr. Water Manage., 248, 106753, https://doi.org/10.1016/j.agwat.2021.106753, 2021.
Koppa, A. and Gebremichael, M.: A framework for validation of remotely sensed precipitation and evapotranspiration based on the Budyko hypothesis, Water Resour. Res., 53, 8487–8499, 2017.
Korzoun, V. I., Sokolov, A. A., Budyko, M. I., Voskresensky, K. P., Kalinin, G. P., Konoplyantsev, A. A., Korotkevich, E. S., Kuzin, P. S., and Lvovich, M. I.: World water balance and water resources of the earth, Stud. Rep. Hydrol., UNESCO, ISBN 9789231014970, 1978.
Kustas, W. P. and Norman, J. M.: Use of remote sensing for evapotranspiration monitoring over land surfaces, Hydrolog. Sci. J., 41, 495–516, https://doi.org/10.1080/02626669609491522, 1996.
Kustas, W. P. and Norman, J. M.: Evaluation of soil and vegetation heat flux predictions using a simple two-source model with radiometric temperatures for partial canopy cover, Agr. Forest Meteorol., 94, 13–29, https://doi.org/10.1016/S0168-1923(99)00005-2, 1999.
Kvålseth, T. O.: Cautionary Note about R2, Am. Stat., 39, 279–285, https://doi.org/10.1080/00031305.1985.10479448, 1985.
Lehmann, F., Vishwakarma, B. D., and Bamber, J.: How well are we able to close the water budget at the global scale?, Hydrol. Earth. Syst. Sci., 26, 35–54, https://doi.org/10.5194/hess-26-35-2022, 2022.
Lex, A., Gehlenborg, N., Strobelt, H., Vuillemot, R., and Pfister, H.: UpSet: Visualization of Intersecting Sets, IEEE Trans. Vis. Comput. Graph., 20, 1983–1992, https://doi.org/10.1109/TVCG.2014.2346248, 2014.
Li, X., Xin, X., Jiao, J., Peng, Z., Zhang, H., Shao, S., and Liu, Q.: Estimating subpixel surface heat fluxes through applying temperature-sharpening methods to MODIS data, Remote Sens., 9, 836, https://doi.org/10.3390/rs9080836, 2017.
Li, X., Liu, S., Li, H., Ma, Y., Wang, J., Zhang, Y., Xu, Z., Xu, T., Song, L., Yang, X., Lu, Z., Wang, Z., and Guo, Z.: Intercomparison of Six Upscaling Evapotranspiration Methods: From Site to the Satellite Pixel, J. Geophys. Res.-Atmos., 123, 6777–6803, https://doi.org/10.1029/2018JD028422, 2018.
Li, Z.-L., Tang, R., Wan, Z., Bi, Y., Zhou, C., Tang, B., Yan, G., and Zhang, X.: A Review of Current Methodologies for Regional Evapotranspiration Estimation from Remotely Sensed Data, Sensors, 9, 3801–3853, https://doi.org/10.3390/s90503801, 2009.
Liang, S., Wang, K., Zhang, X., and Wild, M.: Review on Estimation of Land Surface Radiation and Energy Budgets From Ground Measurement, Remote Sensing and Model Simulations, IEEE J. Select. Top. Appl. Earth Obs. Remote Sens., 3, 225–240, https://doi.org/10.1109/JSTARS.2010.2048556, 2010.
Liou, Y.-A. and Kar, S. K.: Evapotranspiration Estimation with Remote Sensing and Various Surface Energy Balance Algorithms – A Review, Energies 7, 2821–2849, https://doi.org/10.3390/en7052821, 2014.
Liu, S., Xu, Z., Song, L., Zhao, Q., Ge, Y., Xu, T., Ma, Y., Zhu, Z., Jia, Z., and Zhang, F.: Upscaling evapotranspiration measurements from multi-site to the satellite pixel scale over heterogeneous land surfaces, Agr. Forest Meteorol., 230–231, 97–113, https://doi.org/10.1016/j.agrformet.2016.04.008, 2016.
Liu, Z.: The accuracy of temporal upscaling of instantaneous evapotranspiration to daily values with seven upscaling methods, Hydrol. Earth. Syst. Sci., 25, 4417–4433, https://doi.org/10.5194/hess-25-4417-2021, 2021.
Loew, A., Bell, W., Brocca, L., Bulgin, C. E., Burdanowitz, J., Calbet, X., Donner, R. V., Ghent, D., Gruber, A., Kaminski, T., Kinzel, J., Klepp, C., Lambert, J.-C., Schaepman-Strub, G., Schröder, M., and Verhoelst, T.: Validation practices for satellite-based Earth observation data across communities, Rev. Geophys., 55, 779–817, https://doi.org/10.1002/2017RG000562, 2017.
Long, D., Singh, V. P., and Li, Z. L.: How sensitive is SEBAL to changes in input variables, domain size and satellite sensor?, J. Geophys. Res.-Atmos., 116, D21107, https://doi.org/10.1029/2011JD016542, 2011.
Long, D., Longuevergne, L., and Scanlon, B. R.: Uncertainty in evapotranspiration from land surface modeling, remote sensing, and GRACE satellites, Water Resour. Res., 50, 1131–1151, https://doi.org/10.1002/2013WR014581, 2014.
López, O., Houborg, R., and McCabe, M. F.: Evaluating the hydrological consistency of evaporation products using satellite-based gravity and rainfall data, Hydrol. Earth Syst. Sci., 21, 323–343, https://doi.org/10.5194/hess-21-323-2017, 2017.
Markwitz, C. and Siebicke, L.: Low-cost eddy covariance: a case study of evapotranspiration over agroforestry in Germany, Atmos. Meas. Tech., 12, 4677–4696, https://doi.org/10.5194/amt-12-4677-2019, 2019.
Martens, B., Miralles, D. G., Lievens, H., van der Schalie, R., de Jeu, R. A. M., Fernández-Prieto, D., Beck, H. E., Dorigo, W. A., and Verhoest, N. E. C.: GLEAM v3: satellite-based land evaporation and root-zone soil moisture, Geosci. Model Dev., 10, 1903–1925, https://doi.org/10.5194/gmd-10-1903-2017, 2017.
Mayr, S., Kuenzer, C., Gessner, U., Klein, I., and Rutzinger, M.: Validation of Earth Observation Time-Series: A Review for Large-Area and Temporally Dense Land Surface Products, Remote Sens., 11, 2616, https://doi.org/10.3390/rs11222616, 2019.
McColl, K. A., Vogelzang, J., Konings, A.G., Entekhabi, D., Piles, M., and Stoffelen, A.: Extended triple collocation: Estimating errors and correlation coefficients with respect to an unknown target, Geophys. Res. Lett., 41, 6229–6236, 2014.
Melsen, L. A., Teuling, A. J., Torfs, P. J. J. F., Zappa, M., Mizukami, N., Mendoza, P. A., Clark, M. P., and Uijlenhoet, R.: Subjective modeling decisions can significantly impact the simulation of flood and drought events, J. Hydrol., 568, 1093–1104, https://doi.org/10.1016/j.jhydrol.2018.11.046, 2019.
Melton, F.S., Huntington, J., Grimm, R., Herring, J., Hall, M., Rollison, D., Erickson, T., Allen, R., Anderson, M., Fisher, J. B., Kilic, A., Senay, G. B., Volk, J., Hain, C., Johnson, L., Ruhoff, A., Blankenau, P., Bromley, M., Carrara, W., Daudert, B., Doherty, C., Dunkerly, C., Friedrichs, M., Guzman, A., Halverson, G., Hansen, J., Harding, J., Kang, Y., Ketchum, D., Minor, B., Morton, C., Ortega-Salazar, S., Ott, T., Ozdogan, M., ReVelle, P. M., Schull, M., Wang, C., Yang, Y., and Anderson, R. G.: OpenET: Filling a Critical Data Gap in Water Management for the Western United States, J. Am. Water Resour. Assoc., 58, 971–994, https://doi.org/10.1111/1752-1688.12956, 2021.
Miralles, D. G., Holmes, T. R. H., De Jeu, R. A. M., Gash, J. H., Meesters, A. G. C. A., and Dolman, A. J.: Global land-surface evaporation estimated from satellite-based observations, Hydrol. Earth Syst. Sci., 15, 453–469, https://doi.org/10.5194/hess-15-453-2011, 2011a.
Miralles, D. G., De Jeu, R. A. M., Gash, J. H., Holmes, T. R. H., and Dolman, A. J.: Magnitude and variability of land evaporation and its components at the global scale, Hydrol. Earth Syst. Sci., 15, 967–981, https://doi.org/10.5194/hess-15-967-2011, 2011b.
Mohammadi, S. and Cremaschi, S.: Efficiency of uncertainty propagation methods for moment estimation of uncertain model outputs, Comput. Chem. Eng., 166, 107954, https://doi.org/10.1016/j.compchemeng.2022.107954, 2022.
Mohan, M. M. P., Kanchirapuzha, R., and Varma, M. R. R.: Review of approaches for the estimation of sensible heat flux in remote sensing-based evapotranspiration models, J. Appl. Remote Sens., 14, 041501, https://doi.org/10.1117/1.JRS.14.041501, 2020.
Montanari, A.: What do we mean by `uncertainty'? The need for a consistent wording about uncertainty assessment in hydrology, Hydrol. Process., 21, 841–845, https://doi.org/10.1002/hyp.6623, 2007.
Monteith, J. L.: Evaporation and environment, in: Symposia of the society for experimental biology, Vol. 19, CUP – Cambridge University Press, Cambridge, 205–234, https://repository.rothamsted.ac.uk/item/8v5v7 (last access: 18 December 2023), 1965.
Mu, Q., Heinsch, F. A., Zhao, M., and Running, S. W.: Development of a global evapotranspiration algorithm based on MODIS and global meteorology data, Remote Sens. Environ., 111, 519–536, 2007.
Mu, Q., Zhao, M., and Running, S. W.: Improvements to a MODIS global terrestrial evapotranspiration algorithm, Remote Sens. Environ., 115, 1781–1800, 2011.
Mueller, B., Hirschi, M., Jimenez, C., Ciais, P., Dirmeyer, P. A., Dolman, A. J., Fisher, J. B., Jung, M., Ludwig, F., Maignan, F., and Miralles, D. G.: Benchmark products for land evapotranspiration: LandFlux-EVAL multi-data set synthesis, Hydrol. Earth. Syst. Sci., 17, 3707–3720, https://doi.org/10.5194/hess-17-3707-2013, 2013.
NASA – The National Aeronautics and Space Administration: Data Processing Levels|Earthdata, https://earthdata.nasa.gov/collaborate/open-data-services-and-software/data-information-policy/data-levels/ (last access: 22 February 2023), 2021.
Nearing, G. S., Tian, Y., Gupta, H. V., Clark, M. P., Harrison, K. W., and Weijs, S. V.: A philosophical basis for hydrological uncertainty, Hydrolog. Sci. J., 61, 1666–1678, https://doi.org/10.1080/02626667.2016.1183009, 2016.
Oliphant, A. J.: Terrestrial ecosystem-atmosphere exchange of CO2, water and energy from FLUXNET; review and meta-analysis of a global in-situ observatory, Geogr. Compass, 6, 689–705, https://doi.org/10.1111/gec3.12009, 2012.
Oreskes, N., Shrader-Frechette, K., and Belitz, K.: Verification, Validation, and Confirmation of Numerical Models in the Earth Sciences, Science, 263, 641–646, https://doi.org/10.1126/science.263.5147.641, 1994.
Pan, S., Pan, N., Tian, H., Friedlingstein, P., Sitch, S., Shi, H., Arora, V. K., Haverd, V., Jain, A. K., Kato, E., and Lienert, S.: Evaluation of global terrestrial evapotranspiration using state-of-the-art approaches in remote sensing, machine learning and land surface modeling, Hydrol. Earth. Syst. Sci., 24, 1485–1509, https://doi.org/10.5194/hess-24-1485-2020, 2020.
Pardo, N., Sánchez, M. L., Timmermans, J., Su, Z., Pérez, I. A., and García, M. A.: SEBS validation in a Spanish rotating crop, Agr. Forest Meteorol., 195, 132–142, 2014.
Peng, Z. Q., Xin, X., Jiao, J. J., Zhou, T., and Liu, Q.: Remote sensing algorithm for surface evapotranspiration considering landscape and statistical effects on mixed pixels, Hydrol. Earth Syst. Sci., 20, 4409–4438, https://doi.org/10.5194/hess-20-4409-2016, 2016.
Pickering, C. and Byrne, J.: The benefits of publishing systematic quantitative literature reviews for PhD candidates and other early-career researchers, High Educ. Res. Dev., 33, 534–548, https://doi.org/10.1080/07294360.2013.841651, 2014.
Povey, A. C. and Grainger, R. G.: Known and unknown unknowns: uncertainty estimation in satellite remote sensing, Atmosp. Meas. Tech., 8, 4699–4718, https://doi.org/10.5194/amt-8-4699-2015, 2015.
Premoli, A. and Tavella, P.: A revisited three-cornered hat method for estimating frequency standard instability, IEEE T. Instrum. Meas., 42, 7–13, 1993.
Razavi, S. and Gupta, H. V.: What do we mean by sensitivity analysis? The need for comprehensive characterization of “global” sensitivity in Earth and Environmental systems models, Water Resour. Res., 51, 3070–3092, https://doi.org/10.1002/2014WR016527, 2015.
Rwasoka, D. T., Gumindoga, W., and Gwenzi, J.: Estimation of actual evapotranspiration using the Surface Energy Balance System (SEBS) algorithm in the Upper Manyame catchment in Zimbabwe, Phys. Chem. Earth Pt. A/B/C, 36, 736–746, 2011.
Saltelli, A., Aleksankina, K., Becker, W., Fennell, P., Ferretti, F., Holst, N., Li, S., and Wu, Q.: Why so many published sensitivity analyses are false: A systematic review of sensitivity analysis practices, Environ. Model. Softw., 114, 29–39, https://doi.org/10.1016/j.envsoft.2019.01.012, 2019.
Saltelli, A., Jakeman, A., Razavi, S., and Wu, Q.: Sensitivity analysis: A discipline coming of age, Environ. Model. Softw., 146, 105226, https://doi.org/10.1016/j.envsoft.2021.105226, 2021.
Schoups, G. and Nasseri, M.: GRACEfully closing the water balance: A data-driven probabilistic approach applied to river basins in Iran, Water Resour. Res., 57, e2020WR029071, https://doi.org/10.1029/2020WR029071, 2021.
Senay, G. B., Leake, S., Nagler, P. L., Artan, G., Dickinson, J., Cordova, J. T., and Glenn, E. P.: Estimating basin scale evapotranspiration (ET) by water balance and remote sensing methods, Hydrol. Process., 25, 4037–4049, https://doi.org/10.1002/hyp.8379, 2011.
Senay, G. B., Bohms, S., Singh, R. K., Gowda, P. H., Velpuri, N. M., Alemu, H., and Verdin, J. P.: Operational evapotranspiration mapping using remote sensing and weather datasets: A new parameterization for the SSEB approach, J. Am. Water Resour. Assoc., 49, 577–591, https://doi.org/10.1111/jawr.12057, 2013.
Sharma, V., Kilic, A., and Irmak, S.: Impact of scale/resolution on evapotranspiration from Landsat and MODIS images, Water Resour. Res., 52, 1800–1819, https://doi.org/10.1002/2015WR017772, 2016.
Shuttleworth, W. J. and Wallace, J. S.: Evaporation from sparse crops-an energy combination theory, Q. J. Roy. Meteorol. Soc., 111, 839–855, 1985.
Sjoberg, J. P., Anthes, R. A., and Rieckh, T.: The three-cornered hat method for estimating error variances of three or more atmospheric datasets. Part I: overview and evaluation, J. Atmos. Ocean. Tech., 38, 555–572, 2021.
Sobol, I. M.: Global sensitivity indices for nonlinear mathematical models and their Monte Carlo estimates, Math. Comput. Simul., 55, 271–280, 2001.
Stisen, S., Soltani, M., Mendiguren, G., Langkilde, H., Garcia, M., and Koch, J.: Spatial patterns in actual evapotranspiration climatologies for Europe, Remote Sens., 13, 2410, https://doi.org/10.3390/rs13122410, 2021.
Stoffelen, A.: Toward the true near-surface wind speed: Error modeling and calibration using triple collocation, J. Geophys. Res.-Oceans, 103, 7755–7766, 1998.
Su, Z.: The Surface Energy Balance System (SEBS) for estimation of turbulent heat fluxes, Hydrol. Earth. Syst. Sci., 6, 85–100, https://doi.org/10.5194/hess-6-85-2002, 2002.
Talsma, C. J., Good, S. P., Miralles, D. G., Fisher, J. B., Martens, B., Jimenez, C., and Purdy, A. J.: Sensitivity of evapotranspiration components in remote sensing-based models, Remote Sens., 10, 1601, https://doi.org/10.3390/rs10101601, 2018.
Taylor, J.: Introduction to Error Analysis, the Study of Uncertainties in Physical Measurements, in: 2nd Edn., University Science Books, ISBN 10:093570275X, 1997.
Trambauer, P., Dutra, E., Maskey, S., Werner, M., Pappenberger, F., Van Beek, L. P. H., and Uhlenbrook, S.: Comparison of different evaporation estimates over the African continent, Hydrol. Earth. Syst. Sci., 18, 193–212, https://doi.org/10.5194/hess-18-193-2014, 2014.
Tran, B.: Systematic Quantitative Literature Review – Uncertainty assessment of Evapotranspiration Remote Sensing, 4TU.ResearchData [data set], https://doi.org/10.4121/797dcaff-56e3-45ae-a931-f6f4a3135d26.v2, 2023.
Tran, B. and Mul, M.: Meta-analysis of Remotely sensed Evapotranspiration validation with Eddy Covariance, 4TU.ResearchData [data set], https://doi.org/10.4121/e6e1713a-0c2b-4775-a7f4-9e6e0b2cf40f.v2, 2023.
van de Schoot, R., de Bruin, J., Schram, R., Zahedi, P., de Boer, J., Weijdema, F., Kramer, B., Huijts, M., Hoogerwerf, M., Ferdinands, G., Harkema, A., Willemsen, J., Ma, Y., Fang, Q., Hindriks, S., Tummers, L., and Oberski, D. L.: An open source machine learning framework for efficient and transparent systematic reviews, Nat. Mach. Intel., 3, 125–133, https://doi.org/10.1038/s42256-020-00287-7, 2021.
Van Niel, T. G., McVicar, T. R., Roderick, M. L., van Dijk, A. I., Beringer, J., Hutley, L. B., and Van Gorsel, E.: Upscaling latent heat flux for thermal remote sensing studies: Comparison of alternative approaches and correction of bias, J. Hydrol., 468, 35–46, https://doi.org/10.1016/j.jhydrol.2012.08.005, 2012.
Vendrame, N., Tezza, L., and Pitacco, A.: Comparison of sensible heat fluxes by large aperture scintillometry and eddy covariance over two contrasting–climate vineyards, Agr. Forest Meteorol., 288–289, 108002, https://doi.org/10.1016/j.agrformet.2020.108002, 2020.
Vinukollu, R. K., Wood, E. F., Ferguson, C. R., and Fisher, J. B.: Global estimates of evapotranspiration for climate studies using multi-sensor remote sensing data: Evaluation of three process-based approaches, Remote Sens. Environ., 115, 801–823, https://doi.org/10.1016/j.rse.2010.11.006, 2011a.
Vinukollu, R. K., Meynadier, R., Sheffield, J., and Wood, E. F.: Multi-model, multi-sensor estimates of global evapotranspiration: Climatology, uncertainties and trends, Hydrol. Process., 25, 3993–4010, https://doi.org/10.1002/hyp.8393, 2011b.
Wadoux, A. M. J.-C., Heuvelink, G. B. M., Uijlenhoet, R., and de Bruin, S.: Optimization of rain gauge sampling density for river discharge prediction using Bayesian calibration, Peer J., 8, e9558, https://doi.org/10.7717/peerj.9558, 2020.
Wang, J., Zhuang, J., Wang, W., Liu, S., and Xu, Z.: Assessment of Uncertainties in Eddy Covariance Flux Measurement Based on Intensive Flux Matrix of HiWATER-MUSOEXE, IEEE Geosci. Remote Sens. Lett. 12, 259–263, https://doi.org/10.1109/LGRS.2014.2334703, 2015.
Wang, K. and Dickinson, R. E.: A review of global terrestrial evapotranspiration: Observation, modeling, climatology, and climatic variability, Rev. Geophys., 50, RG2005, https://doi.org/10.1029/2011RG000373, 2012.
Wang, Y. Q., Xiong, Y. J., Qiu, G. Y., and Zhang, Q. T.: Is scale really a challenge in evapotranspiration estimation? A multi-scale study in the Heihe oasis using thermal remote sensing and the three-temperature model, Agr. Forest Meteorol., 230, 128–141, https://doi.org/10.1016/j.rse.2012.12.007, 2016.
Weerasinghe, I., Bastiaanssen, W., Mul, M., Jia, L., and van Griensven, A.: Can we trust remote sensing evapotranspiration products over Africa?, Hydrol. Earth Syst. Sci., 24, 1565–1586, https://doi.org/10.5194/hess-24-1565-2020, 2020.
Wilson, K., Goldstein, A., Falge, E., Aubinet, M., Baldocchi, D., Berbigier, P., Bernhofer, C., Ceulemans, R., Dolman, H., Field, C., and Grelle, A.: Energy balance closure at FLUXNET sites, Agr. Forest Meteorol., 113, 223–243, 2002.
Woodcock, C. E.: Uncertainty in Remote Sensing, in: Uncertainty in Remote Sensing and GIS, edited by: Foody, G. M. and Atkinson, P. M., John Wiley & Sons Inc, ISBN 0470844086, 2002.
Wu, X., Xiao, Q., Wen, J., You, D., and Hueni, A.: Advances in quantitative remote sensing product validation: Overview and current status, Earth-Sci. Rev., 196, 102875, https://doi.org/10.1016/j.earscirev.2019.102875, 2019a.
Wu, X., Xiao, Q., Wen, J., and You, D.: Direct comparison and triple collocation: Which is more reliable in the validation of coarse-scale satellite surface albedo products, J. Geophys. Res.-Atmos., 124, 5198–5213, https://doi.org/10.1029/2018JD029937, 2019b.
Xu, T., Liu, S., Xu, L., Chen, Y., Jia, Z., Xu, Z., and Nielson, J.: Temporal upscaling and reconstruction of thermal remotely sensed instantaneous evapotranspiration, Remote Sens., 7, 3400–3425, https://doi.org/10.3390/rs70303400, 2015.
Xu, T., Guo, Z., Xia, Y., Ferreira, V. G., Liu, S., Wang, K., Yao, Y., Zhang, X., and Zhao, C.: Evaluation of twelve evapotranspiration products from machine learning, remote sensing and land surface models over conterminous United States, J. Hydrol., 578, 124105, https://doi.org/10.1016/j.jhydrol.2019.124105, 2019.
Yang, X., Tian, S., You, W., and Jiang, Z.: Reconstruction of continuous GRACE/GRACE-FO terrestrial water storage anomalies based on time series decomposition, J. Hydrol., 603, 127018, https://doi.org/10.1016/j.jhydrol.2021.127018, 2021.
Yao, Y., Liang, S., Li, X., Hong, Y., Fisher, J. B., Zhang, N., Chen, J., Cheng, J., Zhao, S., Zhang, X., and Jiang, B.: Bayesian multimodel estimation of global terrestrial latent heat flux from eddy covariance, meteorological, and satellite observations, J. Geophys. Res.-Atmos., 119, 4521–4545, https://doi.org/10.1002/2013JD020864, 2014.
Yao, Y., Liang, S., Li, X., Zhang, Y., Chen, J., Jia, K., Zhang, X., Fisher, J. B., Wang, X., Zhang, L., and Xu, J.: Estimation of high-resolution terrestrial evapotranspiration from Landsat data using a simple Taylor skill fusion method, J. Hydrol., 553, 508–526, https://doi.org/10.1016/j.jhydrol.2017.08.013, 2017.
Yebra, M., Van Dijk, A., Leuning, R., Huete, A., and Guerschman, J. P.: Evaluation of optical remote sensing to estimate actual evapotranspiration and canopy conductance, Remote Sens. Environ., 129, 250–261, 2013.
Zeng, Y., Su, Z., Calvet, J.-C., Manninen, T., Swinnen, E., Schulz, J., Roebeling, R., Poli, P., Tan, D., Riihelä, A., Tanis, C.-M., Arslan, A.-N., Obregon, A., Kaiser-Weiss, A., John, V. O., Timmermans, W., Timmermans, J., Kaspar, F., Gregow, H., Barbu, A.-L., Fairbairn, D., Gelati, E., and Meurey, C.: Analysis of current validation practices in Europe for space-based climate data records of essential climate variables, Int. J. Appl. Earth Obs. Geoinf., 42, 150–161, https://doi.org/10.1016/j.jag.2015.06.006, 2015.
Zhang, K., Kimball, J. S., and Running, S. W.: A review of remote sensing based actual evapotranspiration estimation, Wiley Interdisciplin. Rev.: Water, 3, 834–853, https://doi.org/10.1002/wat2.1168, 2016.
Zhang, K., Zhu, G., Ma, J., Yang, Y., Shang, S., and Gu, C.: Parameter analysis and estimates for the MODIS evapotranspiration algorithm and multiscale verification, Water Resour. Res., 55, 2211–2231, https://doi.org/10.1029/2018WR023485, 2019.
Zhang, X., Wu, J., Wu, H., Chen, H., and Zhang, T.: Improving temporal extrapolation for daily evapotranspiration using radiation measurements, J. Appl. Remote Sens., 7, 073538, https://doi.org/10.1117/1.JRS.7.073538, 2013.
Scale (both spatial and temporal) is best described as a triplet of support (or grain), spacing, and extent. Support is the volume, shape, size, and orientation that a measurement represents. In the realm of RS, the spatial support of pixel values can be equivalent to the resolution of the RS image, which is the (average) size of its constituent pixels.
Diagnostic RS-ET models are static models that estimate ET at a single period of time (snapshot) using satellite data as the primary inputs for independent variables in the models.
- Abstract
- Introduction
- Theoretical frameworks
- Systematic quantitative literature review method
- Review of the methods for RS-ET uncertainty assessment
- Context of RS-ET uncertainty assessment
- Results of RS-ET uncertainty assessment
- Summary
- Data availability
- Author contributions
- Competing interests
- Disclaimer
- Acknowledgements
- Financial support
- Review statement
- References
- Supplement