the Creative Commons Attribution 4.0 License.
the Creative Commons Attribution 4.0 License.
 | 20 Dec 2023
Transpiration rates from mature Eucalyptus grandis × E. nitens clonal hybrid and Pinus elliottii plantations near the Two Streams Research Catchment, South Africa
Nkosinathi David Kaptein
Colin S. Everson
Alistair David Clulow
Michele Lynn Toucher
Ilaria Germishuizen
Pine plantations are the dominant species currently planted within the South African commercial forestry industry. Improvements in bio-economy markets for dissolving wood pulp products have seen an expansion in fast-growing Eucalyptus plantations due to their higher productivity rates and better pulping properties than pine. This has raised concerns regarding the expansion of Eucalyptus plantations and how they will affect water resources as they have been reported to have higher water use (quantified using transpiration rates) than pine. We measured transpiration rates (mm yr−1), diameter at breast height (quantified as quadratic mean diameter, Dq, m) and leaf area index of an 8-year-old Eucalyptus grandis × Eucalyptus nitens clonal hybrid (GN) and a 20-year-old Pinus elliottii. Transpiration rates were measured for two consecutive hydrological years (2019/20 and 2020/21) using a heat ratio sap-flow method, calibrated against a lysimeter. In the 2019/20 year, annual transpiration for P. elliottii exceeded GN by 28 %, while for the 2020/21 hydrological year, there was no significant difference between the transpiration of the two species, despite a 17 % and 21 % greater leaf area index for P. elliottii than GN in 2019/20 and 2020/21 measurement years respectively. Quadratic mean diameter increments were statistically similar (p > 0.05) in 2019/20, whereas the 2020/21 year produced significant differences (p<0.05). Tree transpiration is known to be influenced by climatic variables; therefore, a random forest regression model was used to test the level of influence between tree transpiration and climatic parameters. The soil water content, solar radiation and vapour pressure deficit were found to highly influence transpiration, suggesting these variables can be used in future water-use modelling studies. The profile water content recharge was influenced by rainfall events. After rainfall and soil profile water recharge, there was a rapid depletion of soil water by the GN trees, while the soil profile was depleted more gradually at the P. elliottii site. As a result, trees at the GN site appeared to be water stressed (reduced stem diameters and transpiration), suggesting that there was limited access to alternative water source (such as groundwater). The study concluded that previous long-term paired catchment studies indicate that eucalypts use more water than pine; however, periods of soil water stress and reduced transpiration observed in this study must be accommodated in hydrological models. Long-term total soil water balance studies are recommended in the same region to understand the long-term impact of commercial plantations on water resources.
- Article
(2005 KB) - Full-text XML
- BibTeX
- EndNote


The expansion of new areas of commercial afforestation in South Africa have generally slowed in recent years in favour of changing the composition of existing plantations. This decrease has been attributed to political, environmental and climate change influences (Nambiar, 2019). Pine plantations are still the dominant species in South Africa occupying approximately 49.6 % of total commercial forest plantation areas (Forestry South Africa, 2020). These plantations are mainly grown for sawlog (74.7 %) and coarse-fibre pulpwood (24.9 %). Over the years, there has been an improvement in the bio-economy market for dissolving wood pulp products such as short fine-fibre pulp. Fast-growing Eucalyptus species are now being considered an alternative to pine due to their superior fibre and pulping properties (Dougherty and Wright, 2012), short rotation (8–12 years) and high productivity rates (Albaugh et al., 2013). Eucalyptus plantation productivity can be as high as 35 m3 ha−1 yr−1 on highly productive sites compared to 25–27 m3 ha−1 yr−1 of pine (Fox et al., 2007). As a result, over the past 10 years, the areas planted to pine in South Africa have decreased by 2 % while Eucalyptus increased by 10 % (Forestry South Africa, 2020). There are now plans to replace as many as 300 000 ha of pine with Eucalyptus over the next 20 years (Forestry South Africa, 2020).
The potential for an increase in planting Eucalyptus species in South Africa may present several environmental considerations including a potential impact on biodiversity (Callaham et al., 2013) and high rates of transpiration and total evaporation (Stanturf et al., 2013). There is a wide body of knowledge indicating that Eucalyptus species transpiration is greater than pine (Scott and Lesch, 1997; Albaugh et al., 2013) and can reduce off-site water yield (Calder, 2002). Given the imminent increase in Eucalyptus plantations in the near future, it is vital to understand water use by pine and Eucalyptus. A Eucalyptus grandis versus Pinus patula comparison by Scott and Lesch (1997) on very deep soils found that E. grandis used up to 100 mm more water per year than P. patula using streamflow measurements. In contrast, White et al. (2021), reported no annual differences between water use of E. globulus and P. radiata in central Chile.
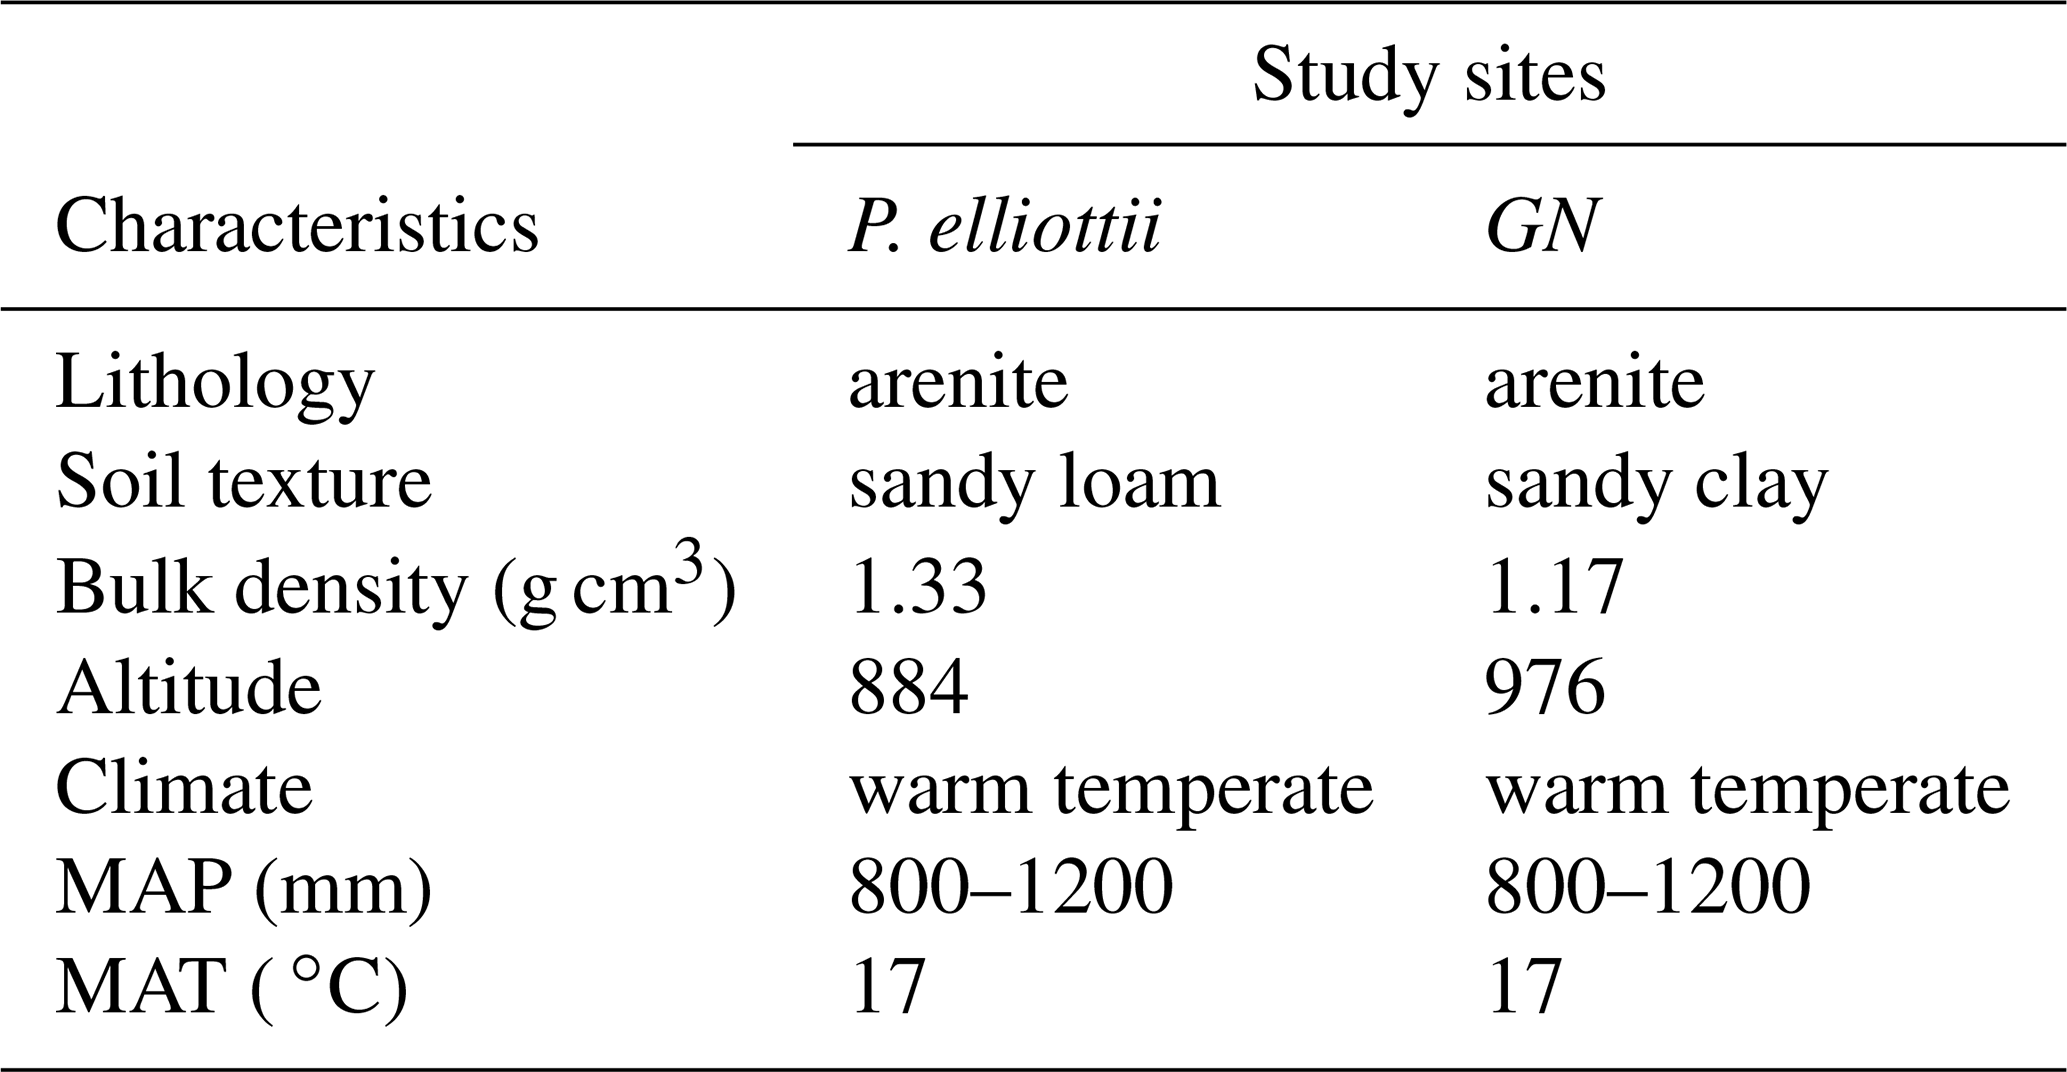
Table 1The general characteristics of the two study sites at Mistley-Canema. The abbreviations MAP and MAT denote mean annual precipitation and mean annual temperature respectively.
Pinus elliottii and E. grandis × Eucalyptus nitens clonal hybrid (GN) are the second and fourth most planted species in South Africa respectively. There is no existing literature that quantifies transpiration by these two species in South Africa and there are mixed reports in international literature. The objective of this study was therefore to measure transpiration (as an indicator of tree water use) of GN and P. elliottii plantations and the impact posed by each species on plantation water yield. In South Africa, forest companies harvest trees at an age aimed at maximising profit, with Eucalyptus species (grown for pulp) rotation generally ranging from 7 to 10 years, whereas pine (grown for sawlog) is usually 18 to 24 years (Forestry South Africa, 2020). Using an average rotation of 8.5 years for Eucalyptus and 21 years for pine, transpiration measurements in our study were conducted on an 8-year-old GN (approximately 94 % into the rotation) and 20-year-old P. elliottii (approximately 95 % into the rotation) and both species were therefore presumed to be in the same stage of development (same rotational age).
2.1 Description of study area
The study area was located on the Mistley-Canema estate (29∘12′19.78∘ S, 30∘39′3.78∘ E) in the KwaZulu-Natal midlands of South Africa, which is about 70 km north-east of Pietermaritzburg (Fig. 1). The area is generally hilly with rolling landscapes and a high percentage of arable land (Everson et al., 2014). It is dominated by forb-rich, tall, sour Themeda triandra grasslands of which only a few patches remain due to invasion of native Aristida junciformis. Soils in this area are highly leached with apedal and plinthic soil forms, mostly derived from shales (Ecca group). The area experiences mist, which could significantly contribute to overall precipitation (Mucina and Rutherford, 2006). The study site weather classification according to Köppen–Geiger climate classification (Peel et al., 2007) falls within the Cwa bioclimatic zone characterised by dry and cold winters and by warm and wet summer months (Table 1).
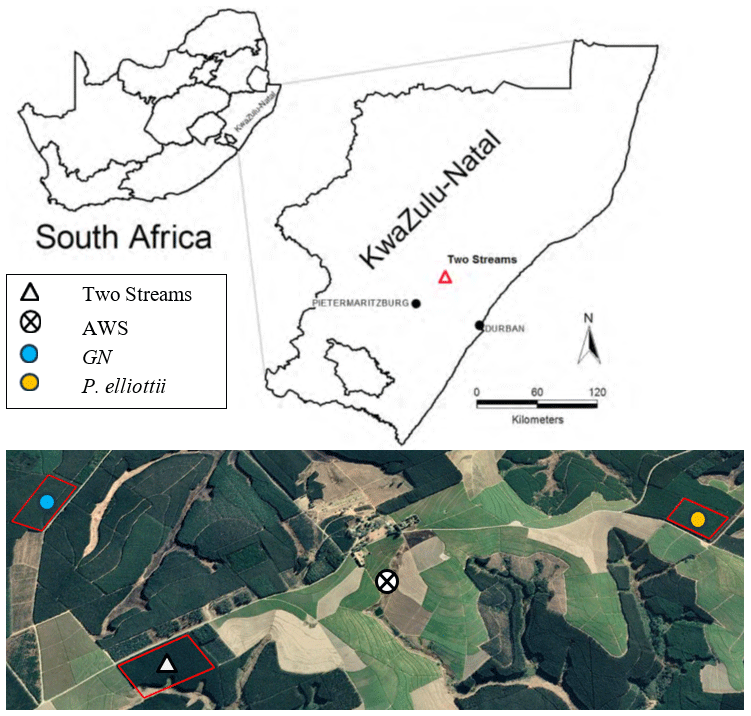
Figure 1Location of the study area next to Two Streams Research Catchment. The Google Earth Pro extract (above) provides location of the two study sites, E. grandis × E. nitens (GN) and Pinus elliottii, and the automatic weather station (© Google Maps 2022). Red lines indicate the boundaries of the compartment for each study site. Dark green vegetation indicates commercial forest plantations and light green vegetation sugarcane fields.
2.2 Site description
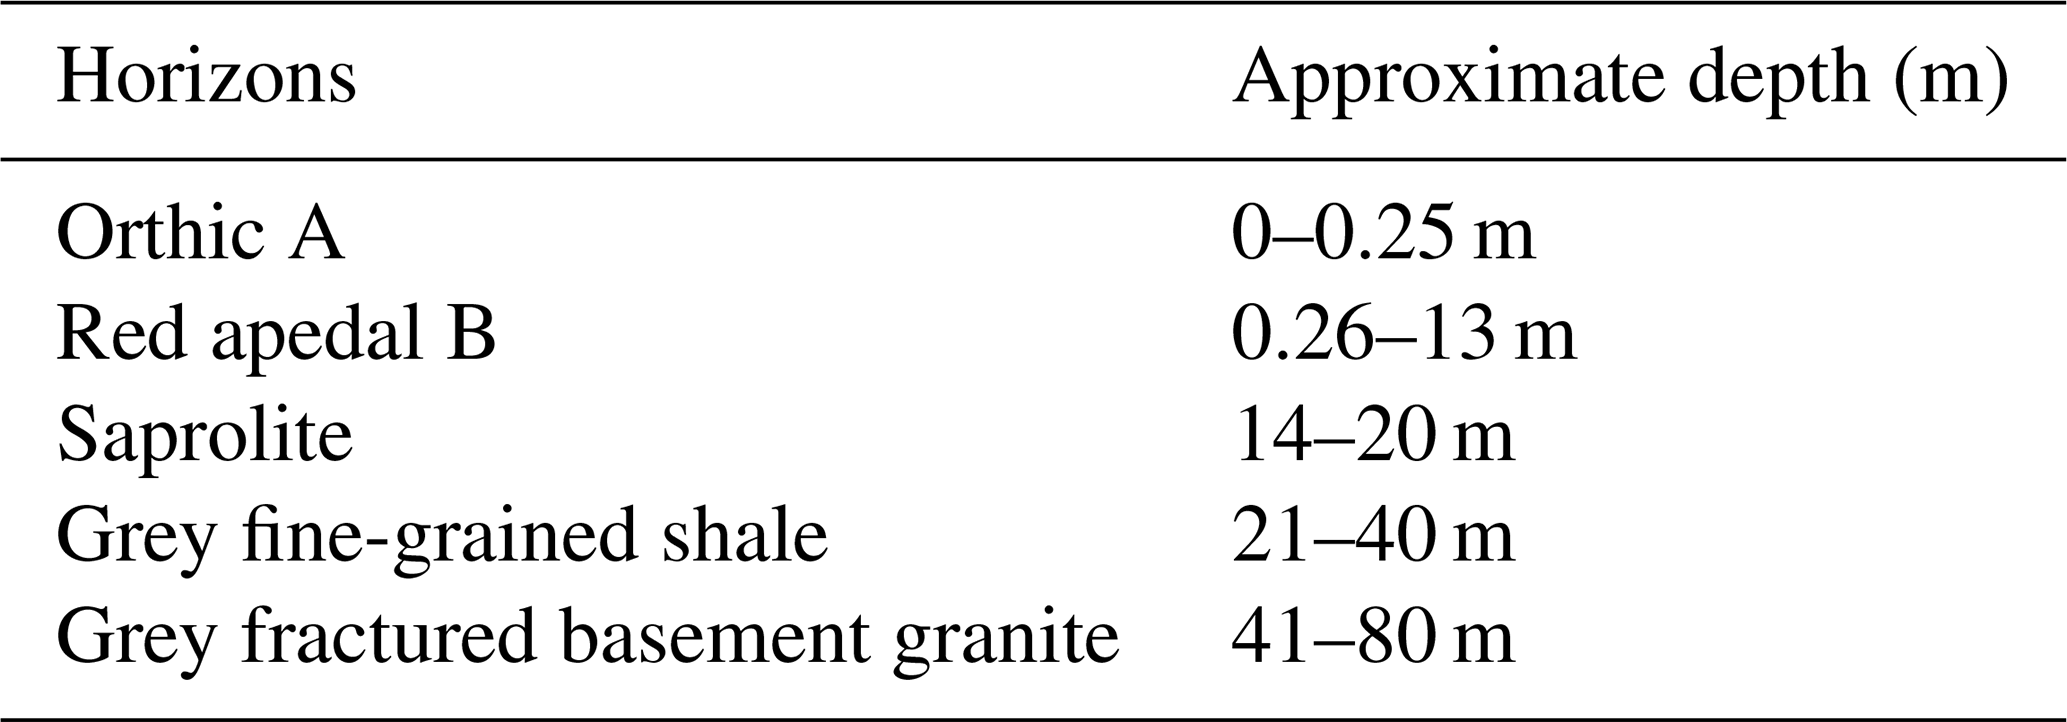
The study sites were located adjacent to the Two Streams Research Catchment used in previous (Clulow et al., 2011; Everson et al., 2014) forestry research (Fig. 1). Study site 1 was situated on the north-western side of the catchment (1.6 km away) and planted to GN in August of 2013. Study site 2 (3.5 km away from the catchment) was established in August 2001 and planted to Pinus elliottii. Soil characteristics from the Two Streams Research Catchment, which is adjacent to our study sites, are presented in Table 2 to show a general soil characteristics picture. Research by Clulow et al. (2011) and Everson et al. (2014) at Two Streams Research Catchment classified the soil profile to be as deep as 13 m (Table 2), below that consisting of a weathered bedrock (saprolite) and fractured basement rock. The soil form was classified as Hutton (Soil Classification Working Group, 1991). Study sites were 4 km away from each other with the automatic weather station located approximately equidistant between the two sites. Both GN and P. elliottii were planted at a spacing of 2 × 3 m (1667 trees ha−1). The GN trees were established using cuttings, while for P. elliottii, seedlings were used. Both study sites were subjected to standard afforestation practices such as pruning and thinning, weeding prior to canopy closure and slash removal every fifth row to minimise fire risk.
Table 2A general description of substrate (soil and geology) characteristics based on characterisation conducted at the Two Streams Research Catchment, which is adjacent to our study site (sourced from Clulow et al., 2014).
2.3 Environmental monitoring
An automatic weather station (AWS) was installed on a flat uniform grassland area in the middle of the two study sites to provide supporting meteorological measurements. Measurements of air temperature (Tair, ∘C) (HMP 60, Vaisala Inc., Helsinki, Finland), relative humidity (RH, %) (HMP60, Vaisala Inc., Helsinki, Finland), wind speed (m s−1) and direction (degrees) (Model 03003, R.M. Young, Traverse City, Michigan, USA), solar radiation (Is, MJ m−2 d−1) (Kipp and Zonen CMP3) and rainfall (mm d−1) (TE525, Texas Electronics Inc., Dallas, Tx, USA) were conducted every 10 s and output hourly. The sensors were installed according to recommendations of the World Meteorological Organisation (2010) with the rain gauge orifice at 1.2 m and the remaining sensors at 2 m above the ground surface. The CR1000 datalogger (Campbell Scientific Inc., Logan, Utah, USA) recorded 5 min outputs and was programmed to calculate the vapour pressure deficit (VPD, kPa) using Tair and RH measurements according to Savage et al. (1997).
2.4 Transpiration flux measurements
Four representative trees were selected within each study site based on diameter stratification. This was achieved by measuring 48 tree diameters at breast height (DBH, 1.3 m) using a diameter tape and stratifying the measured trees according to four size classes; small, medium, medium large and large.
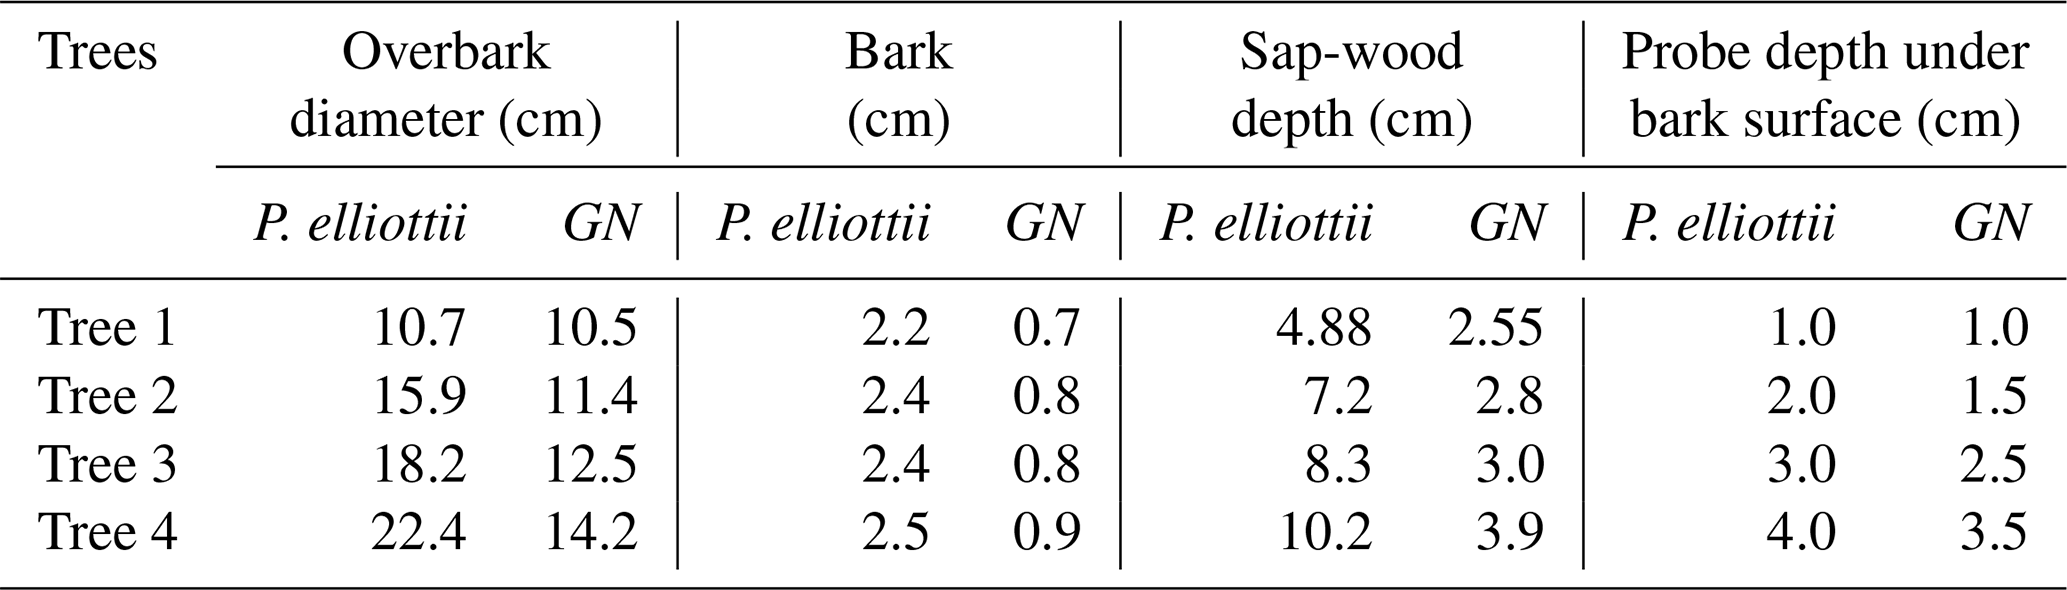
The heat ratio method of a heat pulse velocity system (HPV) (Burgess et al., 2001) was used to estimate sap flow at various depths across the sap-wood of each selected tree for the 2019/20 (October 2019 to October 2020) and 2020/21 hydrological years (October 2020 to October 2021). The HPV system consisted of a line heater probe (4 cm length and 0.18 cm outside diameter brass tubing) with an enclosed constantan filament that provides a heat source for 0.5 s when powered and a pair of type T copper-constantan thermocouples to measure the heat ratio. For Pinus elliottii trees, slightly longer heater probes (6 cm) were used due to the xylem being situated deeper. Prior to probe installation, thickness of the bark was measured, and suitable sensor insertion depth was identified using an increment borer and methyl orange staining. The thermocouples and heater probes were inserted in holes, which were made using a drill and a drill guide to ensure that holes were drilled with the correct spacing and parallel alignment. A heater probe was installed in the central hole and thermocouples installed in each of the holes up (upstream) and down (downstream) from the heater probe relative to the sap-flow direction. Probes were installed at various depths (Table 3) within a tree. Hourly measurements were executed and recorded using a CR1000 datalogger (Campbell Scientific Inc.) powered by a single 55 Ah lead acid deep cycle battery. Thermocouples were connected to an AM 16/32B multiplexer (Campbell Scientific Inc.), which was in turn connected to a datalogger (CR1000, Campbell Scientific Inc.) to allow for 32 measurements at various sap-wood depths across the four instrumented trees. Data were remotely downloaded using a GSM modem (Maestro Wireless Solutions Ltd. Hong Kong, China).
Table 3Detailed description of trees monitored on Pinus elliottii and Eucalyptus grandis × E. nitens clonal hybrid (GN) study sites.
Hourly measurements started by measuring each thermocouple 10 times for accurate initial temperatures. Following a heat pulse, the downstream and upstream temperatures were measured 40 times between 60 and 100 s. Thereafter, heat pulse velocity (Vh, cm h−1) was calculated using (Burgess et al., 2001)
where k is a thermal diffusivity of fresh wood (a nominal value of 2.5 × 10⁻³ cm2 s1), x is the distance of each temperature probe from heater probe (cm), and V1 and V2 are temperature increases in upstream and downstream probe (∘C) at equidistant points.
A slight probe misalignment may occur during the drilling process even when a drill guide is used. This was assessed by checking for inconsistencies in the zero flux values in periods where sap flow was expected to be zero, such as over pre-dawn, during rainfall events, or in high RH and low soil water content (SWC) conditions. The sap-flow values during these times were adjusted to zero, and an offset was calculated from an average of these values and applied to the whole dataset. For probes used in this study, the offset was < 5 % of the midday sap-flow rates.
The wounding and non-sap-conducting area around the thermocouples were accounted for using wound correction coefficients described by Burgess et al. (2001). Thereafter, sap velocities were calculated accounting for moisture fraction and wood density as described by Burgess et al. (2001). Finally, sap velocities were converted to transpiration rates (mm d−1) by summing products of sap velocity and cross-sectional sap-wood area for individual stems. The transpiration rates were then weighted as per individual tree contribution to provide a measure of whole stand transpiration.
2.5 Soil water content measurements
At both sites hourly SWC was measured in the upper 0.60 m of the soil profile (0.20, 0.40 and 0.60 m depth) using CS616 soil water measuring sensors (Campbell Scientific Inc.). The CS616 SWC sensor consists of two 30 cm long stainless-steel rods that use the time domain reflectometer method to measure the SWC. The sensor circuitry generates an electromagnetic pulse, of which an elapsed pulse travel time and reflection are measured and then used to calculate the SWC. Research conducted at Two Streams Research Catchment (Clulow et al., 2011; Everson et al., 2014) reported that the majority of large and fine roots were located in the top 0.06 to 0.4 m of the soil profile, hence SWC measurements were conducted in the top 0.6 m of the soil profile in our study. The SWC measurements ran concurrently with the sap-flow measurements and were recorded on a datalogger (CR1000, Campbell Scientific Inc). The profile water content at 0.6 m soil depth (PWC0.6, mm of water per 0.6 soil depth) was estimated from the SWC measurements using
where SWC0.2, SWC0.4 and SWC0.6 were the soil water content measured at 0.2, 0.4 and 0.6 m respectively.
2.6 Heat ratio technique calibration
The HPV method is an internationally recognised and reliable technique for measuring individual tree transpiration in uniform stands (Hatton and Wu, 1995; Meiresonne et al., 1995; Crosbie et al., 2007). There are however some uncertainties to the accuracy of the absolute sap-flow results, such as the anisotropic sap-wood properties (Vandegehuchte et al., 2012), radial patterns of the sap flow (Cermák and Nadezhdina, 1998), tree symmetry (Vertessy et al., 1997) and changes in spatial patterns of transpiration (Traver et al., 2010). Some studies have indicated that the technique underestimates sap flow in Eucalyptus by as much as 45 % (Maier et al., 2017; Fuchs et al., 2017), whereas pine may be overestimated by as much as 49 % (Dye et al., 1996). This necessitated a calibration experiment to validate the field measurements.
The calibration experiment was conducted in an open area at the Institute for Commercial Forestry Research nursery, located at the University of KwaZulu-Natal, Pietermaritzburg, for a period of 30 d as illustrated in Fig. 2. The 2-year-old GN and 4-year-old Pinus elliottii trees grown in 25 L plastic containers (diameter = 36 cm, height = 42 cm) filled with vermiculite were sourced from Mondi Mountain Home Estate nursery (Hilton, South Africa). The containers had holes at the base (to allow for drainage) and were placed on a rubber mat with slots to prevent root contact with soil and to allow water to drain away from the container. Twenty-four hours before starting the experiment, both trees were well watered, and each container was insulated using plastic at the tree base to prevent soil evaporation and induce water loss solely through transpiration. Tree diameters at the start of the experiment were 0.044 and 0.036 m for GN and P. elliottii respectively. Each tree was instrumented with HPV sensors to measure hourly sap flow (as discussed in Sect. 2.4) and summed from sunrise to sunset to make up daily tree transpiration (L d−1). Concurrently, each soil container was weighed in the morning and afternoon, using a lysimeter (resolution = 0.001 g, placed on a flat concrete surface to ensure it remains level during the experiment) to determine daily changes in container weight (where 1 kg was assumed to be equivalent to 1 L) as a measure of transpiration. This process was repeated for 5 days to get a calibration over a range of plant available water values, whereafter trees were again well watered (achieved by removing plastic insulation) and allowed to drain completely before restarting measurements. Sap-wood area and wounding was accounted for according to Burgess et al. (2001) to derive daily transpiration. A simple regression was conducted between daily transpiration and daily change in tree mass.
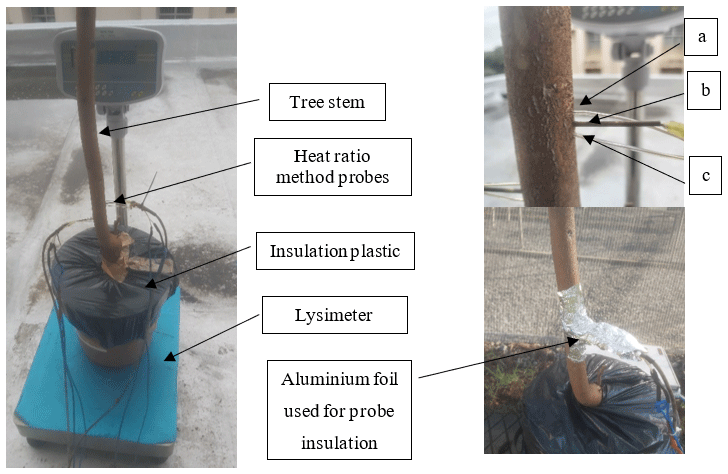
Figure 2An illustration of a calibration experiment setup showing a tree installed with the heat ratio probes, placed in a lysimeter. Insert: a = downstream probe, b = heater probe, c = upstream probe, with aluminium foil used for insulation.
2.7 Growth measurements
Measurements of DBH were conducted monthly using manual dendrometer bands (D1, UMS, Munich, Germany) permanently attached to a tree, with an accuracy of 0.1 mm. Dendrometer bands were installed at beginning of October 2019 on 48 trees including the four HPV instrumented trees and data were manually collected for 21 months. The quadratic mean diameter (Dq) was calculated for 48 trees using (Curtis and Marshall, 2000)
where d is the DBH (m) of an individual tree and n is the total number of trees. Tree heights for the 48 trees were measured simultaneously using a hypsometer (Vertex Laser VL402, Haglof, Sweden). Monthly measurements of leaf area index were conducted using an LAI-2200 Plant Canopy Analyzer (Licor Inc., Lincoln, New York, USA) on a 0.6 ha transect that was identified through the middle of each study site from October 2019 to October 2021.
2.8 Statistical analysis
Analysis of variance (ANOVA) was used to analyse species differences in stand characteristics (transpiration, Dq, tree heights and leaf area index) using the R version 3.6.1 statistical package. Variables were transformed as appropriate to meet the assumptions of normality. Where the overall F-statistic was significant (p<0.05), treatment means were compared using Fisher's least significant difference at the 5 % level of significance (LSD5 %). Statistical parameters that were used included the regression co-efficient (R2), root mean square error (RMSE), standard error of a regression slope (SE slope), standard error of the intercept (SE intercept) and a ratio of variance of y intercept to x intercept (F). In addition, a random forest (RF) regression algorithm (Breiman, 2001) in R statistical computing software (R Development Core team, 2008) was used to rank climatic variables that influence transpiration, where transpiration was made a response variable and meteorological data (Is, VPD, SWC, Tair, rainfall, wind speed and RH) predictor variables. This machine learning approach does not make the assumptions of linear regression and performs well when the relationship among the response variable and independent variables are complex and non- linear. The RF regression model was optimised in terms of the parameters ntree (number of trees built by the model) and mtry (number of variable predictors used at each node split using the Caret package) (Kuhn, 2008). The RF regression was evaluated using the R2 metric and the contribution of each variable to the model accuracy was determined by developing a variable importance plot. The variable importance was calculated from the out-of-bag (OOB) samples. Using a bootstrap sample with replacement, two-thirds of the original dataset are used to train individual trees in the ensemble, whereas the remaining one-third of a sample is used for determining ranked variable importance, providing a measure of accuracy (Breiman, 2001). In this study, the two-thirds of the dataset for each measurement period were used for calibrating and validating the model, while the one-third was used for testing the model. The variable importance plot was assessed using the mean decrease accuracy (MDA) coefficient measures (Breiman et al., 1984). The MDA is calculated during the OOB sample computation phase. The values of a particular variable are randomly permuted on the OOB sample, enabling the new classification to be determined from the modified sample. For more details on how MDA is quantified, see Cutler et al. (2007) and Aria et al. (2021). The difference between the rate of misclassification for the modified sample and the original sample is used as a measure of the variable importance. Each predictor variable was scored based on the MDA for GN and P. elliottii measurement period.
3.1 Automatic weather station
The minimum and maximum daily Tair were typical of the 30-year average of Mistley-Canema. Maximum recorded Tair was 36.5 and 37.5 ∘C for 2019/20 and 2020/21 hydrological years respectively. There were several days where Tair were below freezing between May and July for both measurement years (Fig. 3a). Total annual rainfall for the 2019/20 (1 October 2019 to 30 September 2020) and 2020/21 (1 October 2020 to 30 September 2021) seasons amounted to 857 mm and 825 mm respectively. The majority of this rainfall (70 %) fell during summer months (November to March) for both years (Fig. 3d). By comparison, potential evaporation totals calculated using hourly AWS data and the FAO56 method (Allen et al., 1998) amounted to 1100 and 1056 mm for 2019/20 and 2020/21 hydrological years respectively. Daily maximum VPD was 3.08 kPa for 2019/20 increasing to 3.53 kPa for 2020/21 year during hot summer months (Fig. 3c). Monthly average wind speed ranged from 2.2 to 7.7 m s−1 over the two hydrological years with maximum wind speeds up to 37 m s−1 in August/September. The RH reached 100 % during the night, decreasing to as low as 20 % during the day on hot summer months. Average Is for 2019/20 and 2020/21 hydrological years was 15.5 and 16 MJ m−2 d−1 respectively, while both years experienced a maximum Is of 30 MJ m−2 d−1 in summer (Fig. 3b).
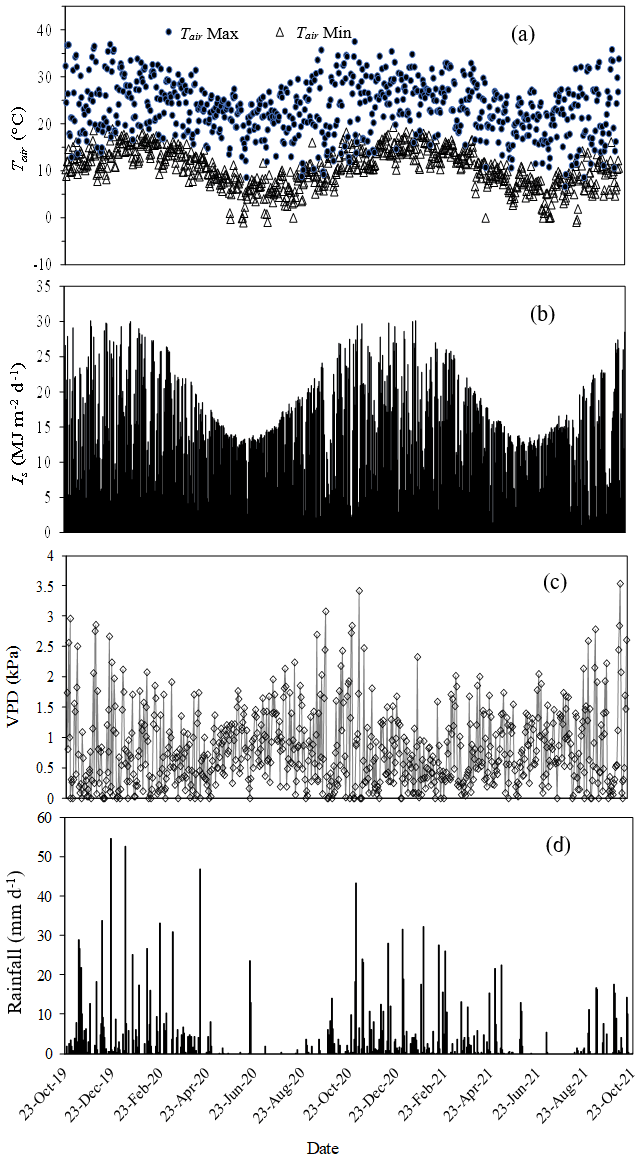
Figure 3(a) The daily minimum (Tair Min) and maximum (Tair Max) air temperature (∘C), (b) daily total solar irradiance (Is, MJ m−2 d−1), (c) daily mean vapour pressure deficit (VPD, kPa) and (d) total daily rainfall (mm d−1) for the period October 2019 to October 2021.
3.2 Soil profile water content
The PWC0.6 was very responsive to rainfall events (Figs. 4 and 7a) on both study sites. The peak PWC0.6 for the GN site during the wet season was 227 and 198 mm d−1 in 2019/20 and 2020/21 hydrological years respectively. By comparison, the maximum measured PWC0.6 in the P. elliottii site was 128 mm d−1 in 2019/20 and 125 mm d−1 in 2020/21. The PWC0.6 at both study sites did not significantly respond to rainfall events below 5 mm h−1, except during consecutive rainfall events. After a significant rainfall event, the PWC0.6 for the GN site was depleted rapidly, within hours (Figs. 4 and 7a), which contrasts with the P. elliottii site, where PWC0.6 was depleted more gradually, lasting for a few days after the rainfall event. The swift depletion of plant available water at the GN site resulted in the site experiencing extended periods of low-profile water content. During the dry season, the PWC0.6 was maintained at approximately 50 and 60 mm d−1 for P. elliottii and GN (Fig. 7b) respectively, except when significant rainfall events occurred.
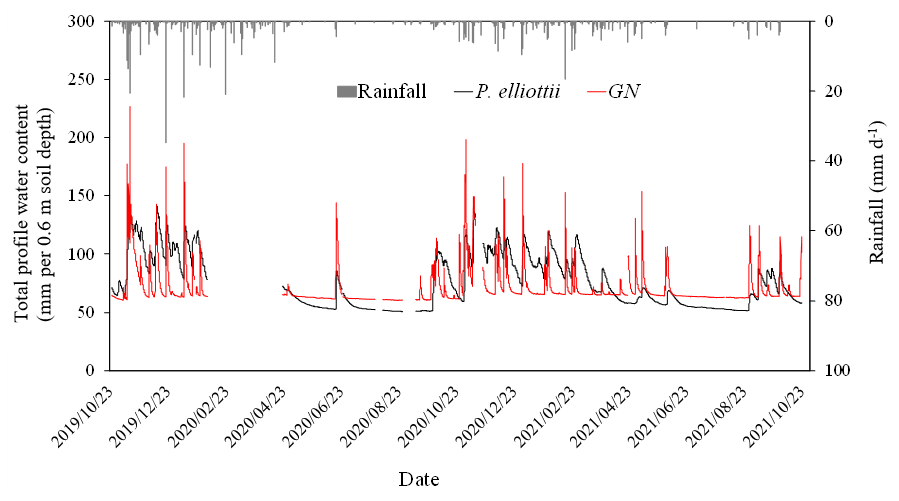
Figure 4The total profile water content (mm d−1) measured in the top 0.6 m of the soil profile in the Pinus elliottii and Eucalyptus grandis × E. nitens clonal hybrid sites in response to rainfall events (mm d−1) during the period October 2019 to October 2021. A gap in the graph indicates missing data.
Commercial forest plantations are known to have a very deep rooting system and are able to access soil water in deeper soil water reserves (Christina et al., 2016). A study adjacent to our study site (Everson et al., 2014) reported that Acacia mearnsii tree roots were as deep as 8 m into the soil profile. Similar results were reported by Dye (1996) in the Mpumalanga province of South Africa, where Eucalyptus grandis trees abstracted water down to 8 m below the soil surface. The deep soil profile with the presence of weathered bedrock (saprolite) in our study site suggests that trees were capable of rooting as deep as 20 m into the soil profile and were probably restricted by the bedrock (grey fine-grained shale). However, Hasenmueller et al. (2017) indicated that shale may consist of fractures which tree roots may grow through. There is, therefore, a high possibility that tree roots in this study accessed soil water stored deep in the soil profile from previous wet years.
3.3 Heat ratio calibration
The HPV system slightly overestimated transpiration (in the case of the GN) and underestimated transpiration (in the case of the P. elliottii) when compared to a lysimeter system. A simple regression between the two systems produced a good linear relationship (GN: R2= 0.73, P. elliottii: R2= 0.76) for both tree species (Fig. 5a and b), with an RMSE of 0.57 and 0.36 L d−1 for the GN and P. elliottii respectively. This relationship was used to correct the transpiration results for both tree species:
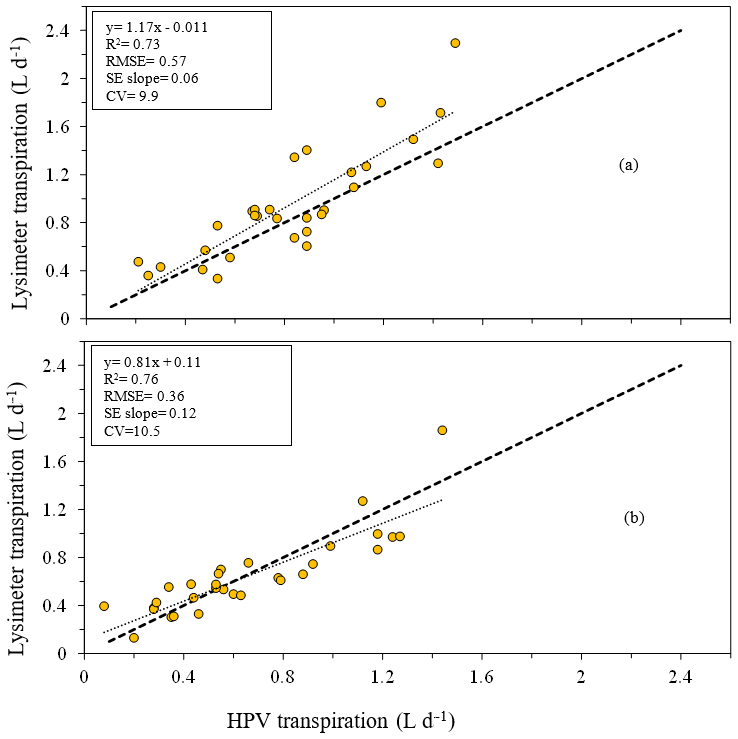
Figure 5Relationship between daily transpiration measured using a heat ratio technique (HPV, L d−1) and the transpiration measured using a lysimeter (through a change in mass, L d−1) for (a) 2-year-old Eucalyptus grandis × Eucalyptus nitens clonal hybrid and (b) 3-year-old Pinus elliottii. The equation of the regression line, regression coefficient (R2), root mean square error (RMSE), standard error of the regression slope (SE slope) and coefficient of variation (CV) for each species are presented. The dashed line is the 1:1 line.
3.4 Transpiration rates
The transpiration followed typical seasonal and diurnal patterns for both sites in both 2019/20 and 2020/21 hydrological years (Fig. 6). Pinus elliottii had significantly (p<0.01) higher mean daily transpiration compared to GN (Fig. 6) except for the winter of 2021 (May to August), where GN was statistically (p= 0.012) greater. Mean daily transpiration values in summer of 2019/20 for Pinus elliottii and GN were 2.5 and 1.9 mm d−1 respectively. By comparison, summer mean transpiration values of 2020/21 were 2.6 mm d−1 for P. elliottii and 2.1 mm d−1 for GN (p<0.05). After a significant rainfall event (∼ 5 mm h−1), transpiration for GN momentarily exceeded P. elliottii for a few days, thereafter, falling below P. elliottii again. The maximum transpiration for GN was 5.2 and 3.8 mm d−1 for 2019/20 and 2020/21 measurement years respectively versus 5.6 mm d−1 for P. elliottii in both seasons. During 2019/20, GN reached peak transpiration rates early in summer (late December 2019) compared to P. elliottii, where peak transpiration rates were measured in late January to early February of 2020 (Fig. 6). However, maximum transpiration rates were reached mid-January for the 2020/21 measurement year by both crops, which coincided with high Is, Tair and VPD. During winter months (June to July) of both the 2019/20 and 2020/21 hydrological years no transpiration could be detected by probes on GN trees on several days, despite clear weather conditions. This corresponded with low PWC0.6 (approximately 60 mm per 0.6 m soil depth). By comparison, transpiration could be measured in P. elliottii trees where the PWC0.6 was low (∼ 50 mm d−1 per 0.6 m soil depth), although at very low transpiration rates (∼ 0.33 mm d−1). Following rainfall, the P. elliottii response to PAW lagged behind the GN trees. While GN transpiration increased almost immediately, P. elliottii transpiration only responded a few days later (Figs. 7a and 8).
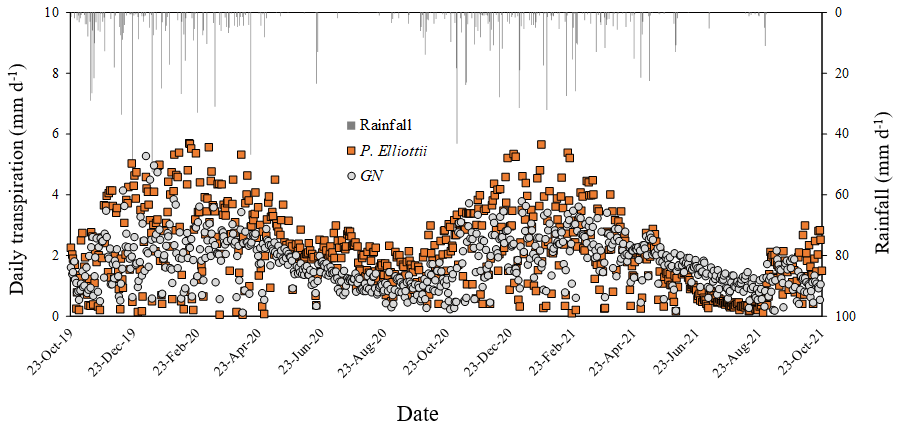
Figure 6Mean daily transpiration (T, mm d−1) and corresponding rainfall (mm d−1) in an 8-year-old E. grandis × E. nitens clonal hybrid (GN) and 20-year-old P. elliottii trees for the period October 2019 to October 2021. Each point is a mean of four trees.
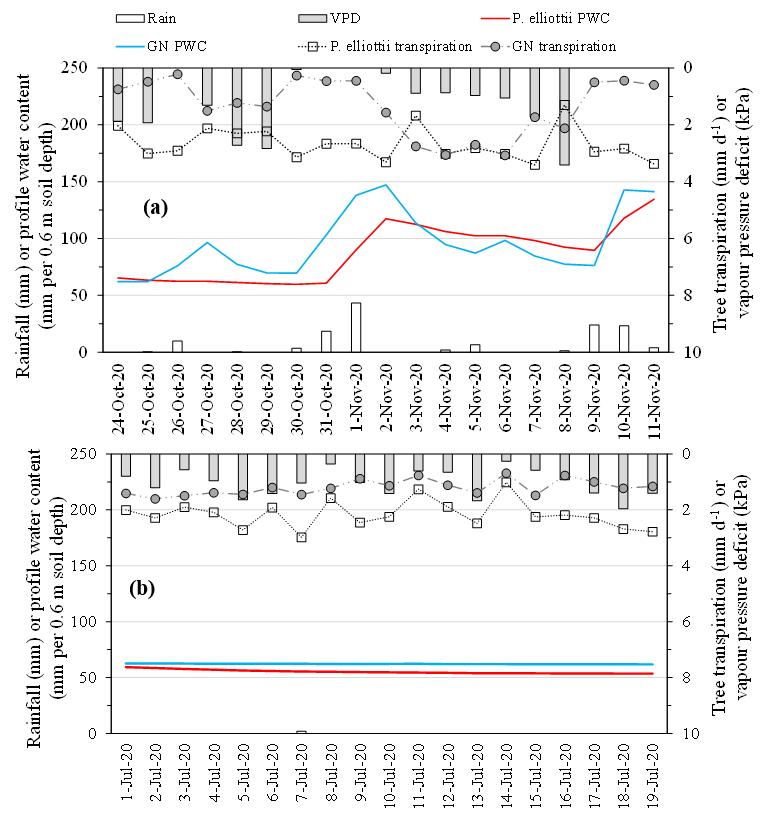
Figure 7Daily tree transpiration (mm) of P. elliottii and Eucalyptus grandis × E. nitens clonal hybrid (GN) with corresponding daily rainfall (mm d−1), daily vapour pressure deficit (kPa) and daily profile water content (PWC, mm 0.6 m−1 soil depth) over (a) a representative period in the summer season (24 October to 11 November 2020, the wet season) and (b) a representative period in the winter season (1 to 19 July 2020, the dry season).
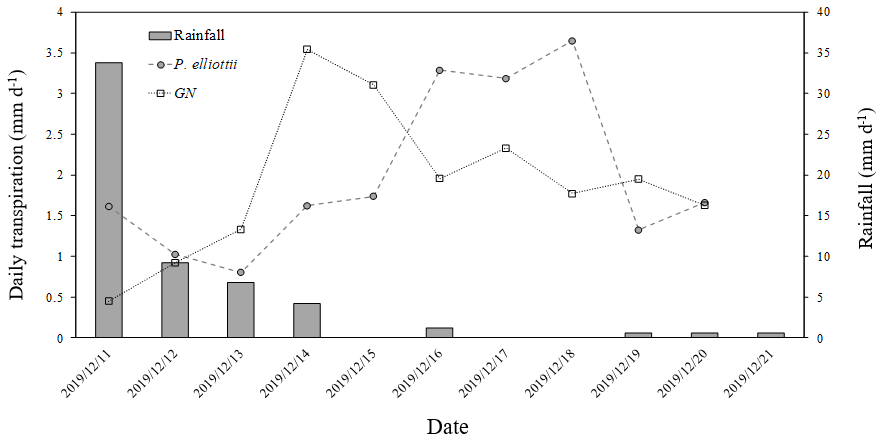
Figure 8Ten-day daily transpiration (mm d−1) for 20-year-old P. elliottii and 8-year-old Eucalyptus grandis × Eucalyptus nitens clonal hybrid (GN) with corresponding rainfall (mm d−1) showing transpiration response of each species to rainfall.
The differences in seasonal patterns of transpiration are illustrated using daily accumulated transpiration (Fig. 9). Over the 2019/20 measurement year, the total accumulated daily transpiration for P. elliottii was 30 % greater than GN. The total accumulated transpiration rate of P.elliottii was also higher in 2020/21 but statistically similar (p>0.05). Total annual transpiration rates for GN were slightly higher in 2020/21 than 2019/20 measurement years (6 %), while P. elliottii transpiration rates reduced by 19 % over the same period (Fig. 9). The accumulated rainfall was 18 % and 20 % greater than transpiration for P. elliottii and GN respectively, while the accumulated potential evaporation exceeded rainfall by 22 % in both seasons.
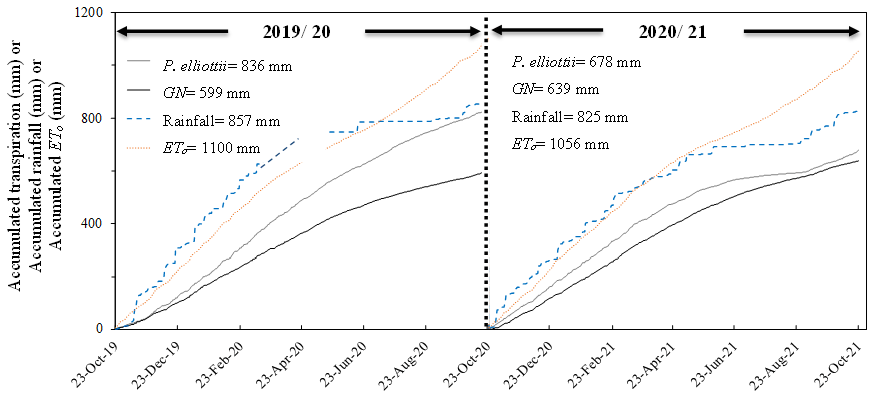
Figure 9The accumulated transpiration (T, mm), rainfall (mm) and FAO reference evaporation (ETo, mm) for 2019/20 hydrological year (October 2019 to October 2020) and 2020/21 hydrological year (October 2020 to October 2021).
3.5 Influence of climatic variables on tree transpiration
The RF model performed well in ranking climatic variables influencing transpiration for both species, producing an overall coefficient of determination (R2) of 0.91 and 0.85 for GN and P. elliottii respectively. The overall root mean square error was 0.58 mm for GN and 0.9 mm for P. elliottii, indicating a very good predictive power. The RF predictive model rated SWC measured at 40 cm depth and SWC measured at 60 cm depth as the most important influencers of transpiration for GN and P. elliottii respectively (Fig. 10). The climatic variables Is, VPD and Tair in descending order of importance were also scored as important in GN, whereas in P. elliottii, soil water content measured at 40 cm, VPD and Is were found to be important variables (Fig. 10). Rainfall was found to be the least important variable in a model in P. elliottii, while wind speed was not a good influencer of transpiration in GN. The model indicated that transpiration is influenced by micrometeorological variables at varying levels of influence.
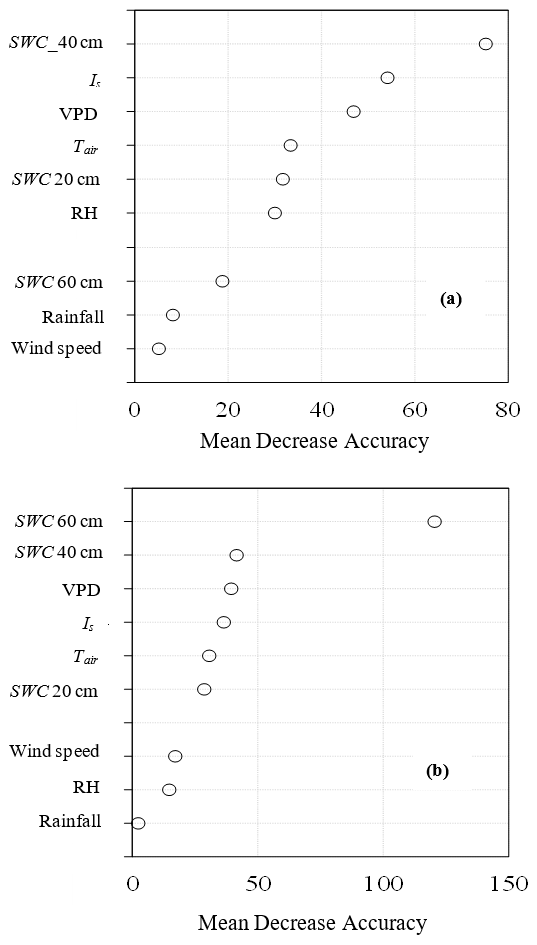
Figure 10Variable importance plots of (a) Eucalyptus grandis × E. nitens (GN) and (b) Pinus elliottii from the random forest regression model using solar radiation (Is), vapour pressure deficit (VPD), air temperature (Tair), relative humidity (RH), wind speed, rainfall and soil water content measured at 20 cm depth (SWC 20 cm), 40 cm depth (SWC 40 cm) and 60 cm depth (SWC 60 cm). Mean decrease accuracy is a measure of how much the model error increases when a particularly variable is randomly permuted.
3.6 Tree growth
At the beginning of the study, P. elliottii trees were larger in diameter than GN. There was a seasonal pattern in Dq increment in both species (Fig. 11), with no significant (p> 0.05) differences in 2019/20, while 2020/21 showed a significantly (p<0.05) greater growth increment in P. elliottii than GN. Interestingly, a negative growth increment was measured during the winter of 2019/20 for GN, which was probably caused by low PWC0.6.
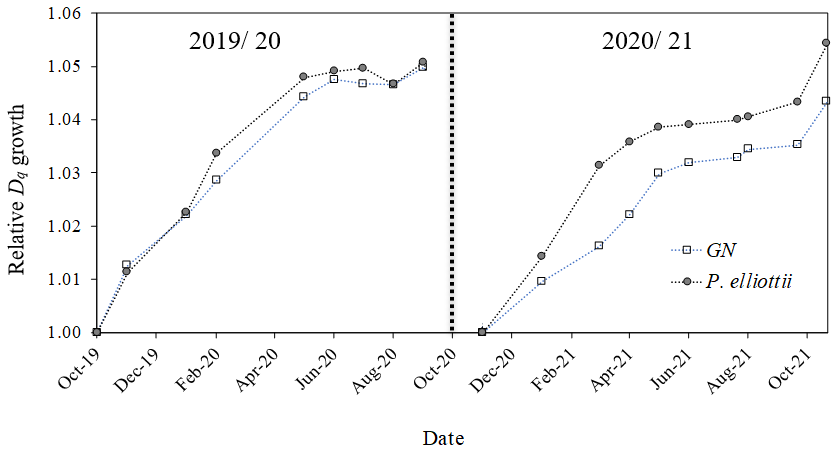
Figure 11Relative quadratic mean diameters (Dq, normalised) measured using manual dendrometer bands for Eucalyptus grandis × E. nitens (GN) and Pinus elliottii. Measurements were conducted in two hydrological years, 2019/20 (October 2019 to October 2020) and 2020/21 (October 2020 to October 2021). Each point represents an average of 48 trees for each species.
3.7 Leaf area index
The mean summer leaf area index for P. elliottii was 17 % greater than GN (P. elliottii = 2.5 versus GN = 2.05, p<0.05) in 2019/20 increasing to 21 % (P. elliottii = 3.1 versus GN = 2.4, p<0.05) in 2020/21. Winter leaf area index decreased to 1.31 and 1.76 for P. elliottii and GN respectively. Total monthly transpiration was linearly related to monthly leaf area index of both P. elliottii and GN (Fig. 12), with statistical differences in the regression (p< 0.05). However, there was a greater RMSE, SE intercept and SE slope in P. elliottii than in GN, indicating that the regression line in GN fits the data better than P. elliottii and that GN has more precise prediction of transpiration from leaf area index than P. elliottii.
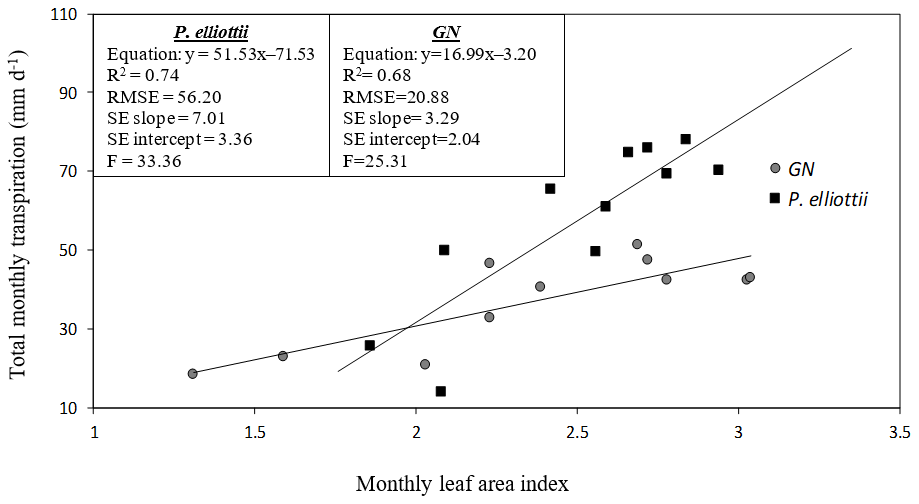
Figure 12A linear relationship between total monthly transpiration (T, mm d−1) and monthly measured leaf area index (LAI) for Eucalyptus grandis × E. nitens clonal hybrid (GN) and Pinus elliottii. The equation of the regression line, regression coefficient (R2), root mean square error (RMSE), standard error of the regression slope (SE slope), standard error of the y intercept (SE intercept) and ratio of variance (F) for each species are presented.
4.1 Daily transpiration
The P. elliottii mean daily transpiration exceeded GN in 2020/21 measurement years, mainly influenced by SWC, VPD and Is. Differences in transpiration between GN and P. elliottii may be attributed to the following: (1) trees at the GN site were water stressed and evidence of water stress was observed through shrinking of tree stem diameters during winter, zero rates of transpiration on some days during winter months and a significant decrease in leaf area index over winter. This suggests that trees were unable to access soil water stored from previous wet years held deep in the soil profile or the GN trees had already accessed and depleted the stored soil water before the study period. Eucalyptus transpiration has been shown to increase sharply in the early stages of growth, reaching a peak in the middle of the rotation, thereafter, declining as the stand matures (Delzon and Loustau, 2005). (2) Sap-wood for P. elliottii was nearly twice the sap-wood area of GN due to the different tree structures. The GN mean transpiration ranges of 0.9–5.2 and 0.5–3.8 mm d−1 for 2019/20 and 2020/21 respectively measured in this study agreed with Eucalyptus studies in relatively low rainfall areas with trees of the same age. For example, a study by Forrester et al. (2010) on 7-year-old E. globulus in Australia measured a transpiration range of 0.4–1.9 mm d−1 (MAP = 708 mm). David et al. (1997) measured daily transpiration of 0.5–3.64 mm d−1 at a E. globulus site in Portugal with a MAP of 600 mm. A South African study by Dye (1996) on 9-year-old E. grandis in Mpumalanga, South Africa, measured transpiration of 2.0–7.5 mm d−1 with the potential to exceed 8.0 mm d−1 under high VPD (Dye, 2013); however, this study was conducted in a high rainfall area (MAP = 1459), with almost double the MAP of the current study. For P. elliottii, peak transpiration of 5.6 mm d−1 in this study agreed with other studies, such as Hatton and Vertessy (1990), who measured a maximum transpiration of 5 mm d−1 in P. radiata in New South Wales, Australia.
During summer, GN transpiration peaked earlier than the P. elliottii (more distinct in 2019/20) and then decreased swiftly so that it was less than the P. elliottii transpiration in the late summer to early autumn. In addition, the GN transpiration increased sharply after the rainfall events and thereafter decreased as PWC0.6 was rapidly depleted, while P. elliottii responded more gradually. This suggests that GN trees have a different growth and water-use strategy than P. elliottii, that involves using available water rapidly. A similar observation was reported by White et al. (2021) from E. globulus in central Chile. This implies that GN trees compete for water and use it more rapidly when it becomes available, and this strategy can expose them to extreme water stress if soil water deficit conditions persist, as reported by Mitchell et al. (2013). P. elliottii had a greater transpiration and stem sizes similar to the GN (i.e. Dq for smallest P. elliottii tree versus Dq for largest GN tree). This may be attributed to a markedly smaller heartwood in P. elliottii than GN. However, it should be noted that pine trees consist of several latewood rings in which no sap movement occurs (Dye et al., 2001). Diurnal changes in transpiration typically lagged behind VPD, creating a pattern of hysteresis, where at similar VPD, transpiration was greater in the morning than in the afternoon for GN. Studies by O'Grady et al. (1999) and Maier et al. (2017) attributed this to low soil hydraulic conductivity or the use of stored stem water for transpiration in the first portion of the day. Further analysis in our study indicated that GN transpiration was significantly influenced by VPD only in summer, suggesting that soil water deficit may have affected soil water uptake to a greater extent in the dry season (winter).
4.2 Annual T
On an annual basis, P. elliottii trees transpired 28 % more water (836 mm) than GN (599 mm yr−1) in 2019/20, while the 2020/21 saw no significant differences between the two species (P. elliottii = 678 mm yr−1 versus GN = 639 mm yr−1). The low rates of transpiration in winter months (May to August) of 2021 at the P. elliottii site (Fig. 6) were caused by low SWC, which resulted in similar annual transpiration rates in 2020/21 of both species. Other studies of pines (Moran et al., 2017; Samuelson et al., 2019) reported that the first reaction by pine species to a decrease in SWC is a significant reduction in stomatal aperture, causing a decrease or cessation of transpiration. By comparison, GN indicated a different response, where transpiration continued (even when SWC was marginally limiting) to a point where it was below detection by our HPV system, and this trait makes eucalypts vulnerable during extended or severe drought periods. South African studies (Dye et al., 1996, and Eksteen et al., 2013) using E. grandis crop showed that trees utilised SWC until the permanent wilting point, which seems to be well beyond the −1500 kPa typically cited in literature for many plants (Santra et al., 2018). An international study by White et al. (1999) found similar results in E. nitens in western Australia.
There are contrasting results in some annual comparative studies of transpiration between Eucalyptus and Pinus species. In a comparative water-use study of 8-year-old E. benthamii versus P. taeda in the United States (Maier et al., 2017), annual transpiration of 1077 and 733 mm yr−1 for E. benthamii and P. taeda respectively was found. In a South African study (tree water use estimated using water balance), Eucalyptus grandis used 100 mm more water per year than Pinus patula (Scott and Lesch, 1997). Notwithstanding these findings, another study in south-eastern Australia, Benyon and Doody (2015) found no significant differences in annual water use (only transpiration was measured) between E. globulus and P. radiata, with or without access to groundwater. A most recent study by White et al. (2022) using meta-analysis of published evapotranspiration estimates found no significant differences in water use between Eucalyptus and Pinus genera. Like other studies (Whitehead and Beadle, 2004; Samuelson et al., 2008), a strong correlation between transpiration and tree leaf area was observed in this study, with P. elliottii having a greater transpiration rate than GN at a similar leaf area index. This good correlation may present a modelling opportunity to estimate transpiration using site measurements of leaf area index or remote sensing estimates of leaf area index.
4.3 Response of tree transpiration to climatic variables
Conventional micrometeorological techniques of estimating transpiration (such as heat pulse velocity) in commercial forest plantations are not easy to conduct due to the remote and inaccessible nature of forest plantations, vulnerability of instrumentation to damage by animals and the threat posed by extreme weather events. In addition, this instrumentation is very expensive, requires technical skills to use and provides measurements on few trees within a stand. An improved technique for estimating transpiration from easy to measure variables would be an advantage. There are many external regulators that have been described to have a strong relationship with transpiration, which includes readily available soil water in the rooting area (Oren and Pataki, 2001), the atmospheric micrometeorological conditions (Lundblad and Lindroth, 2002) and aerodynamic resistance (Hall, 2002). However, these relationships are complex because exotic trees can have several internal mechanisms, which can vary between species, tree age and tree physiology (Zweifel et al., 2005). Nevertheless, in most actively growing tree species, there is a consensus that certain meteorological variables can influence transpiration (Albaugh et al., 2013).
Results from regression analysis using RF showed that SWC, VPD and Is have a significant influence on transpiration, in a decreasing order of importance for both species. These results were expected as other studies have shown that tree transpiration is influenced by SWC (Dye, 1996; Maier et al., 2017), VPD (Dye and Olbrich, 1993; Scott and Lesch, 1997; Campion et al., 2004; Albaugh et al., 2013) and Is (Zeppel et al., 2004; Albaugh et al., 2013). For example, in South African studies by Dye (1996) and Dye et al. (2004), E. grandis daily water use exceeded 90 L d−1 (equivalent to 7 mm d−1) on hot dry days in the middle of summer (when SWC was not limiting) and then declined during the dry season as temperatures decrease and the photoperiod shortened. Rainfall was found to be a weak influencer of tree transpiration, which could be linked to high rate of rainfall interception reported in commercial forests of 14.9 % for Eucalyptus and 21.4 % for pine of gross precipitation (Bulcock and Jewitt, 2012). These results suggest that certain climatic variables can be used as an input in commercial forest plantation models to improve estimation of tree water use.
4.4 Implications of tree water use on water yield
Forest plantation water-use studies and their potential impact on water resources are complex and require comprehensive long-term measurements of total water balance parameters to be conclusive. Our results indicated that P. elliottii water use was significantly greater than GN in 2019/20, while 2020/21 water-use patterns were statistically similar. These year-on-year differences have been attributed to low SWC and plant stress reducing the accumulated GN transpiration. However, this result is in contrast with most long-term studies, which indicate that GN uses more water than P. elliottii. It is clear that the implications over a full rotation or over several rotations cannot be quantified from such short-term studies as this study here. In particular, lags that occur in hydrology between rainfall, changes in groundwater and streamflow have been reported to exceed the time period of this study and will be poorly captured. There are several long-term paired catchment studies conducted in South Africa (van Lill et al., 1980; Smith and Scott, 1992; Scott and Lesch, 1997; Scott and Smith, 1997; Scott et al., 2000) that have compared water use between pine and Eucalyptus and quantified the impact of these species on water resources, particularly the streamflow. A study by Scott and Lesch (1997) on the streamflow response to afforestation with E. grandis and P. patula in Mokobulaan experimental catchment in South Africa indicated that eucalypts cause a faster reduction in streamflow (90 %–100 %) compared to afforestation with pines (40 %–60 %). These results were verified in a study conducted by Scott et al. (2000) where peak reductions in streamflow were reported between 5 and 10 years after establishing eucalypts and between 10 and 20 years after planting pines, with the size of the reduction driven by soil water availability. Another South African study by Smith and Scott (1992) investigated the impact of pine and eucalypts on low flows in various paired catchments located in various regions of South Africa (Westfalia Estate, Cathedral Peak, Jonkershoek, Mokobulaan). Results from this study showed that afforestation has a significant effect on low flow in all paired catchments (low flows reduced by up to 100 % in certain cases), with eucalypts having a severe impact compared to pine. Results from our GN study site indicated that the site was likely water stressed, suggesting that trees were probably unable to access soil water stored from previous wet years held deep in the soil profile. Afforestation with commercial forest plantations over successive rotations have been shown to deplete soil water reserves within the profile, leading to increased soil water deficit (Dye et al., 1997) and ultimately reduction in streamflow. Evidence of this was shown in a paired catchment experiment by Scott and Lesch (1997) where eucalypts were clear-felled at 16 years of age but full perennial streamflow returned 5 years later. The delay in streamflow recovery was attributed to eucalypts desiccating the deep-water reserves, which had to be restored before the stream could return to a normal flow.
All of the above-mentioned South African long-term paired catchment studies suggest that commercial forest plantations, particularly Eucalyptus, pose a severe negative impact on water yield. Results from our study indicated that P. elliottii used more water than GN over the first year of measurement due to limited soil water availability and that a conclusive impact on water reserves cannot be quantified without long-term measurements of at least one crop rotation. This relatively short-term study did however show that commercial forest plantations may deplete soil water stored within the soil profile during dry periods, resulting in potential streamflow reduction over the long term. Due to climate variability in plantation forest areas, long-term studies under non-stressed and stressed conditions are needed in this region to quantify the total water balance (total evaporation, surface runoff, soil water storage and how water partitioning responds to climate change and afforestation over time).
This paper presents a water-use study of GN and P. elliottii near the Two Streams Research Catchment in the KwaZulu-Natal midlands of South Africa, quantified using the heat ratio method (HRM). A calibration of the method was conducted and is recommended for this technique to achieve improved accuracy. Annual water-use results indicated that P. elliottii used 28 % more water than GN in the first measurement year (2019/20), while there were no significant differences in tree transpiration in the second year of measurement (2020/21). These findings contrast with most long-term paired catchment studies in South Africa and internationally, which reported that Eucalyptus species are heavy water users compared to pine and that both species cause negative impacts on the water yield. This relatively short-term study showed the different responses of the tree species to changes in season and available soil water, with GN generally responding more rapidly. It also showed that in countries such as South Africa, where streamflow reduction by commercial forestry is modelled for water licensing purposes, soil water stress in the hydrological models must be able to constrain tree water use. Long-term research is suggested to quantify the total water balance (total evaporation, surface runoff, soil water storage and how water partitioning responds to climate change and afforestation over time) so that the impact of species (such as GN and P. elliottii) on water yield can be determined. A good relationship between tree transpiration and meteorological variables suggests that “easy-to-measure” weather variables can be incorporated in future water-use modelling studies to estimate difficult-to-derive tree transpiration.
Due to the high frequency of the data used in this paper, all data with linked figures and tables have been uploaded to the central database at the Centre for Water Resources Research (CWRR) at the University of KwaZulu-Natal in Pietermaritzburg. The author, Nkosinathi David Kaptein, can be contacted for these data at kapteinnd@gmail.com.
MLT and ADC were responsible for funding acquisition, resources and project administration. MLT, ADC and CSE conceptualised the study and conceived the methodology. NDK, a student, collected, analysed and interpreted the data and wrote the original draft of the paper. ADC, MLT, CSE and IG provided student supervision, discussed the results and contributed to the final version of the paper.
The contact author has declared that none of the authors has any competing interests.
Publisher’s note: Copernicus Publications remains neutral with regard to jurisdictional claims made in the text, published maps, institutional affiliations, or any other geographical representation in this paper. While Copernicus Publications makes every effort to include appropriate place names, the final responsibility lies with the authors.
Mondi Group and Mistley-Canema Estate are acknowledged for their support in providing access to research sites. David Borain and Heyns Kotze provided invaluable assistance and support, without which this study would not have been successful. Assistance from Steven Dovey, Mxolisi Gumede, Xolani Colvelle and Jimmy Nhlangulela was much appreciated. Lastly, the editor Graham Jewitt and reviewers (David Scott and Miriam Coenders-Gerrits) are thanked for their contributions to this paper.
This research has been supported by the South African Department of Water and Sanitation through a Water Research Commission project (grant no. K5/2791).
This paper was edited by Graham Jewitt and reviewed by David Scott and Miriam Coenders-Gerrits.
Albaugh, J. M., Dye, P. J., and King, J. S.: Eucalyptus and water use in South Africa, Int. J. For. Res., 11, 852540, https://doi.org/10.1155/2013/852540, 2013.
Allen, R. G., Pereira, L. S., Raes, D., and Smith, M. (Eds.): Crop evapotranspiration: Guidelines for computing crop water requirements, 2nd edn., Food and Agricultural Organisation of the United Nations, Rome, Italy, 174 pp., ISBN 9251042195, 1998.
Aria, M., Cuccurullo, C., and Gnasso, A.: A comparison among interpretative proposals for Random Forests, Mach. Learn., 6, 1000094, https://doi.org/10.1016/j.mlwa.2021.100094 2021.
Benyon, R. G. and Doody, T. M.: Comparison of interception, forest floor evaporation and transpiration in Pinus radiata and Eucalyptus globulus plantations, Hydrol. Process., 29, 1173–1187, https://doi.org/10.1002/hyp.10237, 2014.
Breiman, L., Friedman, J. H., Olshen, R. A., and Stone, C. J.: Classification and regression of trees: first edition, Chapman & Hall publishers, New York, 368 pp., ISBN 9781315139470, https://doi.org/10.1201/9781315139470, 1984.
Breiman, L.: Random forests, Mach. Learn., 45, 15–32, 2001.
Bulcock, H. H. and Jewitt, G. P. W.: Field data collection and analysis of canopy and litter interception in commercial forest plantations in the KwaZulu-Natal Midlands, South Africa, Hydrol. Earth Syst. Sci., 16, 3717–3728, https://doi.org/10.5194/hess-16-3717-2012, 2012.
Burgess, S. S. O., Adams, M. A., Turner, N. C., Beverly, C. R., Ong, C. K., Khan, A. A. H., and Bleby, T. M.: An improved heat pulse method to measure low and reverse rates of sap flow in woody plants, Tree Physiol., 21, 589–598, https://doi.org/10.1093/treephys/21.9.589, 2001.
Calder, I. R.: Eucalyptus, water and the environment, in: Eucalyptus, edited by: Coppen, J. J. W., Taylor and Francis Inc., New York, 36–51, ISBN 9780429218897, 2002.
Callaham, M. A., Stanturf, J. A., Hammond, W., Rockwood, D. L., Wenk, E. S., O'Brien, J. J.: Survey to evaluate escape of eucalyptus spp. seedlings from plantations in south eastern USA, Int. J. For. Res., 13, 946374, https://doi.org/10.1155/2013/946374, 2013.
Campion, M., Dye, P. J., and Scholes, M. C.: Modelling maximum canopy conductance and transpiration in Eucalyptus grandis stand not subjected to soil water deficit, S. Afr. For. J., 202, 3–11, https://doi.org/10.1080/20702620.2004.10431784, 2004.
Cermák, J. and Nadezhdina, N.: Sapwood as the scaling parameter – defining according to xylem water content or radial pattern of sap flow?, Ann. For. Sci., 55, 509–521, https://doi.org/10.1051/forest:19980501, 1998.
Christina, M., Nouvellon, Y., Laclau, J. P., Stape, J. L., Bouillet, J. P., Lambais, G. R., and Le Maire, G.: Importance of deep-water uptake in tropical eucalypt forest, Funct. Ecol., 31, 509-519, https://doi.org/10.1111/1365-2435.12727, 2016.
Clulow, A. D., Everson, C. S., and Gush, M. B.: The long-term impact of Acacia mearnsii trees on evaporation, streamflow and groundwater resources, Water Research Commission Report TT 505/11, South Africa, 104 pp., ISBN 9781431200203, 2011.
Crosbie, R., Wilson, B., Hughes, J., and McCulloch, C.: The upscaling of transpiration from individual trees to areal transpiration in tree belts, Plant Soil, 297, 223–232, https://doi.org/10.1007/s11104-007-9337-y, 2007.
Curtis, R. O. and Marshall, D. D.: Why Quadratic Mean Diameter?, West. J. Appl. For., 15, 137–139, https://doi.org/10.1093/wjaf/15.3.137, 2000.
Cutler, D. R., Edwards, T. C., Beard, K. H., Cutler, A., Hess, K. T., Gibson, J., and Lawler, J. J.: Random Forests for classification in ecology, Ecology, 88, 2783–2792, https://doi.org/10.1890/07-0539.1, 2007.
David, T. S., Ferreira, M. I., David, J. S., and Pereira, J. S.: Transpiration from mature Eucalyptus globulus plantation in Portugal during a spring-summer period of progressively high-water deficit, Oecologia, 110, 153–159, https://doi.org/10.1007/PL00008812, 1997.
Delzon, S. and Loustau, D.: Age-related decline in stand water use: sap flow and transpiration in a pine forest chronosequence, Agr. Forest. Meteorol., 129, 105–119, https://doi.org/10.1016/j.agrformet.2005.01.002, 2005.
Dougherty, D. and Wright, J.: Silviculture and economic evaluation of eucalypt plantations in the Southern US, BioResources, 7, 1994–2001, https://doi.org/10.15376/biores.7.2.1994-2001, 2012.
Dye, P. J.: Response of Eucalyptus grandis trees to soil water deficits, Tree Physiol., 16, 233–238, https://doi.org/10.1093/treephys/16.1-2.233, 1996.
Dye, P. J.: A review of changing perspectives on Eucalyptus water-use in South Africa, Forest Ecol. Manag., 301, 51–57, https://doi.org/10.1016/j.foreco.2012.08.027, 2013.
Dye, P. J. and Olbrich, B. W.: Estimating transpiration from 6-year-old Eucalyptus grandis trees: development of a canopy conductance model and comparison with independent sap flux measurements, Plant Cell Environ., 16, 45–53, https://doi.org/10.1111/j.1365-3040.1993.tb00843.x, 2012.
Dye, P. J., Soko, S., and Poulter, A. G.: Evaluation of the heat pulse velocity method for measuring sap flow in Pinus Patula, J. Exp. Bot., 47, 975–981, https://doi.org/10.1093/jxb/47.7.975, 1996.
Dye, P. J., Poulter, A. G., Soko, S., and Maphanga, D.: The determination of the relationship between transpiration rate and declining available water for Eucalyptus grandis, Water Research Commission Report No. 441/1/97, Pretoria, South Africa, 103 pp., ISBN 1868453057, 1997.
Dye, P. J., Vilakazi, P., Gush, M., Ndlela, R., and Royappen, M.: Investigation of the feasibility of using trunk growth increments to estimate water use of Eucalyptus grandis and Pinus Patula plantation, Water Research Commission Report No. 809/1/01, South Africa, 229 pp., ISBN 1868458164, 2001.
Dye, P. J., Jacobs, S., and Drew, D.: Verification of 3-PG growth and water-use predictions in twelve Eucalyptus plantation stands in Zululand, South Africa, Forest Ecol. Manag., 193, 197–218, https://doi.org/10.1016/j.foreco.2004.01.030, 2004.
Eksteen, A. B., Grzeskowiak, V., Jones, N. B., and Pammenter, N. W.: Stomatal characteristics of Eucalyptus grandis clonal hybrids in response to water stress, South. Forests, 75, 105–111, https://doi.org/10.2989/20702620.2013.804310, 2013.
Everson, C. S., Clulow, A. D., Becker, M., Watson, A., Ngubo, C., Bulcock, H., Mengistu, M., Lorentz, S., and Demlie, M.: The long-term impact of Acacia mearnsii trees on evaporation, streamflow, low flows and ground water resources. Phase II: Understanding the controlling environmental variables and soil water processes over a full crop rotation, Water Research Commission Report K5/2022, South Africa, 155 pp., ISBN 9781431205165, 2014.
Forrester, D. I., Collopy, J. J., and Morris, J. D.: Transpiration along an age series of Eucalyptus globulus plantation in southeastern Australia, Forest Ecol. Manag., 259, 1754–1760, https://doi.org/10.1016/j.foreco.2009.04.023, 2010.
Fox, T. R., Jokela, E. J., and Allen, H. L.: The development of pine plantation silviculture in the southern United States, J. Forest., 105, 337–347, 2007.
Forestry South Africa: Report on commercial timber resources and primary roundwood processing in South Africa, https://www.forestrysouthafrica.co.za/wp-content/uploads/2023/06/TimberStats-2018_19.pdf (last access: 5 July 2023), 2020.
Fuchs, S., Leuschner, C., Link, R., Coners, H., and Schuldt, B.: Calibration and comparison of thermal dissipation, heat ratio and heat field deformation sap flow probes for diffuse-porous trees, Agr. Forest Meteorol., 244–245, 151–161, https://doi.org/10.1016/j.agrformet.2017.04.003, 2017.
Hall, R. L.: Aerodynamic resistance of coppiced poplar, Agr. Forest Meteorol., 114, 83–102, https://doi.org/10.1078/1439-1791-00099, 2002.
Hasenmueller, A. A., Gu, X., Weitzman, J. N., Adams, T. S., Stinchcomb, G. E., Eissenstat, D. M., Drohan, P. J., Brantley, S. L., and Kaye, J. P.: Weathering of rockto regolith: The activity of deep roots in bedrock fractures, Geoderma, 300, 11–31, https://doi.org/10.1016/j.geoderma.2017.03.020, 2017.
Hatton, T. J. and Vertessy, R. A.: Transpiration of plantation Pinus radiata estimated by the heat pulse method and the Bowen ratio, Hydrol. Process., 4, 289–298, https://doi.org/10.1002/hyp.3360040309, 1990.
Hatton, T. J. and Wu, H.-I.: Scaling theory to extrapolate individual tree water use to stand water use, Hydrol. Process., 9, 527–540, https://doi.org/10.1002/hyp.3360090505, 1995.
Kuhn, M.: Building predictive models in R using the caret package, J. Stat. Softw., 28, 1–26, https://doi.org/10.18637/jss.v028.i05, 2008.
Lundblad, M. and Lindroth, A.: Stand transpiration and sapflow density in relation to weather, soil moisture and stand characteristics, Basic Appl. Ecol., 3, 229–243, https://doi.org/10.1078/1439-1791-00099, 2002.
Maier, C. A, Albaugh, T. J., Cook, R. I., Hall, K., McInnin, D., Johnsen, K. H., Johnson, J., Rubilar, R. A., and Vose, J. M.: Comparative water use in short-rotation Eucalyptus benthamii and Pinus taeda trees in the Southern United States, Forest Ecol. Manag., 397, 126–138, https://doi.org/10.1016/j.foreco.2017.04.038, 2017.
Meiresonne, L., Nadezhdin, N., Cermák, J., Van Slycken, J., and Ceulemans, R.: Measured sap flow and simulated transpiration from a poplar stand in Flanders (Belgium), Agr. Forest Meteorol., 96, 165–179, https://doi.org/10.1016/S0168-1923(99)00066-0, 1999.
Mitchell, P. J., O'Grady, A. P., Tissue, D. T., White, D. A., Ottenschlaeger, M. L., and Pinkard, E. A.: Drought response strategies define the relative contributions of hydraulic dysfunction and carbohydrate depletion during tree mortality, New Phytol., 197, 862–872, https://doi.org/10.1111/nph.12064, 2013.
Moran, E., Lauder, J., Musser, C., Stathos, A., and Shu M.: The genetics of drought tolerance in conifers, New. Phytol., 216, 1034–1048, https://doi.org/10.1111/nph.14774, 2017.
Mucina, L. and Rutherford, M. C.: The Vegetation of South Africa, Lesotho and Swaziland, South African National Biodiversity Institute, Pretoria, South Africa, 801 pp., 2006.
Nambiar, E. K. S.: Tamm Review: Re-imagining forestry and wood business: pathway to rural development, poverty alleviation and climate change mitigation in the tropics, Forest Ecol. Manag., 448, 160–173, https://doi.org/10.1016/j.foreco.2019.06.014, 2019.
O'Grady, A. P., Eamus, D., and Hutley, L. B.: Transpiration increases during the dry season: patterns of tree water use in eucalypt open-forests of northern Australia, Tree Physiol., 19, 591–597, https://https://doi.org/10.1093/treephys/19.9.591, 1999.
Oren, R. and Pataki, D.: Transpiration in response to variation in microclimate and soil moisture in southeastern deciduous forests, Oecologia 127, 549–559, https://doi.org/10.1007/s004420000622, 2001.
Peel, M. C., Finlayson, B. L., and McMahon, T. A.: Updated world map of the Köppen-Geiger climate classification, Hydrol. Earth Syst. Sci., 11, 1633–1644, https://doi.org/10.5194/hess-11-1633-2007, 2007.
R Development Core Team: R: a language and environment for statistical computing, Vienna: R Foundation for Statistical Computing, http://www.R-project.org (last access: 2 August 2023), 2008.
Samuelson, L. J., Farris, M. G., Stokes, T. A., and Coleman, M. D.: Fertilization but not irrigation influences hydraulic traits in plantation-grown loblolly pine, Forest Ecol. Manag., 255, 3331–3339, https://doi.org/10.1016/j.foreco.2008.02.014, 2008.
Samuelson, L. J., Stokes, T. A., Ramirez, M. R., and Mendonca, C. C.: Drought tolerance of a Pinus palustris plantation, Forest Ecol. Manag., 451, 117557, https://doi.org/10.1016/j.foreco.2019.117557, 2019.
Santra, P., Kumar, M., Kumawat, R. N., Painuli, D., K., Hati, K. M., Heuvelink, G. B. M., and Batjes, N. H.: Pedotransfer functions to estimate soil water content at field capacity and permanent wilting point in hot Arid Western India, J. Earth Syst. Sci., 127, 439–448, https://doi.org/10.1007/s12040-018-0937-0, 2018.
Savage, M. J., Everson, C. S., and Metelerkamp, B. R.: Evaporation measurement above vegetated surfaces using micrometeorological techniques, Water Research Commission Report No. 349/1/97, Water Research Commission, Pretoria, South Africa, 248 pp., ISBN 1-86845 363 4, 1997.
Scott, D. F. and Lesch, W.: Streamflow responses to afforestation with Eucalyptus grandis and Pinus patula and to felling in the Mokobulaan experimental catchments, South Africa, J. Hydrol., 199, 360–377, https://doi.org/10.1016/S0022-1694(96)03336-7, 1997.
Scott, D. F. and Smith, R. E.: Preliminary empirical models to predict reductions in annual and lo flows resulting from afforestation, Water SA, 23, 135–140, 1997.
Scott, D. F., Prinsloo, F. W., Moses, G., Mehlomakulu, M., and Simmers, D. A.: A re-analysis of the South African catchment afforestation experimental data, Water Research Commission Report No. 810/1/00, Water Research Commission, Pretoria, South Africa, 122 pp., ISBN 1868456722, 2000.
Smith, R. E. and Scott, D. F.: The effects of afforestation on low flows in various regions of South Africa, Water SA, 18, 185–194, https://doi.org/10.1007/978-1-4612-0919-5_13, 1992.
Soil Classification Working Group (Eds.): Soil classification: a taxonomic system for South Africa, 2nd edn., Department of Agricultural Development, Pretoria, South Africa, 257 pp., ISBN 9780621107845, 1991.
Stanturf, J. A., Vance, E. D., Fox, T. R., and Kirst, M.: Eucalyptus beyond its native range: Environmental issues in 15 exotic bioenergy plantations, Int. J. For. Res., 16, 463030, https://doi.org/10.1155/2013/463030, 2013.
Traver, E., Ewers, B. E., Mackay, D. S., and Loranty, M. M.: Tree transpiration varies spatially in response to atmospheric but not edaphic conditions, Funct. Ecol., 24, 273–282, https://doi.org/10.1111/j.1365-2435.2009.01657.x, 2010.
Vandegehuchte, M. W. and Steppe, K.: Use of the correct heat conduction–convection equation as basis for heat-pulse sap flow methods in anisotropic wood, J. Exp. Bot., 63, 2833–2839, https://doi.org/10.1093/jxb/ers041, 2012.
Van Lill, W. S., Kruger, F. J., and Van Wyk, D. B.: The effect of afforestation with Eucalyptus grandis Hill ex Maiden and Pinus patula Schlecht. et. Cham. on streamflow from experimental catchments at Mokobulaan, Transvaal, J. Hydrol., 48, 107–118, https://doi.org/10.1016/0022-1694(80)90069-4, 1980.
Vertessy, R. A., Hatton, T. J., Reece, P., O'Sullivan, S. K., and Benyon, R. G.: Estimating stand water use of large mountain ash trees and validation of the sap flow measurement technique, Tree Physiol., 17, 747–756, https://doi.org/10.1093/treephys/17.12.747, 1997.
White, D. A., Beadle, C. L., Sands, P. J., Worledge, D., and Honeysett, J. L.: Quantifying the effect of cumulative water stress on stomatal conductance of Eucalyptus globulus and Eucalyptus nitens: a phenomenological approach, Aust. Forestry, 26, 17–27, https://doi.org/10.1071/PP98023, 1999.
White, D. A., Silberstein, R. P., Contreras, F. B., Quiroga, J. J., Meason, D. F., Palma, J. H. N., and de Arellano, P. R.: Growth, water use, and water use efficiency of Eucalyptus globulus and Pinus radiata plantations compared with natural stands of Roble-Hualo Forest in the coastal mountains of central Chile, Forest Ecol. Manag., 501, 119675–119676, https://doi.org/10.1016/j.foreco.2021.119676, 2021.
White, D. A., Ren, S., Mendham, D. S., Balocchi-Contreras, F., Silberstein, R. P., Meason, D., Iroumé, A., and Ramirez de Arellano, P.: Is the reputation of Eucalyptus plantations for using more water than Pinus plantations justified?, Hydrol. Earth Syst. Sci., 26, 5357–5371, https://doi.org/10.5194/hess-26-5357-2022, 2022.
Whitehead, D. and Beadle, C. L.: Physiological regulation of productivity and water use in Eucalyptus: a review, Forest Ecol. Manag., 193, 113–140, https://doi.org/10.1016/j.foreco.2004.01.026, 2004.
World Meteorological Organisation: Guide to Meteorological Instruments and Methods of Observation, World Meteorological Observation, Geneva, Switzerland, 716 pp., ISBN 9789263100085, 2010.
Zeppel, M. J. B, Murray, B. R., Barton, C., and Eamus, D.: Seasonal responses of xylem sap velocity to VPD and solar radiation during drought in a stand of native tree in temperate Australia, Australia Funct. Plant Biol., 31, 461–471, https://doi.org/10.1071/FP03220, 2004.
Zweifel, R., Zimmermann, L., and Newberry, D. M.: Modelling tree water deficit from microclimate: an approach to quantifying drought stress, Tree Physiol., 25, 147–156, https://doi.org/10.1093/treephys/25.2.147, 2005.