the Creative Commons Attribution 4.0 License.
the Creative Commons Attribution 4.0 License.
 | 19 Jan 2023
The origin of hydrological responses following earthquakes in a confined aquifer: insight from water level, flow rate, and temperature observations
Shouchuan Zhang
Guangcai Wang
Zuochen Zhang
Huaming Guo
Although many mechanisms of earthquake-induced hydrological response have been proposed in recent decades, the origins of these responses remain enigmatic, and a quantitative understanding of them is lacking. In this study, we quantitatively analyze the mechanism of coseismic response in water level and flow rate from an artesian well in southwestern China before and after multiple earthquakes and reveal the origin of the earthquake-induced hydrological response based on the monitoring data of water temperature. Water level and temperature always show coseismic step-like increases following earthquakes, which are independent of the earthquakes' epicentral distances and magnitudes. Tidal analysis finds changes in aquifer and aquitard permeability following these earthquakes, which corresponds to the post-seismic total discharge of 85–273 m3 in 20 d after earthquakes. Furthermore, we couple the flow rate and temperature data to model the mixing processes that occurred following each earthquake. The results indicate that coseismic temperature changes are the result of the mixing of different volumes of water from shallow and deep aquifers, with the mixing ratio varying according to each earthquake.
- Article
(5723 KB) - Full-text XML
-
Supplement
(1146 KB) - BibTeX
- EndNote


Earthquake-induced hydrological anomalous phenomena, such as changes in water levels (Hosono et al., 2019; Weaver et al., 2019; H. Zhang et al., 2019, 2021), spring discharge (Manga and Rowland, 2009; Manga et al., 2016; Yan et al., 2020; Mohr et al., 2017), water temperature (Miyakoshi et al., 2020; Chien et al., 2020; Wang et al., 2012), and chemical composition (Shi et al., 2020; Skelton et al., 2014a; Kim et al., 2019; Igarashi et al., 1995; Skelton et al., 2019; Li et al., 2019; Zhang et al., 2020a) have been widely documented. Mechanisms proposed to explain these phenomena include (1) water expulsion by coseismic static strain, (2) water release from shallow crustal areas due to increased permeability following earthquakes, and (3) increased water recharge from a storage source due to an increased hydraulic head gradient. However, most of these mechanisms have been proposed depending either on observations of coseismic streamflow or water-level responses, which makes it difficult to identify the origins of the release of coseismic groundwater. These mechanisms usually do not quantitatively explain the magnitude of coseismic responses. Furthermore, the absence of integrated multi-parameter explanations for the proposed mechanisms may lead to inconsistent or even contradictory explanations of different coseismic hydrological phenomena. Although several studies have documented earthquake-induced changes in groundwater level, flow rate, and temperature, quantitative couplings of earthquake-induced groundwater flow and temperature are lacking, resulting in ambiguity in identification of the origins of earthquake-induced hydrological responses (Furuya and Shimamura, 1988; Anderson, 2010; Wang and Manga, 2010).
Based on the coseismic response of water levels, flow rate, and water temperature responses to several earthquakes in an artesian well (Dazhai well), this study aims to (1) quantitatively evaluate the mechanism of anomalous hydrological changes and (2) reveal the origin of the earthquake-induced hydrological response based on water temperature monitoring data.
2.1 Regional geological setting
Dazhai well (DZ well) is located in the Yixiangba sub-basin, 11 km southeast of the city of Pu'er in western Yunnan Province, Southwest China. The Yixiangba sub-basin belongs to the Lanping–Simao basin. The climatic characteristics in the Simao basin constitute moderate climate with four distinct seasons. The annual precipitation is about 1500 mm, but most precipitation occurs between April and October. The Simao basin is a rift basin situated in the southern section of the Sanjiang fold system. It is located in the southern Yunnan–Tibet geothermal zone, one of the most active areas of tectonic activity in China. The Lanping–Simao basin is underlain by strata ranging in age from Proterozoic to Cenozoic. The outcropping strata are related to the division of tectonic units of the basin. Due to the later denudation, the Upper and Middle Paleozoic limestones outcrop in the central and marginal uplifts of the basin. The Proterozoic metamorphic rocks occur along the Jinshajiang–Ailaoshan fault in the east part of the basin.
Tectonically, the Lancangjiang fault and Jinshajiang–Ailaoshan deep faults are the western and eastern boundaries of the Lanping–Simao basin (Deng et al., 2020). The Wuliangshan fault developed in the central basin, which is composed of several secondary faults, including Mohei, Pu'er East, Pu'er West, Zhenyuan–Puwen East, and Zhenyuan–Puwen West faults. These secondary faults are divided into several segments by a series of NE-trending faults. Fault zones can modulate fluid circulation within the shallow crust acting as conduits for groundwater flow. Veins and microfractures along faults caused by the crust dilation and contraction allow for fluid redistribution and mixing from different reservoirs (Smeraglia et al., 2018). A series of faults control the tectonic evolution of the rifting basin and also provide favorable conditions for groundwater storage and flow (Y. Zhang et al., 2019). As is shown in Fig. 1, the aquifers are classified into five categories, including loose rock aquifers, intrusive rock aquifers, metamorphic rock, clastic rock aquifers, and carbonate rock aquifers. Most of the aquifer types in the basin belong to clastic rock aquifers. The loose rock and carbonate rock aquifers occur sporadically in the northern and southern part of the basin respectively. The metamorphic rock and intrusive rock aquifers are widely distributed in the east part of the basin.
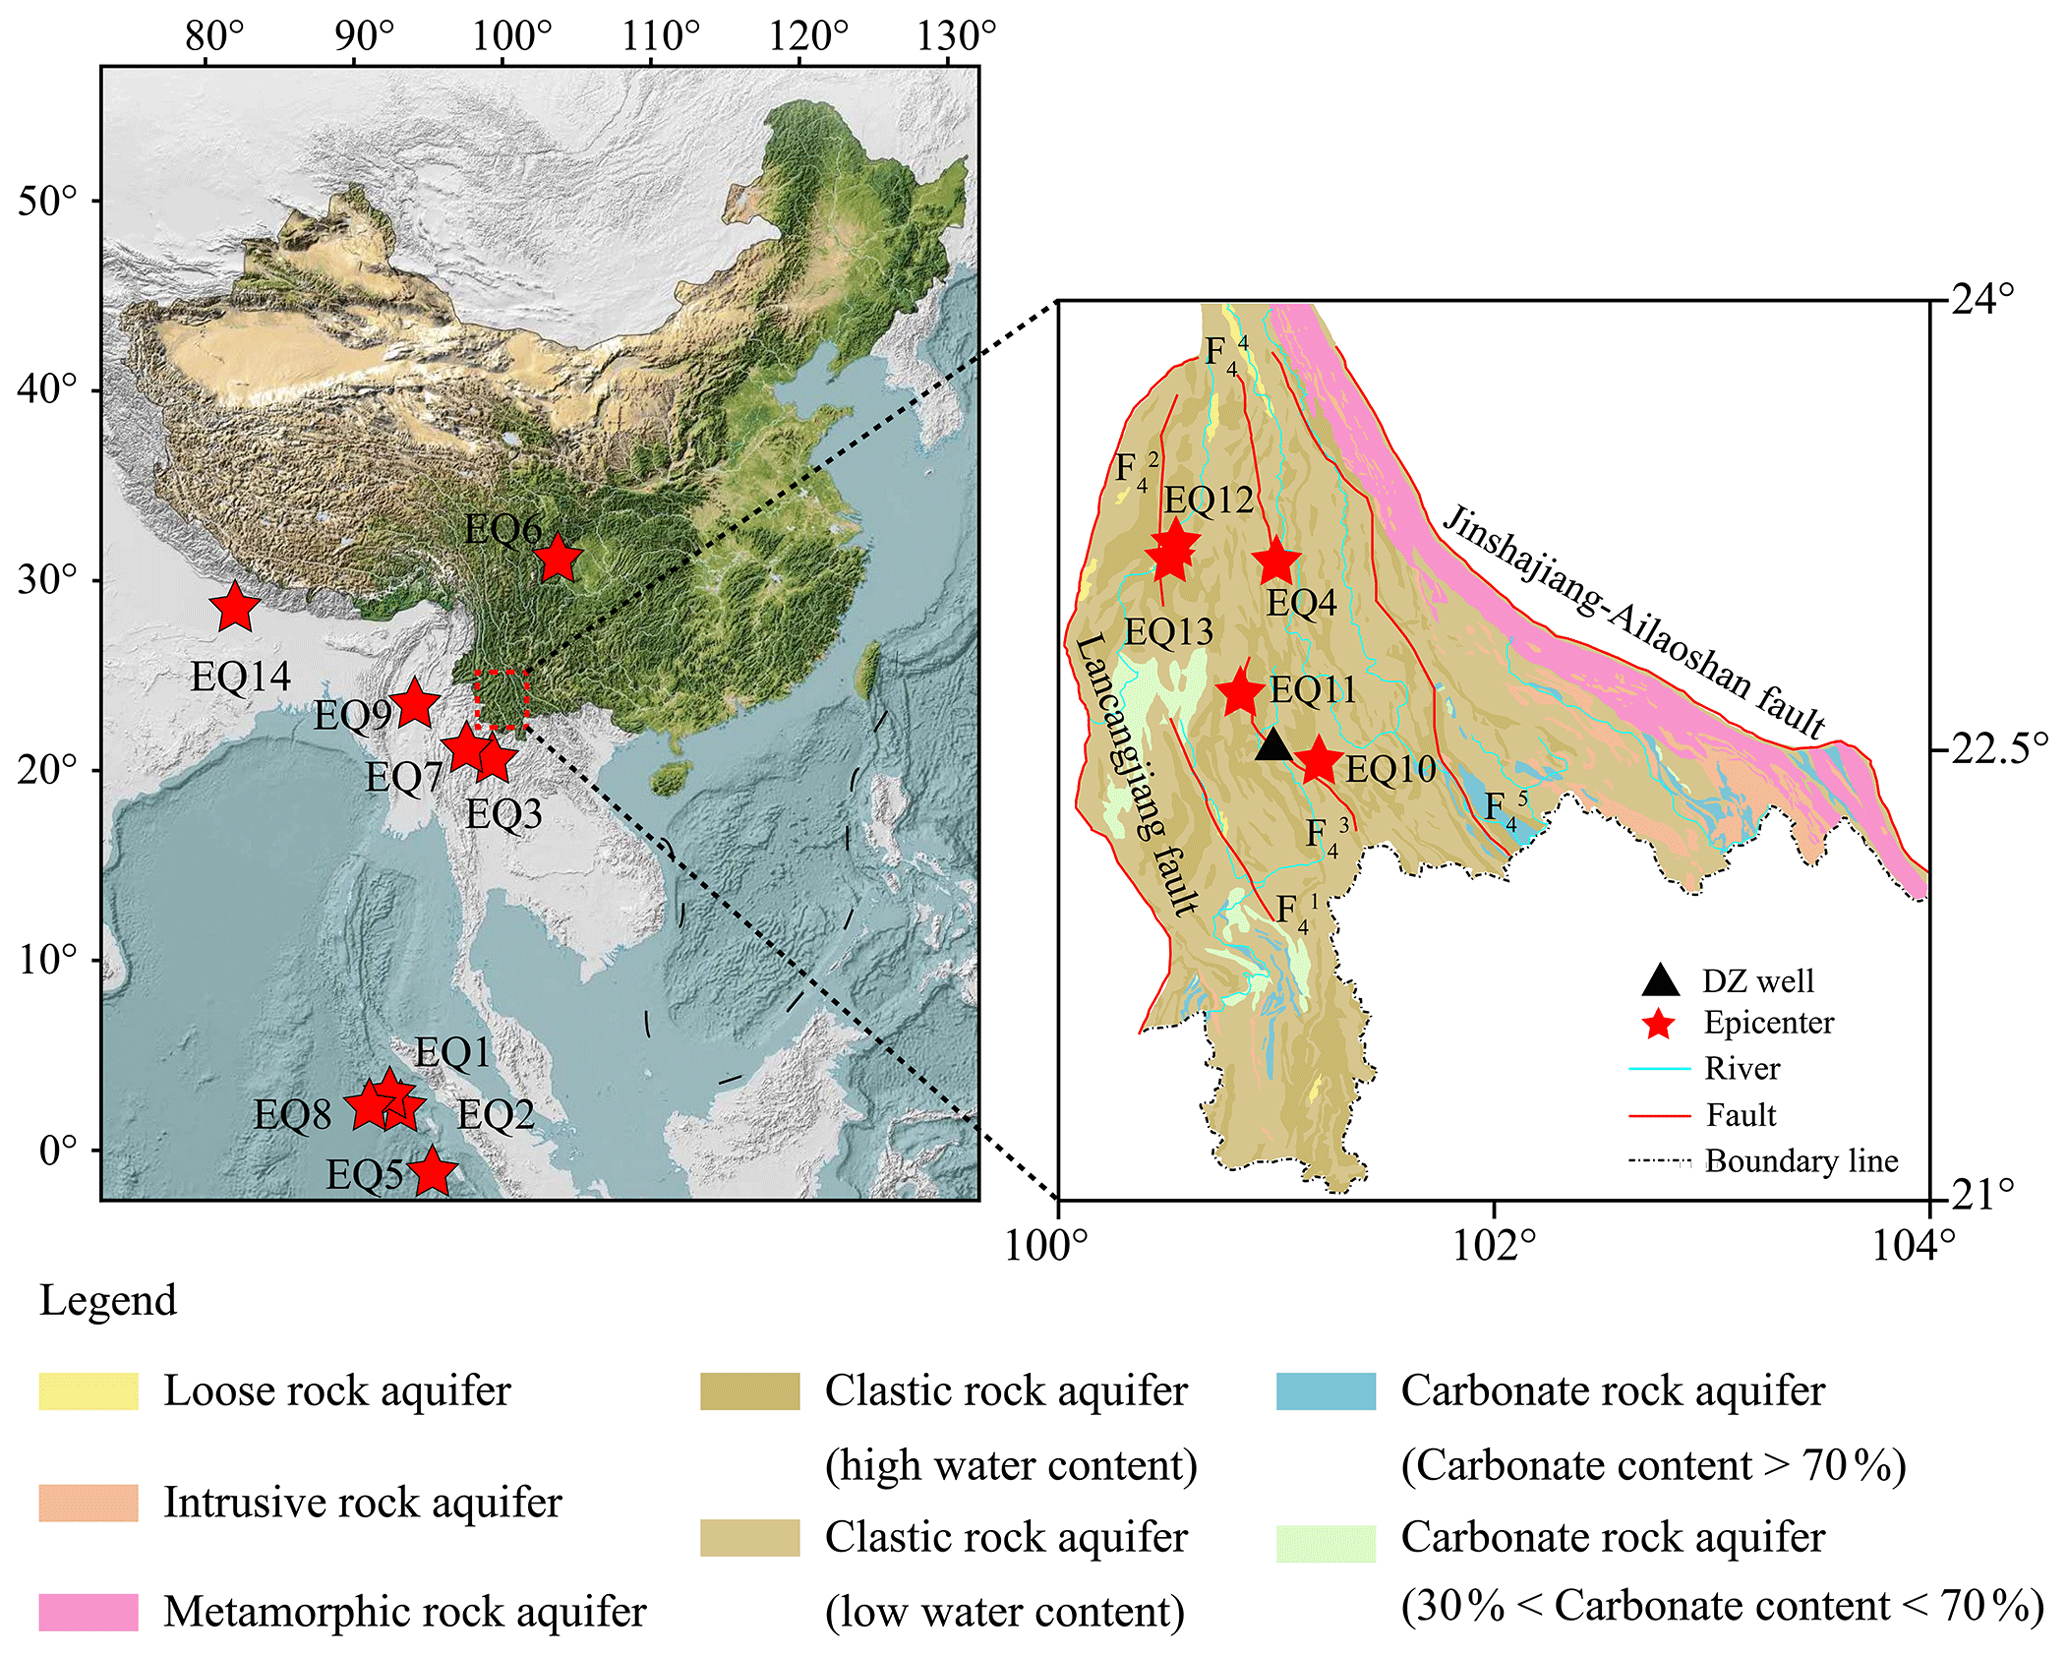
Figure 1The hydrogeological setting of the Lanping–Simao basin. The red star indicates the distribution of 14 earthquakes, the black triangle indicates DZ well, and the solid red lines indicate faults. F4: the Wuliangshan fault. F: the Zhenyuan–Puwen West fault. F: the Zhenyuan–Puwen East fault. F: the Pu'er West fault. F: the Pu'er East fault. F: the Mohei fault.
2.2 Information of monitoring well
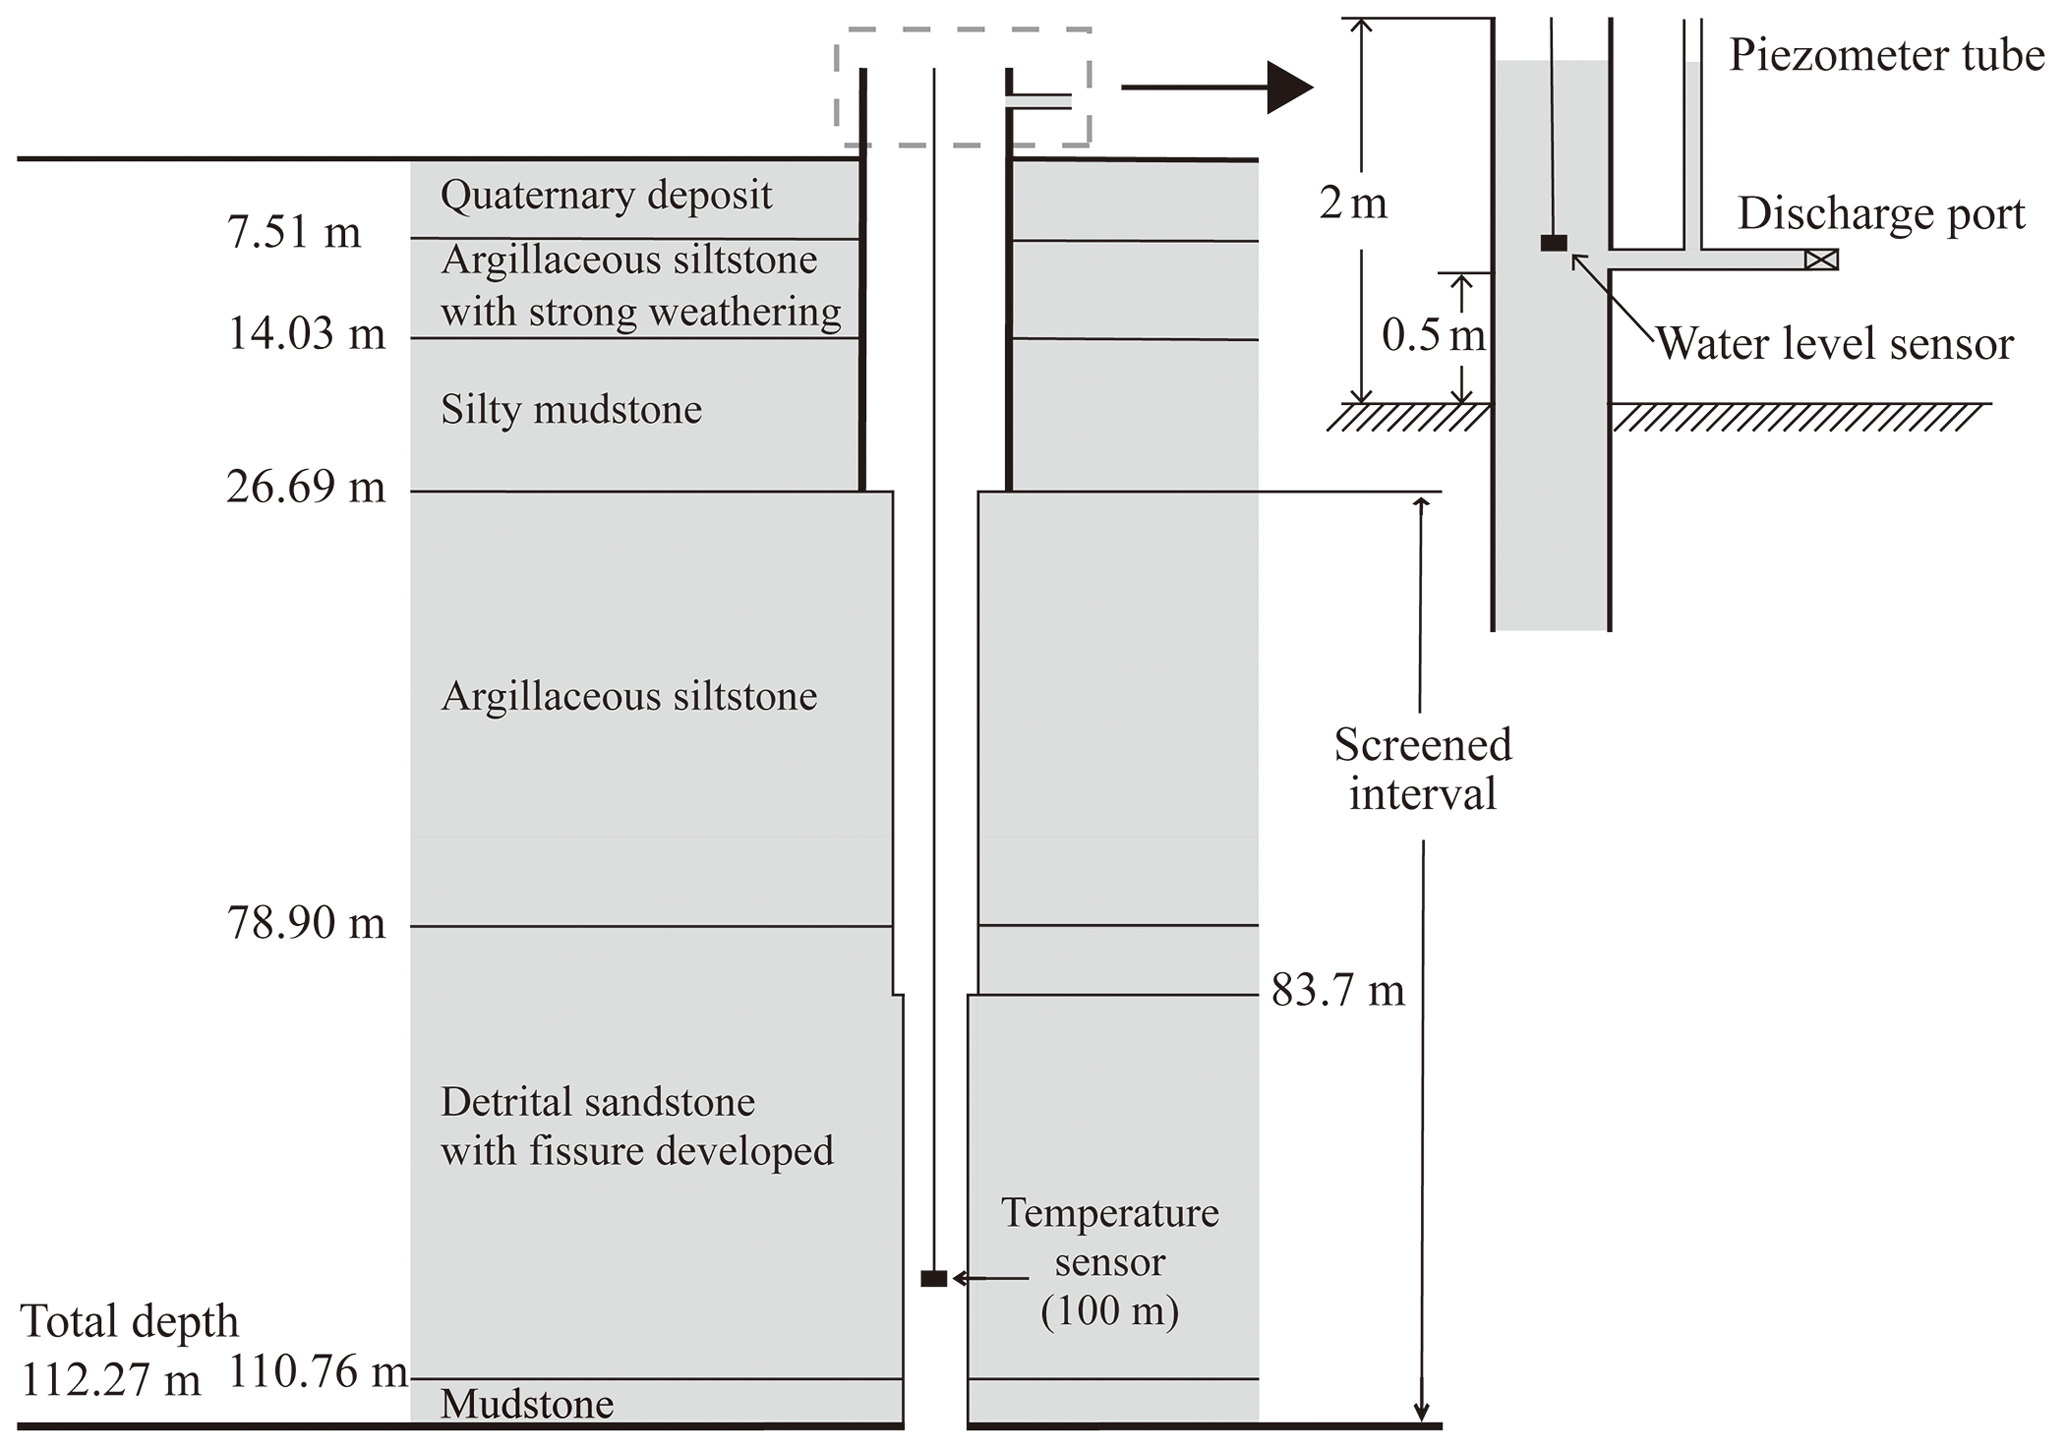
DZ well (constructed in 1984 and upgraded to a digitized observation system in 2001) is located in fractured sandstone–siltstone rock in the Jinmenkou–Shigaojing part of Pu'er West fault (Fig. 1). DZ well is an artesian well with a discharge rate of 0.3–0.6 L s−1, a depth of 112.27 m with a casing diameter of 150 mm, a blank casing from 0–26.69 m with an open section between 26.69–112.27 m, and diameters of 120 and 110 mm at depths of 26.69–83.7 and 83.7–112.27 m, respectively. The elevation level of Dazhai well is about 1471 m. Groundwater level, flow rate, and water temperature are observed in DZ well. The lithology of the wellbore in DZ well is as follows (Fig. 2): 0–7.51 m is quaternary deposit, 7.51–14.03 m is argillaceous siltstone with strong weathering, 14.03–26.69 m is silty mudstone, 26.69–78.90 m is argillaceous siltstone, 78.90–110.76 m is detrital sandstone with fissure developed, and 110.76–112.27 m is mudstone. In order to understand the deeper lithology and the distribution of aquifers, we also collected the aquifer lithology and wellbore structure of Dazhai deep well (Fig. S1 in the Supplement), which is drilled with a depth of 410 m and only 50 m away from Dazhai well. Both wells are artesian wells. Sandstone has the characteristics of high mechanical strength and permeability and is considered the most important type of aquifer in this area. Conversely, the characteristics of mudstone are low mechanical strength and permeability, and it is considered an aquitard. In combining these two wellbores, we found that the sandstone stratum is separated by mudstone at depth between 105–117 m, forming two confined aquifers, and the groundwater head in the underlying sandstone aquifer (1480 m) is higher than the shallow sandstone aquifer (1475 m). In addition, the hydrochemical types of Dazhai well and Dazhai deep well are HCO3–Na ⋅ Ca and HCO3–Ca ⋅ Na, respectively. There is no significant difference in groundwater hydrochemical type in samples from the shallow and deep aquifers.
2.3 Data collection
Earthquake groundwater monitoring wells in China are categorized as two types: (1) static water-level observation for the non-artesian well and (2) dynamic water-level observation for the artesian well (CEA, 2012). DZ well is an artesian aquifer, and the hydraulic head is always above the surface. Thus, dynamic water-level observation is employed. Such a groundwater monitoring system has been widely used in Chinese earthquake groundwater monitoring wells in artesian aquifers. Dynamic water-level observation wells tend to have better confinement than the non-artesian flowing wells. Previous studies revealed that three external influence factors affect the sensitivity of the earthquake-induced hydrogeological responses, including peak ground velocity (PGV), aquifer confinement, and well location relative to local faults (Zhang et al., 2021). In additional, many studies have proposed that the tidal signals from aquifers with different confinement are different. The aquifers with better confinement could record clear and large magnitude of M2 tidal wave, while the aquifers with less confinement may show weak tidal signals (Rahi, 2010; Turnadge et al., 2019; Zhang et al., 2021). Thus, dynamic water-level observations tend to show more sensitivity to earthquakes. In order to observe the variation of water-level fluctuation, the wellbore is constructed above the ground and equipped with the discharge port (Fig. 2). The purpose of setting the discharge port is to discharge a part of groundwater and keep the water-level fluctuation in a certain range. Meanwhile, the discharge can be measured through this port sing the stopwatch capacity method; i.e., the required time per unit volume of water is measured. Without the discharge port, the hydraulic head would be 4 m above the surface, which is difficult for monitoring. A piezometric tube is used to calibrate the data of water level. For such a monitoring system, the water level refers to the distance between the water table and the center line of the discharge port. Dynamic water-level observations in DZ well are recorded hourly with a resolution of 1 mm using a LN-3A pressure transducer (developed by the Institute of Earthquake Forecasting, China Earthquake Administration, Beijing, China). Water temperatures are digitally recorded every minute using a quartz crystal thermometer (SZW-1A, developed by the Institute of Crustal Dynamics, China Earthquake Administration, Beijing, China) with a resolution of 0.1 mK (Shi and Wang, 2014). The temperature probe is set at a depth of 100 m and removed from the influences of other factors such as air temperature, precipitation, and pumping. Monitoring data are transferred to and stored at the Yunnan provincial earthquake administration, Kunming, China.
We collected water-level, flow rate, and water temperature data for the period 2004–2015. Water levels show seasonal fluctuations with a higher level during the summer wet season and a lower level during the drier winter season. The δD and δ18O values of groundwater from Dazhai well are −80.63 ‰ and −11.17 ‰, respectively, which are close to the global meteoric water line (GMWL): δD = 8δ18O + 10 (Yang et al., 2005). The stable-isotope data indicate that the recharge of DZ well aquifer is primarily from meteoric waters. According to the relationship between recharge elevation and δD in the eastern Tibetan Plateau δD = −0.026 H (m) − 30.2 (Yu, 1997), the recharge elevation of groundwater from Dazhai well is about 1940 m. The estimated recharge elevation is close to the elevation of mountains nearby Dazhai well.
Three patterns of water-level coseismic response have been identified based on the distance between the length of the ruptured fault and the epicentral distance: (1) step-like changes in near-field earthquakes (< 1 ruptured fault length); (2) gradual changes, both increases and decreases, at intermediate distance (1–10 ruptured fault length); and (3) oscillations in far-field earthquakes (> 10 ruptured fault length). During the 2004 to 2015 monitoring intervals, these responses were observed for 14 earthquakes, including the 2004 Mw 9.0 Sumatra earthquake, 2008 Mw 7.9 Wenchuan earthquake, and 2015 Mw 8.2 Nepal earthquake (Fig. 1). There is no barometric pressure monitoring data of 2004–2015 in the monitoring site of DZ well; thus no barometric pressure correction had been done for the water level. The raw water-level data are shown in Fig. S2. We have removed the effect of Earth tide in calculating the coseismic water-level changes. The air temperature has no effect on the variation of water (Sect. S3 in the Supplement). The coseismic and post-seismic changes in water level and temperature can be clearly identified (Fig. 3) and show sharp step-like rises, with anomalous changes following earthquakes lasting approximately a month (summarized in Table 1).
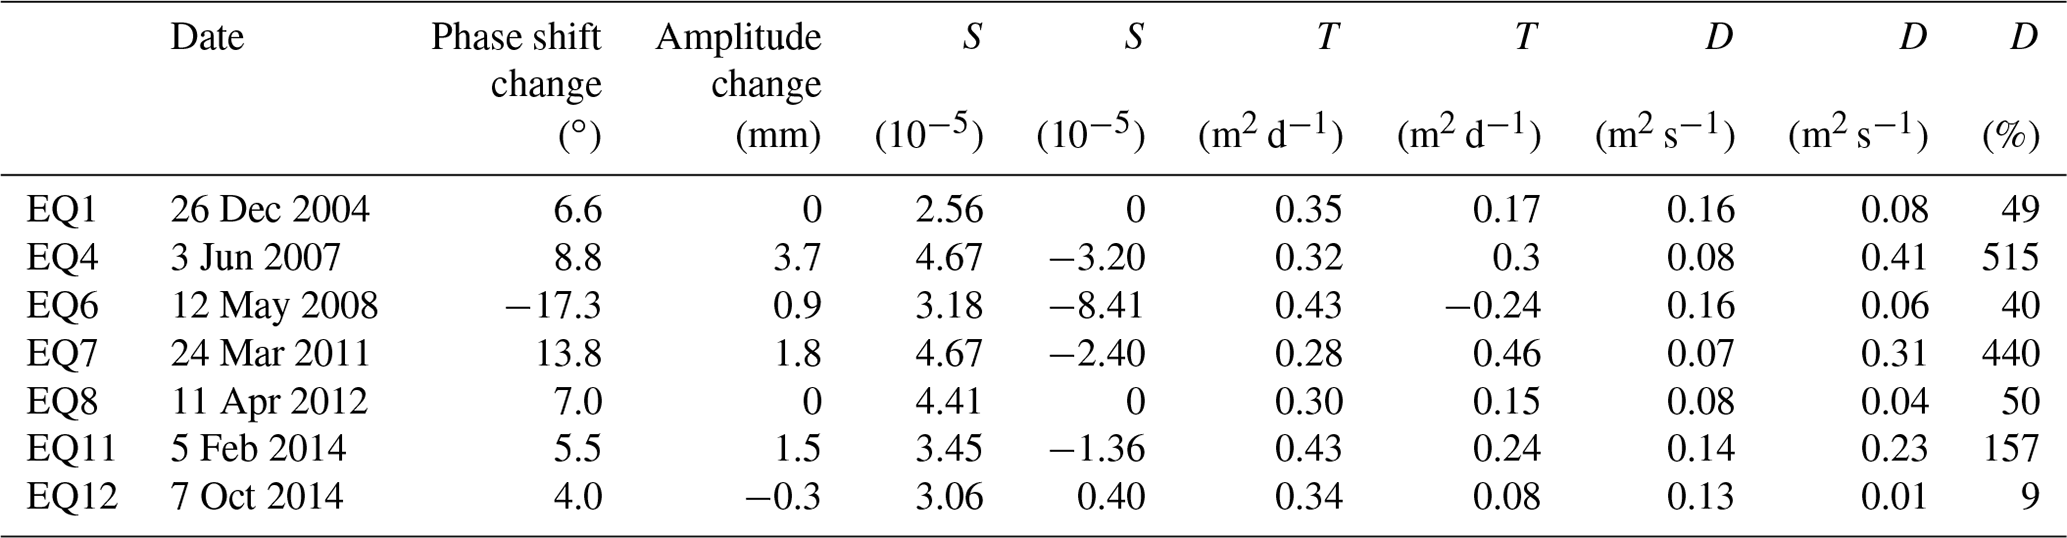
Table 1Seismic properties for 14 earthquakes and their effects on water levels and temperatures in the Dazhai well, western Yunnan Province, China.
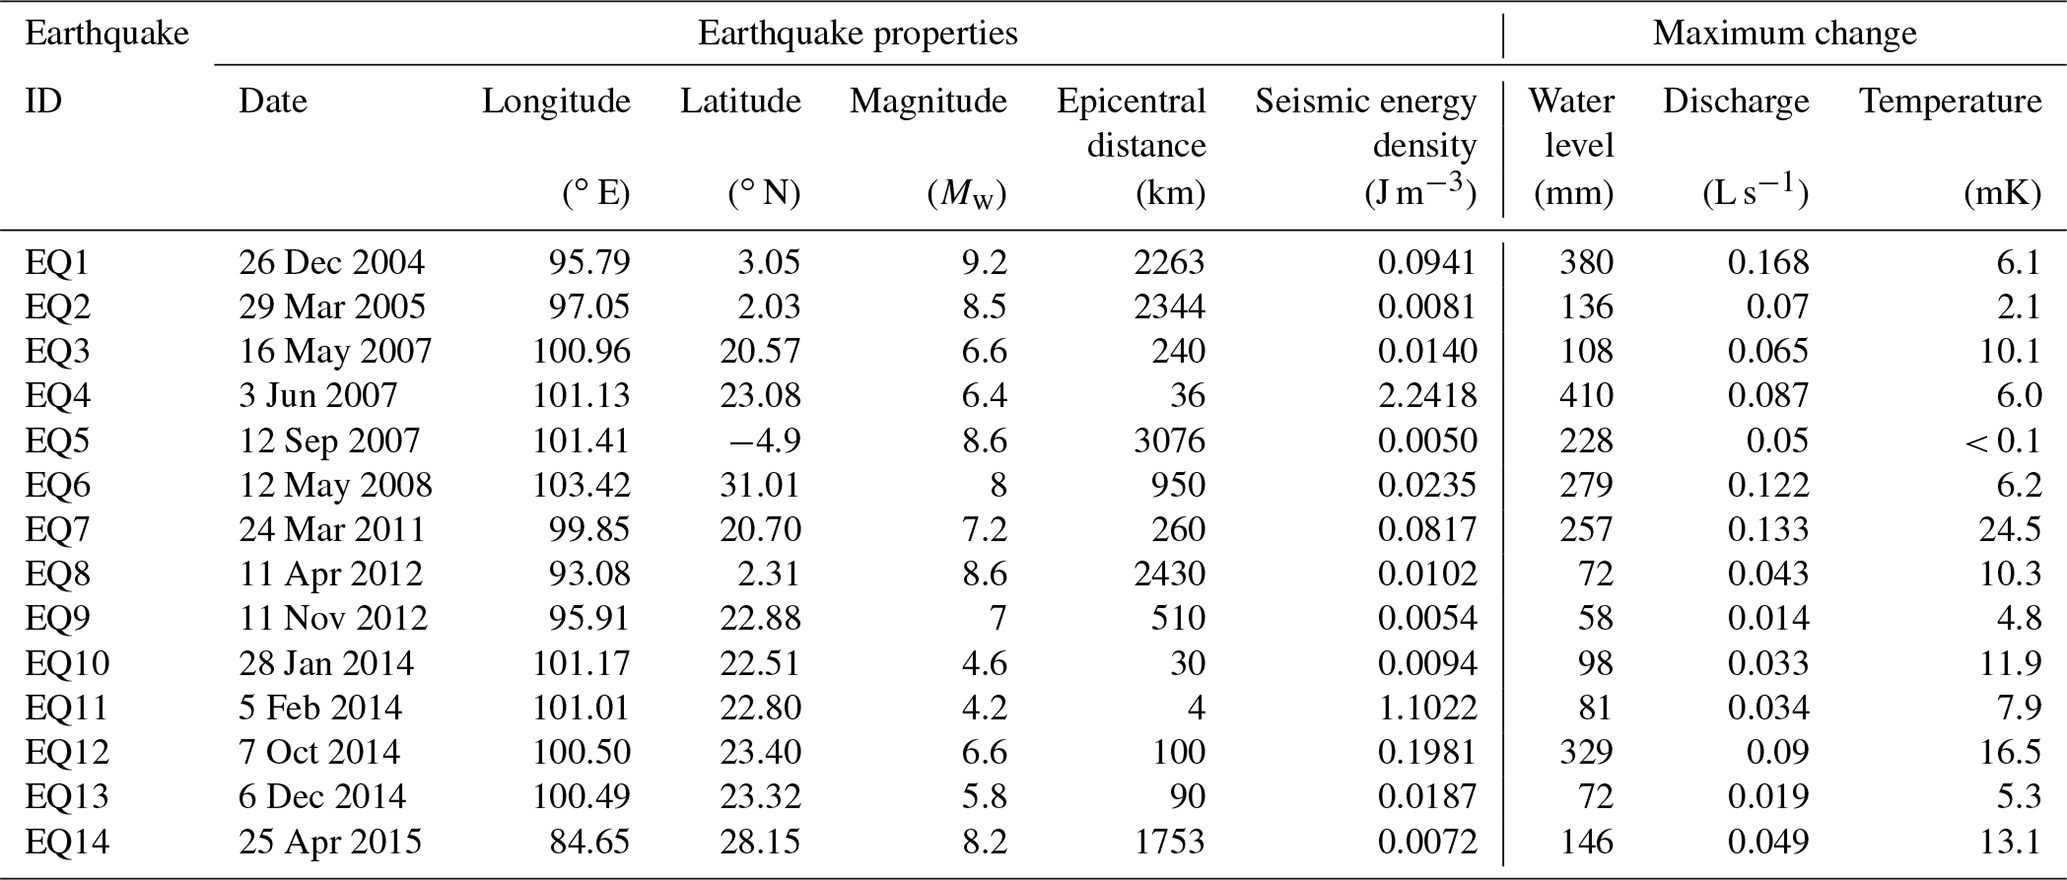
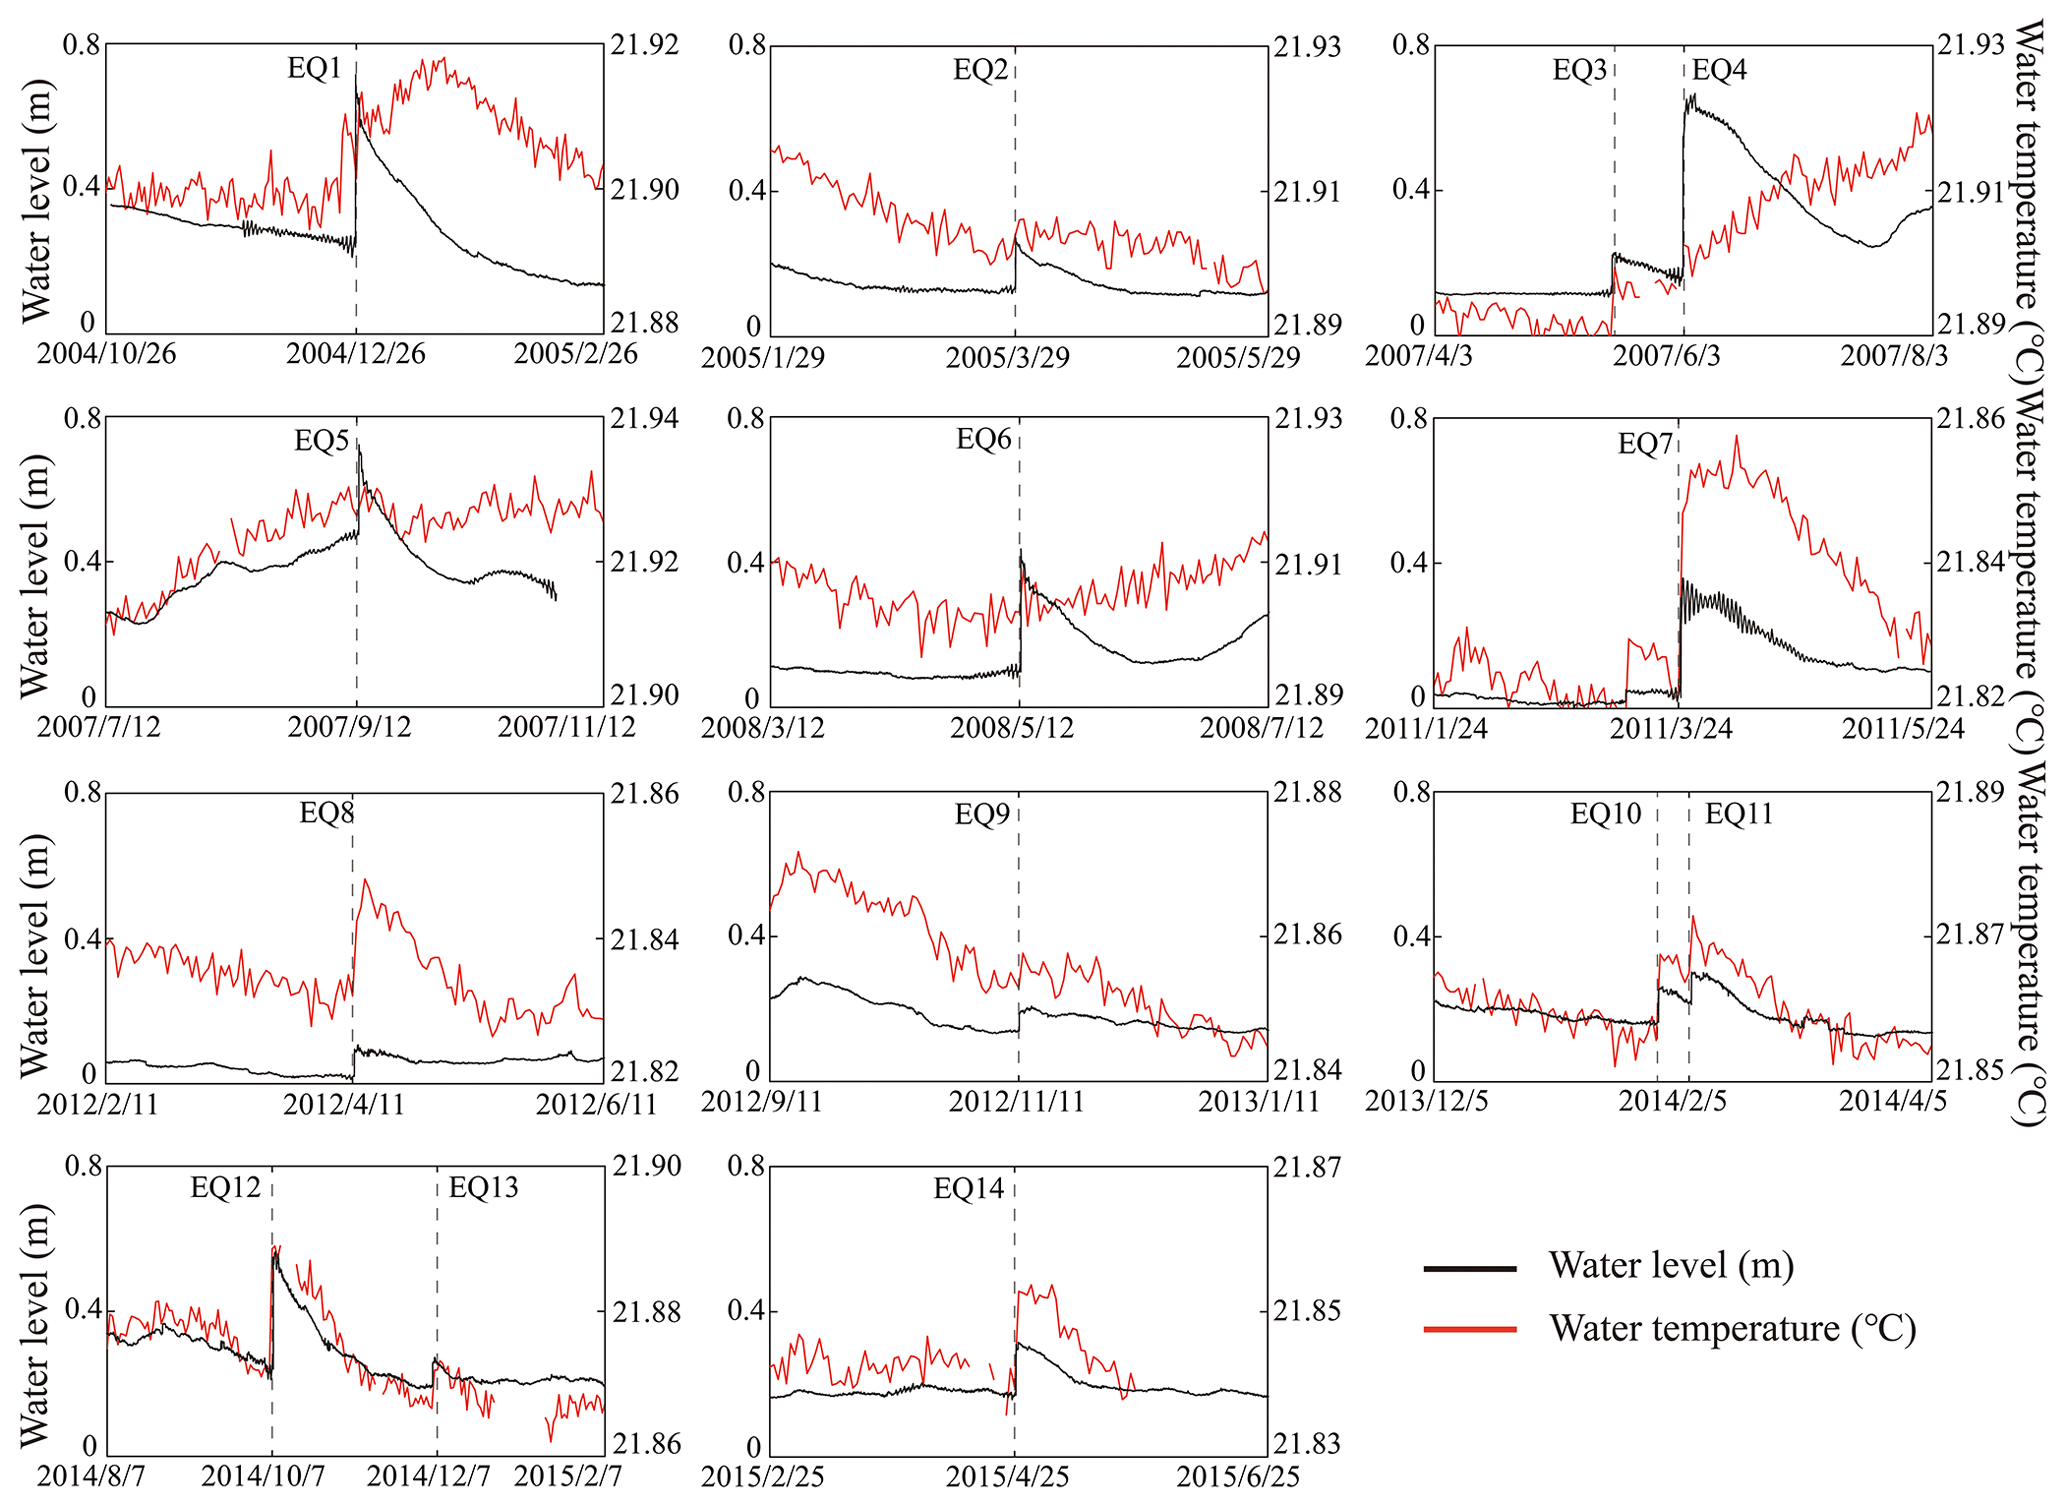
Figure 3Water-level and temperature changes induced by 14 earthquakes in Dazhai well, western Yunnan Province, China. The water-level changes have been corrected for Earth tide. Vertical dashed lines indicate earthquake events.
All water-level coseismic responses show step-like increases, with magnitudes ranging from a minimum of 58 mm to a maximum of 410 mm caused by the 3 June 2007 Mw 6.4 (EQ4). Water-level coseismic changes reached 228 mm in response to epicentral distances greater than 3000 km (EQ5). Water temperature induced by earthquakes ranged from 2.1 to 24.5 mK, where the maximum was caused by the 24 March 2011 Mw 7.2 earthquake (EQ7).
Water levels also show the influence of Earth tides, with a maximum variation induced by semidiurnal and diurnal tides being < 9 mm (Yang et al., 2005), which is less than the step-like changes induced by earthquakes. Seasonal fluctuations in water level from rainy to dry seasons were < 200 mm and showed no long-term trend. All earthquake-induced groundwater-level responses were greater than 200 mm, which cannot be attributed to Earth solid tides and meteorological factors.
Wang (2007) introduced the concept of seismic energy density to quantify the magnitude and epicentral distance of earthquakes to build the relationship between seismic activity and hydrologic response, where a threshold value of 10−3 J m−3 was concluded to be sufficient to trigger a hydrological coseismic response. The seismic energy density can be calculated by the following equation:
where r is the epicentral distance, Mw is the magnitude of the earthquake, and e (J m−3) is the seismic energy density. Table 1 summarizes the seismic energy density of the 14 earthquakes, which ranged from 0.005 to 2.242 J m−3. Detailed information is summarized in Table 1. Those earthquakes that showed hydrological response and no hydrological response are plotted in Fig. S4. As is shown in Fig. S4, although the seismic energy density of most earthquakes is < 10−3 J m−3, the seismic energy density of a few earthquakes ranging from 10−3 to 10−2 J m−3 causes no hydrological response. The minimum seismic energy density required to trigger water-level and temperature coseismic changes was 0.0054 and 0.005 J m−3, respectively, where both values are > 10−3 J m−3, approaching the empirical threshold for triggering hydraulic property changes, which means that this well is highly sensitive to seismic activity. We next explore the mechanism of these coseismic responses and their quantitative assessment and then identify the origin of excess recharge to the aquifer induced by earthquakes.
4.1 Changes in horizontal hydraulic diffusivity
Aquifer parameters such as transmissivity, storage coefficient, and hydraulic diffusivity play important roles in groundwater flow. During seismic activity, anomalous changes in water level may be attributed to earthquake-induced changes in aquifer parameters. The tidal analysis method establishes a direct connection between hydrological responses and aquifer parameter changes, which is also an effective method for the long-term monitoring of variation in aquifer parameters (Hsieh et al., 1987; Xue et al., 2013; Shi and Wang, 2016). Water-level changes induced by Earth solid tides in a wellbore show semi-diurnal and diurnal fluctuations, which are controlled by aquifer properties and the wellbore structure. The amplitude is the ratio of the water-level amplitude to the theoretical volumetric strain, and the phase shift is the time lag between the Earth solid tide fluctuation and water-level variation, which differ because of the time required for groundwater to equilibrate the well. Both can be used to calculate the transmissivity and storage coefficient:
where is the amplitude; X is the amplitude of tide of the water level in the well; H is the amplitude of the fluctuating pressure head in the elastic aquifer responding to the tidal stress; η is the phase shift; T is transmissivity (m2 d−1); S is the storativity (dimensionless); Ker and Kei are zero-order Kelvin functions; rw and rc are the radii of the well and well casing, respectively; and ω is the tidal frequency (Hz).
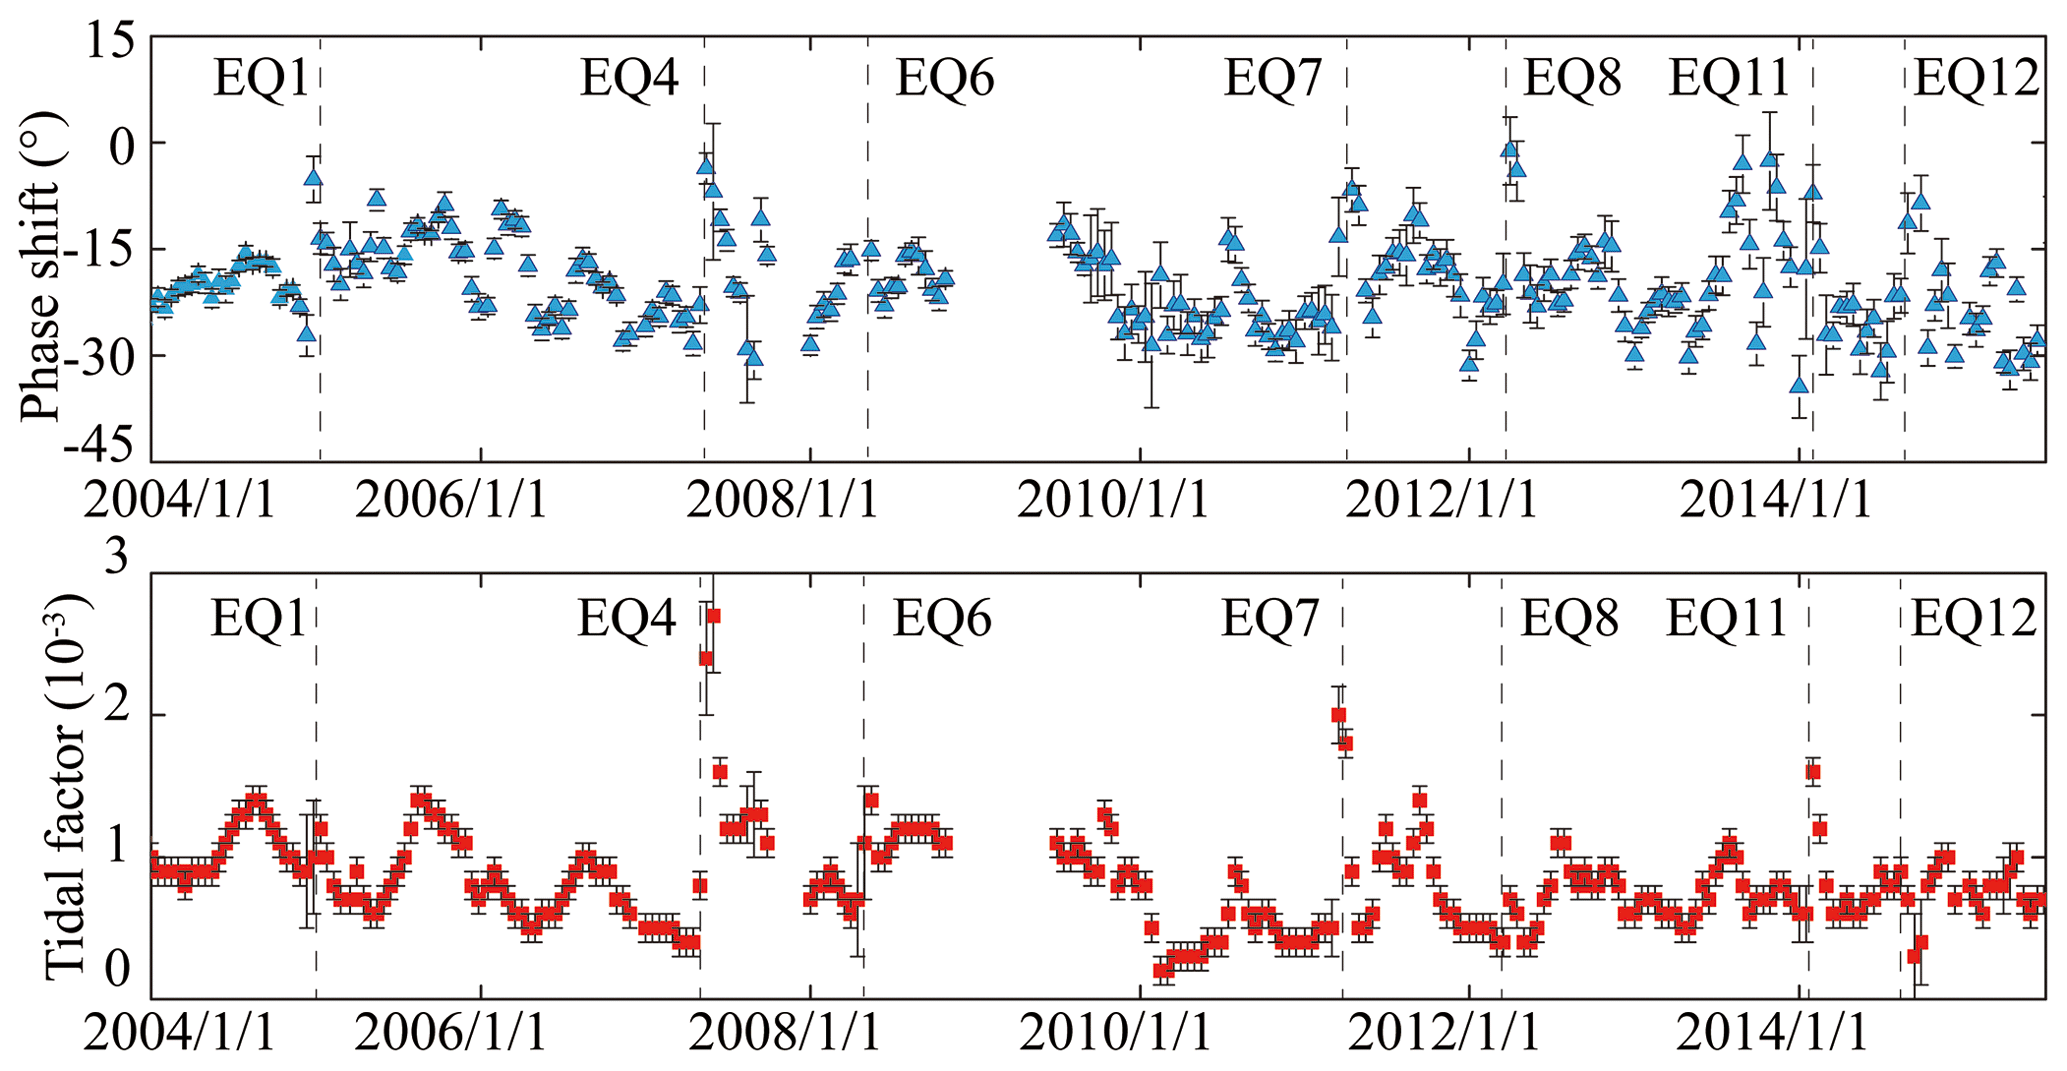
Figure 4Phase shift and tidal factor of M2 tidal constituent using water-level observations in Dazhai well between 2004 to 2015. Vertical dashed lines indicate earthquake events.
Spectral analysis was conducted to identify the multiple components inducing water-level fluctuations in DZ well (Fig. S5). The obvious amplitudes were observed in a frequency band of 0–3 cpd, indicating that the water level in Dazhai well responds to Earth tides (Qu et al., 2020). In order to obtain the phase shift and amplitude information of the water-level time series, we used tidal analysis in the calculations. We used a common tidal analysis program (Baytap-G) and set a period of 30 d with an overlap of 15 d (Tamura et al., 1991). For Earth tide, O1, K1, M2, and S2 are the main waves that account for at least 95 % of all tidal waves. Here, we only chose the M2 wave for further analysis as it is stable and relatively unaffected by barometric pressure. We focus on the evolution in aquifer properties induced by seismic activity based on post-seismic water level to recovery to the pre-seismic value that ranges from 13 to 70 d. We considered earthquakes that occurred within 3 months of each other as a single earthquake to reduce post-seismic effects on the aquifer properties. During this time interval, earthquakes with the greatest seismic energy density were selected for tidal analysis, which totaled seven earthquakes (EQ1, EQ4, EQ6–EQ8, and EQ11–12). The 3-month averages of phase shift and amplitude before and after earthquakes were used to calculate the aquifer parameters. We collect the monitoring data of barometric pressure in the city of Simao and find that barometric pressure fluctuation would not have an effect on the result of our tidal analysis (Figs. S6, S7 and S8). The phase shift and tidal factor changes following earthquakes can be clearly identified in Fig. 4, which are summarized in Table 2.
Table 2Aquifer parameters estimated using tidal analyses before and after selected earthquakes in Dazhai well, western Yunnan, China.
As is shown in Fig. 4, the errors are much smaller than the changes that are caused by the earthquakes, which represent the 95 % confidence interval. There is no periodic variation on the tidal factor. During the monitoring period, the tidal factors range from to , and the average value is . During the aseismic period, the rate of changes ranges from 0 to 75% compared with the mean value of tidal factor. However, the changes are 50 %, 237.5 %, 87.5 %, 150 %, 12.5 %, 100 %, and 25 % following EQ1, EQ4, EQ6, EQ7, EQ8, EQ11, and EQ12, which are greater than that during the aseismic period. Thus, the changes of tidal factor induced by earthquakes are real and significant.
The average value of phase shift is −20∘ during 2004–2015, and it ranges from −31 to −11∘ during the period without earthquakes. However, the phase shifts following EQ1, EQ4, EQ7, and EQ8 are greater than −10∘, which is also significant with that during aseismic period. During the pre-seismic and post-seismic period of EQ11 and EQ12, the phase shift following these earthquakes is also > −10∘, and it shows a wide range of fluctuation which looks like “noise”, but it is not actually noise. The reason for the phenomenon may be that the epicentral distance of EQ11 and EQ12 is 4 and 100 km, respectively, and the aquifer properties are continuous change caused by crustal strain change during the earthquake preparation process. In addition, because of the short interval between the two consecutive earthquakes, the aquifer properties may have been affected by the previous earthquake and not recovered.
As proposed by Hsieh et al. (1987), the phase shift and tidal amplitude are related to the aquifer transmissivity and storage coefficient, so that changes in phase shift and tidal amplitude also indicate changes in aquifer hydraulic properties following earthquakes. The tidal amplitude reflects the ability of an aquifer system to respond to Earth tidal changes induced by earthquakes and is affected by aquifer properties (e.g., undrained compressibility, Poisson's ratio, and fluid compressibility), while variations in phase shift are related to permeability changes (i.e., small phase shifts are related to high aquifer permeability, while large ones are related to low permeability). The hydraulic diffusivity D (m2 s−1; equal to the ratio of T to S), is introduced to accurately depict the changes in aquifer parameters, where results imply that earthquakes cause the change of hydraulic diffusivity ranges from 9 % to 515 %.
4.2 Changes in vertical permeability
Hsieh's model only analyzes the earthquake-induced horizontal permeability changes. The vertical permeability change caused by earthquakes can be detected by comparing the amplitude and the tidal phase shift (Liao et al., 2016; Wang et al., 2016). As is shown in Fig. 5, the amplitude and phase shift inferred from before and after earthquakes fall into two distinct groups (red dots and blue dots). In addition, for a given value of H, the X versus η relationship can be represented by a single curve in the plot, which is uniquely determined by T and S. Dots before earthquakes (blue) and after earthquakes (red) fit two curves with different values of H, which indicated the changes of vertical permeability in the aquifer system (Liao et al., 2016).
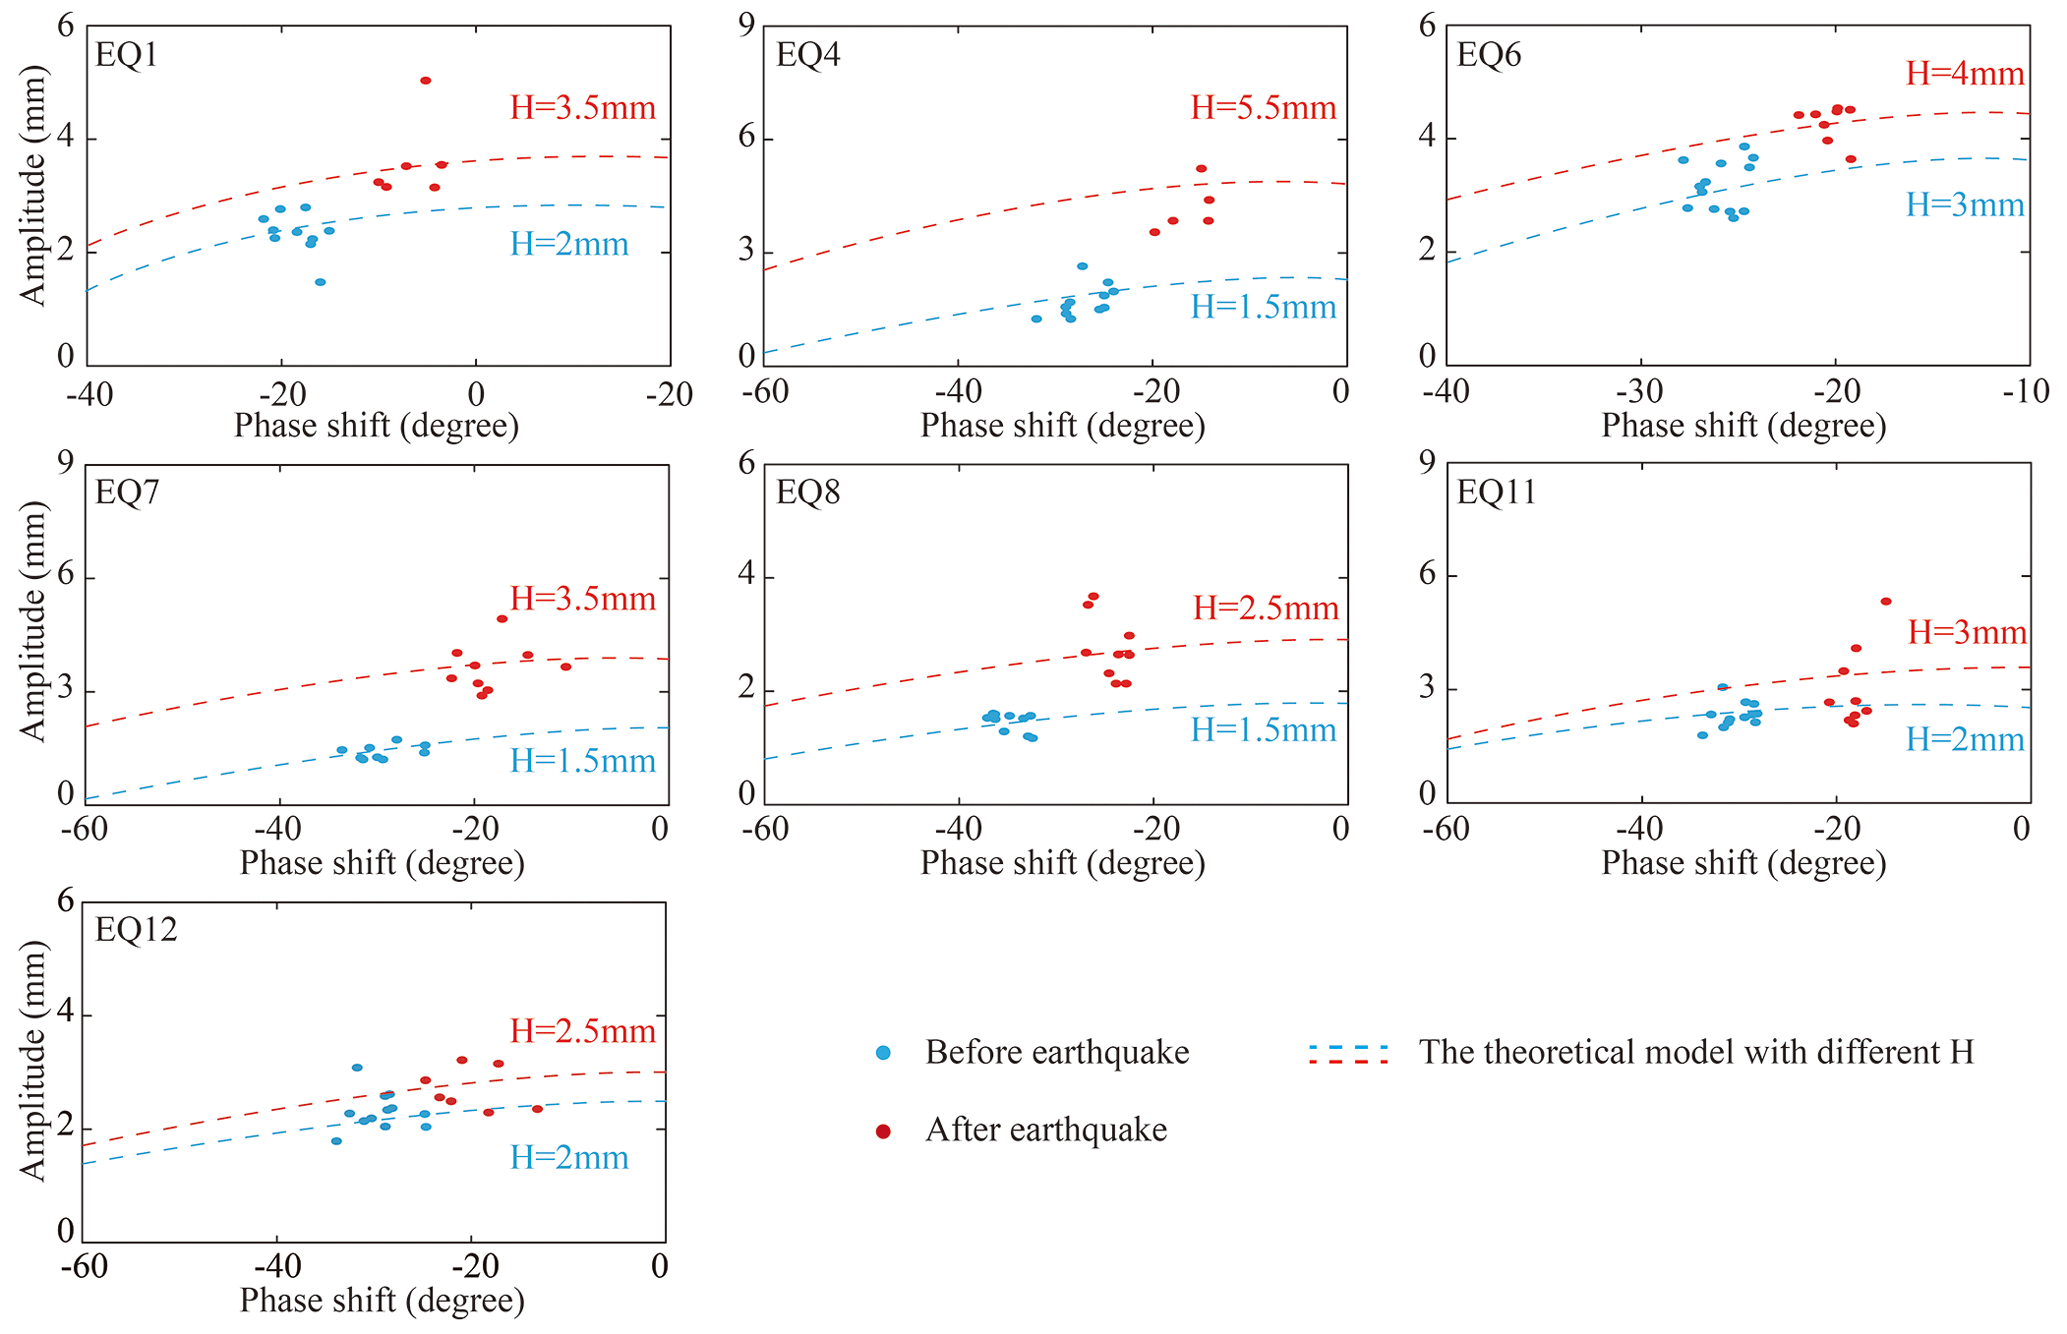
Figure 5Amplitude versus phase shift at the frequency of the M2 wave. Dots before earthquakes (blue dots) and after earthquakes (red dots) fit two curves that represent the theoretical model (Eqs. 2 and 3) with different values of H, respectively.
5.1 Mechanisms of water-level coseismic responses
Static and dynamic strain mechanisms have been proposed to explain coseismic water-level responses where static strain changes aquifer permeabilities, resulting in variations in pore pressure and fracture aperture (flow chart of different mechanisms and methods in Fig. S9), while the effects of dynamic strain include (1) undrained consolidation and liquefaction, (2) drainage from the unsaturated zone, (3) bubbles mobilization through highly fracture, (4) the formation of new fractures, and (5) unclogging of preexisting fractures due to the propagation of seismic waves. In this section, we will discuss the impacts of static and dynamic strain on water-level coseismic responses in DZ well.
5.1.1 Static strain
Static strain induced by fault slip may lead to the dilation of fractures which will change the pore pressure and the jog volume. For our data, static strain produced by large, distant earthquakes with epicentral distances > 2000 km (EQ1 and EQ8) is lower than for earthquakes listed in Table 2; thus we use the near-field earthquakes listed in Table 2 to analyze the change of jog volume and fluid pressure.
The elastic or permanent deformation of crust associated with the fault slip causes static strain. It is assumed that the fault jog was occupied by the fluid before earthquakes. When the frictional strength of the fault is exceeded under the accumulation of tectonic stress, we may estimate the relative volume change of fault jog according the seismic moment (M0),
where μ is the shear rigidity of the host rock, A is the surface area of the rupture, and s is the average slip over the rupture area. The seismic moment can be converted to the moment magnitude (Mw):
The rupture length (L) of seismogenic fault is the function of moment magnitude (Wells and Coppersmith, 1994), as follows:
The down-dip width (W) and the average slip (s) can be calculated by the established empirical relation (Weatherley and Henley, 2013):
Based on the above parameters, the relative volume change of fault jog could be estimated by
where w is the vertical extent of the jog, and Dj is the jog length; it is assumed that Dj= 1 m (Weatherley and Henley, 2013). The relative volume change of fault jog is summarized in Table 3 following different near-field earthquakes.
Table 3The relative change of volume and fluid pressure following the near-field earthquakes.
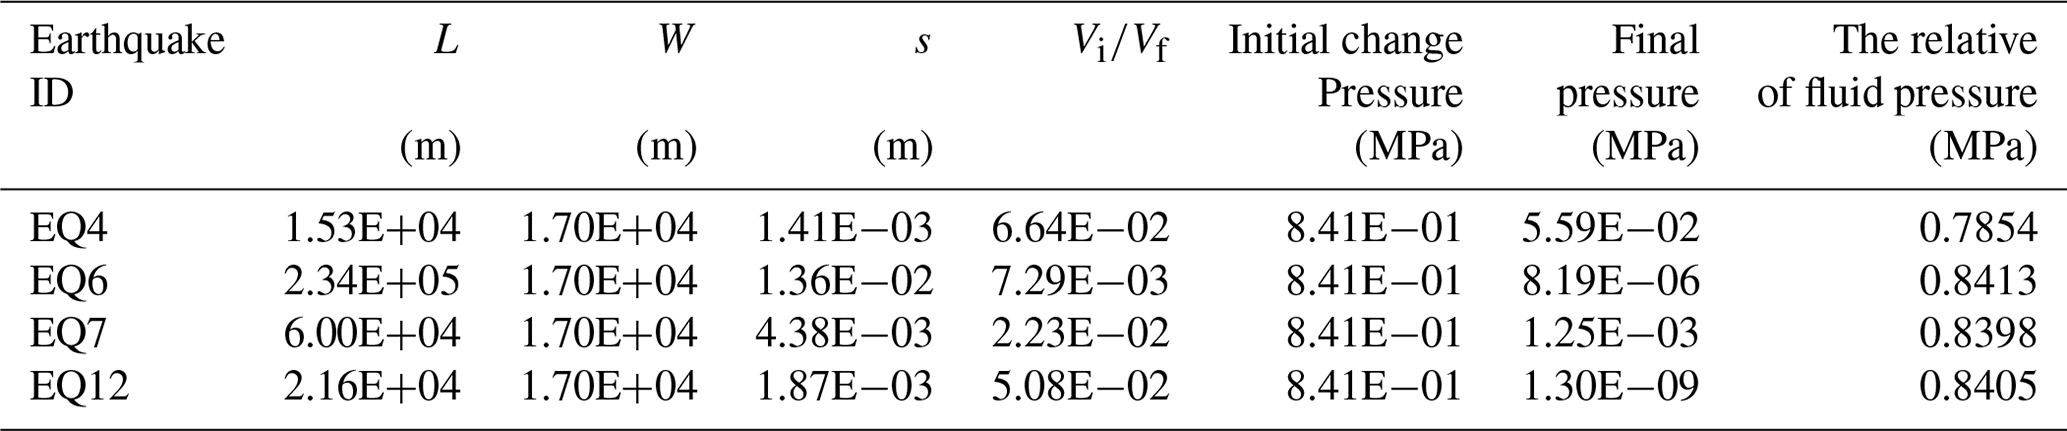
Based on the assumption of isothermal expansion, the fluid pressure changes in the fault jog associated with the volume change of fault jog are considered the behavior of ideal gas with the equation of state PV = nRT (Weatherley and Henley, 2013). According to the 11-year observed mean value of water level, the initial pressure (P) of the fluid before the earthquake is calculated as
where ρ= 1000 kg m−3, g= 9.81 m s−2 is the gravitational acceleration, and z is the depth. Then, the relative change of fluid pressure is calculated by
where the subscripts “i” and “f” indicate values before (initial) and after (final) the earthquake. The significant differences of final fluid pressure varying with the different depths are summarized in Table 3. For different earthquakes, the magnitudes of relative change of fluid pressure are different. According to P=ρgh, the relative change of fluid pressure can cause the magnitude of coseismic response of water level to exceed 80 m in theory, which is inconsistent with the observed value of DZ well. Due to the action of the discharge port on the wellbore, a part of coseismic increased groundwater is discharged by the discharge port. The actual maximum change of water-level coseismic response should be greater than the observed value. We estimate that the actual maximum change of water-level coseismic response should be 0.35–0.83 m, which is the sum of the observed maximum change and the conversion of the volume of discharge groundwater into the height of water level in wellbore, based on the equation of V=πR2H, where V is the volume of discharged groundwater, H is the height of water level, and R is the radius of wellbore. But these results are still 2 orders of magnitude smaller than the theoretical value of water-level change estimated by the relative change of fluid pressure. Thus, the water-level coseismic response may not be attributed to the fluid pressure change induced by static strain.
The relative change of fluid pressure only calculates the theoretical value of relative magnitude of water-level change but cannot judge whether water level is rising or declining following earthquakes theoretically. The Okada (1992) model is introduced to further evaluate the relationship between the water-level coseismic response and static strain, which indicates that the change of static strain causes the water levels to decline in the expansion zone and rise in the contraction zone (Okada, 1992; Toda et al., 2011). Table S1 in the Supplement summarizes fault-plane solutions obtained from the USGS for hypocentral depth, strike, dip, and rake.
Observed coseismic water-level changes following EQ12 are consistent with this model, while the coseismic responses following EQ4 and EQ7 are opposite to the prediction (Fig. S10). We conclude that the distribution of coseismic water-level responses during seismic activity is more complex than the quadrantal distribution expected from the theoretical model. Thus, based on the analysis of the relative change of fluid pressure and the Okada model, the coseismic response of water level in DZ well cannot be attributed to the static strain because it only explains a subset of the coseismic water-level responses. In addition, the large distant earthquakes (epicentral distances > 2000) also cause the coseismic responses of water level in DZ well, while static strain is extremely small for these distant earthquakes, thus implying that the mechanism of coseismic responses is attributed to dynamic strains.
5.1.2 Dynamic strain
As DZ well is located in a highly fractured aquifer, the coseismic hydrological responses are more likely caused by the mechanism of dynamic strain. Of the five potential dynamic causes, the first two (undrained consolidation and liquefaction, unsaturated zone drainage) can be omitted because the observation well is located within consolidated rocks, and no liquefaction was observed during seismic activity. Moreover, the variation of water-level in DZ well is sensitive to Earth tides, which indicates that the content of compressible gaseous phase is less than 10−4 % of the aquifer (Brodsky et al., 2003). Thus, the mechanism of bubble mobilization through high fracture is unlikely. In addition, the result of tidal analysis indicates that these earthquakes caused changes in aquifer properties; the phase shift increased following earthquakes and recovered within several weeks to months afterward, indicating that the earthquake-induced permeability changes were transient, not permanent. The change of the permeability and poroelastic properties within the fault damage zone may be attributed to the dynamic strain caused by the passage of seismic waves. Thus, we consider that earthquake-induced dynamic stress leading to unclogging of preexisting fractures under the propagation of seismic waves is a plausible mechanism for the observed behavior. According to the aquifer lithology of Dazhai deep well, there were two different aquifers separated by a thin aquitard (mudstone), and the pore pressure of the deeper aquifer is higher than the shallow one; such a hydrogeological setting makes the upwelling of groundwater from deep aquifers possible when the hydraulic connection is created following earthquakes (Fig. 6). In the unclogging process, precipitates and colloidal particles are removed from the clogged fractures by the propagation of seismic waves, which connects aquifers at different depth. After earthquakes, permeabilities gradually recover through geochemical and biogeochemical processes or by the re-clogging of fractures, causing water levels to recover to pre-earthquake levels (Manga et al., 2012; Xue et al., 2013; Shi and Wang, 2015).
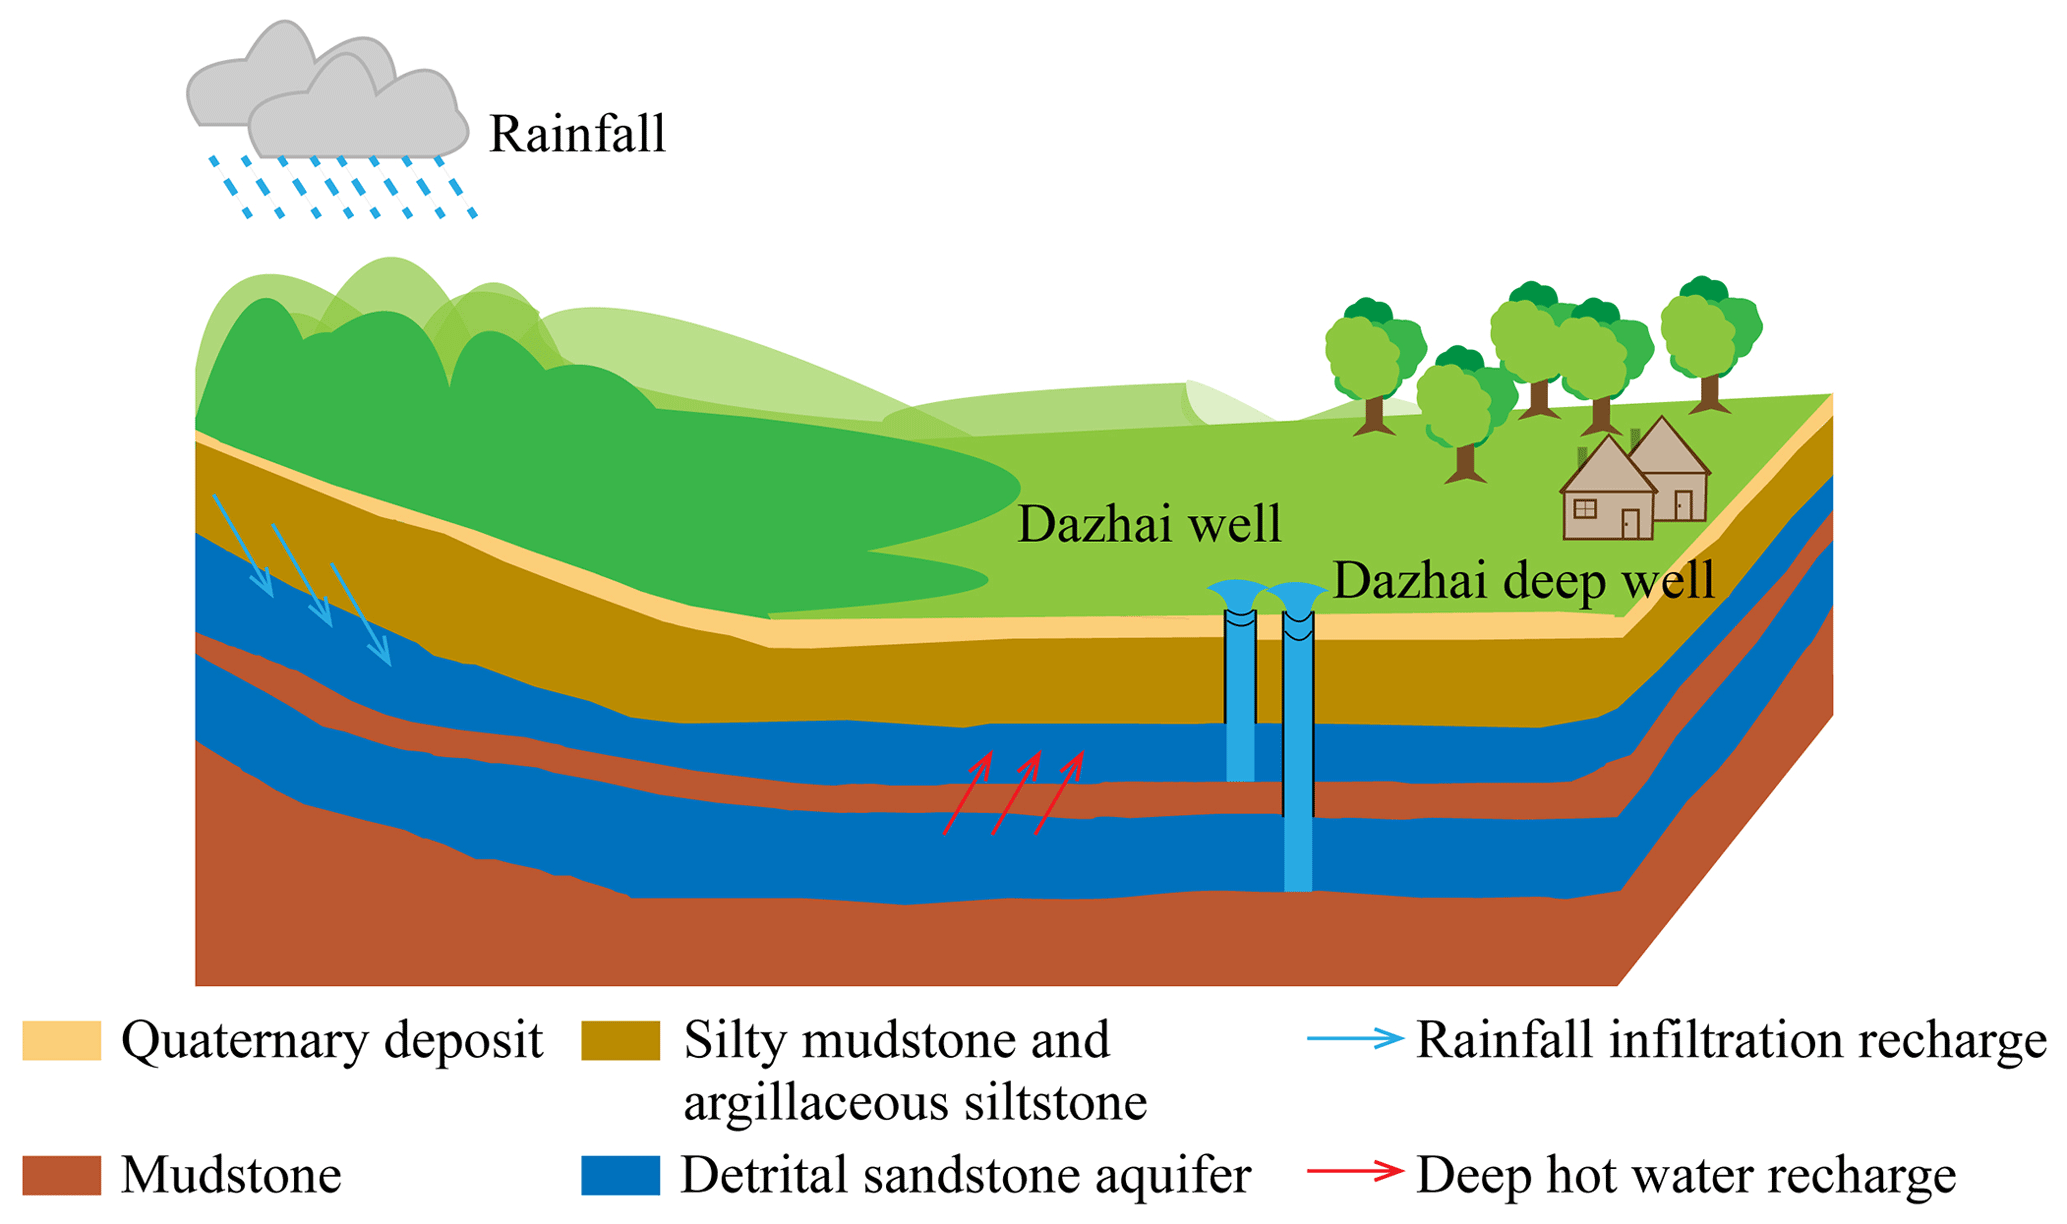
Figure 6Conceptual model for the recharge process and hydrological coseismic response in Dazhai well.
Yet, unclogging only qualitatively explains the change of water levels following earthquakes and does not explain the different magnitudes of changes following different earthquakes. Alternatively we infer that the different magnitudes of water-level change are associated with the total volume of excess recharge to the aquifer during seismic activity, where the volume of aquifer recharge can be described by Wang et al. (2004):
where Q is the total excess water recharge to the aquifer from deeper aquifer, t is the time since the earthquake occurred, and τ is characteristic time. The solution to the groundwater flow equation can be determined by two parameters (Q and τ) that are determined by fitting Eq. (15) to the observed discharge time series using the nonlinear least-squares Marquardt–Levenberg algorithm (Fig. 7). The accuracy and efficiency of model fitting results are shown in Table S2 and Fig. S11.
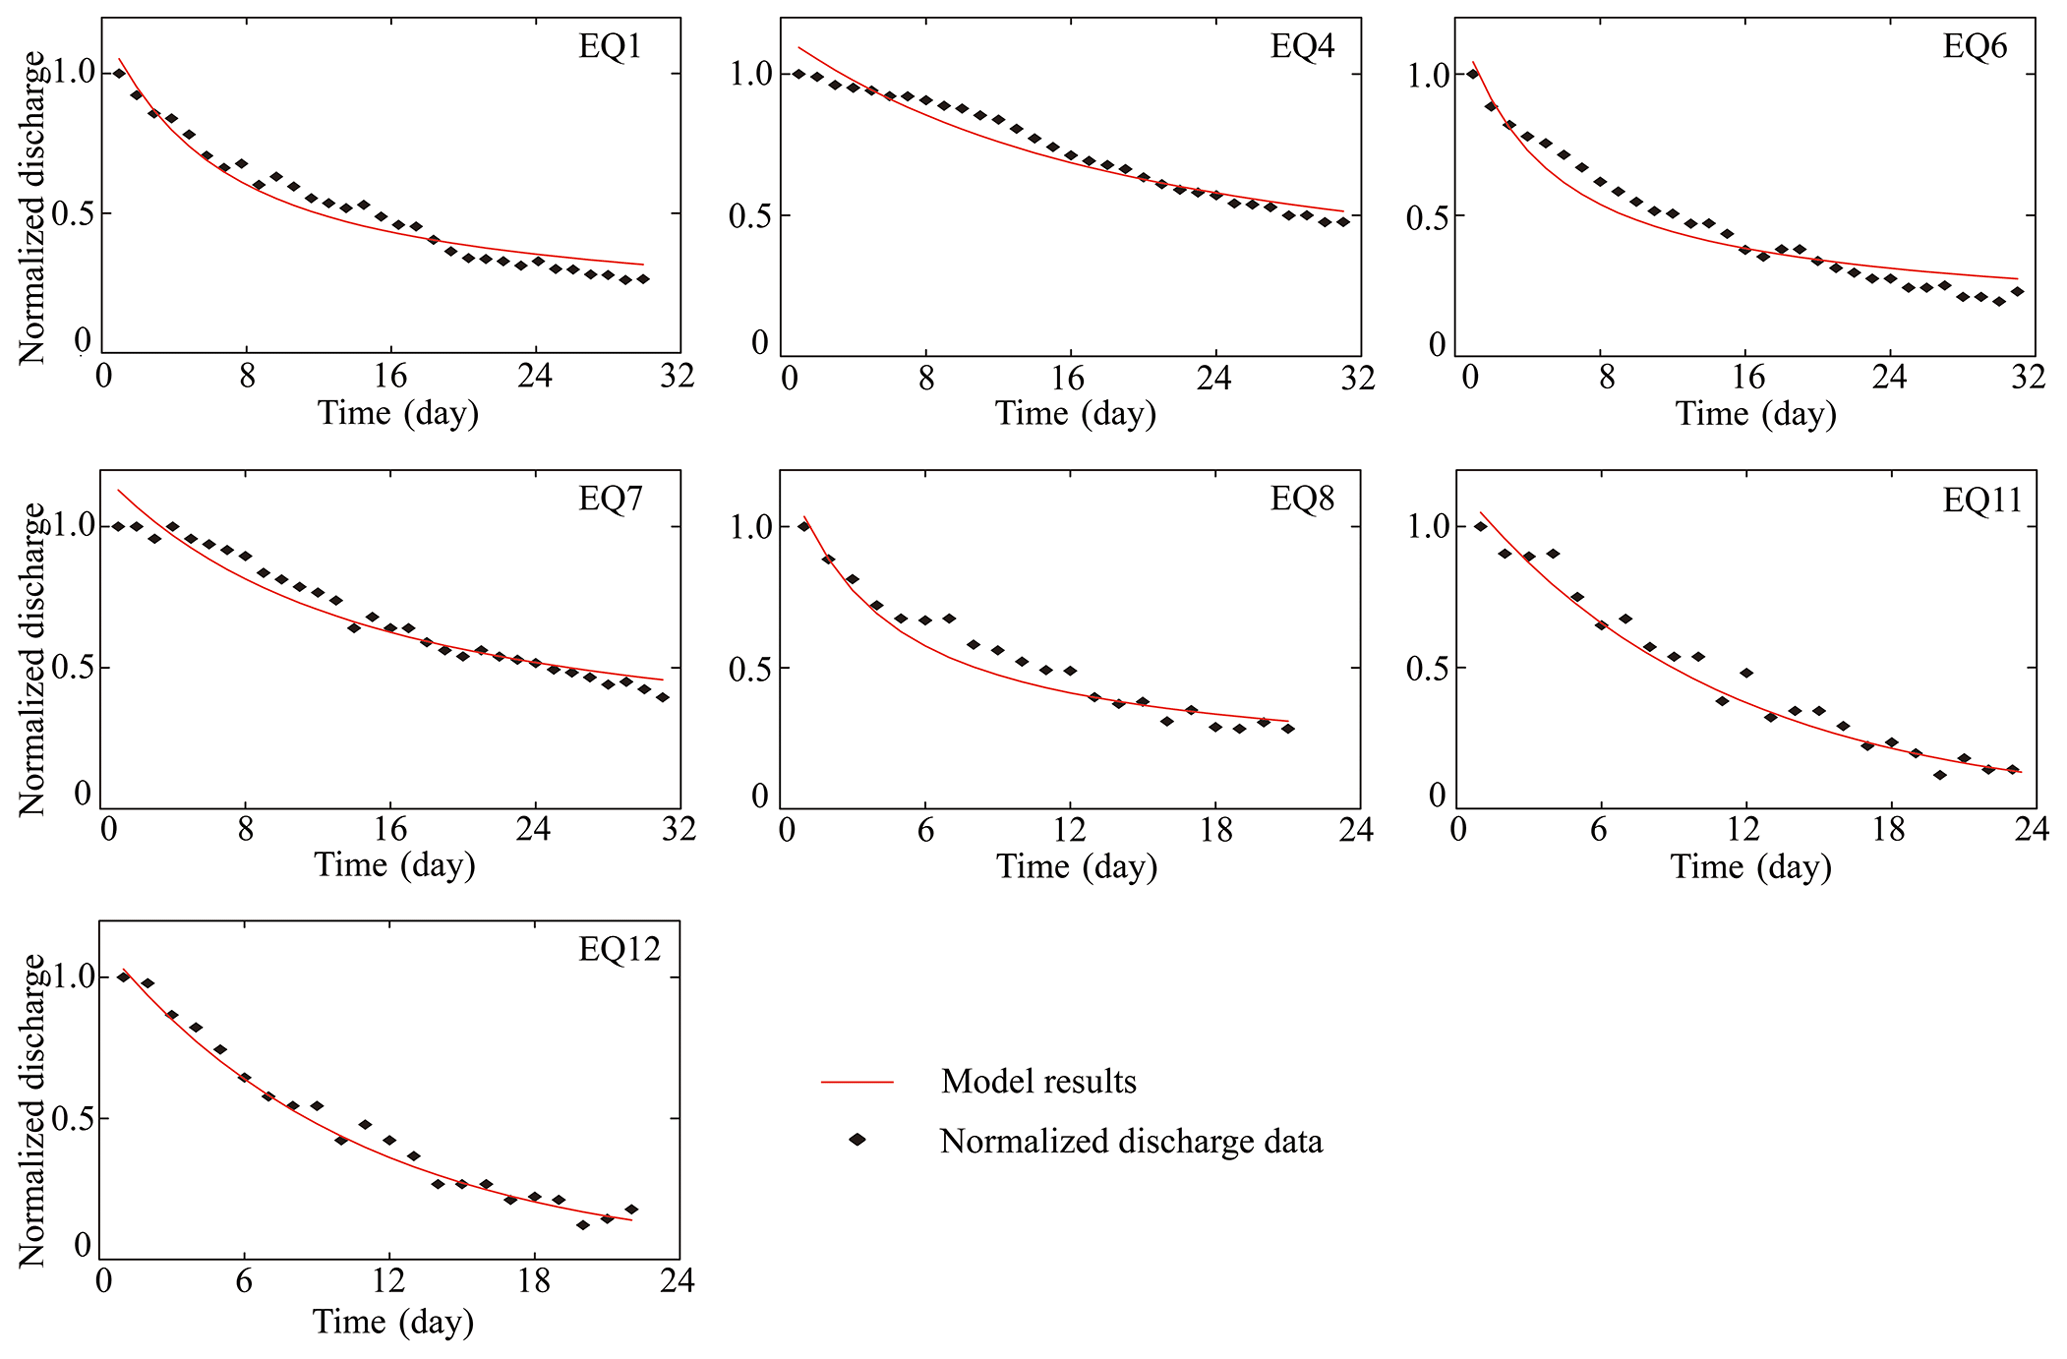
Figure 7Model results compared with normalized discharge data for the discharge coseismic response in DZ well.
Excess recharge predicted by the one-dimensional conceptual model is summarized in Table 4. The excess recharge caused by earthquakes differs for different earthquakes within the range of 85–273 m3. We conclude that this is the most plausible reason for the variation in water-level change magnitudes following each earthquake.
Table 4Parameters estimated by the data of discharge coseismic response in Dazhai well, western Yunnan Province, China.

5.2 Possible mechanism of water temperature coseismic change
The dynamic strain mechanism describes the process of coseismic water-level change, while the one-dimensional diffusion model can explain the different magnitudes of anomalous water-level change following each earthquake. Because they cannot reveal the source of water recharge to the aquifer, we analyzed the coseismic water temperature changes to further identify the origin and processes of the coseismic groundwater responses. Several mechanisms have been proposed for groundwater temperature changes following earthquakes, including heat loss through the walls of boreholes (Kitagawa and Koizumi, 2000), gas escape from groundwater (Ma, 2016; He et al., 2017), friction induced by seismic waves (Fulton et al., 2013; Tanaka et al., 2006; Mori et al., 2010), and changes in the mixing ratios of groundwaters with different temperatures (Shi et al., 2018; Mogi et al., 1989). Although heat can be propagated by radiation, convection through pores, and conduction through solid phases, solar radiation only occurs at the Earth's surface, which has little effect on groundwater temperature. Also, temperatures should change gradually if groundwater exchanges heat with the rock matrix, which is inconsistent with our observations. The gas-escape mechanism explains groundwater temperature changes caused by large amounts of dissolved gases escaping from groundwater (a phase change from liquid to gas), which absorbs heat from the surrounding environment that is then dissipated, causing the water temperature to decrease. Yet this explanation is also inconsistent with our step-like increases. Friction heat caused by seismogenic faults may explain coseismic water temperature responses in some locations close to earthquake epicenters but cannot cause temperature responses at great distances.
Because groundwater is an important carrier fluid for heat transfer, changes in water level, flow rate, and temperature occur simultaneously, which indicates that groundwater flow plays an important role in coseismic responses of water temperature for our system. Thus, the mechanism of mixing of different sources of water is likely to explain the synchronous changes in groundwater discharge and temperature. Several previous studies have documented that mixing of deeper fluids and meteoric water in the crust may play a key role in changing the physical and chemical characteristic of the groundwater (Kaown et al., 2021; Li et al., 2019; Skelton et al., 2014b; Jellicoe et al., 2022; Woith et al., 2013). The fault zone could act as a good conduit that connects the shallow and deep groundwater. For the hydrothermal spring in the fault zone, it usually mixes with the shallow cold water during its rising to the surface. And groundwater in the fault zone aquifer may also originate from different depths of the aquifers. Previous studies suggested that earthquakes could lead to the enhancement of permeability in the low permeability layer (Fischer et al., 2017) or reduction of permeability in high flow path (Shi et al., 2018), causing the changes of mixing ratio between shallow and deep groundwater, and thus lead to the changes of flow rate and chemical components in groundwater (Sato et al., 2020; Li et al., 2019). However, few studies have investigated the earthquake-induced changes both in discharge and temperature in a quantitative way. An end-member mixing model is widely used to quantify the different contributions of groundwater from two or more sources, which is based on assumptions that the spatial distribution of groundwater with distinct characteristics is nonuniform. In this study, we use the end-member mixing model to describe the anomalous change of discharge and water temperature following earthquakes. The possible end-member is analyzed and identified in the following part.
We observed an increase of the water level and flow rates which are not related with precipitation as only 3 and 0.9 mm, which occurred in December 2004 (EQ1) and February 2014 (EQ11), respectively. Wavelet coherence analysis is widely used to identify the influences on water temperature variation in the absence of earthquakes (Zhang et al., 2020a). As shown in Fig. S12 of the Supplement, there is high coherence between meteorological and hydrological data for around a year throughout the measurement period. However, the mean phase angles between discharge (water temperature) and rainfall are about 45∘, indicating a lead of rainfall about 1–1.5 years, which implies that the excess recharge to the aquifer is not directly originated from precipitation. Although DZ well only penetrates one aquifer, according to the borehole information of Dazhai deep well, there were two different aquifers separated by a thin mudstone aquitard. Seismic activities cause the increased permeability of the aquitard and make the upwelling of groundwater from the deep aquifer possible when the hydraulic connection is created (Fig. 6). Thus, we consider the mixing process between them.
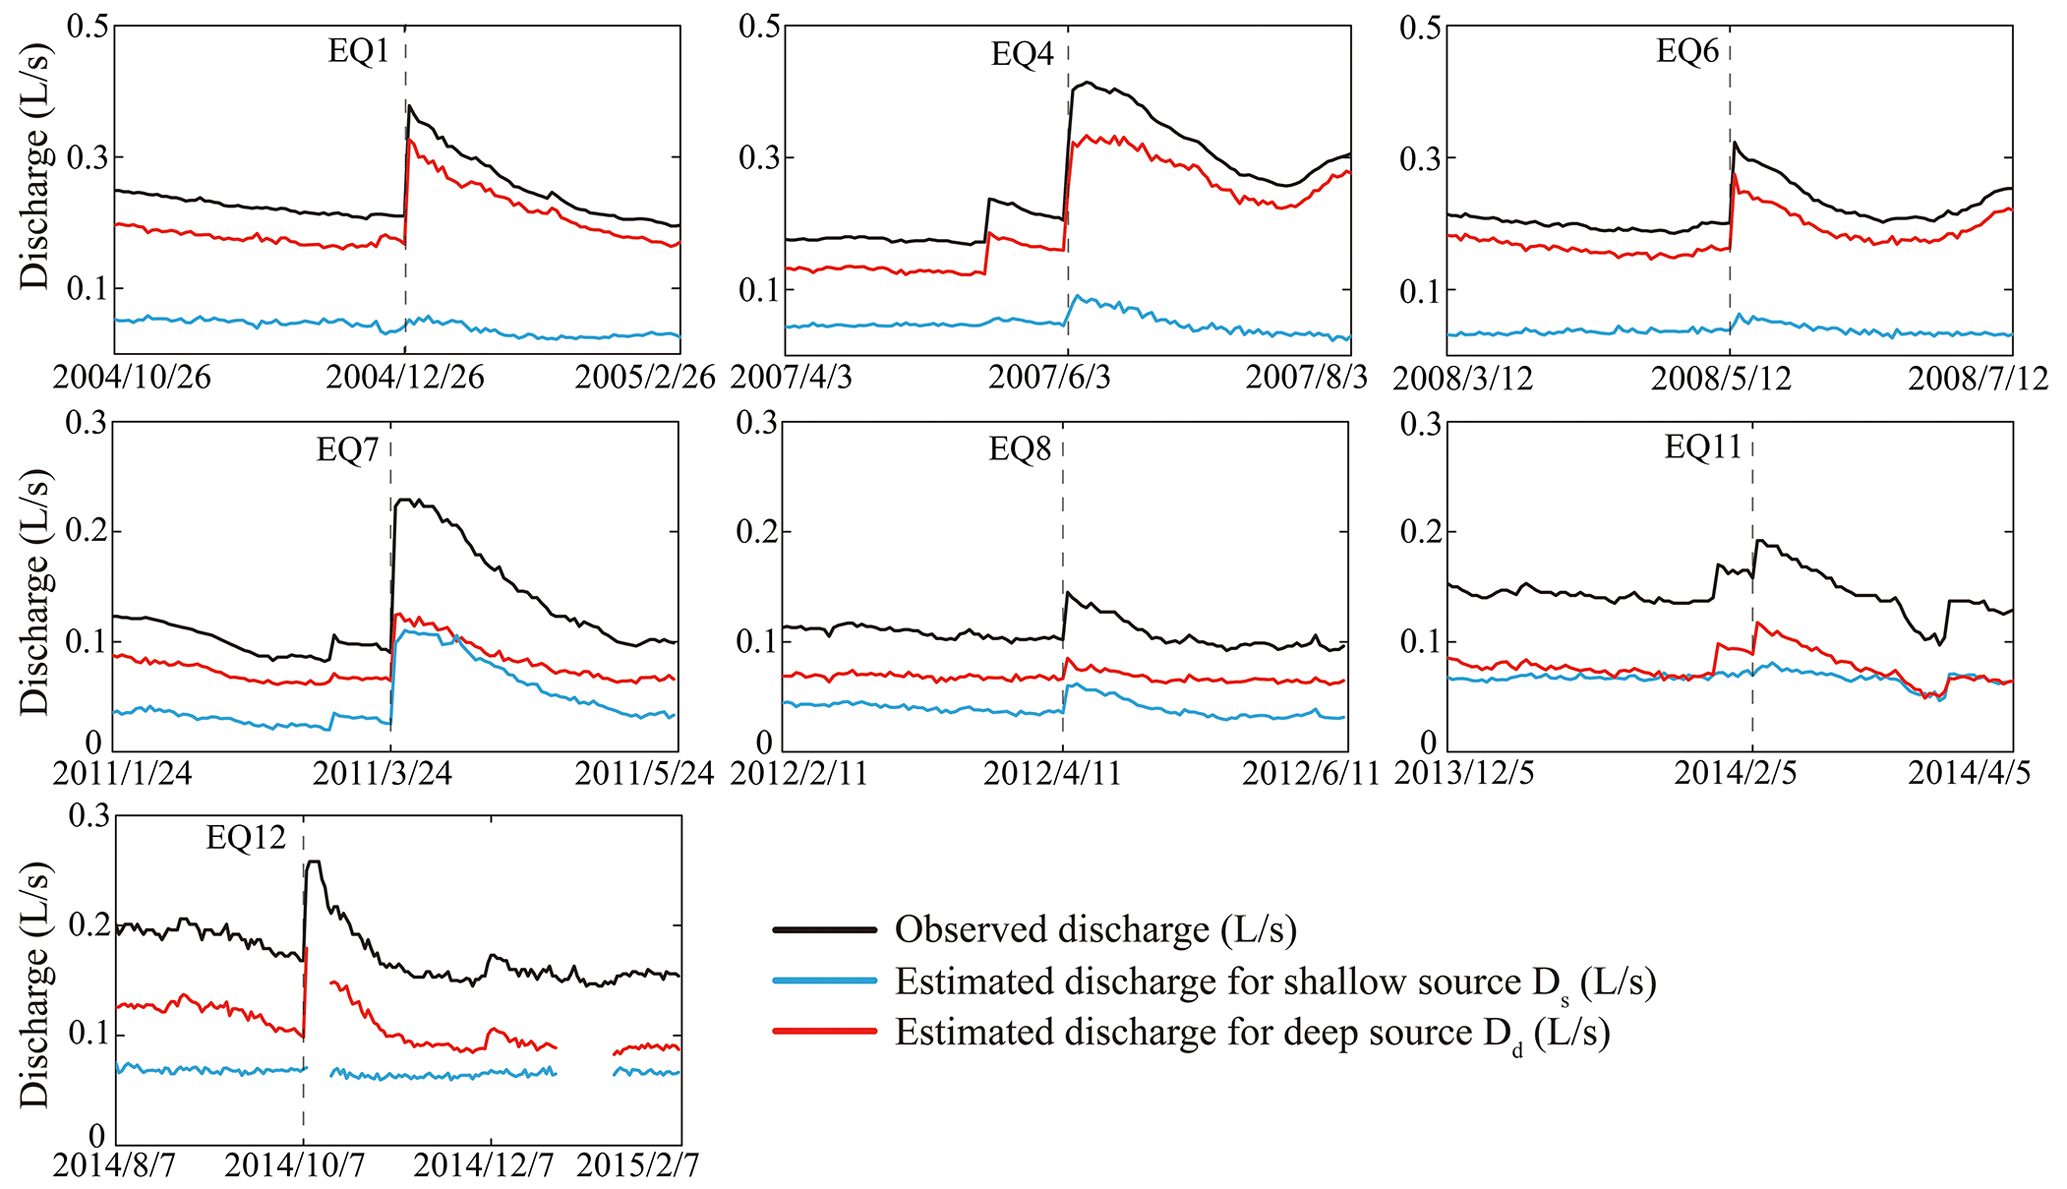
Figure 8Observed and estimated discharge for shallow and deep source following selected earthquakes.
For the selection of end-members, there are no limitations on the number of them in the hydrologic model, but the general rule is to use as few as possible to describe the observed anomalous phenomena (Laaksoharju et al., 2008). Thus, we assume that the different magnitudes of water temperature change are also caused by the mixing of these from distinct end-members at different ratios following earthquakes. The earthquake-induced mixing process between the shallow and deep aquifer can be described by the following equations (Kitagawa and Koizumi, 2000):
where Dobserved is the observed discharge; Ds and Dd denote the discharge from shallow and deep aquifers, respectively; Tobserved is the observed water temperature; and Ts and Td are the water temperatures of shallow and deep aquifers, respectively. We infer that the water temperature responses caused by earthquakes are related to changes in discharge from the shallow and deep aquifers.
During the monitoring period, temperatures ranged between 21.7788 and 21.9325∘, a difference of 153.7 mK that remained within this range even following seismic events. To explain temperature variation following these events, we employed a two-end-member mixing model, where we assume two aquifers at different depth that are hydraulically connected following earthquakes: one is shallower with a lower temperature (21.7788∘), while the other is deeper with a higher temperature (21.9325∘), which corresponds to the extremal temperatures observed during the period of record.
Discharge from each end-member is then estimated using
Figure 8 presents the calculated discharge for each end-member, with end-members 1 and 2 changing following earthquakes; for EQ1, EQ11, and EQ12, the estimated discharge for shallow aquifer remained unchanged before and after earthquakes, while discharge from deep aquifer increased sharply after earthquakes, which may be due to the permeability increase in deep aquifers, which results in more warm groundwater entering the wellbore. For the other four earthquakes, the estimated discharge from shallow and deep aquifers varied, with the magnitude of change varying according to the earthquake. The change in discharge from deep aquifers was always greater than that from shallow aquifers, which is the main cause of the coseismic water temperature response. Thus, we conclude that the coseismic water temperature response can be attributed to earthquake-induced permeability increases, which result in warmer groundwater entering the wellbore. The different magnitudes of water temperature change following each earthquake are caused by changes in the mixing ratios of shallow and deep aquifers with different temperatures.
We document groundwater levels, temperatures, and flow rate responses following 14 earthquakes in an artesian well in western Yunnan Province, China. The well always shows step-like groundwater-level responses and increased flow rates and temperatures following earthquakes. Tidal analysis indicates that the aquifer's hydraulic diffusivity changes following earthquakes. Due to the unclogging of preexisting fractures under the propagation of seismic waves, the hydrogeological setting makes the upwelling of groundwater from the deeper aquifer possible when the hydraulic connection is created following earthquakes, which is the likely mechanism explaining the coseismic water-level response. The excess groundwater recharge from the deep aquifer, ranging from 85 to 273 m3 for the 14 earthquakes, leads to different magnitudes of water-level changes. A groundwater mixing model based on observed water temperatures is used to estimate mixing processes of waters with different temperatures before and after earthquakes, which shows that earthquakes induce recharge from both shallow and deep aquifers.
The Coulomb 3.3 model used in this study is available at https://pubs.usgs.gov/of/2011/1060 (Toda et al., 2011). The code of discharge fitting model is available at https://doi.org/10.5281/zenodo.7528334 (Zhang et al., 2022). The water level, flow rate, and temperature data from Dazhai well can be obtained from https://doi.org/10.5281/zenodo.4746408 (Zhang et al., 2020b).
The supplement related to this article is available online at: https://doi.org/10.5194/hess-27-401-2023-supplement.
ZS and SZ developed the initial idea of the current study, and ZS established the models with inputs from all coauthors. SZ and ZS were involved in data interpretation. ZS and SZ wrote the manuscript with contributions from GW, ZZ, and HG. SZ, ZZ, and HG were involved in data curation. GW provided research funding.
The contact author has declared that none of the authors has any competing interests.
Publisher’s note: Copernicus Publications remains neutral with regard to jurisdictional claims in published maps and institutional affiliations.
We thank the editor Hongkai Gao, Giovani Martinelli, and one anonymous reviewer for their constructive comments and suggestions which have helped us greatly improve the quality of the manuscript.
This research has been supported by the National Natural Science Foundation of China (grant nos. U1602233 and 41972251) and by the 111 Project (grant no. B20010).
This paper was edited by Hongkai Gao and reviewed by Giovanni Martinelli and one anonymous referee.
Anderson, M. P.: Heat as a Ground Water Tracer, Ground Water, 43, 951–968, https://doi.org/10.1111/J.1745-6584.2005.00052.X, 2010.
Brodsky, E. E., Roeloffs, E., Woodcock, D., Gall, I., and Manga, M.: A mechanism for sustained groundwater pressure changes induced by distant earthquakes, J. Geophys. Res.-Sol. Ea., 108, 2390, https://doi.org/10.1029/2002jb002321, 2003.
CEA: The observation method of earthquake-related underground fluid: Observation of water level in well, DB/T 48-2012, China Earthquake Administration, https://www.cea.gov.cn/eportal/fileDir/defaultCurSite/resource/cms/2018/03/2018030110383875846.pdf (last access: 13 January 2023), 2012.
Chien, S. H. J., Chi, W. C., and Ke, C. C.: Precursory and coseismic groundwater temperature perturbation: An example from Taiwan, J. Hydrol., 582, 10, https://doi.org/10.1016/j.jhydrol.2019.124457, 2020.
Deng, J., Wang, Q., Gao, L., He, W., Yang, Z., Zhang, S., Chang, L., Li, G., Sun, X., and Zhou, D.: Differential crustal rotation and its control on giant ore clusters along the eastern margin of Tibet, Geology, 49, 428–432, https://doi.org/10.1130/G47855.1, 2020.
Fischer, T., Matyska, C., and Heinicke, J.: Earthquake-enhanced permeability – evidence from carbon dioxide release following the ML 3.5 earthquake in West Bohemia, Earth Planet. Sc. Lett., 460, 60–67, https://doi.org/10.1016/j.epsl.2016.12.001, 2017.
Fulton, P. M., Brodsky, E. E., Kano, Y., Mori, J., Chester, F., Ishikawa, T., Harris, R. N., Lin, W., Eguchi, N., and Toczko, S.: Low Coseismic Friction on the Tohoku-Oki Fault Determined from Temperature Measurements, Science, 342, 1214–1217, https://doi.org/10.1126/science.1243641, 2013.
Furuya, I. and Shimamura, H.: Groundwater microtemperature and strain, Geophys. J. Int., 94, 345–353, https://doi.org/10.1111/j.1365-246X.1988.tb05905.x, 1988.
He, A., Zhao, G., Sun, Z., and Singh, R. P.: Co-seismic multilayer water temperature and water level changes associated with Wenchuan and Tohoku-Oki earthquakes in the Chuan no. 03 well, China, J. Seismol., 21, 719–734, https://doi.org/10.1007/s10950-016-9631-3, 2017.
Hosono, T., Yamada, C., Shibata, T., Tawara, Y., Wang, C. Y., Manga, M., Rahman, A. T. M. S., and Shimada, J.: Coseismic Groundwater Drawdown Along Crustal Ruptures During the 2016 Mw 7.0 Kumamoto Earthquake, Water Resour. Res., 55, 5891–5903, https://doi.org/10.1029/2019WR024871, 2019.
Hsieh, P. A., Bredehoeft, J. D., and Farr, J. M.: Determination of aquifer transmissivity from Earth tide analysis, Water Resour. Res., 23, 1824–1832, https://doi.org/10.1029/wr023i010p01824, 1987.
Igarashi, G., Saeki, S., Takahata, N., Sumikawa, K., and Sano, Y.: Ground-Water Radon Anomaly Before the Kobe Earthquake in Japan, Science, 269, 60–61, https://doi.org/10.1016/0148-9062(96)86915-4, 1995.
Jellicoe, K., McIntosh, J. C., and Ferguson, G.: Changes in deep groundwater flow patterns related to oil and gas activities, Ground Water, 60, 47–63, https://doi.org/10.1111/gwat.13136, 2022.
Kaown, D., Lee, K.-K., Kim, J., Woo, J.-U., Lee, S., Park, I.-W., Lee, D., Lee, J.-Y., Kim, H., Ge, S., and Yeo, I.-W.: Earthquakes and very deep groundwater perturbation mutually induced, Sci. Rep.-UK, 11, 13632, https://doi.org/10.1038/s41598-021-92937-y, 2021.
Kim, J., Lee, J., Petitta, M., Kim, H., and Lee, K. K.: Groundwater system responses to the 2016 ML 5.8 Gyeongju earthquake, South Korea, J. Hydrol., 576, 150–163, https://doi.org/10.1016/j.jhydrol.2019.06.044, 2019.
Kitagawa, Y. and Koizumi, N.: A study on the mechanism of coseismic groundwater changes: Interpretation by a groundwater model composed of multiple aquifers with different strain responses, J. Geophys. Res.-Sol. Ea., 105, 19121–19134, https://doi.org/10.1029/2000JB900156, 2000.
Laaksoharju, M., Gascoyne, M., and Gurban, I.: Understanding groundwater chemistry using mixing models, Appl. Geochem., 23, 1921–1940, https://doi.org/10.1016/j.apgeochem.2008.02.018, 2008.
Li, B., Shi, Z. M., Wang, G. C., and Liu, C. L.: Earthquake-related hydrochemical changes in thermal springs in the Xianshuihe Fault zone, Western China, J. Hydrol., 579, 11, https://doi.org/10.1016/j.jhydrol.2019.124175, 2019.
Liao, X., Wang, C. Y., and Liu, C. P.: Disruption of groundwater systems by earthquakes, Geophys. Res. Lett., 42, 9758–9763, https://doi.org/10.1002/2015GL066394, 2016.
Ma, Y.: Earthquake-related temperature changes in two neighboring hot springs at Xiangcheng, China, Geofluids, 16, 434–439, https://doi.org/10.1111/gfl.12161, 2016.
Manga, M. and Rowland, J. C.: Response of Alum Rock springs to the October 30, 2007 Alum Rock earthquake and implications for the origin of increased discharge after earthquakes, Geofluids, 9, 237–250, https://doi.org/10.1111/j.1468-8123.2009.00250.x, 2009.
Manga, M., Beresnev, I., Brodsky, E. E., Elkhoury, J. E., and Wang, C. Y.: Changes in permeability caused by transient stresses: Field observations, experiments, and mechanisms, Rev. Geophys., 50, 2004, https://doi.org/10.1029/2011RG000382, 2012.
Manga, M., Wang, C.-Y., and Shirzaei, M.: Increased stream discharge after the 3 September 2016 Mw 5.8 Pawnee, Oklahoma earthquake, Geophys. Res. Lett., 43, 11588–11594, https://doi.org/10.1002/2016GL071268, 2016.
Miyakoshi, A., Taniguchi, M., Ide, K., Kagabu, M., Hosono, T., and Shimada, J.: Identification of changes in subsurface temperature and groundwater flow after the 2016 Kumamoto earthquake using long-term well temperature-depth profiles, J. Hydrol., 582, 10, https://doi.org/10.1016/j.jhydrol.2019.124530, 2020.
Mogi, K., Mochizuki, H., and Kurokawa, Y.: Temperature changes in an artesian spring at Usami in the Izu Peninsula (Japan) and their relation to earthquakes, Tectonophysics, 159, 95–108, https://doi.org/10.1016/0040-1951(89)90172-8, 1989.
Mohr, C. H., Manga, M., Wang, C.-Y., and Korup, O.: Regional changes in streamflow after a megathrust earthquake, Earth Planet. Sc. Lett., 458, 418–428, https://doi.org/10.1016/j.epsl.2016.11.013, 2017.
Mori, J. J., Li, H., Wang, H., Kano, Y., and Brodsky, E. E.: Temperature Measurements in the WFSD-1 Borehole Following the 2008 Wenchuan Earthquake (Mw 7.9), AGU Fall Meeting Abstracts, https://ui.adsabs.harvard.edu/abs/2010AGUFM.T53E..03M/abstract (last access: 13 January 2023), 2010.
Okada, Y.: Surface Deformation due to Shear and Tensile Faults in a Half Space, B. Seismol. Soc. Am., 82, 1018–1040, https://doi.org/10.1016/0148-9062(86)90674-1, 1992.
Qu, S., Shi, Z., Wang, G., Xu, Q., and Han, J.: Using water-level fluctuations in response to Earth-tide and barometric-pressure changes to measure the in-situ hydrogeological properties of an overburden aquifer in a coalfield, Hydrogeol. J., 28, 1465–1479, https://doi.org/10.1007/s10040-020-02134-w, 2020.
Rahi, K. A.: Estimating the hydraulic parameters of the Arbuckle-Simpson aquifer by analysis of naturally-induced stresses, PhD dissertation, Oklahoma State University, https://shareok.org/bitstream/handle/11244/6426/Rahi_okstate_0664D_10810.pdf?sequence=1&isAllowed=y (last access: 13 January 2023), 2010.
Sato, T., Kazahaya, K., Matsumoto, N., and Takahashi, M.: Deep groundwater discharge after the 2011 Mw 6.6 Iwaki earthquake, Japan, Earth Planets Space, 72, 54, https://doi.org/10.1186/s40623-020-01181-7, 2020.
Shi, Z. and Wang, G.: Hydrological response to multiple large distant earthquakes in the Mile well, China, J. Geophys. Res.-Earth, 119, 2448–2459, https://doi.org/10.1002/2014JF003184, 2014.
Shi, Z. and Wang, G.: Sustained groundwater level changes and permeability variation in a fault zone following the 12 May 2008, Mw 7.9 Wenchuan earthquake, Hydrol. Process., 29, 2659–2667, https://doi.org/10.1002/hyp.10387, 2015.
Shi, Z. and Wang, G.: Aquifers switched from confined to semiconfined by earthquakes, Geophys. Res. Lett., 43, 11166–11172, https://doi.org/10.1002/2016GL070937, 2016.
Shi, Z., Zhang, S., Yan, R., and Wang, G.: Fault Zone Permeability Decrease Following Large Earthquakes in a Hydrothermal System, Geophys. Res. Lett., 45, 1387–1394, https://doi.org/10.1002/2017GL075821, 2018.
Shi, Z. M., Zhang, H., and Wang, G. C.: Groundwater trace elements change induced by M5.0 earthquake in Yunnan, J. Hydrol., 581, 9, https://doi.org/10.1016/j.jhydrol.2019.124424, 2020.
Skelton, A., Andrén, M., Kristmannsdóttir, H., Stockmann, G., Mrth, C. M., Sveinbjrnsdóttir, r., Jónsson, S., Sturkell, E., Gurúnardóttir, H. R., and Hjartarson, H.: Changes in groundwater chemistry before two consecutive earthquakes in Iceland, Nat. Geosci., 7, 752–756, https://doi.org/10.1038/ngeo2250, 2014a.
Skelton, A., Andrén, M., Kristmannsdóttir, H., Stockmann, G., Mörth, C.-M., Sveinbjörnsdóttir, Á., Jónsson, S., Sturkell, E., Guðrúnardóttir, H. R., Hjartarson, H., Siegmund, H., and Kockum, I.: Changes in groundwater chemistry before two consecutive earthquakes in Iceland, Nat. Geosci., 7, 752–756, https://doi.org/10.1038/ngeo2250, 2014b.
Skelton, A., Liljedahl-Claesson, L., Wasteby, N., Andren, M., Stockmann, G., Sturkell, E., Morth, C. M., Stefansson, A., Tollefsen, E., Siegmund, H., Keller, N., Kjartansdottir, R., Hjartarson, H., and Kockum, I.: Hydrochemical Changes Before and After Earthquakes Based on Long-Term Measurements of Multiple Parameters at Two Sites in Northern Iceland – A Review, J. Geophys. Res.-Sol. Ea., 124, 2702–2720, https://doi.org/10.1029/2018JB016757, 2019.
Smeraglia, L., Bernasconi, S. M., Berra, F., Billi, A., Boschi, C., Caracausi, A., Carminati, E., Castorina, F., Doglioni, C., Italiano, F., Rizzo, A. L., Uysal, I. T., and Zhao, J.-x.: Crustal-scale fluid circulation and co-seismic shallow comb-veining along the longest normal fault of the central Apennines, Italy, Earth Planet. Sc. Lett., 498, 152–168, https://doi.org/10.1016/j.epsl.2018.06.013, 2018.
Tamura, Y., Sato, T., Ooe, M., and Ishiguro, M.: A procedure for tidal analysis with a Bayesian information criterion, Geophys. J. Int., 104, 507–516, https://doi.org/10.1111/j.1365-246X.1991.tb05697.x, 1991.
Tanaka, H., Chen, W. M., Wang, C. Y., Ma, K. F., Urata, N., Mori, J., and Ando, M.: Frictional heat from faulting of the 1999 Chi-Chi, Taiwan earthquake, Geophys. Res. Lett., 33, 373–386, https://doi.org/10.1029/2006GL026673, 2006.
Toda, S., Stein, R., Sevilgen, V., and Lin, J.: Coulomb 3.3 Graphic-rich deformation and stress-change software for earthquake, tectonic, and volcano research and teaching—user guide, U.S. Geological Survey Open-File Report, 63 pp., https://pubs.usgs.gov/of/2011/1060/ (last access: 16 January 2023), 2011.
Turnadge, C., Crosbie, R. S., Barron, O., and Rau, G. C.: Comparing Methods of Barometric Efficiency Characterization for Specific Storage Estimation, Groundwater, 57, 844–859, https://doi.org/10.1111/gwat.12923, 2019.
Wang, C. Y.: Liquefaction beyond the Near Field, Seismol. Res. Lett., 78, 512–517, https://doi.org/10.1785/gssrl.78.5.512, 2007.
Wang, C.-Y. and Manga, M.: Water and Earthquakes, Springer Cham, https://doi.org/10.1007/978-3-030-64308-9, 2010.
Wang, C.-Y., Manga, M., Dreger, D., and Wong, A.: Streamflow increase due to rupturing of hydrothermal reservoirs: Evidence from the 2003 San Simeon, California, Earthquake, Geophys. Res. Lett., 31, L10502, https://doi.org/10.1029/2004GL020124, 2004.
Wang, C. Y., Manga, M., Wang, C.-H., and Chen, C.-H.: Transient change in groundwater temperature after earthquakes, Geology, 40, 119–122, https://doi.org/10.1130/G32565.1, 2012.
Wang, C.-Y., Liao, X., Wang, L.-P., Wang, C.-H., and Manga, M.: Large earthquakes create vertical permeability by breaching aquitards, Water Resour. Res., 52, 5923–5937, https://doi.org/10.1002/2016WR018893, 2016.
Weatherley, D. K. and Henley, R. W.: Flash vaporization during earthquakes evidenced by gold deposits, Nat. Geosci., 6, 294–298, https://doi.org/10.1038/NGEO1759, 2013.
Weaver, K. C., Doan, M. L., Cox, S. C., Townend, J., and Holden, C.: Tidal Behavior and Water-Level Changes in Gravel Aquifers in Response to Multiple Earthquakes: A Case Study From New Zealand, Water Resour. Res., 55, 1263–1278, https://doi.org/10.1029/2018WR022784, 2019.
Wells, D. L. and Coppersmith, K. J.: New Empirical Relationships among Magnitude, Rupture Length, Rupture Width, Rupture Area, and Surface Displacement, B. Seismol. Soc. Am., 84, 974–1002, https://doi.org/10.1007/BF00808290, 1994.
Woith, H., Wang, R., Maiwald, U., Pekdeger, A., and Zschau, J.: On the origin of geochemical anomalies in groundwaters induced by the Adana 1998 earthquake, Chem. Geol., 339, 177–186, https://doi.org/10.1016/j.chemgeo.2012.10.012, 2013.
Xue, L., Li, H. B., Brodsky, E. E., Xu, Z. Q., Kano, Y., Wang, H., Mori, J. J., Si, J. L., Pei, J. L., Zhang, W., Yang, G., Sun, Z. M., and Huang, Y.: Continuous Permeability Measurements Record Healing Inside the Wenchuan Earthquake Fault Zone, Science, 340, 1555–1559, https://doi.org/10.1126/science.1237237, 2013.
Yan, X., Shi, Z., Zhou, P., Zhang, H., and Wang, G.: Modeling Earthquake-Induced Spring Discharge and Temperature Changes in a Fault Zone Hydrothermal System, J. Geophys. Res.-Sol. Ea., 125, e2020JB019344, https://doi.org/10.1029/2020JB019344, 2020.
Yang, Z., Deng, Z., Zhao, Y., and Zhu, P.: Preliminary study on coseismic step-like changes of water-level in the Dazhai well, Simao city, Yunnan Province, Acta Seismologica Sinica, 18, 611–617, https://doi.org/10.1007/s11589-005-0040-x, 2005.
Yu, J.: Isotopic Geochemistry in China, Chinese Science Press, https://www.academia.edu/6574403/Isotope_geochemistry_researches_in_China (last access: 13 January 2023), 1997.
Zhang, H., Shi, Z., Wang, G., Sun, X., Yan, R., and Liu, C. L.: Large Earthquake Reshapes the Groundwater Flow System: Insight From the Water level Response to Earth Tides and Atmospheric Pressure in a Deep Well, Water Resour. Res., 55, 4207–4219, https://doi.org/10.1029/2018WR024608, 2019.
Zhang, H., Shi, Z., Wang, G., Yan, X., Liu, C., Sun, X., Ma, Y., and Wen, D.: Different Sensitivities of Earthquake-Induced Water Level and Hydrogeological Property Variations in Two Aquifer Systems, Water Resour. Res., 57, e2020WR028217, https://doi.org/10.1029/2020WR028217, 2021.
Zhang, S., Shi, Z., Wang, G., Yan, R., and Zhang, Z.: Groundwater radon precursor anomalies identification by decision tree method, Appl. Geochem., 121, 104696, https://doi.org/10.1016/j.apgeochem.2020.104696, 2020a.
Zhang, S., Shi, Z., Wang, G., and Zhang, Z.: The data for the origin of hydrological responses following earthquakes in a confined aquifer, Zenodo [data set], https://doi.org/10.5281/zenodo.4746408, 2020b.
Zhang, S., Shi, Z., Wang, G., and Zhang, Z.: The code of fitting modelfor the origin of hydrological responses following earthquakes in a confined aquifer, Zenodo [code], https://doi.org/10.5281/zenodo.7528334, 2022.
Zhang, Y., Zhou, X., Liu, H., Yu, M., and Huo, D.: Hydrogeochemistry, Geothermometry, and Genesis of the Hot Springs in the Simao Basin in Southwestern China, Geofluids, 2019, 1–23, https://doi.org/10.1155/2019/7046320, 2019.
- Abstract
- Introduction
- Geological setting and data sources
- Observation of coseismic water-level and temperature changes
- Results
- Discussion
- Conclusion
- Code and data availability
- Author contributions
- Competing interests
- Disclaimer
- Acknowledgements
- Financial support
- Review statement
- References
- Supplement