the Creative Commons Attribution 4.0 License.
the Creative Commons Attribution 4.0 License.
 | 07 Nov 2023
Hydrological connectivity controls dissolved organic carbon exports in a peatland-dominated boreal catchment stream
Laure Gandois
Pierre Taillardat
Marc-André Bourgault
Khawla Riahi
Alex Ponçot
Alain Tremblay
Michelle Garneau
The magnitudes of dissolved organic carbon (DOC) exports from boreal peatlands to streams through lateral subsurface flow vary during the ice-free season. Peatland water table depth and the alternation of low and high flow in peat-draining streams are thought to drive this DOC export variability. However, calculation of the specific DOC exports from a peatland can be challenging considering the multiple potential DOC sources within the catchment. A calculation approach based on the hydrological connectivity between the peat and the stream could help to solve this issue, which is the approach used in the present research. This study took place from June 2018 to October 2019 in a boreal catchment in northeastern Canada, with 76.7 % of the catchment being covered by ombrotrophic peatland. The objectives were to (1) establish relationships between DOC exports from a headwater stream and the peatland hydrology; (2) quantify, at the catchment scale, the amount of DOC laterally exported to the draining stream; and (3) define the patterns of DOC mobilization during high-river-flow events. At the peatland headwater stream outlet, the DOC concentrations were monitored at a high frequency (hourly) using a fluorescent dissolved organic matter (fDOM) sensor, a proxy for DOC concentration. Hydrological variables, such as stream outlet discharge and peatland water table depth (WTD), were continuously monitored at hourly intervals for 2 years. Our results highlight the direct and delayed control of subsurface flow from peat to the stream and associated DOC exports. Rain events raised the peatland WTD, which increased hydrological connectivity between the peatland and the stream. This led to increased stream discharge (Q) and a delayed DOC concentration increase, typical of lateral subsurface flow. The magnitude of the WTD increase played a crucial role in influencing the quantity of DOC exported. Based on the observations that the peatland is the most important contributor to DOC exports at the catchment scale and that other DOC sources were negligible during high-flow periods, we propose a new approach to estimate the specific DOC exports attributable to the peatland by distinguishing between the surfaces used for calculation during high-flow and low-flow periods. In 2018–2019, 92.6 % of DOC was exported during flood events despite the fact that these flood events accounted for 59.1 % of the period. In 2019–2020, 93.8 % of DOC was exported during flood events, which represented 44.1 % of the period. Our analysis of individual flood events revealed three types of events and DOC mobilization patterns. The first type is characterized by high rainfall, leading to an important WTD increase that favours the connection between the peatland and the stream and leading to high DOC exports. The second is characterized by a large WTD increase succeeding a previous event that had depleted DOC available to be transferred to the stream, leading to low DOC exports. The third type corresponds to low rainfall events with an insufficient WTD increase to reconnect the peatland and the stream, leading to low DOC exports. Our results suggest that DOC exports are sensitive to hydroclimatic conditions; moreover, flood events, changes in rainfall regime, ice-free season duration, and porewater temperature may affect the exported DOC and, consequently, partially offset the net carbon sequestration potential of peatlands.
- Article
(5441 KB) - Full-text XML
-
Supplement
(1273 KB) - BibTeX
- EndNote


At the global scale, boreal peatlands are the main contributors of dissolved organic carbon (DOC) exported to the aquatic continuum, accounting for 58 % of the global peatland exports (Rosset et al., 2022). In the context of a net ecosystem carbon budget, quantifying DOC exports, as well as particulate organic carbon (POC) and dissolved inorganic carbon (DIC) exports, is crucial to evaluate how much carbon is lost through this pathway (Webb et al., 2019). Ignoring those carbon losses may, in some cases, lead to an overestimation of annual carbon accumulation in peatlands by 40 %–80 % (Roulet et al., 2007). DOC is the main form of exported carbon and accounts for 54.3 %–91 % of the total aquatic exports (Roulet et al., 2007; Worrall et al., 2009; Holden et al., 2012; Dinsmore et al., 2013; Leach et al., 2016). Moreover, DOC can be mineralized along the aquatic continuum and get converted into dissolved CO2 (Aho and Raymond, 2019). Hence, lateral DOC exports from peatland headwater streams are important to quantify considering the fact that they can lead to greenhouse gas (GHG) emissions to the atmosphere (Billett et al., 2012; Wallin et al., 2013; Rasilo et al., 2017).
One challenge related to net ecosystem carbon budget assessment is that, within a catchment, DOC export to stream(s) comes from the different ecosystems (forest, wetlands, etc.) within the landscape (Webb et al., 2019). Thus, it is methodologically challenging to differentiate the respective contributions of each ecosystem (Billett et al., 2006, 2012; Tipping et al., 2010; Rosset et al., 2019). However, peatlands are recognized as hotspots for the production and transfer of DOC through lateral discharge (including subsurface runoff and porewater seepage) to stream networks (Freeman et al., 2001; Laudon et al., 2011; Rosset et al., 2019; Zhu et al., 2022). Strong positive relationships have already been established between the surface of a catchment covered by peat and the DOC exported to surface waters (Billett et al., 2006; Laudon et al., 2011; Olefeldt et al., 2013).
To obtain a precise estimate of the peatland contribution in DOC exports, a specific DOC export (i.e., a flux normalized to a surface) that includes the peatland surface area within the catchment must be determined. Most of the previous studies have presented DOC exports normalized to the total surface of peatland-dominated catchments rather than to the peatland surface area within the catchment (Koehler et al., 2009; Worrall et al., 2009; Dinsmore et al., 2013; Dick et al., 2015), possibly leading to an underestimation of DOC exports. Leach et al. (2016) proposed calculating the specific exports using both total catchment area and peatland surfaces in the catchment as a way to report minimum and maximum values of DOC exports. The minimum value of the specific exports uses the catchment area as a reference based on the hypothesis that DOC exported from the peatland is equivalent to DOC exported from the non-peatland areas. The maximum value of the specific exports is calculated by using the peatland area and considering the fact that the DOC contribution from non-peatland ecosystems can be negligible. Another approach to obtain peatland-specific DOC exports is by subtracting the sum of DOC entering the peatland from DOC exports at the peatland outlet (Rosset et al. 2019). Unfortunately, this approach is not scalable to all peatlands given the variability in catchment configurations.
Recent advances in high-frequency measurements of dissolved organic matter fluorescence (fDOM), a quantitative proxy of DOC, have allowed us to accurately measure DOC exported at a high temporal frequency (Tunaley et al., 2016; Rosset et al., 2019; Blaurock et al., 2021). This high-frequency monitoring is essential to catch DOC export variations during flood events, which are believed to be crucial moments of DOC transfers (Tipping et al., 2010; Raymond et al., 2016). Pulses of DOC during flood events can be understood as a succession of hydrological connection and disconnection between the peatland and the stream, causing changes in DOC concentration in the stream (Billett et al., 2006; Laudon et al., 2011; Jutebring Sterte et al., 2022). The runoff generation into the peat is controlled by the water table depth (WTD) (Holden and Burt, 2003; Frei et al., 2010), where a large WTD increase during flood events leads to hydrological reconnection between DOC sources (Inamdar et al., 2004; Tunaley et al., 2016; Rosset et al., 2020) and greater DOC exports (Blaurock et al., 2021).
Advances in high-frequency monitoring and better efforts being directed towards flood events have confirmed that the majority of DOC is exported from peatlands during flood periods rather than during recession periods (Dick et al., 2015; Birkel et al., 2017; Blaurock et al., 2021). During flood events, DOC exports in the catchment dominated by peatlands are mainly composed of recently produced carbon derived from peat (Tipping et al., 2010; Billett et al., 2012; Holden et al., 2012; Juutinen et al., 2013; Dean et al., 2019). Recent studies have pointed out the importance of characterizing DOC export variability rather than identifying their sources to understand the processes underlying DOC mobilization (Birkel et al., 2017; Blaurock et al., 2021; Zhu et al., 2022).
DOC exports during flood events may vary depending on many parameters, such as the magnitude of rainfall events, the seasonality and the porewater temperature, the recurrence of high-flow events, the presence of a free-rainfall period, and the antecedent wetness of the catchment (Leach et al., 2016; Tiwari et al., 2018; Rosset et al., 2020; Blaurock et al., 2021). Previous studies have highlighted that long periods between rainfall events favour DOC production (Glatzel et al., 2006; Clark et al., 2007; Grand-Clement et al., 2014). Greater DOC exports are measured once the hydrological connection is restored given the large amounts of DOC recently produced in the peatland which could be mobilized through lateral discharge (Worrall et al., 2008; Clark et al., 2009; Grand-Clement et al., 2014; Buzek et al., 2019). Others have shown that high WTD before a rain event in a peatland favours rapid DOC mobilization and leads to greater exports independently of the recurrence between events (Birkel et al., 2017; Blaurock et al., 2021). The amount of exported DOC is also controlled by production processes stimulated by peat temperature (Clark et al., 2007, 2009; Grand-Clement et al., 2014; Zhu et al., 2022) because DOC concentrations in the peat pore water increase with the peat temperature (Freeman et al., 2001; Buzek et al., 2019).
Most studies that have used an event-based approach in peatland streams have been performed in temperate (Worrall et al., 2008; Austnes et al., 2010; Grand-Clement et al., 2014; Tunaley et al., 2016) and alpine (Birkel et al., 2017; Rosset et al., 2020) catchments. None have been realized in boreal environments. Boreal catchments are constrained by seasonal freezing and pronounced snowmelt (Ågren et al., 2010; Leach et al., 2016; Tiwari et al., 2018) that potentially affect and delay DOC exports from winter to spring (Laudon et al., 2012).
Considering the climatic context of boreal peatlands and the importance of hydrological processes to peat-derived DOC exports, this study aimed to characterize the patterns of DOC exports from a boreal peatland headwater stream over 2 consecutive years (2018 and 2019). Based on high-frequency DOC concentrations and different hydrological parameters, including rainfall, stream discharge, and WTD, we used an event-based approach to document the mechanisms driving DOC mobilization and exports during flood events. Individual flood events were compared in order to understand how hydrological and meteorological variables control the amount of exported DOC. This study comprises three research objectives: (1) establish relationships between DOC exports from a headwater stream and the peatland hydrology; (2) quantify, at the catchment scale, the amount of DOC laterally exported to the draining stream; and (3) define the patterns of DOC mobilization during high-river-flow events.
The study site, located in northeastern Canada within the Romaine River catchment (14 500 km2), adjacent to the Labrador border, was previously described in Prijac et al. (2022). It is located in the eastern spruce–moss bioclimatic domain of the closed boreal forest (Payette, 2001) at the limit of the coastal plain and the Highlands of the Laurentian Plateau of the Precambrian Shield (Dubois, 1980). The Bouleau peatland study site (50∘31′ N, 63∘12′ W; altitude 108 ± 5 m) is an ombrotrophic, slightly dome-shaped bog positioned at the head of a catchment (Fig. 1). Peat accumulation was initiated ca. 9260 cal BP, and the maximum peat depth reaches 440 cm (Primeau and Garneau, 2021). The microtopography of the peatland shows a clear pattern of alternating dry hummocks, lawns, hollows, and pools. The surface vegetation varies according to the microtopography, with Sphagnum fuscum, S. capillifolium, and Cladonia rangiferina on the hummocks; S. magellanicum, S. rubellum, S. cuspidatum, and Trichophorum cespitosum on the lawns; and Sphagnum majus and S. pulchrum on the hollows (Primeau and Garneau, 2021).
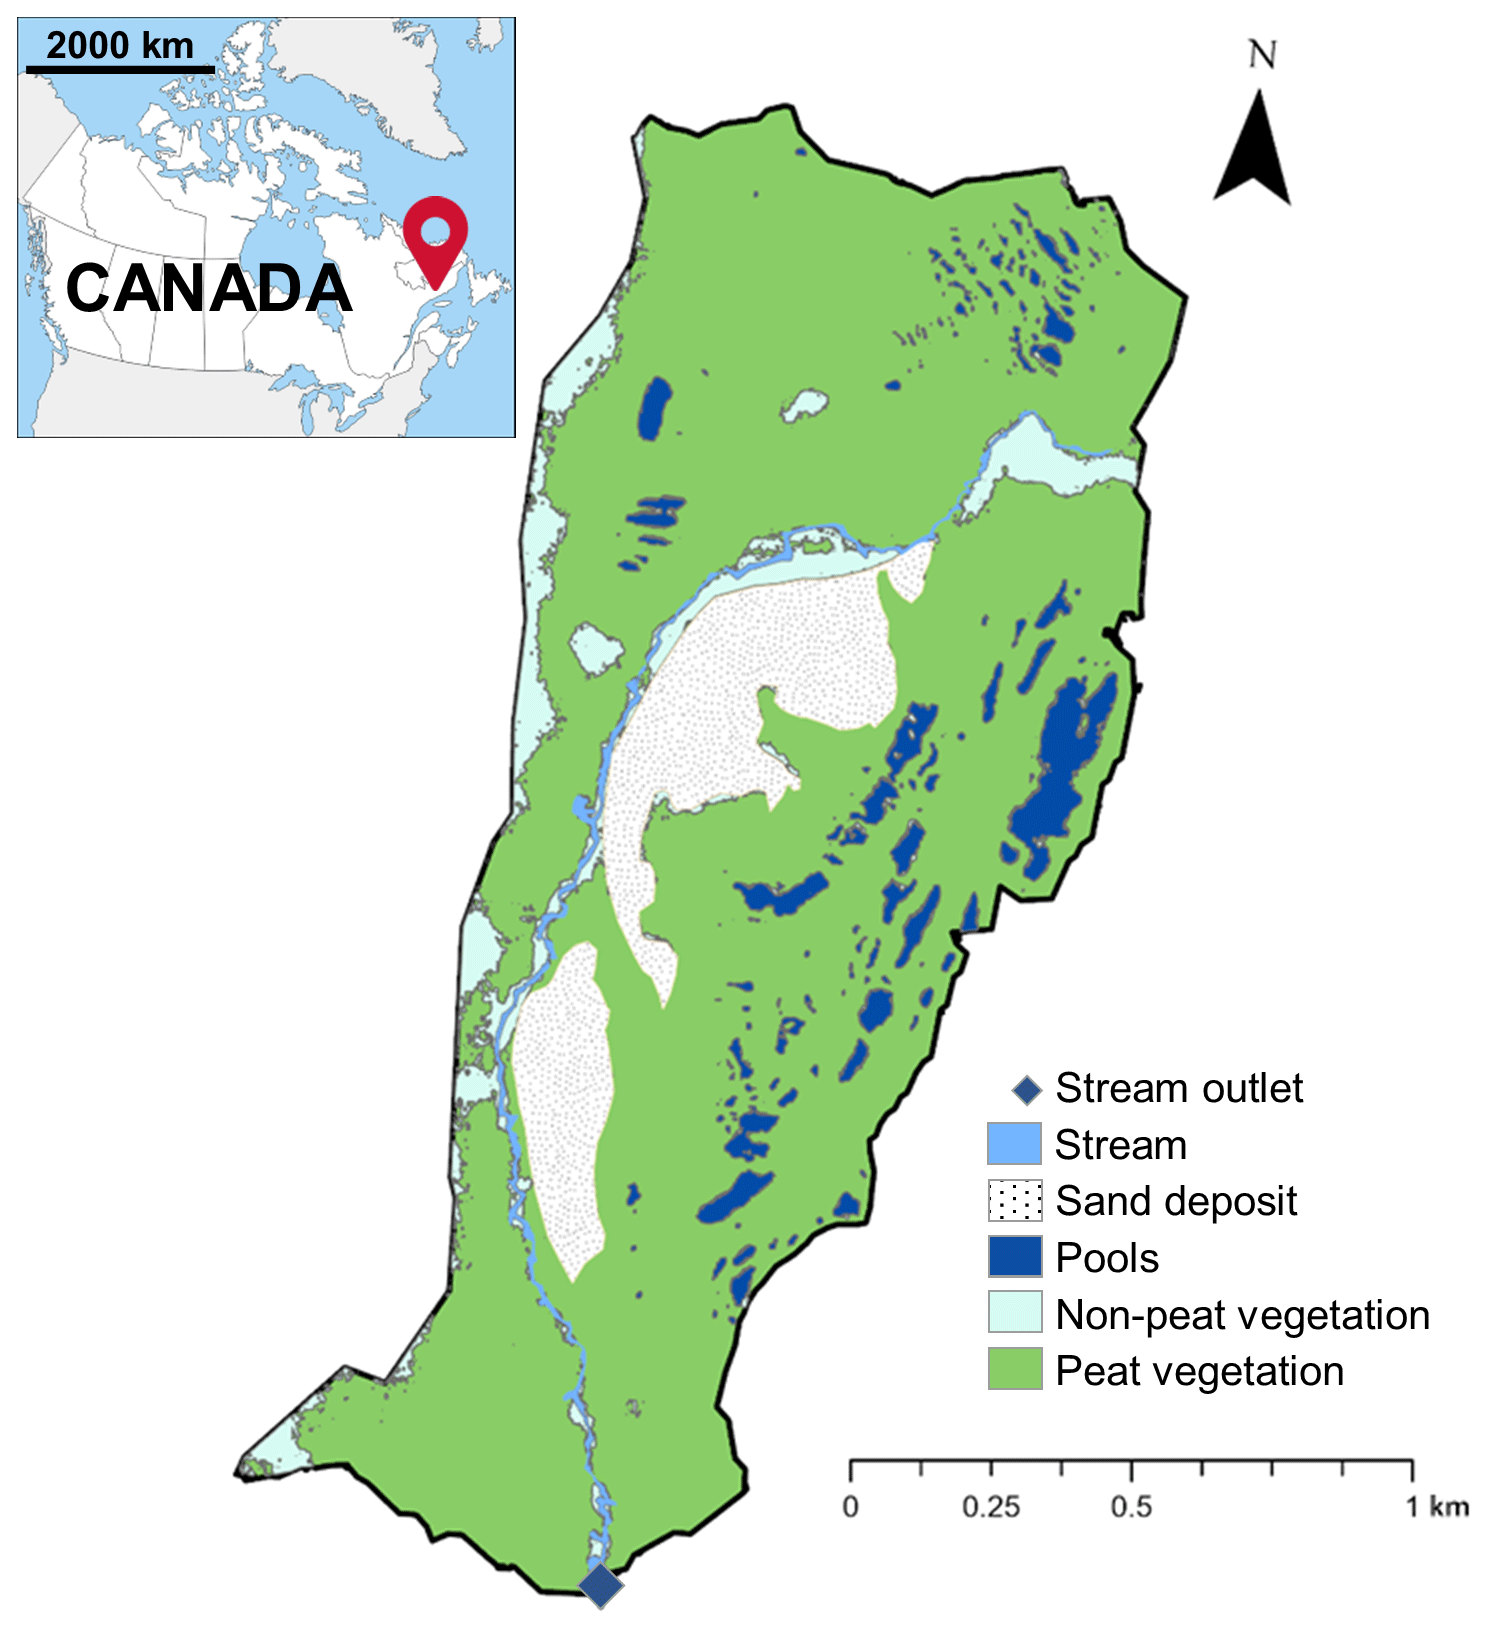
Figure 1Land cover of the Bouleau catchment which distinguishing areas covered by the drainage stream, sand deposits, pools, terrestrial vegetation, and peatland vegetation.
The study focused on the outlet of the peatland drained by a headwater stream of about 3 km in length, which flows north to south across the peatland from the western side. The catchment and peatland areas were determined using ArcGIS Pro 2.8.0 based on lidar images taken in 2004 (source: Hydro Quebec) and an aerial image from World Imagery ArcGIS taken on 8 May 2017 (resolution of 0.5 m). The lidar images and generated databases were used by extrapolation to determine the digital elevation model (DEM). The tools “flow accumulation” and “watersheds” in ArcGIS Pro 2.8.0 were used to generate the hydrological network and associated catchment area. A supervised classification of vegetation was conducted to delineate the peatland ecosystem boundaries within the catchment using the tools “create signatures” and “maximum likelihood classification”. The surface of the catchment drained by the stream is 2.22 km2, and the area of the catchment covered by peat is 1.70 km2, equivalent to 77 % of the total catchment.
As described in Prijac et al. (2022), based on the regional climate data, the mean annual temperature is 1.5 ∘C, and the total annual precipitation is 1011 mm, of which 590 mm falls as snow. An average monthly positive temperature occurs from May to October with 191.5 growing degree days above zero (Havre-Saint-Pierre meteorological station, mean 1990–2019, Environment of Canada). During the growing season, the average air temperature was 13.2 ± 6.9 ∘C, with a minimum of −7.9 ∘C in early October 2018 and a maximum of 30.8 ∘C in late July 2018. The warmest month was July 2018, with an average monthly temperature of 17.9 ± 5.6 ∘C, and the coldest month was October 2018, with an average monthly temperature of 3.52 ± 5.29 ∘C. Average rainfall events were 7 mm d−1, and maximum daily rainfall was in July 2018, with 41 mm d−1. The wettest month was August 2019, with total rainfall of 129 mm, while the driest month was July 2019, with total rainfall of 27 mm.
The measurement period started in June 2018. Consequently, meteorological, hydrological, and physicochemical variables are presented for the growing season, defined from June to October, as described by Prijac et al. (2022). Annual DOC exports are presented for two complete periods of 12 months, ranging from June 2018 to May 2019 for the first year and from June 2019 to May 2020 for the second year.
3.1 Water sampling
Manual water sampling along the studied headwater stream was performed during the same sampling periods as described in Prijac et al. (2022): five times during the 2018 growing season (14 June, 12 July, 8 August, 1 September, and 10 October) and four times in 2019 (8 June, 3 August, 5 September, and 10 October).
Stream surface water was collected at 11 sampling stations along the headwater stream (Fig. 1). Samples were also collected from three tributaries at about 10 m before the confluence (Fig. S1 in the Supplement). Because the stream was intermittent in the upstream section during the growing season, stations R01 and R02 were not sampled during each campaign (Fig. 2).
The physicochemical parameters (temperature, pH, specific conductivity, and dissolved oxygen saturation) were measured from a multi-parameter portable meter (MultiLine Multi 3620 IDS, WTW, Germany) at each sampling site. All water samples were collected in polypropylene bottles previously cleaned with ultra-pure water and rinsed with sample water. The samples were filtered with GF/F filters (Whatman) that had been pre-combusted for 4 h at 450 ∘C.
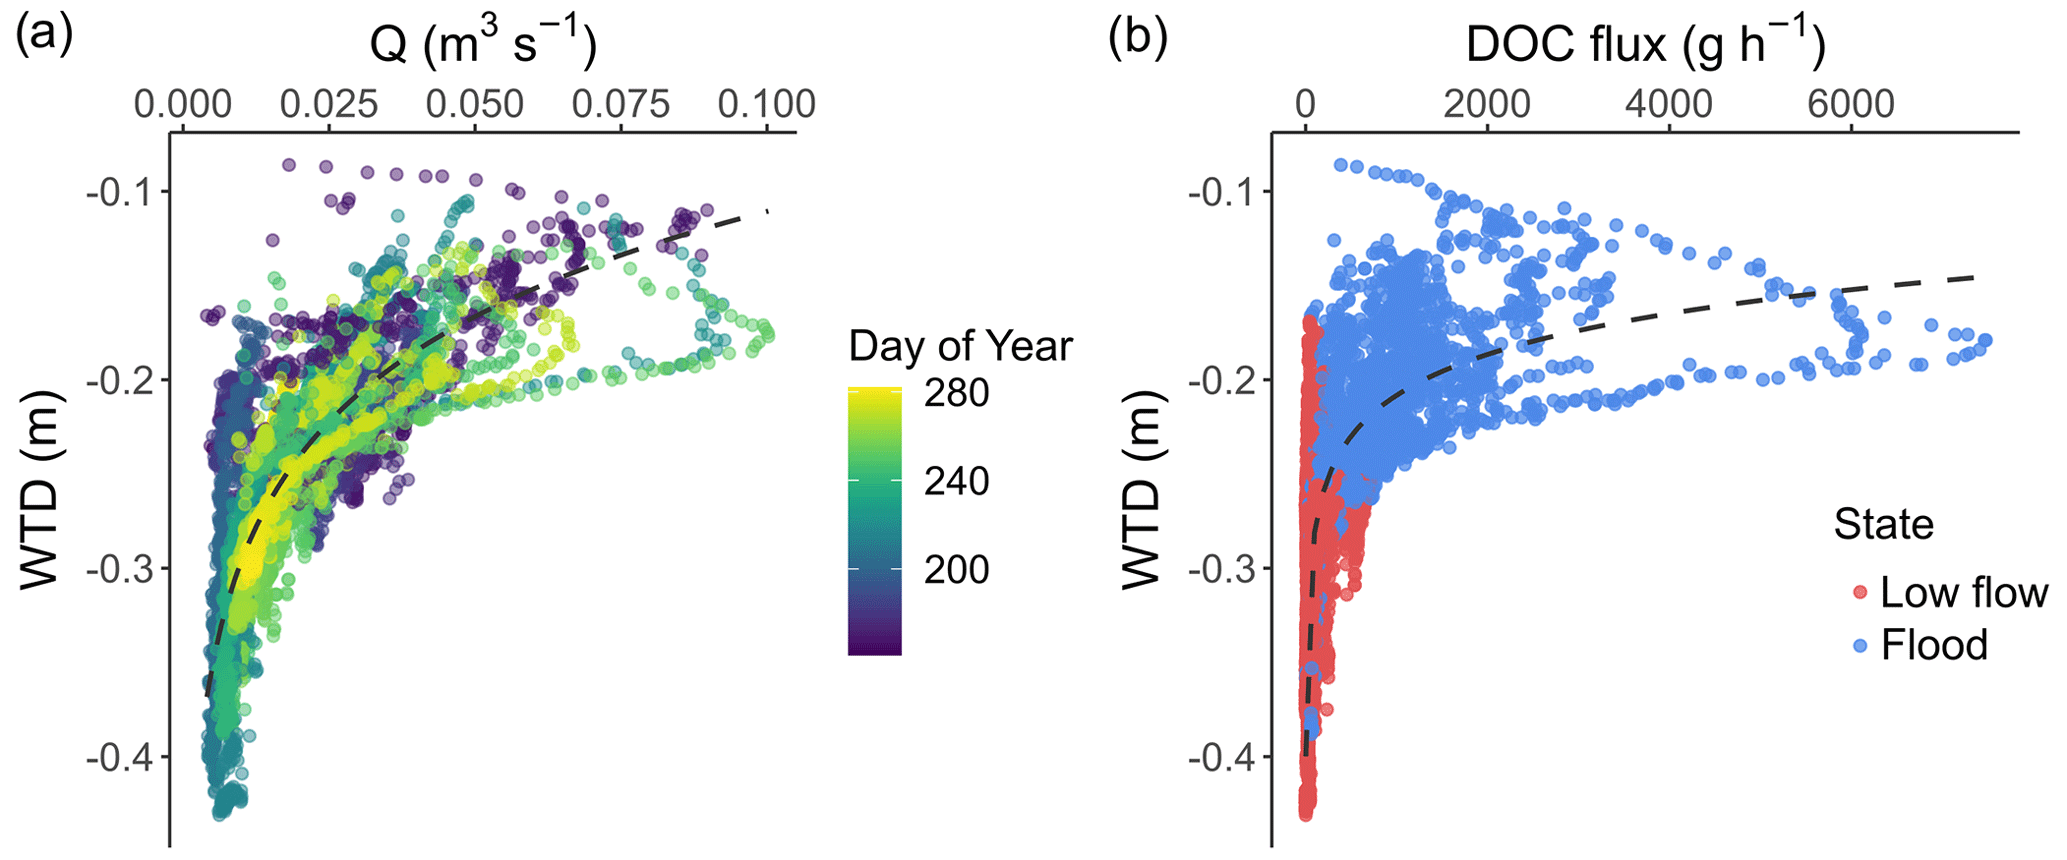
Figure 2(a) Relation between hourly measurements of the water table depth (WTD, in m) and stream discharge (Q, in m3 s−1). The colour represents the day of the year, and the dashed line corresponds to the logarithmic relation between WTD and Q. (b) Relation between the hourly measurements of WTD (m) and hourly DOC flux in the stream (g DOC-C h−1). The colour represents the hydrological state according to the hidden Markov model, and the dashed line corresponds to the logarithmic relation between WTD and DOC flux.
Analyses of DOC concentration
Filtered water was prepared for DOC analysis, following the method described in Prijac et al. (2022), by acidification to pH 2 with 1 M HCl and followed by storage in 40 mL glass vials. DOC and total nitrogen (TN) concentrations were analysed using the catalytic oxidation method followed by non-dispersive infrared (NDIR) detection of produced CO2 (TOC analyser TOC-L, Shimadzu, Japan) with a limit of quantification of 0.1 mg C L−1.
3.2 In situ high-frequency monitoring
3.2.1 fDOM and physicochemical parameters
An EXO2 multi-parameter probe (YSI, USA) was placed at the stream outlet at the same station where discharge was monitored and approximately 40 cm above the bottom. The physicochemical parameters (water temperature, pH, specific conductivity, and dissolved oxygen concentration and saturation) were recorded hourly from June 2018 to May 2020 and were calibrated about once a month during the growing season.
The parameters monitored included fluorescence of DOM (fDOM) (λexcitation = 365 ± 5 nm/λemission = 480 ± 40 nm) and turbidity. The time series included the removal of some fDOM measurements when the probe was found in the stream bottom sediments from mid-July to mid-August 2018 and in July and late August 2019. fDOM measurements were removed when turbidity exceeded a threshold of 50 FNU as they might have altered the values (de Oliveira et al., 2018). Except for the periods when the probe was found in the sediments, there was no important turbidity peak so the study focused on DOC.
A total of 826 individual measurements were removed in 2018, corresponding to 26.2 % of data recorded during the growing season. In 2019, 1168 measurements were removed, corresponding to 37.1 % of the growing-season period. The correction of fDOM signal to the temperature was performed at reference temperature (20 ∘C), as proposed by de Oliveira et al. (2018).
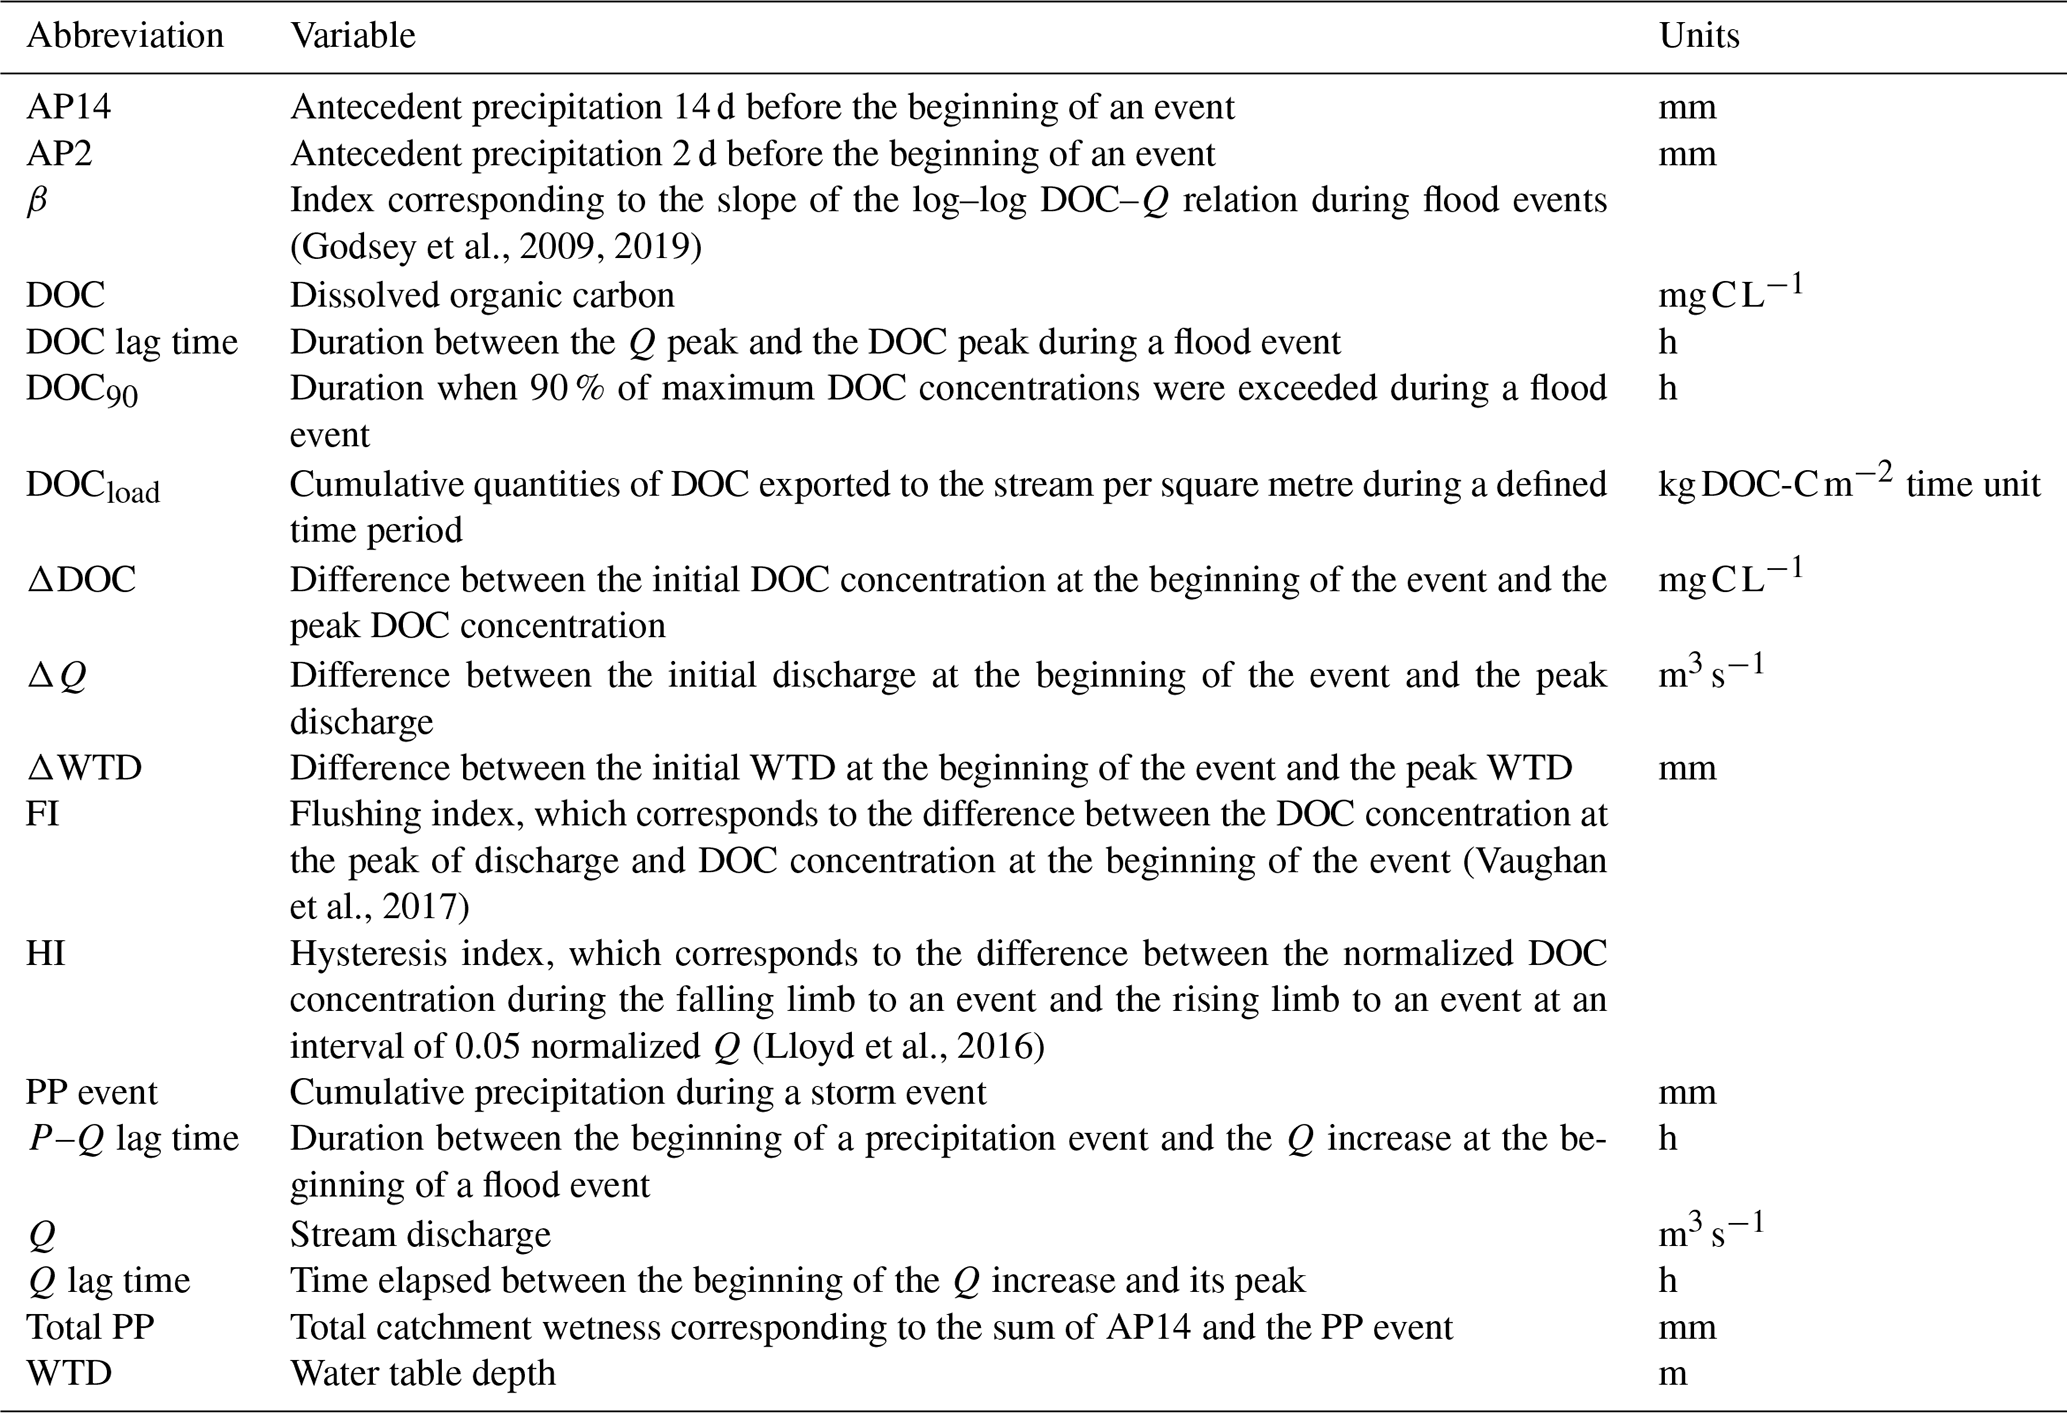
Table 1List of variables used and their abbreviations and units.
During the 2018 and 2019 growing seasons, punctual water samplings were taken in the stream (n=69). At each sampling station, water samples were analysed for DOC concentration, and fDOM measurements were taken with the EXO2 multi-parameter probe. The fDOM measurements were used to determine DOC considering the relationship f(fDOM) = [DOC], where fDOM is the corrected signal fluorescence of DOM measured in quinine sulfate units (QSU), and [DOC] is the dissolved organic carbon concentration (in mg C L−1) (Table S1 in the Supplement).
The first EXO2 multi-parameter probe that had been installed in June 2018 (calibration model I) was replaced with a new EXO2 multi-parameter probe in August 2018, which was used until the end of the monitoring in May 2020 (calibration model II; Table S1). Each EXO2 multi-parameter probe was calibrated independently. Due to fouling (development of a biofilm on the surface of the sensor) of the fDOM sensor, which lead to a deviation of the calibration model, the calibration model was adjusted during the 2019 growing season, and two more calibration models were developed to correct the fDOM deviation. The models are presented in Table S1.
3.2.2 Stream hydrology
At the outlet of the stream, a V-shaped weir was installed perpendicularly to the stream. The discharge was derived from the water level in the stream measured by an ultrasonic distance sensor (SR50A, Campbell Scientific, USA) during the 2018 growing season. The calculation method for the discharge was described by Taillardat et al. (2022). The distance between the surface water and the ultrasonic sensor gave the flooded vertical area in the V-shaped weir. Thomson's triangular-notch equation allowed for the calculation of the discharge from water-level measurements (Shein, 1979).
Starting from June 2019, a water-level logger (U201-04, Hobo, Onset, USA) was installed at the stream outlet to replace the ultrasonic distance sensor, which was damaged during the spring freshet. Water-level discharge rating curves were calculated following the method described by Taillardat et al. (2022). Discharge was measured at the stream outlet using a portable flow velocity probe (Flo-Mate Model 2000, Marsh-McBirney Inc., USA) which measured water velocity in a cross-section at subsections of 20 cm with intervals. The cumulative discharge (Q, in m3 s−1) was measured by summing the discharge obtained for each subsection using Eq. (1), where V is the water velocity measured by the portable flow velocity probe (in m s−1), and A is the flooded vertical area (in m2) obtained by multiplying depth (in m) with the width of the section (in m).
Discharge monitoring data collected with an ultrasonic distance sensor SR-50A during the spring thaw were not available as the sensor was damaged during the freshet. Moreover, in 2020, the spring flood exceeded the stream bed and hence could not be measured either, which explains why the Thomson's triangular notch equation could not be applied. Consequently, daily water discharge was modelled during the whole studied period using the Peatland Hydrologic Impact Model (PHIM) developed by Guertin et al. (1987) and detailed by Riahi (2021).
3.2.3 Peatland hydrology
From June to October 2018 and from June to October 2019, water table depth (WTD) was recorded hourly at the six wells (Fig. S3) inserted at about 2 m depth into the peat and equipped with a water-level data logger (HOBO, Onset, USA) for continuous hourly measurements of WTD and temperature, as described in Prijac et al. (2022). In 2018, the water-level loggers were U20-001-04 models (Hobo, Onset, USA); these were replaced in 2019 with U20l-04 models (Hobo, Onset, USA). The latter are slightly less precise (± 0.2 % against ± 0.1 % for the 2018 sensors) but are better adapted to the meteorological conditions of the study site because of the battery durability for periods when temperatures are below 0 ∘C. The sensors were placed into wells, suspended with a measured metal wire, and kept submerged (i.e., about −0.6 m below the peat surface). Another sensor was installed next to a rain gauge to record atmospheric pressure variability and to correct piezometer pressure.
3.2.4 Rainfall
Rainfall was continuously measured from July 2018 to May 2020 using a tilting-bucket rain gauge (Onset, 0.2 mm). The bucket was connected to a sealed reed switch that produced a contact closure for every 0.2 mm of rainfall. Hourly measurements of rainfall consisted of the number of contacts from this 0.2 mm.
3.3 Calculation of DOC exports
3.3.1 DOC concentration gap filling
Considering the percentage of removed fDOM signals (31.7 % of the total measurements), a gap-filling method was performed on hourly DOC concentrations. The gap filling was conducted with a random forest model using a training dataset containing the stream discharge record, water temperature, pH, dissolved oxygen saturation, and specific conductivity (54.6 % of the time series). The prediction of the data used by the random forest method (from the randomForest package in R) was based on an unsupervised and nonparametric method of modelling. Models based on the validation dataset (13.7 % of the time series) presented a good fit between the observed and predicted DOC concentrations, with a correlation of 0.99 (p value < 0.0001. The mean squared residual was 0.28, and the percentage of variance explained by the model was 98.7 % (p value < 0.0001; Fig. S1a). Modelled concentrations were included in the calculation of DOC exports. The importance of variables included in the random forest model is presented in Table S2. This was obtained using the argument “importance” of the randomForest function in R.
Gap filling of the DOC concentration was also performed during the rest of the time series (i.e., non-growing season). The dataset contained the PHIM-simulated discharge, water temperature, pH, dissolved oxygen saturation, and specific conductivity. The training dataset corresponded to 26 % of the dataset, and the validation dataset corresponded to 22.7 % of this dataset. The validation test of the random forest model gave a relatively good fit with a strong positive correlation between observed and modelled DOC concentrations (cor = 0.84; p value < 0.0001), the mean root-square residual was 2.15, and the percentage of variance explained by the model was 71 % (p value < 0.0001; Fig. S1b).
3.3.2 Calculation of stream DOC exports
The DOC load at the outlet of the catchment () was calculated as in Eq. (1).
In the above equation, [DOC]i corresponds to the DOC concentration (in g m−3) at step measurement i, Qi corresponds to the stream discharge (in m3 h−1) at step measurement i, the variable dt corresponds to the time step between high-frequency measurements, and S corresponds to the surface drained by the stream. dt corresponds to the 1 h intervals between measurements during the growing season (i.e., from June to October) and to the 1 d intervals for the remaining part of the time series.
3.3.3 DOC export standard deviation calculation
Uncertainties associated with DOC export calculation were obtained using a Monte Carlo simulation approach and were applied in Eq. (1) (Cook et al., 2018; Rosset et al., 2019). The Monte Carlo simulation randomly calculates for each interval a DOC concentration and discharge obtained from a normal distribution of the observed values. The mean of the normal distribution corresponds to the mean of observed values. The standard deviation for the DOC calculation corresponds to the mean square error of the random forest models and is ± 0.28 mg C L−1 for the 1 h interval period (from June to October 2018 and from June to October 2019) and ± 2.15 mg C L−1 for the rest of the time series at daily intervals. An arbitrary and conservative standard deviation was settled at 50 % during high-flow periods (determined by hidden Markov model; see next section) and 10 % during low-flow periods. After 5000 iterations, the mean was obtained by the best-estimate value, and the standard error estimation was assumed to represent the standard deviation of DOC exports.
3.4 Analyses of flood events
3.4.1 Classification of time series in high- and low-flow periods to determine flood events
During the growing season, the hidden Markov model (HMM) in the R packages depmixS4 (Visser and Speekenbrink, 2010) and HiddenMarkov (Harte, 2021) was used to classify the time series into two states corresponding to the high- and low-flow periods (Kehagias, 2004; Guilpart et al., 2021). The HMM was applied to both 1 h interval discharge data and PHIM-modellized daily interval discharge data. The distribution of the probability of going from one state to another was calibrated manually. After the HMM classification, the high-flow periods were manually adjusted to get a better integration of their beginnings. They were determined as the inflection of Q before a persistent increase in this variable within a 12 h interval of a high-flow period was determined by the HMM (or within 1 d for the daily interval dataset).
In addition, 12 individual flood events were manually isolated – six in 2018 and six in 2019 (Table S3) – among the time series including DOC measurements of a satisfying quality (e.g., gap-filled DOC export values from the random forest were excluded). Flood events were a subset of the total time series for individual analyses. They were identified by a two-letter code, with the first letter corresponding to the year of the flood event (A for 2018 and B for 2019) and the second letter corresponding to the rank of the flood events each year (from a, following the alphabetical order).
3.4.2 Flood event characteristics
For each of the 12 flood events, several descriptive and quantitative indicators were calculated (see Table 1). During the event, rainfall was summed up under the variable precipitation (PP) event. Rainfall was also summed up 2 d before the beginning of the event (AP2) and 14 d before the beginning of the event (AP14). The PP event and AP14 were added to obtain the variable PP total.
The P–Q lag time (in minutes) corresponds to the duration between the start of the rainfall and the Q increase at the beginning of the event. The Q lag time corresponds to the duration between the beginning of the event and the reaching of peak of Q (Qmax). The DOC lag time corresponds to the duration between Qmax and the peak of DOC (DOCmax). The DOC90 corresponds to the period when 90 % of DOCmax was exceeded and can be summarized as the duration of the DOC plateau before the DOC concentrations decreased. The DOC load (DOCload) was calculated as the DOC exports shown in Eq. (1) and corresponds to the quantity of DOC exported during the flood event. DOCload was divided by the event duration (in h) to provide a better comparison between events (DOCload kgh).
The hysteresis index (HI), the flushing index (FI), and the β index were determined from the relation between Q and the DOC concentration. The HI was used to identify the hysteretic relation between DOC and Q and corresponds to the difference in the integrals during the rising limb (i.e., the increasing phase of Q during a high-flow event) and the falling limb (i.e., the decreasing phase of Q during a high-flow event) of a high-flow event (Lloyd et al., 2016). HI values range from −1 for strong counterclockwise hysteretic relations to 1 for strong clockwise hysteretic relations; 0 indicates the absence of a hysteretic relation. The FI was calculated to describe the response of the DOC concentration during the rising limb of the flood (Vaughan et al., 2017). The FI ranges from −1 to 1; a value < 0 indicates that DOC is diluted during the rising limb, while a value > 0 indicates accretion of DOC during the rising limb. The β index corresponds to the slope of the logarithmic relation between Q and the DOC concentration and provides information on the limiting factor of DOC exports (Godsey et al., 2009). A β index value < 0 indicates a source limitation of the DOC exports, a β index value > 0 reveals that the DOC exports are transport limited, and β = 0 indicates that the DOC exports are chemostatic (Godsey et al., 2009, 2019; Zarnetske et al., 2018).
3.5 Statistical analyses
The data analyses were performed in R (CRAN project) and RStudio interface (RStudio Inc., USA). The figures were produced using the package ggplot2 (Wickham, 2016). Correlations between DOC and explanatory variables (porewater, air and stream temperature, Q, conductivity, pH, saturation of dissolved oxygen, and dissolved oxygen concentrations) were evaluated using a multiple linear regression model. The p values and Spearman correlation factors of individual variable effects on DOC concentrations were used as indicators of model quality.
Prior to clustering the flood events, the correlation and collinearity between variables were evaluated by measuring the variance inflation factor (VIF) function using the R package car. Variables were removed when the correlation with another variable exceeded 0.8 and when the VIF exceeded 5. The variables retained to perform clustering were the event duration, the minimum temperature, the average Q, the minimum WTD, the ΔDOC, the HI index, the β index, the FI, the initial WTD, the Qmax, and the DOCload. As precipitation data were not available for all events (i.e., Aa and Ab), precipitation-related variables were excluded from the clustering to keep the maximum number of events. Hierarchical clustering was performed based on principal component analysis (PCA) to classify each individual event into clusters. The number of clusters was determined according to the elbow method as the optimal number of clusters corresponds to values when the inertia (i.e., the information given by additional clusters) decreases. The R package FactoMineR was used for the PCA and hierarchical clustering.
The low- and high-flow periods were determined using the HMM with the R package HiddenMarkov, which is designed for time series data. The HMM on log-transformed Q (logQ) was performed based on hourly data.
4.1 High-frequency monitoring of hydrological variables and temperature
The maximum daily rainfall was 41 mm d−1 in September 2018 (for the 2018–2019 period) and 39 mm d−1 in August 2019 (for the 2019–2020 period). During the summer of 2018, the wettest month was July, with total rainfall of 98 mm, while the wettest month during the summer of 2019 was August, with 129 mm. The average WTD was −0.26 m and ranged from −0.09 to −0.43 m. The lowest WTD was in July and August 2019, with monthly averages of −0.30 ± 0.06 and −0.30 ± 0.07 m, respectively. The average annual Q was 0.020 m3 s−1 in 2018–2019 and 0.017 m3 s−1 in 2019–2020. During the growing season, the lowest monthly average discharge occurred in July of each year, with 0.010 m3 s−1 in 2018–2018 and 0.007 m3 s−1 in 2019–2020. In 2018–2019, the highest discharge was 0.068 m3 s−1, measured in June 2018, and in 2019–2020 it was 0.100 m3 s−1, measured in September 2019.
There was a strong positive exponential relationship between WTD and Q (ρ = 0.82, p < 0.0001; Fig. 2a). This nonlinear relationship suggests a threshold of WTD on lateral discharge generation. When low, WTD variations do not influence Q, which remains low. An increase in WTD above a threshold observed between −0.33 and −0.19 m leads to lateral discharge generation and an increase in Q (Fig. 2a).
The average peat porewater temperature was 11.5 ± 2.4 ∘C and was very similar in 2018 (11.4 ± 2.6 ∘C) and 2019 (11.7 ± 2.3 ∘C). The warmest peat porewater temperature was 15.1 ∘C, measured in August 2019, and the coldest was 5.6 ∘C, measured in June 2018. During the summer, the average monthly temperature in June increased from 7.1 ± 1.0 ∘C in 2018 and 8.3 ± 0.8 ∘C in 2019 to reach a maximum of slightly above 14 ∘C in August. The temperature decreased in autumn to a similar average October temperature (8.6 ± 0.4 ∘C in 2018 and 8.7 ± 0.5 ∘C 2019). The average water temperature recorded at the stream outlet was 13.2 ± 6.7 ∘C. The average water temperature in 2018 was warmer at 13.9 ± 7.0 ∘C compared to 12.7 ± 6.2 ∘C in 2019. As for the air temperature, the water temperature increased from about 11 ∘C in June to 15.6 and 16.9 ∘C in July and August, respectively. The water temperature subsequently decreased in September, with similar values in both years (10.6 ± 3.5 ∘C in 2018 and 10.2 ± 2.7 ∘C in 2019).
4.2 DOC concentrations and exports from the peatland stream outlet
The average DOC concentration recorded at the peatland stream outlet was 6.3 ± 4.6 mg C L−1, and the median was 4.9 mg C L−1. The maximum DOC concentration was 24.2 mg C L−1 in early August 2019, and the minimum was 0.9 mg C L−1 in September 2018 (Fig. 3g). Correlations between the DOC concentration and the hydrological and physicochemical variables are presented in Table S2. The DOC concentration was significantly positively correlated with Q and WTD (Table S2). DOC was positively correlated with water temperature but only when considering the complete period of measurements. The random forest model applied during the growing-season dataset highlighted the important contribution of hydrological variables (WTD and Q; Table S2). During the growing season, the log-transformed hourly DOC exports were significantly correlated with Q (cor = 0.79, p < 0.0001) and with WTD (cor = 0.75, p < 0.0001; Fig. 2b).
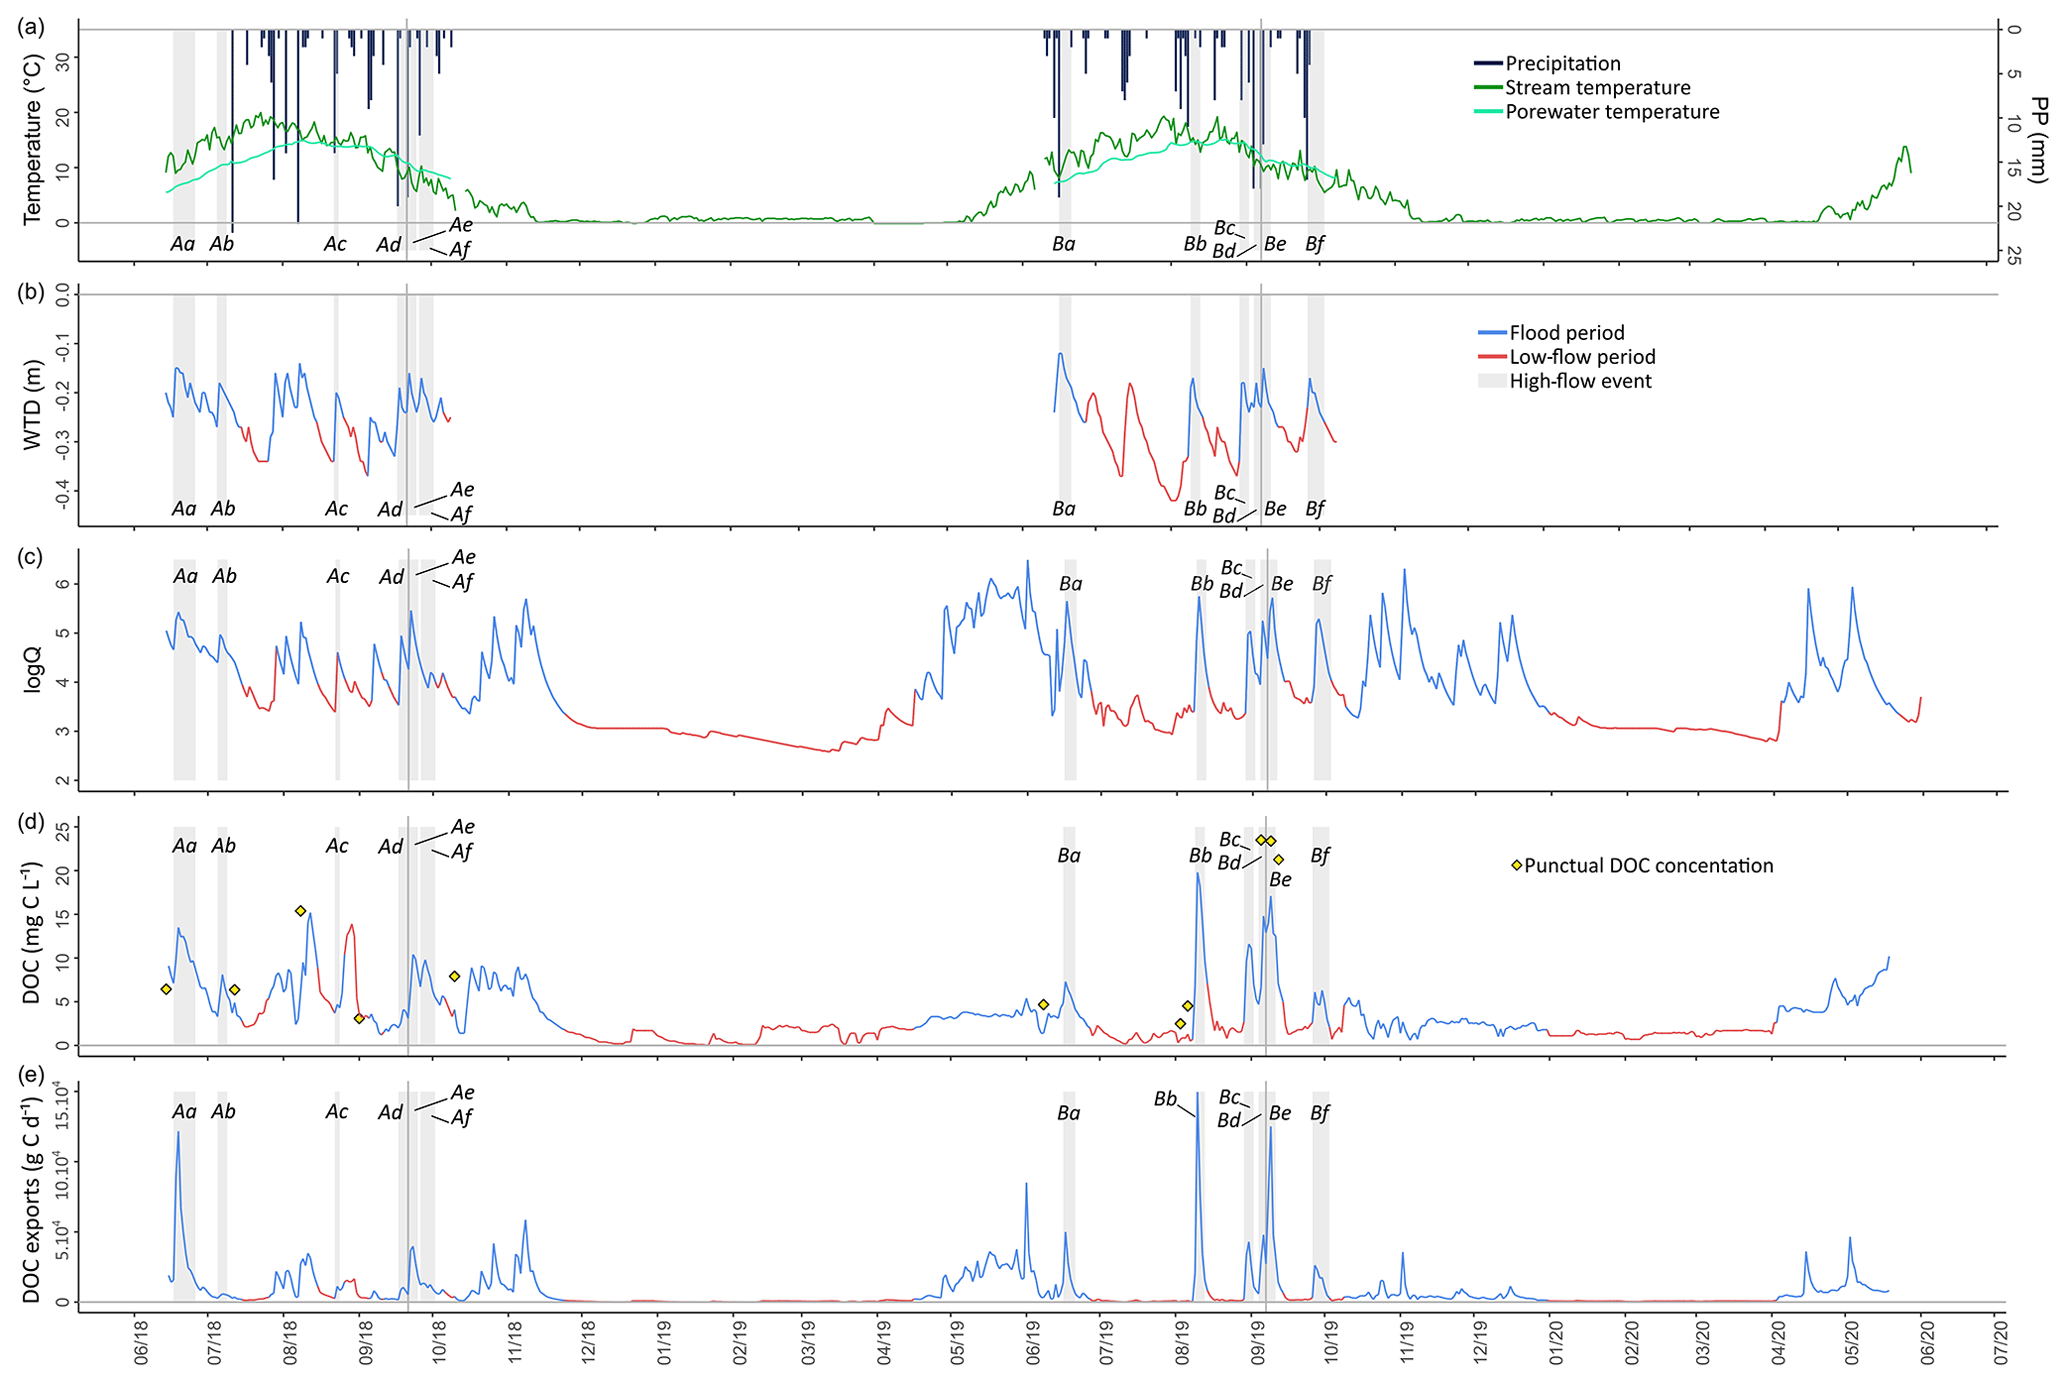
Figure 3Times series of (a) stream and porewater temperature and precipitation, (b) water table depth (WTD), (c) log-transformed stream discharge (logQ), (d) dissolved organic carbon (DOC) concentration in the stream, and (e) DOC exports from June 2018 to May 2020. Colours in (b–e) correspond to the periods of flood (in blue) and low flow (in red). Vertical grey bars represent individual storm events. Yellow diamonds represent DOC concentration analyses from punctual sampling at the stream outlet.
We calculated the specific DOC exports from the peatland by using an approach based on the distinction between the DOC sources during high flow and low flow. The assumption supporting this approach is that the peatland is the main contributor to DOC exports during high flow – because other sources are considered to be negligible – while during low flow, the most conservative approach is to consider the whole catchment to be the potential DOC source. The surface considered in the specific DOC export calculation (S in Eq. 1) is the catchment surface (2 219 574 m2) during low flow and the peatland surface (1 702 353 m2) during high flow.
Table 2(a) Monthly specific dissolved organic carbon (DOC) flux () at the outlet stream from June 2018 to May 2020 and distinguished flux during high flow when (1) the surface of the peatland is considered in the calculation and (2) the watershed is considered in the flux calculation. (b) Summary of DOC flux during the two growing seasons, namely the total recorded and their proportion during high- and low-flow periods.
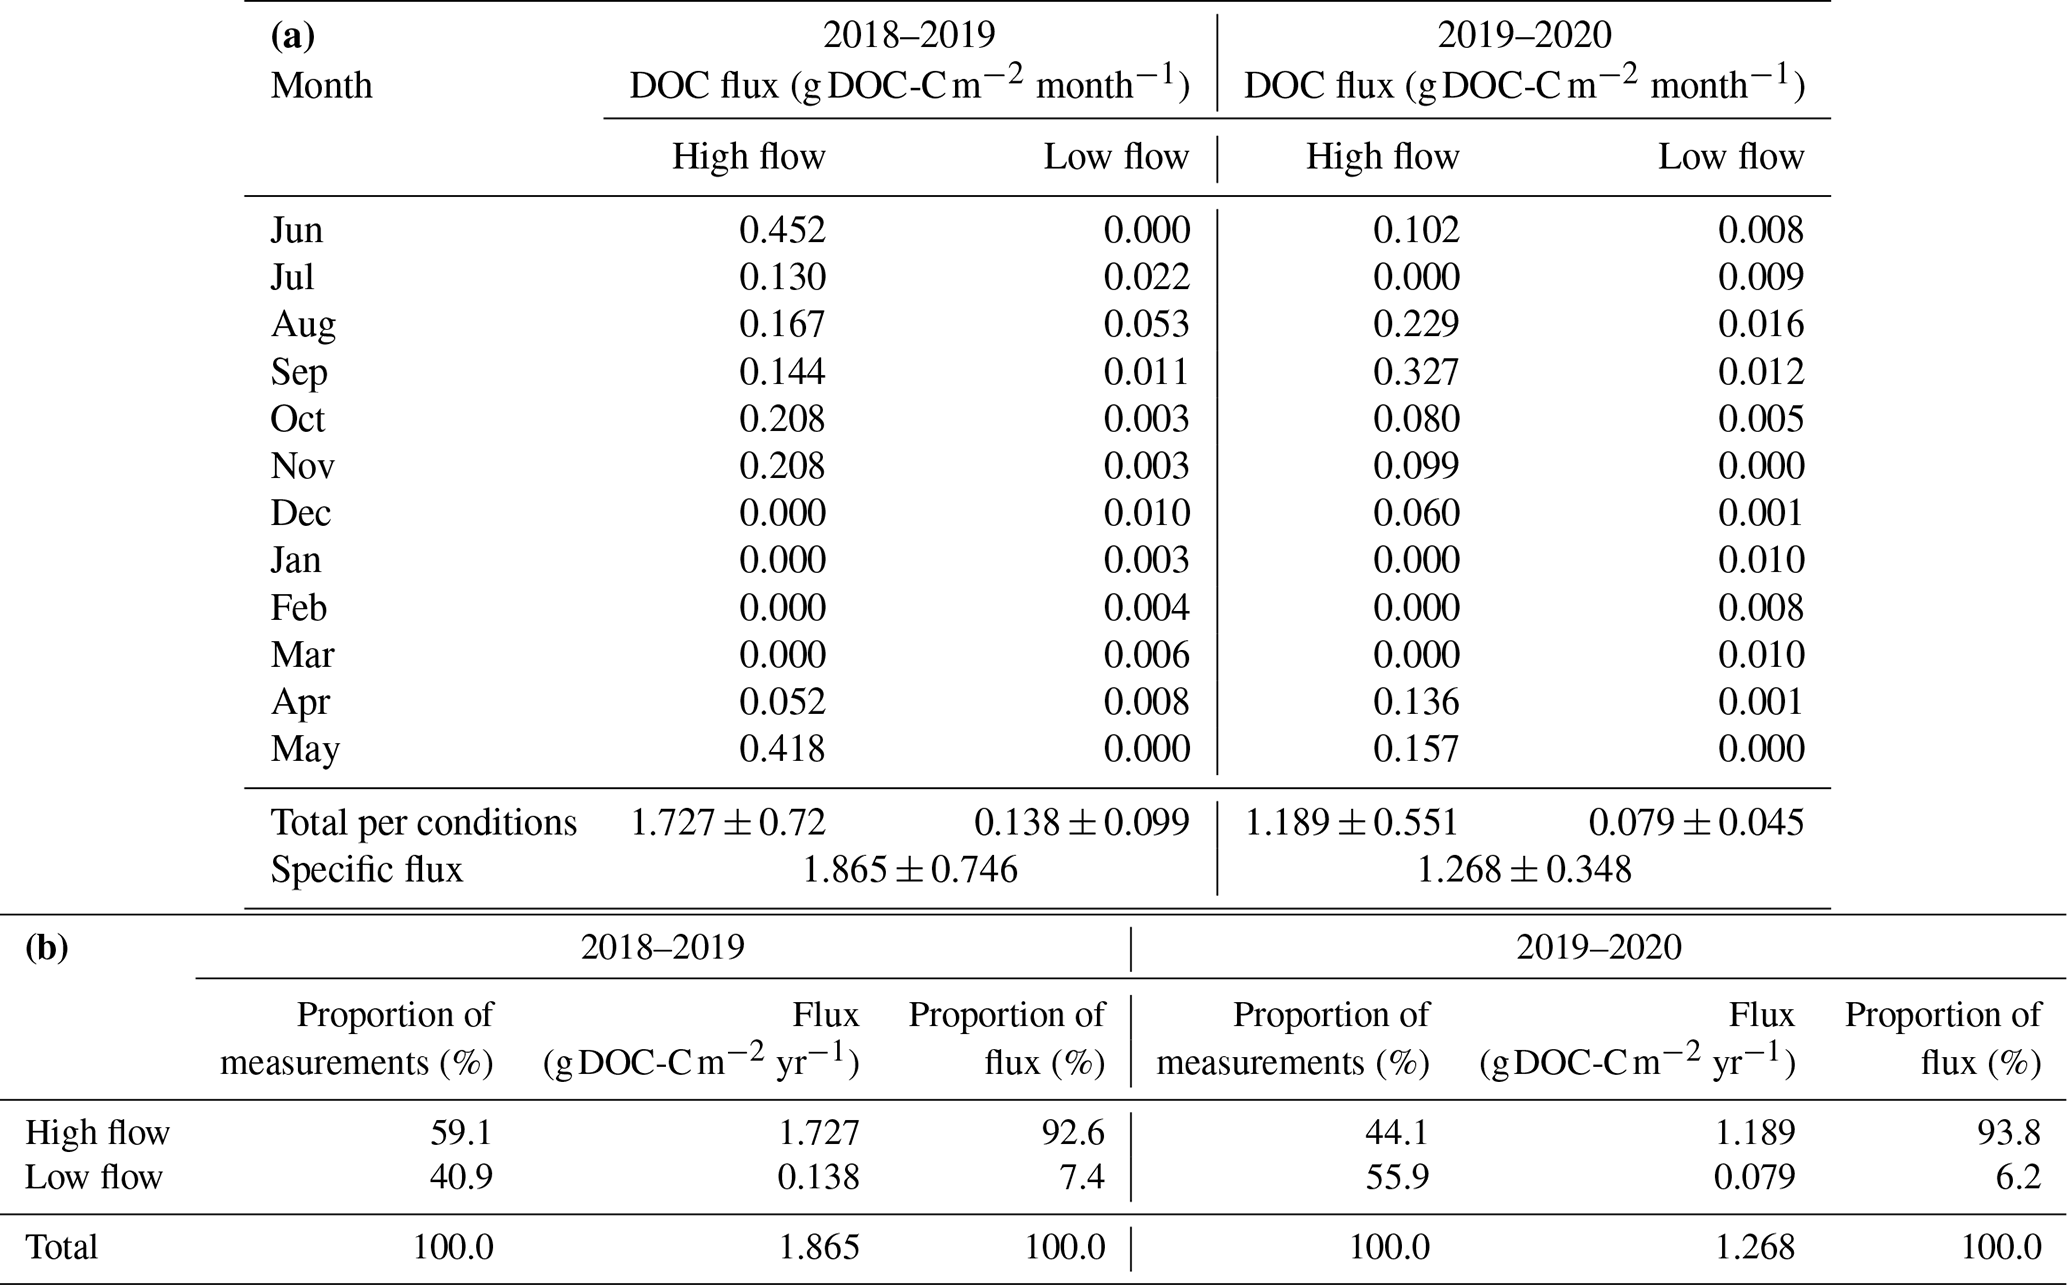
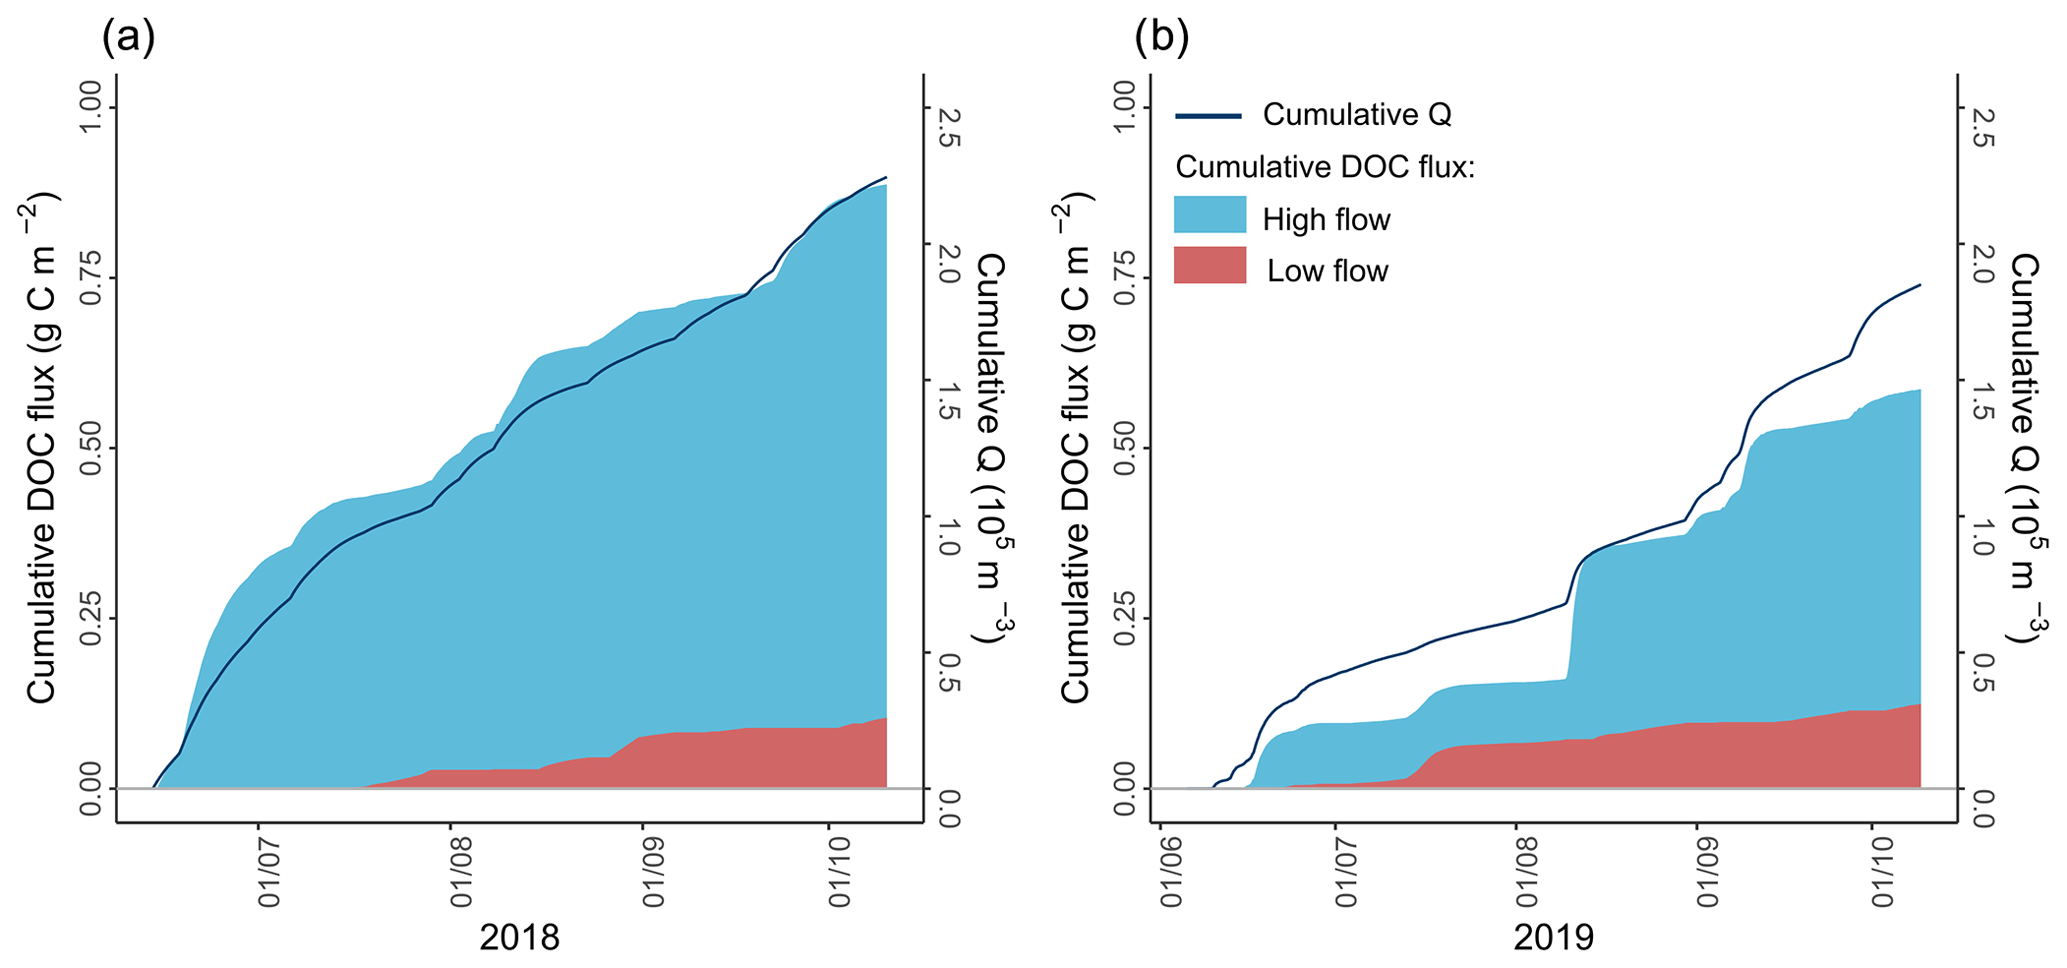
Figure 4Cumulative dissolved organic carbon (DOC) flux (in g DOC-C m−2) and the cumulative stream discharge (in m3) during the (a) 2018 and (b) 2019 growing seasons. ∗ The staircase trend observed in 2019 can be explained by long periods of drought with very low DOC concentrations with discharge given the low DOC exports (Fig. 3e).
The specific annual DOC exports were 1.87 ± 0.75 for June 2018–May 2019 and 1.27 ± 0.35 for June 2019–May 2020 (Table 2 and Fig. 4). The strategy used to calculate the specific DOC exports by distinguishing high flow and low flow provides a better estimation of exports. If the most conservative surface (i.e., the catchment area) had been used to calculate the specific exports, it would have been 1.46 ± 0.64 in 2018–2019 and 0.99 ± 0.31 in 2019–2020. Conversely, if the peatland surface area had been used in the specific DOC export calculation, it would have been 1.91 ± 0.83 in 2018–2019 and 1.29 ± 0.41 in 2019–2020. The proximity with these last values and the intermediate strategy we used (i.e., surface area considered in DOC export calculation depending on hydrological conditions) is coherent given the dominance of DOC exports during high-flow periods of 92.6 % and 93.8 % for 2018–2019 and 2019–2020, respectively.
This approach provides a range for the plausible specific DOC exports from the peatland between 1.46 and 1.91 for 2018–2019 and between 0.99 and 1.29 for 2019–2020. During the period corresponding to the threshold of the 85th percentile of the Q measurements (i.e., 15 % of the total time series with the highest measured Q), the DOC exports represented 63.6 % of the total exports during the 2018–2019 period and 66 % during the 2019–2020 period.
4.3 Analyses of flood events
4.3.1 Description of the flood events
Twelve flood events were isolated over the two growing seasons – six in 2018 and six in 2019 (see the vertical grey bars in Fig. 3). The average flood event duration was 4.8 ± 2.1 d. Aa was the longest event (10 d), while Ac was the shortest one (2 d; Table S3).
The Bd event had the lowest rainfall (8 mm), while the Bb event had the highest rainfall (34 mm). The antecedent rainfall 14 d before the beginning of the event was between 10 mm during the Ac event and 71 mm before the Be event. The maximum discharge during flood events varied from 0.026 m3 s−1 (Ac) to 0.1 m3 s−1 (Be). The discharge increase (ΔQ) varied from 0.019 m3 s−1 (Ac) to 0.084 m3 s−1 (Bb). ΔWTD during an event was between 0.08 m during the Ba event and 0.25 m during the Bb event. The DOC peak concentration varied from 5.0 mg L−1 during the Ad event to 24.2 mg L−1 during the Bb one. Regarding ΔQ and ΔWTD, the Bb event also showed the highest DOC concentration increase (ΔDOC, 22.5 mg C L−1). The Bb event also presented the highest hourly DOC exports (DOCload), namely 3.14 kg DOC-C h−1. The Bf event had the lowest DOCload at 0.23 kg DOC-C h−1.
The HI was always negative, associated with counterclockwise hysteresis, except for the Ba event, which had an HI of 0.05, indicating the absence of a hysteretic relation between Q and DOC (Fig. 5). The HI varied from −0.16 for the Bf event to −0.56 for the Ae event. The β index was always positive, indicating a constant transport limitation of DOC during flood events. The Af event showed an FI of 0.02, reflecting the absence of change in the DOC concentration between the beginning of the event and the peak of Q. The positive FI for the other events indicated that the DOC concentration increased during the rising limb of the hydrograph and was between 0.25 for the Ae event and 0.98 for the Bb event.
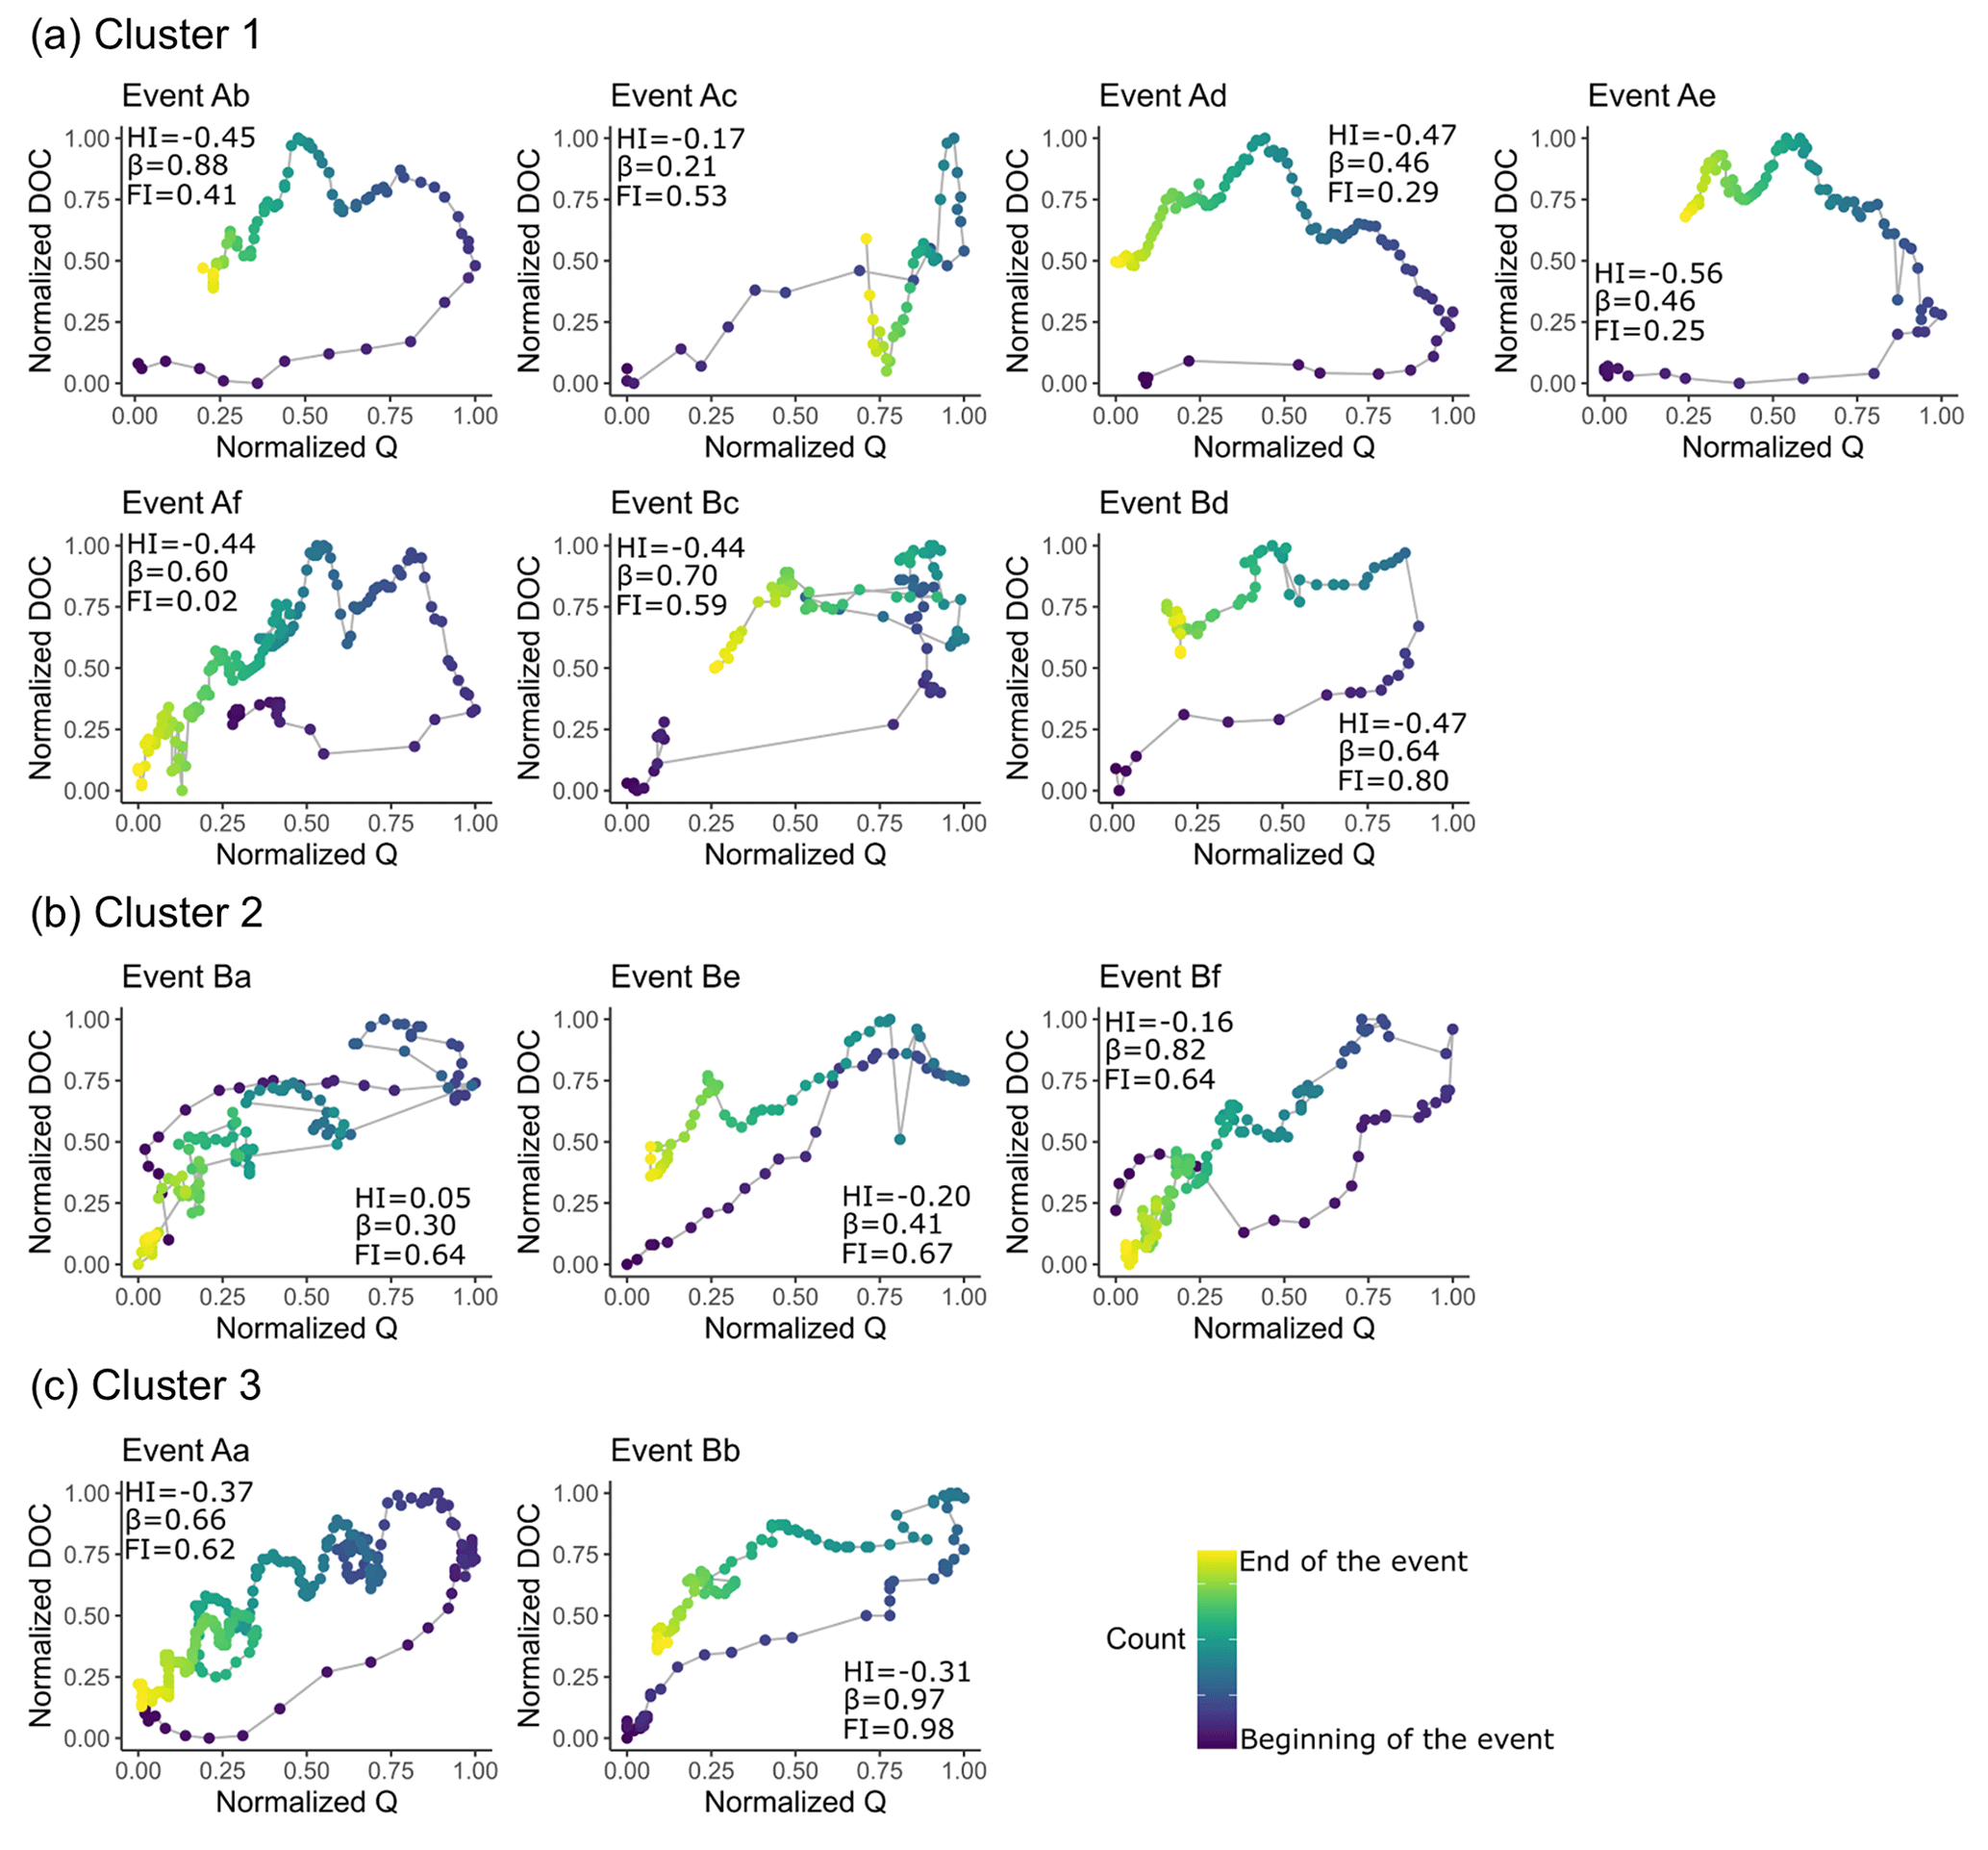
Figure 5The hysteretic relations between hourly measurements of normalized stream discharge (Q) and normalized dissolved organic carbon (DOC) for the events of (a) cluster 1, (b) cluster 2, and (c) cluster 3. The colour represents the count of the measure, from 0 at the beginning of the event to the end. The hysteresis index (HI), the flushing index (FI), and the β index are presented for each event.
The shortest lag time between the rainfall and the beginning of the Q increase (P–Q lag time) occurred during the Ba event (2 h). The longest P–Q lag time was during the Bc and Bd events (7 h). The Q lag time ranged from 15 h for the Ac event to 39 h between the beginning of the event and Q peak during the Bc event. The DOC lag time or the lag time between the peak of Q and the peak of DOC ranged from 7 h during the Ac event to 36 h during the Ad event. The shortest DOC90 occurred during the Ac event (2 h), while the longest DOC90 was 17 h during the Ae event.
4.3.2 Classification and typology of flood events
The hierarchical clustering performed on based PCA (presented in Fig. S2) classified the flood events into three groups (Fig. 6a). Cluster 1 included the Ab, Ac, Ad, Ae, Af, Bc, and Bd events; cluster 2 comprised the Ba, Be, and Bf events; and cluster 3 included the Aa and Bb events.
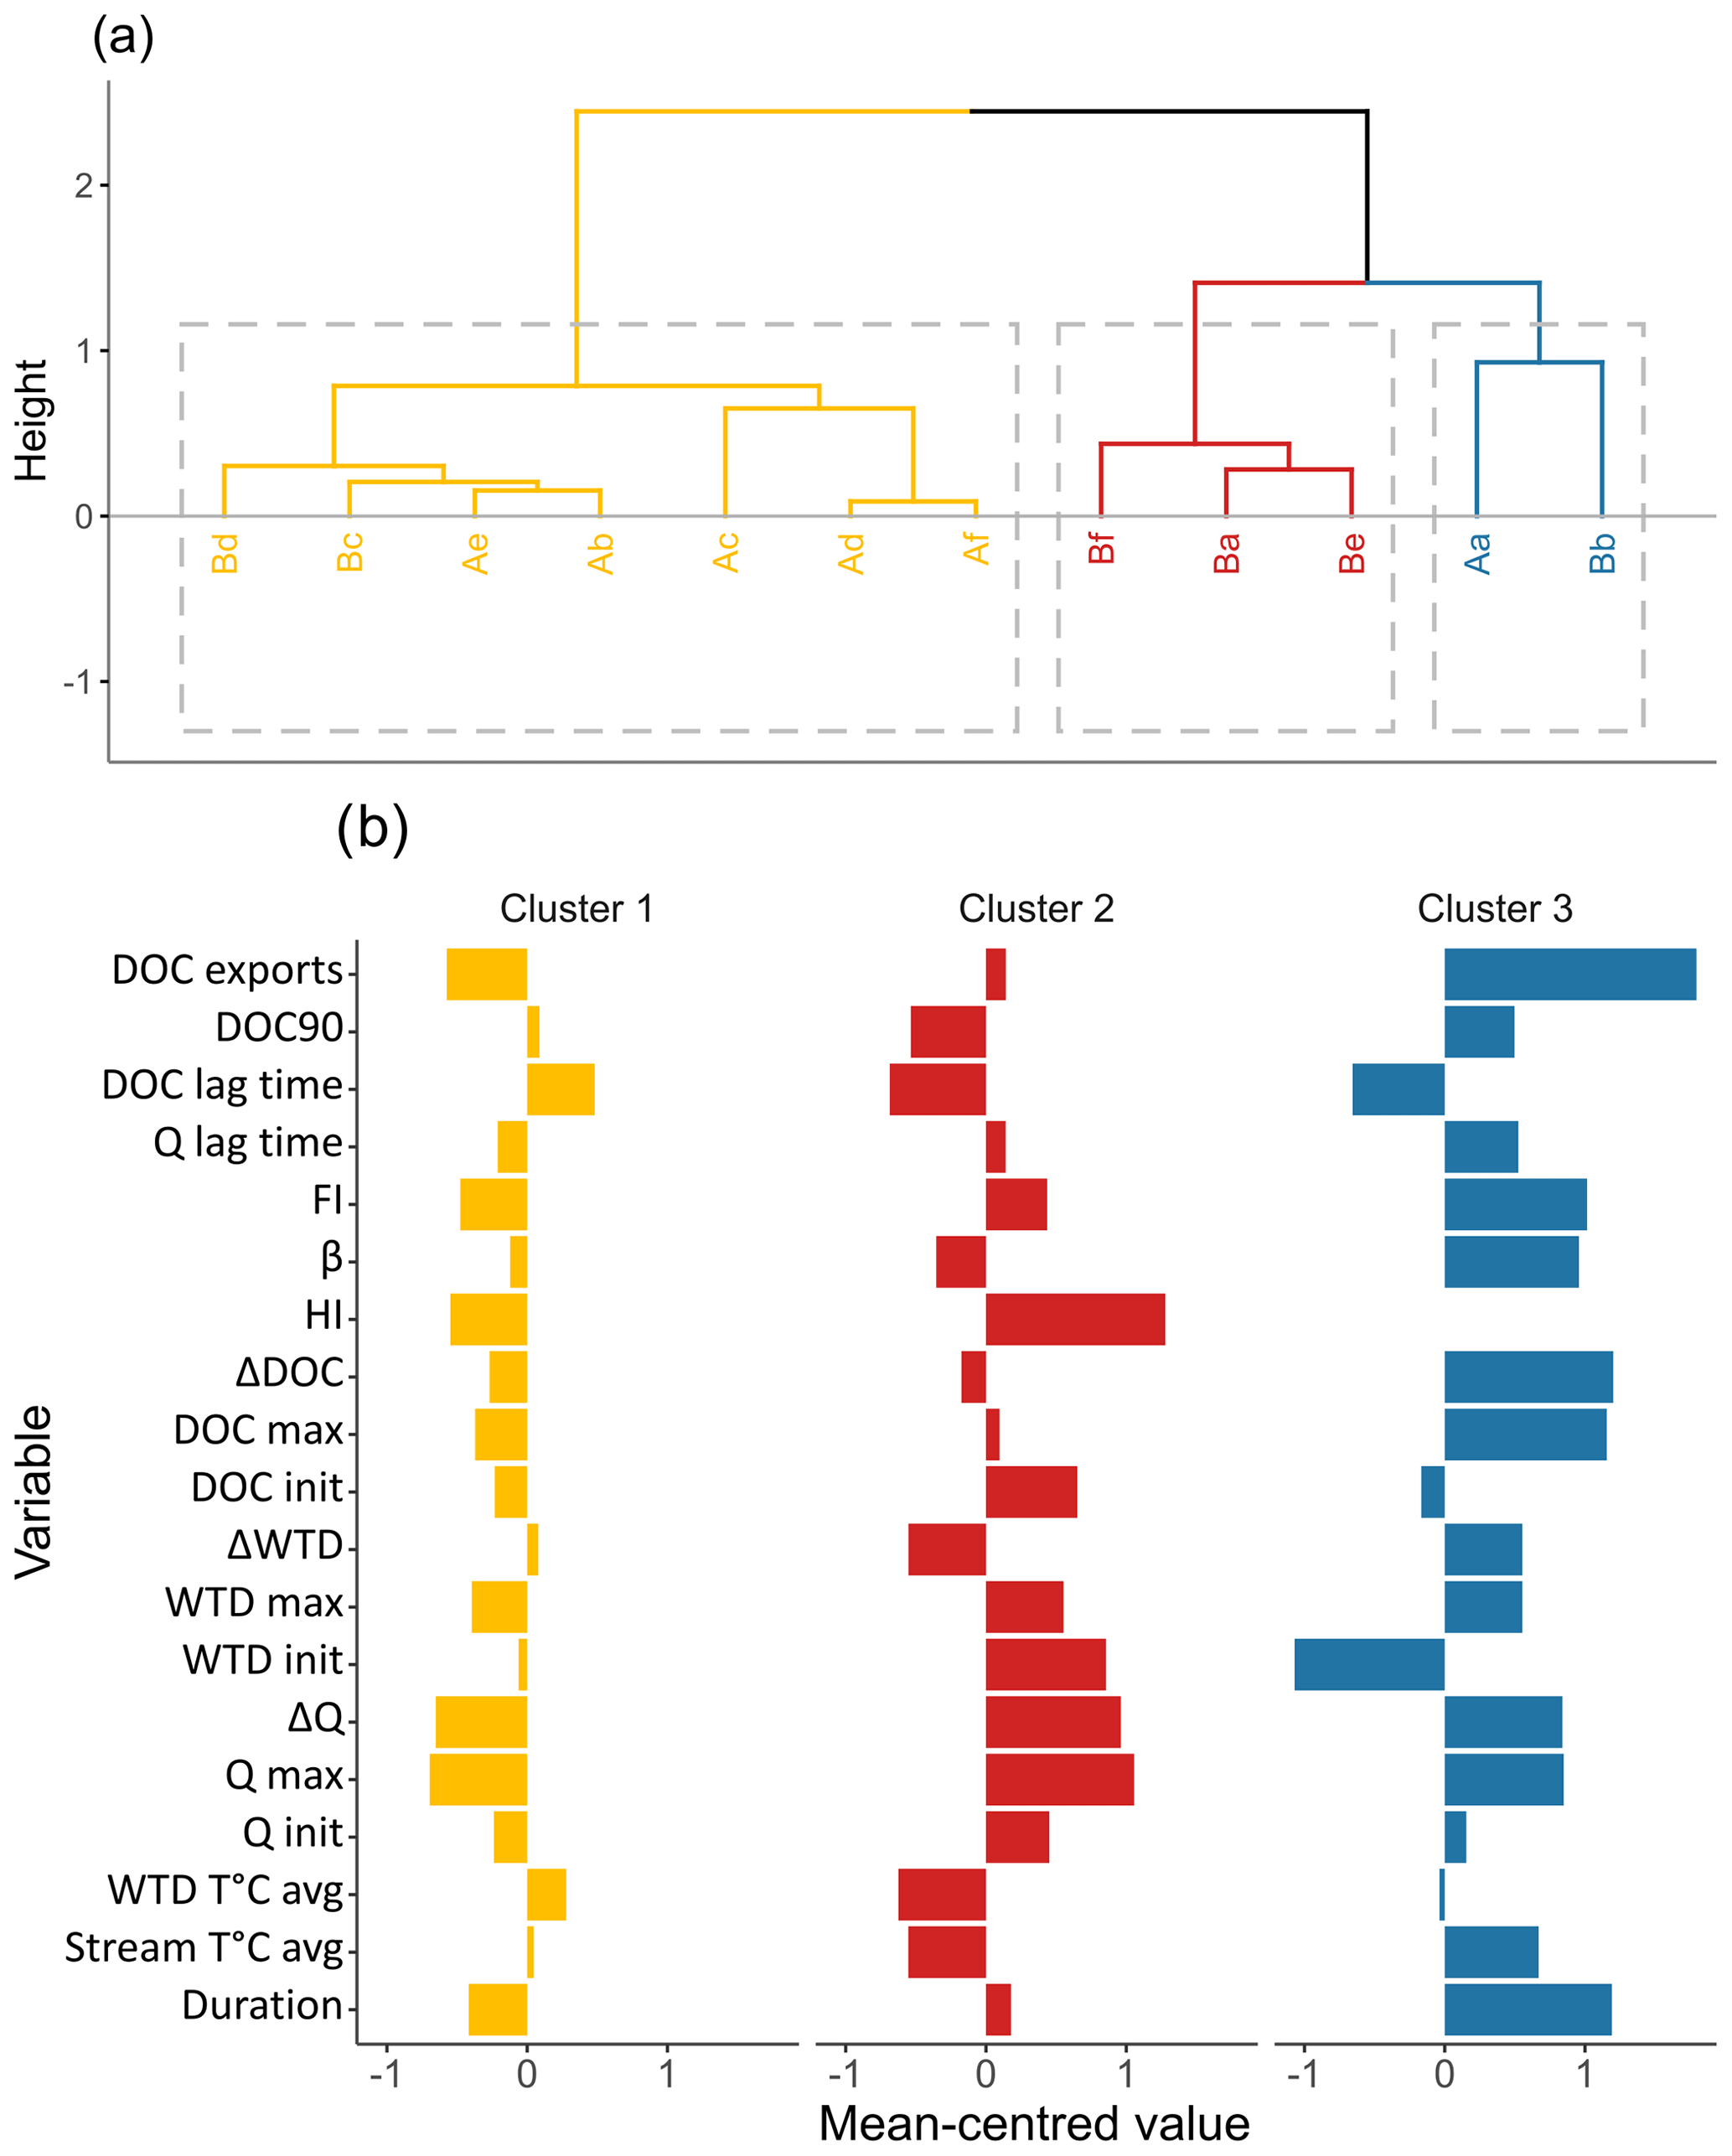
Figure 6(a) Hierarchical clustering based on principal component analysis, discriminating the events into three clusters (cluster 1 = yellow, cluster 2 = red, cluster 3 = blue). (b) For each event, the variables have been mean centred and averaged by cluster. The representation of averaged mean-centred values allowed us to identify the behaviour of variables in each cluster.
Table 3Summary of the variables and indexes (presented as mean ± standard deviation) for each cluster of flood events. The variables include the duration of events; the average stream temperature (T, ∘C); the initial, maximum, and change in (Δ) the stream discharge (Q); the water table depth (WTD); and the dissolved organic carbon (DOC) concentration. The hysteretic index (HI), flushing index (FI), and β index characterize the storm events. Precipitation variables comprise the total precipitation during events (PP event) and antecedent precipitation 2 d (AP2) and 14 d (AP14) prior to the beginning of an event. Total PP corresponds to the sum of AP14 and PP events. The P–Q lag time corresponds to the duration between a precipitation event and the beginning of the increase in Q. The Q lag time corresponds to the duration between the beginning of the discharge increase and the discharge peak. The DOC lag time corresponds to the duration between the discharge peak and the DOC peak. DOC90 corresponds to the period when 90 % of the maximum DOC concentration was exceeded.
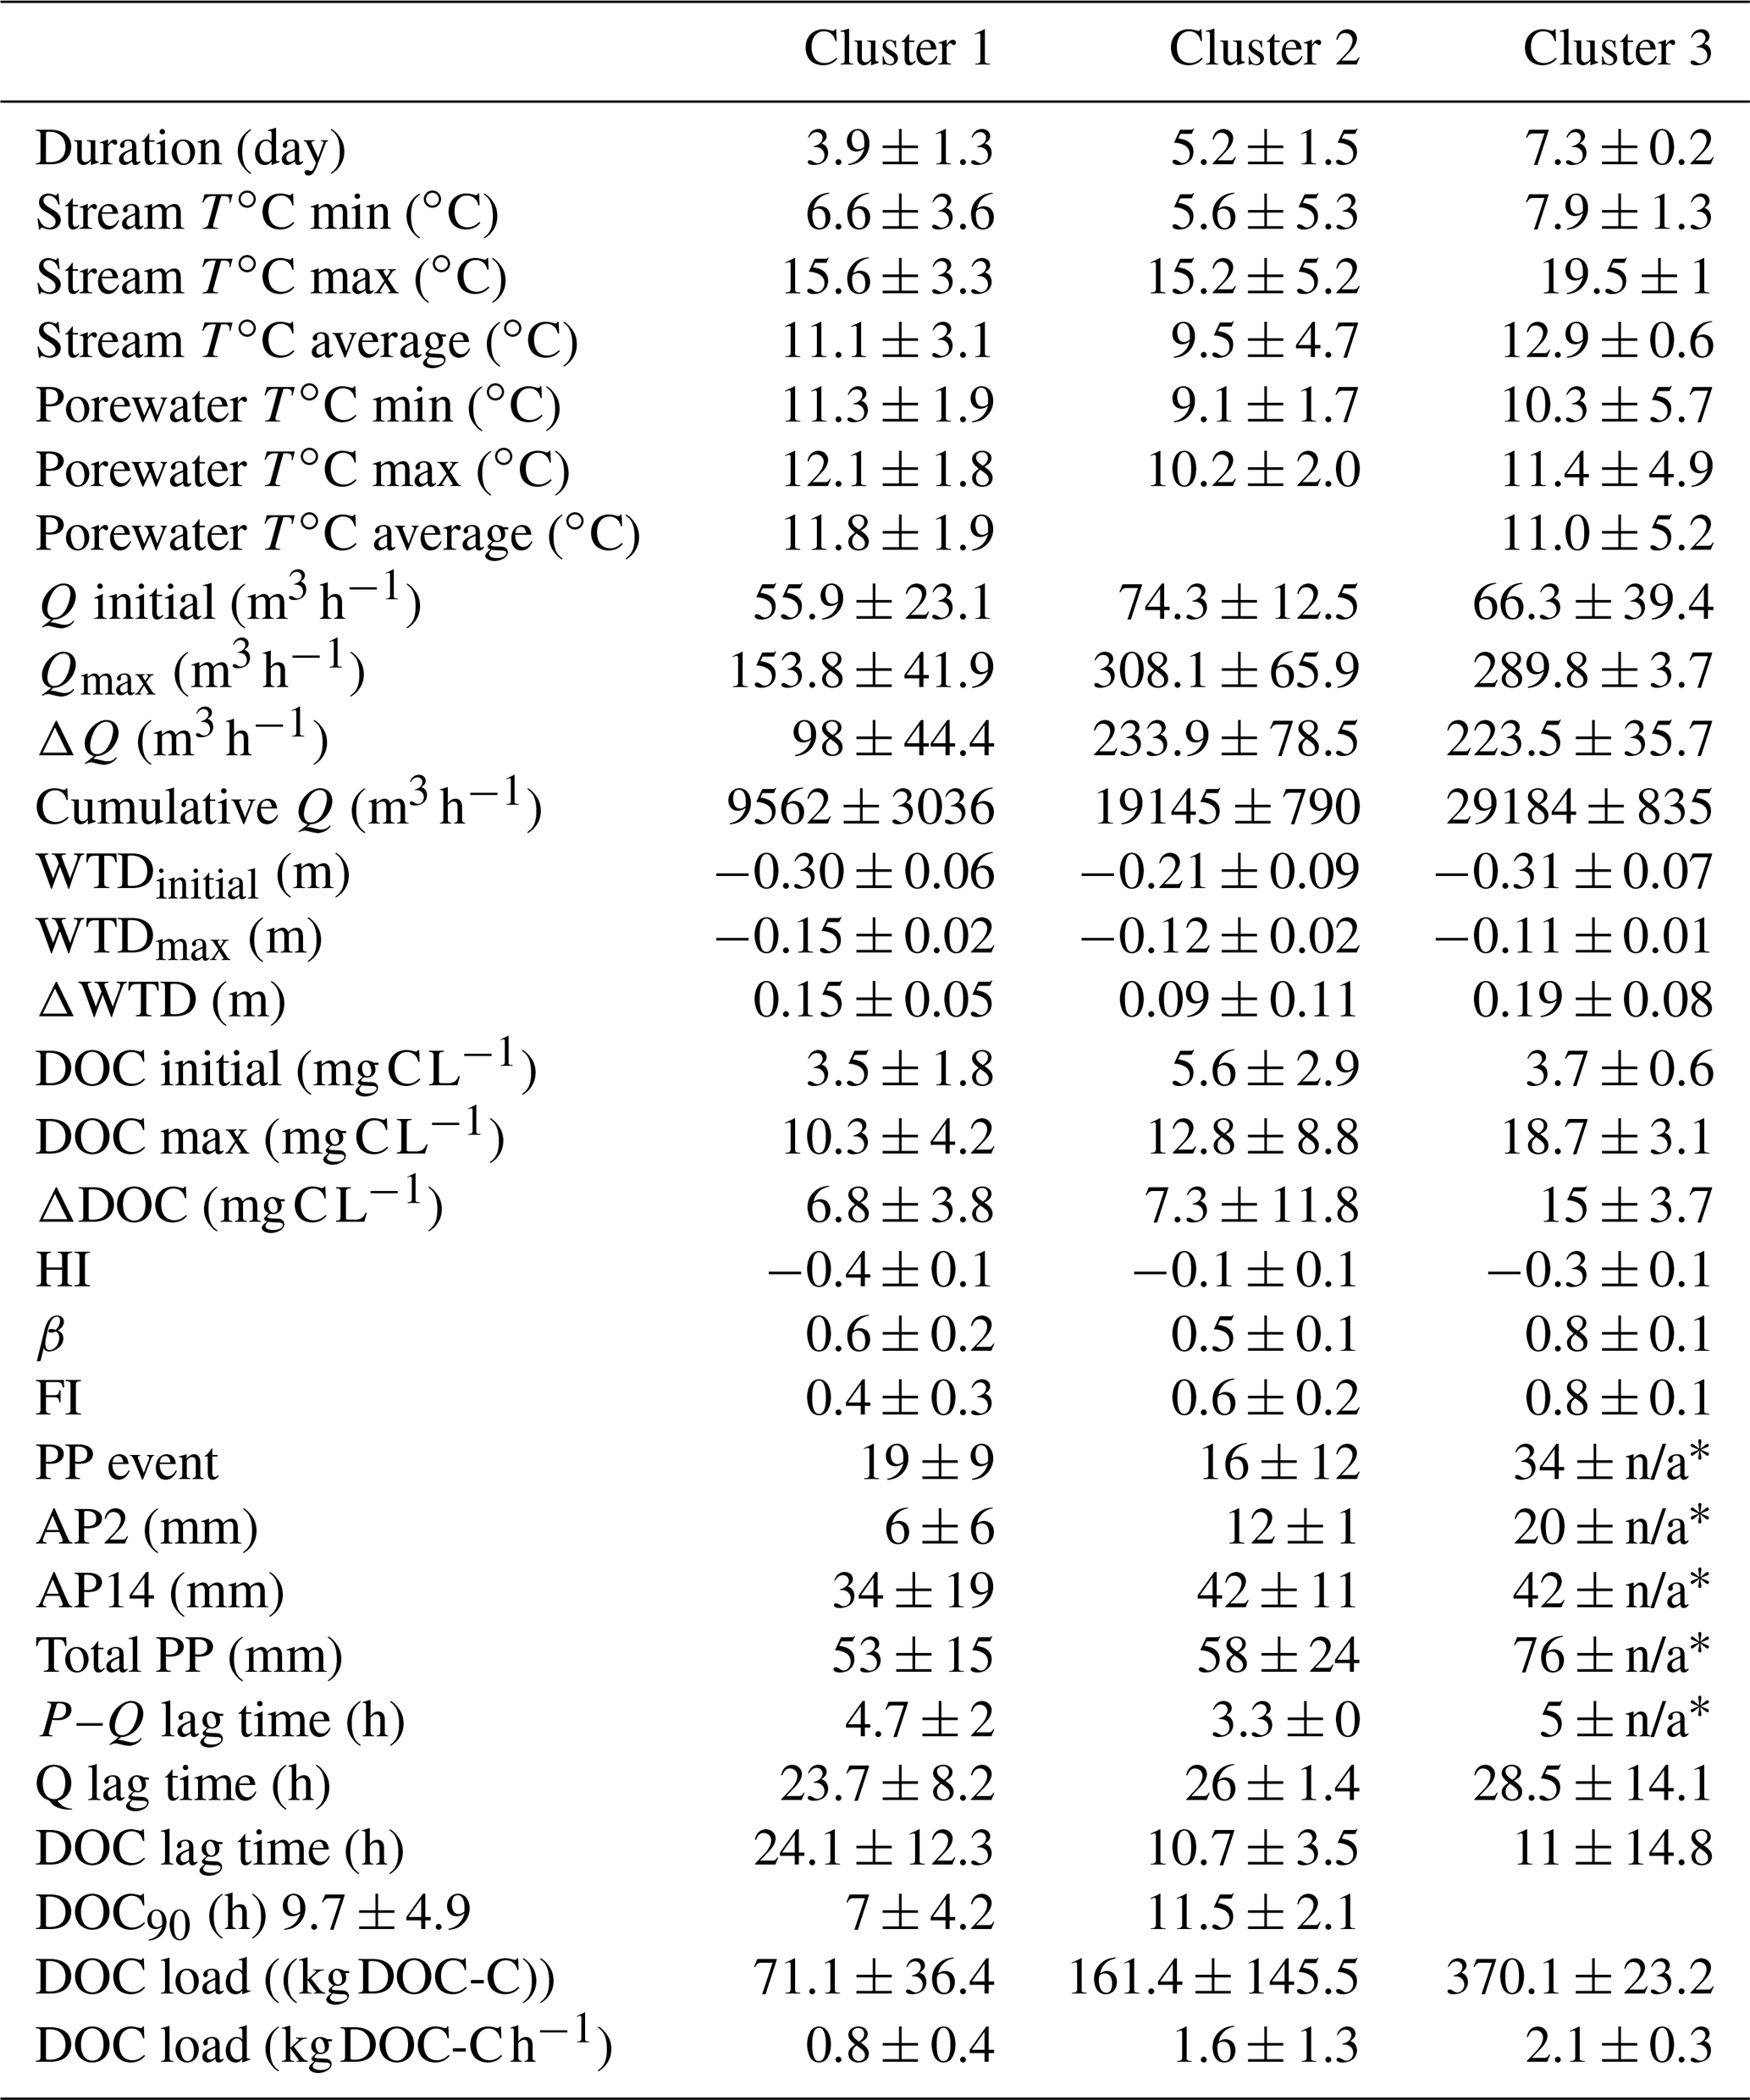
∗ As no precipitation data were available for the Aa event, it was not possible to calculate a standard deviation for the events of cluster 3. The values correspond to the results for the Bb event. Note that n/a stands for not applicable.
The average variable values by cluster are summarized in Table 3. The events of cluster 3 had greater DOC exports, namely 2.4 ± 0.1 kg C h−1, compared with clusters 1 and 2 (0.6 ± 0.3 and 1 ± 2.1 kg DOC-C h−1, respectively). The events of cluster 3 also had the highest DOCmax and ΔDOC of 19.4 ± 2.1 and 15 ± 3.7 mg C L−1, respectively. By contrast, the events of cluster 2 presented the lowest average DOCmax (8 ± 13.7 mg C L−1), but the events of cluster 1 presented the lowest ΔDOC (6.4 ± 4.1 mg C L−1).
Although the events of cluster 3 had the highest ΔDOC, the events of cluster 2 had the highest Qmax and ΔQ, namely 0.086 ± 0.018 and 0.065 ± 0.022 m3 s−1, respectively. Qmax and ΔQ for the events of cluster 3 were 0.081 ± 0.001 and 0.062 ± 0.010 m3 s−1, respectively. The events of cluster 1 had the lowest Qmax and ΔQ of 0.043 ± 0.012 and 0.029 ± 0.011 m3 s−1, respectively. The events of cluster 3 showed the lowest WTDinitial (−0.31 ± 0.07 m) and the highest WTDmax (−0.11 ± 0.01 m) and thus the highest ΔWTD (0.19 ± 0.08 m). The events of cluster 2 presented the lowest ΔWTD (0.09 ± 0.11 m) and the highest WTDinitial (−0.21 ± 0.09 m). Conversely, the events of cluster 1 showed a low WTDinitial (−0.30 ± 0.06 m), and despite a relatively high ΔWTD of 0.15 ± 0.05, they reached the lowest average DOCmax (−0.15 ± 0.02 m).
On average, the events of cluster 1 presented the lowest HI (−0.4 ± 01), while the events of cluster 2 showed the highest HI (−0.1 ± 0.1). The events of clusters 1 and 2 shared a similar β index of 0.5, while the events of cluster 3 had the highest β index (0.8 ± 0.1). The events of cluster 3 had the highest FI (0.8 ± 0.1) compared with 0.6 ± 0.2 for the events of cluster 2 and 0.3 ± 0.3 for the events of cluster 1.
For cluster 3, the rainfall data were only available for the Bb event. However, this event showed the highest total rainfall (76 mm), supported by the highest rainfall during the events and high rainfall before the event. The lowest rainfall before the events occurred for cluster 1, and the rainfall during the events of 19 mm on average led to the lowest total PP of 53 ± 15 mm, which was slightly lower than that of events of cluster 2 (58 ± 24 mm).
5.1 Peatland hydrological connectivity controls DOC exports to the stream
Coupling high-frequency monitoring of DOC concentrations with hydrological measurements (Q and WTD) was important to better understand the relationships between DOC concentration dynamics at the outlet and the hydrological functioning of the peatland. In the studied peatland, we observed a control of hydrological variables (i.e., WTD and Q) in the DOC concentrations at the stream outlet (Table S2). The increase in WTD coincides with an increase in Q and DOC concentrations at the outlet and, consequently, with an increase in DOC exports (Fig. 2). DOC mobilization during high-flow periods exhibited counterclockwise hysteresis (Fig. 5), reflecting the pronounced connectivity between DOC-rich sources within the catchment and the stream (Tunaley et al., 2017). The positive FI and β index (Table 3 and Fig. 5) indicate accretion of DOC in the stream during flood episodes and reveal a transport limitation of DOC (Vaughan et al., 2017; Zarnetske et al., 2018).
The logarithmic relationship between WTD and Q (Fig. 2a) highlights the crucial contribution of peatland during high-flow periods. This mechanism has been described as the threshold of the runoff and subsurface flow generation effect induced by a greater WTD (Frei et al., 2010) based on the transmissivity feedback mechanism (Bishop et al., 2004) and leading to Q increase. It also illustrates the coupling of WTD and DOC exports (Fig. 2b), which are favoured by subsurface flows of water into DOC-rich horizons and less decomposed peat (Austnes et al., 2010) as initiated by a rainfall event leading to the increase in WTD and as confirmed by a significant positive correlation between DOC exports and WTD (cor = 0.75, p < 0.0001; Fig. 2b). An increase in the subsurface flows has been described as the dominant hydrological control on DOC mobilization and exports to peatland streams (Bishop et al., 2004; Birkel et al., 2017; Rosset et al., 2022). In addition, the fluctuating water table in the acrotelm enhances the DOC available to the lateral discharge during high-flow events (Kalbitz et al., 2000; Worrall et al., 2002; Grand-Clement et al., 2014). During the driest periods, the DOC diffuses through the peat and becomes available for further mobilization through lateral discharge during rewetting of the acrotelm (Worrall et al., 2008). This is consistent with the particularly important DOC exports measured during the summer of 2019 (the Bb event, Fig. 3) after July 2019, which was the driest month (27 mm of precipitation). As the increase in the DOC concentration and exports in the stream followed the WTD increase (Figs. 2 and 3), we assume that the DOC exported during high flow is mainly derived from leaching of the acrotelm.
The intermittence of DOC concentration peaks showed that DOC exports are constrained during flood episodes, which are characterized by rapid and significant increases in WTD and Q (Fig. 2). As DOC concentration variations and exports and hydrological variables are closely related, the shift from low- to high-flow periods can be viewed as the hydrological reconnection between peat – that is, the DOC reservoir – and the peatland drainage stream (Billett et al., 2006).
5.2 The succession of low and high flow determines specific peatland DOC exports
In contrast to the assumption that the peatland is the main source of exported DOC during high-flow periods, we found that the hydrological connection between the peat and the stream is less clear during the low-flow periods (Fig. 3). Consequently, we developed an alternative approach to calculate specific DOC exports by using two different catchment surface areas depending on the discharge.
Based on the classification of the discharge in high- and low-flow periods, we calculated the specific exports of the peatland as the amount of DOC exported during the high-flow periods. During the low-flow periods, we used the more conservative approach; specifically, we used the total catchment area as the surface reference (instead of the peatland area). This approach was based on the observation that DOC exported during high flow is mainly derived from the peat, while during low flow, the hydrological connectivity between the peat and the stream is not clear (Fig. 2a). Although there is an absence of investigations into DOC sources within the catchment, the C–Q relationships might help understand DOC sources through the hypothesis made regarding peatland lateral flow pathways within the catchment. During the studied floods episodes, C–Q relationships exhibited a consistent pattern characterized by counterclockwise hysteresis and increases in DOC concentrations corresponding to the rising limb of the flood (Fig. 5). We previously interpreted them as the subsurface runoff in the DOC-rich acrotelm, caused by the rise of the water table and leading to the progressive reconnection between peat-derived DOC sources and the stream during flood events (Tunaley et al., 2016). Understanding the DOC lateral transfer pathways is important to resolve the challenge of characterizing DOC sources and to estimate the contribution of forested soils, which covered 17 % of the studied site. In a mixed-headwater catchment covered by only 22 % of peatlands in riparian zones, Dick et al. (2015) estimated that 84 % of exported DOC was derived from peat soils. In catchments dominated by mineral forested soils, Raymond and Saiers (2010) observed clockwise hysteretic loops, caused by the progressive depletion of available soil-derived DOC during the rising limb of the flood. Contrastingly, counterclockwise hysteretic loops combined with an increase in DOC concentrations during the rising limb were also observed in the forested catchment. Despite the dominance of forested area, authors attribute those relations to the contribution of riparian wetlands to DOC exports (Pellerin et al., 2012; Strohmeier et al., 2013). In our site, forested areas are concentrated on the western border of the catchment with some patches in upstream sections , while in the downstream section, the riparian areas are dominated by peat (Fig. 1). This context tends to moderate the importance of forested inputs in DOC export contribution.
We argue that this pragmatic approach provided a more accurate estimation of the specific DOC exports from the peatland, although it generated a small overestimation since DOC exports from other land covers are assumed to be equal to 0. The annual exports using this approach were 1.87 ± 0.75 in 2018–2019 and 1.27 ± 0.35 in 2019–2020. Approaches using the whole catchment area provided a more conservative estimation, with exports being lower by 21.6 % in 2018–2019 and by 21.8 % in 2019–2020 as compared to the first approach presented above. Conversely, using the peatland area within the catchment to calculate DOC exports during both the low- and high-flow periods would have overestimated the exports only by about 2 % for 2018–2019 and 2019–2020 because the peatland covers 76.7 % of the watershed. While the high-flow periods accounted for 59 % and 44 % of the complete time series in 2018–2019 and 2019–2020, respectively, the specific exports accounted for 92.6 % of the annual exports in 2018–2019 and 93.8 % in 2019–2020 (Table 2b). This approach supports the main contribution of the peatland in annual DOC exports (Tipping et al., 2010) and the importance of high flows as key moments of those exports (Rosset et al., 2019), particularly with the increase of the hydraulic connectivity between the peatland and the stream (Birkel et al., 2017; Tunaley et al., 2017).
In this study, DOC exports are lower than those previously measured in undisturbed boreal peatland drainage streams, which varied from 3.7 to 18.0 (Köhler et al., 2008; Koehler et al., 2009; Juutinen et al., 2013; Leach et al., 2016). This low range of annual DOC exports might be related to incertitude of the discharge during the spring freshet. The stream discharge during this period was derived from the PHIM model (Riahi, 2021) and not by field measurements. Spring freshet is a key period for DOC exports as it can represent 30 % to 55 % of annual carbon exports (Leach et al., 2016). In our site, DOC exports during spring freshets (constrained during April and May, Fig. 3) comprised only 25 % and 23 % of the annual DOC exports for 2018–2019 and 2019–2020, respectively (Table 2a). However, even in a scenario of spring freshet contributing up to 50 % of DOC exports, estimated annual DOC exports would have been about 2.2 and 1.6 for 2018–2019 and 2019–2020, respectively, which remain in the lower range of the measures found in the literature (3.7–18.0 ).
The low DOC exports measured in our site can be explained by hydrometeorological conditions and particularly the low precipitation measured in the region at the Havre-Saint-Pierre airport meteorological station, located 39 km southwest of the site during the studied years (Fig. S4). From May to October (the period including the ice-free season), precipitation was 530 mm in 2018 and 460 mm in 2019, while the average for the 1979–2019 period was 617 ± 104 mm. In addition, precipitation varied by a factor 1.15 between studied years, and this could partially explain the interannual variability in DOC exports that was 1.5 times higher in 2018–2019 than in 2019–2020. Those important interannual variations were previously observed in peatland drainage streams from a factor of 1.6 to 3 and were attributed to interannual variations of the discharge (Worrall et al., 2009; Dinsmore et al., 2013; Leach et al., 2016; Birkel et al., 2017; Rosset et al., 2019). The variability in the cumulative discharge at the stream outlet, 1.26 times higher in 2018–2019 compared to 2019–2020, also supports interannual variations in DOC exports between the 2 years (Fig. 4).
In terms of total carbon flux in our studied peatland, Taillardat et al. (2022) estimated the stream carbon GHG (CO2 and CH4) aquatic exports to be 1.08 . This gives a total aquatic carbon export (GHG + DOC) that ranged between 2.35 and 2.95 and a contribution of DOC exports accounting for 54 %–63 % of the total aquatic carbon exports. This is in line with previous studies which observed a DOC contribution to aquatic carbon flux ranging between 46 % and 95 % (Roulet et al., 2007; Nilsson et al., 2008; Worrall et al., 2008; Dyson et al., 2011; Holden et al., 2012; Huotari et al., 2013; Dinsmore et al., 2013; Leach et al., 2016). Despite low DOC exports measured in the Bouleau peatland drainage stream, it seems that this does not alter the expected proportion of DOC exports in comparison with GHG exports, which mainly occurred during low flow (Taillardat et al., 2022). Also, it seems unlikely that low DOC exports are due to in-stream processing as these are mainly observed during low flow when the hydrological connectivity is limited (Raymond et al., 2016; Casas-Ruiz et al., 2017). Using a closed mass balance model, Taillardat et al. (2022) estimated that only 17 % of exported CO2 results from in-stream processing compared to 81 % from peat porewater drainage.
The low DOC exports need to be considered in the context of the ecosystem carbon budget. Our study and that of Taillardat et al. (2022) are the first to document aquatic carbon exports from an undisturbed peatland within the boreal biome in eastern Canada. In order to better explain those low aquatic carbon exports, it would be interesting to compare them with the net ecosystem exchange of the peatland and to estimate which proportion of carbon accumulated yearly is offset by those outgoing fluxes.
5.3 Variability in DOC lateral transfer patterns and implications in annual DOC exports
The division of flood events between three clusters helped us understand the mechanisms leading to the different magnitudes of DOC exports (Table 3 and Fig. 6b). The events of cluster 1 seem to represent the most common type of flood events as these included 7 of the 12 events and accounted for 47.7 % of the total event duration but with the lowest DOCload of 0.6 ± 0.3 kg DOC h−1 (Table 3). While cluster 1 was characterized by a ΔWTD slightly higher than the average (Fig. 6b), and despite a precipitation event 2 d before the flood (AP2) that was 2 times lower than in cluster 2 and more than 3 times lower than in cluster 3, cluster 1 also presented the lowest WTDinitial (−0.30 m; Table 3). Consequently, the lateral discharge did not lead to an important increase in Q compared with the other clusters (Table 3). In addition to the low ΔQ and Qmax, the low FI (Table 3) reflects the low accretion of DOC (Vaughan et al., 2017). While Tunaley et al. (2017) interpreted that a low HI reflects a DOC source distant from the stream, in our study site, this seems to be more related to progressive rewetting of the peat and slow lateral discharge, leading to slow DOC mobilization to the stream (Bishop et al., 2004; Blaurock et al., 2021). Those conditions restricted the connectivity between DOC sources and the stream, leading to low DOC loads (Fig. 7a).
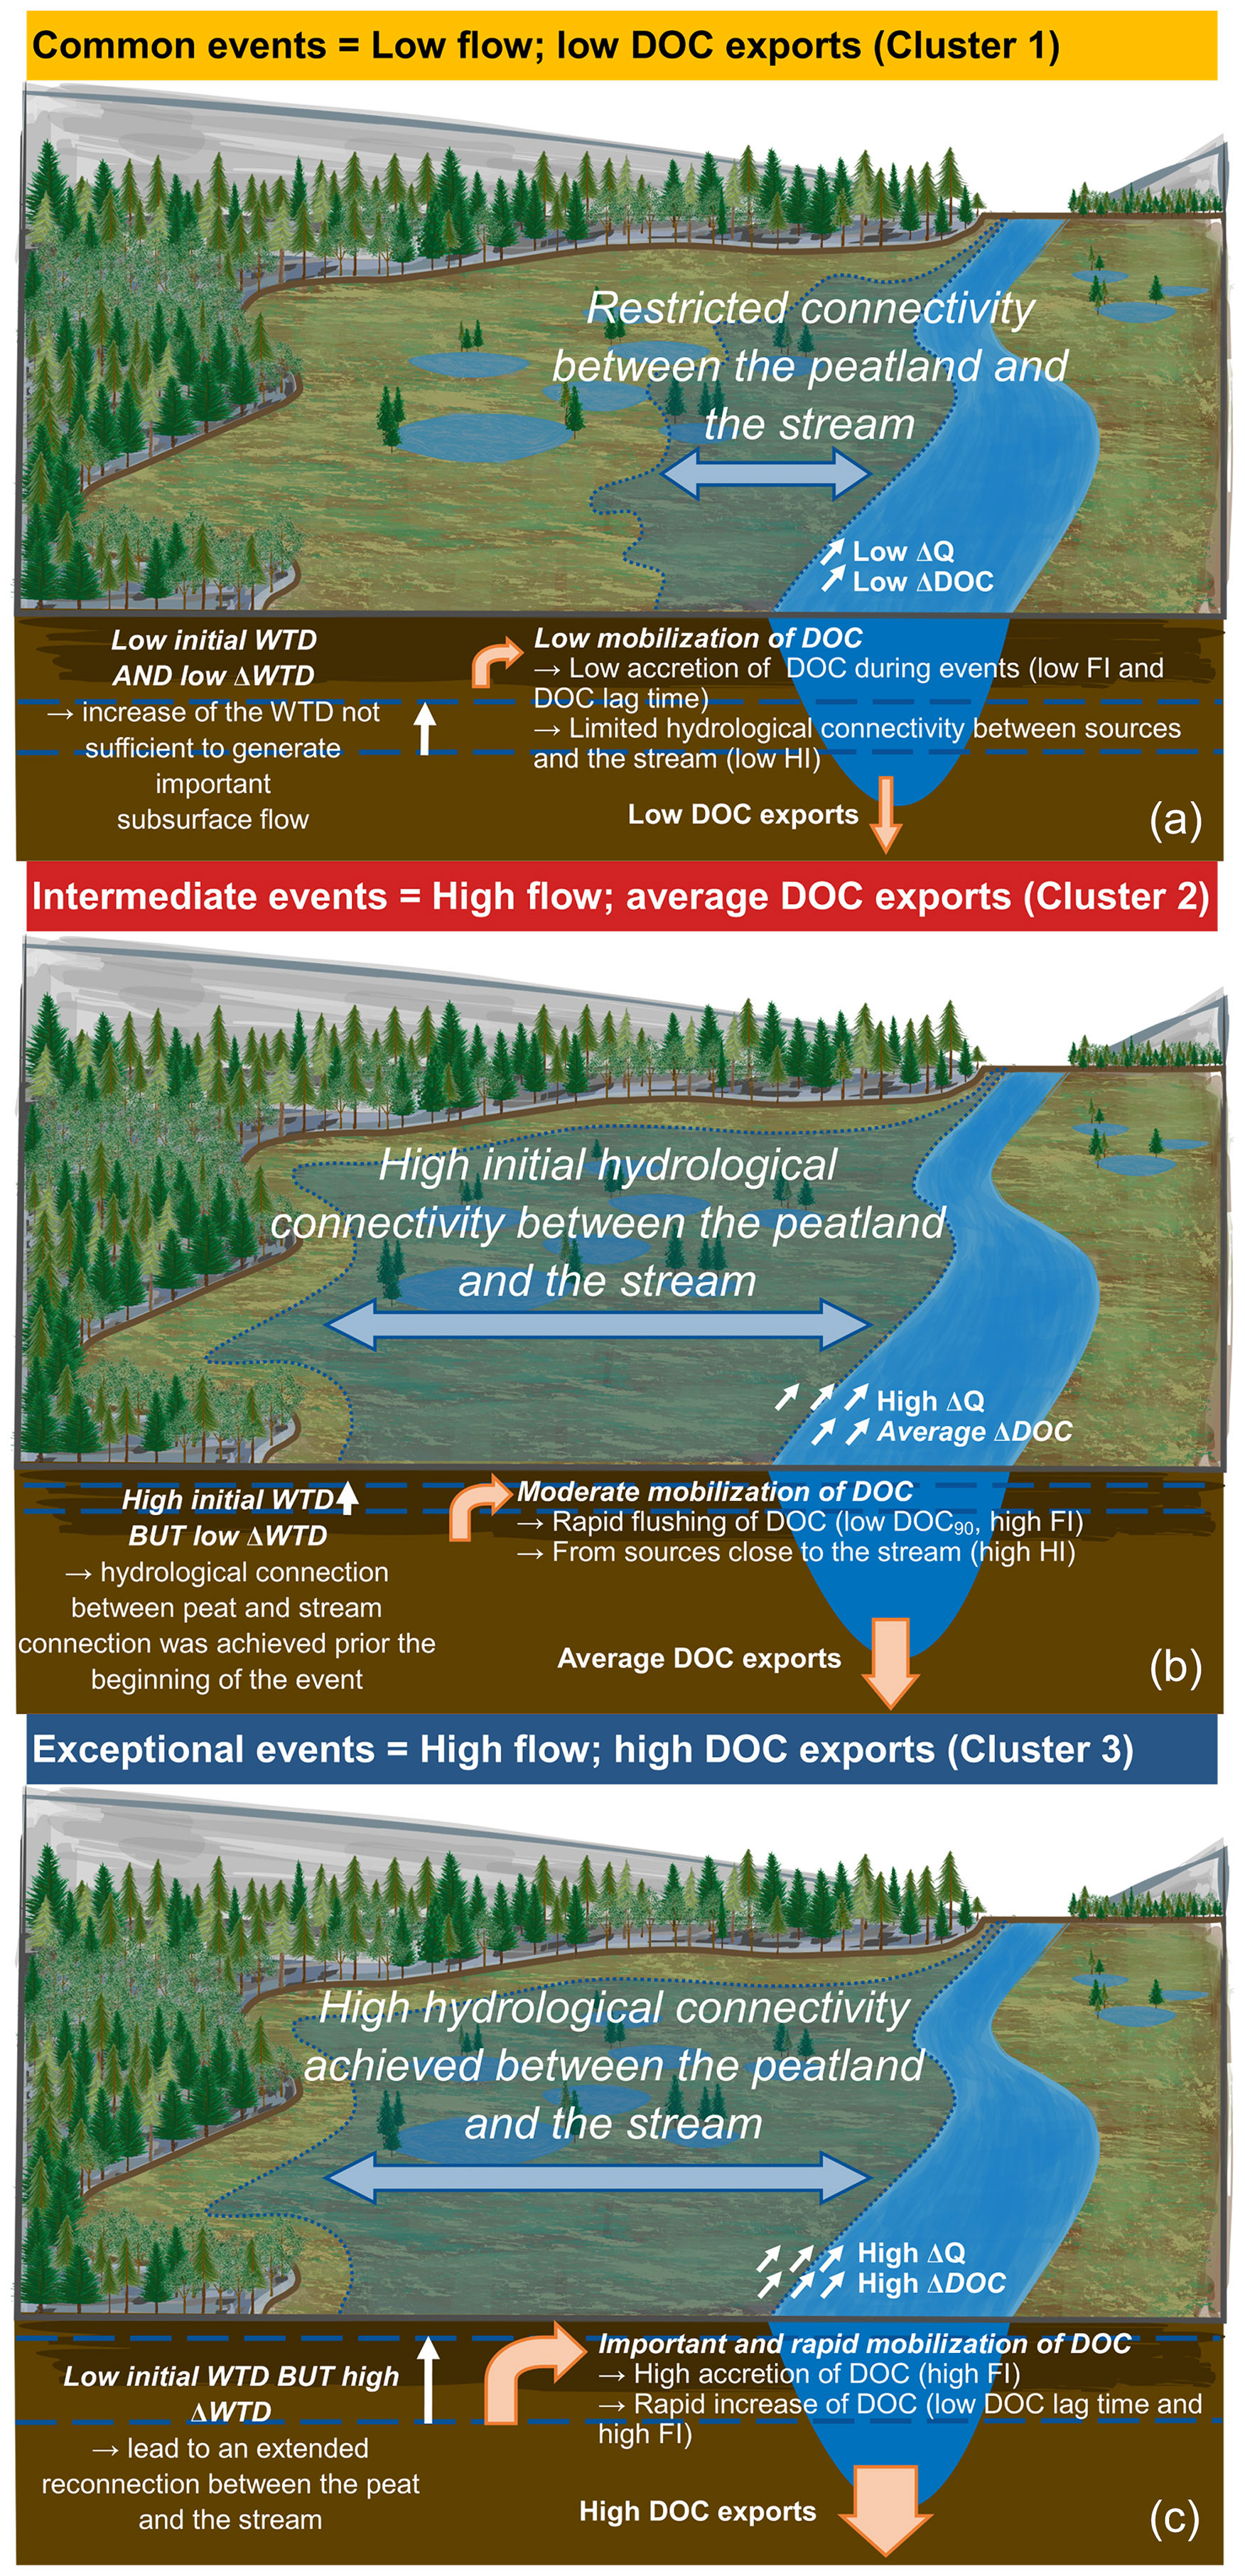
Figure 7Theoretical models of flood events from (a) events of low flow and low dissolved organic carbon (DOC) loads (cluster 1), (b) events of high flow and average DOC loads (cluster 2), and (c) events of high flow and high DOC loads (cluster 3).
Cluster 2 comprised three events that occurred during the early and late growing season of 2019 (Fig. 6a). Those events had a comparable rainfall amount but a higher ΔQ compared with the events of cluster 1 (Table 3). The high WTDinitial might indicate that these events succeeded a previously wet period, as confirmed by the high amount of precipitation 14 d before the event (AP14, Table 3) compared to cluster 1 and similarly to cluster 3 but also by a P–Q lag time (i.e., the lag time between the precipitation event and the increase of discharge in the stream) that was lower than that of the other clusters (Table 3). This can also be sustained by the higher FI compared to the events of cluster 1 and the highest HI (Fig. 5). It reflects rapid DOC mobilization simultaneously with the Q increase and from sources close to the stream (Tunaley et al., 2017; Blaurock et al., 2021). Those events might represent rapid flushing of DOC, promoted by the high WTDinitial and supported by the lowest DOC90, leading to moderate DOC loads of 1.0 kg DOC-C h−1 on average (Fig. 7b). Although the threshold of the lateral discharge generation was easily exceeded, the less negative HI suggests that DOC was mostly exported from sources close to the stream (Tunaley et al., 2017).
Cluster 3 was comprised two events that occurred during early summer (Aa) and midsummer (Bb), where the highest ΔWTD and ΔDOC and high ΔQ led to the highest DOCmax (Fig. 6b). Event Bb, which is the only event of the cluster with available precipitation data, exhibited the highest precipitation during the flood event but also the highest AP2, more than 3 times higher than cluster 1 and 2 times higher than cluster 2 (Table 3). Consequently, during those events, DOCload was 2.4–4 times higher than during the events of cluster 1 and cluster 2, respectively. Despite the low WTDinitial of −0.31 m, which was comparable to the events of cluster 1, those events presented greater DOC exports. These findings indicate that DOCload is more constrained by the magnitude of the WTD increase rather than by the initial WTD considering the fact that WTD drawdown, as well as the average porewater temperature and high stream temperature, can stimulate the DOC production (Clark et al., 2009; Grand-Clement et al., 2014). During those events, the large WTD increase favoured the rapid circulation of water through the DOC-rich acrotelm (Inamdar et al., 2004) and was supported by the high FI, indicating rapid flushing of DOC to the stream (Table 3). In addition, the counterclockwise hysteresis (HI of −0.3 on average, Table 3) highlights the extensive connectivity between DOC sources within the peatland and the stream (Pellerin et al., 2012; Tunaley et al., 2016), supporting the high DOC exports (Fig. 7c).
Cluster 3 events appear to be extreme and associated with events with a low probability of occurrence. DOC exported during those events contributed to 24.3 % and 24.4 % of the total exports while only representing 8.5 % and 3.8 % of the growing season in 2018 and 2019, respectively (Table 2b). The event Bb presented the highest AP2 and total precipitation (Table 3), leading to an important ΔWTD (Fig. 6b). These data suggest that the magnitude of a single event is at least as important as that of several events (Raymond and Saiers, 2010). Interestingly, those events did not happen during the same periods, revealing different export mechanisms.
The Aa event occurred at the end of the spring freshet, which is known to bean important period of DOC exports (Tiwari et al., 2018). However, similar events were not observed during 2019 snowmelt, and event Ba, which occurred during this period, was attributed to cluster 2 (Fig. 6a). However, similar amounts of DOC were exported during May 2019 compared to June 2018 and suggest a delayed spring thaw in 2019 compared to 2018. Previous studies observed that variability in DOC exports can be influenced by interannual variations of meteorological conditions (Ågren et al., 2010; Dinsmore et al., 2013; Tiwari et al., 2018). The period covered by our study limits this interpretation, but it reinforces the necessity of long-term DOC export monitoring (Webb et al., 2019).
Conversely, the Bb event occurred during the warmest registered period, in August 2019, after 42 d of low flow and without a significant period of DOC exports between 26 June and 8 August 2019 (Figs. 3 and 4). A large amount of DOC was exported during high-flow events that occurred throughout the warm periods. This may coincide with conditions that have previously been described as favourable for DOC production which is accumulated within the peat during dry periods (Clark et al., 2007, 2009; Dinsmore et al., 2013). Then, the large rainfall events occurring before the event initiated an important WTD increase that lead to DOC mobilization (Table S3; Grand-Clement et al., 2014; Zhu et al., 2022).
Our study, measuring continuous DOC exports from a boreal peatland in northeastern Canada, provides the very first insights concerning peatland DOC exports from this region. The use of high-frequency monitoring of hydrological variables and DOC concentrations has provided a comprehensive understanding of the temporal dynamics of DOC exports and the mobilization patterns of DOC in a boreal peatland ecosystem. The relationship between WTD and Q highlights the major contribution of peat subsurface flows to Q during flood events. Our data suggest that, during these events, the exported DOC is mainly leached from the peatland. While the determination of specific DOC exports from the peatland remains a challenge, here we proposed a time series analysis split between low- and high-flow periods. During the flood periods, the surface considered in the export calculations is the peatland area within the catchment. By contrast, during the low-flow periods, the catchment area is considered to be the conservative surface reference in the calculation given the lack of a direct link between peat porewater discharge and DOC exports from the stream during the growing season. DOC exported during high flow represented 92.6 % and 93.8 % of the total DOC exports during 59 % and 44 % of the 2018–2019 and the 2019–2020 periods, respectively. In addition, the use of a simple catchment surface in the export calculation underestimates the exports by 22 % compared with the new approach we proposed here.
The study of DOC mobilization during flood events supports the theory that variations in WTD generate lateral discharge that controls the magnitude of DOC being exported from the stream. Based on hierarchical clustering, three types of events were characterized with contrasting wetness conditions. The most common events (cluster 1) had a low WTDinitial and a small WTD increase that limited the extent of the connectivity between the DOC sources and the stream. Conversely, the events of cluster 3 showed an important WTD increase, easily exceeding the threshold of runoff generation to facilitate DOC mobilization and to increase its transfer through the stream. Those exceptional events can represent up to 24 % of the total DOC exported during periods, accounting for 8 % and 3 % of the growing season in 2018 and 2019, respectively. The cluster-2 events represented intermediate conditions. While during those events the threshold of runoff generation was easily exceeded, previous events might have depleted DOC available to be transferred to the stream. This event presented relatively low DOC loads despite the high peak WTD and Q.
The response of DOC mobilization to hydroclimatic conditions in peatlands is a key element in the magnitude of DOC exports. With current warming temperatures and expected increases in precipitation, we expect that the ice-free season duration and the water balance of peatland ecosystems will be affected.
The datasets used in this study are available online on the PANGAEA data repository (https://doi.pangaea.de/10.1594/PANGAEA.959045, Prijac et al., 2023).
The supplement related to this article is available online at: https://doi.org/10.5194/hess-27-3935-2023-supplement.
Conceptualization: LG, MG, AP, and PT. Data curation: AP and PT. Data analyses: AP, AP, KR, and PT. Formal analyses: AP and LG. Funding acquisition: MG and AT. Investigation: LG, AP, and PT. Methodology: MAB, LG, and AP. Data collection: AP, KR, and PT. Writing – original draft preparation: AP. Writing – review and editing: MAB, LG, MG, AP, KR, PT, and AT.
The contact author has declared that none of the authors has any competing interests.
Publisher’s note: Copernicus Publications remains neutral with regard to jurisdictional claims made in the text, published maps, institutional affiliations, or any other geographical representation in this paper. While Copernicus Publications makes every effort to include appropriate place names, the final responsibility lies with the authors.
We thank Frederic Julien, Virginie Payre-Suc, and Didier Lambrigot from Laboratoire Écologie Fonctionnelle et Environnement (UMR 5245 CNRS – UT3 – INPT, France) for performing the DOC–TN and cation–anion analyses. Thanks is given to Roman Teisserenc (ENSAT, Toulouse, France) and students Charles Bonneau, Charles-Élie Dubé-Poirier, Camille Girard, Pénélope Germain-Chartrand, Léonie Perrier, Guillaume Primeau, Khawla Riahi, and Karelle Trottier for their assistance in the field.
This research has been supported by the Natural Sciences and Engineering Research Council of Canada and Hydro-Québec funding to Michelle Garneau (grant no. RDCPJ 51421817).
This paper was edited by Matthew Hipsey and reviewed by two anonymous referees.
Ågren, A., Haei, M., Köhler, S. J., Bishop, K., and Laudon, H.: Regulation of stream water dissolved organic carbon (DOC) concentrations during snowmelt; the role of discharge, winter climate and memory effects, Biogeosciences, 7, 2901–2913, https://doi.org/10.5194/bg-7-2901-2010, 2010.
Aho, K. S. and Raymond, P. A.: Differential Response of Greenhouse Gas Evasion to Storms in Forested and Wetland Streams, J. Geophys. Res.-Biogeo., 124, 649–662, https://doi.org/10.1029/2018JG004750, 2019.
Austnes, K., Evans, C. D., Eliot-Laize, C., Naden, P. S., and Old, G. H.: Effects of storm events on mobilisation and in-stream processing of dissolved organic matter (DOM) in a Welsh peatland catchment, Biogeochemistry, 99, 157–173, https://doi.org/10.1007/s10533-009-9399-4, 2010.
Billett, M. F., Deacon, C. M., Palmer, S. M., Dawson, J. J. C., and Hope, D.: Connecting organic carbon in stream water and soils in a peatland catchment, J. Geophys. Res.-Biogeo., 111, G02010, https://doi.org/10.1029/2005JG000065, 2006.
Billett, M. F., Dinsmore, K. J., Smart, R. P., Garnett, M. H., Holden, J., Chapman, P., Baird, A. J., Grayson, R., and Stott, A. W.: Variable source and age of different forms of carbon released from natural peatland pipes, J. Geophys. Res.-Biogeo., 117, G02003, https://doi.org/10.1029/2011JG001807, 2012.
Birkel, C., Broder, T., and Biester, H.: Nonlinear and threshold-dominated runoff generation controls DOC export in a small peat catchment, J. Geophys. Res.-Biogeo., 122, 498–513, https://doi.org/10.1002/2016JG003621, 2017.
Bishop, K., Seibert, J., Köhler, S., and Laudon, H.: Resolving the Double Paradox of rapidly mobilized old water with highly variable responses in runoff chemistry, Hydrol. Process., 18, 185–189, https://doi.org/10.1002/hyp.5209, 2004.
Blaurock, K., Beudert, B., Gilfedder, B. S., Fleckenstein, J. H., Peiffer, S., and Hopp, L.: Low hydrological connectivity after summer drought inhibits DOC export in a forested headwater catchment, Hydrol. Earth Syst. Sci., 25, 5133–5151, https://doi.org/10.5194/hess-25-5133-2021, 2021.
Buzek, F., Novak, M., Cejkova, B., Jackova, I., Curik, J., Veselovsky, F., Stepanova, M., Prechova, E., and Bohdalkova, L.: Assessing DOC export from a Sphagnum-dominated peatland using δ13C and δ18O–H2O stable isotopes, Hydrol. Process., 33, 2792–2803, https://doi.org/10.1002/hyp.13528, 2019.
Casas-Ruiz, J. P., Catalán, N., Gómez-Gener, L., von Schiller, D., Obrador, B., Kothawala, D. N., López, P., Sabater, S., and Marcé, R.: A tale of pipes and reactors: Controls on the in-stream dynamics of dissolved organic matter in rivers: Controls on in-stream DOM dynamics, Limnol. Oceanogr., 62, S85–S94, https://doi.org/10.1002/lno.10471, 2017.
Clark, J. M., Lane, S. N., Chapman, P. J., and Adamson, J. K.: Export of dissolved organic carbon from an upland peatland during storm events: Implications for flux estimates, J. Hydrol., 347, 438–447, https://doi.org/10.1016/j.jhydrol.2007.09.030, 2007.
Clark, J. M., Ashley, D., Wagner, M., Chapman, P. J., Lane, S. N., Evans, C. D., and Heathwaite, A. L.: Increased temperature sensitivity of net DOC production from ombrotrophic peat due to water table draw-down, Glob. Change Biol., 15, 794–807, https://doi.org/10.1111/j.1365-2486.2008.01683.x, 2009.
Cook, S., Whelan, M. J., Evans, C. D., Gauci, V., Peacock, M., Garnett, M. H., Kho, L. K., Teh, Y. A., and Page, S. E.: Fluvial organic carbon fluxes from oil palm plantations on tropical peatland, Biogeosciences, 15, 7435–7450, https://doi.org/10.5194/bg-15-7435-2018, 2018.
Dean, J. F., Garnett, M. H., Spyrakos, E., and Billett, M. F.: The Potential Hidden Age of Dissolved Organic Carbon Exported by Peatland Streams, J. Geophys. Res., 124, 328–341, https://doi.org/10.1029/ 2018JG004650, 2019.
de Oliveira, G., Bertone, E., Stewart, R., Awad, J., Holland, A., O’Halloran, K., and Bird, S.: Multi-Parameter Compensation Method for Accurate In Situ Fluorescent Dissolved Organic Matter Monitoring and Properties Characterization, Water, 10, 1146, https://doi.org/10.3390/w10091146, 2018.
Dick, J. J., Tetzlaff, D., Birkel, C., and Soulsby, C.: Modelling landscape controls on dissolved organic carbon sources and fluxes to streams, Biogeochemistry, 122, 361–374, https://doi.org/10.1007/s10533-014-0046-3, 2015.
Dinsmore, K. J., Billett, M. F., and Dyson, K. E.: Temperature and precipitation drive temporal variability in aquatic carbon and GHG concentrations and fluxes in a peatland catchment, Glob. Change Biol., 19, 2133–2148, https://doi.org/10.1111/gcb.12209, 2013.
Dubois, J. M. M.: Environments quaternaires et évolution postglaciaire d’une zone côtière en émersion en bordure sud du bouclier canadien: la moyennne Côte Nord du Saint-Laurent, Québec, University of Ottawa, Ottawa, https://doi.org/10.20381/ruor-15610, 1980.
Dyson, K. E., Billett, M. F., Dinsmore, K. J., Harvey, F., Thomson, A. M., Piirainen, S., and Kortelainen, P.: Release of aquatic carbon from two peatland catchments in E. Finland during the spring snowmelt period, Biogeochemistry, 103, 125–142, https://doi.org/10.1007/s10533-010-9452-3, 2011.
Freeman, C., Evans, C. D., Monteith, D. T., Reynolds, B., and Fenner, N.: Export of organic carbon from peat soils, Nature, 412, 785–785, https://doi.org/10.1038/35090628, 2001.
Frei, S., Lischeid, G., and Fleckenstein, J. H.: Effects of micro-topography on surface–subsurface exchange and runoff generation in a virtual riparian wetland — A modeling study, Adv. Water Resour., 33, 1388–1401, https://doi.org/10.1016/j.advwatres.2010.07.006, 2010.
Glatzel, S., Lemke, S., and Gerold, G.: Short-term effects of an exceptionally hot and dry summer on decomposition of surface peat in a restored temperate bog, Eur. J. Soil Biol., 42, 219–229, https://doi.org/10.1016/j.ejsobi.2006.03.003, 2006.
Godsey, S. E., Kirchner, J. W., and Clow, D. W.: Concentration-discharge relationships reflect chemostatic characteristics of US catchments, Hydrol. Process., 23, 1844–1864, https://doi.org/10.1002/hyp.7315, 2009.
Godsey, S. E., Hartmann, J., and Kirchner, J. W.: Catchment chemostasis revisited: Water quality responds differently to variations in weather and climate, Hydrol. Process., 33, 3056–3069, https://doi.org/10.1002/hyp.13554, 2019.
Grand-Clement, E., Luscombe, D. J., Anderson, K., Gatis, N., Benaud, P., and Brazier, R. E.: Antecedent conditions control carbon loss and downstream water quality from shallow, damaged peatlands, Sci. Total Environ., 493, 961–973, https://doi.org/10.1016/j.scitotenv.2014.06.091, 2014.
Guertin, D. P., Barten, P. K., and Brooks, K. N.: The Peatland Hydrologic Impact Model: Development and Testing, Hydrol. Res., 18, 79–100, https://doi.org/10.2166/nh.1987.0007, 1987.
Guilpart, E., Espanmanesh, V., Tilmant, A., and Anctil, F.: Combining split-sample testing and hidden Markov modelling to assess the robustness of hydrological models, Hydrol. Earth Syst. Sci., 25, 4611–4629, https://doi.org/10.5194/hess-25-4611-2021, 2021.
Harte, D.: Hidden Markov Models,1.8-13, https://www.statsresearch.co.nz/dsh/sslib/ (last access: 18 October 2023), 2021.
Holden, J. and Burt, T. P.: Runoff production in blanket peat covered catchments: BLANKET PEAT RUNOFF, Water Resour. Res., 39, 1191, https://doi.org/10.1029/2002WR001956, 2003.
Holden, J., Smart, R. P., Dinsmore, K. J., Baird, A. J., Billett, M. F., and Chapman, P. J.: Natural pipes in blanket peatlands: major point sources for the release of carbon to the aquatic system, Glob. Change Biol., 18, 3568–3580, https://doi.org/10.1111/gcb.12004, 2012.
Huotari, J., Nykänen, H., Forsius, M., and Arvola, L.: Effect of catchment characteristics on aquatic carbon export from a boreal catchment and its importance in regional carbon cycling, Glob. Change Biol., 19, 3607–3620, https://doi.org/10.1111/gcb.12333, 2013.
Inamdar, S. P., Christopher, S. F., and Mitchell, M. J.: Export mechanisms for dissolved organic carbon and nitrate during summer storm events in a glaciated forested catchment in New York, USA, Hydrol. Process., 18, 2651–2661, https://doi.org/10.1002/hyp.5572, 2004.
Jutebring Sterte, E., Lidman, F., Sjöberg, Y., Ploum, S. W., and Laudon, H.: Groundwater travel times predict DOC in streams and riparian soils across a heterogeneous boreal landscape, Sci. Total Environ., 849, 157398, https://doi.org/10.1016/j.scitotenv.2022.157398, 2022.
Juutinen, S., Väliranta, M., Kuutti, V., Laine, A. M., Virtanen, T., Seppä, H., Weckström, J., and Tuittila, E.-S.: Short-term and long-term carbon dynamics in a northern peatland-stream-lake continuum: A catchment approach, J. Geophys. Res.-Biogeo., 118, 171–183, https://doi.org/10.1002/jgrg.20028, 2013.
Kalbitz, K., Solinger, S., Park, J.-H., Michalzik, B., and Matzner, E.: CONTROLS ON THE DYNAMICS OF DISSOLVED ORGANIC MATTER IN SOILS: A REVIEW:, Soil Science, 165, 277–304, https://doi.org/10.1097/00010694-200004000-00001, 2000.
Kehagias, Ath.: A hidden Markov model segmentation procedure for hydrological and environmental time series, Stoch. Env. Res. Risk A., 18, 117–130, https://doi.org/10.1007/s00477-003-0145-5, 2004.
Koehler, A.-K., Murphy, K., Kiely, G., and Sottocornola, M.: Seasonal variation of DOC concentration and annual loss of DOC from an Atlantic blanket bog in South Western Ireland, Biogeochemistry, 95, 231–242, https://doi.org/10.1007/s10533-009-9333-9, 2009.
Köhler, S. J., Buffam, I., Laudon, H., and Bishop, K. H.: Climate's control of intra-annual and interannual variability of total organic carbon concentration and flux in two contrasting boreal landscape elements, J. Geophys. Res., 113, G03012, https://doi.org/10.1029/2007JG000629, 2008.
Laudon, H., Berggren, M., Ågren, A., Buffam, I., Bishop, K., Grabs, T., Jansson, M., and Köhler, S.: Patterns and Dynamics of Dissolved Organic Carbon (DOC) in Boreal Streams: The Role of Processes, Connectivity, and Scaling, Ecosystems, 14, 880–893, https://doi.org/10.1007/s10021-011-9452-8, 2011.
Laudon, H., Buttle, J., Carey, S. K., McDonnell, J., McGuire, K., Seibert, J., Shanley, J., Soulsby, C., and Tetzlaff, D.: Cross-regional prediction of long-term trajectory of stream water DOC response to climate change, Geophys. Res. Lett., 39, https://doi.org/10.1029/2012GL053033, 2012.
Leach, J. A., Larsson, A., Wallin, M. B., Nilsson, M. B., and Laudon, H.: Twelve year interannual and seasonal variability of stream carbon export from a boreal peatland catchment, J. Geophys. Res.-Biogeo., 121, 1851–1866, https://doi.org/10.1002/2016JG003357, 2016.
Lloyd, C. E. M., Freer, J. E., Johnes, P. J., and Collins, A. L.: Technical Note: Testing an improved index for analysing storm discharge–concentration hysteresis, Hydrol. Earth Syst. Sci., 20, 625–632, https://doi.org/10.5194/hess-20-625-2016, 2016.
Nilsson, M., Sagerfors, J., Buffam, I., Laudon, H., Eriksson, T., Grelle, A., Klemedtsson, L., Weslien, P., and Lindroth, A.: Contemporary carbon accumulation in a boreal oligotrophic minerogenic mire – a significant sink after accounting for all C-fluxes, Glob. Change Biol., 14, 2317–2332, https://doi.org/10.1111/j.1365-2486.2008.01654.x, 2008.
Olefeldt, D., Roulet, N., Giesler, R., and Persson, A.: Total waterborne carbon export and DOC composition from ten nested subarctic peatland catchments-importance of peatland cover, groundwater influence, and inter-annual variability of precipitation patterns, Hydrol. Process., 27, 2280–2294, https://doi.org/10.1002/hyp.9358, 2013.
Payette, S.: Le contexte physique et biogéographique, in: Écologie des tourbières du Québec-Labrador, Presses de l’Université Laval, Québec, 9–37, ISBN 9782763777733, 2001.
Pellerin, B. A., Saraceno, J. F., Shanley, J. B., Sebestyen, S. D., Aiken, G. R., Wollheim, W. M., and Bergamaschi, B. A.: Taking the pulse of snowmelt: in situ sensors reveal seasonal, event and diurnal patterns of nitrate and dissolved organic matter variability in an upland forest stream, Biogeochemistry, 108, 183–198, https://doi.org/10.1007/s10533-011-9589-8, 2012.
Prijac, A.: High-frequency monitoring of dissolved organic carbon exports, stream discharge and water table depth in a peatland-dominated boreal catchment, Minganie, Quebec, Canada, PANGAEA, https://doi.pangaea.de/10.1594/PANGAEA.959045, 2023.
Prijac, A., Gandois, L., Jeanneau, L., Taillardat, P., and Garneau, M.: Dissolved organic matter concentration and composition discontinuity at the peat–pool interface in a boreal peatland, Biogeosciences, 19, 4571–4588, https://doi.org/10.5194/bg-19-4571-2022, 2022.
Primeau, G. and Garneau, M.: Carbon accumulation in peatlands along a boreal to subarctic transect in eastern Canada, Holocene, 31, 858–869, https://doi.org/10.1177/0959683620988031, 2021.
Rasilo, T., Hutchins, R. H. S., Ruiz-González, C., and del Giorgio, P. A.: Transport and transformation of soil-derived CO2, CH4 and DOC sustain CO2 supersaturation in small boreal streams, Sci. Total Environ., 579, 902–912, https://doi.org/10.1016/j.scitotenv.2016.10.187, 2017.
Raymond, P. A. and Saiers, J. E.: Event controlled DOC export from forested watersheds, Biogeochemistry, 100, 197–209, https://doi.org/10.1007/s10533-010-9416-7, 2010.
Raymond, P. A., Saiers, J. E., and Sobczak, W. V.: Hydrological and biogeochemical controls on watershed dissolved organic matter transport: pulse-shunt concept, Ecology, 97, 5–16, https://doi.org/10.1890/14-1684.1, 2016.
Riahi, K.: Analyse du bilan hydrologique d'une tourbière ombrotrophe située dans le bassin versant de la rivière Romaine, Côte-Nord, Québec, Maîtrise en Sciences de la Terre, Université du Québec, Institut National de la Recherche Scientifique, Québec, 83 pp., https://espace.inrs.ca/id/eprint/12054 (last access: 18 October 2023), 2021.
Rosset, T., Gandois, L., Le Roux, G., Teisserenc, R., Durantez Jimenez, P., Camboulive, T., and Binet, S.: Peatland Contribution to Stream Organic Carbon Exports From a Montane Watershed, J. Geophys. Res.-Biogeo., 124, 3448–3464, https://doi.org/10.1029/2019JG005142, 2019.
Rosset, T., Binet, S., Antoine, J.-M., Lerigoleur, E., Rigal, F., and Gandois, L.: Drivers of seasonal- and event-scale DOC dynamics at the outlet of mountainous peatlands revealed by high-frequency monitoring, Biogeosciences, 17, 3705–3722, https://doi.org/10.5194/bg-17-3705-2020, 2020.
Rosset, T., Binet, S., Rigal, F., and Gandois, L.: Peatland Dissolved Organic Carbon Export to Surface Waters: Global Significance and Effects of Anthropogenic Disturbance, Geophys. Res. Lett., 49, e2021GL096616, https://doi.org/10.1029/2021GL096616, 2022.
Roulet, N. T., Lafleur, P. M., Richard, P. J. H., Moore, T. R., Humphreys, E. R., and Bubier, J.: Contemporary carbon balance and late Holocene carbon accumulation in a northern peatland, Glob. Change Biol., 13, 397–411, https://doi.org/10.1111/j.1365-2486.2006.01292.x, 2007.
Shein, J.: Discharge characteristics of triangular-notch thin-plate weirs, U.S. Geological Survey, Washington, DC, https://doi.org/10.3133/wsp1617B, 1979.
Strohmeier, S., Knorr, K.-H., Reichert, M., Frei, S., Fleckenstein, J. H., Peiffer, S., and Matzner, E.: Concentrations and fluxes of dissolved organic carbon in runoff from a forested catchment: insights from high frequency measurements, Biogeosciences, 10, 905–916, https://doi.org/10.5194/bg-10-905-2013, 2013.
Taillardat, P., Bodmer, P., Deblois, C. P., Ponçot, A., Prijac, A., Riahi, K., Gandois, L., del Giorgio, P. A., Bourgault, M. A., Tremblay, A., and Garneau, M.: Carbon Dioxide and Methane Dynamics in a Peatland Headwater Stream: Origins, Processes and Implications, J. Geophys. Res.-Biogeo., 127, e2022JG006855, https://doi.org/10.1029/2022JG006855, 2022.
Tipping, E., Billett, M. F., Bryant, C. L., Buckingham, S., and Thacker, S. A.: Sources and ages of dissolved organic matter in peatland streams: evidence from chemistry mixture modelling and radiocarbon data, Biogeochemistry, 100, 121–137, https://doi.org/10.1007/s10533-010-9409-6, 2010.
Tiwari, T., Sponseller, R. A., and Laudon, H.: Extreme Climate Effects on Dissolved Organic Carbon Concentrations During Snowmelt, J. Geophys. Res.-Biogeo., 123, 1277–1288, https://doi.org/10.1002/2017JG004272, 2018.
Tunaley, C., Tetzlaff, D., Lessels, J., and Soulsby, C.: Linking high-frequency DOC dynamics to the age of connected water sources, Water Resour. Res., 52, 5232–5247, https://doi.org/10.1002/2015WR018419, 2016.
Tunaley, C., Tetzlaff, D., and Soulsby, C.: Scaling effects of riparian peatlands on stable isotopes in runoff and DOC mobilisation, J. Hydrol., 549, 220–235, https://doi.org/10.1016/j.jhydrol.2017.03.056, 2017.
Vaughan, M. C. H., Bowden, W. B., Shanley, J. B., Vermilyea, A., Sleeper, R., Gold, A. J., Pradhanang, S. M., Inamdar, S. P., Levia, D. F., Andres, A. S., Birgand, F., and Schroth, A. W.: High-frequency dissolved organic carbon and nitrate measurements reveal differences in storm hysteresis and loading in relation to land cover and seasonality, Water Resour. Res., 53, 5345–5363, https://doi.org/10.1002/2017WR020491, 2017.
Visser, I. and Speekenbrink, M.: depmixS4: An R Package for Hidden Markov Models, J. Stat. Softw., 36, https://doi.org/10.18637/jss.v036.i07, 2010.
Wallin, M. B., Grabs, T., Buffam, I., Laudon, H., Ågren, A., Öquist, M. G., and Bishop, K.: Evasion of CO2 from streams - The dominant component of the carbon export through the aquatic conduit in a boreal landscape, Glob. Change Biol., 19, 785–797, https://doi.org/10.1111/gcb.12083, 2013.
Webb, J. R., Santos, I. R., Maher, D. T., and Finlay, K.: The Importance of Aquatic Carbon Fluxes in Net Ecosystem Carbon Budgets: A Catchment-Scale Review, Ecosystems, 22, 508–527, https://doi.org/10.1007/s10021-018-0284-7, 2019.
Wickham, H.: ggplot2 Elegant Graphics for Data Analysis, Second Edition, Springer International Publishing, XVI, 260 pp., https://doi.org/10.1007/978-3-319-24277-4, 2016.
Worrall, F., Burt, T. P., Jaeban, R. Y., Warburton, J., and Shedden, R.: Release of dissolved organic carbon from upland peat, Hydrol. Process., 16, 3487–3504, https://doi.org/10.1002/hyp.1111, 2002.
Worrall, F., Gibson, H. S., and Burt, T. P.: Production vs. solubility in controlling runoff of DOC from peat soils – The use of an event analysis, J. Hydrol., 358, 84–95, https://doi.org/10.1016/j.jhydrol.2008.05.037, 2008.
Worrall, F., Burt, T. P., Rowson, J. G., Warburton, J., and Adamson, J. K.: The multi-annual carbon budget of a peat-covered catchment, Sci. Total Environ., 407, 4084–4094, https://doi.org/10.1016/j.scitotenv.2009.03.008, 2009.
Zarnetske, J. P., Bouda, M., Abbott, B. W., Saiers, J., and Raymond, P. A.: Generality of Hydrologic Transport Limitation of Watershed Organic Carbon Flux Across Ecoregions of the United States, Geophys. Res. Lett., 45, https://doi.org/10.1029/2018GL080005, 2018.
Zhu, X., Chen, L., Pumpanen, J., Ojala, A., Zobitz, J., Zhou, X., Laudon, H., Palviainen, M., Neitola, K., and Berninger, F.: The role of terrestrial productivity and hydrology in regulating aquatic dissolved organic carbon concentrations in boreal catchments, Glob. Change Biol., 28, 2764–2778, https://doi.org/10.1111/gcb.16094, 2022.