the Creative Commons Attribution 4.0 License.
the Creative Commons Attribution 4.0 License.
 | 09 Oct 2023
Modelling the regional sensitivity of snowmelt, soil moisture, and streamflow generation to climate over the Canadian Prairies using a basin classification approach
Kevin Shook
Christopher Spence
John W. Pomeroy
Colin Whitfield
This study evaluated the effects of climate perturbations on snowmelt, soil moisture, and streamflow generation in small Canadian Prairies basins using a modelling approach based on classification of basin biophysical characteristics. Seven basin classes that encompass the entirety of the Prairies Ecozone in Canada were determined by cluster analysis of these characteristics. Individual semi-distributed virtual basin (VB) models representing these classes were parameterized in the Cold Regions Hydrological Model (CRHM) platform, which includes modules for snowmelt and sublimation, soil freezing and thawing, actual evapotranspiration (ET), soil moisture dynamics, groundwater recharge, and depressional storage dynamics including fill and spill runoff generation and variable connected areas. Precipitation (P) and temperature (T) perturbation scenarios covering the range of climate model predictions for the 21st century were used to evaluate climate sensitivity of hydrological processes in individual land cover and basin types across the Prairies Ecozone. Results indicated that snow accumulation in wetlands had a greater sensitivity to P and T than that in croplands and grasslands in all basin types. Wetland soil moisture was also more sensitive to T than the cropland and grassland soil moisture. Jointly influenced by land cover distribution and local climate, basin-average snow accumulation was more sensitive to T in the drier and grassland-characterized basins than in the wetter basins dominated by cropland, whilst basin-average soil moisture was most sensitive to T and P perturbations in basins typified by pothole depressions and broad river valleys. Annual streamflow had the greatest sensitivities to T and P in the dry and poorly connected Interior Grasslands (See Fig. 1) basins but the smallest in the wet and well-connected Southern Manitoba basins. The ability of P to compensate for warming-induced reductions in snow accumulation and streamflow was much higher in the wetter and cropland-dominated basins than in the drier and grassland-characterized basins, whilst decreases in cropland soil moisture induced by the maximum expected warming of 6 ∘C could be fully offset by a P increase of 11 % in all basins. These results can be used to (1) identify locations which had the largest hydrological sensitivities to changing climate and (2) diagnose underlying processes responsible for hydrological responses to expected climate change. Variations of hydrological sensitivity in land cover and basin types suggest that different water management and adaptation methods are needed to address enhanced water stress due to expected climate change in different regions of the Prairies Ecozone.
- Article
(2019 KB) - Full-text XML
- BibTeX
- EndNote


The Canadian Prairies Ecozone occupies approximately 450 000 km2 from Alberta in the west to Manitoba in the east (Fig. 1). This agricultural region features a semi-arid to sub-humid, cold, continental climate with a long-term mean annual precipitation of less than 500 mm, approximately one-third of which is snowfall (Shahabul Alam and Elshorbagy, 2015). The prairies in their natural state were extensively covered by grasslands and topographic depressions filled with wetlands. Now they are the most extensive agricultural land base in Canada, whilst providing crucial habitat for waterfowl and other wetland- and grassland-associated animals (Anteau et al., 2016; Zhang et al., 2021). Spring snowmelt is the major water source of runoff in the prairies, and the extensive depressions play important roles in storing, evaporating, and transporting snow and surface runoff (Pomeroy et al., 2022; Fang and Pomeroy, 2009; Costa et al., 2020; Unduche et al., 2018). Prairie hydrological states can vary widely from drought to deluge (Johnson et al., 2005). Evaluating the sensitivity of prairie hydrology to climate perturbation can help inform adaptation of water management to future climate changes.
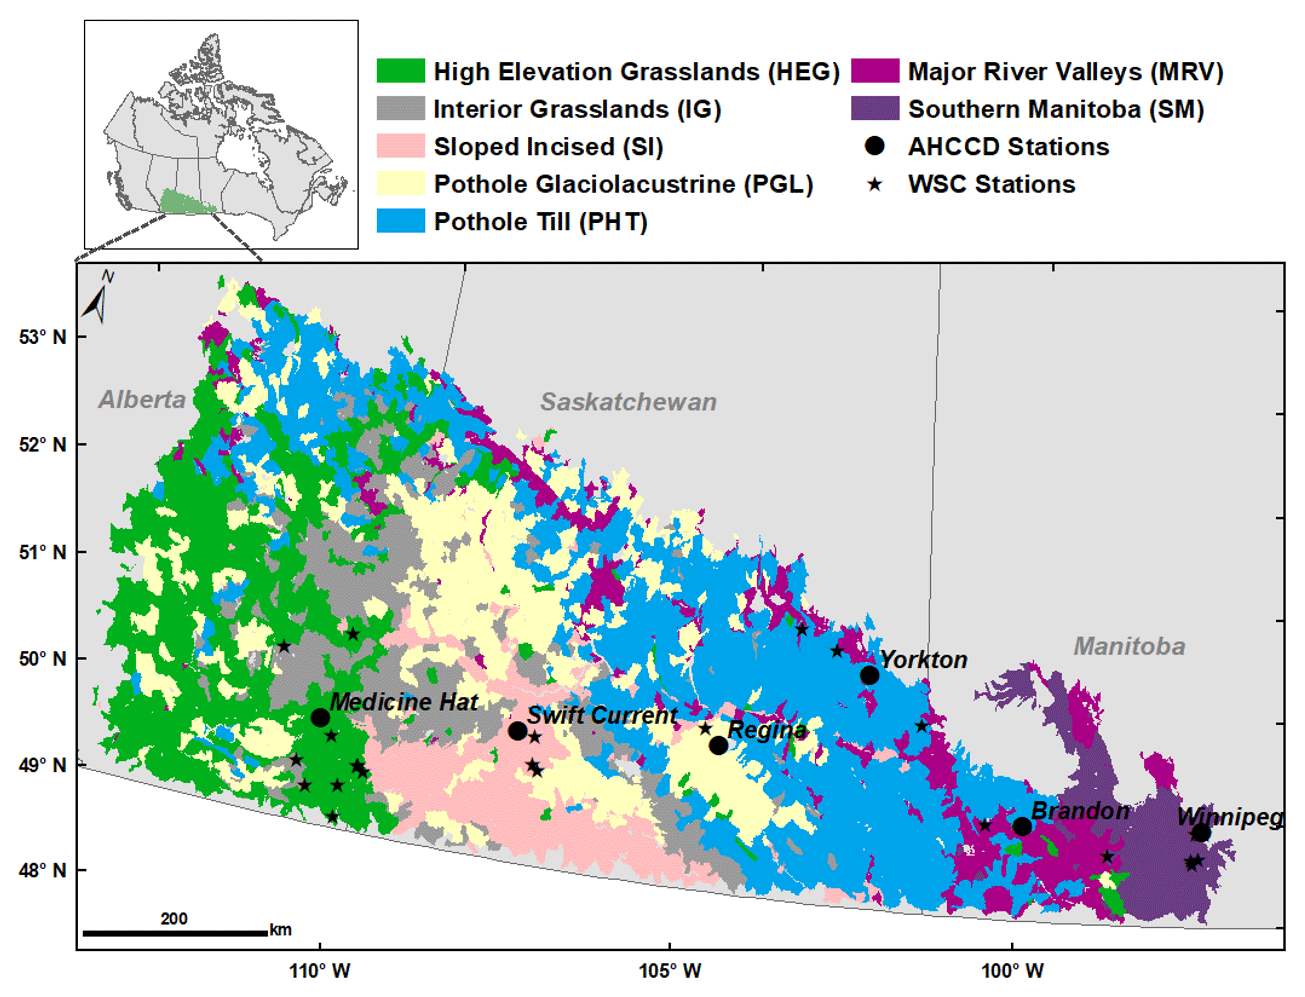
Figure 1Map of the Prairies Ecozone study area in the south-central part of western Canada (inset) with basin classes and locations of adjusted homogenized climate change data (AHCCD) meteorological stations and Water Survey of Canada (WSC) streamflow stations. Note that areas in light grey are excluded from the analysis (due to large water bodies, urban coverage of the basin, or not being entirely within the study domain).
The Canadian Prairies are projected to experience relatively rapid climate change in the 21st century. Air temperatures are projected to increase substantively during the next few decades. For example, mean annual temperature is predicted to increase by 1.0 to 6.0 ∘C in most of the prairies by 2100, compared to 1986–2005 (Bush and Lemmen, 2019). Similarly, results from regional climate models (RCMs) indicate that mean annual temperatures in the Prairie Pothole Region will increase by 1.8 to 4 ∘C by the end of this century (Withey and van Kooten, 2011). However, projections of future precipitation are much less certain. Johnson et al. (2005) reported that changes in prairie precipitation in the 21st century could decrease by 20 % in some areas and increase by 20 % in others, whilst Bush and Lemmen (2019) predicted that mean annual precipitation will rise by up to 25 % in the western prairies but decrease by 0.2 % in the southern prairies (with differing seasonal responses), compared to 1986–2005. Jiang et al. (2017) projected that seasonal precipitation in Alberta will change from −25 % to +36 % by the end of 21st century, compared to 1961–1990. Uncertainty in the projected precipitation is attributed to the mismatch between the coarse resolutions of general circulation models (GCMs) or RCMs and the scale of convective precipitation generation in the prairies (Zhang et al., 2011), which is not always well parameterized in climate models (Zhang et al., 2021). The large uncertainty in climate model projections can restrict their practical application for predicting future hydrology in the prairies. An alternative method is to add changes to baseline temperature and precipitation conditions informed by ensembles of GCM and RCM projections to represent the range of uncertainty in the projections. This delta method has proven useful to assess hydrological sensitivity to climate perturbations in the Canadian Prairies and nearby regions (Rasouli et al., 2019). Particularly, Kienzle et al. (2012) perturbed 30-year baseline precipitation and temperature observations to represent future climate conditions and provide insights into the responses of seasonal streamflow regimes in the Cline River basin, Alberta. MacDonald et al. (2012) used the delta method to shift baseline climate to represent monthly perturbations in precipitation and temperature and showed the sensitivity of snowpack to climate changes in the North Saskatchewan River basin. However, these sensitivity analyses were limited to small basins or portions of the prairies (e.g., Spence et al., 2022a). Comparison of the hydrological sensitivity to climate change across the entire Canadian Prairies region has not yet been rigorously conducted.
Hydrological models can be effective tools for quantifying the hydrological impacts of climate change. However, complex hydrography such as in the Prairie Pothole Region makes hydrological modelling in prairie basins a highly challenging task (Gray, 1970; Fang et al., 2010; Unduche et al., 2018). First, snowmelt and rainfall runoff may not necessarily contribute flow to the basin outlet, as wetlands store surface runoff until their storage capacity is exhausted. As extra runoff only spills and flows to the basin outlet once no storage capacity remains, the uplands only connect to the channel when downstream wetlands are filled (Shaw et al., 2012; Shook et al., 2015). The fill–spill runoff of wetlands and the intermittent surface hydrological connection within prairie basins specifically are poorly represented in many hydrological models, as those models typically do not simulate the physics of depressional storage (Muhammad et al., 2019). Second, blowing snow and frozen soil infiltration strongly affect the generation of snowmelt runoff in spring (Pomeroy et al., 1998). Snow is redistributed directly into prairie depressions from surrounding agricultural fields (Pomeroy et al., 1993; Fang and Pomeroy, 2009). Infiltration of snowmelt into frozen soil is complicated by multiple factors including snowpack accumulation, initial soil moisture, and soil thermal properties (Gray et al., 2001). Physical representation of thermal dynamics of frozen soil in a hydrological model is a prerequisite for successful simulation of snowmelt runoff in the prairies (Pomeroy et al., 2007, 2022). Third, the typical sparse observations of hydro-meteorological data in the prairies restrict opportunities to calibrate empirical hydrological models using streamflow (St-Jacques et al., 2018). Streamflow records in the prairie basins are typically intermittent and characterized by long periods of zero flow (Whitfield et al., 2020), with many stream gauge stations operated seasonally. The gauging network is extremely sparse and is considered to be insufficiently gauged for regionalization of runoff (Samuel et al., 2013). As streamflow in the region is dominated by spring snowmelt runoff, any calibration from streamflow may bias parameters to certain hydrological processes and seasons. Records of streamflow in the prairies are therefore not necessarily useful for parameter calibration. The complex hydrology of the prairies highlights the need for physically based hydrological modelling approaches where parameters for calculation of snow redistribution, snowmelt runoff, soil moisture, depressional storage, and streamflow can be estimated based on basin hydrography and biophysical properties.
Building physically based hydrological models over the entire Prairies Ecozone is nonetheless challenging due to dynamic contributing areas caused by geographically isolated wetlands (Pomeroy et al., 2014; Unduche et al., 2018) resulting in poorly defined drainage basins (Pomeroy et al., 2010). Virtual basin (VB) modelling using hydrological response units (HRUs) to represent the typical land cover and hydrographic land types in the prairies (Armstrong et al., 2015), boreal forest (He and Pomeroy, 2023), and alpine basins (López-Moreno et al., 2020) has been successfully used to examine the spatial variability of evapotranspiration (ET), hydrological sensitivity to climate change, and the role of snow in governing hydrology, for example. Moreover, VB modelling informed by basin classification (Wolfe et al., 2019) has been successfully applied for assessing streamflow sensitivity to climate perturbation in the western part of the prairies (Spence et al., 2022a). The current study applies this hydrological modelling approach over the entire Canadian Prairies with the aims of (1) assessing and comparing hydrological sensitivity to climate by evaluating how snow, soil moisture, and runoff processes in different land cover types respond; (2) quantifying and comparing the hydrological sensitivity to climate in seven different basin types across the prairies; and (3) assessing the degree to which precipitation increases can compensate for the hydrological impacts of warming on prairie hydrological processes.
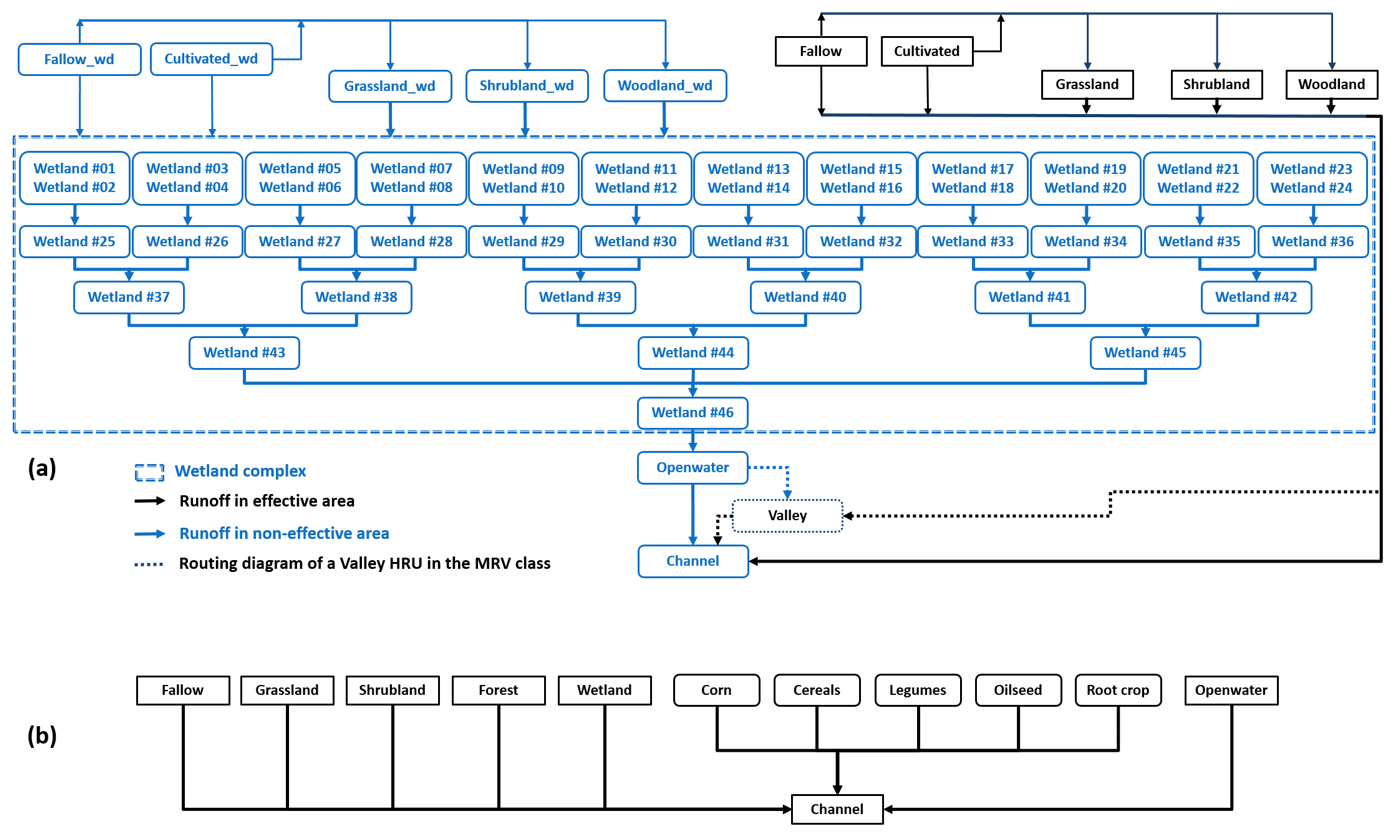
Figure 2Routing orders of HRUs in the seven VB models created using the Cold Regions Hydrological Model (CRHM). (a) VB models of HEG, IG, PHT, PGL, SI, and MRV are shown, where dashed arrows indicate the location of the valley HRU in MRV basins; and (b) VB model of SM. The “_wd” notation is for the upland fraction that is in the wetland catena.
The Canadian Prairies region is in the south-central part of western Canada (49–54∘ N, 90–115∘ W; Fig. 1), extending around 0.45×10⁶ km2 across the provinces of Alberta, Saskatchewan, and Manitoba. Mean annual precipitation in the prairies increases from west to east (Johnson and Poiani, 2016; Wolfe et al., 2019), from 300 to 610 mm (1970–2000). Mean annual air temperature over the prairies ranges from 1 to 6 ∘C. The long and cold winter results in 30 % of annual precipitation falling as snow. Landscapes in the prairies are, in general, flat, with millions of small wetland depressions embedded within grassland and annual cropping lands (abbreviated as cropland hereafter). Wolfe et al. (2019) classified approximately 4200 headwater basins of, on average, ∼100 km2 across the Canadian Prairies into seven biophysical basin classes. Here, a slightly different classification from Wolfe et al. (2019) is used. This one does not include climate variables in the basin classification but features the same seven classes (Fig. 1), and it is identical to the one described by Spence et al. (2022a). Cropland is the main land-use type in all seven classes, accounting for 40 %–65 %. Pothole Till (PHT) is the largest class by area (120 881 km2), 65 % of which is covered by cropland. The other class dominated by cropland (64 %) is Pothole Glaciolacustrine (PGL), which spans 77 844 km2. The classes of High Elevation Grasslands (HEG), Interior Grasslands (IG), and Sloped Incised (SI) are characterized by high grassland fractions of 37 %–49 %. HEG is the largest grassland-characterized class (79 667 km2). The Major River Valleys (MRV) class (21 149 km2) is characterized by distinct valleys which cover 17 % of the class area, and the Southern Manitoba (SM) class is the class with the highly drained wetlands and the most extensive cropland (34 533 km2). Average depression coverage, associated with wetlands, ranges from 4 % to 28 % across the seven classes, with the largest coverage in PHT and PGL and the smallest coverage in IG. More details on the classification are provided by Wolfe et al. (2019).
3.1 Virtual basin (VB) modelling
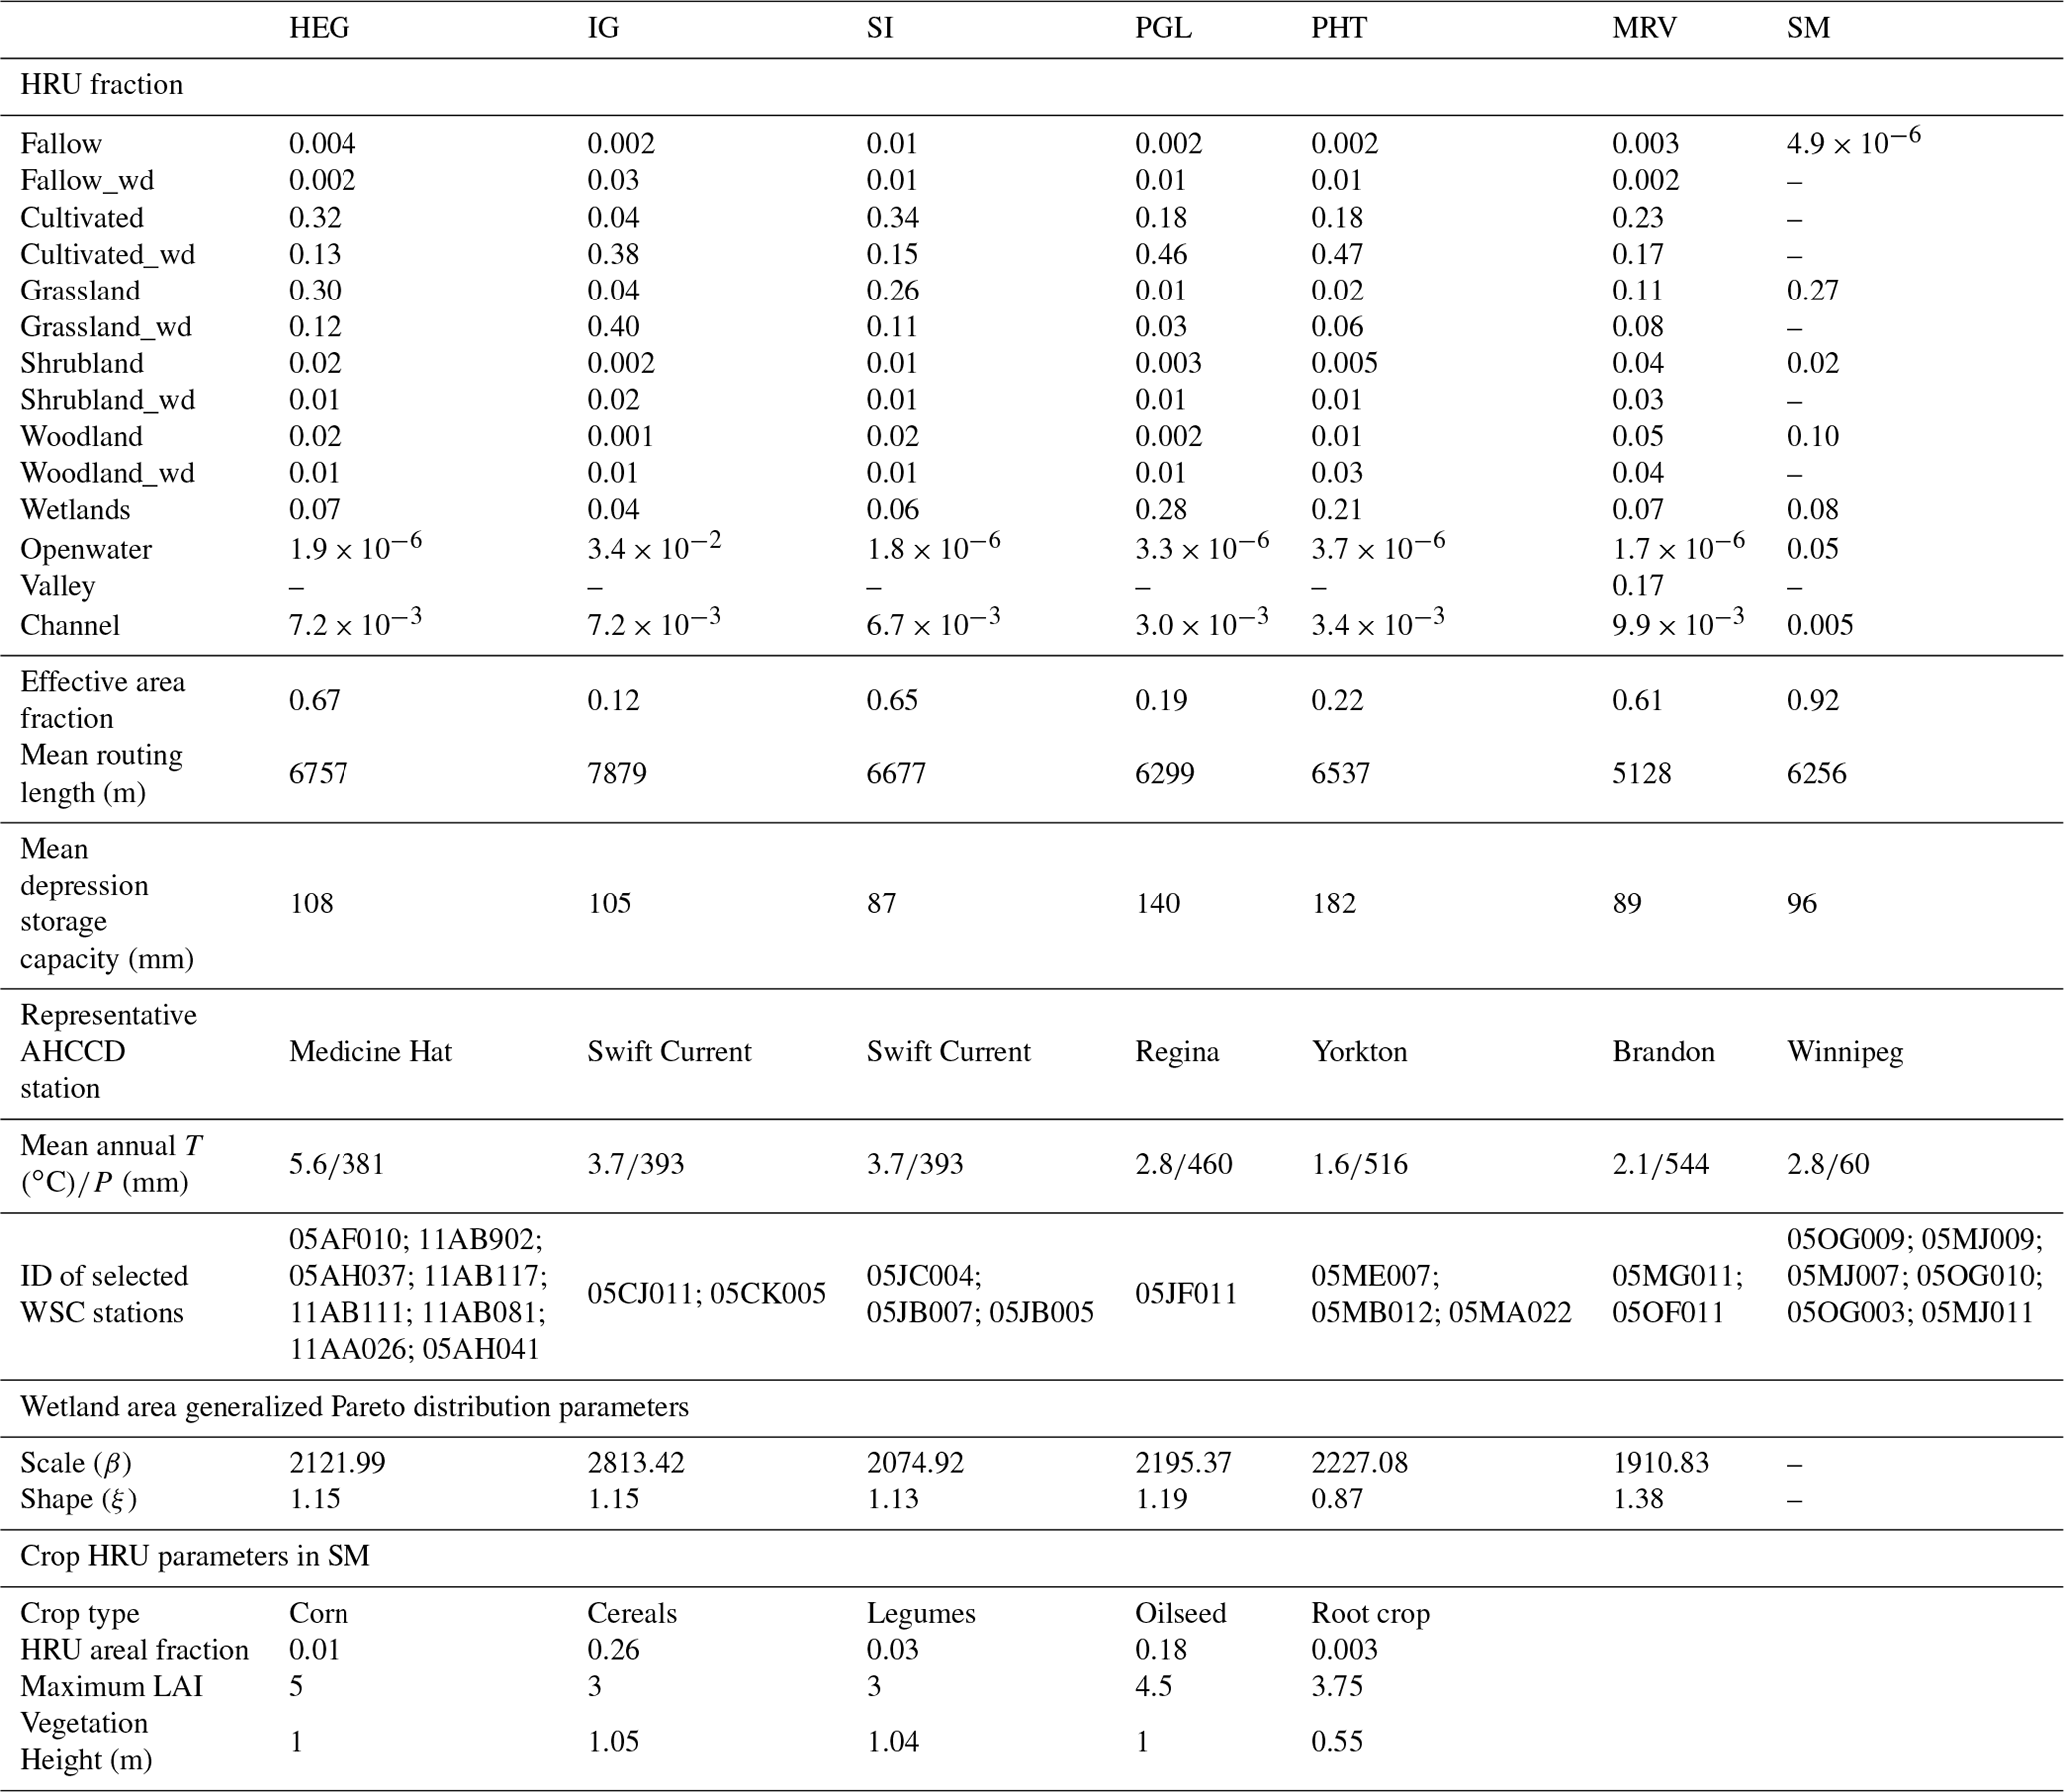
To set up hydrological models in the Cold Regions Hydrological Model (CRHM) parsimoniously, the VBs were assigned an area of 100 km2, in accordance with the average area of the 4175 prairie basins classified by Wolfe et al. (2019). Each VB consists of five upland land covers of fallow fields, cultivated fields, grasslands, shrublands, woodlands, and three downstream land types of depressions filled with wetlands, “openwater” bodies, and stream channels that were used to define HRUs (Spence et al., 2022a, b, Table 1, Fig. 2). The HRU areal fractions were derived from the results of the basin classification. Summer fallowing is a declining agricultural practice in the prairies, which is demonstrated by the small areal fraction of fallow in all of the basin types (Table 1). In each VB except SM, the five upland land covers were divided into two portions based on the average effective drainage area of the class. The effective part contributes runoff directly to the channel, while the non-effective part routes runoff through a stylized wetland depression complex as shown by HRUs with a suffix of “_wd” in Fig. 2a and Table 1. This was not done for SM, owing to widespread historical drainage of wetlands in this part of the prairie, with remaining wetlands typically highly modified and lying adjacent to drainage ditches. The depression complex was characterized using 46 “wetland” HRUs (Fig. 2a, except SM), with every two upper wetlands contributing to one downstream wetland (Pomeroy et al., 2014). Runoff from the depression complex was routed to the bottom openwater HRU and then to the channel HRU. Areas of the 46 “wetland” HRUs were estimated by generalized Pareto distributions using parameters (i.e., β and ξ in Table 1) estimated in Wolfe et al. (2019) for the individual basin classes (Shook et al., 2013).
Table 1HRU fractions for the VB models created by CRHM. The “_wd” notation refers to the fraction that is in the wetland catena. The long-term (1960–2006) mean air temperature and mean annual precipitation are observed at AHCCD stations. Basin-average effective areal fraction, routing length, depressional storage capacity, parameters for deriving the wetland distribution, and crop types in the SM VB, as well as IDs of available WSC stations for model evaluation, are provided.
For MRV, a unique valley HRU was inserted between the openwater HRU and channel (see dashed lines in the bottom of Fig. 2a). Runoff from the effective part was routed to the valley first and then to the channel HRU, whilst runoff from the depression complex flowed into the openwater HRU first and then to the valley and to the channel. This HRU represented the incised alluvial valley that is a distinct feature of this basin class. In the SM basins, where warmer and wetter conditions allow for a broader diversity of agricultural crops that require specific parameterization, wetlands are typically connected to the channel, much of which has been straightened via ditching. As such, the VB model representing these basins was composed of 12 HRUs (one representing a wetland) with five distinctive crop HRUs (Fig. 2b; Table 1), in which vegetated HRUs are connected to the channel HRU directly. Fractions of HRUs representing different land covers were determined as described above, with fractions of each crop HRU derived from statistical analysis of land covers in two well-researched basins: South Tobacco Creek (Mahmood et al., 2017) and the La Salle River (Cordeiro et al., 2017) in Manitoba's Red River valley.
3.2 Cold Regions Hydrological Model (CRHM) and model parameterization
The CRHM platform is an object-oriented modelling system with modules representing a wide range of hydrological processes (Pomeroy et al., 2007, 2022). Models created with CRHM have proven successful for simulating streamflow in Canadian Prairies basins (Pomeroy et al., 2007, 2010, 2012, 2014; Fang et al., 2010; Mahmood et al., 2017; Cordeiro et al., 2017, 2022) and also in the US northern Great Plains (Van Hoy et al., 2020). CRHM is strongly physically based and requires no parameter calibration, and so it is highly suitable for the VB modelling approach because the VB does not refer to a specific gauged location that can be used for calibration (Pomeroy et al., 2013; Spence et al., 2022a). A suite of modules was chosen to build and run the prairie VB models in CRHM. The primary modules used were (see more details on modules in Pomeroy et al., 2010): an observation input module to read the meteorological forcing of air temperature, wind speed, relative humidity, and precipitation data; a prairie blowing snow module to simulate the blowing snow redistribution and sublimation in the winter based on vegetation height, topography, and wind speed; an energy-budget snowmelt module to estimate snowmelt in spring according to the net balance between radiation and conductive and convective heat fluxes; a soil module to represent soil moisture dynamics, infiltration of snowmelt and rain as well as Hortonian and Dunnian runoff generation, thawing and freezing of soil water, and the filling and spilling of wetland depression storage (Leibowitz and Vining, 2003); an ET module to simulate actual evaporation from unsaturated surfaces using Granger and Gray's (1990) combination method ET algorithm; Priestley and Taylor's energy-advection evaporation formula for saturated surfaces and openwater bodies; and a routing module using a Muskingum approach to route runoff from HRUs to the basin outlet stream.
The strong physical basis of the CRHM modules allows for the parameters to be estimated from field studies described in the literature using the deduction–induction–abduction approach (Pomeroy et al., 2013). For each HRU in the VBs, parameters of vegetation height and leaf area index (LAI) were set to represent the holding capacity of snow accumulation and canopy interception in winter. The vegetation height for grassland and shrubland were set as 0.4 and 1.5 m, respectively, adopting from Spence et al. (2022a, b). Heights of crops range from 0.55 to 1.05 m depending on the crop types (Table 1). The maximum LAI values for grassland and shrubland were set as 3 and 5 (Spence et al., 2022b), and crop LAI in the SM VB ranged from 3 to 5. In addition, a depressional storage capacity was defined to govern the storage and release of water in the wetland complex (Table 1). Storage capacities of wetlands were estimated based on wetland HRU areas, using logarithmic or linear regression relations derived from lidar-measured DEM data (Pomeroy et al., 2014). Soil properties in the HRUs were assumed to be loam as this was the most common soil type for all basin classes in Wolfe et al. (2019). Routing distances across each HRU to its downstream HRUs were estimated by a modified Hack's law length–area relationship that was derived from Smith Creek Research Basin in Saskatchewan by Fang et al. (2010) (Table 1).
3.3 Model application
Historical (1960–2006) meteorological measurements from the Adjusted Homogenized Climate Change Data (AHCCD; Mekis and Vincent, 2011) served as the baseline climate to force the CRHM-based VB models (Fig. 1). To reduce the impact of initial conditions, the input of the first 5 years was used to spin-up the model running. This dataset is operated and continuously maintained by Environment and Climate Change Canada's Meteorological Service of Canada. Meteorological inputs include hourly observations of wind speed, relative humidity, surface air temperature, and daily measurement of precipitation, which was corrected for wind-undercatch of snowfall in gauges. To reduce the computational effort, only one representative AHCCD station was chosen to force each class VB model, selected based on the proximity between the class centroid and the station location (Table 1). Based on the long-term mean annual precipitation at representative AHCCD stations and the areal fractions of grassland and cropland HRUs, the seven basin types were divided into two groups: (1) the first is a dry and grassland-characterized type including HEG, IG, and SI; (2) the second is a wet and cropland-dominated type for PGL, PHT, MRV, and SM.
Daily streamflow measurements from Water Survey of Canada (WSC) stations that are close to the representative AHCCD stations and gauge a basin which is >90 % in the associated class (see stars in Fig. 1 and IDs in Table 1) were selected for the VB model evaluation phase. As daily streamflows in the prairies are often zero, except during and following spring snowmelt, model performance was evaluated according to gauged annual and monthly streamflow for representative gauges. Snow depth measurements on cropland taken in the South Tobacco Creek Research Basin by the Watershed Evaluation of Beneficial Management Practices (WEBs) Project of Agriculture and Agri-Food Canada (e.g., Mahmood et al., 2017) were used to evaluate the model's ability to simulate snow accumulation in the SM class. Performance of the PHT VB model has proven acceptable in simulating the inter-annual variability of depressional storage (Spence et al., 2022b). Model performance was primarily assessed by graphical assessment which includes comparing simulated and observed data using various plots and visual representations for the agreement of broad range of values at gauge sites, because traditional approaches for model assessment for basin-specific model applications to instrumented basins are not appropriate here as the virtual basin does not directly align with any specific real-world basin. For qualitative reference, we employed a simple metric of mass bias (MB) between the simulated and observed streamflow for performance evaluation (Eq. 1).
where s and o are the simulated and observed annual streamflow, respectively.
3.4 Climate perturbation scenarios
To represent the potential future temperature (T) changes over the prairies, seven T input scenarios were used to force the CRHM-based VB models to reflect predictions from an ensemble of climate models for the 21st century. This included a baseline scenario using historical T observations from the representative AHCCD stations and six perturbation scenarios with warming from 1 to 6 ∘C with an increment of 1 ∘C. Five precipitation (P) input scenarios were used to represent potential future changes in P as reported by Bush and Lemmen (2019) and Johnson et al. (2005): a baseline scenario using historical P observations from the representative AHCCD stations; a drier scenario assuming that the P will decrease by up to 20 % of the baseline observation; and three wetter scenarios with P increasing by 10 %, 20 %, and 30 %, respectively. To examine the synergistic impacts of combined P and T perturbations on VB outputs, the five P scenarios were combined with the seven T scenarios, resulting in 35 climate input scenarios.
3.5 Sensitivity analysis
The hydrological variables assessed include annual peak snow water equivalent (SWE), annual snowmelt runoff, winter snow sublimation and spring snowmelt infiltration, growing-season soil moisture (θ) in the shallow soil (recharge) layer and in the lower soil (deep-root) layer, annual and monthly streamflow (Q) at the basin outlet, annual ET, annual maximum connected areal fraction (CA), and mean daily depressional storage (SD). These variables were evaluated at the basin scale, whilst snow processes and soil moisture were further assessed for cropland, grassland, and wetland HRUs (wetland results were area-weighted across the 46 individual HRUs). All variables except CA have the unit of millimetre (mm). θ was assessed at a depth range of 0–12 cm for the recharge soil layer, 12–140 cm for the deep-root soil layer, and 0–140 cm for the total soil layer. A Pearson correlation coefficient (r) between Q sensitivity and the sensitivity of ET, SWE, θ, and CA was used to investigate the major underlying contributor for Q sensitivity in the basin types of HEG, IG, SI, PGL, PHT, and MRV. To facilitate comparisons between classes, hydrological sensitivity was quantified using the concept of elasticity (Eqs. 2 and 3).
where ΔT refers to the degree (∘C) change in T, Ps is the P amount in the perturbed scenario, and Pb is the baseline P amount. M is the hydrological variable value forced by perturbed T or P scenarios, and m refers to the corresponding variable value forced by baseline T and P inputs. In this study, as the hydrological models were forced by a range of P and T perturbations, mean precipitation elasticity (PES) was thus estimated as the slope of the best-fit line to scatterplots of [, ] derived from simulations in the 35 climate input scenarios. Similarly, mean temperature elasticity (TES) was estimated as the slope of the best-fit line to scatterplots of {ΔT, . The TES has units of percentage per degree Celsius (% ∘C−1), whilst PES is dimensionless.
Elasticity was first used to assess the climatic sensitivity of hydrological processes by Schaake (1990), referring to the percent change in a hydrological variable caused by a degree (∘C) warming or by 1 % change in P. Recently, Rasouli et al. (2022) used this metric to investigate hydrological sensitivity to climate perturbations in three North American mountainous basins, due to its advantage of standardizing the quantification of sensitivity at different locations.
4.1 Model evaluation
Comparisons in Fig. 3 indicate that streamflow simulations by the VB models aligned with observations of little or no streamflow in autumn and winter. The VB models also reasonably simulated that streamflow in the prairies is dominated by runoff during snowmelt from March to May. The mean values and ranges of annual streamflow simulated by the VB models reflected observed annual streamflow amounts (with the MB values ranging from −0.71 to 0.54), especially in the PHT basins (MB was only 0.14). Simulated annual streamflow in SM was larger than observations due to the overestimated monthly streamflow in April to June (MB was 0.54). In the remaining basins, the VB models underestimated observed streamflow particularly in the primary melting months of March to April, indicated by the negative bias from −0.71 to −0.37.
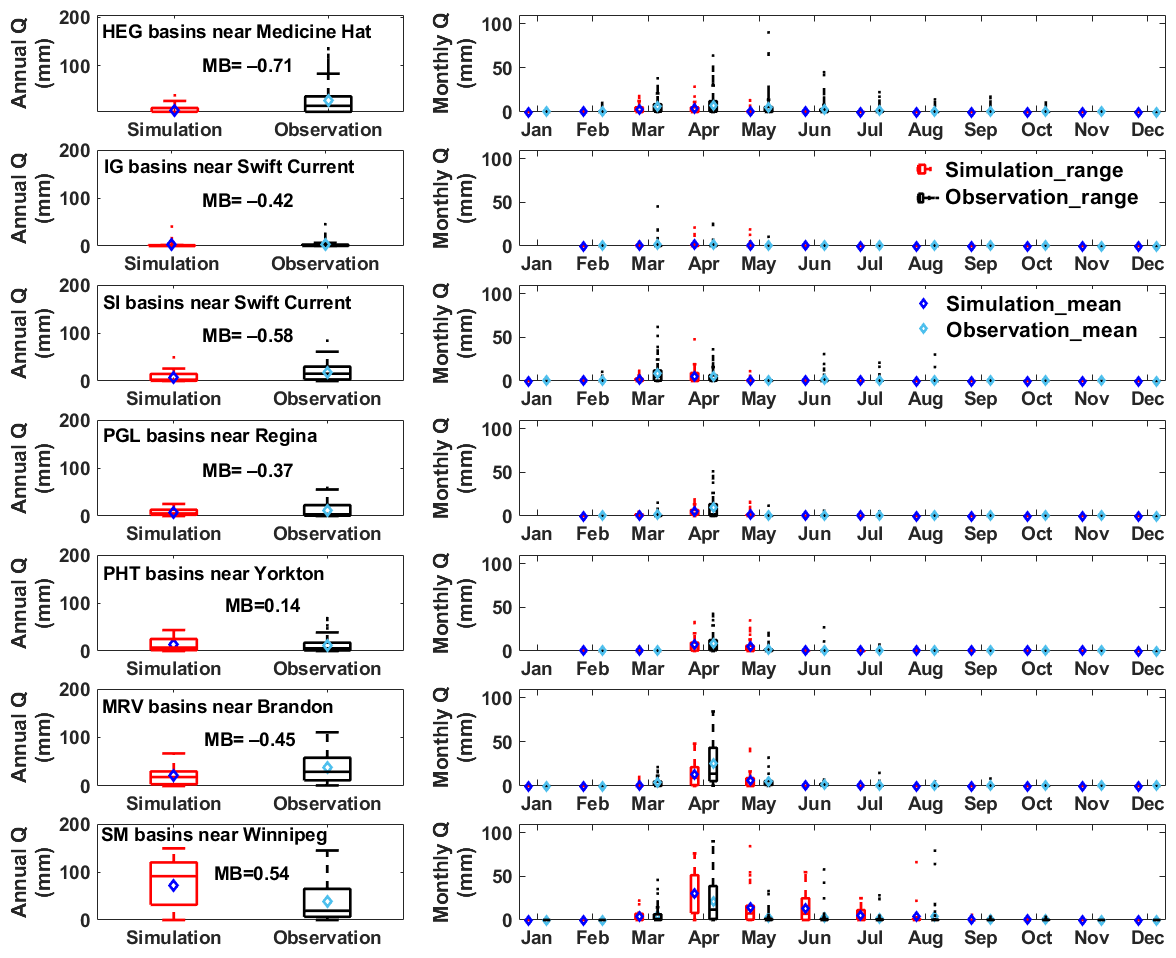
Figure 3Performance of the CRHM-based hydrological models in simulating annual (left panels) and monthly (right panels) streamflow (Q) over the prairies (1965–2006). Boxplots refer to the inter-annual variability in streamflow, and diamond dots represent the long-term mean values. MB is mass bias between simulated and observed annual streamflow.
In addition to model uncertainty, bias in simulated monthly and annual streamflow could be associated with two factors. First, the AHCCD meteorological stations are generally located outside of the basins that were gauged by the selected WSC stations (Fig. 1). Meteorological inputs measured at the AHCCD stations are therefore different from those that triggered runoff in the WSC gauged basins. This is most severe for summer rainfall, where there are misrepresentations of intense but small spatial- and temporal-scale convective rainstorms occurring in the gauged basins, but missed in the AHCCD precipitation, likely contributing to underestimation of simulated streamflow in the warm seasons. Second, the CRHM-based VB hydrological models were structured and parameterized using the median characteristics of each class. The VB model parameters, such as the effective-area fraction, capacity of depressional storage, and land use types, can differ from those in the specific WSC gauged basins, which likely led to some differences between simulated and observed streamflow.
Simulated snow depth on multiple cropland sites replicated observations well in most years between 2001 and 2011 in the SM class (Fig. 4). Although the model slightly underestimated peak snow depth in 2004 and 2010, observed snow depth in the remaining years generally fell within the simulation ranges at the various crop HRUs. The simulated snow accumulation showed a reasonable pattern that started in October and ended in March when melt and sublimation deplete the snowpack. Snow cover disappeared from April and May due to strong melting. In addition to the evaluation in SM, the VB model has proven effective in matching observed SWE at Red Deer (Alberta) in the HEG class (Spence et al., 2022a).
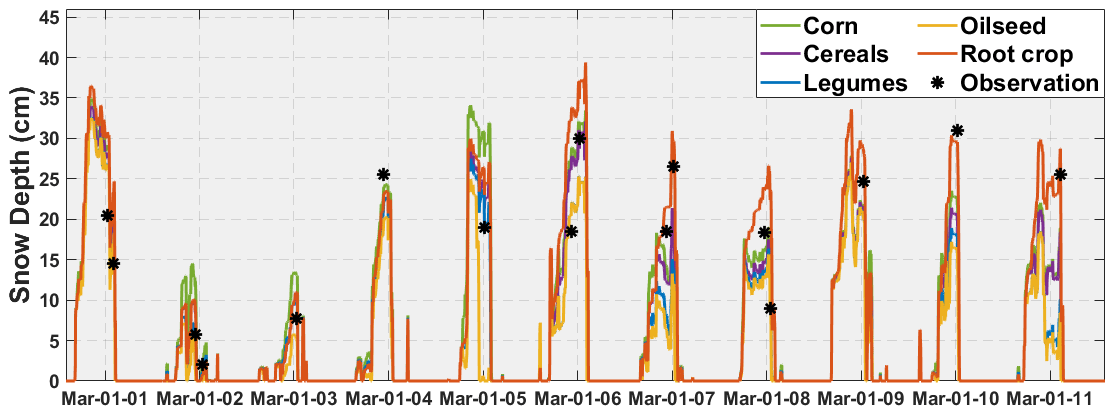
Figure 4Model performance in simulating snow depth observed at the South Tobacco Creek site in the SM class during 2001–2011.
Model performance in simulating soil moisture was not evaluated by this work due to limited availability of soil moisture measurements surrounding the representative AHCCD stations. The CRHM-based VB models have been verified as effective in simulating the soil-moisture-limited ET at Lethbridge (Alberta) and central Saskatchewan (Armstrong et al., 2015). In the ET algorithm of CRHM, actual ET rate was represented by a function of soil properties and moisture stress (Armstrong et al., 2010), in which soil wetness was tracked for the ET calculation. Good agreement between cumulative curves of observed and simulated ET in Armstrong et al. (2010, 2015) implied that the seasonality of soil moisture could be reasonably represented in the CRHM VB models. Moreover, the CRHM soil module has proven acceptable in reproducing observed volumetric soil moisture in Smith Creek Research Basin, Saskatchewan (Fang et al., 2010).
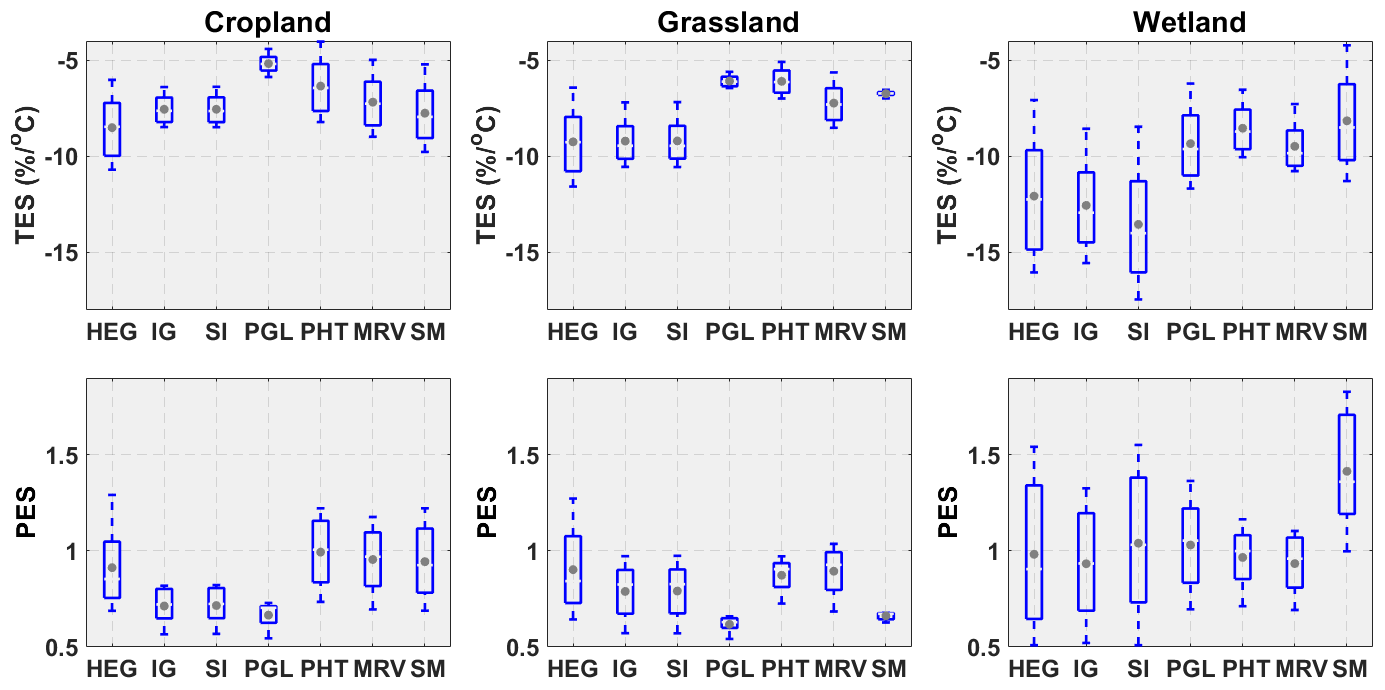
Figure 5Annual peak SWE temperature elasticity (TES; top panels) and precipitation elasticity (PES; bottom panels) on varied land covers in the seven basin classes. Boxplots represent variability for the model runs forced by diverse P and T perturbations.
Considering that the CRHM-based VB models were not calibrated against observations, that the models were parameterized using typical values in the corresponding classes, and that they were forced with climate data located at some distance from the monitored sites, the results in this and previous studies imply that the VB models are fit for purpose as tools to investigate hydrological sensitivity to climate perturbations in the prairies.
4.2 Snow sensitivity to climate perturbations
Snow elasticity differed amongst land covers. For example, absolute TES values of peak SWE in cropland and grassland were smaller than that in wetlands in all seven basin types, especially in the dry and grassland-characterized basins (Fig. 5). In these classes, mean absolute TES of peak SWE in the wetland were around 13 % ∘C−1, whilst they were only 8 % ∘C−1–9 % ∘C−1 in cropland and grassland (see grey dots in Fig. 5). In the wet and cropland-dominated basins, mean absolute TES values of peak wetland SWE were around 8 % ∘C−1, whilst they were only 5 ∘C−1–7 % ∘C−1 in cropland and grassland. The smaller absolute TES of peak SWE in the wet and cropland-dominated basins is because of their wetter baseline climate compared to the semi-arid grassland-characterized basins. The wetter climate resulted in a larger baseline SWE and thereby generated a smaller percentage decrease in SWE caused by warming. Absolute TES in cropland was smaller than grassland in the grassland-characterized basins and PGL but larger in the remaining classes. Similarly, mean PES of peak SWE in wetland was larger than that in cropland and grassland (except PHT and MRV), especially in SM. The mean PES of peak SWE in wetlands was 1.4 in the SM class and close to 1.0 in the remaining classes, whilst both cropland and grassland mean PES values were lower than 1.0 in all the basin types. Cropland PES in the grassland-characterized basins were smaller than grassland but larger in the cropland-dominated basins. Variability in wetland snow elasticity forced by diverse P and T inputs was much larger than that in cropland and grassland (Fig. 5), partly because snow accumulation in wetlands was strongly influenced by wind redistribution of snow to wetlands from all upland HRUs. The blowing snow process was sensitive to climate inputs.
Table 2Mean elasticities of basin-average snow processes/variables to warming and P rising forced by 35 climate input scenarios.
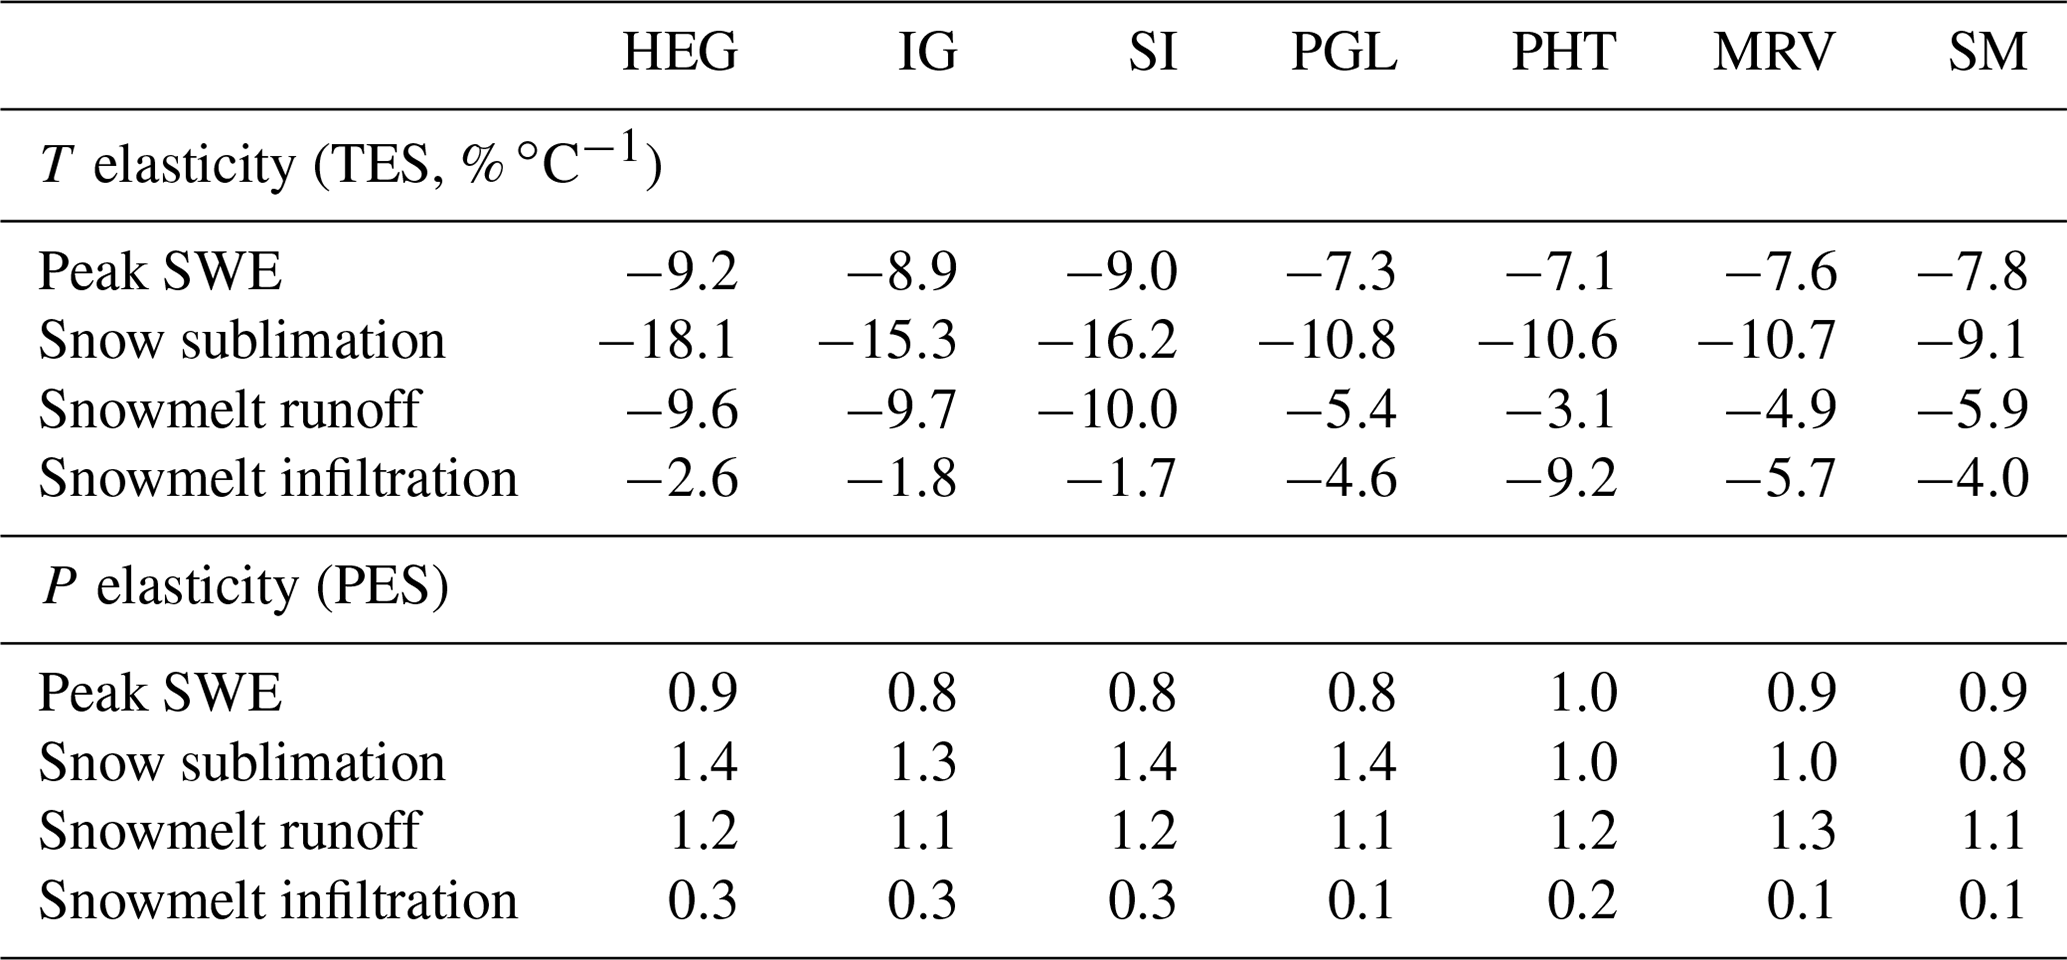
At the basin scale, peak SWE showed decreasing mean absolute TES from the drier and grassland-characterized classes to the wetter and cropland-dominated classes, with the largest value of 9.2 % ∘C−1 in HEG and the smallest value of 7.1 % ∘C−1 in PHT (Table 2). This could be caused partly by the higher baseline peak SWE of the colder and wetter climates in the cropland-dominated classes (Table 1). Despite that, wetlands showed larger absolute TES than other land covers in Fig. 5, and wetland fractions in the cropland-dominated classes were larger than those in the grassland-characterized basins (Table 1). Results in Table 2 indicated that the TES of basin SWE was more determined by local climate rather than land cover characteristics. The other winter snow process of sublimation was more sensitive to T than was SWE, showing the same decreasing tendency from grassland to cropland dominated basins. The TES for snowmelt runoff and peak SWE were comparable among the grassland-characterized basin classes, which can be expected as redistributed snow accumulation serves as the primary contributor to melt runoff. However, in the cropland-dominated basins, the absolute magnitude of snowmelt runoff TES was lower than that of peak SWE, which could be attributed to the large TES of snowmelt infiltration (Table 2). The strong decrease in snowmelt infiltration in these classes could partly offset the decrease in snowmelt runoff caused by warming. Warming resulted in decreases in SWE, as indicated in Table 2. Consequently, both infiltration and runoff resulting from snowmelt would be reduced by warming. Specifically, the decrease in snowmelt infiltration was more pronounced in the cropland-dominated basin types compared to other basin types (Table 2). This implies that a larger fraction of snowmelt runoff occurred in the warming scenarios in these basins, which helped to lessen the reduction in snowmelt runoff.
PES of snow sublimation was larger than 1.0 in the dry and grassland-characterized classes and PGL (Table 2), which indicated that snow sublimation was limited by snowfall availability in these classes. When P increased and generated more snowfall, sublimation showed a larger percentage increase rate than P. This could explain why PES of peak SWE was lower than 1.0, because of the enhanced snow loss via sublimation. In contrast, snowmelt infiltration was controlled by the rate of soil thawing associated with T in the melting season rather than the availability of snow meltwater in the prairie basins. Although increased P resulted in larger snowmelt, PES of snowmelt infiltration was smaller than 1.0 because of the restriction by frozen soil. As a result, PES of snowmelt runoff was larger than 1.0 because of the increased snowmelt availability for surface runoff generation (Table 2). Compared to TES, PES of snow processes showed smaller variations across the seven classes.
Effects of expected warming on peak SWE (i.e., percentage and magnitude changes in SWE caused by warming) can be partially offset by increased P within its possible future range in the Canadian Prairies (Fig. 6). Using the results from the PHT class as an example (because this basin class has the largest areal extent among the seven classes), decreases in peak SWE caused by warming from 1 to 4 ∘C can be completely offset by the gains from P increases ranging from 4.4 % to 25.2 % (Fig. 6a). The maximum expected increase of 30 % in future P, however, cannot fully offset the decrease in SWE caused by warming higher than 5 ∘C. On the other hand, increases in SWE associated with P increases of 10 %, 20 %, and 30 % can be offset by warming of 1.7, 3.37, and 4.44 ∘C, respectively (Fig. 6b). With warming of 6 ∘C, the decreases in snowmelt runoff can be fully offset if P increases by 18 % (Fig. 6c). On the other hand, offsetting the increase in snowmelt runoff created with a P increase of 10 % requires warming of 4.75 ∘C (Fig. 6d). P increases greater than 20 % cannot be fully offset by warming lower than 6 ∘C.
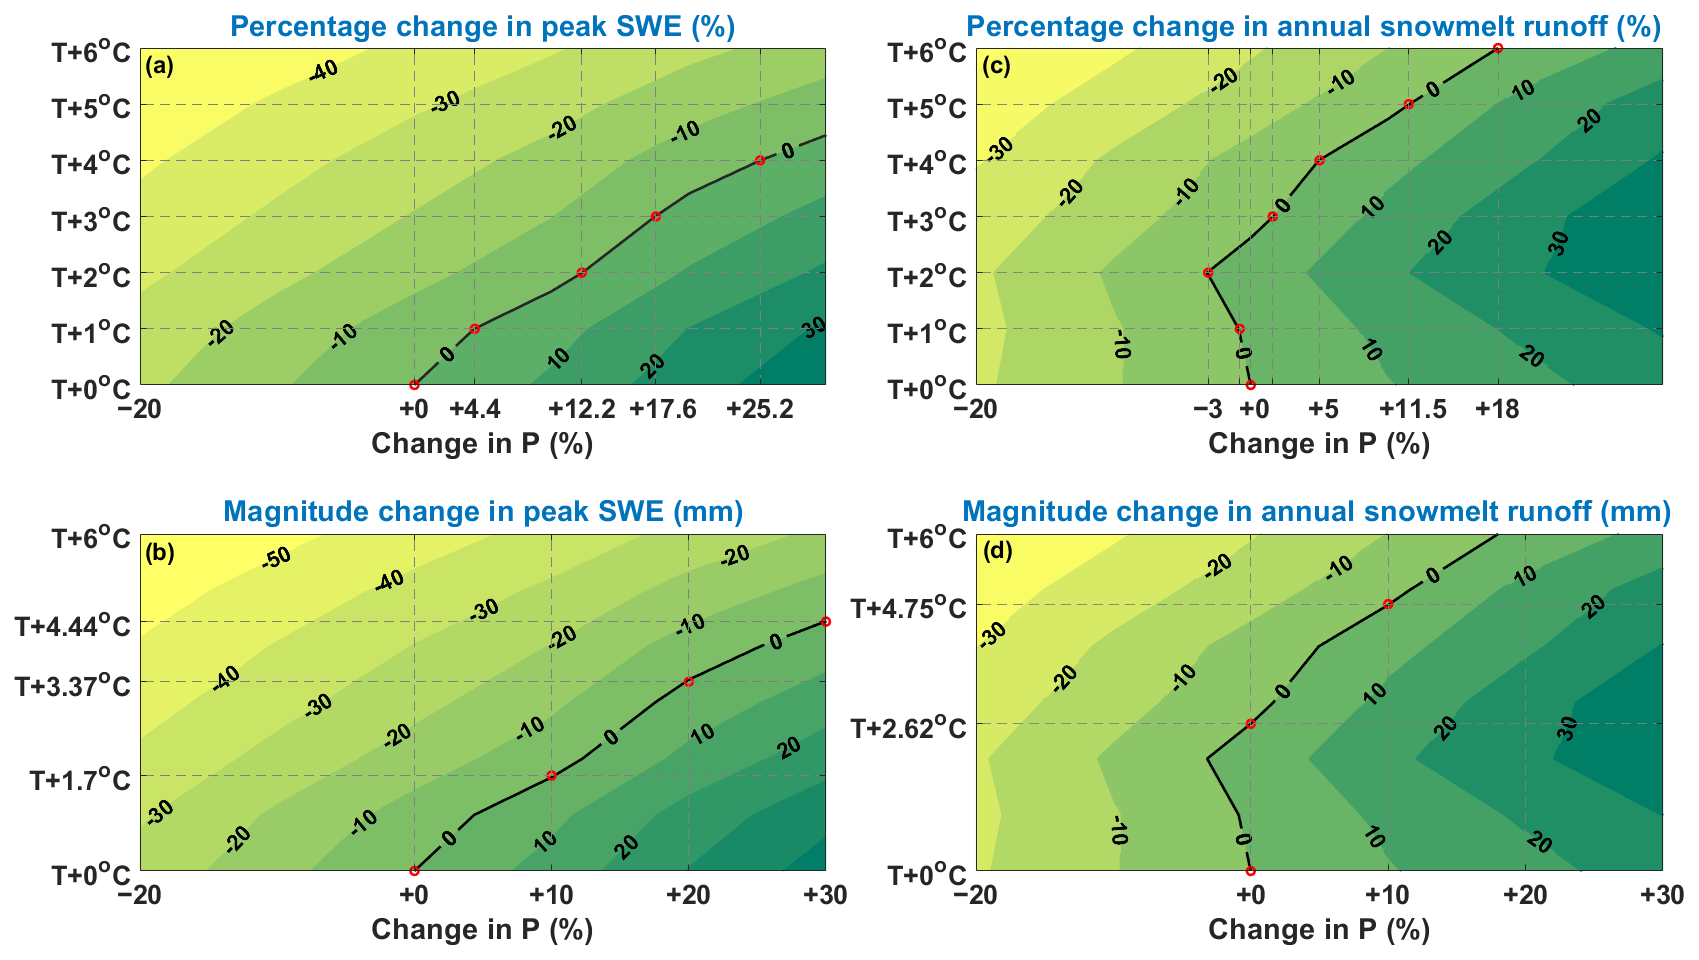
Figure 6Combined effects of T and P perturbations on annual peak SWE and snowmelt runoff in the PHT class. Red dots on the upper panels show where the effects of warming scenarios were offset by percentage changes in P, and those on the lower panels show where the effects of P rising scenarios were offset by warming degrees in T.
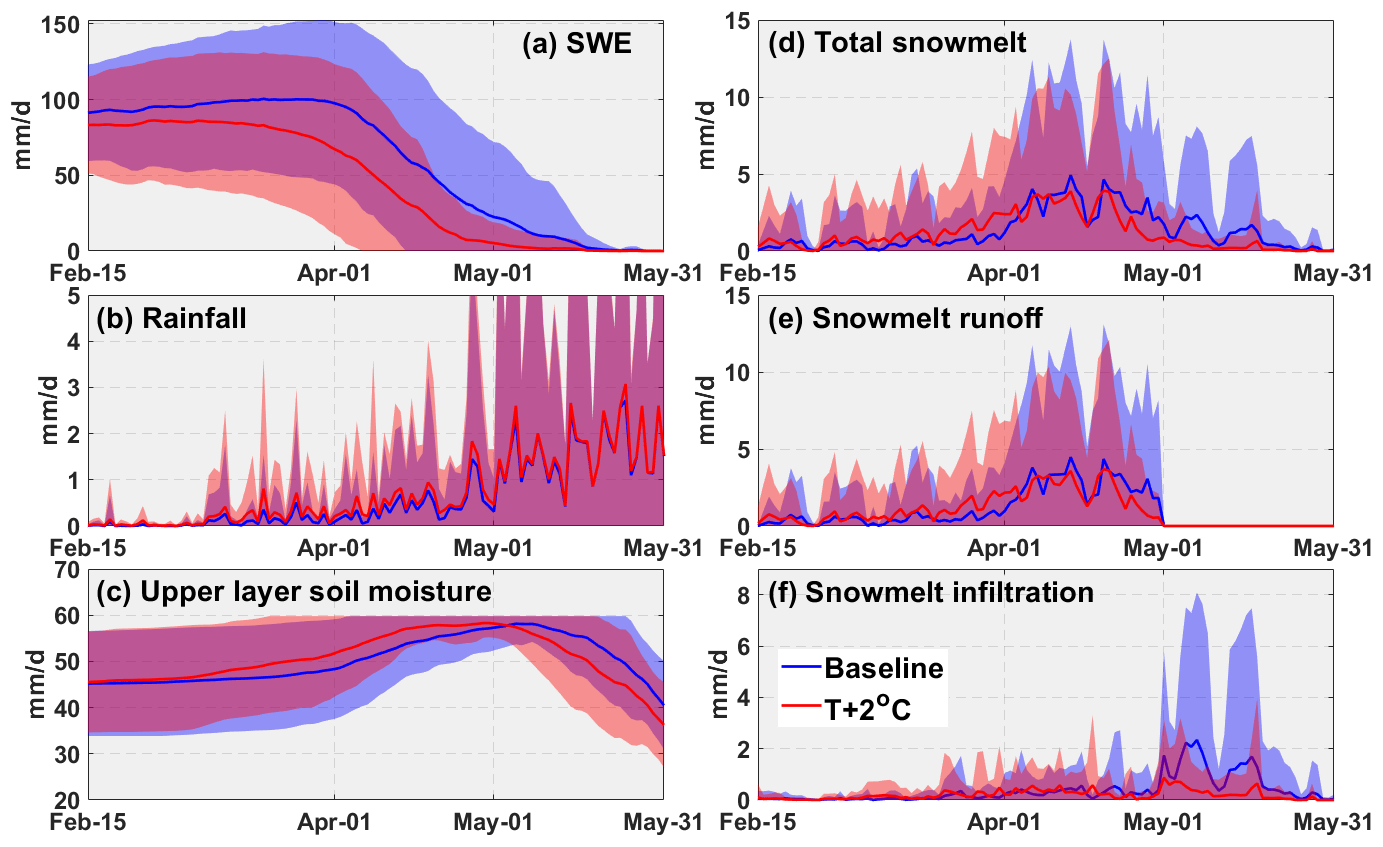
Figure 7Comparisons of daily snow accumulation and melt, snowmelt runoff and infiltration, rainfall, and soil moisture in two T input scenarios. Solid lines represent the mean daily values throughout the modelling period, whilst the bands indicate the range of values within the standard deviation (±).
It is noted that snowmelt runoff increases slightly with warming of 1–2 ∘C in the PHT class (Fig. 6c and d). This phenomenon could be caused by increased surface runoff fraction of snowmelt with warming (Fig. 7). With a warming of 2 ∘C, a reduction in annual peak SWE and snowfall by 14.3 mm (14 %) and 20 mm (12 %), respectively, was predicted (Fig. 7a). Total rainfall increased by 20 mm (5.5 %) (Fig. 7b). However, snowmelt surface runoff increased by 3.9 mm (3.9 %), accompanied by a decrease of 20 mm (40 %) in snowmelt infiltration (refer to Fig. 7e and f). Snowmelt infiltration was strongly constrained by antecedent conditions before 1 May (Fig. 7c). In the warmer scenarios, snowmelt initiated and concluded earlier, with a majority of the snowpack melting away before 1 May at which date the soil layer started to thaw and soil moisture started to decrease (Fig. 7a, c and d). The thawed soil layer after 1 May greatly facilitated snowmelt infiltration in the baseline scenario, during which considerable snowmelt was still occurring after 1 May. The longer melting period extending to the thawing season in the baseline scenario resulted in a larger fraction of snowmelt infiltration, whereas the shorter melting period mainly falling within the frozen soil season generated a larger fraction of surface runoff for snowmelt.
Table 3Required P increases (%) to offset the effects of warming and required warming degrees (∘C) to offset P changes on annual peak SWE and the maximum increase and decrease (percentage/magnitude) in peak SWE caused by the 35 combined P and T perturbation scenarios. “n/a” means not applicable.
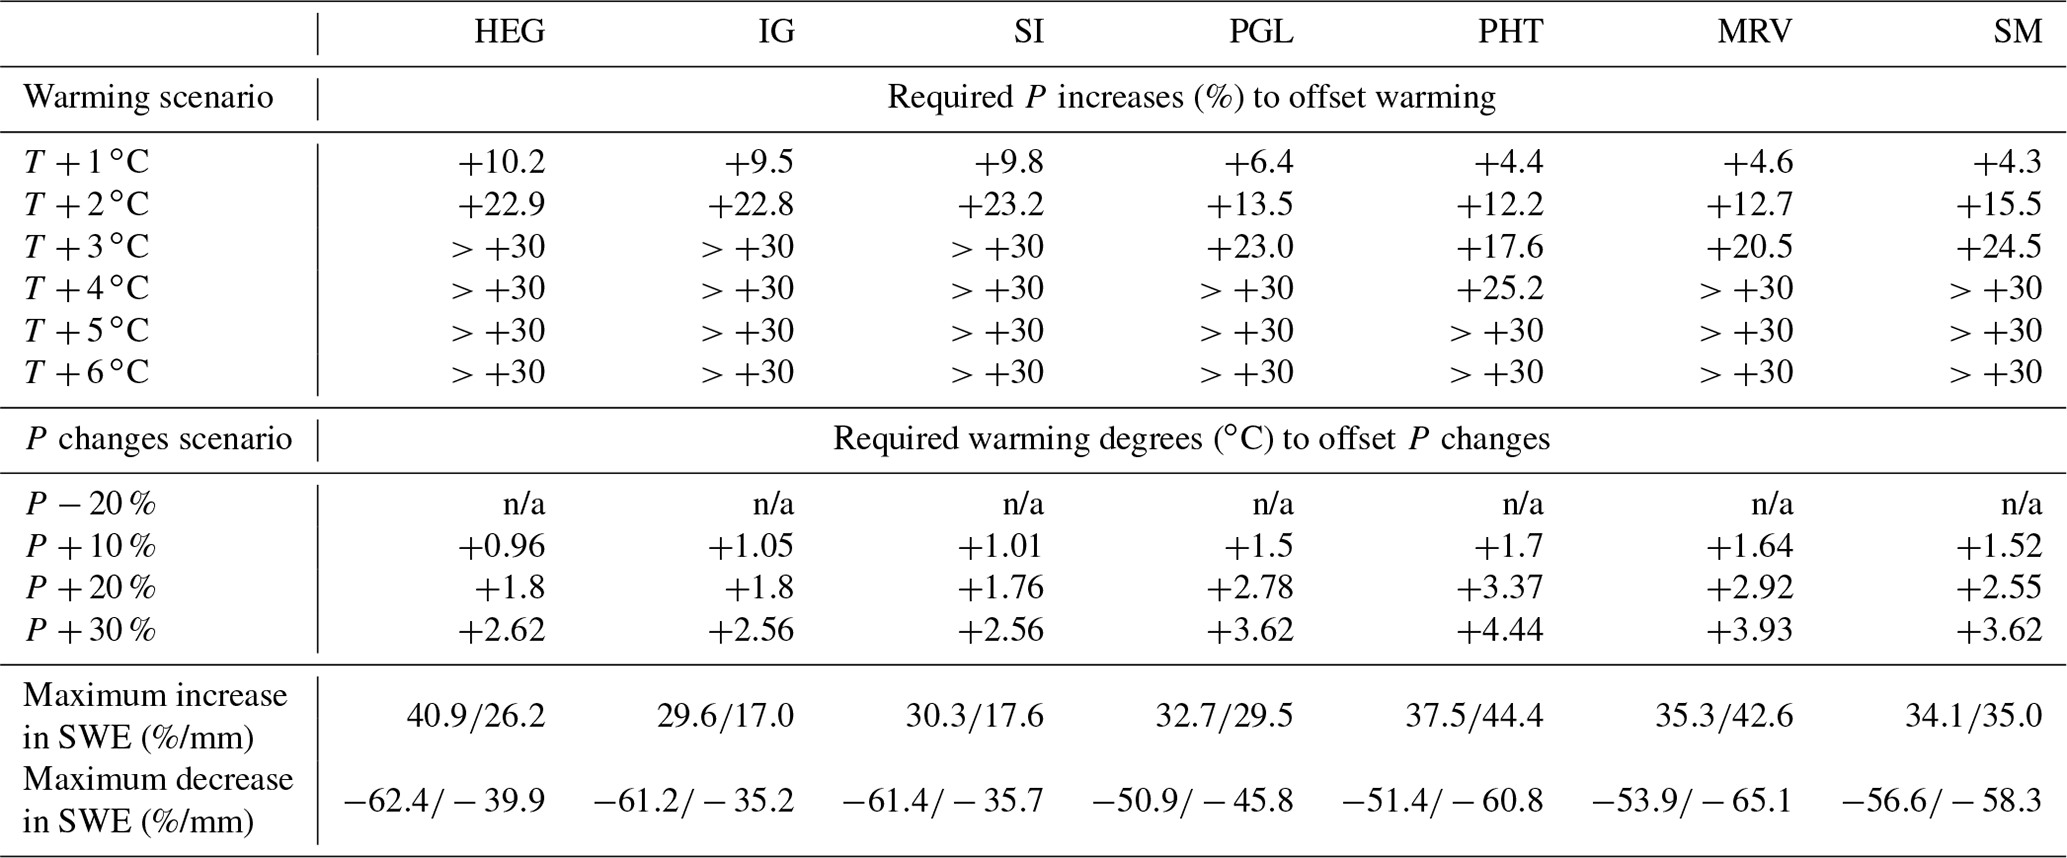
The effectiveness of P to compensate for warming effects on peak SWE increased from the drier and grassland-characterized classes to the wetter and cropland-dominated classes (Table 3). To offset the effects of warming by 1 ∘C, 9.5 %–10.2 % increases in P were required in the HEG, IG, and SI classes, whilst smaller increases of around 4.4 % were required in the PHT, MRV, and SM classes. An increase of 30 % in P would be able to offset the effects of warming up to 3 ∘C in the PGL, MRV, and SM classes and even 4 ∘C in the PHT class, whilst such an increase in P could only offset the effects of warming of up to 2 ∘C in the HEG, IG, and SI classes. In contrast, warming of around 1 ∘C can offset the effects of a 10 % increase in P in the HEG, IG, and SI classes, whilst warming of higher than 1.5 ∘C is required in the PGL, PHT, MRV, and SM classes.
The 35 combined climate inputs resulted in varied decreases and increases in peak SWE across the basin types (Table 3). The maximum percentage increases in peak SWE due to increased P of 30 % were around 30 %–41 % over the entire region, whilst the maximum magnitude increases ranged from 17 mm in IG to 44 mm in PHT. The maximum percentage decreases in peak SWE ranged from 51 % to 62 %, associated with warming of 6 ∘C and 20 % decrease in P; magnitude decreases in this scenario ranged from 35 mm in IG to 65 mm in MRV.
Table 4Mean elasticities of the growing-season's total soil moisture (θ) to warming and P rising derived from simulations in 35 climate forcing scenarios.
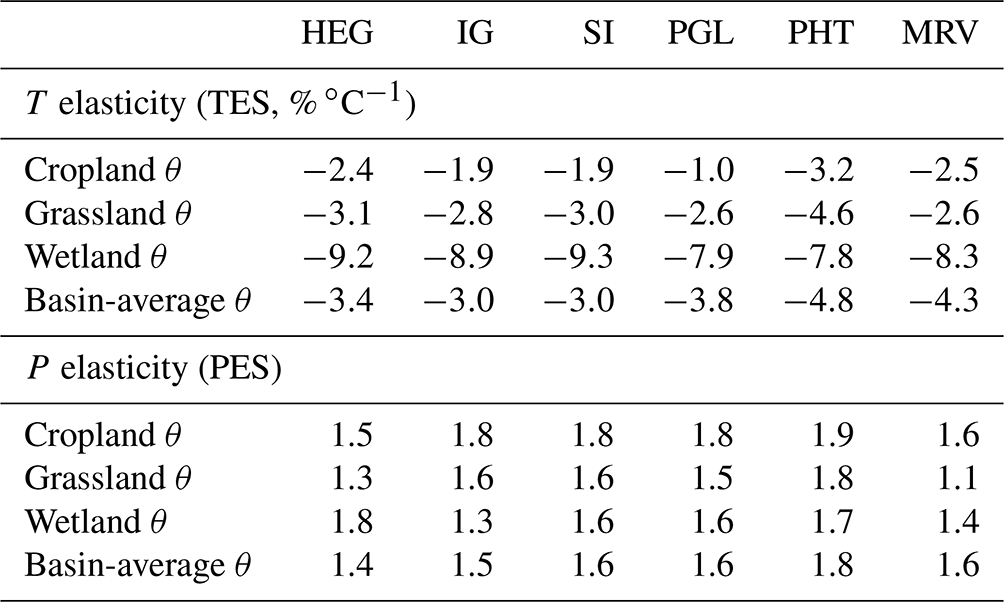

Figure 8Comparisons of the climate elasticities of mean growing-season soil moisture in cropland. Boxplots refer to the variability forced by different P or T inputs, and dotted lines stand for the mean elasticities.
4.3 Soil moisture sensitivity to climate perturbations
Growing-season (May to September) soil moisture TES differed among land cover types in the basin classes (Table 4). The SM basins were excluded from this analysis, because the VB model's performance in simulating soil moisture in the eastern wet area has not been evaluated. Cropland soil moisture showed smaller mean absolute TES than in grassland and wetland along all the six evaluated classes. The maximum absolute TES for cropland soil moisture happened in PHT as 3.2 % ∘C−1 followed by 2.5 % ∘C−1 in MRV. The TES of grassland soil moisture was slightly higher, with a maximum absolute value of 4.6 % ∘C−1 in PHT. Wetland soil moisture showed the largest absolute TES among the land covers with the maximum of 9.3 % ∘C−1 in SI and the minimum of 7.8 % ∘C−1 in PHT. This could be explained by the fact that when their depressional storage dropped to zero, wetlands transitioned to bare surface, and soil moisture under those conditions was thus highly sensitive to warming. Variations in TES of the basin-average soil moisture among the basin types can be explained by the different land cover fractions in the classes (Table 1). For instance, HEG, IG, and SI have high coverage of grassland; TES of basin-average soil moisture (around 3.2 % ∘C−1) in these classes was thereby close to that of grassland soil moisture (around 3.0 % ∘C−1). In contrast, PGL and PHT had large land cover fractions of cropland and wetland, and their basin-average soil moisture TES (around 4.3 % ∘C−1) was intermediary to values for cropland (1 % ∘C−1–3.2 % ∘C−1) and wetland (7.9 % ∘C−1).
PES of growing-season soil moisture, however, only exhibited slight differences across land covers and were typically larger than 1.0 which can be attributed to rainfall infiltration in the growing season being limited by the availability of rain input. In all the six classes, PES of cropland soil moisture ranged only from 1.5 to 1.9 and were between 1.1–1.8 and 1.3–1.8 in grasslands and wetlands, respectively (Table 4). Again, basin-average soil moisture PES was close to that of grassland soil moisture in HEG, IG, and SI and was intermediary to values for cropland and wetland in the PGL, PHT, and MRV classes.
Moisture in shallow (recharge) soil layers is of great interest to agricultural producers in the Canadian Prairies and is the source of crop growth by supplying water for dryland farming ET and plant productivity. As expected, moisture in shallow soils (Fig. 8a and b) showed smaller mean absolute TES and PES than in deeper (deep-root) soils (Fig. 8c and d), because the shallow layer soil moisture capacity is much smaller and receives infiltrating waters first. Despite that, mean TES (absolute) and PES for shallow layer soil moisture generally increased from the drier and grassland-characterized classes to the wetter and cropland-dominated classes, likely because soil moisture in the shallow layer was easily depleted by ET in the dry sites. Deeper layer soil moisture response showed wide variability among the basin types. It had the largest absolute mean TES of around 4 % ∘C−1 in the PHT class, whilst presenting the largest mean PES of 2.2 in the SI class.
The effectiveness of P in compensating for the effects of warming on cropland's growing-season soil moisture showed that a P increase of 10.5 % was required to offset the effects of 6 ∘C warming in the HEG and PHT classes (Table 5), which is much higher than the required increase of 5.4 % in the PGL class. The P increase in the IG and SI classes showed similar effectiveness, offsetting effects of 1 and 6 ∘C warming with increases of 2.0 % and 7.7 %, respectively. The MRV basins showed reduced effectiveness compared to IG and SI, indicated by the required P increases of 2.8 %, and 7.8 % to offset the effects of warming by 1 and 6 ∘C, respectively. In contrast, warming is not effective in compensating for the increases in soil moisture caused by more P. The maximum warming of 6 ∘C could only offset the effects of P increases up to 11 % in any basin types. The maximum percentage increases in soil moisture by 30 % P increase approached 61 % in PGL and to as large as 110 % in MRV. Maximum magnitude increases ranged from 95 to 242 mm in all basin types. The maximum decrease in soil moisture forced by 6 ∘C warming and 20 % P decrease showed the percentage and magnitude values of 24 %–52 % and 46–147 mm, respectively.
Table 5Required P increases (%) to offset the effects of warming and required warming degrees (∘C) to offset changes in P on cropland's growing-season total soil moisture (θ) and the maximum increase and decrease (percentage/magnitude) in the growing season's total soil moisture caused by the 35 combined P and T perturbation scenarios. “n/a” means not applicable.
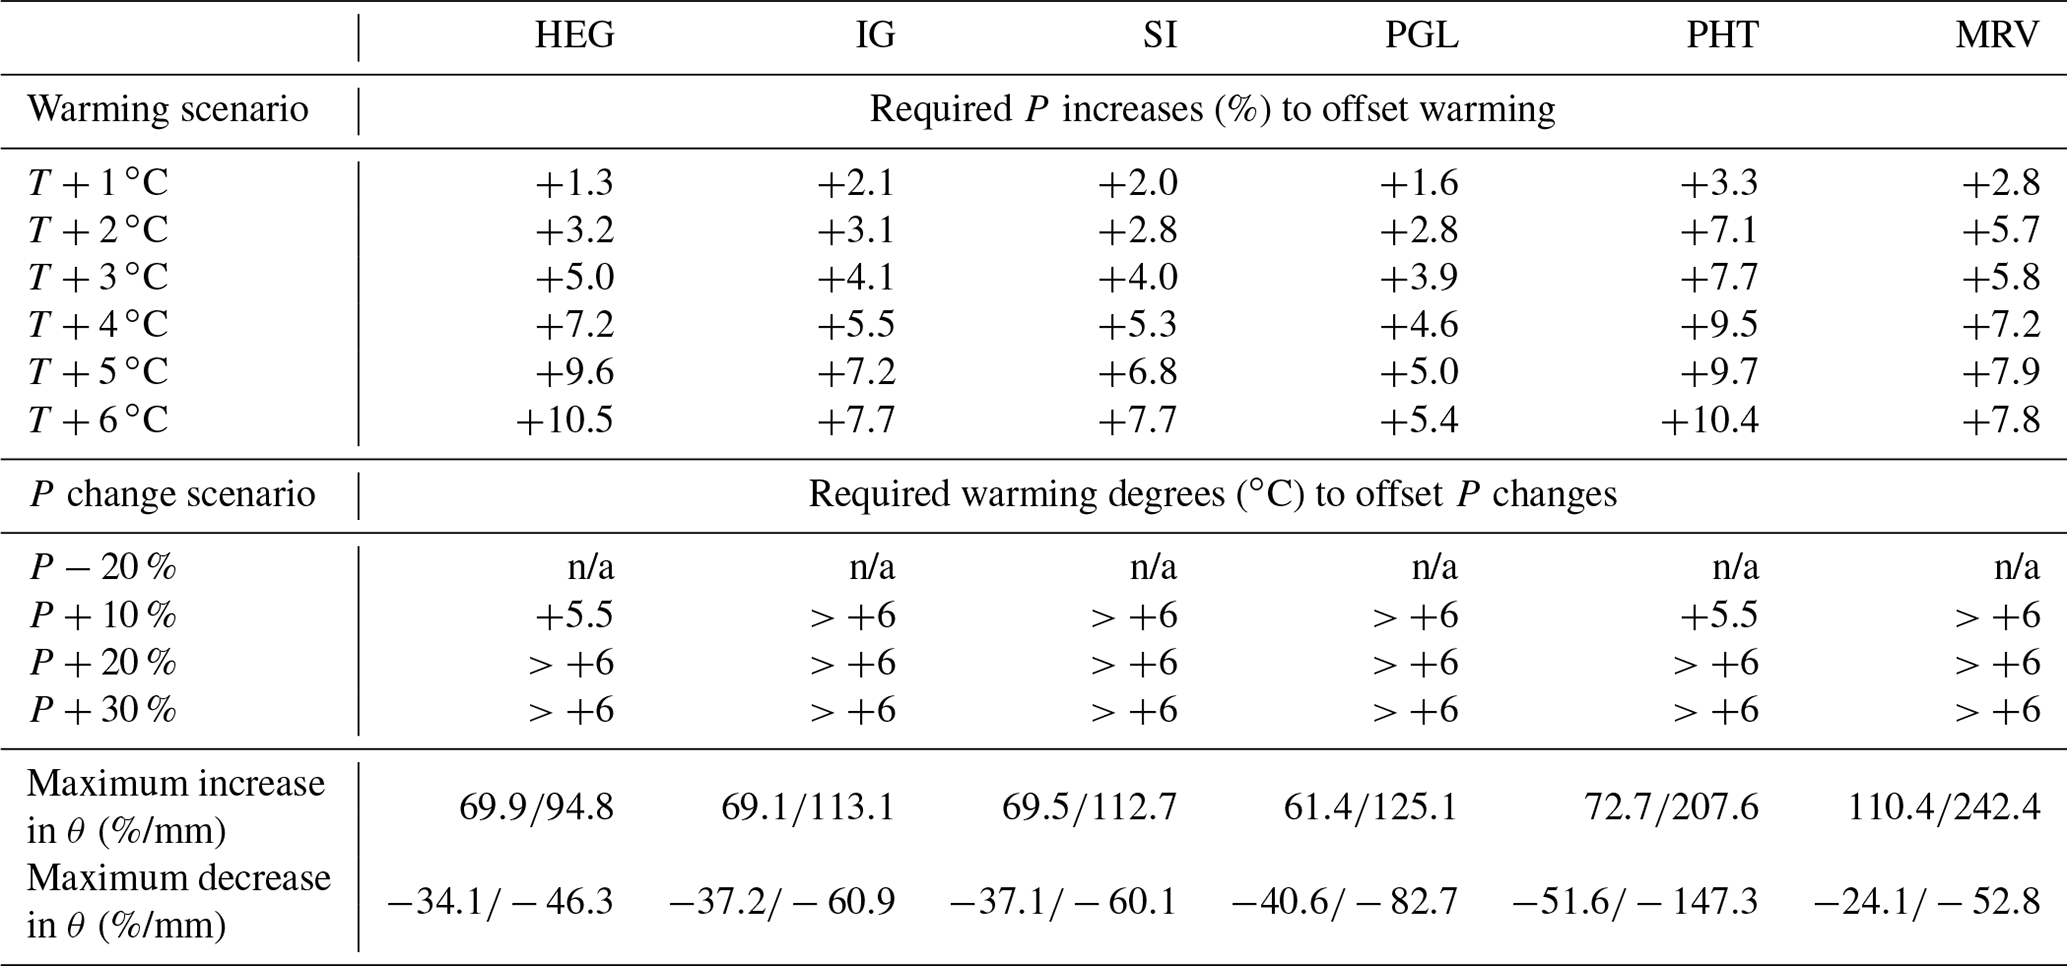
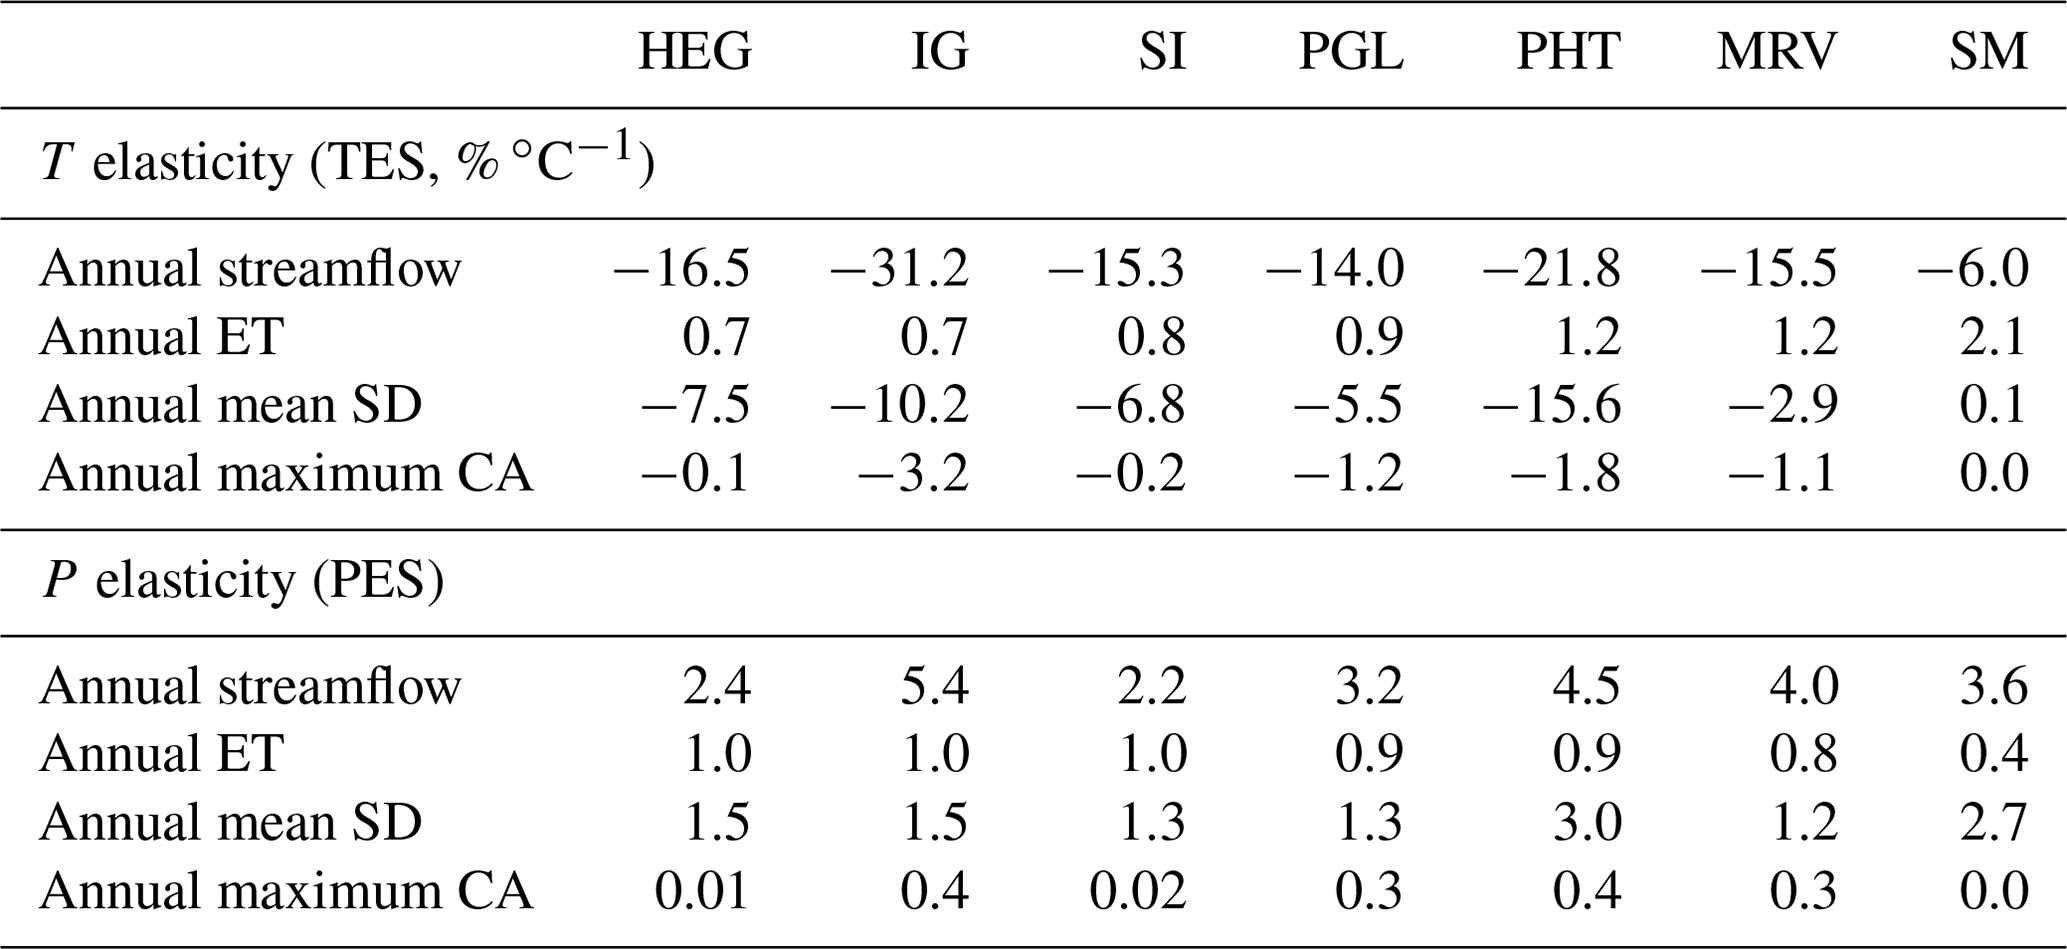
Table 6Mean elasticities of streamflow, ET, depressional storage (SD), and maximum connected area (CA) to climate perturbations derived from the 35 climate input scenarios.
4.4 Streamflow sensitivity to climate perturbations
Mean absolute TES and PES values of streamflow were much larger than those of snow and soil moisture (Table 6). Mean annual streamflow in the IG class was the most temperature sensitive at −31.2 % ∘C−1. The SM class showed the smallest (absolute) TES for streamflow at −6.0 % ∘C−1. Streamflow TES in the remaining classes were typically around −17 % ∘C−1. Similarly, IG had the largest streamflow PES of 5.4, followed by PHT with a PES of 4.5. Streamflow in SM showed comparable PES to that in MRV and PGL, whilst HEG and SI had the smallest PES of ∼2.3.
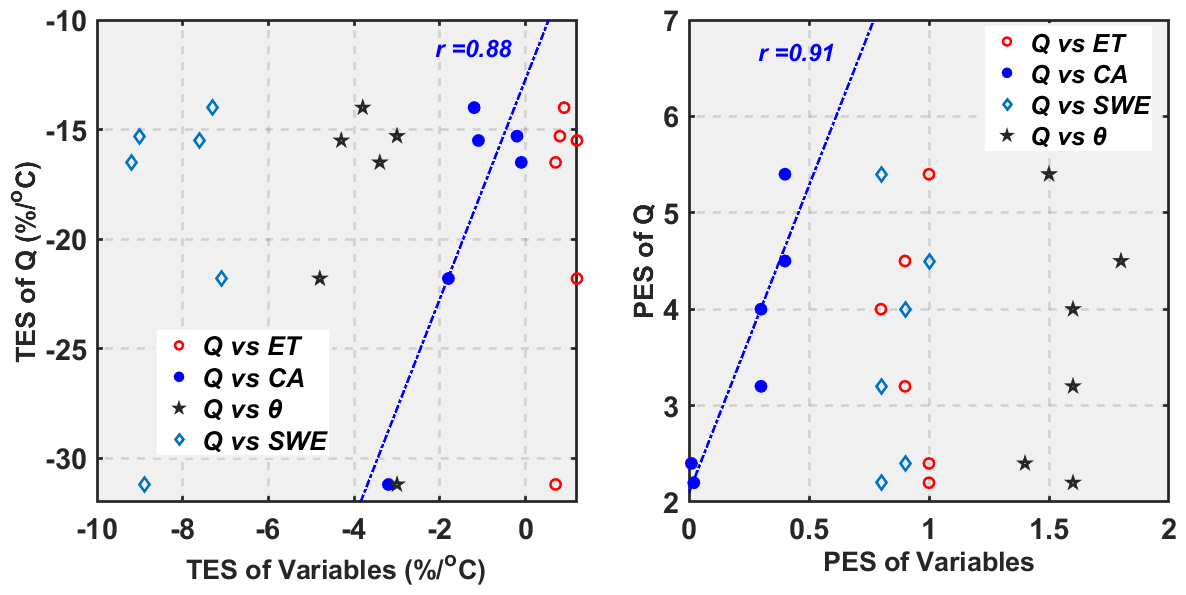
Figure 9Correlations between climate elasticities of annual streamflow (Q) and other variables in the basin types except SM; r means the Pearson correlation coefficient, and θ means the basin-average total soil moisture.
Apart from snowmelt contributions, streamflow in prairie basins is controlled by ET and CA, the latter of which is determined by the state of SD which is most often filled by spring snowmelt. ET increased with both warming and P rising, as shown by its positive TES and PES (Table 6). The TES of ET was highest in the wetter and cropland-dominated classes, whilst PES of ET was highest in the grassland-characterized classes, because ET in the drier and grassland-characterized classes was more strongly limited by water availability but more limited by energy input in the wet and cropland-dominated classes. Therefore, PES of ET were around 1.0 in the grassland-characterized classes but lower than 1.0 in the cropland-dominated classes, especially in the SM basins. Basin-average SD in PHT showed the largest mean TES and PES among the basin types, partly because of its largest depressional storage capacity (Table 1). CA over the prairies showed less sensitivity to P changes than ET, indicated by the PES values of only 0.01–0.4, which means the P input scenarios were not able to strongly change the fill–spill patterns of large depressions in the prairies, whilst CA in classes of IG, PGL, PHT, and MRV showed visible sensitivity to T change with absolute TES values comparable to that of ET, which can be explained by the fact that enhanced ET by warming strongly reduced SD in small wetland HRUs and their connectivity to the basin outlet. The CA in the SM class showed no sensitivity to P or T perturbations because all upper HRUs were connected to the channel in this class (see Fig. 2b). These show that the climate sensitivity of ET, basin water storage, and connectivity is greatly exceeded by that of streamflow generation. This is to be expected in a semi-arid to sub-humid climate where streamflow is intermittent and small in the baseline scenario.
Correlation coefficient (r) between the climate elasticities of annual streamflow and other hydrological variables indicated that the responses of annual streamflow to climate were mainly related to the response of CA in the wetland-characterized basins of HEG, IG, SI, PGL, PHT, and MRV (Fig. 9). The SM class was not included in this analysis because of its high connectivity. Climate elasticities of annual streamflow in SM should be mainly controlled by ET. The r between TES of annual streamflow and CA was as high as 0.88 and that for PES was 0.91. Correlations between the climate elasticities of annual streamflow and other variables including ET, SWE, and basin-average soil moisture were typically lower and not significant (at the 5 % level). For example, PES of ET and SWE showed small variations among the basin types, which differed from the considerable variations of streamflow PES.
The effectiveness of increasing P in compensating for decreases in mean annual streamflow caused by warming increased from the grassland-characterized classes to the cropland-dominated classes (Table 7). For example, around a 20 % increase in P was required to offset the effects of warming by 3 ∘C in HEG, whilst in SM, only up to a 5 % increase in P was required. Meanwhile, effects of the maximum warming of 6 ∘C can be fully offset by P increases up to 30 % in PGL, PHT, MRV, and SM, whilst 30 % increases in P could only offset the effects of warming of 4–5 ∘C in HEG and SI. As expected, higher levels of warming were required to offset the effects of the same P increases in the cropland-dominated classes. The maximum warming of 6 ∘C can only offset the effects of P increase of up to 20 % in the cropland-dominated classes but can fully offset the effects of the maximum increase of 30 % in the HEG and SI classes. The maximum increases in mean annual streamflow forced by the 35 combined P and T scenarios ranged from 118 % to 483 % and 10 to 150 mm, whilst the maximum decreases ranged from −73 % to −98 % and −2 to −78 mm.
Table 7Required P increases (%) to offset the effects of warming and required warming degrees (∘C) to offset changes in P on annual streamflow (Q) and the maximum increase and decrease (percentage/magnitude) in mean annual streamflow forced by the 35 combined perturbation scenarios. “n/a” means not applicable.

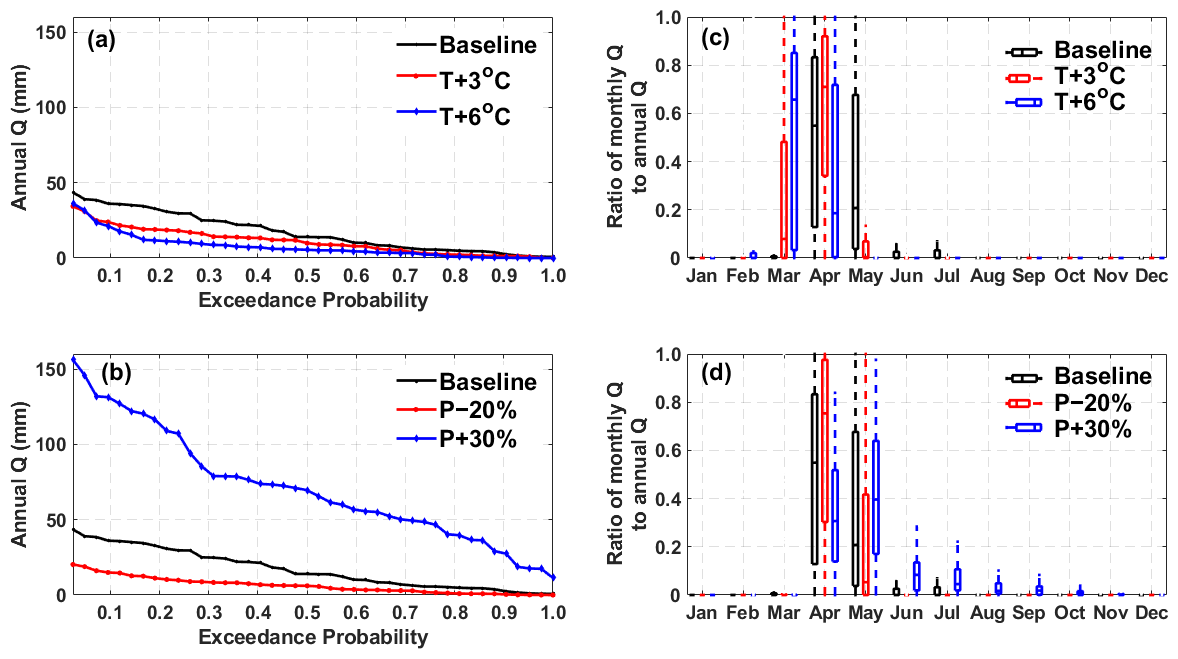
Figure 10Changes in flow duration curve of annual streamflow (Q) during the modelling period (1965–2006) and the ratio of monthly Q to annual Q under T and P perturbation scenarios in the PHT class. Boxplots refer to the inter-annual variability during the modelling period.
In addition to the long-term mean annual streamflow, T and P changes showed different impacts on statistically high and low annual streamflow during the modelling period. Taking the PHT class as an example, warming caused larger magnitude reductions in annual streamflow with exceedance probability of 0.1–0.4 than those in peak and low annual streamflow (Fig. 10a), whilst P changes resulted in larger changes in peak annual streamflow (Figure 10b). Compared to maximum warming of 6 ∘C, the maximum 30 % increase in P caused greater increases not only in peak and low annual streamflow but also in those with exceedance probability of 0.1–0.4. The ratio of monthly streamflow to annual streamflow showed considerable switches under T and P perturbation scenarios. With warming of 3–6 ∘C, the dominant period of monthly streamflow on annual streamflow switched from April–May to March–April (Fig. 10c). Under 6 ∘C warming, streamflow in March became the major contributor to annual streamflow, whilst that in May became very small. In contrast, streamflow in April–May will remain dominant on annual streamflow within the P changes range from −20 % to +30 % (Fig. 10d). The P changes will not increase the contribution of March streamflow to annual streamflow, whilst dry scenario (P−20 %) considerably enhanced the contribution of April. In the wet scenario (P+30 %), contributions from streamflow in June, July, August and September to annual streamflow will be more visible.
5.1 Basin hydrological sensitivity to climate changes
These modelling results are consistent with previous studies that focused on the impacts of warming (e. g., St-Jacques et al., 2018; Tanzeeba and Gan, 2012), which indicate earlier spring runoff, decreased mean annual streamflow, and lower peak SWE in the prairies. Johnson and Poiani (2016) found that a 20 % increase in P could strongly offset the effects of a 3 ∘C warming on the wetland water storage in the Prairie Pothole Region, which is similar to the findings here of the combined effects of P and T in the PGL and PHT classes (Table 3). Results from the Bad Lake basin in southwestern Saskatchewan (Fang and Pomeroy, 2007) indicated that spring streamflow would decrease by 20 % if air temperature increased by 1 ∘C and decrease by 1.6 % in response to a 1 % decrease in precipitation, which is rather close to the findings for the HEG and SI classes (in which Bad Lake basin lies) (Table 6). In this study we also showed that annual streamflow showed a larger PES than did SWE, which is consistent with behaviour of Canadian mountain basins to the west of our study region (Rasouli et al., 2022). However, the absolute TES of streamflow over all the prairie classes were larger than that of peak SWE, which is different from the findings of Rasouli et al. (2022). Reasons for this can be that streamflow in the prairies is typically dominated by snowmelt in spring with a small contribution from rainfall in spring and summer (Valeo et al., 2007; Pomeroy et al., 2010, 2014), but rainfall can be more important to streamflow generation in steeper mountain basins. Moreover, the connectivity of the wetland complex to basin outlet is important to streamflow generation in the prairies and connectivity can be strongly regulated by ET which is enhanced by warming.
The TES and PES showed distinct gradients from drier to wetter climates over the prairies as the lower baseline SWE or annual streamflow in the drier and grassland-characterized classes (Borchert, 1950; Millett et al., 2009; Pomeroy et al., 2010) likely resulted in a higher percentage change of response variables assessed herein (Eqs. 2 and 3). Whitfield et al. (2020) analyzed the changing trends in the prairie streamflow during 1920–2015 and demonstrated that streams in the southwestern Canadian Prairies are shifting to drier conditions and that the northeast is getting wetter. The modelling results here align with their findings and partly reveal the underlying mechanisms: streamflow in the western HEG class and southern SI class declined more rapidly with warming but increased more slowly with elevated P than those in the eastern SM class and the northern MRV class. Meanwhile, streamflow reduction in the eastern basins due to warming is more easily offset by P increase than in the western basins. Forced by future warming, streamflow in the drier and grassland-characterized basins will probably continue to get drier, and wetter cropland-dominated basins will continue to get wetter.
In addition to the climate difference, landscape traits among the basins also contributed to the varied hydrological sensitivities. For example, the SM class was characterized by fewer isolated wetlands and higher connectivity than the other classes, which resulted in smaller streamflow sensitivity to warming. The non-effective fraction in IG was much larger than that in SI, and when forced by the same meteorological observations at Swift Current, streamflow in IG showed much larger sensitivities to T and P perturbations. Wetland fraction and depressional storage capacity in PHT are larger than those in MRV. When forced by a similar climate at Yorkton and Brandon, respectively, streamflow, ET, and CA in PHT showed larger sensitivities. This can be explained by hydrological connectivity and streamflow generation in the PHT basins being more limited by water availability because of the larger depressional storage capacity. However, the influence of landscape traits on sensitivity of basin-average snow to climate perturbations was smaller than the influence of site climate.
To reduce the computational effort and conduct hydrological modelling forced by 35 climate input scenarios in all the seven basin types, one representative AHCCD station was selected as an exemplar for each of the basin types. Spence et al. (2022a) indicated that sensitivity to climate perturbation varied with local climate within the same prairie basin class. The elasticity modelling here also demonstrated dynamic percentage changes in peak SWE with warming and per percentage P increase under different P and T input scenarios (Fig. 5). Mean TES and PES values used in this study were calculated as the average change rate in hydrological variables forced by the 35 climate inputs at the representative AHCCD stations, which were therefore reasonably used as the hydrological sensitivity assessment for the typical locations in each of the classes. In Spence et al. (2022a), simulating streamflow in HEG with a Medicine Hat climate resulted in an absolute TES 3.3 % ∘C−1 higher than with a Brandon climate. In this study, when forcing the HEG VB model at Medicine Hat and the MRV VB model at Brandon, the TES difference for annual streamflow was as small as 1.0 % ∘C−1 (Table 6). This suggests simulating streamflow in one basin class with a representative climate likely reduces uncertainty in the sensitivity assessment than running a VB model with a distant unrepresentative meteorology.
5.2 Implications for adaptive water management strategies
Considering risks to freshwater availability caused by economic growth, population growth, and agricultural expansion in the prairies concomitant with climate change (St-Jacques et al., 2018), these scenario-based modelling results have important implications for the development of adaptive strategies to changing climate for the prairie provinces. The sensitivity analysis based on a physically based hydrological model provides a diagnosis of the underlying processes behind regional hydrological response to climate change and provides insightful information to support the design and direction of adaptive practices (Tarnoczi, 2011). Separation of P and T sensitivity could serve as guidance for adaptation strategies in response to short-term hydrological flooding triggered by P events and long-term warming and droughts caused by decadal T increases (Zhang et al., 2021). Calculating elasticity of hydrological processes under variable climate and basin types over the prairies provides useful information for how these processes may change and how hydrological sensitivity to climate perturbations can differ, across the spectrum of climate conditions and landscapes (Wheater and Gober, 2013). The sensitivity assessment indicated to what extent snow processes, soil moisture, and streamflow will be significantly impacted by meteorological forcing changes in the different basins spanning the region, delivering informative knowledge for potential management of agricultural activities. The combined effects of P and T perturbations on soil moisture and streamflow have implications for the prairie provinces' climate change plans that are aimed at building climate resilience (Sauchyn et al., 2017), including improving understanding of future hydrology changes and the quantitative examinations of the tradeoff between P increase and warming, which importantly differ according to basin type and climate in the study region.
Comparisons among the land covers and basin types suggested that both basin characteristics and local climate influenced the basin hydrological sensitivities. The lower P effectiveness in compensating for warming effects in the drier and grassland-characterized basins highlighted their tendency to undergo more drying than the wetter and cropland-dominated basins which are historically wetter. Adaptation strategies in the drier basins should be carefully designed for a future where surface water is scarcer. In the wetter basins concentrated in eastern parts of the study region, it seems the ability to cope with more water in many years will be necessary in the short term, but long-term drying is also possible.
5.3 Uncertainty and limitations
High uncertainty in modelled sensitivities in the prairies has been documented before (Unduche et al., 2018). Sources of uncertainty in this study include those from inaccurate meteorological data observations at the AHCCD stations, use of perturbed climate scenarios, and model process representation and parameterization associated with a VB approach.
There is uncertainty in the meteorological measurements at the AHCCD stations, particularly for severe summer rainstorms. The misrepresentations of the intensity and occurrence of such events in the P inputs would lead to an underestimation of simulated streamflow in the warm seasons across the prairies. The 35 perturbed climate scenarios were set up based on a delta approach with the assumption that P and T perturb linearly without considering the seasonal dynamics. The linear approach thus did not consider disproportionate changes in extreme precipitation events. Seasonal patterns of P and T in the perturbed scenarios are the same as in the baseline scenario observed at the AHCCD stations. This approach was used because the focus of our study is a sensitivity analysis of snowmelt, soil moisture, and streamflow in response to potential future climate perturbations, rather than a modelling projection of future hydrology under future climates. Delta perturbations have successfully represented the uncertainty in projected future climate over the prairies (Zhang et al., 2021). The maximum warming of 6 ∘C and the future change range in P of −20 % to +30 % are within the realm of projections (Bush and Lemmen, 2019; Jiang et al., 2017; Forbes et al., 2011). Characterized by increment changes in T (i.e., per degree Celsius) and P (i.e., per 10 %), the perturbed climate scenarios are not only suitable for the assessment of hydrological sensitivity (i.e., changes in hydrological variables caused by per degree of warming or per 10 % increases in P) but also able to examine to what extent the impact of warming can be compensated for by P changes. Despite the limitations, the delta approach has been shown to provide reasonable temporal distributions of extreme dry, wet, hot, and cold climate conditions documented in long-term historical observations (He et al., 2021). This allows for the model calculation of shifts from spring snowfall to spring rainfall with increasing T, which is associated with the generation of extreme flow. Inter-annual variability, particularly with anticipated new precipitation extremes, warrants further consideration, but to include additional analyses of this here would be unwieldy.
All surface hydrological processes in CRHM are physically represented (Pomeroy et al., 2013, 2022). Because of this, most model parameters (which have physical meaning) are observable and do not require calibration. Some deeper sub-surface processes, however, are represented conceptually in CRHM and therefore the parameters (which are not normally observed in any case) might require calibration. But this was not done in the models presented here as the parameters, which were abducted from previous studies in similar basins, did well enough to yield good agreement in our model assessment stages. First, this is because sub-surface flows are typically unimportant for runoff generation mechanisms in the Canadian Prairies. Second, the CRHM-based virtual basin hydrological models were not specifically tailored to site-specific basins. Instead, they were designed to represent the median land cover and hydrological characteristics of each of the seven basin types. Therefore, calibrating model parameters using those from specific basins would have biased the results away from the typical basin of each class. The approach of using parameters from previous studies was taken to avoid using optimized parameters that may yield high performance in the calibrated basins but perform poorly in other ungauged basins of the same class. Additionally, it is important to note that streamflow discharge observations over the Canadian Prairies are very limited, especially for small basins, making it difficult to calibrate the CRHM-based models at each specific location within the prairie basins. The ability of CRHM to give good results without calibration has been well established in the published literature. Pomeroy et al. (2022) summarizes many examples of this. The use of CRHM parameters “abducted” from similar basins has also been established in Pomeroy et al. (2013). Therefore, while there is inherent uncertainty in the model (He and Pomeroy, 2023), parameter uncertainty should have limited influence on the modelling assessment in this study.
Virtual basins (VBs) were used to represent the typical hydrological behaviour in each of the seven basin types. The CRHM-based VB hydrological models were structured and parameterized using the median characteristics of each class. The VB models were then utilized to assess the median sensitivity of hydrological processes to climate perturbations based on representative meteorological data. Therefore, simulations will inevitably show biases from the gauged streamflow due to the virtual basin nature of the models. Further, this analysis does not represent the full range of hydrological variability within each basin class which is one limitation of the regional approach favoured here. Despite these considerations, there is reasonable agreement between the simulated and observed seasonal pattern of streamflow based on graphical assessment. This approach enabled comparisons of the general response of hydrological processes amongst these basin types. However, caution should be taken when interpreting these assessments for real basins in the prairies. The results are meant to reflect a regional response rather than that in any specific location. Specifically, local land cover, hydrography, and soil properties would be taken into account for the assessment of how they may alter estimates from those presented here in a physical basin. Moreover, changes in land cover and soil parameters under a perturbed climate were not considered (see Spence et al., 2022b, for such an example). The modelling outcomes cannot be interpreted as future hydrological projections in real basins.
This study evaluated hydrological sensitivity to climate across the Canadian Prairies based on a basin-classification and virtual basin (VB) modelling approach, with different land covers represented with HRUs. Among the different land covers, snow accumulation in wetlands is more sensitive to climate perturbations than that in cropland and grassland. Peak SWE in cropland showed larger climate sensitivity than that in grassland in wet and cropland-dominated basin types (PGL, PHT, MRV, and SM), but it was less sensitive in the dry and grassland-characterized basin types (HEG, IG, and SI). Wetland soil moisture was more sensitive to warming than that in cropland and grassland, with cropland soil moisture being the least sensitive to temperature. Precipitation sensitivity for soil moisture in cropland, grassland, and wetland tended to be consistent over the prairies. Due to the joint influences of land cover and site climate, snow accumulation and melt runoff at the basin scale were more sensitive to warming in the drier and grassland-characterized basins than in the wetter and cropland-dominated basins. Basin-average soil moisture was more sensitive to T and P perturbations in basins typified by pothole depressions and broad river valleys than that in grassland-characterized basins. Annual streamflow exhibited the greatest sensitivities to T and P in the dry and poorly connected IG basins but the smallest sensitivity to T in the wet and well-connected SM basins. The effectiveness of P increases in compensating for the effects of warming on snow accumulation and annual streamflow was higher in wet than in dry basins. For snow accumulation, the maximum 30 % increase in P could fully offset warming of 3 ∘C in wet SM but could only compensate for 2 ∘C in the dry and grassland-characterized basins (e.g., HEG). For annual streamflow, the maximum P increase of 30 % could offset decreases caused by warming of 6 ∘C in the wetter and cropland-dominated basins in the eastern prairies but could not do so in the drier grassland-characterized basins of the western prairies.
These sensitivity analyses improved our understanding of variations in hydrological responses to climate change over the Canadian Prairies, highlighting where important hydrological states for agricultural productivity (e.g., soil moisture) are sensitive and likely to change due to overwhelming effects of warming, even where potential P increases occur. Assessments of the sensitivities of snow processes, soil moisture, ET, and connected area provide diagnosis of the underlying processes behind streamflow response to climate change over the prairies.
All data and codes are available through the Federated Research Data Repository at https://doi.org/10.20383/103.0815 (He et al., 2023).
CS, JWP, and CJW conceived the study. ZH and KRS led the modeling effort and data analysis. All authors contributed to the writing.
The contact author has declared that none of the authors has any competing interests.
Publisher's note: Copernicus Publications remains neutral with regard to jurisdictional claims in published maps and institutional affiliations.
The authors wish to acknowledge funding provided by the Canada First Research Excellence Fund to Global Water Futures that supported this research. Additional support from the Canada Research Chairs, and Natural Sciences and Engineering Research Council of Canada is gratefully acknowledged. The role of Tom Brown in developing and supporting the CRHM Platform in his 50-year hydrological modelling career at the University of Saskatchewan and the research findings of the Division of Hydrology and Centre for Hydrology at the same university were crucial to this research.
This research has been supported by the Canada First Research Excellence Fund (Global Water Futures/Prairie Water).
This paper was edited by Gerrit H. de Rooij and reviewed by two anonymous referees.
Anteau, M. J., Wiltermuth, M. T., van der Burg, M. P., and Pearse, A. T.: Prerequisites for Understanding Climate-Change Impacts on Northern Prairie Wetlands, Wetlands, 36, 299–307, https://doi.org/10.1007/s13157-016-0811-2, 2016.
Armstrong, R. N., Pomeroy, J. W., and Martz, L. W.: Estimating evaporation in a Prairie landscape under drought conditions, Can. Water Resour. J., 35, 173–186, 2010.
Armstrong, R. N., Pomeroy, J. W., and Martz, L. W.: Variability in evaporation across the Canadian Prairie region during drought and non-drought periods, J. Hydrol., 521, 182–195, https://doi.org/10.1016/j.jhydrol.2014.11.070, 2015.
Borchert, J. R.: The climate of the central north American grassland, Ann. Assoc. Am. Geogr., 40, 1–39, https://doi.org/10.1080/00045605009352020, 1950.
Bush, E. and Lemmen, D. S.: Canada's Changing Climate Report, Government of Canada, Ottawa, ON, https://changingclimate.ca/CCCR2019 (last access: 29 September 2023), 2019.
Cordeiro, M. R. C., Wilson, H. F., Vanrobaeys, J., Pomeroy, J. W., and Fang, X.: Simulating cold-region hydrology in an intensively drained agricultural watershed in Manitoba, Canada, using the Cold Regions Hydrological Model, Hydrol. Earth Syst. Sci., 21, 3483–3506, https://doi.org/10.5194/hess-21-3483-2017, 2017.
Cordeiro M. R. C., Liang K., Wilson H. F., Vanrobaeys J., Lobb D. A., Fang, X., and Pomeroy, J. W.: Simulating the hydrological impacts of land use conversion from annual crop to perennial forage in the Canadian Prairies using the Cold Regions Hydrological Modelling platform, Hydrol. Earth Syst. Sci., 26, 5917–5931, https://doi.org/10.5194/hess-26-5917-2022, 2022.
Costa, D., Shook, K., Spence, C., Elliott, J., Baulch, H., Wilson, H., and Pomeroy, J. W.: Predicting Variable Contributing Areas, Hydrological Connectivity, and Solute Transport Pathways for a Canadian Prairie Basin, Water Resour. Res., 56, e2020WR02798, https://doi.org/10.1029/2020WR027984, 2020.
Fang, X. and Pomeroy, J. W.: Snowmelt runoff sensitivity analysis to drought on the Canadian prairies, Hydrol. Process., 2274, 2594–2609, https://doi.org/10.1002/hyp.6796, 2007.
Fang, X. and Pomeroy, J. W.: Modelling blowing snow redistribution to prairie wetlands, Hydrol. Process., 23, 2557–2569, https://doi.org/10.1002/hyp.7348, 2009.
Fang, X., Pomeroy, J. W., Westbrook, C. J., Guo, X., Minke, A. G., and Brown, T.: Prediction of snowmelt derived streamflow in a wetland dominated prairie basin, Hydrol. Earth Syst. Sci., 14, 991–1006, https://doi.org/10.5194/hess-14-991-2010, 2010.
Forbes, K. A., Kienzle, S. W., Coburn, C. A., and Byrne, J. M., Rasmussen, J.: Simulating the hydrological response to predicted climate change on a watershed in southern Alberta, Canada, Climatic Change, 105, 555–576, https://doi.org/10.1007/s10584-010-9890-x, 2011.
Granger, R. J. and Gray, D. M.: A net radiation model for calculating daily snowmelt in open environments, Nord. Hydrol., 21, 217–234, 1990.
Gray D. M.: Handbook on the Principles of Hydrology, Water Information Center, Inc. Port, Washington, NY, ISBN 9780912394077, ISBN 0912394072, 1970.
Gray, D. M., Toth, B., Zhao, L., Pomeroy, J. W., and Granger, R. J.: Estimating areal snowmelt infiltration into frozen soils, Hydrol. Process., 15, 3095–3111, 2001.
He, Z. and Pomeroy, J. W.: Assessing hydrological sensitivity to future climate change in the Canadian southern boreal forest, J. Hydrol., 624, 129897, https://doi.org/10.1016/j.jhydrol.2023.129897, 2023.
He, Z., Pomeroy, J. W., Fang, X., and Peterson, A.: Sensitivity analysis of hydrological processes to perturbed climate in a southern boreal forest basin, J. Hydrol., 601, 126706, https://doi.org/10.1016/j.jhydrol.2021.126706, 2021.
He, Z., Shook, K., Spence, C., Pomeroy, J., and Whitfield, C.: Virtual Watershed Model Simulations for Typified Prairie Watersheds in Seven Basin Classes, Federated Research Data Repository [code and data set], https://doi.org/10.20383/103.0815, 2023.
Jiang, R., Gan, T. Y., Xie, J., Wang, N., and Kuo, C.: Historical and potential changes of precipitation and temperature of Alberta subjected to climate change impact: 1900–2100, Theor. Appl. Climatol., 127, 725–739, 2017.
Johnson, W. C. and Poiani, K. A.: Climate Change Effects on Prairie Pothole Wetlands: Findings from a Twenty-five Year Numerical Modeling Project, Wetlands, 36, 273–285, https://doi.org/10.1007/s13157-016-0790-3, 2016.
Johnson, W. C., Millett, B. V., Gilmanov, T., Voldseth, R. A., Guntenspergen, G. R., and Naugle, D. E.: Vulnerability of northern prairie wetlands to climate change, Bioscience, 55, 863–872, https://doi.org/10.1641/0006-3568(2005)055[0863:VONPWT]2.0.CO;2, 2005.
Kienzle, S. W., Nemeth, M. W., Byrne, J. M., and MacDonald, R. J.: Simulating the hydrological impacts of climate change in the upper North Saskatchewan River basin, Alberta, Canada, J. Hydrol., 412–413, 76–89, https://doi.org/10.1016/j.jhydrol.2011.01.058, 2012.
Leibowitz, S. G. and Vining, K. C.: Temporal connectivity in a prairie pothole complex, Wetlands, 23, 13–25, 2003.
López-Moreno, J. I., Pomeroy, J. W., Alonso-González, E., Morán-Tejeda, E., and Revuelto, J.: Decoupling of warming mountain snowpacks from hydrological regimes, Environ. Res. Lett., 15, 114006, https://doi.org/10.1088/1748-9326/abb55f, 2020.
MacDonald, R. J., Byrne, J. M., Boon, S., and Kienzle, S. W.: Modelling the Potential Impacts of Climate Change on Snowpack in the North Saskatchewan River Watershed, Alberta, Water Resour. Manage., 26, 3053–3076, https://doi.org/10.1007/s11269-012-0016-2, 2012.
Mahmood, T. H., and Pomeroy, J. W., Wheater, H. S., and Baulch, H. M.: Hydrological responses to climatic variability in a cold agricultural region, Hydrol. Process., 31, 854–870, https://doi.org/10.1002/hyp.11064, 2017.
Mekis, É. and Vincent, L. A.: An overview of the second generation adjusted daily precipitation dataset for trend analysis in Canada, Atmos.-Ocean., 49, 163–177, 2011.
Millett, B., Johnson, W. C., and Guntenspergen, G.: Climate trends of the North American prairie pothole region 1906–2000, Climatic Change, 93, 243–267, https://doi.org/10.1007/s10584-008-9543-5, 2009.
Muhammad, A., Evenson, G. R., Stadnyk, T. A., Boluwade, A., Jha, S. K., and Coulibaly, P.: Impact of model structure on the accuracy of hydrological modeling of a Canadian Prairie watershed, J. Hydrol. Reg. Stud., 21, 40–56, https://doi.org/10.1016/j.ejrh.2018.11.005, 2019.
Pomeroy, J., Fang, X., and Ellis, C.: Sensitivity of snowmelt hydrology in Marmot Creek, Alberta, to forest cover disturbance, Hydrol. Process., 26, 1891–1904, 2012.
Pomeroy, J. W., Gray, D. M., and Landine, P. G.: The Prairie Blowing Snow Model: characteristics, validation, operation, J. Hydrol., 144, 165–192, 1993.
Pomeroy, J. W., Gray, D. M., Shook, K. R., Toth, B., Essery, R. L. H., Pietroniro, A., and Hedstrom, N.: An evaluation of snow accumulation and ablation processes for land surface modelling, Hydrol. Process., 12, 2339–2367, 1998.
Pomeroy, J. W., Gray, D. M., Brown, T., Hedstrom, N. R., Quinton, W., Granger, R. J., and Carey, S.: The cold regions hydrological model: a platform for basing process representation and model structure on physical evidence, Hydrol. Process., 21, 2650–2667, 2007.
Pomeroy, J. W., Fang, X., Westbrook, C., Minke, A., Guo, X., and Brown, T.: Prairie Hydrological Model Study Final Report, Centre for Hydrology Report No. 7, University of Saskatchewan, Saskatoon, 113 pp., https://research-groups.usask.ca/hydrology/documents/pubs/papers/pomeroy_et_al_2009_2.pdf (last access: 29 September 2023), 2010.
Pomeroy, J. W., Fang, X., Shook, K., and Whitfield, P. H.: Predicting in ungauged basins using physical principles obtained using the deductive, inductive, and abductive reasoning approach, in: Putting Prediction in Ungauged Basins into Practice, edited by: Pomeroy, J. W., Spence, C., and Whitfield, P. H., Canadian Water Resources Association, 41–62, https://research-groups.usask.ca/hydrology/documents/pubs/papers/pomeroy_et_al_2013_3.pdf (last access: 29 September 2023), 2013.
Pomeroy, J. W., Shook, K., Fang, X., Dumanski, S., Westbrook, C., and Brown, T.: Improving and testing the prairie hydrological model at Smith Creek Research Basin, Centre for Hydrology Report No.14. May, 2014.
Pomeroy, J. W., Brown, T., Fang, X., Shook, K. R., Pradhananga, D., Armstrong, R., Harder, P., Marsh, C., Costa, D., Krogh, S. A., Aubry-Wake, C., Annand, H., Lawford, P., He, Z., Kompanizare, M., and Lopez-Moreno, J. I.: The Cold Regions Hydro- logical Modelling Platform for hydrological diagnosis and prediction based on process understanding, J. Hydrol., 615, 128711, https://doi.org/10.1016/j.jhydrol.2022.128711, 2022.
Rasouli, K., Pomeroy, J. W., and Whitfield, P. H.: Hydrological Responses of Headwater Basins to Monthly Perturbed Climate in the North American Cordillera, J. Hydrometeorol., 20, 863–882, https://doi.org/10.1175/JHM-D-18-0166.1, 2019.
Rasouli, K., Pomeroy, J. W., and Whitfield, P. H.: The sensitivity of snow hydrology to changes in air temperature and precipitation in three North American headwater basins, J. Hydrol., 606, 127460, https://doi.org/10.1016/j.jhydrol.2022.127460, 2022.
Samuel, J., Coulibaly, P., and Kollat, J.: CRDEMO: Combined regionalization and dual entropy-multiobjective optimization for hydrometric network design, Water Resour. Res., 49, 8070–8089, https://doi.org/10.1002/2013WR014058, 2013.
Sauchyn, D., Davidson, D., and Johnston, M.: Prairie Provinces, in: Chap. 4 in Canada in a Changing Climate: Regional Perspectives Report, https://changingclimate.ca/regional-perspectives/chapter/4-0/ (last access: 29 September 2023), 2017.
Schaake, J. C.: From climate to flow, in: Climate change and U.S. water resources, edited by: Waggoner, P. E., John Wiley and Sons Inc., New York, USA, 177–206, ISBN 978-0471618386, 1990.
Shahabul Alam, M. and Elshorbagy, A.: Quantification of the climate change-induced variations in Intensity-Duration-Frequency curves in the Canadian Prairies, J. Hydrol., 527, 990–1005, https://doi.org/10.1016/j.jhydrol.2015.05.059, 2015.
Shaw, D. A., Vanderkamp, G., Conly, F. M., Pietroniro, A., and Martz, L.: The Fill-Spill Hydrology of Prairie Wetland Complexes during Drought and Deluge, Hydrol. Process., 26, 3147–3156, https://doi.org/10.1002/hyp.8390, 2012.
Shook, K., Pomeroy, J. W., Spence, C., and Boychuk, L.: Storage dynamics simulations in prairie wetland hydrology models: Evaluation and parameterization, Hydrol. Process., 27, 1875–1889, https://doi.org/10.1002/hyp.9867, 2013.
Shook, K., Pomeroy, J., and van der Kamp, G.: The transformation of frequency distributions of winter precipitation to spring streamflow probabilities in cold regions; case studies from the Canadian Prairies, J. Hydrol., 521, 395–409, https://doi.org/10.1016/j.jhydrol.2014.12.014, 2015.
Spence, C., He, Z., Shook, K., Mekonnen, B., Pomeroy, J., Whitfield, C., and Wolfe, J.: Assessing hydrological sensitivity of grassland basins in the Canadian Prairies to climate using a basin classification-based virtual modelling approach, Hydrol. Earth Syst. Sci., 26, 1801–1819, https://doi.org/10.5194/hess-26-1801-2022, 2022a.
Spence, C., He, Z., Shook, K., Pomeroy, J., Whitfield, C., and Wolfe, J.: Assessing runoff sensitivity of North American Prairie Pothole Region basins to wetland drainage using a basin classification-based virtual modelling approach, Hydrol. Earth Syst. Sci., 26, 5555–5575, https://doi.org/10.5194/hess-26-5555-2022, 2022b.
St-Jacques, J. M., Andreichuk, Y., Sauchyn, D. J., and Barrow, E.: Projecting Canadian Prairie Runoff for 2041–2070 with North American Regional Climate Change Assessment Program (NARCCAP) Data, J. Am. Water Resour. Assoc., 54, 660–675, https://doi.org/10.1111/1752-1688.12642, 2018.
Tanzeeba, S. and Gan, T. Y.: Potential impact of climate change on the water availability of South Saskatchewan River Basin, Climatic Change, 112, 355–386, https://doi.org/10.1007/s10584-011-0221-7, 2012.
Tarnoczi, T.: Transformative learning and adaptation to climate change in the Canadian Prairie agro-ecosystem, Mitig. Adapt. Strateg. Glob. Change, 16, 387–406, https://doi.org/10.1007/s11027-010-9265-7, 2011.
Unduche, F., Tolossa, H., Senbeta, D., and Zhu, E.: Evaluation of four hydrological models for operational flood forecasting in a Canadian Prairie watershed, Hydrolog. Sci. J., 63, 1133–1149, https://doi.org/10.1080/02626667.2018.1474219, 2018.
Valeo, C., Xiang, Z., Bouchart , F. J.-C., Yeung, P., and Ryan, M. C.: Climate Change Impacts in the Elbow River Watershed, Can. Water Resour. J., 32, 285–302, https://doi.org/10.4296/cwrj3204285, 2007.
Van Hoy, D. F., Mahmood, T. H., Todhunter, P. E., and Jeannotte, T. L.: Mechanisms of Cold Region Hydrologic Change to Recent Wetting in a Northern Glaciated Landscape, Water Resour. Res., 56, 1–28, https://doi.org/10.1029/2019WR026932, 2020.
Wheater, H. and Gober, P.: Water security in the Canadian Prairies: Science and management challenges, Philos. T. Roy. Soc. A, 371, 1–21, https://doi.org/10.1098/rsta.2012.0409, 2013.
Whitfield, P. H., Shook, K. R., and Pomeroy, J. W.: Spatial patterns of temporal changes in Canadian Prairie streamflow using an alternative trend assessment approach, J. Hydrol., 582, 124541, https://doi.org/10.1016/j.jhydrol.2020.124541, 2020.
Withey, P. and van Kooten, G. C.: The effect of climate change on optimal wetlands and waterfowl management in Western Canada, Ecol. Econ., 70, 798–805, https://doi.org/10.1016/j.ecolecon.2010.11.019, 2011.
Wolfe, J. D., Shook, K. R., Spence, C., and Whitfield, C. J.: A watershed classification approach that looks beyond hydrology: Application to a semi-arid, agricultural region in Canada, Hydrol. Earth Syst. Sci., 23, 3945–3967, https://doi.org/10.5194/hess-23-3945-2019, 2019.
Zhang, H., Huang, G. H., Wang, D., and Zhang, X.: Uncertainty assessment of climate change impacts on the hydrology of small prairie wetlands, J. Hydrol., 396, 94–103, https://doi.org/10.1016/j.jhydrol.2010.10.037, 2011.
Zhang, Z., Bortolotti, L. E., Li, Z., Armstrong, L. M., Bell, T. W., and Li, Y.: Heterogeneous Changes to Wetlands in the Canadian Prairies Under Future Climate, Water Resour. Res., 57, 1–16, https://doi.org/10.1029/2020WR028727, 2021.