the Creative Commons Attribution 4.0 License.
the Creative Commons Attribution 4.0 License.
 | 20 Sep 2023
An advanced tool integrating failure and sensitivity analysis into novel modeling of the stormwater flood volume
Francesco Fatone
Bartosz Szeląg
Przemysław Kowal
Arthur McGarity
Adam Kiczko
Grzegorz Wałek
Ewa Wojciechowska
Michał Stachura
Nicolas Caradot
An innovative tool for modeling the specific flood volume was presented that can be applied to assess the need for stormwater network modernization as well as for advanced flood risk assessment. Field measurements for a catchment area in Kielce, Poland, were used to apply the model and demonstrate its usefulness. This model extends the capability of recently developed statistical and machine learning hydrodynamic models developed from multiple runs of the US Environmental Protection Agency (EPA) Storm Water Management Model (SWMM). The extensions enable the inclusion of (1) the characteristics of the catchment and its stormwater network, calibrated model parameters expressing catchment retention, and the capacity of the sewer system; (2) extended sensitivity analysis; and (3) risk analysis. Sensitivity coefficients of calibrated model parameters include correction coefficients for percentage area, flow path, depth of storage, and impervious area; Manning roughness coefficients for impervious areas; and Manning roughness coefficients for sewer channels. Sensitivity coefficients were determined with respect to rainfall intensity and characteristics of the catchment and stormwater network. Extended sensitivity analysis enabled an evaluation of the variability in the specific flood volume and sensitivity coefficients within a catchment, in order to identify the most vulnerable areas threatened by flooding. Thus, the model can be used to identify areas particularly susceptible to stormwater network failure and the sections of the network where corrective action should be taken to reduce the probability of system failure. The simulator developed to determine the specific flood volume represents an alternative approach to the SWMM that, unlike current approaches, can be calibrated with limited topological data availability; therefore, the aforementioned simulator incurs a lower cost due to the lower number and lower specificity of data required.
- Article
(6222 KB) - Full-text XML
-
Supplement
(6773 KB) - BibTeX
- EndNote


-
A simulator to determine the specific flood volume is developed as an alternative to the SWMM model.
-
A sensitivity analysis extension considering rainfall and catchment topological data is employed.
-
The probability of failure of the stormwater system is used as a criterion to determine the necessity for corrective action under conditions of uncertainty.
Climate change and urbanization are the main factors increasing the pressure on the functioning of sewer networks, in particular the components responsible for stormwater management (Miller et al., 2014; Hettiarachchi et al., 2018; Lama et al., 2021a; Khan et al., 2022). This results in an increase in the frequency and volume of stormwater flooding, a deterioration in the living standards of the inhabitants, and pipe abrasion (Jiang et al., 2018; Zhou et al., 2019; Chang et al., 2020; Lense et al., 2023). Data from the literature (Siekmann et al., 2011) show that the basis for making decisions regarding the necessity for corrective action (replacement of a pipe, removal of sediments, construction of a reservoir, etc.) is the specific flood volume, which represents the volume of stormwater flooding on a unit of impervious surface. Limiting values for the specific flood volume have been determined by Siekmann and Pinnekamp (2011), based on simulations for urban catchments, as the basis for the maintenance of the sewage network and the criteria for making decisions regarding modernization or the necessity for corrective action.
In order to obtain the required hydraulic efficiencies, simulation models are typically used to plan corrective action (Kirshen et al., 2015). For this purpose, mechanistic models (MCMs) are used, such as the US Environmental Protection Agency (EPA) Storm Water Management Model (SWMM), which accounts for surface runoff, drainage of the sewage network, and stormwater flooding during system overload (Guo et al., 2021; Yang et al., 2022; Lama et al., 2021b). As is the case with other mechanistic models (e.g., MOUSE, PCSWMM, and MIKE URBAN), SWMM can incorporate the spatial characteristics and hydraulic conditions of a sewage network into calculations that predict and characterize stormwater flooding (Martins et al., 2018; Yang and Chui, 2021; Ma et al., 2022). However, such models are characterized by high specificity (one model can be used for one catchment), and they require the collection of detailed data and measurements (rainfall and runoff), which is labor-intensive and generates a high cost. Moreover, there are a strong interactions between the calibrated parameters (Wu et al., 2013; L. Chen et al., 2018; Sonavane et al., 2020; Shrestha et al., 2022; Ray et al., 2023), leading to uncertainty in simulation results (Ball, 2020; Kobarfard et al., 2022; Sun et al., 2022) and, thus, complicating the selection of specified corrective action (Kim et al., 2015; Babovic et al., 2018; Hung and Hobbs, 2019). To solve this problem, an important step in the development of the computational algorithm is the implementation of sensitivity analysis (Fraga et al., 2016; Cristiano et al., 2019; Razavi and Gupta, 2019). Simulations by Szeląg et al. (2021a) have shown the influence of uncertainty in calibrated SWMM parameters on the calculation of the specific flood volume and degree of flooding; this finding has also been confirmed by the simulations of Fraga et al. (2016) and Kelleher et al. (2017).
To overcome the limitations of MCMs, the implementation of statistical and/or machine learning (ML) methods is a prospective alternative (Rosenzweig et al., 2021; Lei et al., 2021; Bui et al., 2018; Shafizadeh-Moghadam et al., 2018; Chen et al., 2019; Yang and Chui, 2021; Mohammad et al., 2023). ML methods can estimate the specific stormwater flood volume for a catchment area with different topology. So far, however, no simulator model based on statistical and/or machine learning has been developed to simulate the specific stormwater flood volume while also considering the factors included in MCMs (Mignot et al., 2019; Guo et al., 2021; Rosenzweig et al., 2021). Nevertheless, some progress in the application of ML methods to the simulation of stormwater flooding has been made. Thorndahl (2009), based on simulation results of flooding from sewer utility holes, including the uncertainty in calibrated parameters, developed a model using the FORM (first-order reliability model) method. Jato-Espino et al. (2018) and Li and Willems (2020), conducting simulations with MCMs, presented (logistic regression) models for the identification of flooding from a single sewer utility hole based on rainfall frequency and catchment and stormwater network characteristics. Therefore, Szeląg et al. (2022a, b) proposed a model to calculate estimates of stormwater flooding in a catchment; however, due to the insufficient data used to construct the model, its application is limited. In the aforementioned models, interactions between land use, catchment and stormwater network characteristics, and system capacity were neglected. However, omitting these factors at the spatial planning stage reduces the applicability of the model.
Another important indicator of proper sewage network management is the assessment of the risk of system failure (exceedance of the maximum specific flood volume). Reliable risk assessment requires the integration of mechanistic models, a statistical approach, and simulation of rainfall data (Fu et al., 2011; Zhou et al., 2019; Venvik et al., 2021). Most of the methods (Ursino, 2014; Cea and Costabile, 2022; Taromideh et al., 2022) focus on determining the impact of changes in rainfall due to climate change on the efficiency of the sewage system and include the impact of parameters expressing terrain and sewer retention. Currently, there is no effective method of risk analysis that considers the uncertainty in the calibrated parameters used to simulate the specific flood volume for the different urban catchments.
The aim of this article was to develop an innovatory simulator, considering rainfall data and catchment characteristics and topology, that could be combined with risk assessment and sensitivity analyses to calculate the specific flood volume. Recognition of the above factors enabled the application of the proposed logistic regression model to the identification of stormwater flooding in catchments with different characteristics, as an alternative approach to the SWMM model. An important aspect of the proposed approach was the risk assessment of system failure (a specific flood volume exceeding 13 m3 ha−1) and sewage system operation under uncertainty. Moreover, the methodology presented here, integrated with the stormwater flooding simulator, enabled the identification of the impact of calibrated SWMM parameters on the results of the sensitivity analysis in catchments with different characteristics. This feature enables the construction of a mechanistic model, thereby allowing the appropriate selection of techniques for measuring input data, which can ultimately reduce the cost of applying the model. The developed methodology also enables the appropriate selection of devices for measuring the flow rate as well as their location in the sewage network in the context of calibrating the catchment model and reducing the cost of flow measurements.
The analyzed urban catchment is located in the southeastern part of Kielce in the Świętokrzyskie region, central Poland (Fig. 1). Residential districts, public buildings, and main and side streets are located in the study area. The catchment area covers 63 ha and consists of 40 % impervious and 60 % permeable areas. The road density is 108 m ha−1 (Wałek, 2019), and the terrain denivelation is 11.20 m (the ordinates of the highest and the lowest points of the terrain are 271.20 and 260 m above sea level, respectively).
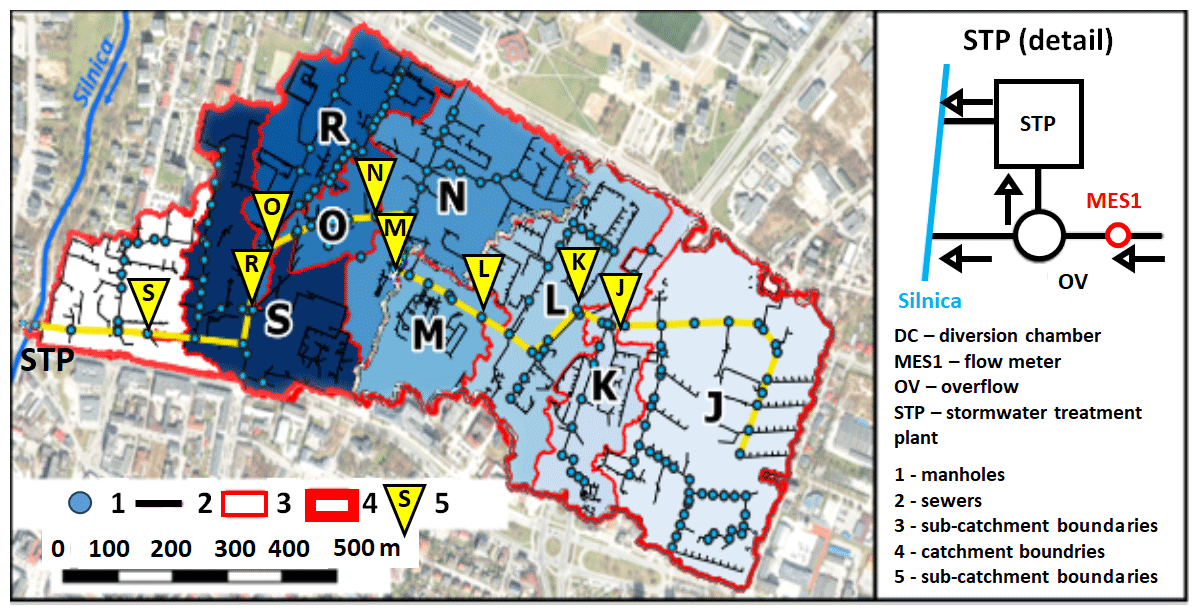
Figure 1Study catchment area (Wałek, 2019).
The length of the main interceptor channel in the stormwater network is 1569 m, with an average slope of 0.71 %. The diameter of the main interceptor channel expands from 600 to 1250 mm, while the diameters of side sewers vary between 300 and 1000 mm. The slopes of the sewers vary between 0.04 % and 3.90 %. The analyzed stormwater system is separated from the municipal sewage. Stormwater flows to the division chamber (DC); it then flows into a stormwater treatment plant (STP) after reaching a depth of 0.42 m. During heavy rainfall, when the stormwater level in the DC exceeds the overflow level (OV), it is discharged by the storm overflow into the S1 channel, which transports the stormwater directly to the Silnica River (without treatment). At a distance of 3.0 m from the inlet of the main interceptor channel to the DC, the MES1 flow meter is installed; this flow meter measures the flow rates during heavy rainfall with a resolution of 1 min. Analysis of data from 2010 to 2020 showed that the measured flow rates varied between 1 and 9 dm3 s−1 during dry periods, indicating that infiltration occurs in the stormwater network. Measurements of stormwater network operation carried out between 2008 and 2019 indicated that stormwater flooding occurs in the analyzed catchment. Considering 159 episodes of rainfall–runoff within four catchments, 23 cases of flooding were observed. At a distance of 2.5 km from the catchment boundary, a rainfall measurement station is located that provides constant measurement of rainfall, with a 1 min temporal resolution.
Subcatchment division and characteristics
The analyzed catchment was divided into subcatchments (Szeląg et al., 2022a) that constituted the study areas for the identification of stormwater flooding. Due to the limited number of rainfall data, the obtained model for the simulation of stormwater overflow did not include all of the important factors, such as the dry-period duration between rainfall events and catchment retention, that impact flooding phenomenon; this meant that the model had a limited predictive capability. A detailed description of the subcatchments used for the construction of the flooding identification model and the justification of their selection were presented in Szeląg et al. (2022b). In reference to the approach proposed by Duncan et al. (2012), Jato-Espino et al. (2018), and Li and Willems (2020), the number of subcatchments used for the development of a logit model was increased to eight in the current analysis (Fig. 2). The subcatchments' boundaries and data on the spatial development and stormwater network (Table 1) were determined based on maps for design purposes, which were discussed in detail in Szeląg (2013).
Table 1Characteristics of subcatchments.
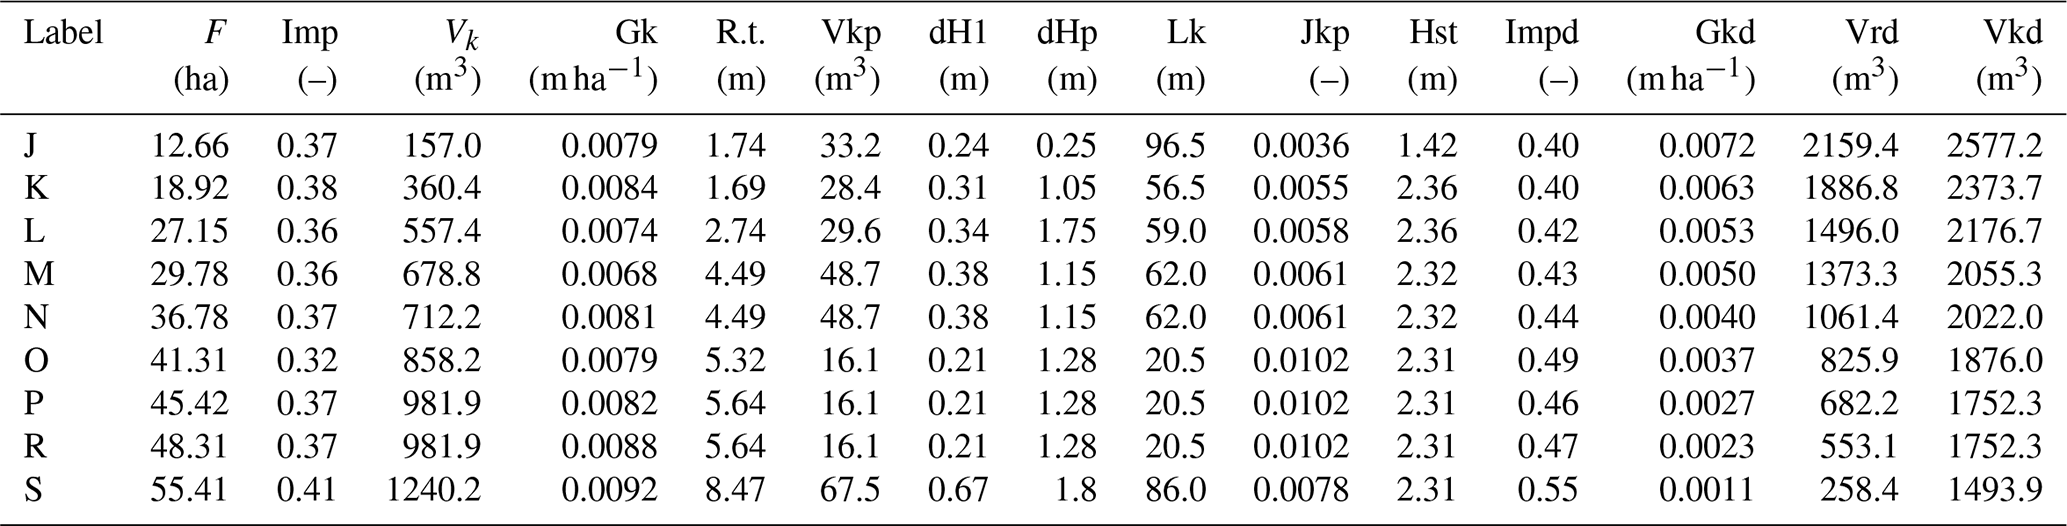
The characteristics listed in the table are as follows: F – catchment surface area; Imp – impervious area; Vk – volume of stormwater channel; Gk – length of stormwater channel per impervious area of the catchment; R.t. – height difference of the channel; Vkp – volume of the channel above the cross-section of a catchment; dH1 – height difference of the terrain at section above cross-section r; dHp – height difference at section above cross-section; Lk – length of channel above cross-section of a catchment; Jkp – channel slope above cross-section of a catchment; Hst – the height of a sewer utility hole at cross-section; Imp – impervious area of downstream area; Gkd – length of a channel per impervious area below cross-section; Vrd – catchment retention above the cross-section, calculated as Vrd = ; and Vkd – total retention of a catchment.
Data were verified using an independent analysis performed by Wałek (2019), who used the QGIS program to construct a spatial development model and stormwater network for Kielce. The location of closing cross-sections of subcatchments (J, K, L, M, M, O, P, R, and S) along the main interceptor channel were additionally supported by the simulation results of outflow hydrographs developed by Wałek (2019), with use of the Hydrologic Engineering Center – Hydrologic Modeling System (HEC-HMS) model, as well as by Szeląg et al. (2016, 2022b), with use of the SWMM.
3.1 A criterion for stormwater system operation and modernization
The value of the specific flood volume was defined as the stormwater flooding per unit paved area, which can be expressed using the following formula (Siekmann and Pinnekamp, 2011):
Here, Vt is the volume of stormwater flooding from the ith sewer utility hole of the stormwater network, K is the number of sewer utility holes, and Apav is paved area. Siekmann and Pinnekamp (2011), based on continuous simulations with hydrodynamic models for three urban catchments, found that the specific flood volume ranged from 0 to >20 m3 ha−1.
On this basis, they established a limiting κ value that expressed the need to improve the operating conditions of the drainage system. Specifically, they showed that a κ>13 m3 ha−1 inferred that the drainage system requires adaptation. This was also confirmed by the calculations of Kotowski et al. (2013) for a catchment in Wroclaw and by Szeląg et al. (2021a) for a catchment in Kielce. This allows us to conclude that the κ value quoted above can be used as a decision-making criterion for urban catchments (e.g., in Poland and Germany) with respect to the necessity for corrective action on the drainage network.
3.2 Simulator structure and development
The concept of the proposed tool – a simulator integrated with risk assessment and a sensitivity analysis – to evaluate the operation of a sewage system is presented in Fig. 2. Applying the MCM of an urban catchment with separate subcatchments (varying land use and topology), a specific flood volume simulator was developed as an alternative approach to the SWMM. A logistic regression model simulator based on rainfall data, catchment and stormwater network characteristics, and SWMM parameters (width of runoff path, retention depth of impervious areas, the Manning roughness coefficient of impervious areas, the correction coefficient of impervious areas, and the Manning roughness coefficient of channels) was proposed. The resulting tool enables fast analysis of sewer network performance, even with limited data access, and can be applied to other catchments. The proposed methodology is based on the extension of algorithms given by Szeląg et al. (2021a, 2022a). In contrast to previous studies (Szeląg et al., 2022b), the current approach considers the retention of the catchment and the sewer network, and the performance criterion of the sewer network was the volume of flooding, not just the fact that it occurred. Integration of the simulator with an analytical relationship for sensitivity coefficient calculations for logistic regression allows fast evaluation of the impact of MCM parameters on flooding for arbitrary catchment characteristics and topological data.
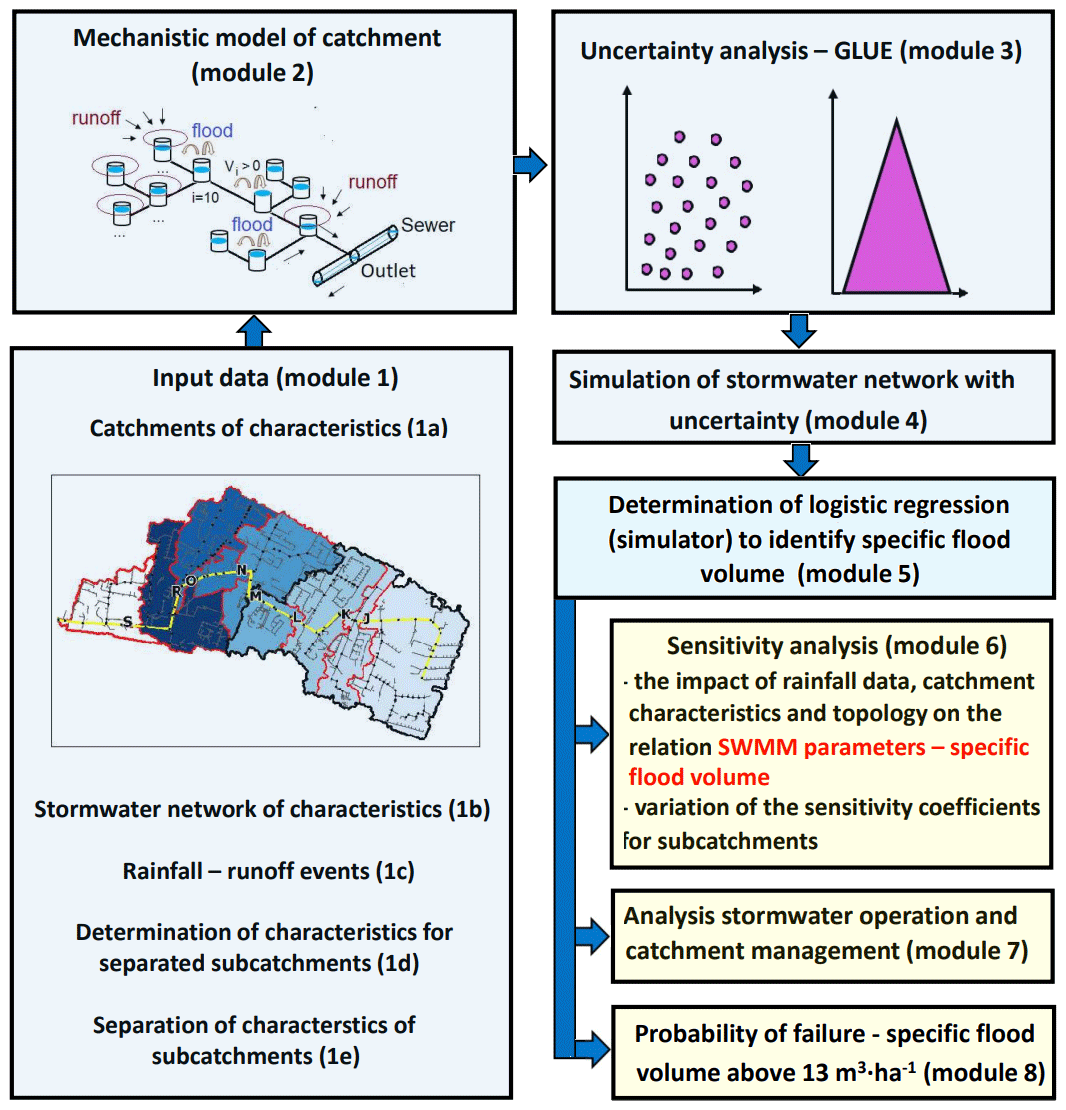
Figure 2Algorithm for developing an advanced tool to simulate the specific flood volume (situation maps in module 1a and 1b by Walek, 2019).
In order to provide more reliable simulation results, the proposed risk assessment considered the uncertainty in the SWMM parameters and enabled the optimization of the operation of the sewer network based on the maximum allowable values of the channel Manning roughness coefficients.
3.3 Algorithm structure
The proposed computation algorithm consists of eight modules. Modules 1, 2, 3, and 4 include identical steps to those in the work of Szeląg et al. (2021a, 2022a). In the present study, the scope of the analyses was extended: in addition to precipitation data and SWMM parameters (Szeląg et al., 2022a), the characteristics of the catchment and the stormwater network of the separated subcatchments were also included (module 1), which were used to determine the computational model. On the basis of spatial data (module 1a and 1b), a mechanistic model of the catchment was built (module 2), which allowed one to perform an uncertainty analysis using the generalized likelihood uncertainty estimation (GLUE) method (module 3). On this basis, simulations were performed in separated subcatchments for rainfall events (module 1e) under uncertainty (module 4). Based on the simulation results, a logistic regression model was developed (module 5) to calculate the local sensitivity coefficients for calibrated SWMM parameters, with respect to rainfall intensity and catchment characteristics (module 6). Modules 1, 2, 3, and 4 included analyses to determine a specific flood volume simulator that could be applied to any catchment. Thus, future algorithm implementation for the new catchment will ultimately only include modules 6, 7, and 8. Using adopted rainfall data, the sensitivity coefficients of the SWMM model parameters for subcatchments are computed, and maps showing sensitivity changes at the catchment scale are drawn (module 6). While the model is applied to identify stormwater flooding, the possible methods to improve stormwater network operation are analyzed inside modules 7 and 8. Computations using the developed algorithm consist of the following steps and substeps:
- 1.
Input data are collected (catchment characteristics – module 1a; stormwater network characteristics – module 1b; rainfall–runoff episodes – module 1c), independent rainfall episodes are separated (module 1d), and the characteristics of subcatchments are divided and determined (module 1e).
- 2.
A hydrodynamic model is developed (module 2) based on catchment characteristics (module 1a) and stormwater network characteristics (module 1b).
- 3.
An uncertainty analysis is conducted with the GLUE method (Sect. 3.3.3) using a hydrodynamic model of a catchment based on rainfall–runoff episodes (module 1d).
- 4.
Using independent rainfall events (module 1d), simulations with a hydrodynamic model, including the uncertainty in the calibrated parameters, are conducted according to the following points (4a, 4b, and 4c).
- a.
SWMM parameters (a posteriori distribution), shown in Table S1, are simulated using the results of uncertainty analysis.
- b.
Stormwater network operation during independent rainfall events is simulated (module 1d) including uncertainty (module 4a).
- c.
Specific flood volume in each sample of independent rainfall events in subcatchments is computed, and the determined κ values are transformed to classification data (Sect. 4a).
- a.
- 5.
The logistic regression simulator SWMM of the specific flood volume is determined as an alternative to MCMs based on the results of the computations undertaken in point 4c.
- 6.
A sensitivity analysis is carried out according to the following points (6a and 6b).
- a.
Sensitivity coefficients (with respect to SWMM parameters) are computed for assumed rainfall data and catchment characteristics.
- b.
Sensitivity coefficients for subcatchments (J, K, L, M, N, O, P, R, and S) are computed.
- a.
- 7.
The developed logistic regression model for the amelioration of stormwater network operation is applied.
- a.
The impact of corrective variants on sensitivity coefficients in subcatchments is analyzed.
- a.
- 8.
An analysis of failures occurrence is carried out.
3.3.1 The determination of independent rainfall events (module 1e)
The determination of independent rainfall events for the 2010–2021 period was based upon criteria defined in the German Association for Water, Wastewater, and Waste (DWA) guidelines (DWA-A118E, 2006). The minimum time period between independent rainfall events was set as 4.0 h. Computation of stormwater flooding was performed for rainfall events with a minimum depth of Pt=5.0 mm (Fu and Butler, 2014) and only for those events that resulted from convectional rainfall (i.e., rainfall duration of less than 120 min). For the analyzed catchment, it was indicated that stormwater flooding occurs for C=2, 3, and 5 and rainfall duration tr=120 min (Szeląg et al., 2021a). The computed value of the specific flood volume (the upper limit of the 95 % confidence interval) was κ=45 m3 ha−1. Analyzing of the rainfall data, it was observed that the number of rainfall events with depths of Pt=5.2–42 mm ranged from 12 to 30 each year (210 rainfall events altogether), while the rainfall duration was between tr=15–120 min.
3.3.2 Hydrodynamic catchment model (module 2)
Stormwater flood volume calculations were performed with the SWMM using the “Flooding” function (Szeląg et al., 2021b). Based on the results of Q(t) for j – sewer utility holes (j=1, 2, 3 …, k) in the subcatchments (J, K, L, M, N, O, P, R, and S), the total flood volume was determined, which allowed specific flood volume (κ) values to be determined from Eq. (1).
The model of the analyzed catchment covers 62 ha and is divided into 92 subcatchments with areas varying from 0.12 to 2.10 ha and impervious areas ranging from 5 % to 95 %. The model comprises 82 nodes and 72 sections of channels. At the “trial-and-error” stage of the calibration method, the mean retention of the catchment was 4.60 mm. The Manning coefficient of impervious areas was found to be 0.025 m s, whereas this value was 0.10 m s for permeable areas. The flow path width was determined using the following formula: , where α=1.35. Catchment model calibration performed by Szeląg et al. (2021a) indicated that a very good fit of modeling outflow hydrographs to measurement results was obtained for six rainfall–runoff events (Nash–Sutcliffe coefficient of 0.85–0.98, coefficient of determination of 0.85–0.99, and hydrograph volumes and maximum flows did not exceed 5 % compared to measurement data).
3.3.3 Uncertainty analysis – GLUE (module 3)
In the GLUE method, the identification of model parameters was considered to be a probabilistic task due to the large number of parameters characterizing processes occurring in urban catchments (e.g., runoff, infiltration, flow in stormwater conduits, and flooding) (Szeląg et al., 2021a; Kiczko et al., 2018). The identification of model parameters in the GLUE method depends on the transformation of an a priori distribution to an a posteriori distribution by means of a likelihood function that determines the probability of a combination of parameters depending on the quality of the fit of the calculation result to the measured values. A uniform distribution of the SWMM parameters was assumed (Table S1). Mathematical models used for the description of surface runoff usually do not include the runoff distribution; at most, they include the range of admissible values of parameters resulting from their physical interpretation (Dotto et al., 2014; Knighton et al., 2016). The identification of distributions a posteriori and the determination of likelihood functions for the rainfall–runoff episodes on 30 May 2010 and 8 July 2011 were used, and the episodes on 15 September 2010 and 30 July 2010 were applied for verification. Subsequent computation steps of the GLUE analysis are discussed in detail in the Supplement (Sect. S1).
3.3.4 The simulation of stormwater network operation with respect to uncertainty (module 4)
Based on the results of the GLUE method (a posteriori distribution of the SWMM parameters, 5000 samples), the computation of the stormwater network was performed separately for 175 independent rainfall events and 9 subcatchments; 35 events were used to validate the model. The specific flood volume values for subcatchments (J, K, L, M, N, O, P, R, and S) were calculated, and zero–one variables were established to develop the logistic regression model. For the computed specific flood volume values (κ≥13 m3 ha−1), the variable value was denoted as one, whereas this value was zero in the opposite case (Siekmann and Pinekamp, 2011).
3.3.5 Developing a logistic regression model (simulator) to identify the specific flood volume (module 5)
A logistic regression model (LRM) is a tool used for classification. This model has already been applied to model stormwater flooding (Szeląg et al., 2020), identify stormwater flooding from sewer utility holes (Jato-Espino et al., 2018), and determine the technical condition of sewage systems (Salman and Salem, 2012). The logistic regression model is described by the following equation:
Here, pm is the probability of a specific flood volume (understood as the need for corrective action on the stormwater network); α0 is an absolute term; α1, α2, α3, and αi are values of coefficients estimated with the maximum likelihood method; X is the vector describing the linear combination of the independent variables; Xrain/XSWMM/XCatchm is the vector describing linear combination of statistically significant
-
rainfall characteristics (,
-
SWMM parameters (,
-
and catchment and stormwater network characteristics (confidence level − 0.05 (); and xi represents independent variables describing rainfall characteristics, such as rainfall depth, rainfall duration, the parameters calibrated in the SWMM, and the catchment characteristics (e.g., permeability; terrain retention; density of stormwater network; and length, slope, and retention in stormwater channels).
Independent variables in the LRM were calculated using the forward stepwise algorithm, recommended for the creation of such models. At the same time, this also ensures the elimination of correlated independent variables (Harrell, 2001). The estimation of the αi coefficients in Eq. (2) and, thus, the determination of the LRM involved two stages: learning (80 %) and testing (20 %). Optimization of the pm threshold and equations for determining measures of fit between computational results and measurements are provided in the Supplement (Sect. S2). In this study, 35 independent rainfall events, for which Pt=6.0–15.0 mm and tr=30–120 min, were assumed for model validation. For validation of the LRM, catchments J, O, and S were selected; in these catchments, the catchment (Imp and Impd) and topology network (Gk, Gkd, and Jkp) characteristics were varied in the interaction scheme. At the variant-generation step, combinations of two inputs were used to verify the model, the values of which were changed using a three-point scheme, −0.2, 0, and +0.2.
3.3.6 Sensitivity analysis (module 6)
According to data from the literature (Morio, 2011), despite simplifications, local sensitivity analysis is widely applied at the calibration stage and while analyzing the hydrodynamic catchment models. In our study, the sensitivity coefficient was calculated from the following equation (Petersen et al., 2002):
Here, knowing that , after transformations, the following formula was obtained (Fatone et al., 2021):
The value of Sxi was calculated for calibrated SWMM parameters (Table S1) while simultaneously analyzing the impact of rainfall duration (tr=30–90 min) for a rainfall depth of Pt=10 mm (representative value for analyzing stormwater network functioning according to DWA-A118E, 2006, corresponding to a heavy-rainfall event). For the above assumptions, Sxi was determined for different catchment characteristics, which helped to evaluate the interactions between rainfall data and the SWMM parameters.
The probability of a specific flood volume (pm) was computed using the LRM for the subcatchment characteristics defined in Table 2 and SWMM parameters established during calibration (Szeląg et al., 2016) for a maximum convectional rainfall intensity for tr=30 min and Pt=9.62 mm for Kielce (Sect. S4). The calculations of Szeląg et al. (2022b) proved that there is a hydraulic overload of the stormwater system due to convective rainfall in the urban catchment in question. At the same time, the sensitivity coefficients for the calibrated SWMM model parameters were calculated. On this basis, the spatial variability in Sxi for the subbasins was determined.
3.3.7 Application of the LRM to analyze stormwater operation and catchment management (module 8)
If the stormwater network ceases to function properly and the threshold value of pm is exceeded, some possible improvements have been suggested, including the following: (a) increasing the retention depth of impervious areas, i.e., an increase of dimp from 2.50 to 3.50 mm, while concurrently raising the Manning roughness coefficient from nimp=0.025 to 0.035 m s and (b) increasing the hydraulic capacity by reducing the Manning roughness coefficient for stormwater channels from nsew=0.018 to 0.012 m s. In addition, the possible change in the spatial development of the urban catchment area was taken into consideration. Finally, combinations of the abovementioned computation variants were analyzed. When the values of independent variables (catchment characteristics) adopted for the calculations exceeded the lower/upper limit of applicability of the determined LRM (e.g., for Imp = 0.32–0.41), the simulation results were verified with the MCM. The verification procedure consisted of three steps:
- a.
The probability of a specific flood volume for rainfall with durations in the range of tr=30–90 min was computed to assess stormwater network operation.
- b.
Simulation was carried out with a calibrated hydrodynamic model for rainfall data as in step a.
- c.
A comparison of the computation results obtained in steps a and b was undertaken; in the event of a good fit, i.e., proper identification of the specific flood volume, the results obtained from the LRM can be accepted. Three specific corrective variants have been defined, as presented in Table S2.
3.3.8 Probability of stormwater network failure (module 9)
The probability of failure (Sun et al., 2022; Karamouz and Nazif, 2013) was used to analyze the performance of the sewage network during a rainfall event. In the calculations, a failure was defined as an episode (assumed rainfall data, catchment characteristics, sewer network, and SWMM parameters described by the a posteriori distribution – GLUE results discussed in Sect. 3.3.3) in which κ≥13 m3 ha−1 () is exceeded. However, the probability of failure was calculated using the following equation:
Here, pm is the probability of a specific flood volume (exceedance of this value indicates a failure), pF is the probability of stormwater network failure in the event of rainfall, and Zj is a function describing stormwater network operation. For the latter, Zj=1 denotes that the drainage system requires modernization, whereas Zj=0 denotes that modernization is not necessary.
Based on Eq. (5) for the assumed characteristics (rainfall, catchment, and drainage network), the operating conditions of the stormwater network were determined. Hence, an algorithm is given to calculate the performance improvement of a sewer network in the context of failure probability (pF) reduction. The above effect was obtained by introducing thresholds for the maximum permissible values of the Manning roughness coefficients of sewers (nsew(m)). It was assumed that, if the value of nsew (the value from the a posteriori distribution) exceeds the maximum permissible value (nsew(m)) and determines the occurrence of failure (Zj=1) and the need to modernize the sewers, it should be corrected in such a way that . The above calculations were reduced to the following steps:
- a.
The a posteriori distribution of the calibrated SWMM model parameters was established (N=5000 samples).
- b.
The probability of a specific flood volume for N items and the establishment of failure probability were computed.
- c.
The Manning roughness coefficient for channels when was computed as
where k=1, 2, 3, …, m represents the calibrated SWMM model parameters; k=1, 2, 3, …, m; and represents the estimated coefficient in the LRM for the Manning roughness coefficient for channels (the derivation of Eq. 6 is presented in Sect. S4 in the Supplement).
- d.
An empirical distribution describing the nsew values calculated from Eq. (6) is established.
- e.
The nsew values from Eq. (6) for nsew(un)≤nsew(m) are computed. Here, nsew(un) represents the Manning roughness coefficients of channels computed in step a, and nsew(m) denotes the maximal boundary (threshold) value of the Manning roughness coefficient for channels, when nsew(un)≥nsew(m) to nsew=nsew(un).
- f.
The probability of a specific flood volume and the probability of failure (pF) are computed.
- g.
The empirical distribution (cumulative distribution function, CDF) for nsew is computed.
- h.
Steps e to g are repeated; r=1, 2, 3, …, z for different values of nsew,max, and median values of nsew(0.5)=f(nsew(m), r) are denoted based on empirical distributions.
- i.
Steps a to h are conducted for different catchment characteristics.
- j.
A graph of pF=f(nsew(0.5)) is drawn.
4.1 Uncertainty analysis – GLUE (module 3)
Based on SWMM simulation results including the uncertainty in the calibrated parameters (Table S1), the likelihood functions were determined (Kiczko et al., 2018). For the observed events (30 May 2010 and 8 July 2011) used to identify the SWMM parameters, it was found that 96 % of the measurement points included the calculated confidence interval. For the validation sets, 90 % of the observation points fall within the bands for the 15 September 2010 event and 70 % fall within the bands for the 30 July 2010 event (Fig. S1). The results of the likelihood function calculations for the calibrated SWMM model parameters are given in Figs. S2 and S3 in the Supplement.
4.2 Simulations of stormwater network operation with respect to uncertainty (module 4)
The results of variation in the specific flood volume for the separate subcatchments are presented in Fig. 3. Based on the obtained curves, it was stated that the uncertainty in the SWMM parameters influenced the simulation results, which was confirmed by the great variability in the 1st and 99th percentile values for each subcatchment. The median values enabled one to identify that the largest specific flood volume was for subcatchment J (14.90 m3 ha−1), followed by subcatchment S (8.29 m3 ha−1) (Fig. 3). The simulation results for the 1st percentiles showed that, for the adopted rainfall events (Pt>5.0 mm and tr<150 min), stormwater flooding occurred in all subcatchments.
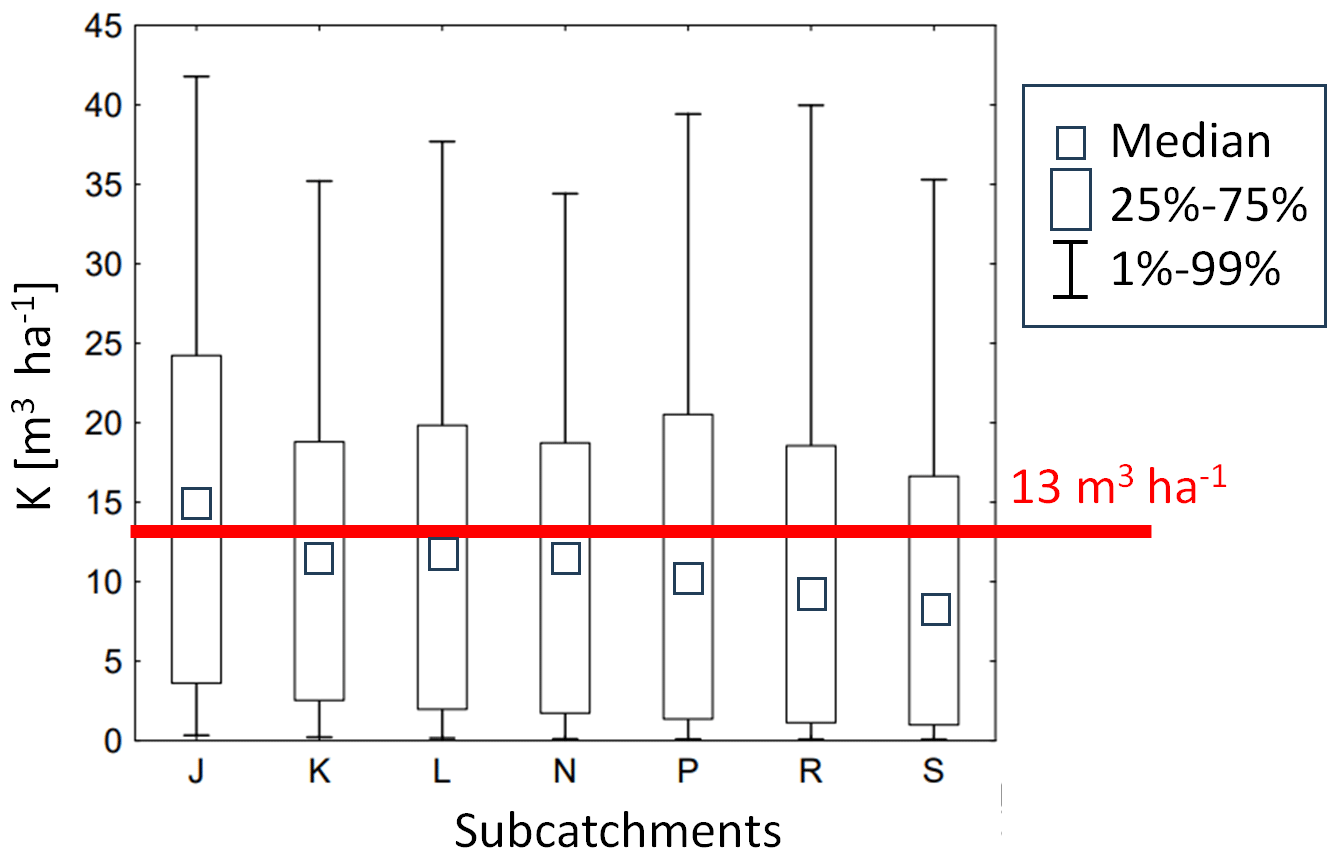
It was demonstrated that problems with the operation of the stormwater network are present in each subcatchment, as the calculated values of the (75th and 99th) percentiles are higher than 13 m3 ha−1. This indicates that the stormwater network requires modernization.
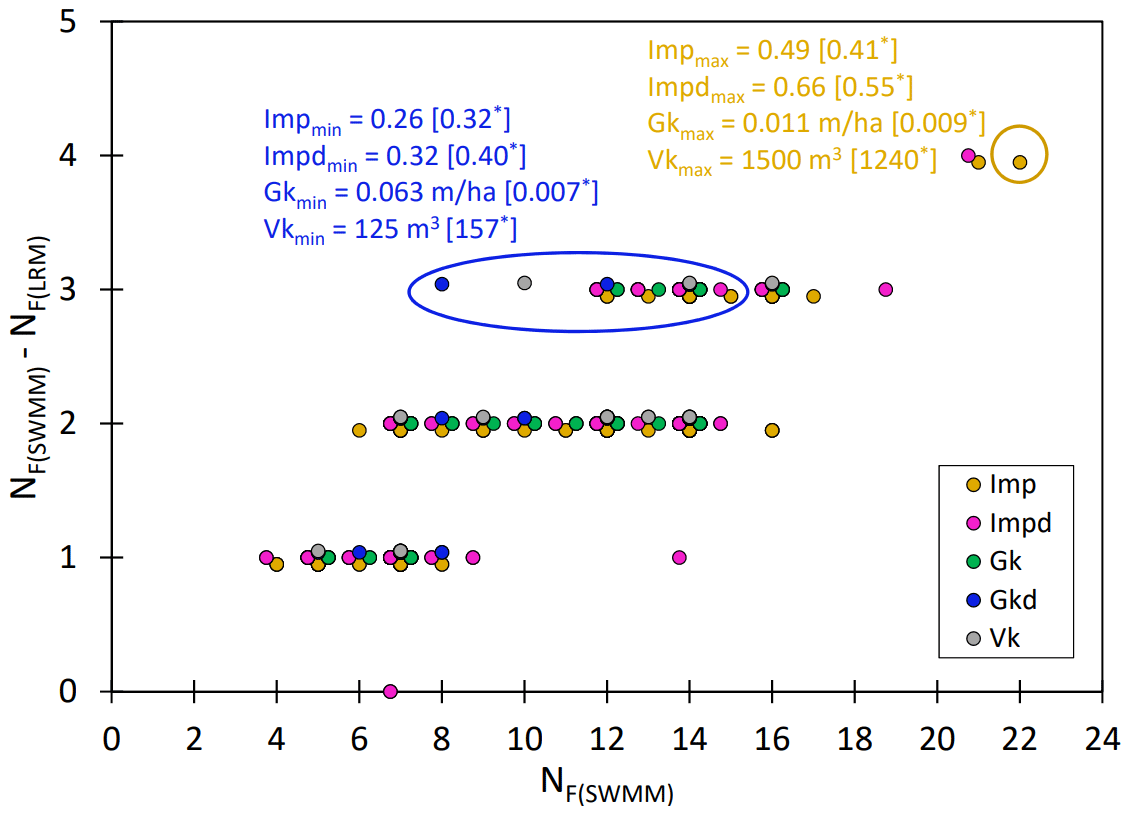
Figure 4Comparison of LRM and SWMM simulation results for the number of episodes in which the specific flood volume was greater than 13 m3 ha−1. In this figure, NF(SWMM) represents the prediction of SWMM; NF(LRM) represents the prediction of LRM; ∗ denotes the minimum and maximum values of the catchment characteristics, representing the topology of the stormwater network in Table 1, where yellow is the upper limit of the model and blue is the lower limit of the model.
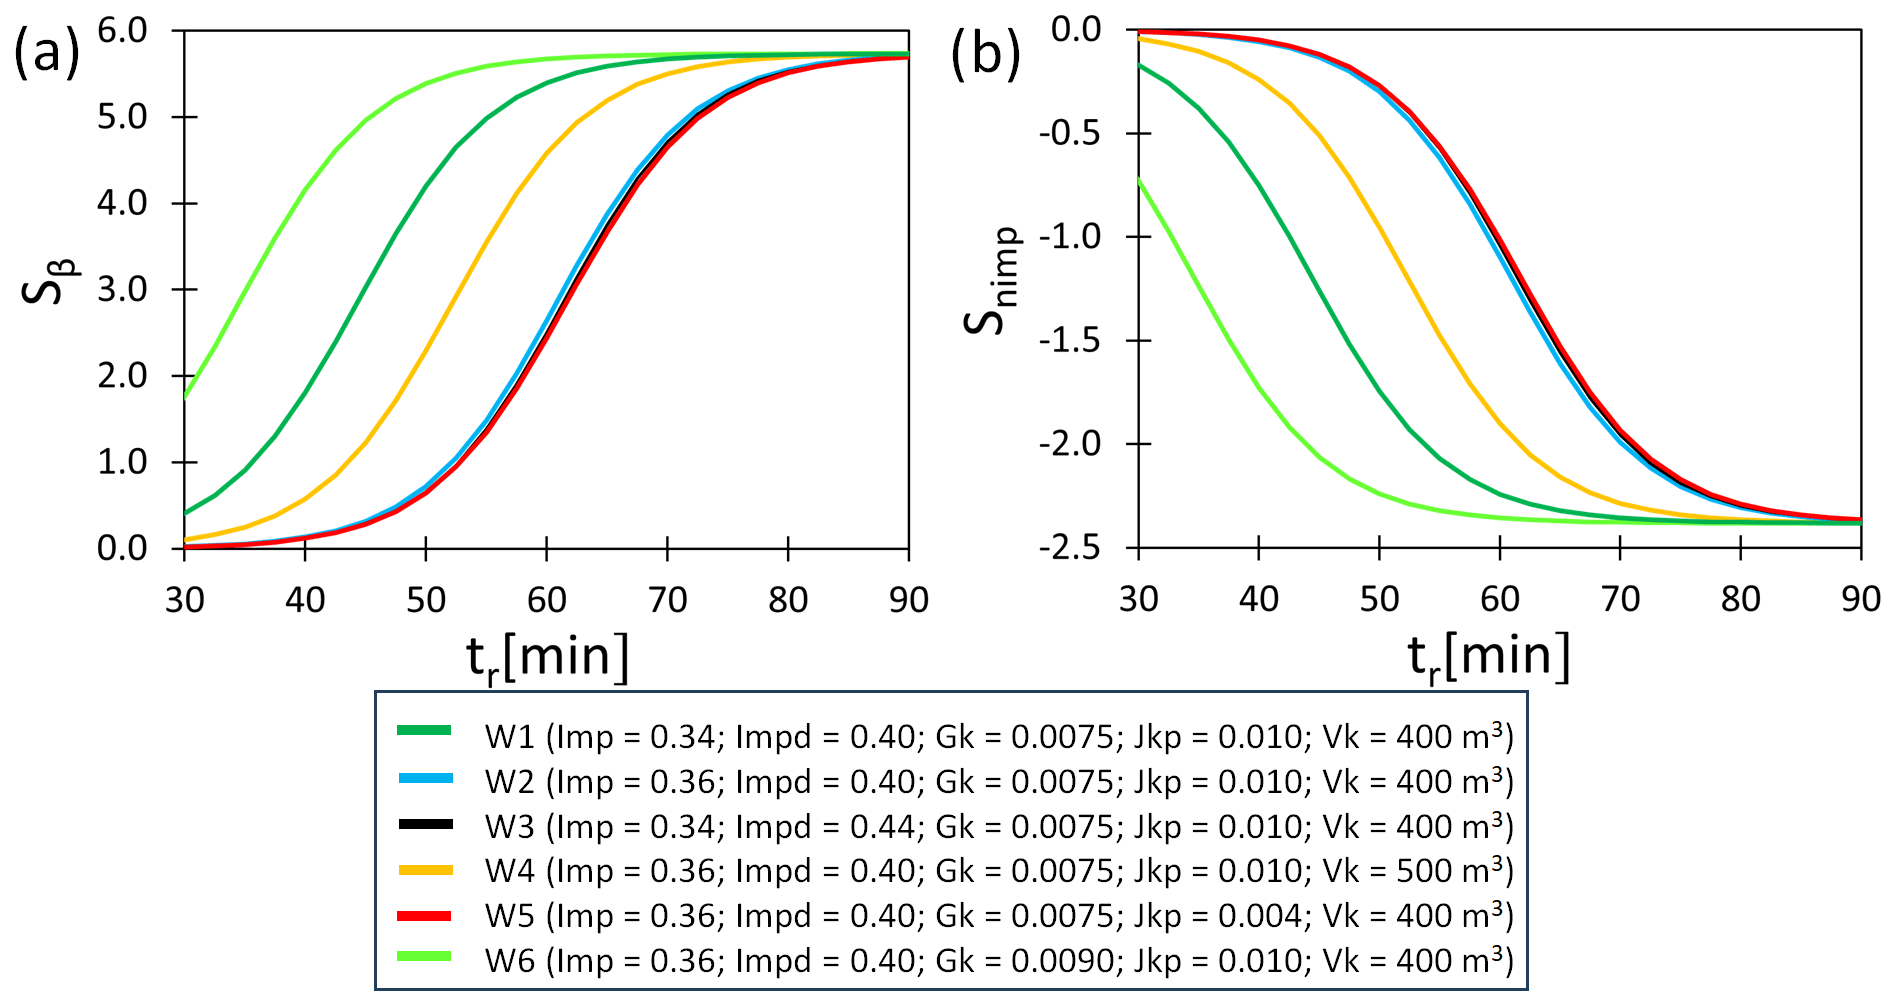
Figure 5The impact of rainfall duration (tr) and catchment characteristics (Imp, Impd, Vk, and Jkp) on sensitivity coefficients: (a) Sβ and (b) .
4.3 Determination of the LRM (module 5)
An LRM was built based on the operational simulation of the stormwater network. The model can be used to identify the specific flood volume and for decision-making regarding corrective action on the stormwater system. The relationship from Eq. (2) was described by the following linear combination:
For other independent variables (Table S2), the determined coefficients were statistically insignificant in prediction confidence band 0.05. Standard deviations in the coefficients estimated from the LRM and the test probabilities are presented in Table S2. The best fit of the computed results to the measurement data was obtained for . For the test data set (20 %), the following values were obtained: SPEC = 95.24 %, SENS = 84.62 %, and Acc = 87.87 % (where SPEC, SENS, and Acc denote specificity, sensitivity, and accuracy, respectively).
For the determined independent variables (Eqs. 7, 8), calculations were performed with the LRM and SWMM models (for 35 rainfall events, Pt≥5 mm and tr≤120 min), assuming values of catchment characteristics and topological data within ±0.2 in the separated subcatchments. The results of the validation of the developed model for the identification of the specific flood volume are given in Tables S5–S11 in the Supplement. The results obtained confirm that the determined LRM model can be applied to a wider range than that shown in Table 1. In the range of NF(SWMM)= (0–6), the relative difference in the number of episodes when κ≥13 m3 ha−1 did not exceed 20 %; for , the corresponding value was 15 %–33 % (Fig. 4).
The maximum difference between the LRM and SWMM simulations () was obtained for Imp = 0.49, Impd = 0.66, Gk = 0.011 m ha−1, and Vk=1500 m3, which correspond to the extreme values of the catchment characteristics and the topology of the sewer network. Verification results showed that the maximum difference in the number of events when κ>13 m3 ha−1 using the ML model and SWMM for Imp = 0.26–0.50, Impd = 0.32–0.66, Gk = 0.0068–0.011 m3 ha−1, and Gkd = 0.0009–0.0013 m3 ha−1 did not exceed four episodes (Fig. 4). The calculations performed confirm the good fit of the calculations with measurements of the number of episodes when the specific flood volume exceeds 13 m3 ha−1.
4.4 Sensitivity analyses (module 6)
For a rainfall depth of Ptot=10 mm and rainfall duration of tt=30–90 min, the sensitivity coefficients for the SWMM were determined based on Eq. (4). For the calculation of Sxi, the values established during calibration were adopted (Kiczko et al., 2018). The computation results for two parameters of the SWMM (β and nimp) are presented in Fig. 5.
These two parameters appeared to have the most significant impact on the specific flood volume and, at the same time, they present a vastly different impact on the dynamics of changes regarding Sxi=f(tr, Imp, Impd, Vk, and Jkp); the calculation results for the other SWMM model parameters are given in Figs. S4–S8 in the Supplement. Figures 5 and S4–S8 indicated that, for the adopted values of tr, Imp, Impd, Vk, and Jkp, the highest values of Sxi were obtained for correction coefficient percentage of impervious areas (β), the Manning roughness coefficient for sewer channels (nsew), and the Manning roughness coefficient for impervious areas (nimp). The retention depth of impervious areas (dimp) had the lowest impact on the results of the specific flood volume. An increase in the rainfall duration results in higher values of Sβ and (Fig. 5). The lowest sensitivity coefficients were obtained for tr=30 min, whereas the highest values were obtained for tr=90 min. An increase in the Imp and Impd results in a decrease in the Sβ and sensitivity coefficients. For instance, an increase in Imp from 0.34 to 0.36 results in a decrease in Sβ from 1.23 to 0.28; identical values were obtained for Impd (Fig. 5). Moreover, an increase in Vk, Jkp, and Gk leads to an increase in the Sβ and sensitivity coefficients. Among the analyzed catchment characteristics, the density of the stormwater network (Gk) had the highest impact on the sensitivity coefficients, whereas the longitudinal slope of the canal (Jkp) was of the lowest significance; these results are confirmed by the variability in the obtained curves for the subsequent SWMM parameters (Fig. 5). For example, when Vk increased from 400 to 500 m3, Sβ increased from 0.29 to 0.82. Additionally, a 10 % growth in Sβ was observed due to a change from Jkp = 0.004 to Jkp = 0.010. Finally, when Gk increased from 0.0075 to 0.009, Sβ also increased from 0.29 to 3.03 (Fig. 5).
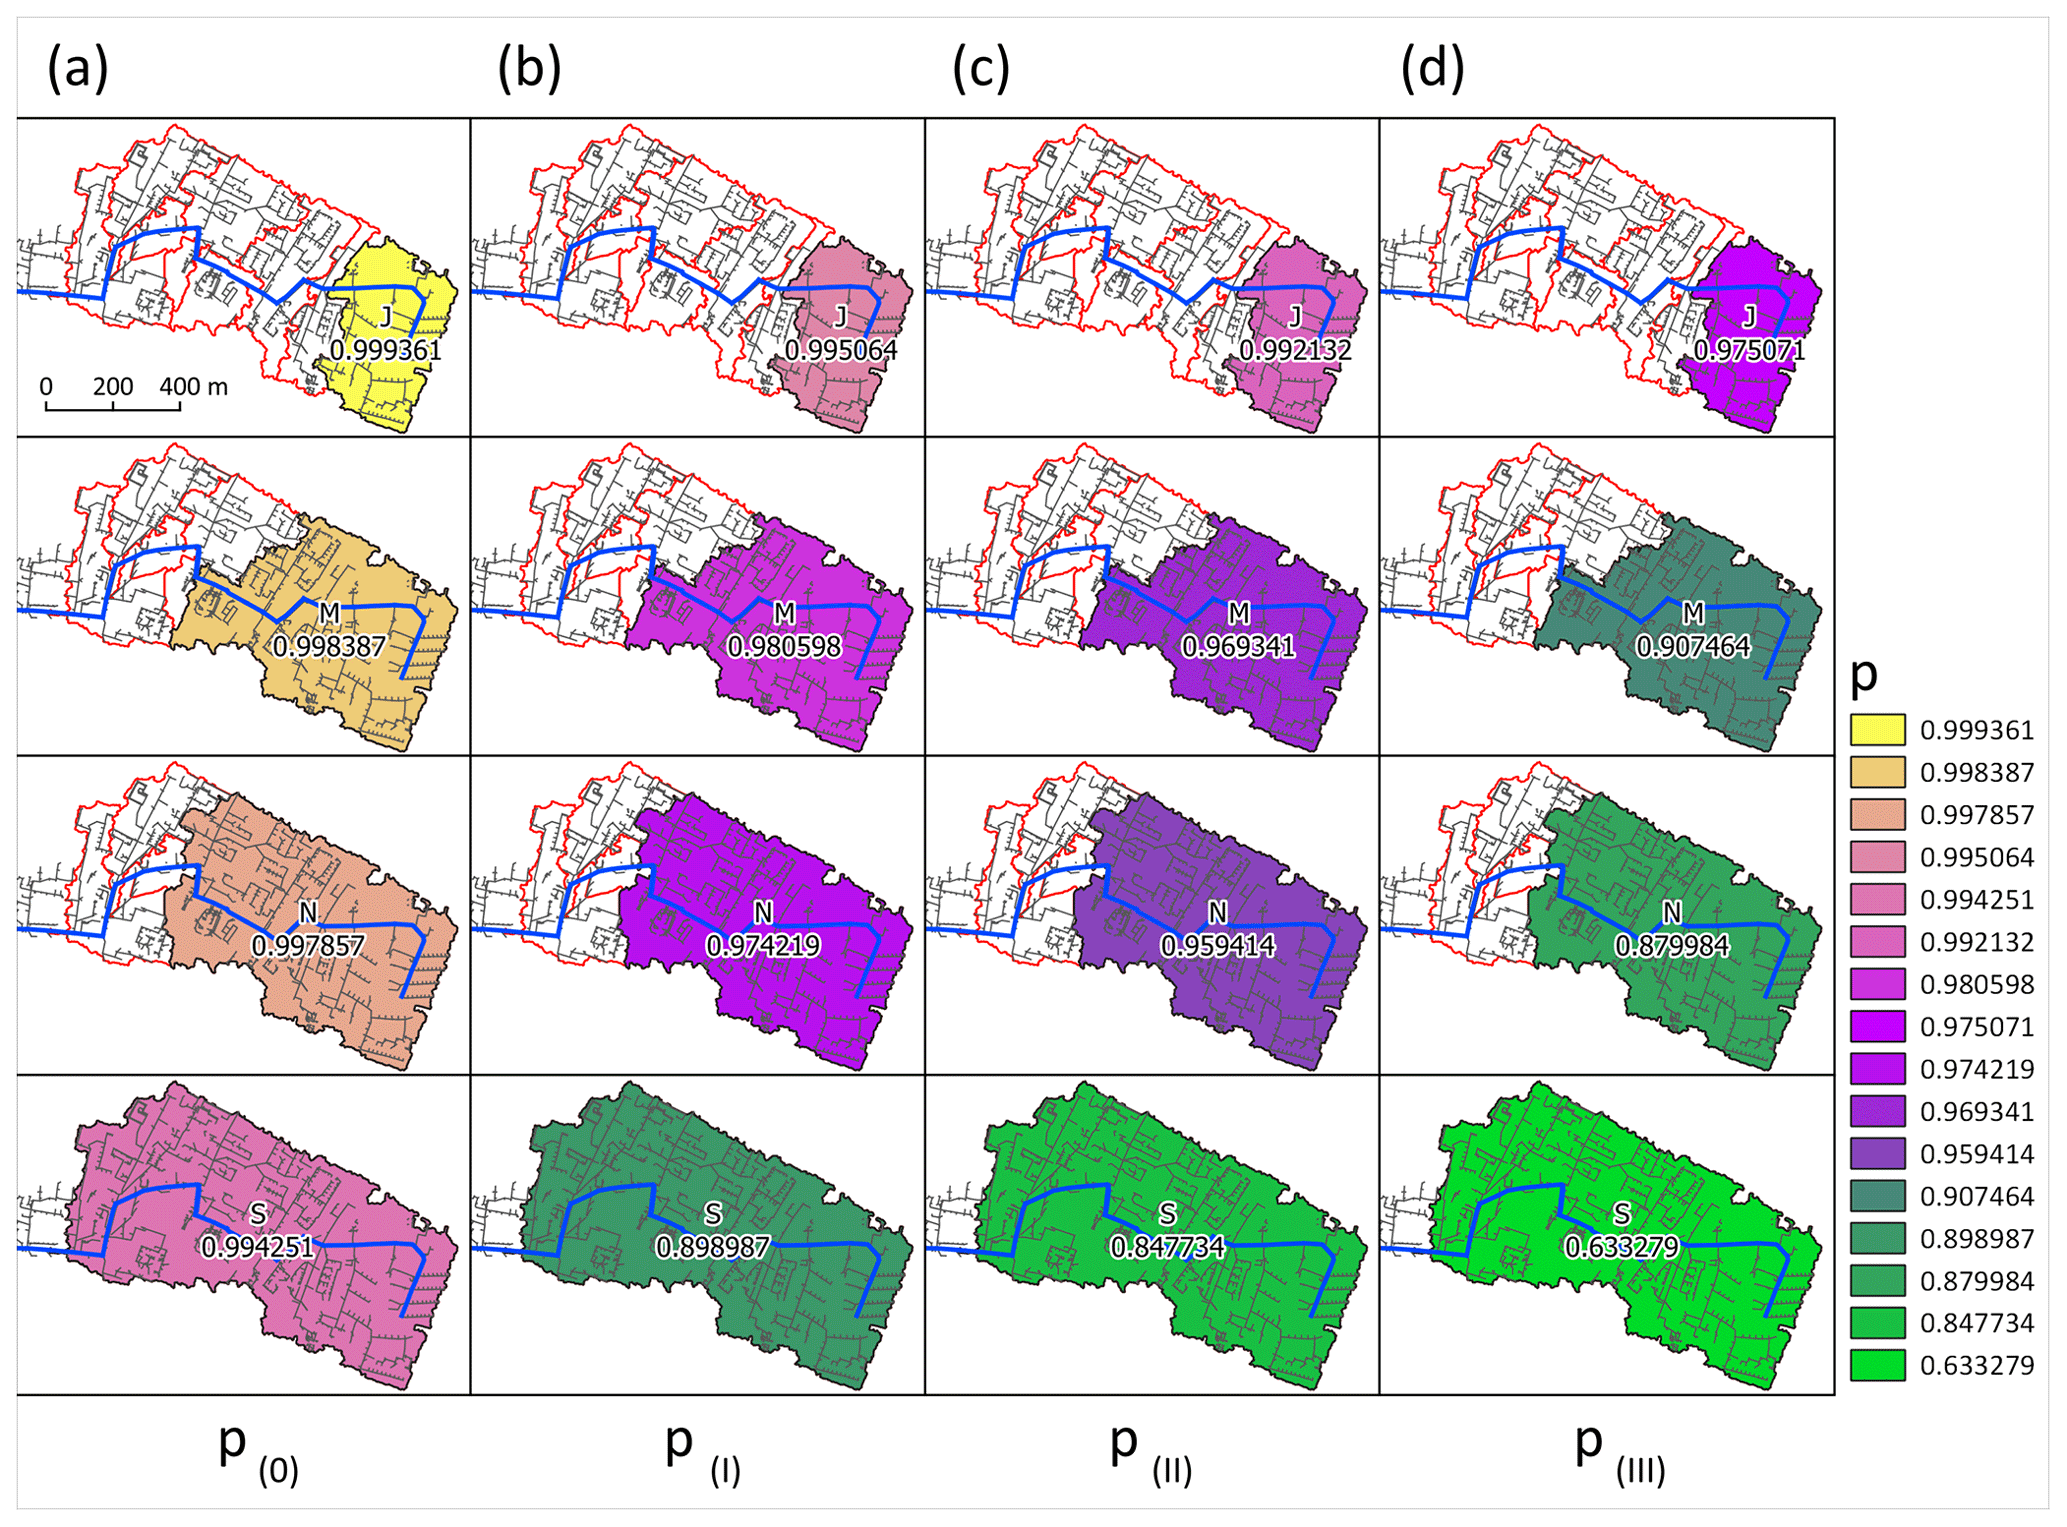
Figure 6Probability of a specific flood volume in subcatchments for the (a) present state (p0) and for the (b) I, (c) II, and (d) III corrective action variants.
4.5 Implementation of logit model to analyze the operation of the stormwater network and catchment management (module 7 and 8)
Due to the fact that an exceedance of specific flood volume was observed in the analyzed stormwater network, possible improvements to the network were considered in terms of correcting catchment imperviousness (Imp) and enhancing terrain retention and channel capacity. The results of pm computations are presented in Fig. 6, while Fig. 7 shows Sβ for variants I, II, and III for subcatchments.
Simulation results for the sensitivity coefficients of other SWMM model parameters (Table S1) and the probability of specific flood volumes are presented in Figs. S9–S17 in the Supplement. A 10 % decrease in Imp in subcatchment J has a negligible impact on the pm value, whereas it results in a 10 % decrease in the specific flood volume probability in subcatchment S (Fig. 6a, b). It was found that a decrease in catchment imperviousness (variant I) leads to improvement in stormwater system operation (Fig. 6).
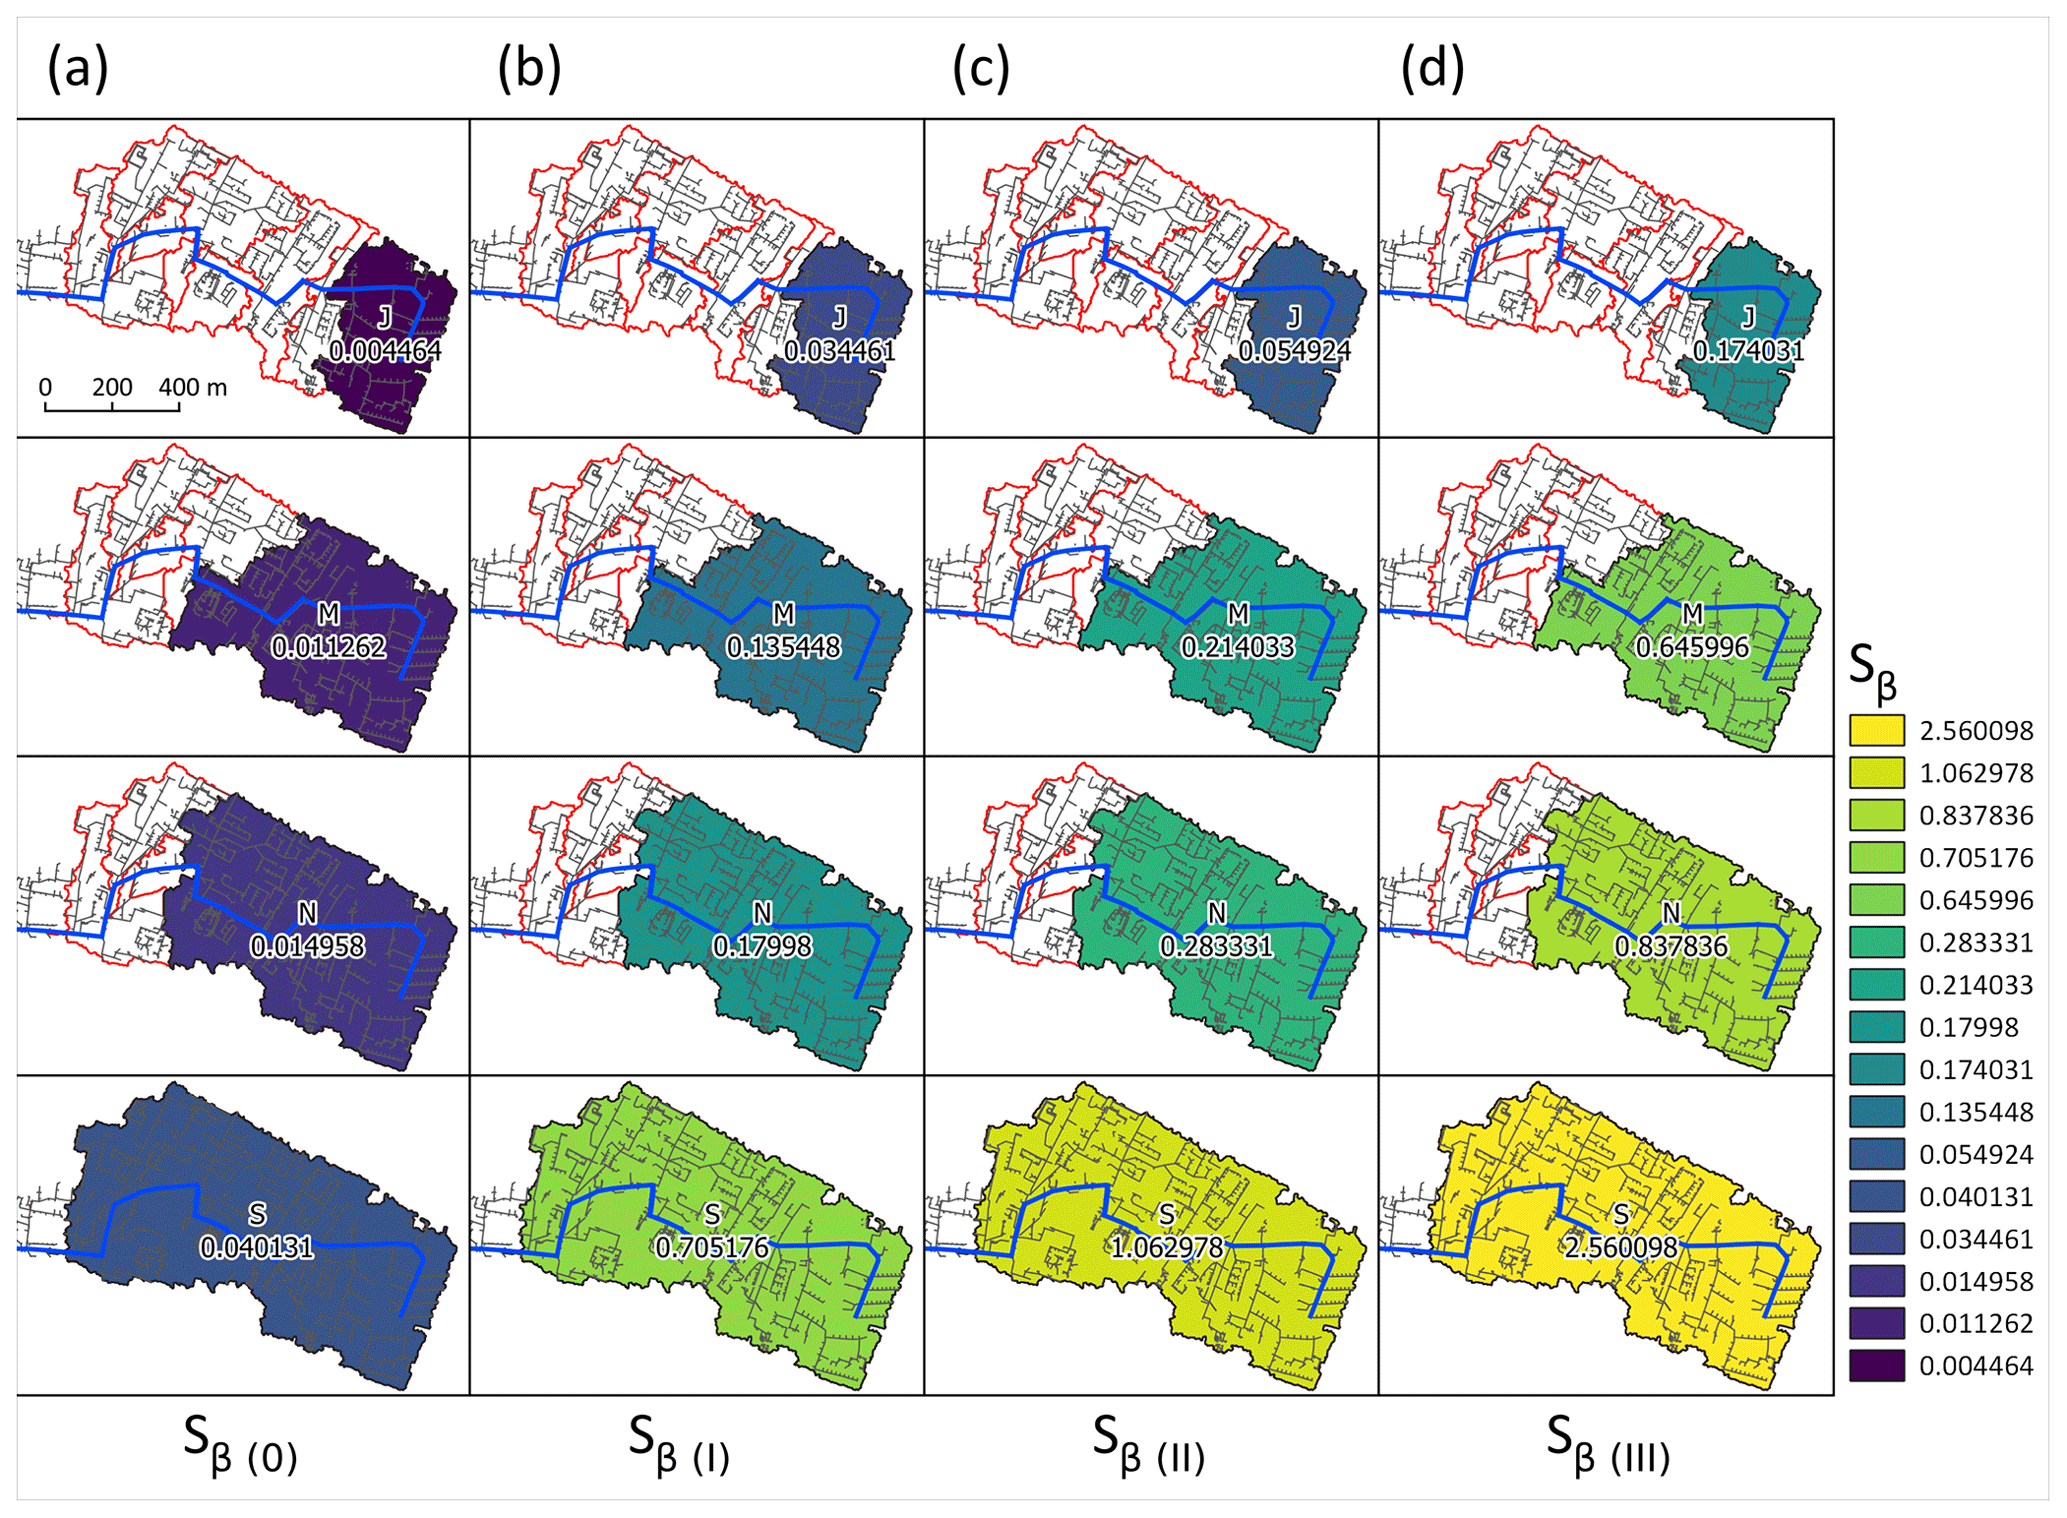
Figure 7Sensitivity coefficient (Sβ) in subcatchments for the (a) present state and for the (b) I, (c) II, and (d) III corrective action variants.
The greatest reduction in flooding volume was obtained for variant III: pm values decreased by 2 % and 36 % for subcatchments J and S (Fig. 6d). Based on the pm values for catchments J, M, N, and S for corrective action variant III, it was found that, despite the increase in retention depth and channel capacity and the reduction in the imperviousness of the catchments, there was hydraulic overloading (κ>13 m3 ha−1) in the subcatchments. This indicates the need for further changes in both the catchment and the stormwater network than were assumed. For variants I and III, the Imp values for the subcatchment were below the applicability range of the LRM; therefore, MCM simulations were performed to verify the results (Table S4). The results of the model calculations confirm their high agreement: out of 72 cases, identical results were obtained in 68 cases. The calculations performed (variants I, II, and III) for the subcatchments showed a greater influence of changes in terrain retention and channel capacity on the sensitivity coefficients than on the influence of the probability of a specific flood volume (Fig. 7). For catchments J and S, a 10 % decrease in Imp (variant I) increased Sβ by 7.55 times and 17.50 times (Fig. 7a, d). For variant II (increasing catchment retention), sensitivity coefficients were found to be higher than 51 % (catchment S) and 59 % (catchment J) compared with variant I, and the highest Sβ was obtained for variant III. The Sβ values for subcatchment S are 20.7 times, 19.3 times, and 14.7 times higher than in catchment J for variants I, II, and III, respectively. These results provide relevant information for planning retentive infrastructure that reduces outflow.
4.6 Probability of failure (module 9)
Based on the SWMM model parameters determined via the MCM method (Table S1), the probability of failure (pF) was computed for convectional rainfall in Kielce with a duration of tr=30 min and Ptot=9.61 mm. The following threshold values of nsew(m) were adopted for calculations: nsew(m)=0.015–0.045 m s. This threshold was coupled with three variants of catchment characteristics: Imp = 0.36 and Impd = 0.40, Imp = 0.35 and Impd = 0.40, and Imp = 0.35 and Impd = 0.42. The impact of canal retention (Vk=750, 850, and 950 m3) and the density of the stormwater network (Gk = 0.0075, 0.0080, and 0.0085 m ha−1; Gkd = 0.005, 0.006, and 0.007 m ha−1) in upper and lower part of the catchment on the probability of failure (pF) were also analyzed. The Manning roughness coefficients of the channels (nsew) for the analyzed variants were presented as an empirical distribution (CDF). In Figs. 8a and 9a, the results for Imp = 0.36, Impd = 0.40, and Vk=750, 850, 950 m3 are presented; other variants are shown in Figs. S18 and S19.
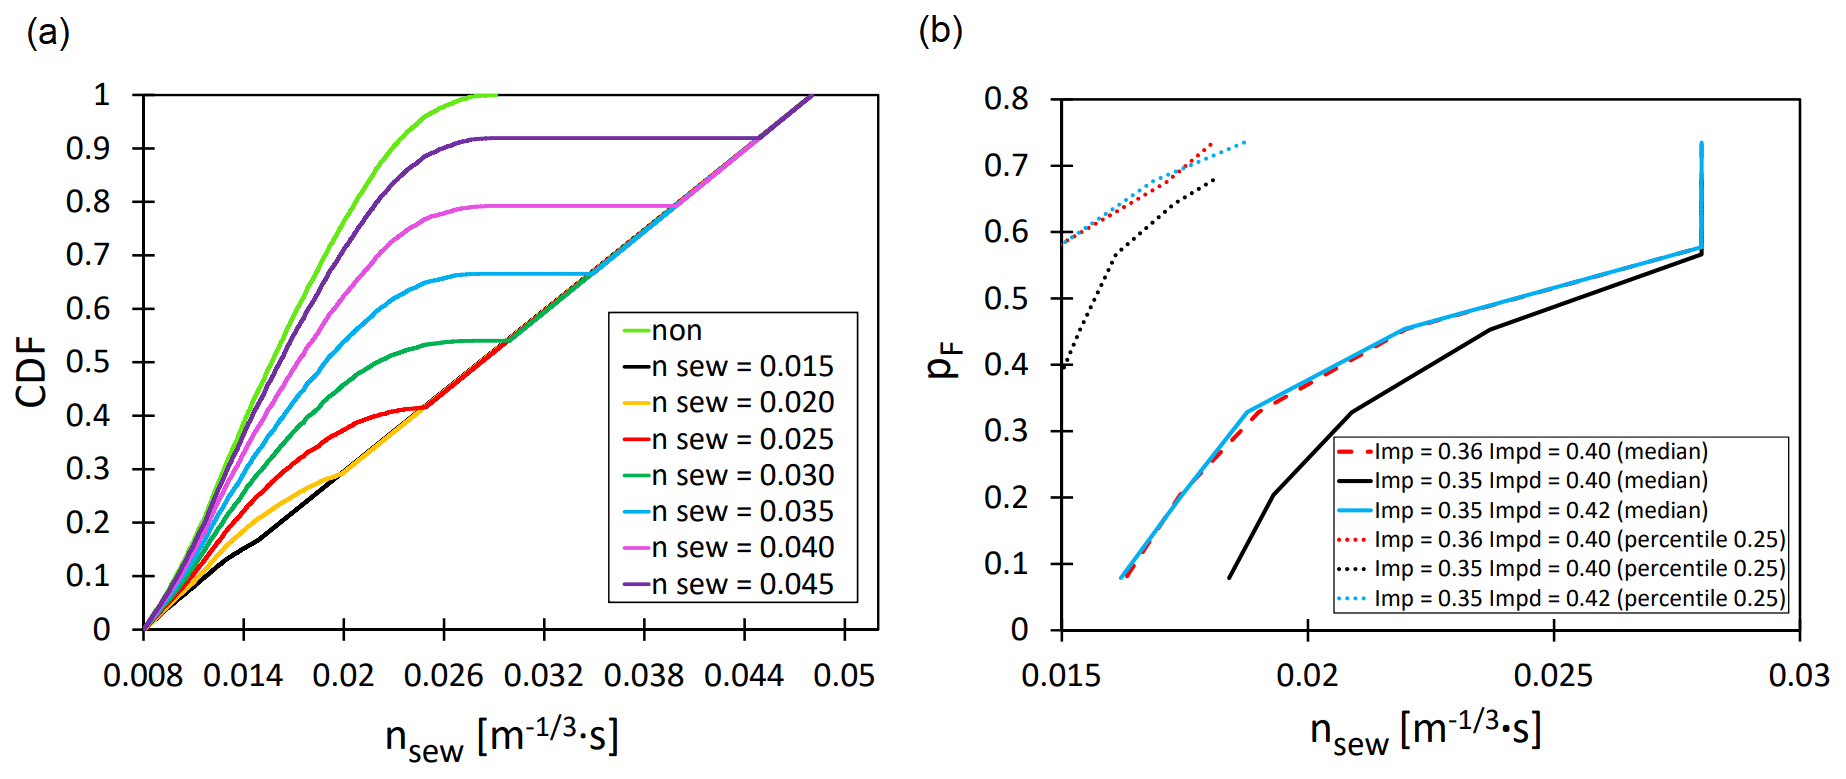
Figure 8(a) Empirical distributions of the threshold values of the Manning roughness coefficients of the channel (nsew). (b) The impact of the Manning roughness coefficient of the channel on the failure probability (pF) in relation to Imp and Impd.
Figure 8b presents the impact of nsew=f(nsew(m)) for percentiles 0.25 and 0.50 (based on the curves in Figs. 8b, 9b, 9c, 9d, S25, and S26 – the values of the respective percentiles for the analyzed nsew(m)) on the probability of failure (pF). Assuming that the Manning roughness coefficients (nsew(un)) determined by Monte Carlo (MC) simulation exceed the threshold and trigger corrective action on sewer pipes, resulting in a reduction in roughness below nsew(m), following the condition under which the stormwater network functions, for an independent rainfall event; thus, it was found that an appropriate decrease in the percentiles (0.25 and 0.50 – median) leads to improved network operation and to a lower failure probability (Fig. 8a, b). It was observed that the change in percentile 0.50 for nsew for a sample from MC simulation leads to a decrease from 0.028 to 0.021 m s (as a result of correction nsew(un)<nsew(m)) and to improved stormwater network operation, understood as a lower probability of failure (decrease in pF from 0.68 to 0.42 for Imp = 0.36 and Impd = 0.40). These results confirm the significance of catchment characteristics (Imp and Impd) for the operability of a stormwater network. For Impd = 0.40, the reduction in catchment impervious area (Imp) from 0.36 to 0.35 at percentile nsew=0.019 m s results in a decrease in the failure probability from pF=0.42 to pF=0.33 (Fig. 8b).
A great impact of channel retention (Vk) and the density of stormwater network in the upper and lower part of a catchment (Gkd and Gk, respectively) on the probability of failure pF were indicated (Fig. 9). For nsew<0.0215 m s, pF reached higher values (max 0.41) than for Vk=850 m3 and Vk=950 m3.
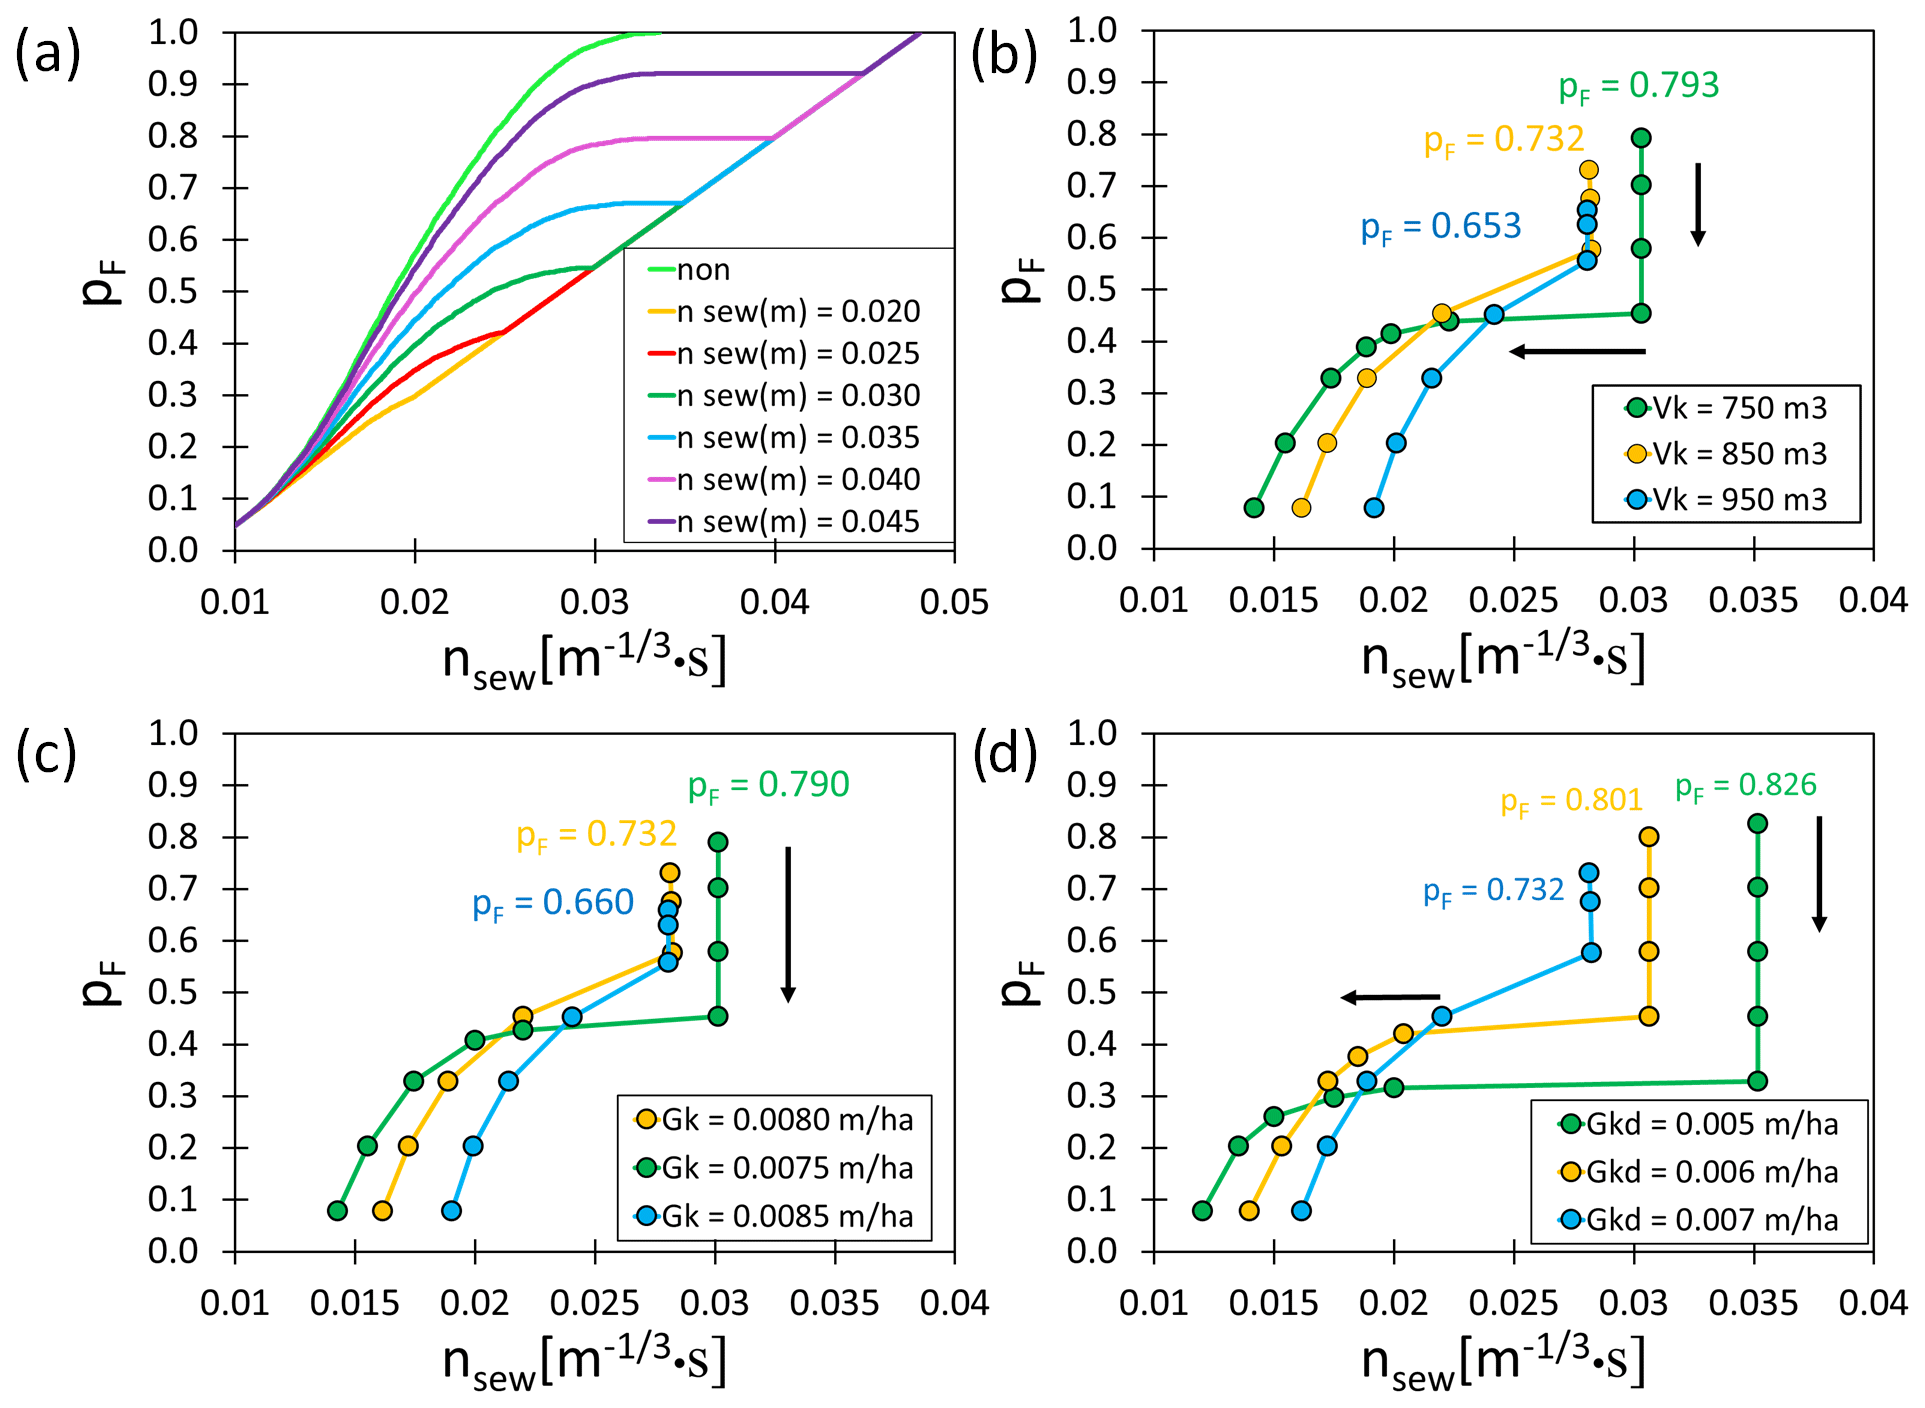
Figure 9(a) Empirical distributions of the threshold values of the Manning roughness coefficients of the channels (nsew) for Vk=950 m3. The impact of the Manning roughness coefficient for the channel on the failure probability (pF) is shown in relation to the following: (b) Vk (canal retention), (c) Gk (length of stormwater channel per impervious area in a catchment, in m ha−1), and (d) Gkd (length of a channel per impervious area below closing cross-section, in m ha−1).
The highest failure probability (pF=0.80) was obtained for Vk=750 m3 (nsew=0.031 m s), whereas the lowest failure probability (pF=0.65) was obtained for Vk=950 m3 (Fig. 9b). Furthermore, the highest probability of failure (pF=0.79) was obtained for Gk = 0.0075 m ha−1 (nsew=0.031 m s), whereas the lowest probability of failure was observed for Gk = 0.0085 m ha−1 (nsew=0.0276 m s) (Fig. 9c). For nsew<0.023 m s, it was established that computed values of pF for Gk = 0.0075 m ha−1 and Gk = 0.0080 m ha−1 were higher than 0.41. Moreover, the highest failure probability (pF) for nsew=0.035 m s was equal to 0.82 for Gkd = 0.005 m ha−1, while it was 0.73 for Gkd = 0.007 m ha−1 (Fig. 9d).
Developing and calibrating mathematical models to simulate stormwater network operation under hydraulic overloads is one of the latest areas of research. In comparison to the models used so far (Li and Willems, 2020; Thorndahl, 2009), the LRM proposed in this study includes SWMM model parameters describing catchment retention and, at the same time, the characteristics of the catchment and stormwater network (Table 2).
Table 2Comparison of the model developed for the identification of the specific flood volume to literature data.
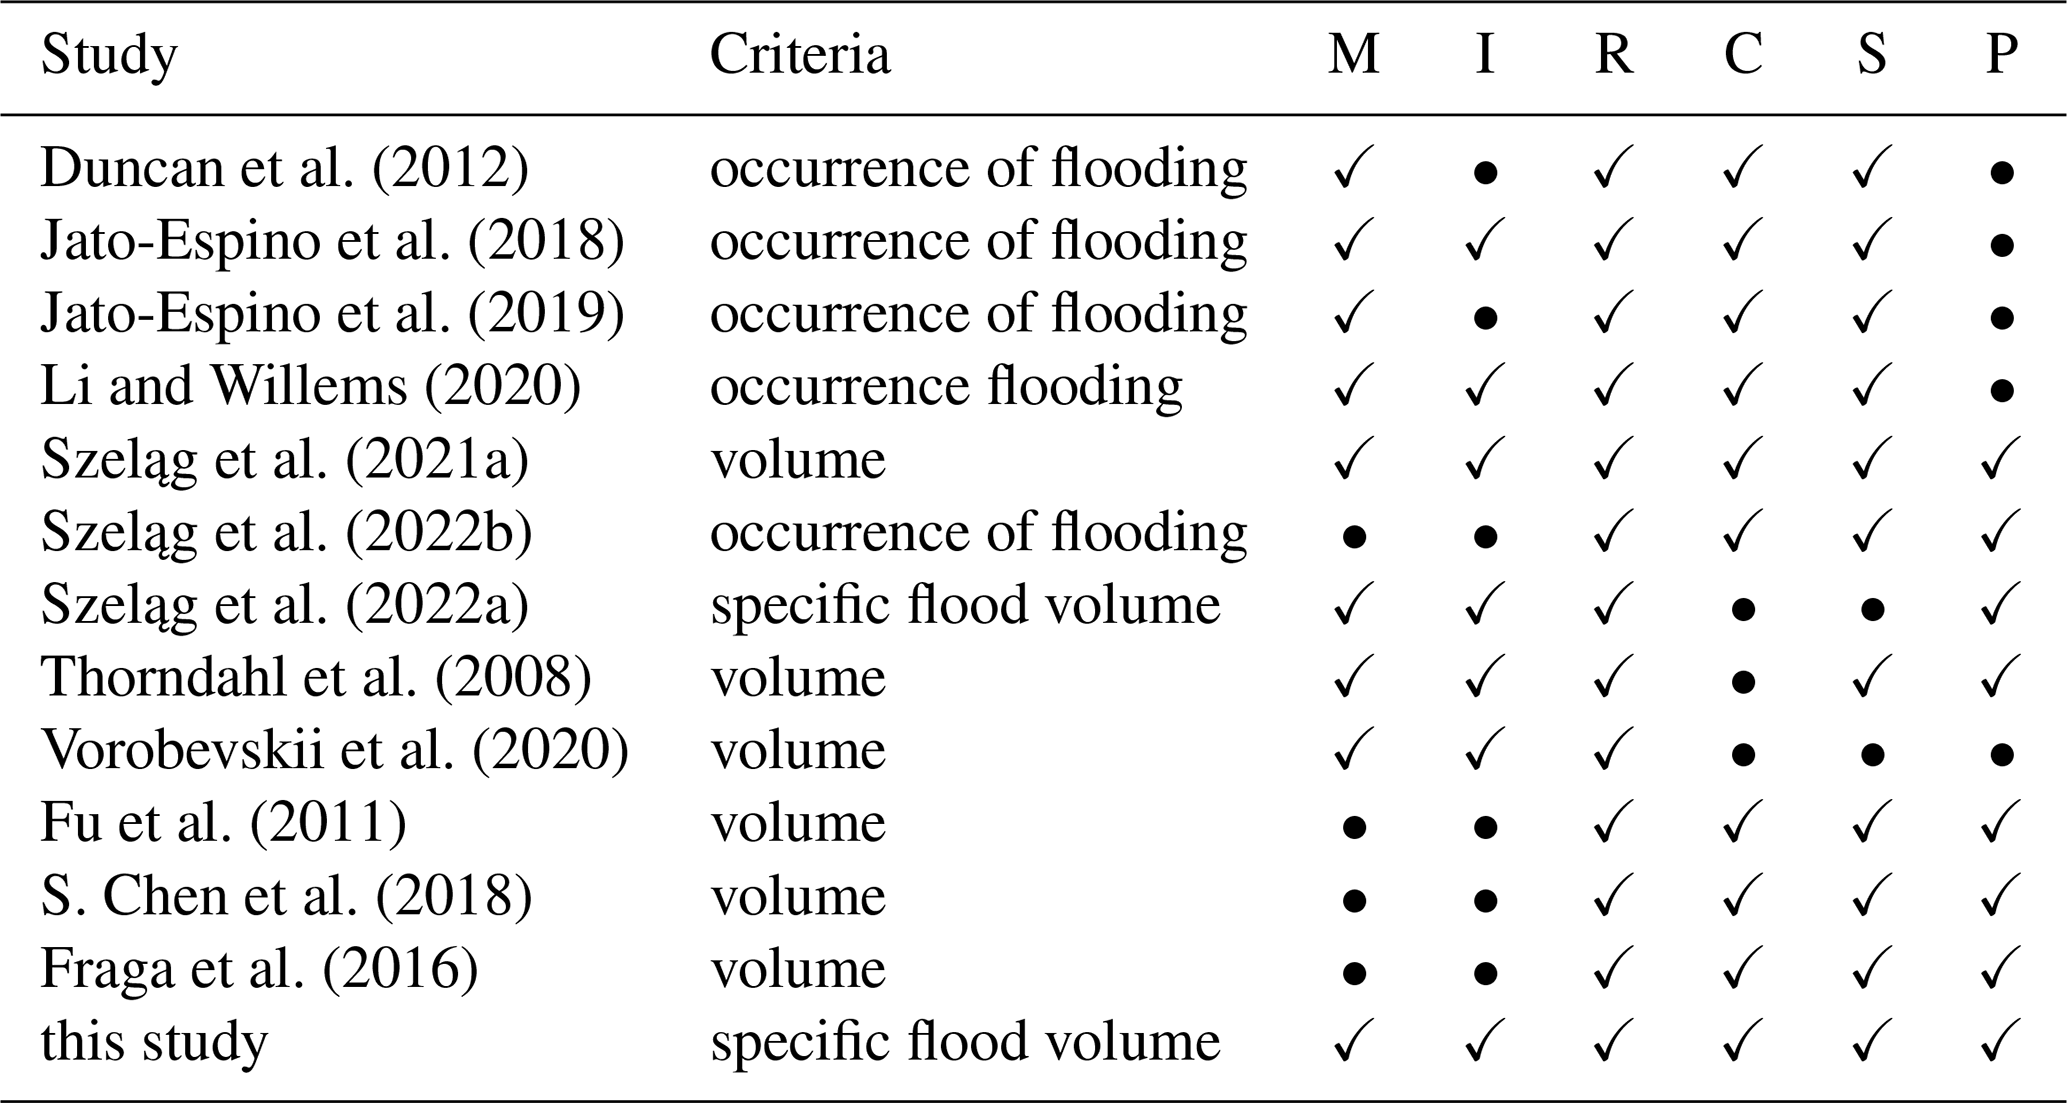
The following abbreviations are used in the table: M – method; R – rainfall; C – catchment; S – sewer; P – calibration parameter; and I – interpretation model (based on estimated factors, the impact of analyzed factors on stormwater flooding can be determined). The models were divided into two groups: mechanistic (•) and statistical (✓) models.
Apart from the model developed in this study, the abovementioned factors are only included in MCMs that have a form of differential equations. Therefore, they require a large number of simulations in order to determine the impact of selected variables on the computation results of the specific flood volume. Free of such drawbacks are statistical models (Table S4) that take the form of empirical relationships. For models developed with neural networks, there is the need to perform additional analyses (Ke et al., 2020; Yang and Chui, 2021). Jato-Espino et al. (2018, 2019) and Li and Willems (2020) analyzed stormwater flooding from sewer utility holes based on catchment characteristics and stormwater network characteristics (Table 2). Szeląg et al. (2022b) confirmed their results and developed a model for the identification of stormwater flooding in a catchment, but they did not consider catchment retention. In this context, the approaches cited above were insufficient to analyze the impact of different types of surfaces (e.g., roof, road, and parking) on sewage flooding. Fu et al. (2011), Thorndahl (2009), and Szeląg et al. (2022a) analyzed the uncertainty in the identified parameters, which allowed them, for example, to correct for impervious area retention and the roughness coefficient without being able to correct for catchment imperviousness, which limited the use of the models in catchment management. The approach proposed in this study is a combination of these two solutions, thereby providing a tool which can be successfully implemented to manage other catchments.
The results of this study confirmed the major significance of and strong interaction between catchment characteristics and SWMM model parameters. This fact can be further compared to several publications (Li and Willems, 2020; Jato-Espino et al., 2019; Zhou et al., 2019) presenting comparisons of flooding simulations in urban catchments. This analysis indicated that an impervious area in a catchment (Imp and Impd) leads to an increase in flooding; an inverse dependency was obtained by Jato-Espino et al. (2018) when modeling flooding from sewer utility holes. Jato-Espino et al. (2018) found that an increase in channel volume above the closing cross-section of a catchment (Vk) and its longitudinal slope (Jkp) results in a decrease in flooding, and this was confirmed for Espoo catchment in Finland. An increase in the unit of impervious area per length of the main stormwater interceptor (Gk and Gkd) results in a smaller volume of stormwater flooding. This is due to the following relationship: the longer the channel, the greater the number of sewer utility holes. Huang et al. (2018), based on observations conducted in a complex stormwater system, indicated the impact of catchment location and hydrological conditions on the peak flow of flooding. Yao et al. (2022) obtained similar results after computations with an MCM for catchments in Beijing and in Dresden (Reyes-Silva et al., 2020).
The calculation results obtained in this study confirmed the relevant impact of rainfall data, catchment characteristics, and stormwater network characteristics on sensitivity coefficients (the relationships between SWMM parameters and the specific flood volume). For rainfall data and catchment characteristics (assumed to be constant), it was proved that the correction coefficient of impervious area (β) and the Manning roughness coefficient for channels (nsew) have the greatest impact on the specific flood volume. The results of these computations were consistent with Thorndahl (2009), who simulated flooding from a single sewer utility hole in the Frejlev catchment (Belgium), based on rainfall data and the calibrated parameters of an MCM. These findings were confirmed by calculations carried out by Fu et al. (2011) and Prodanovic et al. (2022) for respective catchments of 400 and 8 ha. Szeląg et al. (2021a, 2022a), based on simulations with an MCM including uncertainty in the SWMM parameters, proved the key impact of the Manning roughness coefficient of sewers on the specific flood volume (for a rainfall event with tr=30 min and Pt=15.25 mm). Fraga et al. (2016) used the GLUE+ GSA (global sensitivity analysis) method for a road catchment and indicated the impact of rainfall data (rainfall duration, depth, and temporal distribution) on the sensitivity analysis results. This was confirmed in computations of stormwater flooding using a LRM (Szeląg et al., 2022b) and specific flood volume calculations with the SWMM (Freni and Oliveri, 2005). Xing et al. (2021) used an MCM to determine the impact of spatial development and stormwater characteristics in Chongqing catchment (China) on the depth of stormwater flooding. The aforementioned studies indicate the impact of rainfall data, catchment characteristics, and stormwater network characteristics on the sensitivity of a hydrodynamic simulation model for stormwater flooding.
The sensitivity analysis development proposed in this study enabled its application to catchments with different characteristics, which is an improvement compared with previously applied, more specific, approaches (Cristiano et al., 2019; Fatone et al., 2021). Differences in the probability of occurrence/sensitivity coefficients indicate the influence of downstream catchments on the conditions in the catchment above. The variation in the sensitivity coefficients does not account for local conditions within the side channels. Due to the creation of successive subcatchments by combining them, the conditions of the sewer system in its area are averaged out, making the interpretation of the results difficult. Using the developed tool, catchment management may become difficult when there is a particularly hydraulically overloaded area within the catchment that impacts neighboring subcatchments.
As in the case of the sensitivity analysis, the extension of the sewer system failure assessment has been adapted in this study to enable its implementation in a random catchment (for a sewer system without pump stations). The calculations' outputs showed the influence of the catchment and sewage network characteristics on the failure probability. The introduction of the maximum allowable value of the Manning roughness coefficient for the sewer channel enabled one to model the improvement in the operating conditions of the sewage network under uncertainty. A similar approach was used in the study of Fu et al. (2011) by limiting the analysis to probabilistic rainfall characteristics (Del Giudice et al., 2013) and using an MCM to simulate the drainage system. Fu et al. (2011) modified the above approach by focusing on the impact of uncertainty in the calibrated parameters on flooding; however, it was not possible to analyze the effect of retention or channel capacity on system performance.
In this study, a novel simulator of logistic regression including an advanced risk assessment extension was developed for modeling stormwater systems' operation under uncertainty. The proposed model is an alternative approach to MCMs, which can be used at the preliminary stage of analyses related to spatial planning, urban development and expansion, etc. This is of major significance because, at the preliminary stage, the data set for building catchment models is limited, and urgent demand for a simulation algorithm to assist decision-making is present. Assuming a Manning roughness coefficient (nsew(un)) estimation that exceeds the threshold triggers corrective action on sewer pipes, resulting in a reduction in roughness below nsew(m), following the condition of proper functioning of the stormwater network (). An appropriate decrease in the percentiles (0.25 and 0.50 – median) led to improved network operation and to a lower failure probability requirement.
In the adopted hydrodynamic (LRM-based) model, the impact of rainfall data, catchment characteristics (impervious areas in the downstream and upstream regions), and stormwater network characteristics (the length of channel per unit of impervious area, the channel slope, and the volume) as well as the SWMM parameters (roughness coefficient for sewer channel, correction coefficient for percentage impervious area, and Manning roughness coefficients for impervious area) were included simultaneously. The obtained simulation results show the strong interaction between the above-listed parameters. This is extremely relevant in the context of model calibration that can be applied to analyze stormwater network operation and to support the decision-making process (management of stormwater in an urban catchment). As the proposed solution analyses the spatial distribution of sensitivity coefficients, it is possible to identify the most vulnerable areas inside a catchment that require specific attention while also identifying SWMM model parameters that could be considered when locating measuring facilities.
| Apav | Area of paved surface (ha) |
| dH1 | Height difference of the terrain at section above closing cross-section (m) |
| dHp | Height difference at section above closing cross-section (m) |
| dimp | Retention depth of impervious areas (mm) |
| dper | Retention depth of pervious areas (mm) |
| F | Catchment surface area (ha) |
| Gk | Length of stormwater channel per impervious area in a catchment (m ha−1) |
| Gkd | Length of a channel per impervious area below closing cross-section (m ha−1) |
| GLUE | Generalized likelihood uncertainty estimation |
| Hst | The height of a sewer utility hole at closing cross-section (m) |
| Imp | Impervious area (–) |
| Impd | Impervious area of a catchment of downstream area (–) |
| J | Average rainfall intensity (L s−1 ha−1) |
| Jkp | Channel slope above closing cross-section of a catchment (–) |
| K | Total number of sewer utility holes (–) |
| Lk | Length of channel above closing cross-section of a catchment (m) |
| Likelihood function (–) | |
| nimp | Manning roughness coefficient for impervious areas (m s) |
| nperv | Manning roughness coefficient for pervious areas (m s) |
| Qz | Denotes the zth value from the times series of observed and computed discharges (m3 s−1) |
| Pt | Maximum depth of rainfall (mm) |
| p | Cumulative distribution function (CDF) |
| pm | Probability of a specific flood volume |
| P(θ) | The a priori parameter distribution |
| Height difference of the channel (m) | |
| Sxi | Sensitivity coefficient (–) |
| xi | Independent variables |
| SWMM | Storm Water Management Model |
| tr | Duration of rainfall (minutes) |
| V() | Variance |
| Vk | Volume of stormwater channel (m3) |
| Vkd | Total retention of a catchment (m3) |
| Vkp | Volume of the channel above the closing cross-section of a catchment (m3) |
| Vrd | Catchment retention above the closing cross-section (m3) |
| Vt(i) | Flood volume from the ith sewer utility hole (here, i=1, 2, 3, …, k) (m3) |
| W | Width of the runoff path in a subcatchment (m) |
| α | Coefficient for flow path width (–) |
| β | Correction coefficient for percentage of impervious areas (–) |
| γ | Correction coefficient for subcatchment slope (–) |
| ε | A scaling factor for the variance of model residual, used to adjust the width of the confidence intervals |
| κ | Specific flood volume (m3 ha−1) |
The model and codes used in this work are available from the corresponding author upon reasonable request.
The data supporting the findings of this study are available from the corresponding author upon reasonable request.
The supplement related to this article is available online at: https://doi.org/10.5194/hess-27-3329-2023-supplement.
BS: conceptualization; FF, BS, and AK: methodology; BS, AK, MS, and GW: formal analysis and investigation; BS, PK, AM, EW, GW, FF, and NC: writing – original draft preparation; PK, EW, AM, FF, and NC: writing – review and editing; BS, PK, AM, EW, and NC: supervision.
The contact author has declared that none of the authors has any competing interests.
Publisher's note: Copernicus Publications remains neutral with regard to jurisdictional claims in published maps and institutional affiliations.
This paper was edited by Nadia Ursino and reviewed by two anonymous referees.
Babovic, F., Mijic, A., and Madani, K.: Decision making under deep uncertainty for adapting urban drainage systems to change, Urban Water J., 15, 552–560, https://doi.org/10.1080/1573062X.2018.1529803, 2018.
Ball, J. E.: An Assessment of Continuous Modeling for Robust Design Flood Estimation in Urban Environments, Front. Earth Sci., 8, 1–10, https://doi.org/10.3389/feart.2020.00124, 2020.
Bui, D. T., Hoang, N. D., Martínez-Álvarez, F., Ngo, P. T. T., Hoa, P. V., Pham, T. D., Samui, P., and Costache, R.: A novel deep learning neural network approach for predicting flash flood susceptibility: A case study at a high frequency tropical storm area, Sci. Total Environ., 701, 134413, https://doi.org/10.1016/j.scitotenv.2019.134413, 2018.
Cea, L. and Costabile, P.: Flood Risk in Urban Areas: Modelling, Management and Adaptation to Climate Change. A Review, Hydrology, 9, 50, https://doi.org/10.3390/hydrology9030050, 2022.
Chang, H., Pallathadka, A., Sauer, J., Grimm, N. B., Zimmerman, R., Cheng, C., Iwaniec, D. M., Kim, Y., Lloyd, R., McPhearson, T., Rosenzweig, B., Troxler, T., Welty, C., Brenner, R., and Herreros-Cantis, P.: Assessment of urban flood vulnerability using the social-ecological-technological systems framework in six US cities, Sustain. Cities Soc., 68, 102786, https://doi.org/10.1016/j.scs.2021.102786, 2020.
Chen, L., Li, S., Zhong, Y., and Shen, Z.: Improvement of model evaluation by incorporating prediction and measurement uncertainty, Hydrol. Earth Syst. Sci., 22, 4145–4154, https://doi.org/10.5194/hess-22-4145-2018, 2018.
Chen, S., Garambois, P.-A., Finaud-Guyot, P., Dellinger, G., Mosé, R., Terfous, A., and Ghenaim, A.: Variance based sensitivity analysis of 1D and 2D hydraulic models: An experimental urban flood case, Environ. Model. Softw., 109, 167181, https://doi.org/10.1016/j.envsoft.2018.08.008, 2018.
Chen, W., Li, Y., Xue, W., Shahabi, H., Li, S., Hong, H., Wang, X., Bian, H., Zhang, S., Pradhan, B., and Bin Ahmad, B.: Modeling flood susceptibility using data-driven approaches of naïve Bayes tree, alternating decision tree, and random forest methods, Sci. Total Environ., 701, 134979, https://doi.org/10.1016/j.scitotenv.2019.134979, 2019.
Cristiano, E., ten Veldhuis, M. C., Wright, D. B., Smith, J. A., and van de Giesen, N.: The Influence of Rainfall and Catchment Critical Scales on Urban Hydrological Response Sensitivity, Water Resour. Res., 55, 3375–3390, https://doi.org/10.1029/2018WR024143, 2019.
Del Giudice, D., Honti, M., Scheidegger, A., Albert, C., Reichert, P., and Rieckermann, J.: Improving uncertainty estimation in urban hydrological modeling by statistically describing bias, Hydrol. Earth Syst. Sci., 17, 4209–4225, https://doi.org/10.5194/hess-17-4209-2013, 2013.
Dotto, C. B. S., Kleidorfer, M., Deletic, A., Rauch, W., and McCarthy, D. T.: Impacts of measured data uncertainty on urban stormwater models, J. Hydrol., 508, 28–42, https://doi.org/10.1016/j.jhydrol.2013.10.025, 2014.
Duncan, A. P., Chen, A. S., Keedwell, E. C., Djordjević, S., and Savić, D. A.: Urban flood prediction in real-time from weather radar and rainfall data using artificial neural networks, Weather Radar and Hydrology: IAHS Red Book Proceedings, 18–21 April 2011, University of Exeter, UK, 2012.
DWA-A118E: Hydraulic Dimensioning and Verification of Drain and Sewer Systems, Ger. Assoc. Water Wastewater Waste, 2006.
Fatone, F., Szeląg, B., Kiczko, A., Majerek, D., Majewska, M., Drewnowski, J., and Łagód, G.: Advanced sensitivity analysis of the impact of the temporal distribution and intensity of rainfall on hydrograph parameters in urban catchments, Hydrol. Earth Syst. Sci., 25, 5493–5516, https://doi.org/10.5194/hess-25-5493-2021, 2021.
Fraga, I., Cea, L., Puertas, J., Suárez, J., Jiménez, V., and Jácome, A.: Global sensitivity and GLUE-based uncertainty analysis of a 2D-1D dual urban drainage model, J Hydrol Eng., 21, 04016004, https://doi.org/10.1061/(ASCE)HE.1943-5584.0001335, 2016.
Freni, G. and Oliveri, O.: Mitigation of urban flooding: a simplified approach for distributed stormwater management practices selection and planning, Urban Water J., 2, 215226, https://doi.org/10.1080/15730620500386461, 2005.
Fu, G. and Butler, D.: Copula-based frequency analysis of overflow and flooding in urban drainage systems, J. Hydrol., 510, 49–58, https://doi.org/10.1016/j.jhydrol.2013.12.006, 2014.
Fu, G., Butler, D., Khu, S.-T., and Sun, S.: Imprecise probabilistic evaluation of sewer flooding in urban drainage systems using random set theory, Water Resour. Res., 47, 1–13, https://doi.org/10.1029/2009WR008944, 2011.
Guo, K., Guan, M., and Yu, D.: Urban surface water flood modelling – a comprehensive review of current models and future challenges, Hydrol. Earth Syst. Sci., 25, 2843–2860, https://doi.org/10.5194/hess-25-2843-2021, 2021.
Harrell, F. E.: Regression Modeling Strategies: With Applications to Linear Models, Logistic Regression, and Survival Analysis, Springer Series in Statistics, New York, ISBN 9781475734621, 2001.
Hettiarachchi, S., Wasko, C., and Sharma, A.: Increase in flood risk resulting from climate change in a developed urban watershed – the role of storm temporal patterns, Hydrol. Earth Syst. Sci., 22, 2041–2056, https://doi.org/10.5194/hess-22-2041-2018, 2018.
Huang, H., Chen, X., Zhu, Z., Xie, Y., Liu, L., Wang, X., Wang, X., and Liu, K.: The changing pattern of urban flooding in Guangzhou, China, Sci. Total Environ., 622623, 394401, https://doi.org/10.1016/j.scitotenv.2017.11.358, 2018.
Hung, W. and Hobbs, F. B.: How can learning-by-doing improve decisions in stormwater management? A Bayesian-based optimization model for planning urban green infrastructure investments, Environ. Modell. Softw., 113, 59–72, https://doi.org/10.1016/j.envsoft.2018.12.005, 2019.
Jato-Espino, D., Sillanpää, N., Andrés-Doménech, I., and Rodriguez-Hernandez, J.: Flood Risk Assessment in Urban Catchments Using Multiple Regression Analysis, J. Water Resour. Plan. Manag., 144, 04017085, https://doi.org/10.1061/(asce)wr.1943-5452.0000874, 2018.
Jato-Espino, D., Sillanpää, N., and Pathak, S.: Flood modelling in sewer networks using dependence measures and learning classifier systems, J. Hydrol., 578, 124013, https://doi.org/10.1016/j.jhydrol.2019.124013, 2019.
Jiang, Y., Zevenbergen, C., and Mab, Y.: Urban pluvial flooding and stormwater management: A contemporary review of China's challenges and “sponge cities” strategy, Environ. Sci. Policy, 80, 132–143, https://doi.org/10.1016/j.envsci.2017.11.016, 2018.
Karamouz, M. and Nazif, S.: Reliability-based flood management in urban watersheds considering climate change impacts, J. Water Resour. Plann. Manage., 139, 520–533, https://doi.org/10.1061/(ASCE)WR.1943-5452.0000345, 2013.
Ke, Q., Bricker, J., Tian, Z., Guan, G., Cai, H., Huang, X., Yang, H., and Liu, J.: Urban pluvial flooding prediction by machine learning approaches – a case study of Shenzen city, China, Adv. Water Resour., 145, 103719, https://doi.org/10.1016/j.advwatres.2020.103719, 2020.
Kelleher, C., McGlynn, B., and Wagener, T.: Characterizing and reducing equifinality by constraining a distributed catchment model with regional signatures, local observations, and process understanding, Hydrol. Earth Syst. Sci., 21, 3325–3352, https://doi.org/10.5194/hess-21-3325-2017, 2017.
Khan, M. P., Hubacek, K., Brubaker, K. L., Sun, L., and Moglen, G. E.: Stormwater Management Adaptation Pathways under Climate Change and Urbanization, J. Sustain. Water Built Environ., 8, 04022009, https://doi.org/10.1061/JSWBAY.0000992, 2022.
Kiczko, A., Szeląg, B., Kozioł, A. P., Krukowski, M., Kubrak, E., Kubrak, J., and Romanowicz, R. J.: Optimal capacity of a stormwater reservoir for flood peak reduction, J. Hydrol. Eng., 23, 04018008, https://doi.org/10.1061/(ASCE)HE.1943-5584.0001636, 2018.
Kim, Y., Eisenberg, D. A., Bondank, E. N., Chester, M. V., Mascaro, G., and Underwood, S.: Fail-safe and safe-to-fail adaptation: decision-making for urban flooding under climate change, Clim. Change, 145, 397–412, https://doi.org/10.1007/s10584-017-2090-1, 2015.
Kirshen, P., Caputo, L., Vogel, R. M., Mathisen, P., Rosner, A., and Renaud, T.: Adapting urban infrastructure to climate change: a drainage case study, J. Water Resour. Plan. Manag., 141, 04014064, https://doi.org/10.1061/(ASCE)WR.1943-5452.0000443, 2015.
Knighton, J., Lennon, E., Bastidas, L., and White, E.: Stormwater detention system parameter sensitivity and uncertainty analysis using SWMM, J. Hydrol. Eng., 21, 05016014, https://doi.org/10.1061/(ASCE)HE.1943-5584.0001382, 2016.
Kobarfard, M., Fazloula, R., Zarghami M., and Akbarpour: Evaluating the uncertainty of urban flood model using glue approach, Urban Water J., 19, 600–615, https://doi.org/10.1080/1573062X.2022.2053865, 2022.
Kotowski, A., Kaźmierczak, B., and Nowakowska, M. A.: Analysis of the drainage system load in case of the predicted increase in frequency and intensity of rain due to climate change, Ochrona Środowiska, 35, 25–32, 2013.
Lama, G. F. C., Crimaldi, M., De Vivo, A., Chirico, G. B., and Sarghini, F.: Eco-hydrodynamic characterization of vegetated flows derived by UAV-based imagery, 2021 IEEE International Workshop on Metrology for Agriculture and Forestry (MetroAgriFor), 273–278, https://doi.org/10.1109/MetroAgriFor52389.2021.9628749, 2021a.
Lama, G. F. C., Rillo Migliorini Giovannini, M., Errico, A., Mirzaei, S., Chirico, G. B., and Preti, F.: The impacts of Nature Based Solutions (NBS) on vegetated flows' dynamics in urban areas, 2021 IEEE International Workshop on Metrology for Agriculture and Forestry (MetroAgriFor), 3–5 November 2021, Trento-Bolzano, Italy, 58–63, https://doi.org/10.1109/MetroAgriFor52389.2021.9628438), 2021b.
Lei, X., Chen, W., Panahi, M., Falah, F., Rahmati, O., Uuemaa, E., Kalantari, Z., Ferreira, C. S. S., Rezaie, F., Tiefenbacher, J. P., Lee, S., and Bian, H.: Urban flood modeling using deep-learning approaches in Seoul, South Korea, J. Hydrol., 601, 126684, https://doi.org/10.1016/j.jhydrol.2021.126684, 2021.
Lense, G. H. E., Lämmle, L., Ayer, J. E. B., Lama, G. F. C., Rubira, F. G., and Mincato, R. L.: Modeling of Soil Loss by Water Erosion and Its Impacts on the Cantareira System, Brazil. Water, 15, 1490, https://doi.org/10.3390/w15081490, 2023.
Li, X. and Willems, P.: A Hybrid Model for Fast and Probabilistic Urban Pluvial Flood Prediction, Water Resour. Res., 56, e2019WR025128, https://doi.org/10.1029/2019WR025128, 2020.
Ma, B., Wu, Z., Hu, C., Wang, H., Xu, H., Yan, D., and Soomro, S.: Process-oriented SWMM real-time correction and urban flood dynamic simulation, J. Hydrol., 605, 127269, https://doi.org/10.1016/j.jhydrol.2021.127269, 2022.
Martins, R., Leandro, J., and Djordjević, S.: Influence of sewer network models on urban flood damage assessment based on coupled 1D/2D models, J. Flood Risk Manag., 11, 717–728, https://doi.org/10.1111/jfr3.12244, 2018.
Mignot, E., Li, X., and Dewals, B.: Experimental modelling of urban flooding: A review, J. Hydrol., 568, 334–342, https://doi.org/10.1016/j.jhydrol.2018.11.001, 2019.
Miller, J., Kim, H., Kjeldsen, T. R., Packman, J., Grebby, S., and Dearden, R.: Assessing the impact of urbanization on storm runoff in a peri-urban catchment using historical change in impervious cover, J. Hydrol., 515, 59–70, https://doi.org/10.1016/j.jhydrol.2014.04.011, 2014.
Mohammad, L., Bandyopadhyay, L., Sk, R., Mondal, I., Nguyen, T. T., Lama, G. F. C., and Ahn, D. T.: Estimation of agricultural burned affected area using NDVI and dNBR satellite-based empirical models, J. Environ. Manage., 343, 118226, https://doi.org/10.1016/j.jenvman.2023.118226, 2023.
Morio, J.: Global and local sensitivity analysis methods for a physical system, Eur. J. Phys., 32, 1577–1583, https://doi.org/10.1088/0143-0807/32/6/011, 2011.
Petersen, B., Gernaey, K., Henze, M., and Vanrolleghem, P. A.: Evaluation of an ASM1 model calibration procedure on a municipal industrial wastewater treatment plant, J. Hydroinf., 4, 1538, https://doi.org/10.2166/hydro.2002.0003, 2002.
Prodanovic, V., Jamali, B., Kuller, M., Wang, Y., Bach, P. M., Coleman, R. A., Metzeling, L., McCarthy, D. T., Shi, B., Deletic, A.: Calibration and sensitivity analysis of a novel water flow and pollution model for future city planning: Future Urban Stormwater Simulation (FUSS), Water Sci. Technol., 85, 961969, https://doi.org/10.2166/wst.2022.046, 2022.
Ray, R., Das, A., Hasan, M. S. U., Aldrees, A., Islam, S., Khan, M. A., and Lama, G. F. C.: Quantitative Analysis of Land Use and Land Cover Dynamics using Geoinformatics Techniques: A Case Study on Kolkata Metropolitan Development Authority (KMDA) in West Bengal, India, Remote Sens., 15, 959, https://doi.org/10.3390/rs15040959, 2023.
Razavi, S. and Gupta, H. V.: A multi-method Generalized Global Sensitivity Matrix approach to accounting for the dynamical nature of earth and environmental systems models, Environ. Model. Softw., 114, 1–11, https://doi.org/10.1016/j.envsoft.2018.12.002, 2019.
Reyes-Silva, J. D., Bangura, E., Helm, B., Benisch, J., and Krebs, P.: The Role of Sewer Network Structure on the Occurrence and Magnitude of Combined Sewer Overflows (CSOs), Water, 12, 2675, https://doi.org/10.3390/w12102675, 2020.
Rosenzweig, B. R., Cantis, H., Kim, Y., Cohn, A., Grove, K., Brock, J., Yesuf, J., Mistry, P., Welty, C., McPhearson, T., Sauer, J., and Chang, H.: The value of urban flood modeling, Earth's Future, 9, e2020EF001739, https://doi.org/10.1029/2020EF001739, 2021.
Salman, B. and Salem, O.: Modeling Failure of Wastewater Collection Lines Using Various Section-Level Regression Models, J. Infrastruct. Syst., 18, 146–154, https://doi.org/10.1061/(ASCE)IS.1943-555X.0000075, 2012.
Shafizadeh-Moghadam, H., Valavi, R., Shahabi, H., Chapi, K., and Shirzadi, A.: Novel forecasting approaches using combination of machine learning and statistical models for flood susceptibility mapping, J. Environ. Manage., 217, 1–11, https://doi.org/10.1016/j.jenvman.2018.03.089, 2018.
Shrestha, A., Mascaro, G., and Garcia, M.: Effects of stormwater infrastructure data completeness and model resolution on urban flood modeling, J. Hydrol., 607, 127498, https://doi.org/10.1016/j.jhydrol.2022.127498, 2022.
Siekmann, M. and Pinnekamp, J.: Indicator based strategy to adapt urban drainage systems in regard to the consequences caused by climate change. 12th International Conference on Urban Drainage, 11–16 September 2011, Porto Alegre/Brazil, 2011.
Siekmann, M., Vomberg, N., Mirgartz, M., Pinnekamp, J., and Mühle, S.: Multifunctional Land Use in Urban Spaces to Adapt Urban Infrastructure, in: Climate Change and the Sustainable Use of Water Resources. Climate Change Management, edited by: Leal Filho, W., Springer, Berlin, Heidelberg, https://doi.org/10.1007/978-3-642-22266-5_37, 2011.
Sonavane N., Rangari, V. A., Waikar, M. L., and Patil, M.: Urban storm-water modeling using EPA SWMM – a case study of Pune city, 2020 IEEE Bangalore Humanitarian Technology Conference (B-HTC), 8–10 October 2020, Vijiyapur, India, https://doi.org/10.1109/B-HTC50970.2020.9297900, 2020.
Sun, Y., Liu, Ch., Du, X., Yang, F., Yao, Y., Soomro, S., and Hu, C.: Urban storm flood simulation using improved SWMM based on K-means clustering of parameter samples, J. Flood Risk Manag., 15, e12826, https://doi.org/10.1111/jfr3.12826, 2022.
Szeląg, B.: Influence of the Hydrogramme Shape on the Capacity and Selection of Drains of a Small Retention Reservoir, PhD thesis, University of Technology, Kielce, 2013.
Szeląg, B., Kiczko, A., and Dąbek, L.: Sensitivity and uncertainty analysis of hydrodynamic model (SWMM) for storm water runoff forecasting in an urban basin – a case study, Ochr. Sr., 38, 15–22, 2016.
Szeląg, B., Suligowski, R., Studziński, J., and De Paola, F.: Application of logistic regression to simulate the influence of rainfall genesis on storm overflow operations: a probabilistic approach, Hydrol. Earth Syst. Sci., 24, 595–614, https://doi.org/10.5194/hess-24-595-2020, 2020.
Szeląg, B., Kiczko, A., Łagód, G., and De Paola, F.: Relationship between rainfall duration and sewer system performance measures within the context of uncertainty, Water Res Manage., 35, 5073–5087, https://doi.org/10.1007/s11269-021-02998-x, 2021a.
Szeląg, B., Suligowski, R., Drewnowski, J., De Paola, F., Fernandez-Morales, F. J., and Bąk, Ł.: Simulation of the number of storm overflows considering changes in precipitation dynamics and the urbanisation of the catchment area: A probabilistic approach, J. Hydrol., 598, 126275, https://doi.org/10.1016/j.jhydrol.2021.126275, 2021b.
Szeląg, B., Majerek, D., Kiczko, A., Łagód, G., Fatone, F., and McGarity, A.: Analysis of sewer network performance in context of modernization: modeling, sensitivity, uncertainty analysis, 12, 148, https://doi.org/10.1061/(ASCE)WR.1943-5452.0001610, 2022a.
Szeląg, B., Suligowski, R., De Paola, F., Siwicki, P., Majerek, D., and Łagód, G.: Influence of urban catchment characteristics and rainfall origins on the phenomenon of stormwater flooding: Case study, Environ. Model. Softw., 150, 105335, https://doi.org/10.1016/j.envsoft.2022.105335, 2022b.
Taromideh, F., Fazloula, R., Choubin, B., Emadi, A., and Berndtsson, R.: Urban Flood-Risk Assessment: Integration of Decision-Making and Machine Learning, Sustainability, 14, 4483, https://doi.org/10.3390/su14084483, 2022.
Thorndahl, S.: Stochastic long term modelling of a drainage system with estimation of return period uncertainty, Water Sci. Technol., 59, 2331–2339, https://doi.org/10.2166/wst.2009.305, 2009.
Thorndahl, S., Schaarup-Jensen, K., and Jensen, J. B.: Probabilistic modelling of combined sewer overflow using the First Order Reliability Method, Water Sci. Technol., 57, 1337–1344, https://doi.org/10.2166/wst.2008.301, 2008.
Ursino, N.: Reliability analysis of sustainable storm water drainage systems, WIT Transactions on The Built Environment, 139, 149–157, https://doi.org/10.2495/UW140131, 2014.
Venvik, G., Bang-Kittilsen, A., and Boogaard, F. C.: Risk assessment for areas prone to flooding and subsidence: a case study from Bergen, Western Norway, Hydrol. Res., 51, 322-338, https://doi.org/10.2166/nh.2019.030, 2021.
Vorobevskii, I., Al Janabi, F., Schneebeck, F., Bellera, J., and Krebs, P.: Urban Floods: Linking the Overloading of a Storm Water Sewer System to Precipitation Parameters, Hydrology, 7, 35, https://doi.org/10.3390/hydrology7020035, 2020.
Wałek, G.: Wpływ dróg na kształtowanie spływu powierzchniowego w obszarze zurbanizowanym na przykładzie zlewni rzeki Silnicy w Kielcach, Jan Kochanowski University Press, Kielce, 2019 (in Polish).
Wu, J. Y., Thompson, J. R., Kolka, R. K., Franz, K. J., and Stewart, T. W.: Using the Storm Water Management Model to predict urban headwater stream hydrological response to climate and land cover change, Hydrol. Earth Syst. Sci., 17, 4743–4758, https://doi.org/10.5194/hess-17-4743-2013, 2013.
Xing, Y., Shao, D., Yang, Y., Ma, X., and Zhang, S.: Influence and interactions of input factors in urban flood inundation modeling: An examination with variance-based global sensitivity analysis, J. Hydrol., 600, 126524, https://doi.org/10.1016/j.jhydrol.2021.126524, 2021.
Yang, Q., Ma, Z., and Zhang, S.: Urban Pluvial Flood Modeling by Coupling Raster-Based Two-Dimensional Hydrodynamic Model and SWMM, Water, 14, 1760, https://doi.org/10.3390/w14111760, 2022.
Yang, Y. and Chui, T. F. M.: Modeling and interpreting hydrological responses of sustainable urban drainage systems with explainable machine learning methods, Hydrol. Earth Syst. Sci., 25, 5839–5858, https://doi.org/10.5194/hess-25-5839-2021, 2021.
Yao, Y., Hu, C., Liu, C., Yang, F., Ma, B. Wu, O. Li, X., and Soomro, S.: Comprehensive performance evaluation of stormwater management measures for sponge city construction: A case study in Gui'an New District, China, J. Flood Risk Manage., 15, e12834, https://doi.org/10.1111/jfr3.12834, 2022.
Zhou, Y., Shen, D., Huang, N., Guo, Y., Zhang, T., and Zhang, Y.: Urban flood risk assessment using storm characteristic parameters sensitive to catchment-specific drainage system, Sci. Total Environ., 659, 1362–1369, https://doi.org/10.1016/j.scitotenv.2019.01.004, 2019.