the Creative Commons Attribution 4.0 License.
the Creative Commons Attribution 4.0 License.
 | 29 Aug 2023
Predicting soil hydraulic properties for binary mixtures – concept and application for constructed Technosols
Moreen Willaredt
Thomas Nehls
Andre Peters
Constructed Technosols are an important means of substituting natural soil material, such as peat and geogenic material, for use in urban green infrastructure. One characteristic of Technosols important to their role in urban green infrastructure, specifically with respect to urban water management, is their soil hydraulic properties (SHPs). The SHPs depend on the composition of the constructed Technosols (e.g. their components and their mixing ratio). The diversity of possible components and the infinite number of mixing ratios practically prohibit the experimental identification of the composition needed to achieve suitable soil hydrological functions. In this study, we propose a compositional model for predicting the water retention curves (WRCs) of any binary mixture based on the measured WRCs of its two pure components only (basic scheme) or with one additional mixture (extended scheme). The unsaturated hydraulic conductivity curves (HCCs) are predicted based on the modelled WRCs. The compositional model is developed from existing methods for estimating the porosity of binary mixtures. The model was tested on four data sets of measured WRCs of different binary mixtures. The distribution of water and air in 50 cm high soil columns filled with these mixtures was predicted under hydrostatic conditions in order to assess their suitability for typical urban applications. The difference between the maxima of the pore size distributions ΔPSDmax (m) of the components indicates the applicability of the compositional approach. For binary mixtures with small ΔPSDmax, the water content deviations between the predicted and the measured WRCs range from 0.004 to 0.039 cm3 cm−3. For mixtures with a large ΔPSDmax, the compositional model is not applicable. The prediction of the soil hydraulic properties of any mixing ratio facilitates the simulation of flow and transport processes in constructed Technosols before they are produced (e.g. for specific urban water management purposes).
- Article
(4326 KB) - Full-text XML
- BibTeX
- EndNote


Soil sealing disrupts the natural soil functions involved in regulating water cycles and the energy balance in urban environments. Therefore, environmental problems like pluvial flooding or the intensification of the urban heat island effect are challenging the health and quality of life in urban areas. Climate change intensifies these urgent problems. In fact, plants and their substrates, in the form of green roofs (Molineux et al., 2009; Eksi et al., 2020), facade greening, urban trees pits (Vidal-Beaudet et al., 2018; Yilmaz et al., 2018) and ornamental raised beds (Pitton et al., 2022), can increase cities' resilience to extreme weather events when they are reintroduced to sealed urban areas. The effectiveness of secondary urban greening (Nehls et al., 2015) is dependent upon its “brown infrastructure” parts (Pouyat et al., 2010). Constructed Technosols, soil-like substrates or growing media restitute the functions of the former unsealed soils on site. This can be described as functional de-sealing. The implementation of urban green infrastructure (UGI) on top of sealed soils leads to an increased demand for soil, planting substrates and constructed Technosols. These constructed Technosols can be engineered from locally accruing mineral and organic waste. This is considered a sustainable path to meet the aforementioned increased demand (Prado et al., 2020; Deeb et al., 2020; Fabbri et al., 2021), as it reuses materials that would otherwise be sent to landfills. It also decreases the degradation of fertile natural soil resources and other geogenic materials outside urban areas (Willaredt and Nehls, 2021). Using a life cycle analysis, Tams et al. (2022) showed that the use of recycled brick particles instead of expanded clay reduces the CO2 footprint of the substrate layer by 50 % in an extensive green roof. The composition of waste materials and their processing (Ulrich et al., 2021) are the most important design levers in manipulating the properties according to their application (Rokia et al., 2014; Fields et al., 2018; Willaredt and Nehls, 2021). Most UGI addresses the re-establishment of soil functions related to the regulation of the water cycle (Grabowski et al., 2022). Rokia et al. (2014) were the first to describe the properties of binary and ternary combinations of Technosol components as functions of their mixing ratio and the waste type used. Using dose–response curves, they were able to describe six basic soil properties that are important for agricultural use: total C, available phosphorus, cation exchange capacity, pH in water, the water content at a pressure head of cm and the bulk density. They showed that only mixtures containing both waste types, mineral and organic, will feature soil-like agronomic properties. Water retention characteristics, hydraulic conductivity, and the distributions of water and air for different hydraulic heads determine the successful application of constructed Technosols in UGI (Al Naddaf et al., 2011; Caron et al., 2015). Measurements in soil-like but still unknown components and in their combinations require the following of a protocol guaranteeing the reproducibility of the mixture formulation and comparability between the mixtures (Hill et al., 2019; Willaredt and Nehls, 2021). The extensive labour involved and the costly equipment required limit comprehensive measurement of the wide variety of components for Technosol construction and their infinite possible mixing ratios. Nevertheless, planning for efficient water management in UGI requires the knowledge of the soil hydraulic properties of the Technosols used.
Therefore, this study aims to develop a concept that allows for the prediction of the water retention curves (WRCs) of binary mixtures based on the measured WRCs of only the pure components. Concepts that approach soils as mixtures can be found in research on the soil physical properties after soil amelioration (Abel et al., 2013; Walczak et al., 2002) and in research on soils containing stones or gravel (Naseri et al., 2019; Zhang et al., 2011). The impact of mixing on soil physical properties, mainly the porosity and saturated hydraulic conductivity, were most comprehensively described for mixtures of coarse and fine particles with a pronounced particle size difference (Sakaki and Smits, 2015; Zhang et al., 2011; Clarke, 1979). For the porosity in such mixtures, the functional dependence on the composition of the mixture has been described by the concepts of “ideal mixing” and “zero mixing” (Clarke, 1979). Briefly, these concepts are as follows:
-
In ideal-mixing binary mixtures, two categories can be distinguished depending on their mixing ratio – fine-controlled or coarse-controlled mixtures. In fine-controlled mixtures, the fine component of the mixture determines its properties, and the coarse particles – having no inner porosity – reduce the total porosity in the mixture. In coarse-controlled mixtures, the fine particles are located within the pores between coarse particles.
-
In zero-mixing binary mixtures, the resulting porosity can be linearly interpolated between the components' porosity.
The effect of the volumetric stone content in fine-controlled mixtures on the resulting porosity, as well as on the WRC and unsaturated hydraulic conductivity, has been successfully described by scaling approaches in work such as Bouwer and Rice (1984) and Flint and Childs (1984). With high-resolution WRC measurements, Naseri et al. (2019) confirmed the applicability of scaling approaches for stony soils with volumetric stone contents not bigger than the order of magnitude of 30 vol % – hence, fine-controlled mixtures. In addition to the porosity, Sakaki and Smits (2015) measured the WRCs in mixtures with a pronounced particle size difference and found the patterns of ideal mixing also reflected in the WRCs. The focus on mixtures with components that have a distinct particle size differences is a major limitation for the transferability of this prediction concept to Technosols. Technosols are mixtures of components with suitable characteristics for soil construction, with overlapping particle size and pore size distributions (e.g. organic and mineral components that present fine, graded particle size distributions instead of distinct particle size differences). Therefore, the particles of these components are less likely to be located within each others' pore spaces. Hence, the impact of mixing the components on the resulting WRCs is more likely to be represented by the zero-mixing concept introduced above.
The purpose of this study is to develop an approach to predict WRCs in binary mixtures of materials that are suitable for Technosol construction. This enables the prediction of the soil hydraulic properties of Technosols formulated as binary mixtures at any mixing ratio based on only a few necessary measurements. Therefore, we (i) formulate and use a simple compositional model approach to predict the WRCs of binary mixtures that cover a full range of mixing ratios, from to (), based on the WRCs of the pure components; (ii) assess the approach with sets of WRCs of binary mixtures found in the literature; and (iii) present the applicability of the compositional model for predicting hydraulic conductivity curves and the hydrostatic distribution of water and air using the constructed Technosols as planting substrates in a container.
2.1 The concept of compositional models
In this study, the difference between the maxima of the pore size distribution (PSD) of both components ΔPSDmax (m) is used as a measure to qualitatively evaluate their similarity. It can be calculated as the difference between the logarithms of the effective radii Reff (m) and reff (m) at the PSD maxima for the components with larger and smaller components, respectively:
Figure 1 schematically visualizes the proportions of the pore radii present in two components and the resulting pore system arrangement with a large ΔPSDmax (Fig. 1a) and a smaller ΔPSDmax (Fig. 1b).
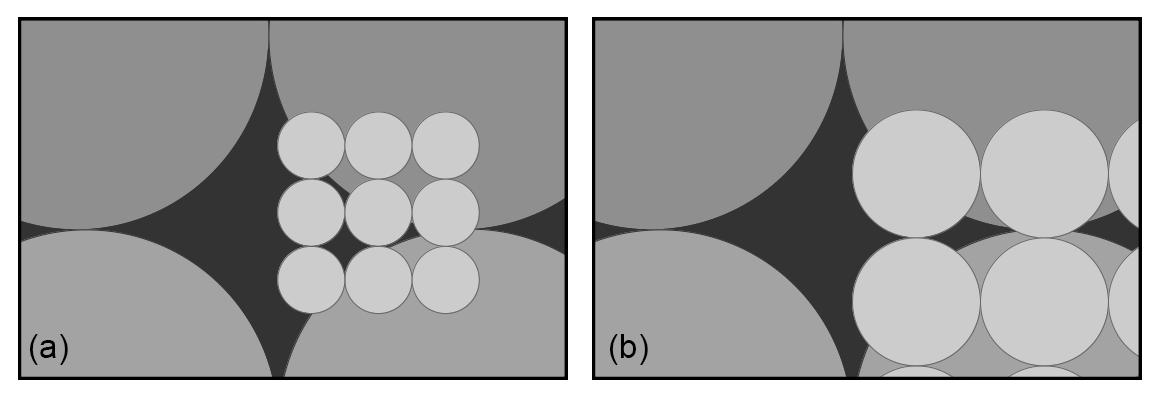
Figure 1Schematic representation of two different pore systems. Panel (a) shows a system that presents a pronounced difference in the effective pore radii found in two soil components: the pores of the component characterized by smaller pores can arrange within the pores of the component characterized by large pores (ideal mixing). Panel (b) shows a system that presents a smaller difference in pore size radii: the pores formed by the particles in the components characterized by the small pore radius do not easily arrange within the larger pore system but rather exist next to each other (zero mixing).
2.1.1 Adapted Clarke model
The ideal-mixing approach described in Clarke (1979) was formulated to define the lower boundary of the resulting porosity in binary mixtures of fine and coarse particles. It was developed to describe natural soil containing stones or gravel and distinguishes two cases: “coarse-controlled” mixtures and “fine-controlled” mixtures. The volumetric composition describes the volumetric stone content in the mixture. For fine-controlled mixtures, this implies that the volume of the coarse fraction refers to the solid volume of the contained stones in a background bulk volume of the fine component. The volumetric share of the fine component xf (–) in the mixture delineates the two cases. The threshold at which the relation between the porosity and the volumetric share of the fine component changes from one case to the other corresponds to xf=ϕc (Sakaki and Smits, 2015), where ϕc (–) stands for the porosity in the coarse component of the binary mixture.
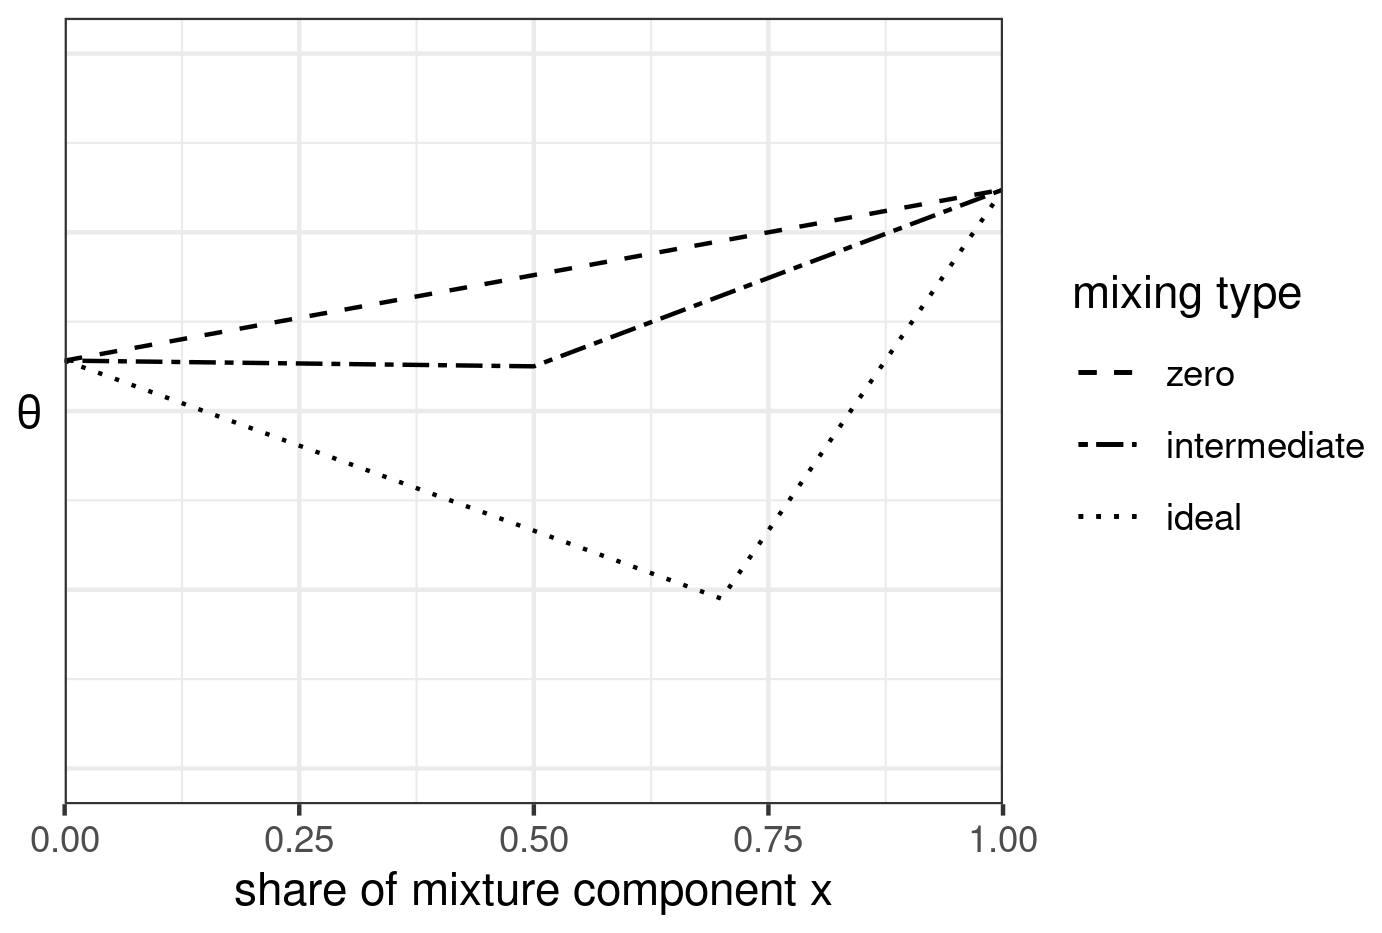
Figure 2Mixing types of water retention characteristics in binary mixtures (adapted from the concept for porosity in binary mixtures in Zhang et al., 2011).
When adapting the ideal-mixing approach to predict the complete WRCs for any volumetric composition, we refer to the bulk volumes of the components that form the composition. Hence, x (–) refers to the bulk volumetric share of one component in the mixture (Fig. 2). With the adapted Clarke model, the predicted WRCs are calculated as follows:
where θpred (–) is the predicted WRC in a mixture; θf (–) and θc (–) stand for the WRCs in the fine and coarse components of the mixture, respectively; ϕf (–) represents the porosity in the fine component; xf (–) refers to the bulk volumetric share of the fine component; and xc (–) stands for the bulk volumetric share of the coarse component. The volumetric content of fine component is effectively larger in ideally mixed fine-controlled mixtures (xf≥ϕc) compared with the bulk volumetric share of fine particles. The difference corresponds to the porosity in the bulk volumetric share of the coarse component, as this volume is filled by fine particles. The volume taken up by the solids of the coarse component does not contribute to water retention. This corresponds to the scaling approaches tested and approved by Naseri et al. (2019). In coarse-controlled mixtures the water retention in the coarse component of the mixture is reduced by the solid volume introduced with the fine component. The water retention within the pores of the fine component adds to the mixture's water retention (Eq. 2). In binary mixtures with pore systems that are characterized by small ΔPSDmax (m), the particles and the pore system formed between them are not going to interlock in the same way that mixtures with a distinct difference in particle size do. Instead, the particles in the mixture exist next to each other and form a new pore system that can be directly calculated as a linear interpolation between the porosities of the two pure components. In reality, the mixture's porosity, and consequently the water retention, likely follows a curves situated between zero mixing and ideal mixing, represented by the “intermediate mixing” type in Fig. 2.
2.1.2 Basic scheme CM1
This approach corresponds to the zero-mixing concept and is a weighted superposition of the WRCs of the two components to predict the WRC of the mixture:
where xa (–) and xb (–) represent the bulk volumetric share of component a and b, respectively, for the mixture, with ; θa (–) and θb (–) are the volumetric water contents at any matric potential of the two single components; and θpred (–) is the resulting volumetric water content of the mixture at any matric potential.
2.1.3 Extended scheme CM2
For the extended scheme of the compositional model, an additional WRC is required to predict a mixture's WRC. The additional WRC should represent a mixture of similar shares of both components. Therefore, it is referred to as the WRC of an intermediate mixture xm (–) (intermediate mixing concept in Fig. 2). The motivation behind the extended scheme is to analyse if a slight increase in measurement effort leads to more sound predictions. With the extended scheme, the predicted WRCs are calculated as follows:
where xm (–) represents the bulk volumetric share of component a in the intermediate mixture and θm (–) is the water content in the intermediate mixture. This approach is based on typical calculations for dilution concentrations.
2.2 Data sets of binary mixtures and their mathematical representation
2.2.1 Data sets
We used four different data sets of WRCs of binary mixtures, ranging from volumetric shares of the pure first component () to volumetric shares of the pure second component (). Three of them represent binary mixtures of one organic and one mineral component, mimicking soils and providing soil functions (Walczak et al., 2002; Deeb et al., 2016; Willaredt and Nehls, 2021). The fourth data set (Sakaki and Smits, 2015) represents a mixture of sands with a pronounced difference in particle sizes (Fig. 3). The data of Walczak et al. (2002) were digitally extracted from their graphs using the open-access Engauge Digitizer 12.1 software (Mitchell et al., 2019). The other three data sets were available as raw data. Table 1 summarizes the selected properties of the components used to compose each of the four data sets.
Table 1Properties of the components constituting the investigated binary mixtures. Porosity, if not provided, was calculated from particle density, bulk density and soil sample volume.
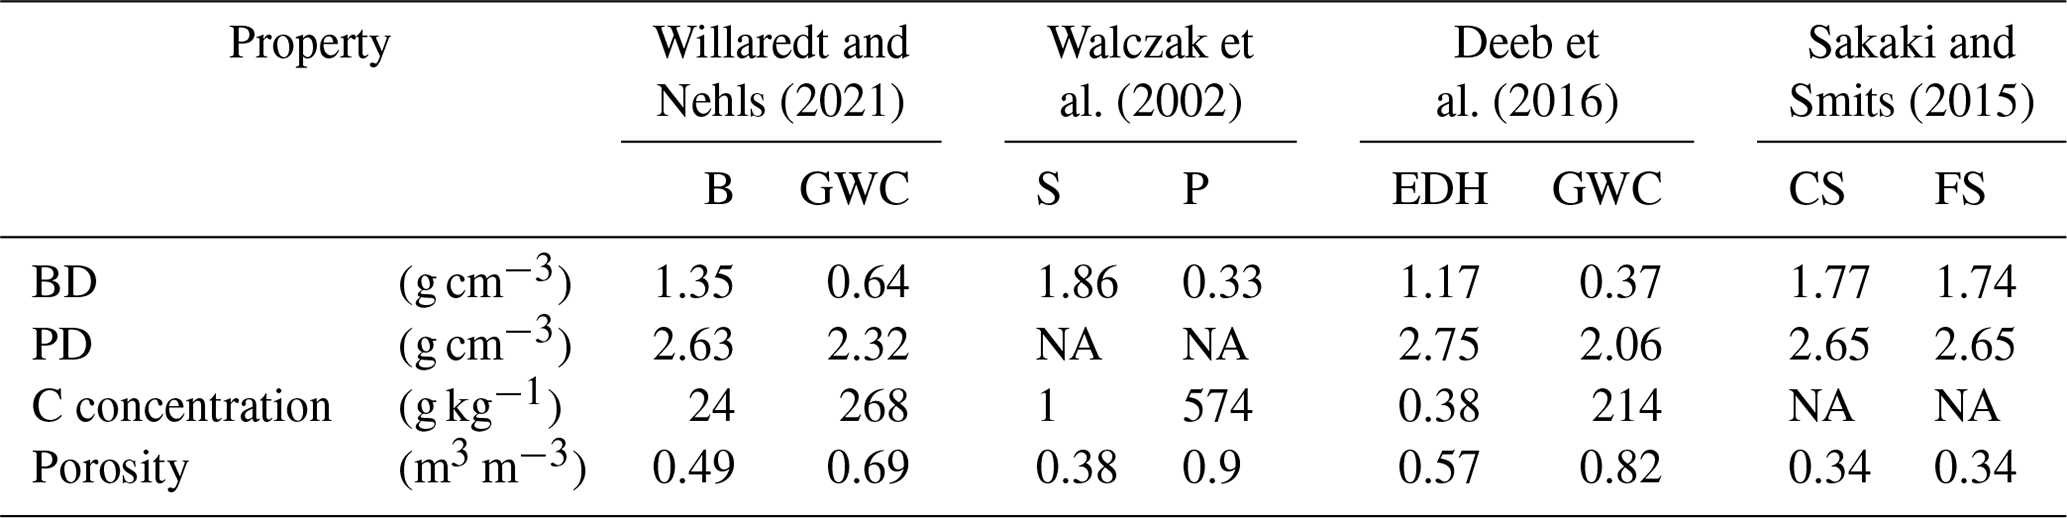
The abbreviations used in the table are as follows: B – ground bricks, GWC – green-waste compost, S – sand, P – peat, EDH – excavated deep soil horizon, CS – coarse sand, FS – fine sand, BD – bulk density, PD – particle density and NA – not available.
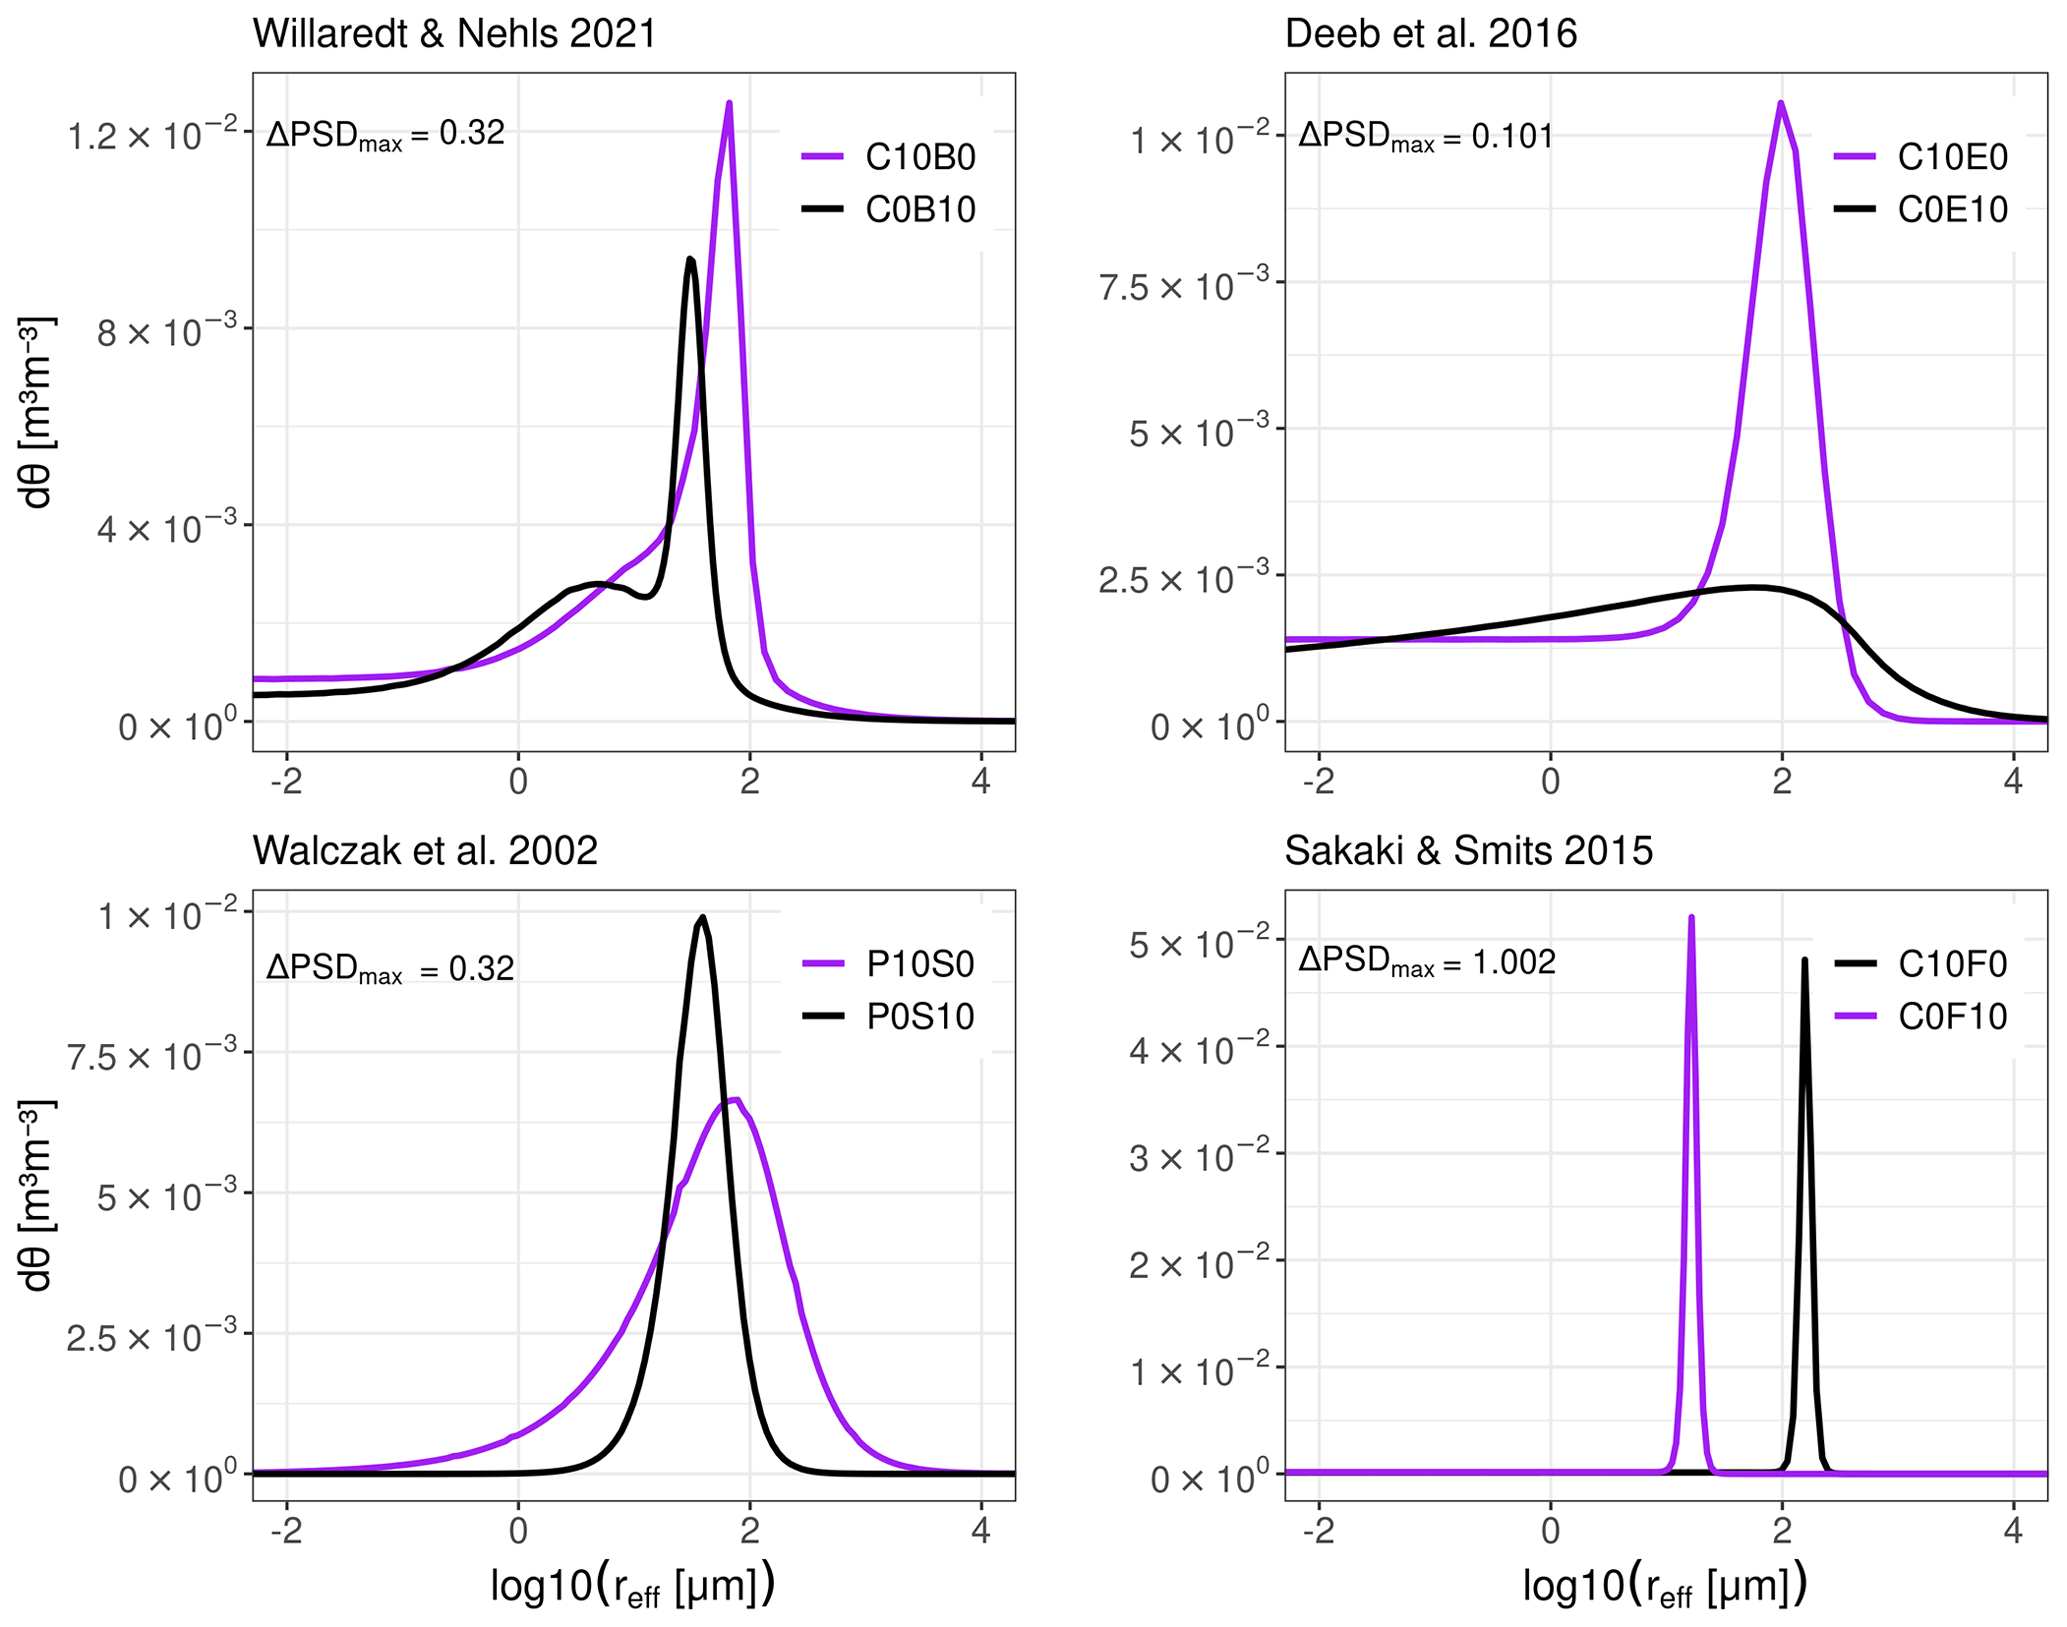
Figure 3Pore size distribution of each component used to create the binary mixtures. The magnitude of the distance between each curves' maxima ΔPSDmax describes the size difference in the most abundantly occurring pores in both components. dθ stands for the pore density and reff represents the effective pore radius.
Deeb et al. (2016) combined the excavated deep soil horizon from construction sites (EDH) with green-waste compost (GWC) to create mixtures containing volumetric GWC shares of 0 %, 10 %, 20 %, 30 % 40 %, 50 % and 100 %, referred to as C0E10, C1E9, C2E8, C3E7, C4E6, C5E5 and C10E0, respectively. Four replicates of each mixture were put into planting containers, and samples were taken from their surface. The volumetric water contents of the samples were assessed at eight matric potentials h (cm) using the sand box method for h of −2, −9.8 and −31 cm and a pressure-plate apparatus for matric potentials h of −310, −980, −1550, −4910 and −15 540 cm.
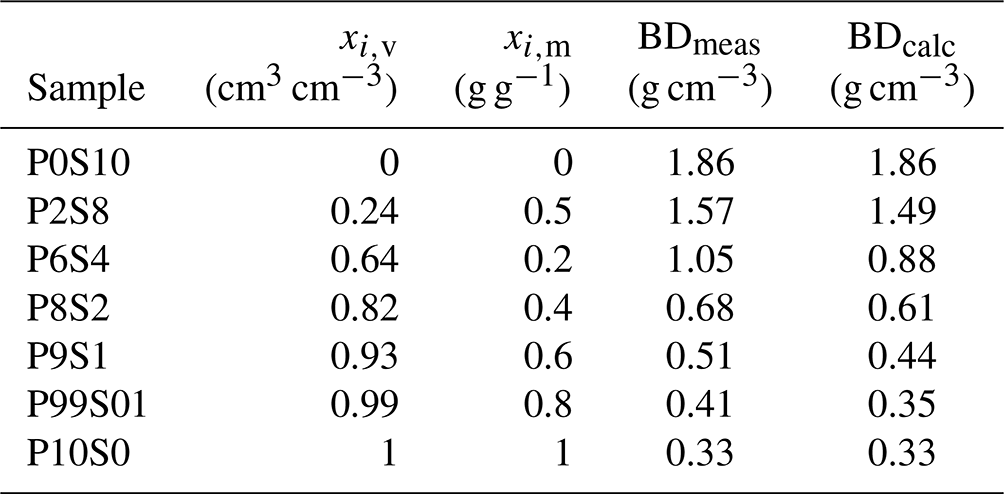
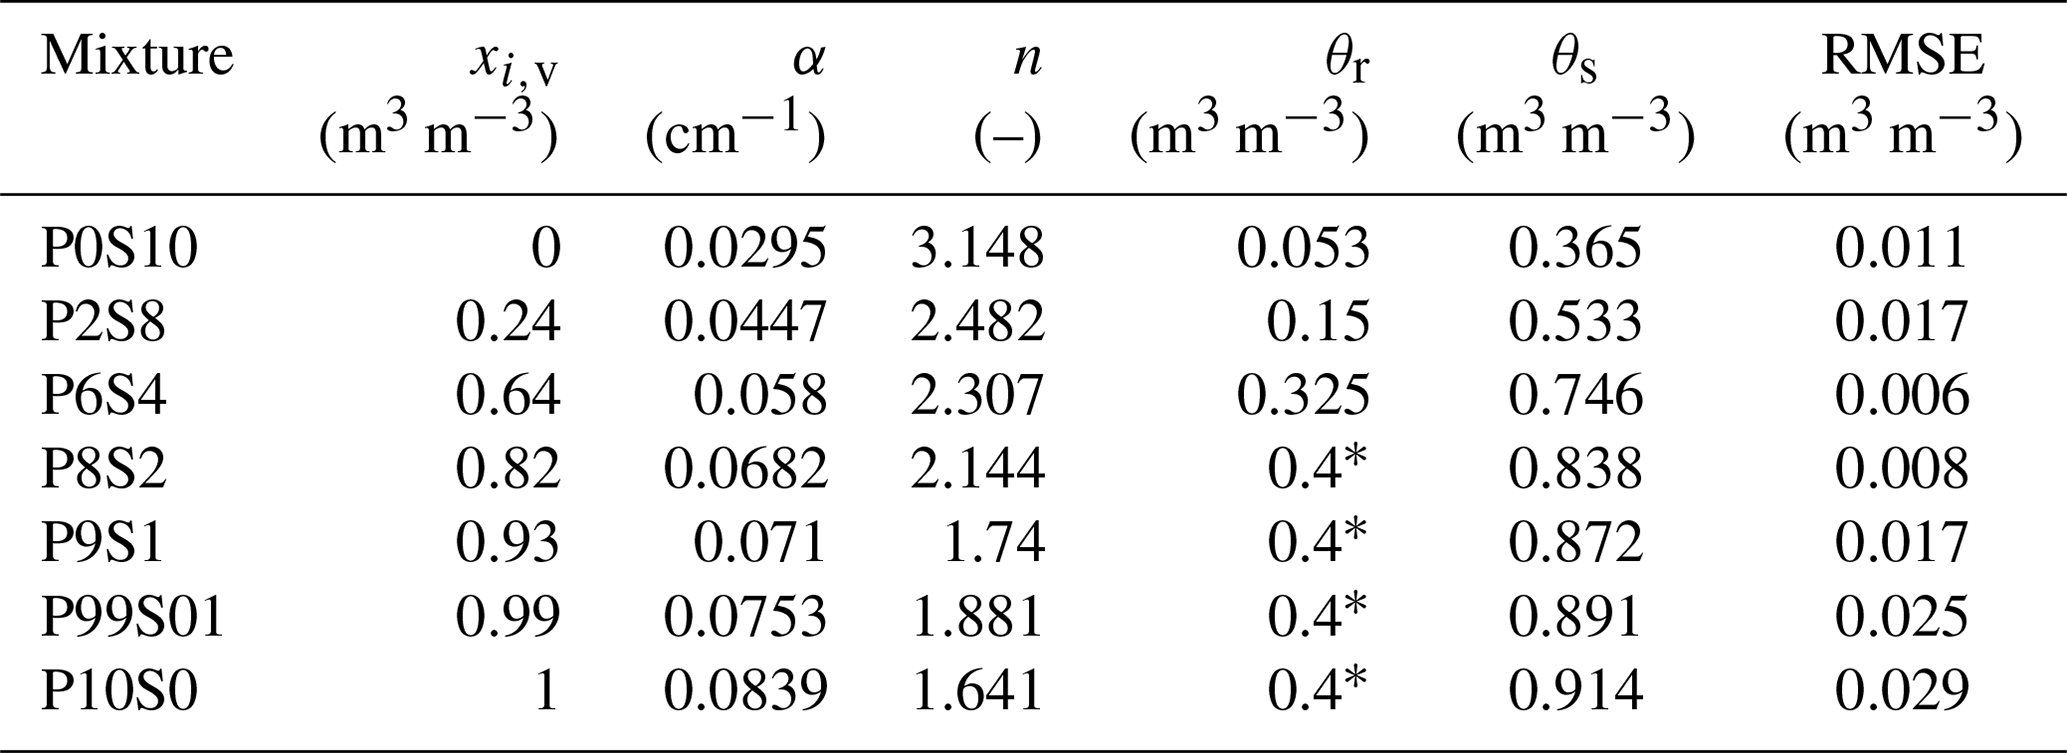
Walczak et al. (2002) created mixtures of peat and sand with mass-specific contents of dry peat xi,m of 0, 0.05, 0.2, 0.4, 0.6, 0.8 and 1 (mass/mass), with i (–) referring to the specific mixture. For our analysis, the volumetric peat content xi,v (–) of each mixture was determined based on the given bulk densities (BDmeas) and the mass-specific contents of the mixtures using the following equation:
The BD of peat and sand are 0.33 and 1.86 g cm−3, respectively. Table 2 summarizes the volumetric ratios of the mixtures and the deviations between the measured and calculated BD resulting from the conversion of gravimetric to volumetric contents. It indicates the magnitude of error introduced by such a conversion. The sample names of the mixtures reflect the order of magnitude of the volumetric peat content. The WRCs of all mixtures were determined using pressure-plate extractors at seven different values of h: −1, −10, −31.6, −100, −158.5, −1000 and −15 848.9 cm.
Table 2The converted volumetric share of peat derived from the mass-specific mixing ratio and the magnitude of the resulting error.
Willaredt and Nehls (2021) used different binary mixtures of ground bricks (B) and green-waste compost (GWC) with the following volumetric shares of GWC: 0 %, 18 %, 28 %, 37 %, 47 %, 68 % and 100 %. The following respective denominations refer to the rounded bulk volumetric share of GWC: C0B10, C2B8, C3B7, C4B6, C5B5, C7B3 and C10B0. The WRCs of five replicates of each mixture were measured by combining the simplified evaporation method (Schindler, 1980; Peters et al., 2015), using a HYPROP device (METER Group, Munich, Germany), and the dew point method (Campbell et al., 2007), using a WP4C device (METER Group, Munich, Germany). For details of the measurements and the data evaluation, the reader is referred to Willaredt and Nehls (2021).
Sakaki and Smits (2015) combined coarse sand (mean grain size D=1.04 mm) and fine sand (mean grain size D=0.12 mm), thereby choosing two components with a pronounced difference in particle size. They obtained high-resolution water retention measurements for matric potentials ranging between −1 and −135 cm using an induced drainage process in a modified Tempe cell set-up (Sakaki and Illangasekare, 2007).
2.2.2 Mathematical representation
We used the SHYPFIT 2.0 software (Peters and Durner, 2015) to fit parametric water retention models to the data. For each data set, we chose the model presenting the best performance with respect to matching the observations in the respective measurement range without over-parametrization. The detailed model descriptions, obtained parameters, the root-mean-square error (RMSE) values between the models and observations are summarized in the Appendix (Tables A1–A4). The data of Willaredt and Nehls (2021) were measured in high resolution and showed a complex pore structure; thus, the Peters–Durner–Iden (PDI) model (Peters, 2013; Iden and Durner, 2014; Peters, 2014), with the unconstrained bimodal van Genuchten basic function (van Genuchten, 1980), was fitted to the data (see Eqs. A1, A4 and A5). The model was fitted to all replicates of each mixture.
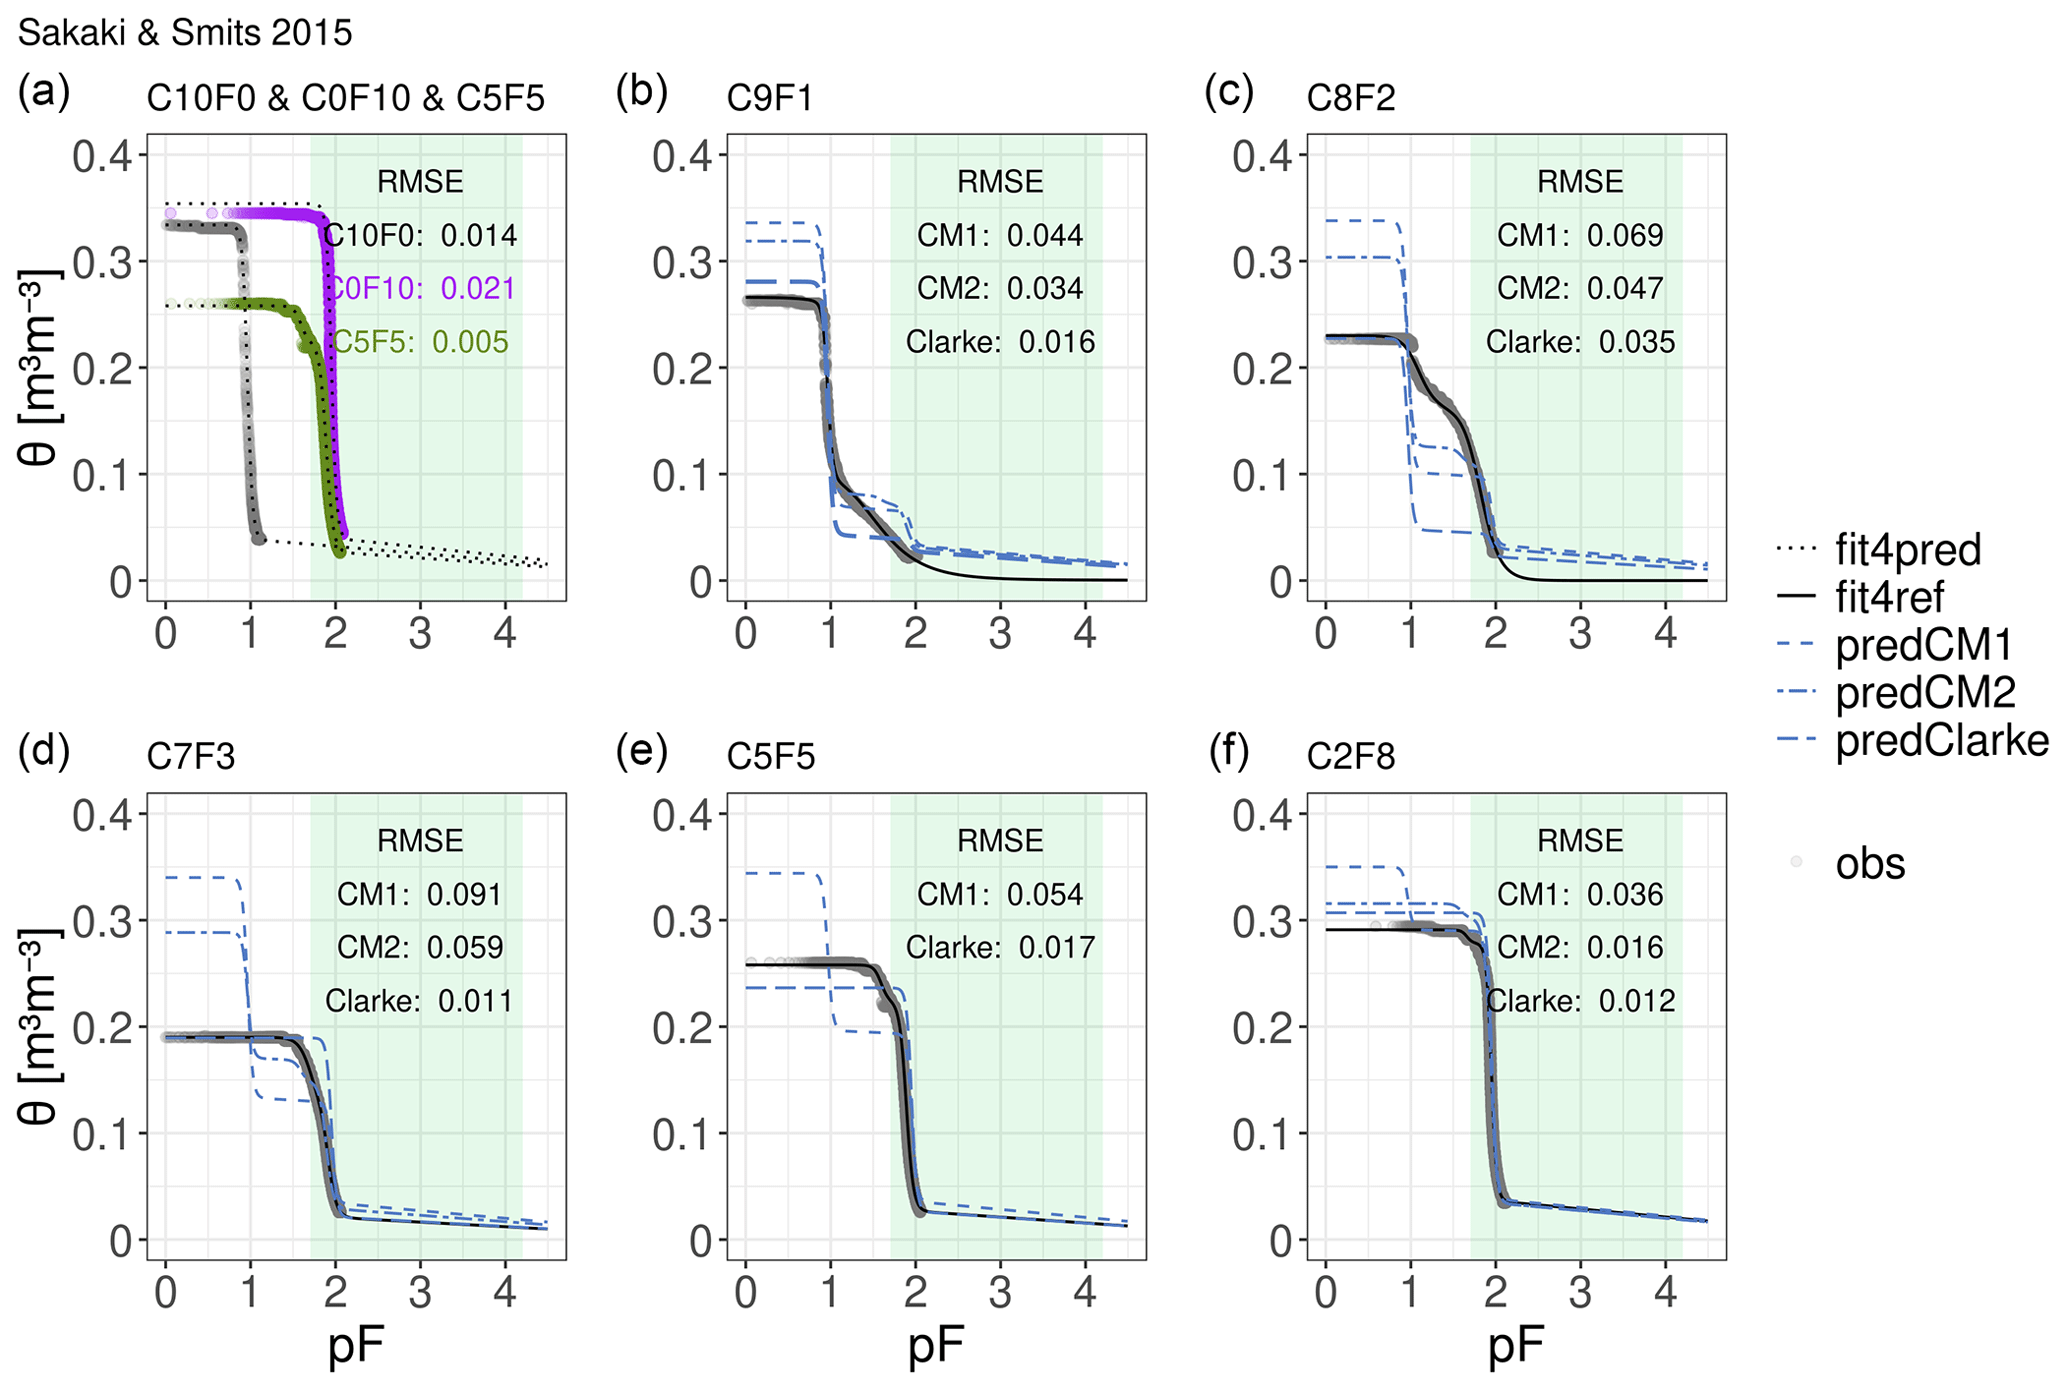
Figure 4Water retention curves of all seven binary mixtures produced from coarse sand (C10F0) and fine sand (C0F10). Observations (obs) are represented by grey dots, fitted curves are represented by black lines (i.e. reference curves as solid lines, fit4ref; see Table A2 for fitting parameters and model specification) and predicted curves (pred) are represented by dashed blue lines. CM1 stands for the basic compositional model, CM2 denotes the extended scheme and Clarke stands for the adapted model from Clarke (1979). Panel (a) assembles the fitted WRCs of the pure components and the intermediate mixture as dotted black lines (fit4pred), which constitute the input for the compositional model. Panels (b)–(f) show the predicted WRCs of each produced mixture as well as the observations and the reference WRCs. The RMSE describes the deviation between the predictions and the reference curves. Note that C5F5 is not predicted by the extended model scheme because it is considered to be the intermediate mixture.
Due to their limited matric potential range but high resolution (Fig. 4), the data sets of Sakaki and Smits (2015) were described with the PDI model using the constrained bimodal van Genuchten function (Durner, 1994) (see Eqs. A1, A3 and A5). The data sets of Deeb et al. (2016) and Walczak et al. (2002) comprise fewer observations (n=9 and n=7, respectively, for each mixture); thus, for those data sets, unimodal models were applied, as the fitting of a small number of parameters results in more robust fitting and, consequently, more robust predictions. The data set by Deeb et al. (2016) was best represented by the PDI model with the unimodal constrained model of van Genuchten (1980) as the basic function (see Eqs. A1 and A3), whereas the data set of Walczak et al. (2002) was best represented using the original unimodal constrained model of van Genuchten (1980) (see Eq. A3). The latter can be explained by the comparably high remaining water contents at high matric potentials. The fitted curves for the pure components and the intermediate mixtures (referred to as “fit4pred”) were used as model input to predict the WRCs (referred to as “pred”) of all binary mixtures. The fitted curves for all other mixtures were used as reference curves (referred to as “fit4ref”) to subsequently assess the quality of predictions.
2.3 Testing
We evaluate the predictive performance of the described compositional model approaches by calculating the RMSE values between the predicted curves (pred) and the reference curves (fit4ref):
where θfit4ref (–) is the water content at the specific matric potential given by the model fitted to the observations, θpred (–) is the predicted water content using one of the compositional models and r (–) is the number of points on the curves used. Furthermore, we analyse the absolute deviation as the difference between the predicted and reference water contents at similar matric potentials, meaning that positive deviations indicate that the prediction overestimates the water contents compared with the value of the reference curve, whereas negative deviations underestimate the water contents compared with the value of the reference curve.
2.4 Model application
We demonstrate two ways of applying predicted WRCs for further soil hydrological characterization and the selection of suitable Technosol mixtures. For these examples, we employ the binary mixtures of Willaredt and Nehls (2021) and Deeb et al. (2016) for use in urban green infrastructure.
2.4.1 Prediction of hydraulic conductivity functions
In order to simulate transport processes in constructed Technosols, not only the WRC but also the unsaturated hydraulic conductivity curve (HCC) is required. However, observations of HCCs, especially in the unsaturated moisture range, are rarely available. Therefore, we used the approaches for absolute non-capillary and capillary conductivity within the PDI scheme outlined by Peters et al. (2021, 2023). Their approach does not require any measured conductivity value as a matching point, but it does call for the separation of capillary and non-capillary water retention. The following procedure was applied to achieve this requirement: after predicting the WRCs with our compositional approach outlined above, we refitted the same parametric models to the predicted curves. These refitted model curves were then used for the prediction of the absolute HCC. In line with Peters et al. (2023), we selected the value of the HCCs at h=6 cm, corresponding to a pore diameter of 5 mm, to derive the so-called saturated matrix conductivity, Ks,matrix (cm d−1), which mimics the saturated conductivity for cases in which macropores are absent.
2.4.2 A case study of predicted water and air distribution
We calculated the distribution of air and water based on the predicted and the reference WRCs in a containerized constructed Technosol. This demonstrates the application of predicted soil hydraulic properties to a real-world problem. As an example, we chose a 0.5 m high raised bed with constant water saturation at the bottom. Furthermore, we assume hydrostatic equilibrium and calculate the matric potential across the whole profile; thus, the matric potential at the upper boundary is approximately pF 1.7. The air content is simply calculated as θs−θ(z), where θs (m3 m−3) stands for the water content at saturation and θ(z) (m3 m−3) represents the water content at the matric potential corresponding to the soil depth z (m) in the container.
3.1 Pore size distribution in components of binary mixtures
The difference between the maxima of the pore size distributions ΔPSDmax (m) of the components provides a useful measure for choosing the right type of model to predict any mixture's WRC. Figure 3 assembles the pore size distribution curves computed for all components used to create binary mixtures. Each plot is supplemented with the value of ΔPSDmax. This quantifies the order of magnitude between the size of the most abundantly occurring pore sizes in both components.
In the data of Willaredt and Nehls (2021), the pore size corresponding to the maxima of the PSD in green-waste compost (C10B0) is approximately twice as big as the PSDmax in ground bricks (C0B10). The sand (P0S10) and peat (P10S0) chosen for the mixtures prepared by Walczak et al. (2002) show a similar difference. The smallest difference was determined for the excavated deep soil (C0E10) and green-waste compost (C10E0) (Deeb et al., 2016), with the most abundantly present pores in green-waste compost being only 1.26 times larger than those in the excavated deep soil horizon. The most pronounced difference between the PSDmax was determined for the mixture of coarse sand (C10F0) and fine sand (C0F10) studied by Sakaki and Smits (2015). Here, the size difference between the most abundantly occurring pore size in coarse sand is 10 times larger than the dominant pore size found in fine sand. The PSD of the components that are relevant for Technosol construction (i.e. GWC, ground bricks, peat, sand and excavated deep soil horizon material) show small differences between their PSDmax values. Hence, the difference between them is too small and the two pore systems will not interlock, as is the case for the fine and coarse sand used by Sakaki and Smits (2015) (see Fig. 1). Based on these differences, the model type can be selected. The predictions for the data sets by Willaredt and Nehls (2021), Walczak et al. (2002), and Deeb et al. (2016) were generated using the zero-mixing approach, corresponding to the basic scheme of the compositional models. The ideal-mixing model type was applied to the data by Sakaki and Smits (2015). In mixtures formulated with more then two components or with components containing coarse particles with inner porosity (e.g. bricks), three maxima would have to be considered. Not every mode in the single component's PSD is necessarily visible in the mixtures, as the PSD may intertwine.
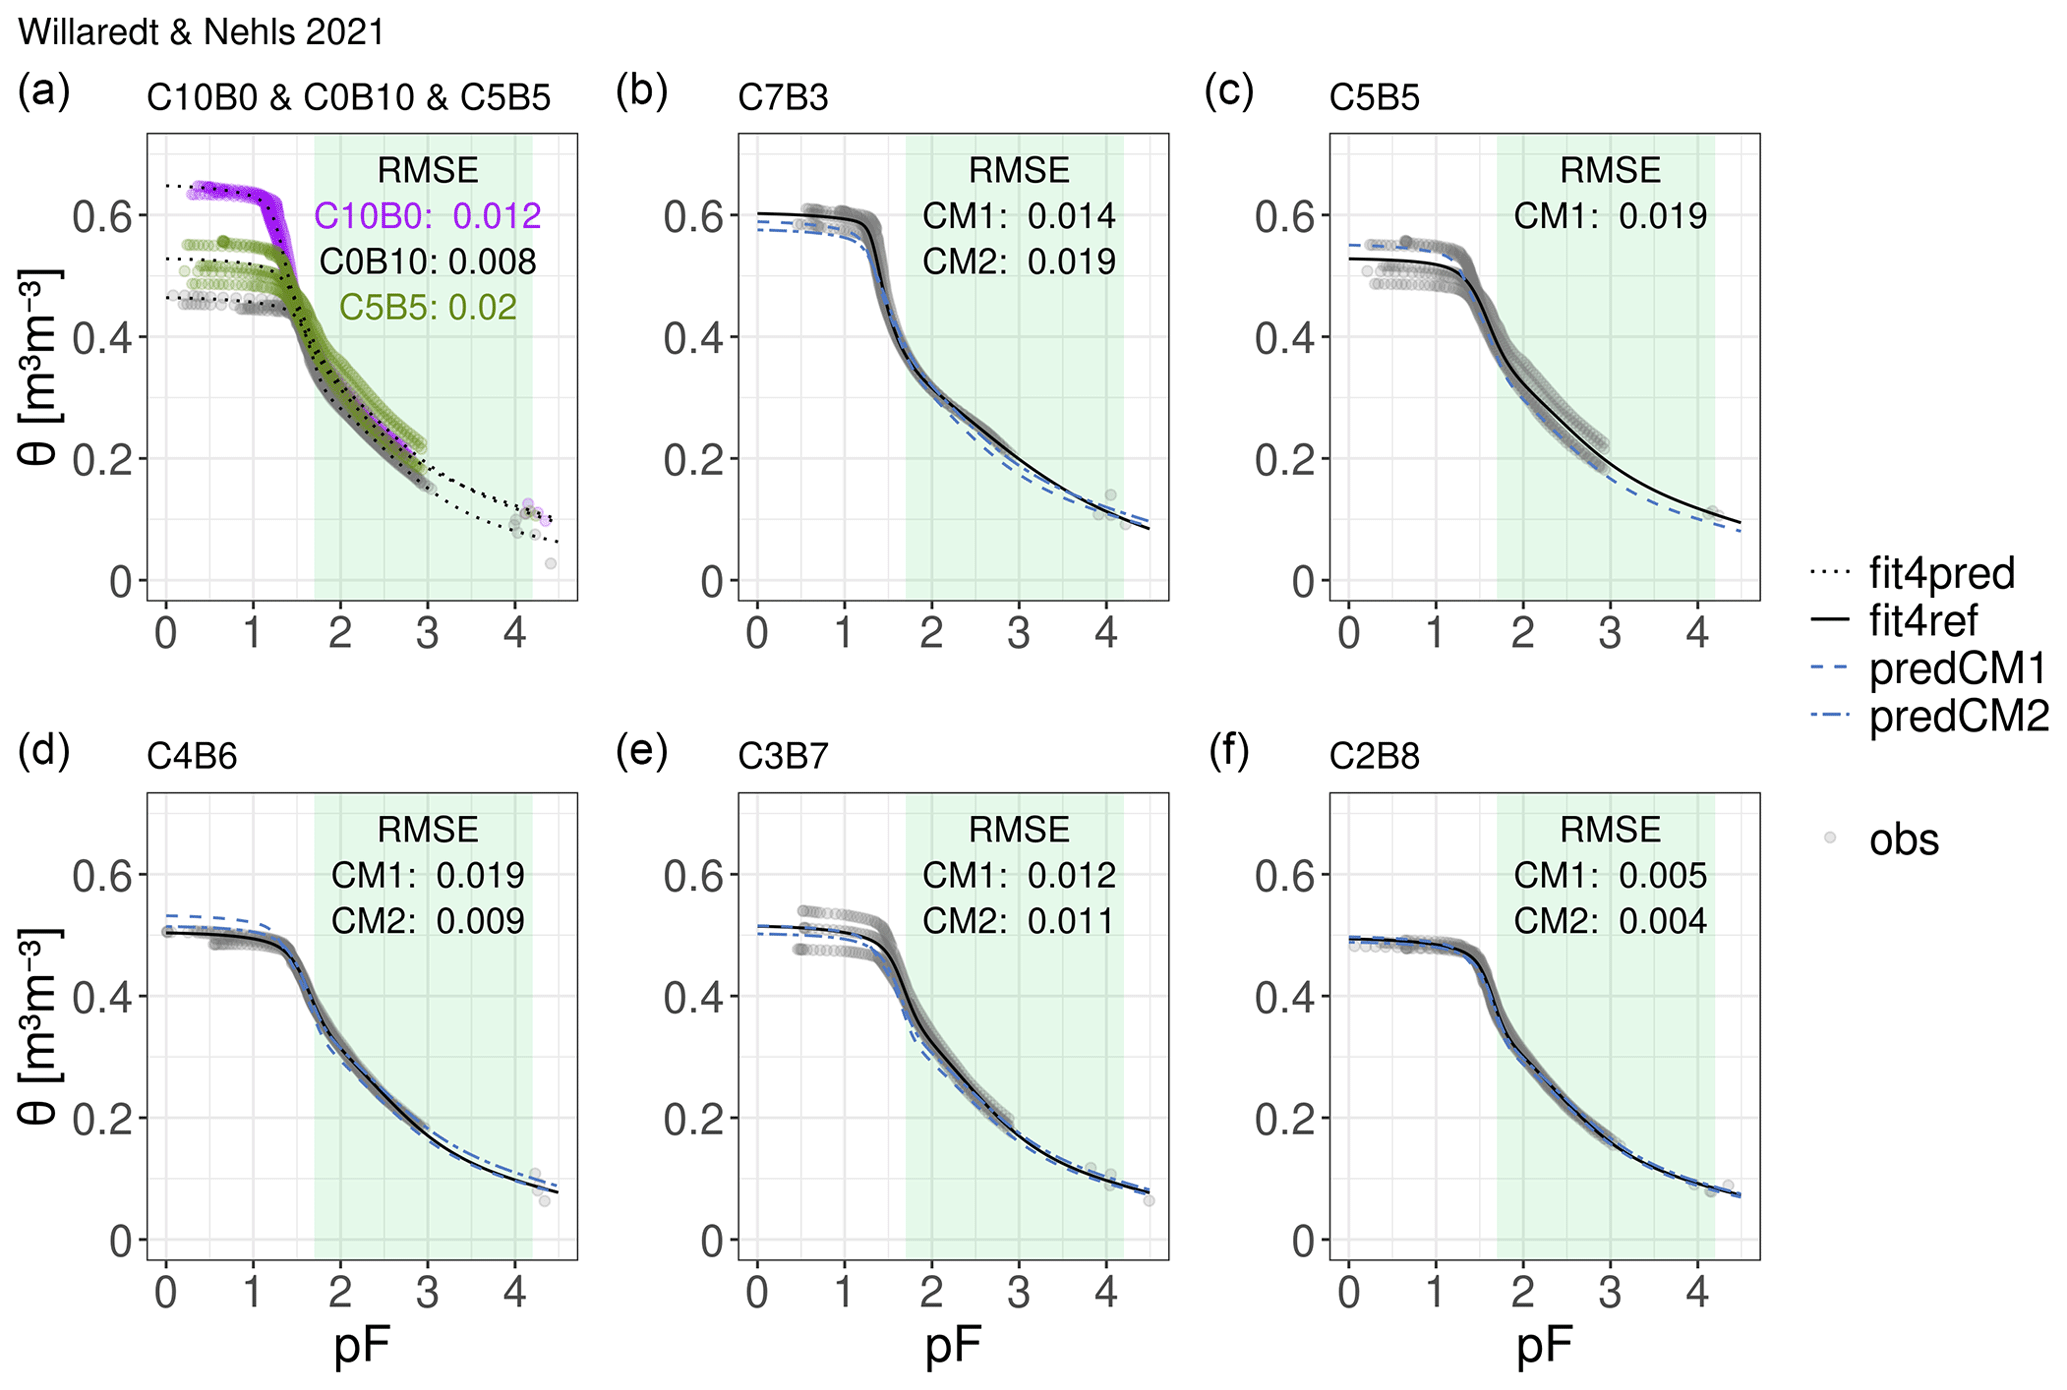
Figure 5Water retention curves of all seven binary mixtures of ground bricks (C0B10) and green-waste compost (C10B0). Observations (obs) are represented by grey dots, fitted curves are represented by black lines (i.e. reference curves as solid lines, fit4ref; see Table A1 for fitting parameters and model specification) and predicted curves (pred) are represented by dashed blue lines. CM1 stands for the basic compositional model and CM2 denotes the extended scheme. Panel (a) assembles the fitted WRCs of the pure components and the intermediate mixture as dotted black lines (fit4pred), which constitute the input for the compositional model. Panels (b)–(f) show the predicted WRCs of each produced mixture as well as the observations and the reference WRCs. The RMSE describes the deviation between the predictions and the reference curves. Note that C5B5 is not predicted by the extended model scheme because it is considered to be the intermediate mixture.
3.2 Impact of data quality and resolution
The pore size distributions in Fig. 3 only show bimodality for the data set of Willaredt and Nehls (2021); this is likely due to the high resolution of the WRC. Therefore, a bimodal parametric model was chosen to represent the WRC. The bimodality is more pronounced for the ground bricks (C0B10). The assumption is that this is due to their inner porosity, which was found for ground-brick particles bigger than 0.2 mm (Nehls et al., 2013). The green-waste compost (C10B0) also has a secondary pore system, with most pores having a size of approximately 1 µm. It is likely that the green-waste compost used in the mixtures formulated by Deeb et al. (2016) presents a similar structure; however, due to the comparably small number of observations on the curve, such a structure remains undetected. Therefore, we stress the importance of high-resolution measurements and a wide range of matric potentials on which the presented predictions of mixtures' WRCs should be based. The evaporation method implemented in the HYPROP device accounts for high-resolution measurements; however, the measurement range here should be extended towards higher matric potentials using complementary measurements, e.g. with a WP4C dew point water potential meter (Flores-Ramírez et al., 2018). Furthermore, we identify the need to systematically measure the WRCs of materials that have been identified as suitable components in Technosol construction (e.g. those compiled in Rokia et al., 2014). A comprehensive database would be helpful to further validate and narrow down thresholds of ΔPSDmax. Thus far, ΔPSDmax has been used as a qualitative description, but a more precise quantification should be done based on more data sets.
3.3 Predicted water retention curves
The plots in Figs. 4–7 illustrate the comparison between the predicted WRCs and the reference WRCs. The first panel in each plot shows the curves of the pure components (fit4pred) used as model input. The curves are presented along with the corresponding RMSE, which quantifies the average deviation between the predictions and the respective reference curves.

Figure 6Water retention curves of all seven binary mixtures of sand (P0S10) and peat (P10S0). Observations (obs) are represented by grey dots, fitted curves are represented by black lines (i.e. reference curves as solid lines, fit4ref; see Table A4 for fitting parameters and model specification) and predicted curves (pred) are represented by dashed blue lines. CM1 stands for the basic compositional model and CM2 denotes the extended scheme. Panel (a) assembles the fitted WRCs of the pure components and the intermediate mixture as dotted black lines (fit4pred), which constitute the input for the compositional model. Panels (b)–(f) show the predicted WRCs of each produced mixture as well as the observations and the reference WRCs. The RMSE describes the deviation between the predictions and the reference curves. Note that P6S4 is not predicted by the extended model scheme because it is considered to be the intermediate mixture.
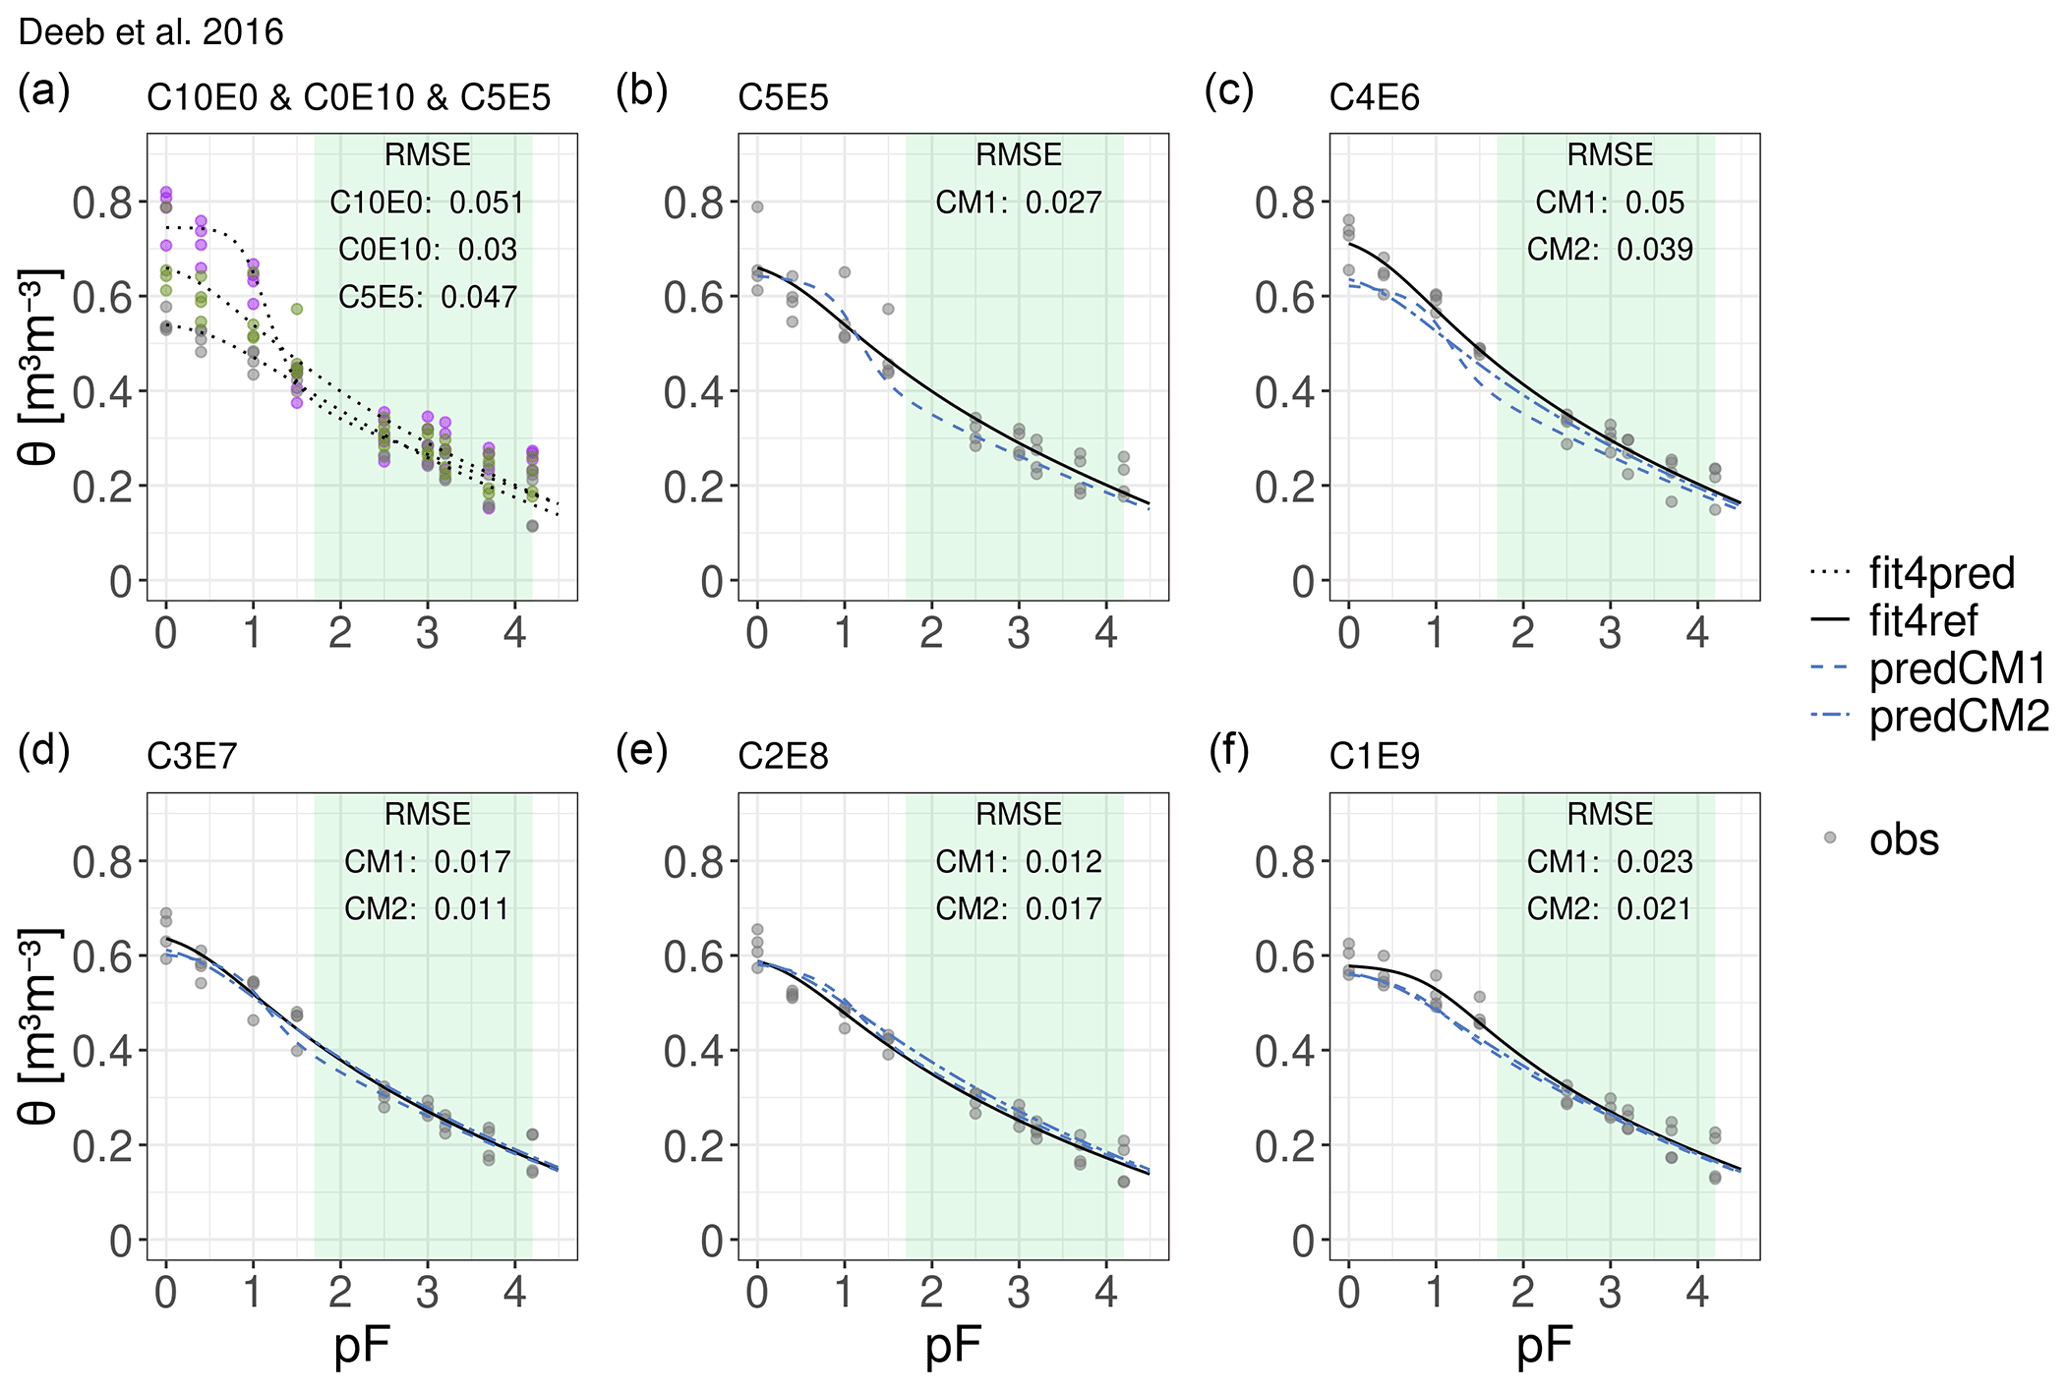
Figure 7Water retention curves of all seven binary mixtures of the excavated deep soil horizon (C0E10) and green-waste compost (C10E0). Observations (obs) are represented by grey dots, fitted curves are represented by black lines (i.e. reference curves as solid lines, fit4ref; see Table A3 for fitting parameters and model specification) and predicted curves (pred) are represented by dashed blue lines. CM1 stands for the basic compositional model and CM2 denotes the extended scheme. Panel (a) assembles the fitted WRCs of the pure components and the intermediate mixture as dotted black lines (fit4pred), which constitute the input for the compositional model. Panels (b)–(f) show the predicted WRCs of each produced mixture as well as the observations and the reference WRCs. The RMSE describes the deviation between the predictions and the reference curves. Note that C5E5 is not predicted by the extended model scheme because it is considered to be the intermediate mixture.
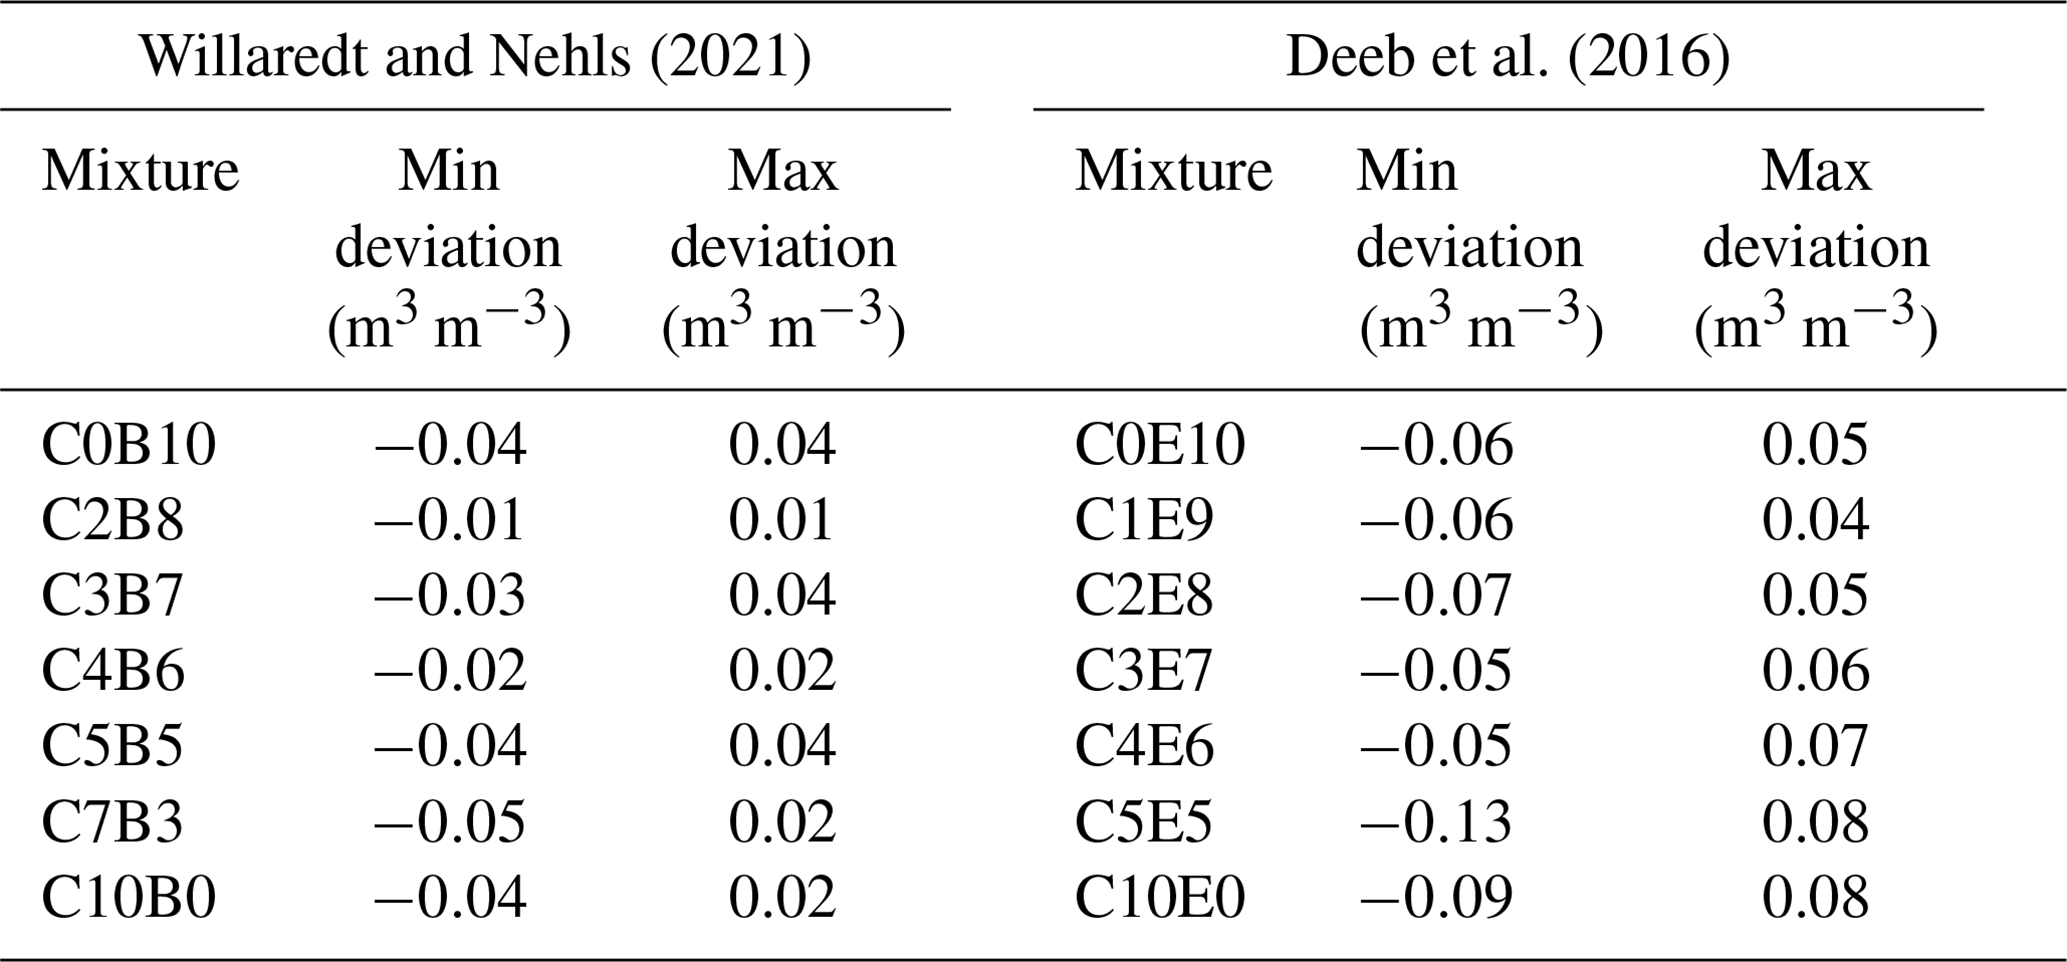
Table 3The maximum and minimum deviation between observations and the corresponding mathematical representations of the volumetric water contents of all observed matric potentials. The data of Willaredt and Nehls (2021) were represented with the PDI model (Peters, 2013; Iden and Durner, 2014; Peters, 2014) with the unconstrained bimodal (Durner, 1994) basic function of van Genuchten (1980), whereas the data set of Sakaki and Smits (2015) was described with the PDI model using the constrained bimodal van Genuchten function (Durner, 1994). The magnitude reflects the differences between the replicates due to different sampling strategies (packing cylinders to a defined weight for compaction vs. in situ sampling from containers).
The adapted Clarke model is suitable for predicting the water retention in the fine-controlled mixtures created by Sakaki and Smits (2015). This applies to mixtures C2F8, C5F5 and C7F3. For coarse-controlled mixtures, the Clarke model accounts well for the observations in the wet range; this is unsurprising, as it was adapted from a model for porosity prediction. Whereas the air entry point in mixture C9F1 is not impacted by the small volumetric share of fine sand, the volumetric share of fine sand in mixture C2F8 affects the curve. Neither the Clarke approach nor the basic/extended compositional model properly predicts the impact of the addition of small amounts of fine sand to the mixture. This can be explained by the heterogeneity of such a mixture, which develops when some of the pores formed by the large particles are filled with fine particles whilst others remain empty (Naseri et al., 2019). Mixtures of coarse and fine sand are not relevant for Technosol construction in practice. However, coarse expanded geogenic particles with inner porosity are popular commercial components in green-roof media and horticultural substrates (Hill et al., 2019). The description of their water retention characteristics by Flores-Ramírez et al. (2018) shows a clear bimodal pore structure. For constructed Technosols that contain coarse fragments with inner porosity, a modified version of the Clarke model that accounts for water retention within the coarse particles could be applied.
For the data set of Willaredt and Nehls (2021), the fitting quality of the mathematical representations is characterized by RMSE values ranging between 0.005 m3 m−3 for mixture C4B6 in the best case and 0.02 m3 m−3 for mixture C5B5 in the worst case (see Table A1 for the model specification and all RMSE values). The average deviation between the predicted WRC and the reference WRC is generally smaller than 2 %. Using the extended scheme improves the prediction with respect to the RMSE in three of the four cases (mixtures C4B6, C3B7 and C2B8). The compositional model led to similarly good results for the data of Walczak et al. (2002) (Fig. 6). Here, the RMSE between the predicted curves and reference curves ranges from 0.01 to 0.03 m3 m−3, with the same order of magnitude as the errors calculated between the observations and corresponding fitted curves, which ranged from 0.006 to 0.029 m3 m−3 (Table A4). Using the extended scheme for this data set improves the representation of the average for mixtures P2S8, P8S2 and P9S1. The improvements using CM2 are especially observable for pF values above 1.2. The deviations here reflect the comparably poor fit of the original unimodal constrained model of van Genuchten (1980) used to mathematically represent the data of pure peat (RMSE 0.029 m3 m−3). This leads to deviations in the predictions, which remain smaller if the extended scheme is applied.
3.4 Absolute deviations along the water retention curve
The RMSE, as a measure averaging deviations between predicted and reference curves, can mask the malperformance of the predictions in some parts of the curve. Therefore, considering the absolute deviations (see Fig. 8) over different matric potentials completes the assessment. Generally, for the data set of Willaredt and Nehls (2021), the deviation over all matric potentials does not exceed 4.2 % and is largest in the wet range. This is not surprising, as the retention characteristics close to saturation are highly influenced by soil structure and, thus, hardly predictable. The predictions made using the basic compositional model approach (CM1) tend to overestimate the water contents. In contrast, the extended scheme underestimates the water contents in the same pressure head range. Applying the extended scheme only diminishes the absolute deviation for mixture C4B6, which has a mixing ratio close to the intermediate mixture. For the data set of Walczak et al. (2002), using the extended scheme CM2 yields more accurate predictions in the dry range for mixtures containing volumetric shares of peat xv>0.6.
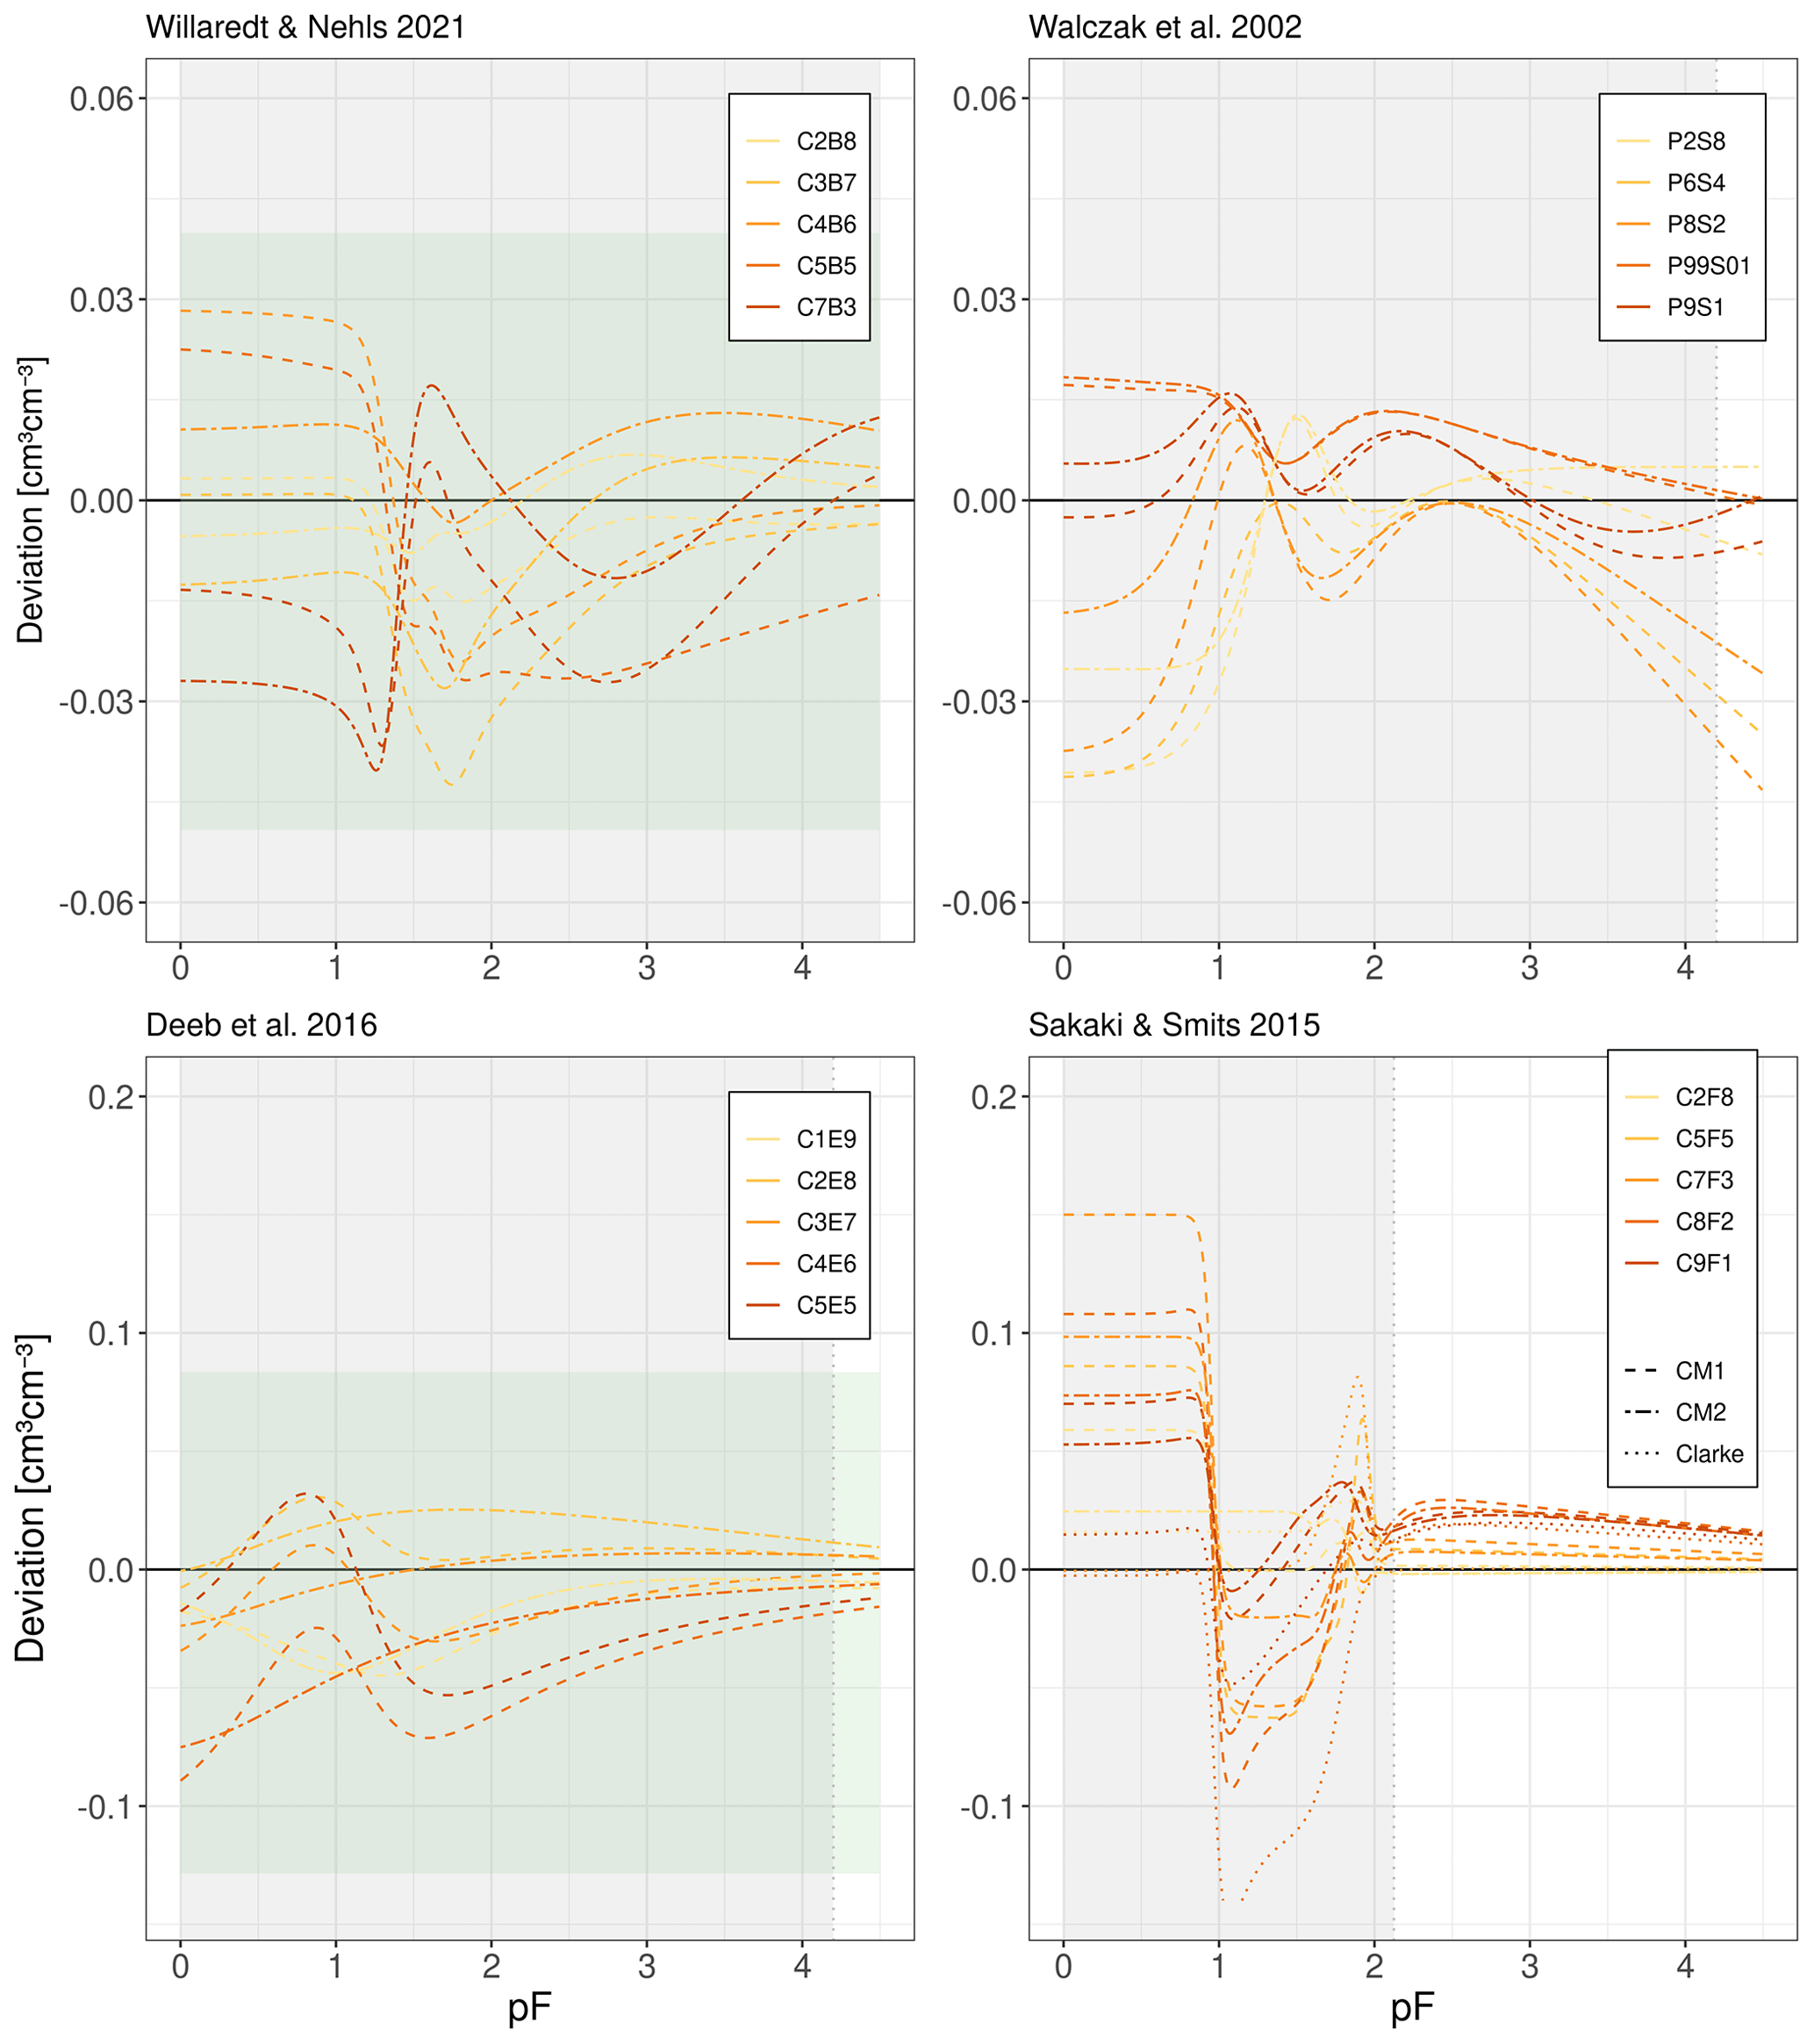
Figure 8Absolute deviation between predicted and reference water contents over different matric potentials. The shaded pressure head range in grey was covered by measurements. The solid line represents the deviation between predictions with the basic model scheme (CM1) and the reference values. The dashed line represents the deviation between the extended model scheme (CM2) and the reference values. The green ribbon illustrates the maximum deviation that occurred between the observations and the fitted mathematical representations.
Obviously, the method used for determining the WRCs of the main components has an impact on the prediction quality. The case of a larger deviation in the observed water contents between replicates leads to poor representations by the parametric fits that are used to predict WRCs of other mixtures. On the one hand, the deviation between the replicates of the components introduces an error when being used as model input for predicting the WRC of the mixtures; on the other hand, the deviation resulting from the uncertainties in the sample preparation of any mixture also defines the magnitude of the tolerable error when predicting the curves by the means of our model approach. The tested data sets of Deeb et al. (2016) and Willaredt and Nehls (2021) were derived from replicated observations (see Figs. 7 and 5). In addition to the RMSE values summarized in the corresponding figures, Table 3 provides the absolute maximal and minimal deviations from the corresponding mathematical representation for each observed mixture in the data set of Deeb et al. (2016) and Willaredt and Nehls (2021), thereby providing the magnitude of the tolerable error from our predictions. Those deviations are bigger for the data set obtained by Deeb et al. (2016) using a more practical sampling strategy from containers. Along the observed pressure head range, the biggest deviations occur in mixture C5E5. Here, the parametric fit underestimated the observed water contents in the worst case by 13 %. The deviations remain similarly large along all observed matric potentials. Following the sampling preparation protocol introduced by Willaredt and Nehls (2021) yields comparably smaller deviations of bulk densities. Here, the biggest misfit for the WRCs was observed for mixture C7B3: the parametric representation underestimated the observation by 5 %. In Fig. 8, it can be observed that the deviations decrease for higher tensions, except for mixture C5B5. According to Jackisch et al. (2020), this reflects a deviation related to different bulk densities of samples that are otherwise homogeneous. However, the deviations related to the different compaction of Technosols when used in practice are expected to be larger. Figure 8 visualizes the absolute deviations between the predictions and the parametric representations for all predicted WRCs. In the data sets from Willaredt and Nehls (2021) as well as from Deeb et al. (2016), the deviations remain smaller than the maximum deviations described in the section above.
3.5 A comparison of the basic and extended schemes
The plots in Fig. 8 show that, for the CM1 model, the largest deviations occur in the wet range, with the exception of the data set of Walczak et al. (2002). The extended scheme CM2 leads to smaller RMSE values and to smaller absolute deviations, except for a few cases: in the wet range for mixture C7B3 of the data set by Willaredt and Nehls (2021) and in the medium to dry range for mixture C2E8 of the data set by Deeb et al. (2016). Nonetheless, the curves predicted using the basic compositional model approach already represent the observations with a quality that does not warrant further improvement by additional laboratory work. However, an additional measurement of an intermediate mixture can always serve as a validation measurement, demonstrating that the approach does not fail for the chosen components of the Technosol formulation.
3.6 Model application for constructed Technosols
Based on the predicted WRCs, it is possible to analyse and compare the hydrologic performance of constructed Technosols (e.g. as planting substrates in urban green infrastructure). We can analyse the behaviour and perform the comparisons of (i) any possible mixing ratio and (ii) different components. The first type of comparison narrows down the infinite options provided by combining two components to a full range of mixtures, whereas the second type of comparison enables an exploration of the behaviour of potential components in mixtures and the selection of the most suitable components that provide plant-growth-supporting properties.
3.6.1 Hydraulic conductivity prediction
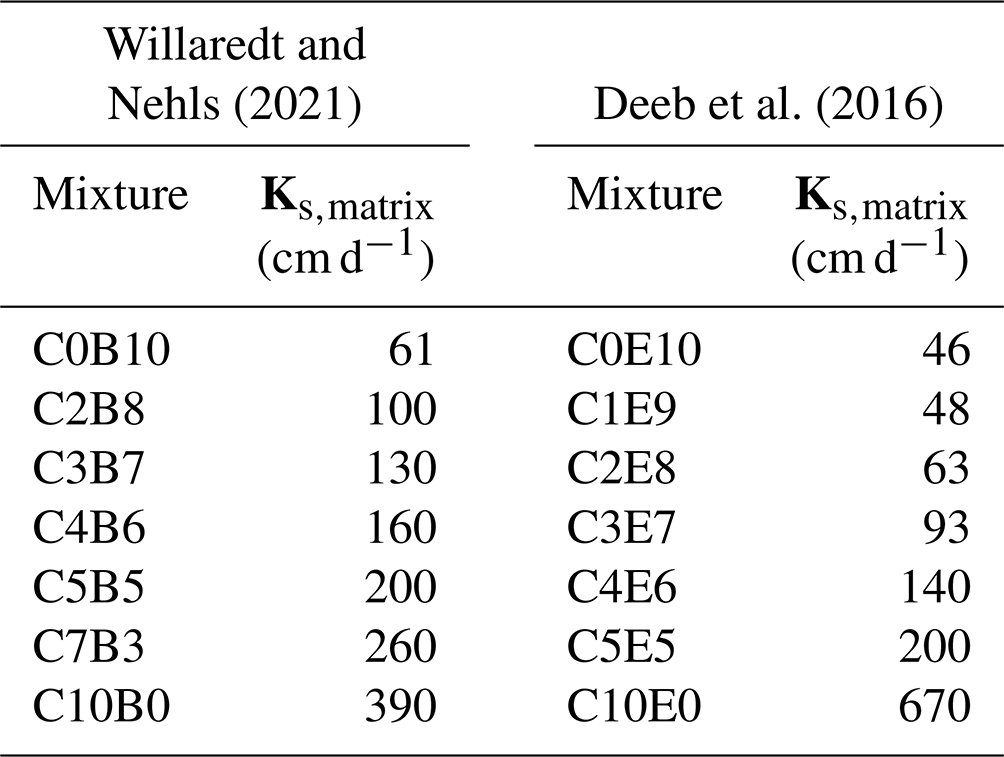
Figure 9 and Table 4 show the predicted hydraulic conductivity curves and the so-called saturated matrix conductivity (Ks,matrix). As expected for the wet range, the conductivity is higher in the coarser green-waste compost (390 cm d−1) compared with the conductivity in ground bricks (61 cm d−1) at a matric potential corresponding to pF 0.8 in the mixtures formulated by Willaredt and Nehls (2021). For the data set of Deeb et al. (2016), the conductivity spans a similar range, with 670 cm d−1 in green-waste compost and 47 cm d−1 in excavated deep soil.
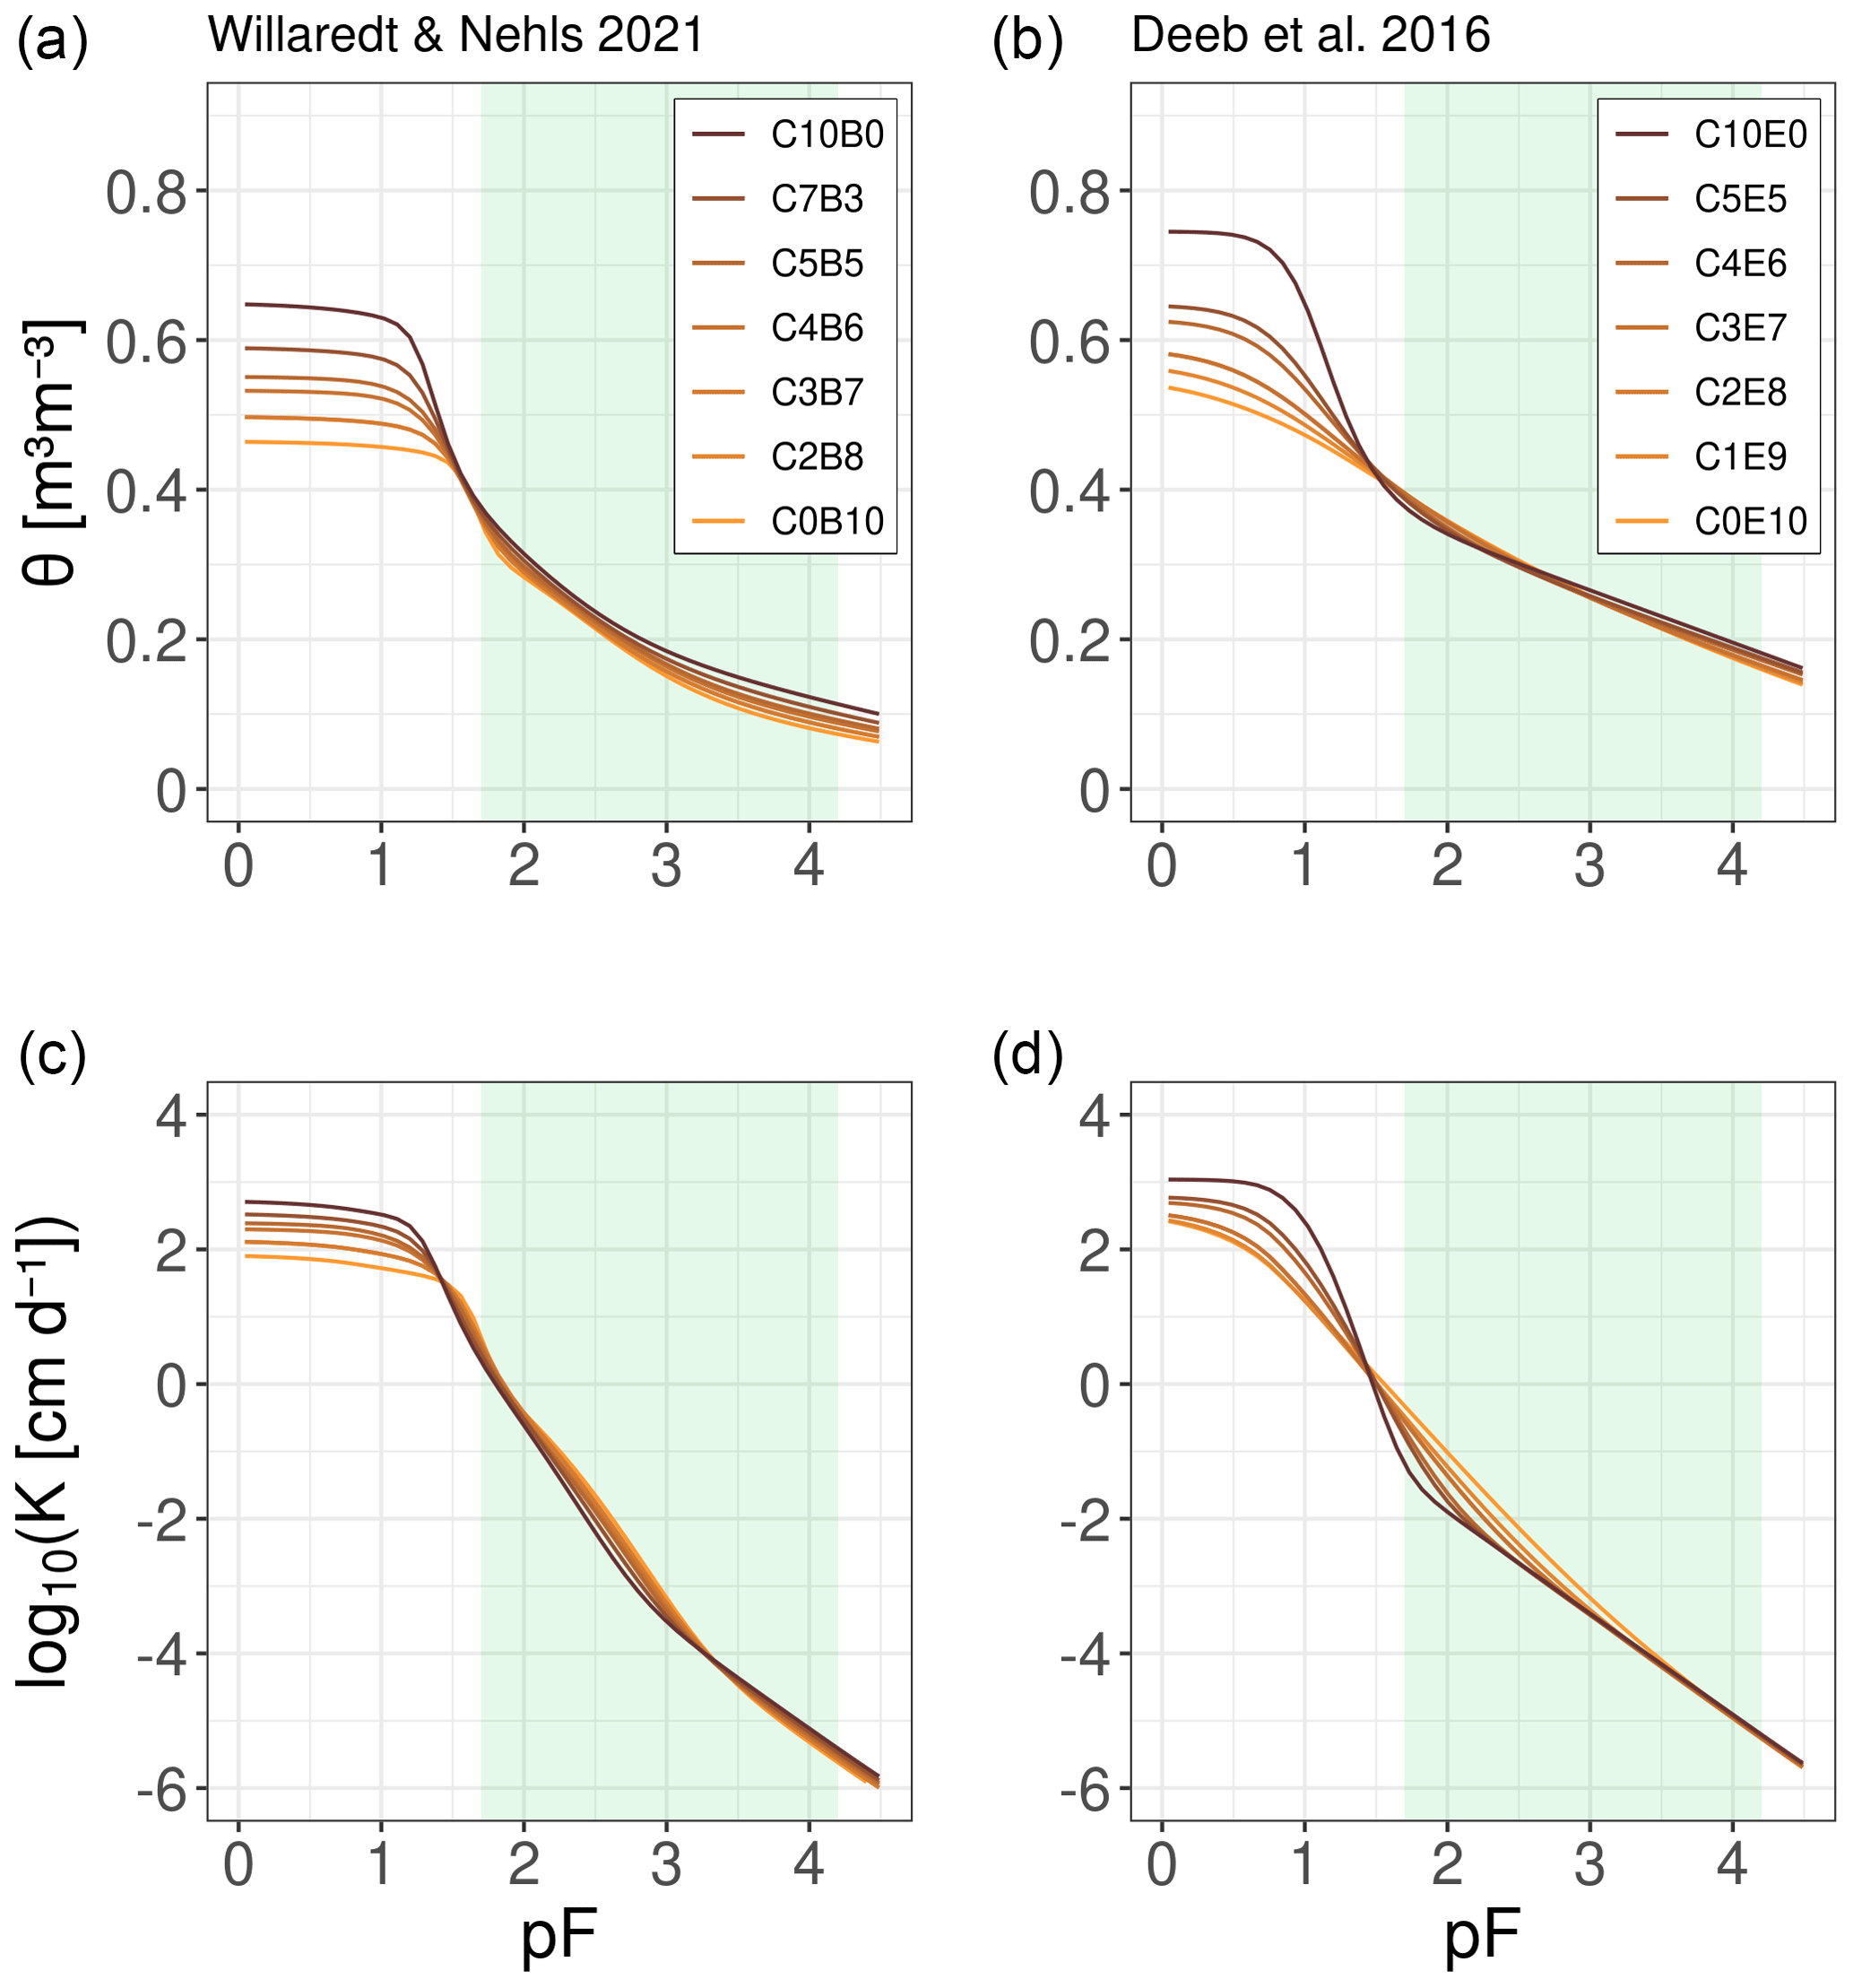
Figure 9Predicted soil hydraulic properties of binary mixtures. In panels (a) and (c), mixtures are formulated from green-waste compost and ground bricks, whereas they are formulated from green-waste compost and excavated deep soil in panels (b) and (d). WRCs were predicted using the compositional model in the simple scheme (CM1), and the soil hydraulic conductivity was predicted using the approaches of Peters et al. (2021, 2023).
Table 4Predicted saturated matrix conductivity for all mixtures of the full mixing range. Ks,matrix mimics the saturated conductivity if macropores are present (Peters et al., 2023).
The compositional model approach to predict the WRCs, together with the scheme for predicting the unsaturated hydraulic conductivity for the full range of pressure heads by Peters et al. (2023, 2021), allows full characterization of the soil hydraulic properties of any binary mixture. The properties required for modelling transient flow and transport processes in urban green-infrastructure elements, as demonstrated in Brunetti et al. (2016), can thus be obtained solely based on the measured water retention characteristics of the pure components that constitute the mixture. These results enable the design of Technosol compositions as well as the container dimensions of urban green infrastructure dedicated to water management applications under realistic atmospheric boundary conditions.
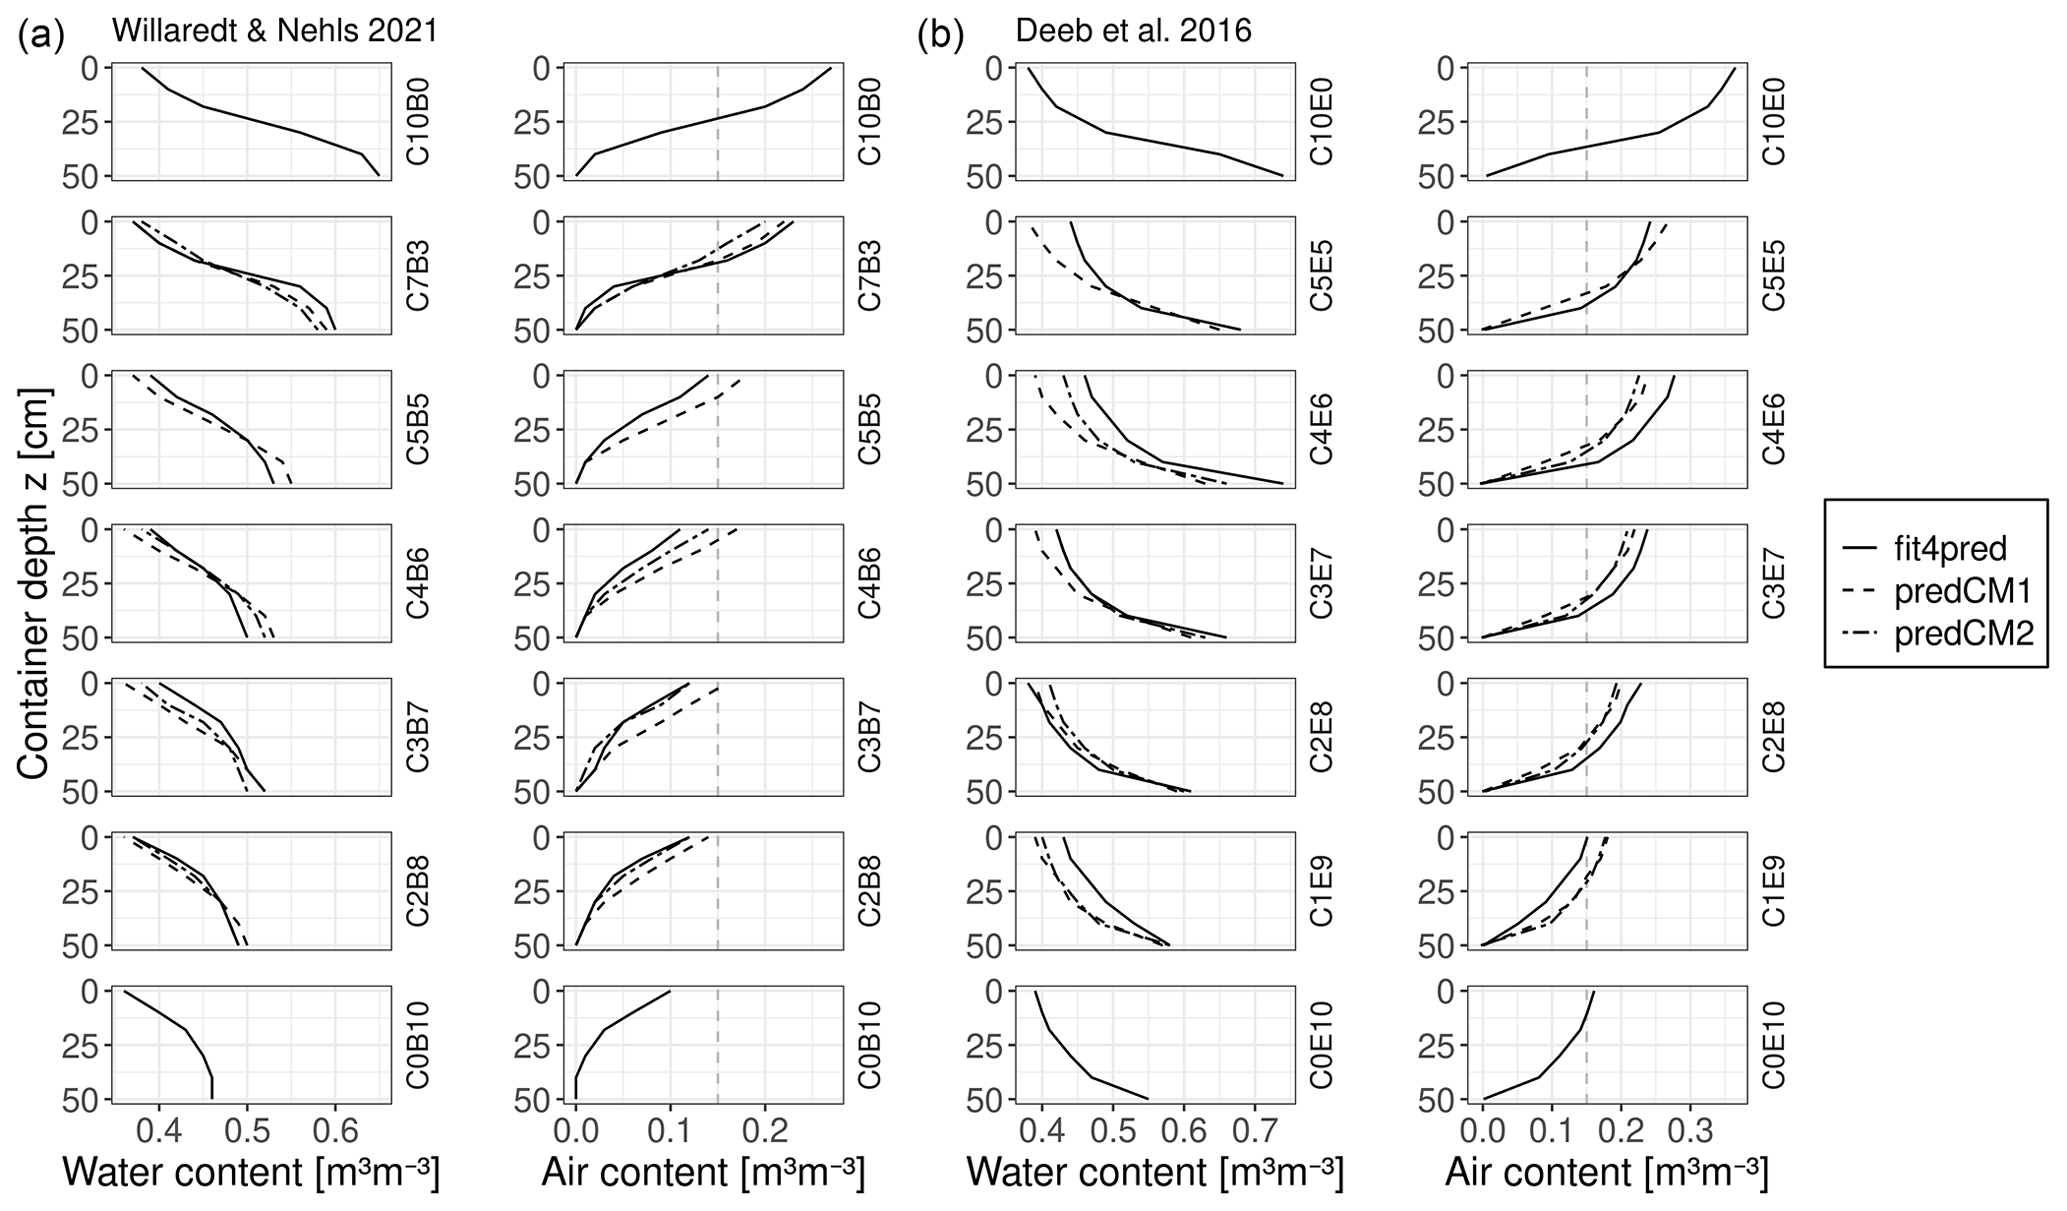
Figure 10Distribution of the volumetric water and air content over different depths at hydrostatic equilibrium in a container (corresponding to pF=1.7 at the top of the container) filled with a constructed Technosol formulated as a binary mixture of green-waste compost and ground bricks (a) and green-waste compost and excavated deep soil (b). The solid line indicates the reference WRCs; the dashed lines indicate predictions using the basic scheme (CM1) or the extended scheme (CM2), respectively; and the grey vertical line indicates the minimum volumetric air content in horticultural substrates favourable for root growth (Caron et al., 2015).
3.6.2 A case study of predicted water and air distribution
For a hydrostatic case, we calculated the distribution of water and air contents in the binary mixtures of Willaredt and Nehls (2021) and Deeb et al. (2016). Here, we assume that Technosols are implemented as planting substrates in a container of 0.5 m depth. Figure 10 shows the vertical distribution of water and air under such conditions. A volumetric air content of at least 15 % throughout the depth is a favourable condition for root growth (Caron et al., 2015). For both Technosols, we conclude that green-waste compost introduces the pore space to the mixture that is needed to guarantee a supply of air to the roots in shallow containers. For Technosols that contain ground bricks as a mineral component, the GWC content has to be at least 70 vol % to avoid an insufficient air supply in shallow containers. Alternatively, the depth of containers should be increased for mixtures containing less GWC. Technosols formulated with excavated deep soil present a sufficient supply of air in shallow containers when they contain at least 20 vol % GWC; this confirms the results in Deeb et al. (2016).
This study presents a compositional model that allows us to predict the water retention curve (WRC) of a constructed Technosol formulated as a binary mixture at any mixing ratio. The predictions are based on the measured WRC of the pure components and the volumetric mixing ratio. Thus, only a small measurement effort is required to describe a large number of possible combinations. The introduced compositional model approach, in the basic and extended scheme, was shown to be applicable to mixtures of components characterized by a small difference in their pore space distribution maxima (ΔPSDmax). It can be concluded that the model performs best based on water retention observations that have a high reproducibility, a high resolution and that cover a large range of pressure heads. From the comparison between the predicted and reference WRCs of three case study mixtures that are of practical relevance for Technosol construction, we conclude that the approach should be valid for further materials and their mixtures. In order to demonstrate practical applications of the predicted WRCs, the unsaturated hydraulic conductivity and the hydrostatic distribution of water and air in constructed Technosols were predicted. The knowledge of the soil hydraulic properties at any mixing ratio enables the quick choice of a binary Technosol composition, based on either the estimated air capacity, wilting point capacity and available water capacity or the modelled water balance of a soil–plant–atmosphere system (e.g. in urban green infrastructure). Using this method, planning for efficient water management in urban green infrastructure dedicated to different purposes (e.g. rainwater, grey water and irrigation) is made possible. The results of this study indicate the added value of a systematic soil hydrological characterization of potential Technosol components (e.g. in the form of a database). Such data could be used to further evaluate the compositional model approach and for theoretical experiments that search for purpose-designed Technosol compositions.
The data of Willaredt and Nehls (2021) were represented using the PDI model (Peters, 2013; Iden and Durner, 2014; Peters, 2014) with the unconstrained bimodal (Durner, 1994) basic function of van Genuchten (1980), and the respective parameters are displayed in Table A1. The PDI model accounts for both capillary and adsorptive water retention, Scap (–) and Sad (–), respectively, as follows:
where θ(h) (m3 m−3) stands for the volumetric water content, h (cm) stands for the matric potential, θs (m3 m−3) stands for the saturated water content and θr (m3 m−3) represents the residual water content. To ensure that the water content is zero for cm, the respective basic function in the capillary saturation function Γ(h) is scaled as follows:
where Γ0=Γ(h0). The basic function Γ(h) in form of the constrained retention function of van Genuchten (1980) is described by the following:
where α (cm−1) and n (–) are curve shape parameters. The unconstrained function of van Genuchten (1980) is described by the following:
where m (–) stands for an additional shape parameter. In the bimodal form of Durner (1994) the basic functions are weighted and added:
where wi represents the weighting factor of the sub-functions, with and . The adsorptive water retention is calculated as follows:
where x denotes , with h in centimetres. Here, xa refers to the pF value corresponding to the suction at air entry for adsorptive retention, with , and x0 refers to the pF value corresponding to the suction where the water content is zero, . The smoothing parameter b for the adsorption function in the constrained and unconstrained van Genuchten function is calculated as follows:
A1 Fitting parameters
In the following, the fitting parameters obtained for every mixture of each data set are presented in Tables A1–A4 with the corresponding RMSE value as a diagnostic variable describing the mean deviation between the fitted model and the observation. The data set of Sakaki and Smits (2015) was described with the PDI model using the constrained bimodal van Genuchten function (Durner, 1994), and the respective parameters are displayed in Table A2. The data set of Deeb et al. (2016) was represented using the PDI model with the unimodal constrained van Genuchten function as basic function, and the respective parameters are displayed in Table A3. The data set of Walczak et al. (2002) was represented using the original unimodal constrained model of van Genuchten (1980), and the respective parameters are displayed in Table A4.
Table A1Fitted parameters to the water retention observations from Willaredt and Nehls (2021) using the bimodal PDI unconstrained van Genuchten variant and the RMSE between the model and observations. The subscript numbers indicate the sub-function to which the parameters belong.
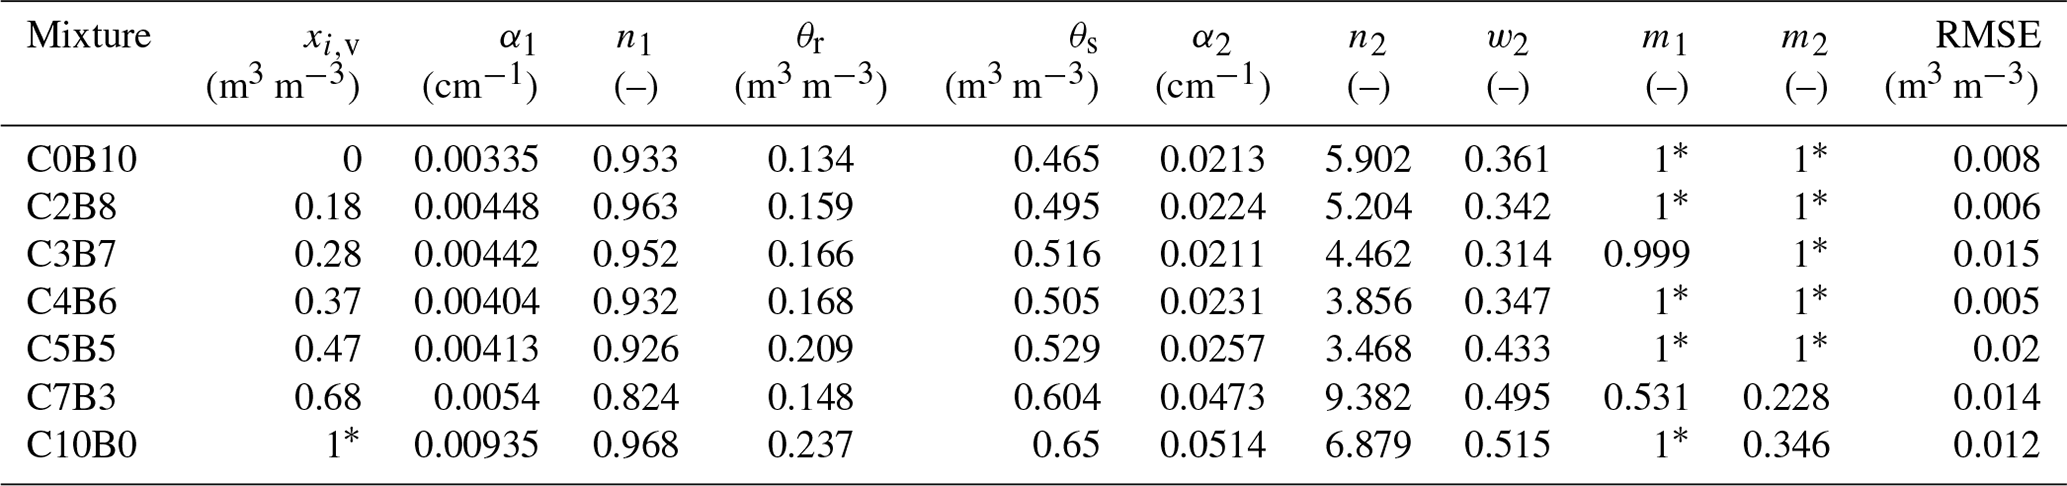
* Parameter boundary reached.
Table A2Fitted parameters to the water retention observations from Sakaki and Smits (2015) using the bimodal PDI constrained van Genuchten variant. The subscript numbers indicate the sub-function to which the parameters belong.
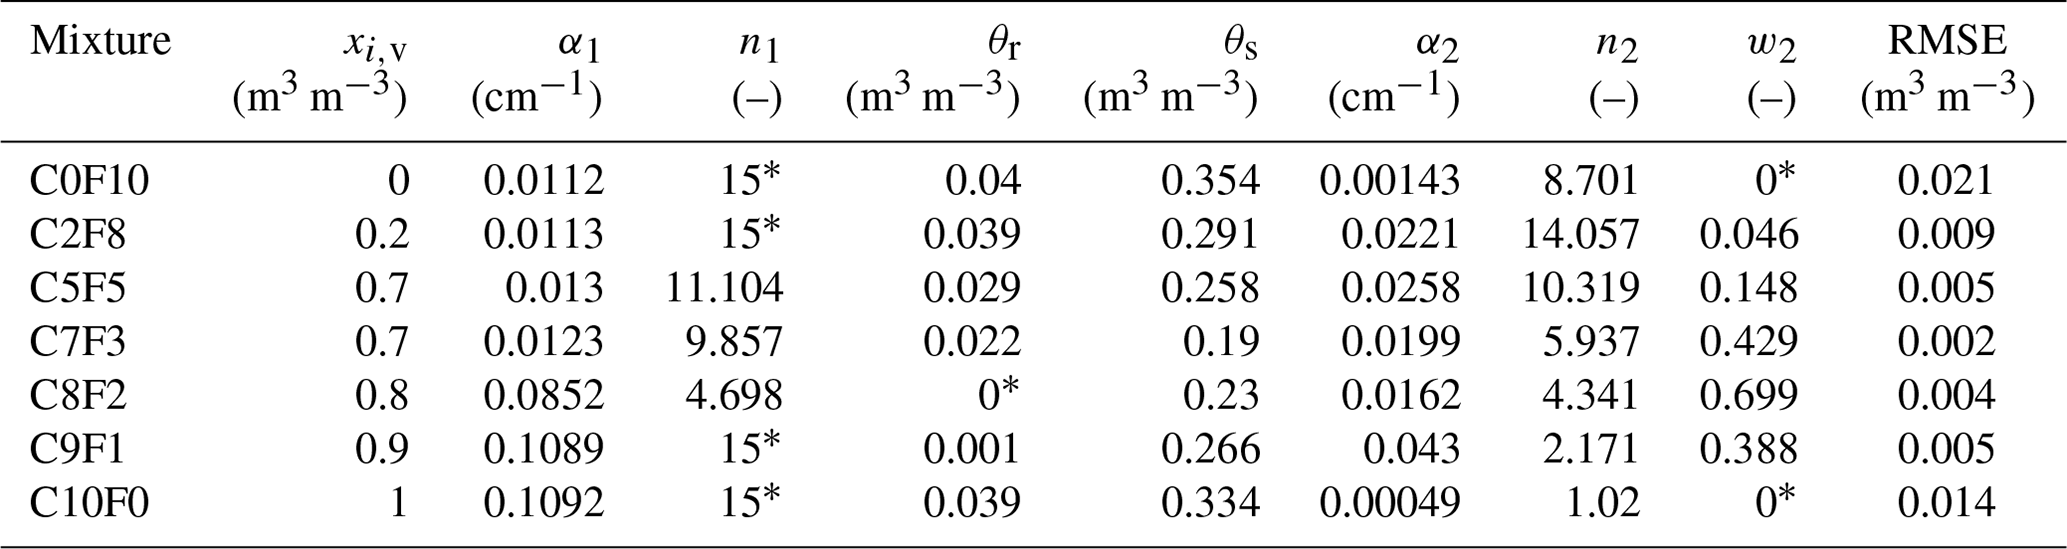
* Parameter boundary reached.
Table A3Fitted parameters to the water retention observations from Deeb et al. (2016) using the unimodal PDI constrained van Genuchten variant.
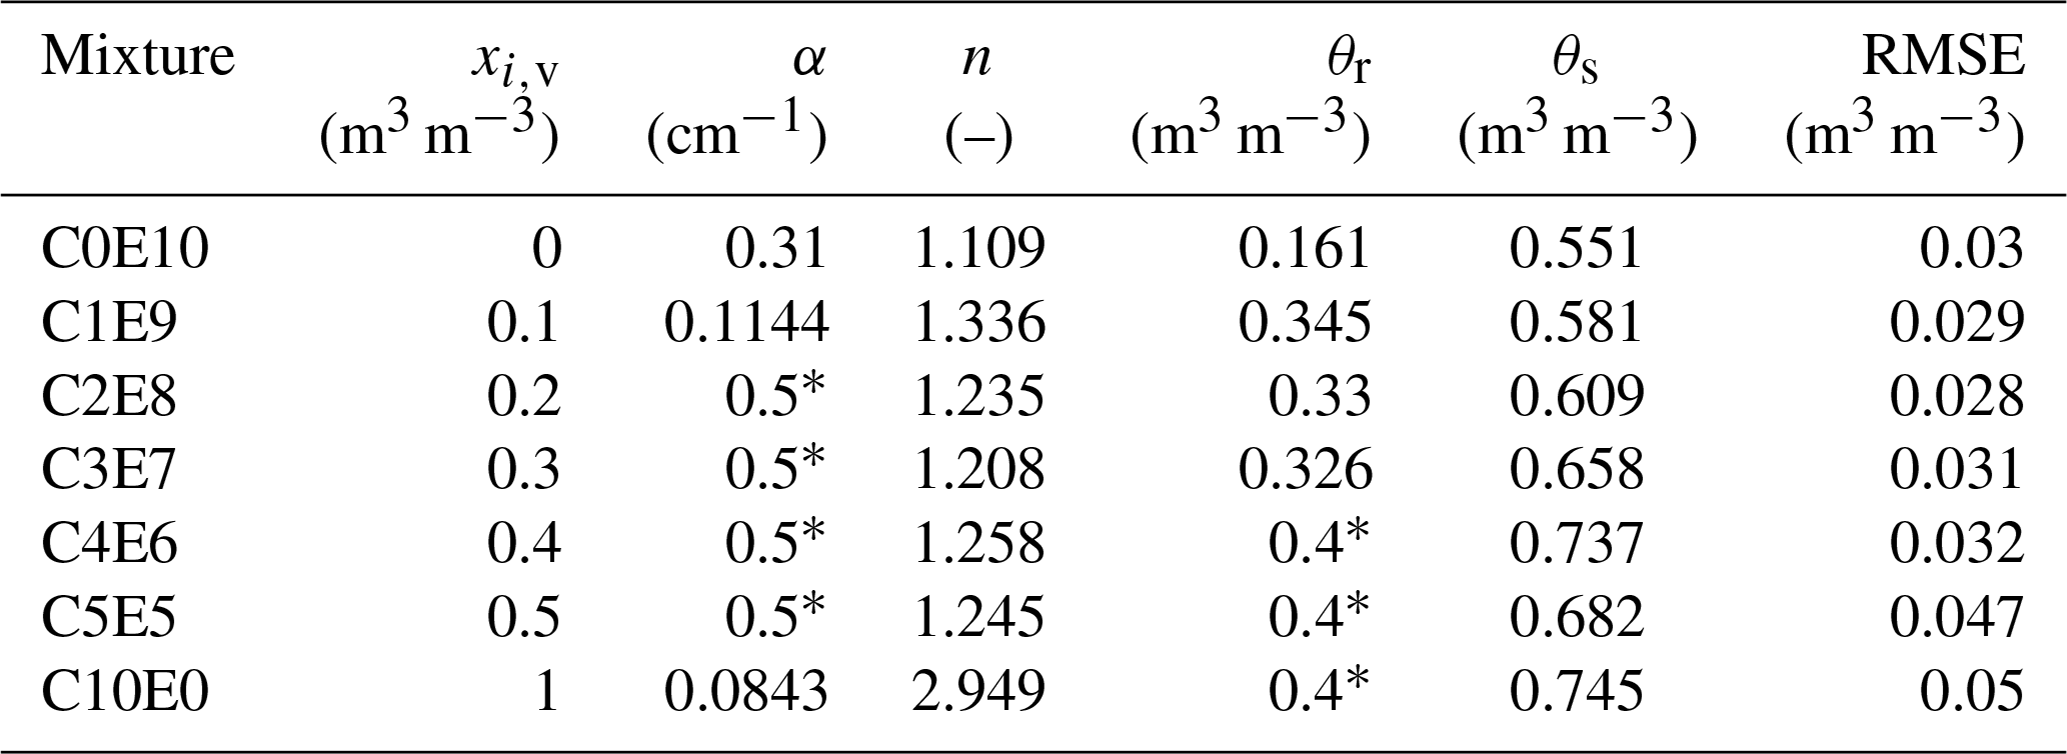
* Parameter boundary reached.
Table A4Fitted parameters to the water retention observations from Walczak et al. (2002) using the original unimodal constrained van Genuchten model.
* Parameter boundary reached.
In the Appendix, we provide the fitting parameters and WRC models used to represent the water retention data sets presented in this study. The raw data from third parties cannot be made available. The raw data related to the work by Willaredt and Nehls (2021) can be obtained upon request from the corresponding author.
MW and TN: conceptualization; MW, AP and TN: model implementation and analysis; MW: writing – original draft preparation; MW, TN and AP: writing – review and editing as well as approval of the final manuscript.
The contact author has declared that none of the authors has any competing interests.
Publisher's note: Copernicus Publications remains neutral with regard to jurisdictional claims in published maps and institutional affiliations.
The authors are grateful to Maha Deeb, Toshihiro Sakaki and Kathleen M. Smits for providing water retention data. We acknowledge Sarah Sanford and Anna Rowntree for linguistic revision. Furthermore, we thank the three anonymous reviewers for their comments and feedback that contributed to improving the paper. Finally, the authors acknowledge support from the German Research Foundation and the Open Access Publication Fund of Technische Universität Berlin.
This research has been supported by the Berlin International Graduate School on Model and Simulation Based Research (BIMoS) (Moreen Willaredt), by the Federal Ministry for Economic Affairs and Climate Action of Germany (BMWi; Ugreen, grant no. FKZ 03EN1045C) (Thomas Nehls) and by the German Research Foundation (DFG; grant no. PE 1912/4-1) (Andre Peters).
This open-access publication was funded by Technische Universität Berlin.
This paper was edited by Philippe Ackerer and reviewed by three anonymous referees.
Abel, S., Peters, A., Trinks, S., Schonsky, H., Facklam, M., and Wessolek, G.: Impact of biochar and hydrochar addition on water retention and water repellency of sandy soil, Geoderma, 202, 183–191, 2013. a
Al Naddaf, O., Livieratos, I., Stamatakis, A., Tsirogiannis, I., Gizas, G., and Savvas, D.: Hydraulic characteristics of composted pig manure, perlite, and mixtures of them, and their impact on cucumber grown on bags, Scient. Horticult., 129, 135–141, 2011. a
Bouwer, H. and Rice, R.: Hydraulic Properties of Stony Vadose Zones a, Groundwater, 22, 696–705, 1984. a
Brunetti, G., Šimůnek, J., and Piro, P.: A comprehensive analysis of the variably saturated hydraulic behavior of a green roof in a mediterranean climate, Vadose Zone J., 15, 1–17, https://doi.org/10.2136/vzj2016.04.0032, 2016. a
Campbell, G. S., Smith, D. M., and Teare, B. L.: Application of a dew point method to obtain the soil water characteristic, in: Experimental unsaturated soil mechanics, Springer, 71–77, https://doi.org/10.1007/3-540-69873-6_7, 2007. a
Caron, J., Price, J., and Rochefort, L.: Physical properties of organic soil: adapting mineral soil concepts to horticultural growing media and histosol characterization, Vadose Zone J., 14, 1–14, https://doi.org/10.2136/vzj2014.10.0146, 2015. a, b, c
Clarke, R.: Reservoir properties of conglomerates and conglomeratic sandstones: Geologic notes, AAPG Bull., 63, 799–803, 1979. a, b, c
Deeb, M., Grimaldi, M., Lerch, T. Z., Pando, A., Podwojewski, P., and Blouin, M.: Influence of organic matter content on hydro-structural properties of constructed Technosols, Pedosphere, 26, 486–498, 2016. a, b, c, d, e, f, g, h, i, j, k, l, m, n, o, p, q, r
Deeb, M., Groffman, P. M., Blouin, M., Egendorf, S. P., Vergnes, A., Vasenev, V., Cao, D. L., Walsh, D., Morin, T., and Séré, G.: Using constructed soils for green infrastructure – challenges and limitations, SOIL, 6, 413–434, https://doi.org/10.5194/soil-6-413-2020, 2020. a
Durner, W.: Hydraulic conductivity estimation for soils with heterogeneous pore structure, Water Resour. Res., 30, 211–223, 1994. a, b, c, d, e, f
Eksi, M., Sevgi, O., Akburak, S., Yurtseven, H., and Esin, İ.: Assessment of recycled or locally available materials as green roof substrates, Ecol. Eng., 156, 105966, https://doi.org/10.1016/j.ecoleng.2020.105966, 2020. a
Fabbri, D., Pizzol, R., Calza, P., Malandrino, M., Gaggero, E., Padoan, E., and Ajmone-Marsan, F.: Constructed Technosols: A Strategy toward a Circular Economy, Appl. Sci., 11, 3432, https://doi.org/10.3390/app11083432, 2021. a
Fields, J. S., Owen, J. S., Altland, J. E., van Iersel, M. W., and Jackson, B. E.: Soilless substrate hydrology can be engineered to influence plant water status for an ornamental containerized crop grown within optimal water potentials, J. Am. Soc. Horticult. Sci., 143, 268–281, 2018. a
Flint, A. L. and Childs, S.: Physical properties of rock fragments and their effect on available water in skeletal soils, Erosion and productivity of soils containing rock fragments, Erosion and Productivity of Soils Containing Rock Fragments, 13, 91–103, https://doi.org/10.2136/sssaspecpub13.c10, 1984. a
Flores-Ramírez, E., Abel, S., and Nehls, T.: Water retention characteristics of coarse porous materials to construct purpose-designed plant growing media, Soil Sci. Plant Nutr., 64, 181–189, 2018. a, b
Grabowski, Z. J., McPhearson, T., Matsler, A. M., Groffman, P., and Pickett, S. T.: What is green infrastructure? A study of definitions in US city planning, Front. Ecol. Environ., 20, 152–160, 2022. a
Hill, J., Sleep, B., Drake, J., and Fryer, M.: The Effect of Intraparticle Porosity and Interparticle Voids on the Hydraulic Properties of Soilless Media, Vadose Zone J., 18, 180176, https://doi.org/10.2136/vzj2018.09.0176, , 2019. a, b
Iden, S. C. and Durner, W.: Comment on “Simple consistent models for water retention and hydraulic conductivity in the complete moisture range” by A. Peters, Water Resour. Res., 50, 7530–7534, 2014. a, b, c
Jackisch, C., Germer, K., Graeff, T., Andrä, I., Schulz, K., Schiedung, M., Haller-Jans, J., Schneider, J., Jaquemotte, J., Helmer, P., Lotz, L., Bauer, A., Hahn, I., Šanda, M., Kumpan, M., Dorner, J., de Rooij, G., Wessel-Bothe, S., Kottmann, L., Schittenhelm, S., and Durner, W.: Soil moisture and matric potential – an open field comparison of sensor systems, Earth Syst. Sci. Data, 12, 683–697, https://doi.org/10.5194/essd-12-683-2020, 2020. a
Mitchell, M., Muftakhidinov, B., Winchen, T., Wilms, A., Schaik, B. v., badshah400, Mo-Gul, The Gitter Badger, Jędrzejewski-Szmek, Z., kensington, and kylesower: Engauge Digitizer Software, Nonrelease (v12.2.1), Zenodo [code], https://doi.org/10.5281/zenodo.3941227, 2019. a
Molineux, C. J., Fentiman, C. H., and Gange, A. C.: Characterising alternative recycled waste materials for use as green roof growing media in the UK, Ecol. Eng., 35, 1507–1513, 2009. a
Naseri, M., Iden, S. C., Richter, N., and Durner, W.: Influence of stone content on soil hydraulic properties: experimental investigation and test of existing model concepts, Vadose Zone J., 18, 180163, https://doi.org/10.2136/vzj2018.08.0163, 2019. a, b, c, d
Nehls, T., Rokia, S., Mekiffer, B., Schwartz, C., and Wessolek, G.: Contribution of bricks to urban soil properties, J. Soils Sediments, 13, 575–584, 2013. a
Nehls, T., Schwartz, C., Kim, K.-H. J., Kaupenjohann, M., Wessolek, G., and Morel, J.-L.: Letter to the editors: Phyto-P-mining, secondary urban green recycles phosphorus from soils constructed of urban wastes, J. Soils Sediments, 15, 1667–1674, 2015. a
Peters, A.: Simple consistent models for water retention and hydraulic conductivity in the complete moisture range, Water Resour. Res., 49, 6765–6780, 2013. a, b, c
Peters, A.: Reply to comment by S. Iden and W. Durner on “Simple consistent models for water retention and hydraulic conductivity in the complete moisture range”, Water Resour. Res., 50, 7535–7539, 2014. a, b, c
Peters, A. and Durner, W.: SHYPFIT 2.0 User's Manual. Research Report. Institut für Ökologie, Technische Universität Berlin, Germany, 2015. a
Peters, A., Iden, S. C., and Durner, W.: Revisiting the simplified evaporation method: Identification of hydraulic functions considering vapor, film and corner flow, J. Hydrol., 527, 531–542, 2015. a
Peters, A., Hohenbrink, T. L., Iden, S. C., and Durner, W.: A simple model to predict hydraulic conductivity in medium to dry soil from the water retention curve, Water Resour. Res., 57, e2020WR029211, https://doi.org/10.1029/2020WR029211, 2021. a, b, c
Peters, A., Hohenbrink, T. L., Iden, S. C., van Genuchten, M. Th., and Durner, W.: Prediction of the absolute hydraulic conductivity function from soil water retention data, Hydrol. Earth Syst. Sci., 27, 1565–1582, https://doi.org/10.5194/hess-27-1565-2023, 2023. a, b, c, d, e
Pitton, B. J., Oki, L. R., Sisneroz, J., and Evans, R. Y.: A nursery system nitrogen balance for production of a containerized woody ornamental plant, Scient. Horticult., 291, 110569, https://doi.org/10.1016/j.scienta.2021.110569, 2022. a
Pouyat, R. V., Szlavecz, K., Yesilonis, I. D., Groffman, P. M., and Schwarz, K.: Chemical, physical and biological characteristics of urban soils, Chap. 7, vol. 55 of Agronomy Monograph, 119–152, https://doi.org/10.2134/agronmonogr55.c7, 2010. a
Prado, B., Mora, L., Abbruzzini, T., Flores, S., Cram, S., Ortega, P., Navarrete, A., and Siebe, C.: Feasibility of urban waste for constructing Technosols for plant growth, Revista Mexicana de Ciencias Geológicas, 37, 237–249, 2020. a
Rokia, S., Séré, G., Schwartz, C., Deeb, M., Fournier, F., Nehls, T., Damas, O., and Vidal-Beaudet, L.: Modelling agronomic properties of Technosols constructed with urban wastes, Waste Manage., 34, 2155–2162, 2014. a, b, c
Sakaki, T. and Illangasekare, T. H.: Comparison of height-averaged and point-measured capillary pressure–saturation relations for sands using a modified Tempe cell, Water Resour. Res., 43, W12502, https://doi.org/10.1029/2006WR005814, 2007. a
Sakaki, T. and Smits, K. M.: Water Retention Characteristics and Pore Structure of Binary Mixtures, Vadose Zone J., 14, 1–7, https://doi.org/10.2136/vzj2014.06.0065, 2015. a, b, c, d, e, f, g, h, i, j, k, l, m
Schindler, U.: Ein Schnellverfahren zur Messung der Wasserleitfähigkeit im teilgesättigten Boden an Stechzylinderproben, Arch. Acker Pfl. Boden., 24, 1–7, 1980. a
Tams, L., Nehls, T., and Calheiros, C. S. C.: Rethinking green roofs-natural and recycled materials improve their carbon footprint, Build. Environ., 219, 109122, https://doi.org/10.1016/j.buildenv.2022.109122, 2022. a
Ulrich, S., Willaredt, M., Nehls, T., and van Schaik, L.: Do earthworms (D. veneta) influence plant-available water in technogenic soil-like substrate from bricks and compost?, J. Soils Sediments, 21, 2013–2024, 2021. a
van Genuchten, M. T.: A closed-form equation for predicting the hydraulic conductivity of unsaturated soils, Soil Sci. Soc. Am. J., 44, 892–898, 1980. a, b, c, d, e, f, g, h, i
Vidal-Beaudet, L., Rokia, S., Nehls, T., and Schwartz, C.: Aggregation and availability of phosphorus in a Technosol constructed from urban wastes, J. Sils Sediments, 18, 456–466, 2018. a
Walczak, R., Rovdan, E., and Witkowska-Walczak, B.: Water retention characteristics of peat and sand mixtures, Int. Agrophys., 16, 161–165, 2002. a, b, c, d, e, f, g, h, i, j, k, l, m
Willaredt, M. and Nehls, T.: Investigation of water retention functions of artificial soil-like substrates for a range of mixing ratios of two components, J. Soils Sediments, 21, 2118–2129, 2021. a, b, c, d, e, f, g, h, i, j, k, l, m, n, o, p, q, r, s, t, u, v, w
Yilmaz, D., Cannavo, P., Séré, G., Vidal-Beaudet, L., Legret, M., Damas, O., and Peyneau, P.-E.: Physical properties of structural soils containing waste materials to achieve urban greening, J. Soils Sediments, 18, 442–455, 2018. a
Zhang, Z. F., Ward, A. L., and Keller, J. M.: Determining the porosity and saturated hydraulic conductivity of binary mixtures, Vadose Zone J., 10, 313–321, 2011. a, b, c