the Creative Commons Attribution 4.0 License.
the Creative Commons Attribution 4.0 License.
 | 13 Jan 2023
Droughts can reduce the nitrogen retention capacity of catchments
Tam V. Nguyen
Andreas Musolff
Stefanie R. Lutz
Michael Rode
Rohini Kumar
Jan H. Fleckenstein
In 2018–2019, Central Europe experienced an unprecedented 2-year drought with severe impacts on society and ecosystems. In this study, we analyzed the impact of this drought on water quality by comparing long-term (1997–2017) nitrate export with 2018–2019 export in a heterogeneous mesoscale catchment. We combined data-driven analysis with process-based modeling to analyze nitrogen retention and the underlying mechanisms in the soils and during subsurface transport. We found a drought-induced shift in concentration–discharge relationships, reflecting exceptionally low riverine nitrate concentrations during dry periods and exceptionally high concentrations during subsequent wet periods. Nitrate loads were up to 73 % higher compared to the long-term load–discharge relationship. Model simulations confirmed that this increase was driven by decreased denitrification and plant uptake and subsequent flushing of accumulated nitrogen during rewetting. Fast transit times (<2 months) during wet periods in the upstream sub-catchments enabled a fast water quality response to drought. In contrast, longer transit times downstream (>20 years) inhibited a fast response but potentially contribute to a long-term drought legacy. Overall, our study reveals that severe droughts, which are predicted to become more frequent across Europe, can reduce the nitrogen retention capacity of catchments, thereby intensifying nitrate pollution and threatening water quality.
- Article
(3747 KB) - Full-text XML
-
Supplement
(1337 KB) - BibTeX
- EndNote


In 2018–2019, large parts of Europe experienced a severe drought that was unprecedented in the last 250 years (Hari et al., 2020; Rakovec et al., 2022). This drought, caused by exceptionally low precipitation concurring with high temperatures, had detrimental impacts on vegetation during the growing season and caused massive forest diebacks (Hari et al., 2020; Schuldt et al., 2020). Besides the scarcity of water and its direct impact on ecosystems and society (Delpla et al., 2009; Fu et al., 2020; Stahl et al., 2010), there is first evidence that this drought could also have impacted freshwater quality in regard to nitrate concentrations. The Nitrate Report 2020 of the Netherlands (RIVM, 2021), for example, found an increase in nitrogen (N) surplus in agricultural areas across the country and, with it, an increase in leachate nitrate concentrations below the root zone. This increase in N surplus and leachate nitrate concentrations in response to drought has been explained by the low water availability that might reduce crop growth and, thus, N plant uptake (Cramer et al., 2009; RIVM, 2021). However, high nitrate concentrations in the leachate do not necessarily reach the stream network, because catchments act as a filter and reactor that can delay the transit of N to the receiving stream or permanently remove it via denitrification (Van Meter and Basu, 2015). The extent of delays and removal strongly depends on the catchment characteristics and boundary conditions (e.g., Ehrhardt et al., 2021; Jawitz et al., 2020; Winter et al., 2021). Moreover, different N sources and their spatial distribution within a catchment can impact nitrate export at the catchment outlet (Casquin et al., 2021; Dupas et al., 2019). Therefore, both catchment characteristics and their spatial configuration might shape the response of riverine nitrate export to drought.
Diverse responses of stream water nitrate concentrations have been reported in different catchments for previous droughts and subsequent post-drought periods (Morecroft et al., 2000; Mosley, 2015). Several studies have found decreasing nitrate concentrations during droughts, which have been attributed either to disconnected shallow flow paths that normally allow for efficient transport of nitrate to the stream (J. Yang et al., 2018) or to increased in-stream retention efficiency and to increased uptake along with higher temperatures (Morecroft et al., 2000; Mosley, 2015; Oelsner et al., 2007). However, also increases or no changes in stream concentrations have been reported during droughts, mainly due to high nitrate concentrations in the baseflow or due to the presence of point sources, which increase in relative importance under low flow conditions (e.g., Andersen et al., 2004; Jarvie et al., 2003; Sprague, 2005; Van Vliet and Zwolsman, 2008). With rewetting after the drought, many studies have reported high nitrate concentration peaks as a consequence of accumulated nitrate in the soil zone being flushed from the catchment via fast and shallow flow paths (Górski et al., 2019; Loecke et al., 2017; Morecroft et al., 2000; Mosley, 2015; Outram et al., 2014). This pattern can be explained by both remobilization of accumulated nitrate and stimulation of mineralization with the rewetting of dry soils (Campbell and Biederbeck, 1982; Haynes, 1986; Loecke et al., 2017). Together, these findings imply that droughts can have profound impacts on nitrate availability and transport to the stream network and that the catchment response to droughts seems to vary between catchments and potentially also with drought magnitude. Furthermore, recent studies have highlighted the role of different sub-catchments with different response times to changes composing the integrated signal of nitrate export at the catchment outlet (e.g., Ehrhardt et al., 2019; Nguyen et al., 2022; Winter et al., 2021). It can therefore be important to account for the spatial heterogeneity of a catchment and to look at sub-catchment-specific contributions to better understand the overall catchment response to drought in terms of nitrate export.
To identify drought impacts on nitrate export, data-driven approaches have the advantage of giving a direct reflection of real observations that are an integrated result of the complex biogeochemical and hydrological processes within the catchment. Data-driven approaches thus provide observation-based understanding without strong assumptions on the underlying processes while allowing to build hypotheses on these processes. For example, the relationships of nitrate concentrations and discharge (C–Q) and of nitrate loads and discharge (L–Q) can serve as a robust characterization of catchment-specific nitrate export patterns under different flow conditions and allow for conclusions on N source availability and distribution and on catchment specific response times (e.g., Bieroza et al., 2018; Minaudo et al., 2019; Musolff et al., 2015). Moreover, a comparison of N input and output from a catchment allows for the quantification of catchment N retention resulting from hydrological and/or biogeochemical N legacies and denitrification (Ehrhardt et al., 2019; Van Meter et al., 2016; Van Meter and Basu, 2015; Winter et al., 2021). Tools complementary to data-driven analyses are mechanistic and process-based models, which explicitly aim at a physical description of the underlying processes causing the observed concentrations and loads, and therefore provide detailed insights into catchment-internal N dynamics. For example, the mesoscale Hydrological Model with StorAge Selection functions (mHM-SAS; Nguyen et al., 2022) allows quantifying the rates of N uptake and removal in the catchment soils, lateral N transport at the sub-catchment scale, and time-variant transit time distributions (TTDs). However, resulting simulations also rely on fixed assumptions and the distinct processes that these models entail. Therefore, combining data-driven analyses and mechanistic process-based modeling has several advantages: The data-driven analysis allows for robust identification of drought impacts on nitrate export and a discussion on the underlying processes, while the process-based modeling allows testing if these processes can actually explain the observed behavior.
In this study, we used data-driven analysis and process-based modeling to analyze the impact of the 2018–2019 drought on nitrate concentrations and loads compared to previous years (1997–2017) in a heterogeneous mesoscale catchment with three nested gauges located in Germany. This setup allows us to disentangle sub-catchment-specific drought responses while obtaining results at a larger and integral spatial scale relevant to water quality management. We hypothesize that droughts can cause a change in the nitrogen retention capacity of catchments, but with different impacts on riverine nitrate export at contrasting sub-catchments. Our specific objectives were to (i) identify changes in riverine nitrate concentrations and loads at the sub-catchment scale via data-driven analyses (using C–Q and L–Q relationships) and (ii) quantify changes in N cycling in the catchment soils and in the timescales of lateral N transport from the soil leachates to the stream network via process-based modeling (using mHM-SAS). This approach allows us to gain knowledge on drought impacts on catchment functioning in terms of retaining and releasing N, which is crucial for our ability to adapt to climate change and effectively mitigate nitrate pollution.
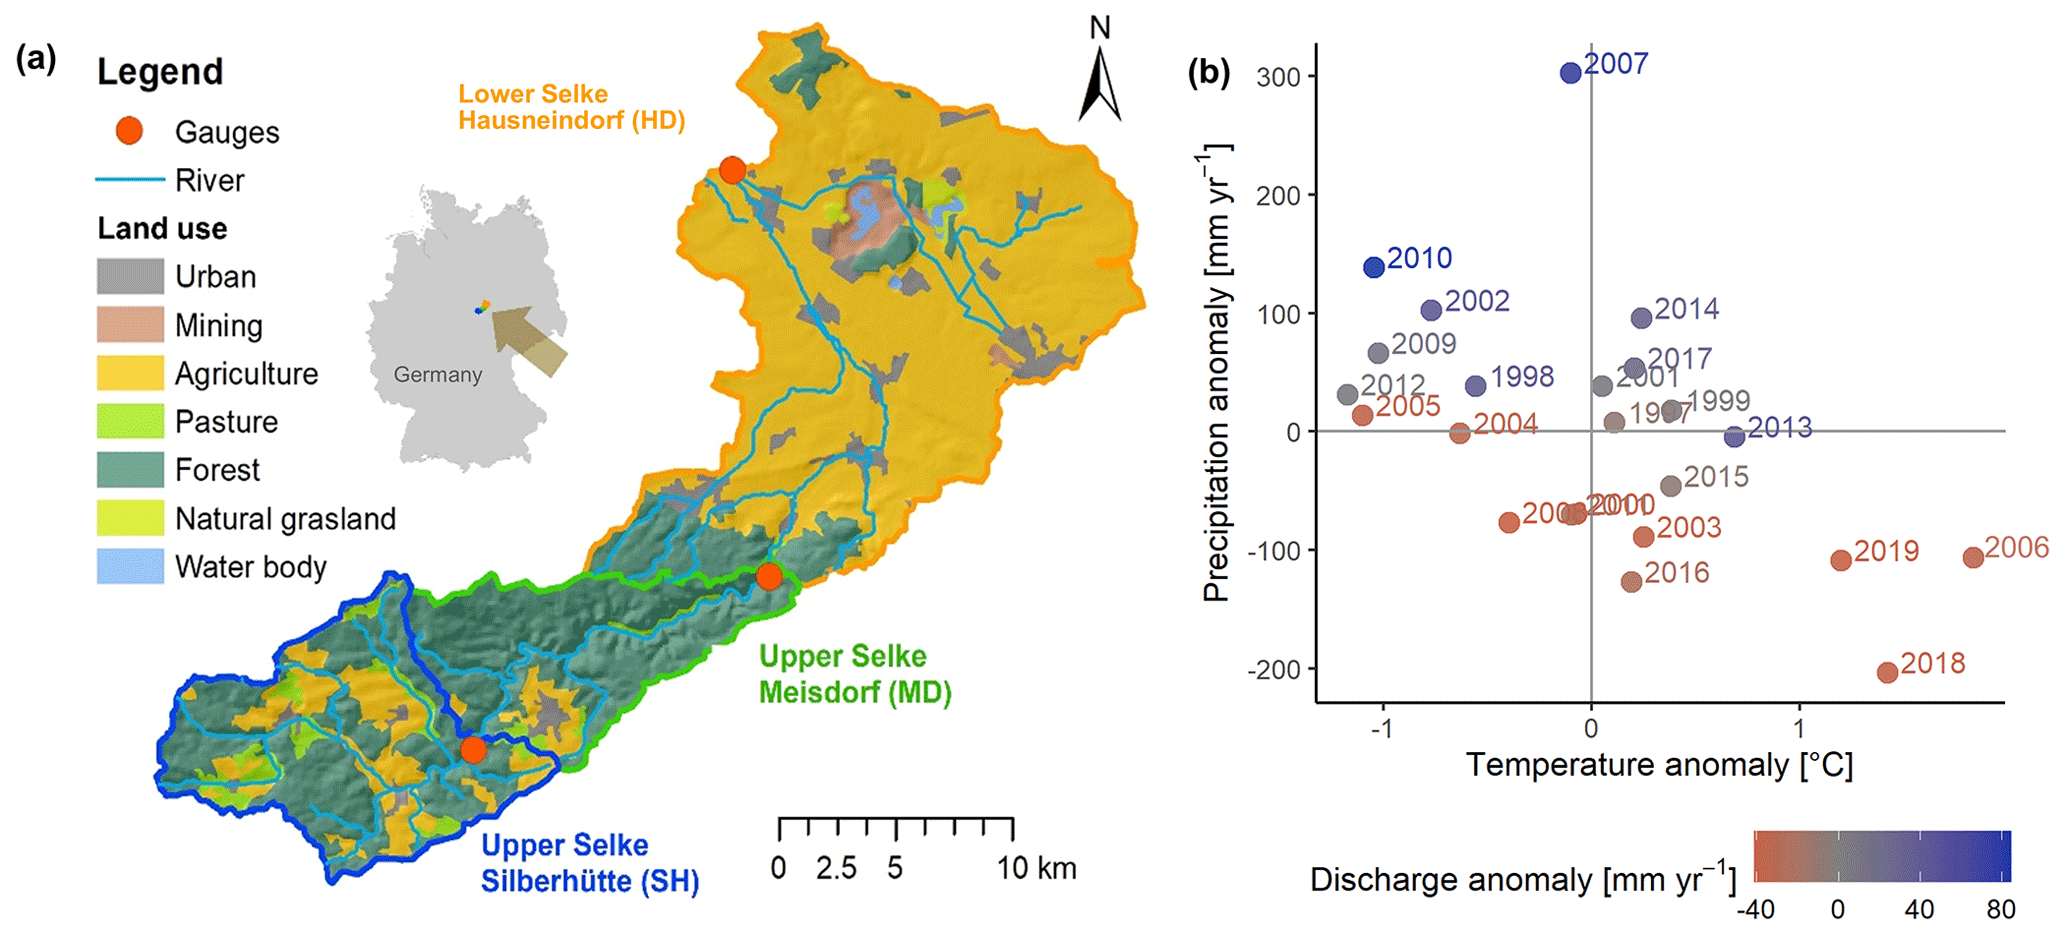
Figure 1Study site and long-term hydro-meteorological conditions. (a) Land use map of the Selke catchment with its three gauging stations (SH (Silberhütte), MD (Meisdorf), and HD (Hausneindorf)). (b) Climatic anomalies in the Selke catchment in terms of precipitation, temperature, and discharge for the years (starting in May) 1990 to 2019.
The 2018–2019 drought was an unprecedented event, but with accelerating climate change, such prolonged droughts are likely to become more frequent (Hari et al., 2020; IPCC, 2018; Rakovec et al., 2022; Samaniego et al., 2018). In this context, this study is one step towards a better understanding of the impacts of such droughts on nitrate export dynamics and the underlying mechanisms within a catchment.
2.1 Study site
This study was conducted in the mesoscale Selke catchment, which is located in the Harz Mountains and Harz foreland in Saxony–Anhalt, Germany (Fig. 1a). As a sub-catchment of the Bode basin, it is also part of the network of TERestrial ENvironmental Observatories (TERENO; Wollschläger et al., 2017). The Selke catchment is gauged with three nested stations: Silberhütte (SH), Meisdorf (MD), and Hausneindorf (HD, Fig. 1a). The two upstream sub-catchments form the upper Selke with similar characteristics, such as forest being the dominant land use and also in terms of relatively short transit times (TTs) and comparable nitrate export dynamics (Nguyen et al., 2022; Winter et al., 2021). The downstream part forms the lowland area of the catchment, which is dominated by agricultural land use. Compared to the upper Selke, TTs are longer, and the variability of export dynamics is reduced (Nguyen et al., 2022; Winter et al., 2021).
2.2 Characterization of different hydro-meteorological conditions and anomalies
We adopted the definition of annual wet, drying, dry, and wetting periods from J. Yang et al. (2018), based on the catchment subsurface storage condition in a headwater catchment of the Selke catchment. Accordingly, wet periods last from January to April, drying periods (i.e., the transition from wet to dry) last from May to June, dry periods last from July to October, and wetting periods (i.e., the transition from dry to wet) last from November to December. Instead of annual averages starting in January, we calculated annual averages of discharge and N fluxes over 12-month periods, starting with the drying period in May and ending with the wet period end of April. This was done under the rationale that nitrate starts accumulating in a catchment over the drying and dry period, when fast flow paths are deactivated (J. Yang et al., 2018), and that, subsequently, accumulated nitrate is more efficiently exported from the catchment during wetter conditions. Under this rationale, comparing annual statistics of nitrate export is more meaningful if comparing 12-month periods starting in May instead of January, considering the seasonality in climatic conditions in central Germany. Throughout the paper, we therefore defined years by drying–wetting cycles starting in May, with the consecutive numbering being based on the starting date. For example, the year 2018 started on 1 May 2018 and ended on 30 April 2019. In the same manner, we refer to the 2-year drought as 2018–2019, spanning a period from May 2018 until the end of April 2020.

Figure 2Nitrate as nitrogen concentrations and discharge at the gauging stations of the three Selke sub-catchments (1997–2020) with low-frequency grab samples (orange dots), simulated concentrations via mHM-SAS (grey line), daily averages of high-frequency sensor measurements from 2012 (red line), and daily discharge (bluish lines). Dashed lines indicate the mHM-SAS calibration (2012–2015) and validation (2016–2020) periods, comparing simulated nitrate-N concentrations with daily averages of sensor measurements.
To compare the hydro-meteorological conditions during the drought years (2018 and 2019) with the ones during previous years (1990–2017), we calculated their hydro-meteorological anomalies compared to the long-term average. To this end, we calculated the annual averages in observed temperature, precipitation, and discharge and modeled soil moisture (see Sect. 2.5) for the study catchment. We then calculated the long-term average over all years and subtracted the single annual averages from those long-term averages. The divergence of annual hydro-meteorological conditions from the long-term average is considered the hydro-meteorological anomaly. In the Selke catchment for the 2018–2019 drought, the years starting in May 2018 and May 2019 are characterized by exceptionally low precipitation (anomaly of −205 and −110 mm yr−1 in 2018 and 2019, respectively, compared to the long-term average of 602 mm yr−1 over the period 1997–2020), high temperatures (+1.6 and +1.4 ∘C in 2018 and 2019, compared to the long-term average of 9.0 ∘C), and low discharge (−37.0 and −39.2 mm yr−1 compared to the long-term average of 98.5 mm yr−1) (Fig. 1b). In terms of soil moisture, these 2 years were the driest in the Selke catchment since the start of our time series in May 1997, with 2018 being even drier than 2019 (Fig. S1 in the Supplement). Consequently, the 2-year drought that affected large parts of Central Europe (Hari et al., 2020) can also be characterized as an exceptional drought in the Selke catchment.
2.3 Data
Daily long-term temperature and precipitation data (1997–2020) were provided by the German Meteorological Service (Deutscher Wetterdienst, DWD) and gridded via external drift kriging following Zink et al. (2017). N input data (i.e., fertilizer, manure, and plant residues), land use management (i.e., crop rotation), and atmospheric deposition were based on agricultural authority data obtained from X. Yang et al. (2018) and Jomaa et al. (2018). Accordingly, N input to agricultural fields in mHM-SAS follows a 2- or 3-year crop rotation, as is typical in this area and as implemented in X. Yang et al. (2018) and Nguyen et al. (2022). Daily discharge data and biweekly–monthly grab samples of nitrate concentrations were provided by the State Office of Flood Protection and Management of Saxony–Anhalt (LHW; Fig. 2a–c). Sensor measurements (using TriOS Pro-UV sensors (Rode et al., 2016) of nitrate concentrations at a 15 min resolution (2012–2020) were provided by the TERENO facilities of the Helmholtz Centre for Environmental Research (UFZ). To match the temporal resolution of long-term data, nitrate concentrations were aggregated to daily averages (Fig. 2a–c). Part of this data was previously used by Musolff et al. (2021), Rode et al. (2016), Winter et al. (2021, 2022), and X. Yang et al. (2018). Therefore, for the detailed processing of nitrate concentration data, we refer to Rode et al. (2016) and the other references above. With a coefficient of determination (R2) between 0.8 for MD and HD and 0.9 for SH, processed high-frequency nitrate concentration data from sensor measurements showed a good agreement with concentrations from grab samples analyzed in the lab.
2.4 Data-driven analysis using concentration–discharge relationships
To characterize nitrate export in the Selke catchment, we performed a data-driven analysis using concentration–discharge (C–Q) relationships from daily averages and load–discharge (L–Q) relationships from annual averages (starting in May). A simple but efficient way to describe the C–Q relationship is a power–law relationship of the following form:
with t standing for the respective time step. The parameters α and β describe the intercept (α) and the slope of the relationship in the log–log space (β), also termed C–Q slope (Musolff et al., 2015; Thompson et al., 2011). A positive C–Q slope indicates an increase of nitrate concentrations with discharge (enrichment pattern), whereas a negative C–Q slope indicates decreasing nitrate concentrations with increasing discharge (dilution pattern). Both patterns imply a directional relationship between concentrations and discharge, with nitrate concentrations either increasing or decreasing with increasing discharge. On the contrary, a C–Q slope around zero indicates that nitrate concentrations are not or are poorly correlated with the dynamics of discharge. Since nitrate loads (L) are the product of nitrate concentrations (C) and discharge (Q), the L–Q slope can be described using β+1, with the differentiation in this study that the C–Q slope and the L–Q slope were calculated with data of different temporal resolutions and are thus not directly comparable.
The C–Q relationship was calculated from daily averages of measured data only and is therefore restricted to the period 2012–2020. To test if the C–Q slope for the 2-year drought was different than the long-term average, we compared both slopes and their standard errors. To account for the different sample sizes between the pre-drought and drought periods, we applied additional block sampling across all possible combinations of 2 consecutive years and compared the resulting pre-drought C–Q slopes with the one from the 2-year drought.
Instead of restricting our analysis to observed daily data, as done for C–Q relationships, we calculated L–Q relationships with the annual sums of daily load and discharge data starting in May 1997. To this end, we used the continuous daily discharge measurements, and filled the gap in daily nitrate concentration measurements by interpolating from biweekly–monthly grab samples via Weighted Regression on Time, Discharge, and Season (WRTDS; Hirsch et al., 2010). The fit between daily loads calculated from interpolated and measured nitrate concentration data (2012–2019) was high, with an R2 between 0.93 and 0.96 and a small percentage bias between −0.5 % and −1.1 % (Fig. S2).
2.5 Process-based nitrogen export modeling with storage selection functions
To get a deeper insight into catchment processes that cause the observed nitrate export patterns during and after the 2-year drought, we simulated daily nitrate concentrations at the three gauging stations using the mesoscale Hydrological Model with StorAge Selection functions (mHM-SAS, Nguyen et al., 2021, 2022; Nguyen, 2022). The mHM-SAS model is a deterministic model with a strong physical basis, explained in detail in Nguyen et al. (2022) and in the Supplement (Sect. S1). Briefly, mHM-SAS provides a spatially distributed (1×1 km2) representation of hydro-climatic inputs, N pools, and fluxes in the soil zone based on a combination of mHM and the soil nitrogen model (X. Yang et al., 2018). Nitrate pools and fluxes in the saturated and unsaturated zone below the soil are represented for each sub-catchment using the nitrate transport model with StorAge Selection (SAS) functions (Van Der Velde et al., 2012, Nguyen et al., 2022). SAS functions describe the selective removal of water from a subsurface storage with different water ages and nitrate concentrations, which allows for a nitrate transport formulation based on time-variant TTDs. The SAS function in mHM-SAS is described using a beta function (β(a,b)), with a and b being two fitted parameters that vary in time (see Supplement, Eq. 6). The derived ratio represents the selection schemes for discharge, e.g., preference for young water ( ratio < 1) or old water ( ratio > 1) (Nguyen et al., 2022).
Nguyen et al. (2022) calibrated the model in the Selke sub-catchments for the years 2012–2015 with a Nash–Sutcliffe efficiency (NSE) of 0.68, 0.66, and −0.13 over the calibration, and 0.81, 0.81, and 0.57 for SH, MD, and HD over the validation period (2016–2019), which includes parts of the 2-year drought. The lower NSE in HD can be explained by the lower seasonality in nitrate concentrations (Nguyen et al., 2022; Schaefli and Gupta, 2007). Using the same setup, here we extended the model simulations to the 1997–2020 time period (Fig. 2a–c). To create an initial age distribution in the storage before 1997 and to minimize the effect of initial conditions, we replicated model input data between 1993 and 1996 10 times as a warm-up period to obtain initial conditions for our actual model runs (1997–2020). We used these extended simulations to contrast average conditions with the 2018–2019 drought-induced changes in the C–Q relationships in the different sub-catchments of the Selke catchment. Despite distinctly different climatic conditions during the 2018–2019 drought period, nitrate concentrations simulated with mHM-SAS showed an even better fit to the measured sensor data (NSE of 0.89, 0.88, and 0.79 in SH, MD, and HD, respectively) than for the calibration period.(Fig. 2a–c). This good fit over the drought years indicates that the model is also applicable under very dry hydro-meteorological conditions. With this setup, the mHM-SAS model allows for a separation of the contribution of each sub-catchment to the overall catchment responses to account for sub-catchment specific N cycling in the soil zone (denitrification, plant uptake, mineralization, and leaching), instream uptake, denitrification along the groundwater flow paths, and for dynamic transit times (TTs).
2.6 Catchment retention capacity
We estimated the capacity of a catchment to retain N (Nret) during 1 year (starting in May) by the ratio of average nitrate-N load export (NOUT) against annual average atmospheric deposition and long-term average N inputs from fertilizer and manure (NIN),
We used the long-term average N input across crop rotations, as precise information on which crop is applied to which field in which year is not available, and thus a long-term average is more robust. This approach is justified by the fact that N input data did not show any trends and no significant deviation during the 2-year drought. Additionally, we assessed the sensitivity of our results to uncertainty in N input through crop rotation by varying N inputs by ±20 %, which confirmed the overall robustness of our results (Fig. S3).
To estimate changes in Nret relative to the hydrological conditions, we fitted a non-linear regression between Nret and observed discharge (Q) for the years previous to the 2-year drought (1997–2017). To this end, we assume that Q is log-normally distributed and related to nitrate loads (i.e., NOUT) in the form of a power–law relationship (αQβ+1), with β+1 being the L–Q slope. Consequently, Nret can be described as a function of Qβ+1, which would be linear if the L–Q slope equals 1. The result is an Nret–Q relationship that asymptotically approaches 1 (i.e., 100 % retention) at zero discharge, and that is zero if NOUT equals NIN. Nret is a combined measure of biogeochemical N retention in the catchment soils and its consecutive transport via hydrological flow paths to the stream network, which is affected by TTs and denitrification along the flow paths. To acquire a more direct estimate of soil N retention, we additionally fitted the Nret–Q relationship for simulated nitrate leachates (Fig. S4).
3.1 Nitrate concentrations
Daily nitrate-N concentrations (i.e., sensor measurements) differed between the upper (SH and MD) and the lower Selke (HD) and between normal (i.e., 2012–2017) and drought years (2018–2019; Fig. 2a-c). Median concentrations in the upper Selke measured before the 2-year drought ranged from 0.6 and 0.7 mg L−1 during dry periods in SH and MD, respectively, and 2.6 and 2.4 mg L−1 during wet periods. Median nitrate-N concentrations measured at HD were higher and less variable, with a median of 2.2 mg L−1 during dry periods and 3.1 mg L−1 during wet periods. During the 2-year drought, nitrate-N concentrations generally showed a higher seasonal variability (Fig. 2a–c). During dry periods in 2018 and 2019, nitrate-N concentrations were lower than during previous dry periods, with a median of 0.2, 0.4, and 1.4 mg L−1 in SH, MD, and HD, respectively. During the subsequent wet periods (January–April 2019 and 2020), nitrate-N concentrations were exceptionally high, with a median of 4.2, 3.8, and 3.7 mg L−1. In the upper Selke (SH and MD), nitrate-N concentrations reached the highest value observed since the start of measurements in 1983, with 6.4 mg L−1 in January 2019. Peak concentration in the lower Selke (HD) during that time was 5.9 mg L−1, which was also among the highest values measured at this gauge (Fig. 2c).
3.2 Concentration–discharge and load–discharge relationship
Nitrate concentrations during the 2-year drought show an accelerated seasonality (see Sect. 2.3) that is reflected in a more chemodynamic C–Q relationship (Fig. 3a–c). All three sub-catchments show a positive C–Q relationship for daily averages of pre-drought (January 2012–April 2018) nitrate-N concentrations and discharge, with the highest slope in SH, followed by MD, and the lowest slope in HD. During the 2-year drought, the C–Q slope for all sub-catchments increased by values that are multiples of the standard error of the pre-drought regressions for the entire period (Fig. 3a–c), but also for block sampled C–Q slopes that account for the smaller samples size of the drought period (Fig. S5).
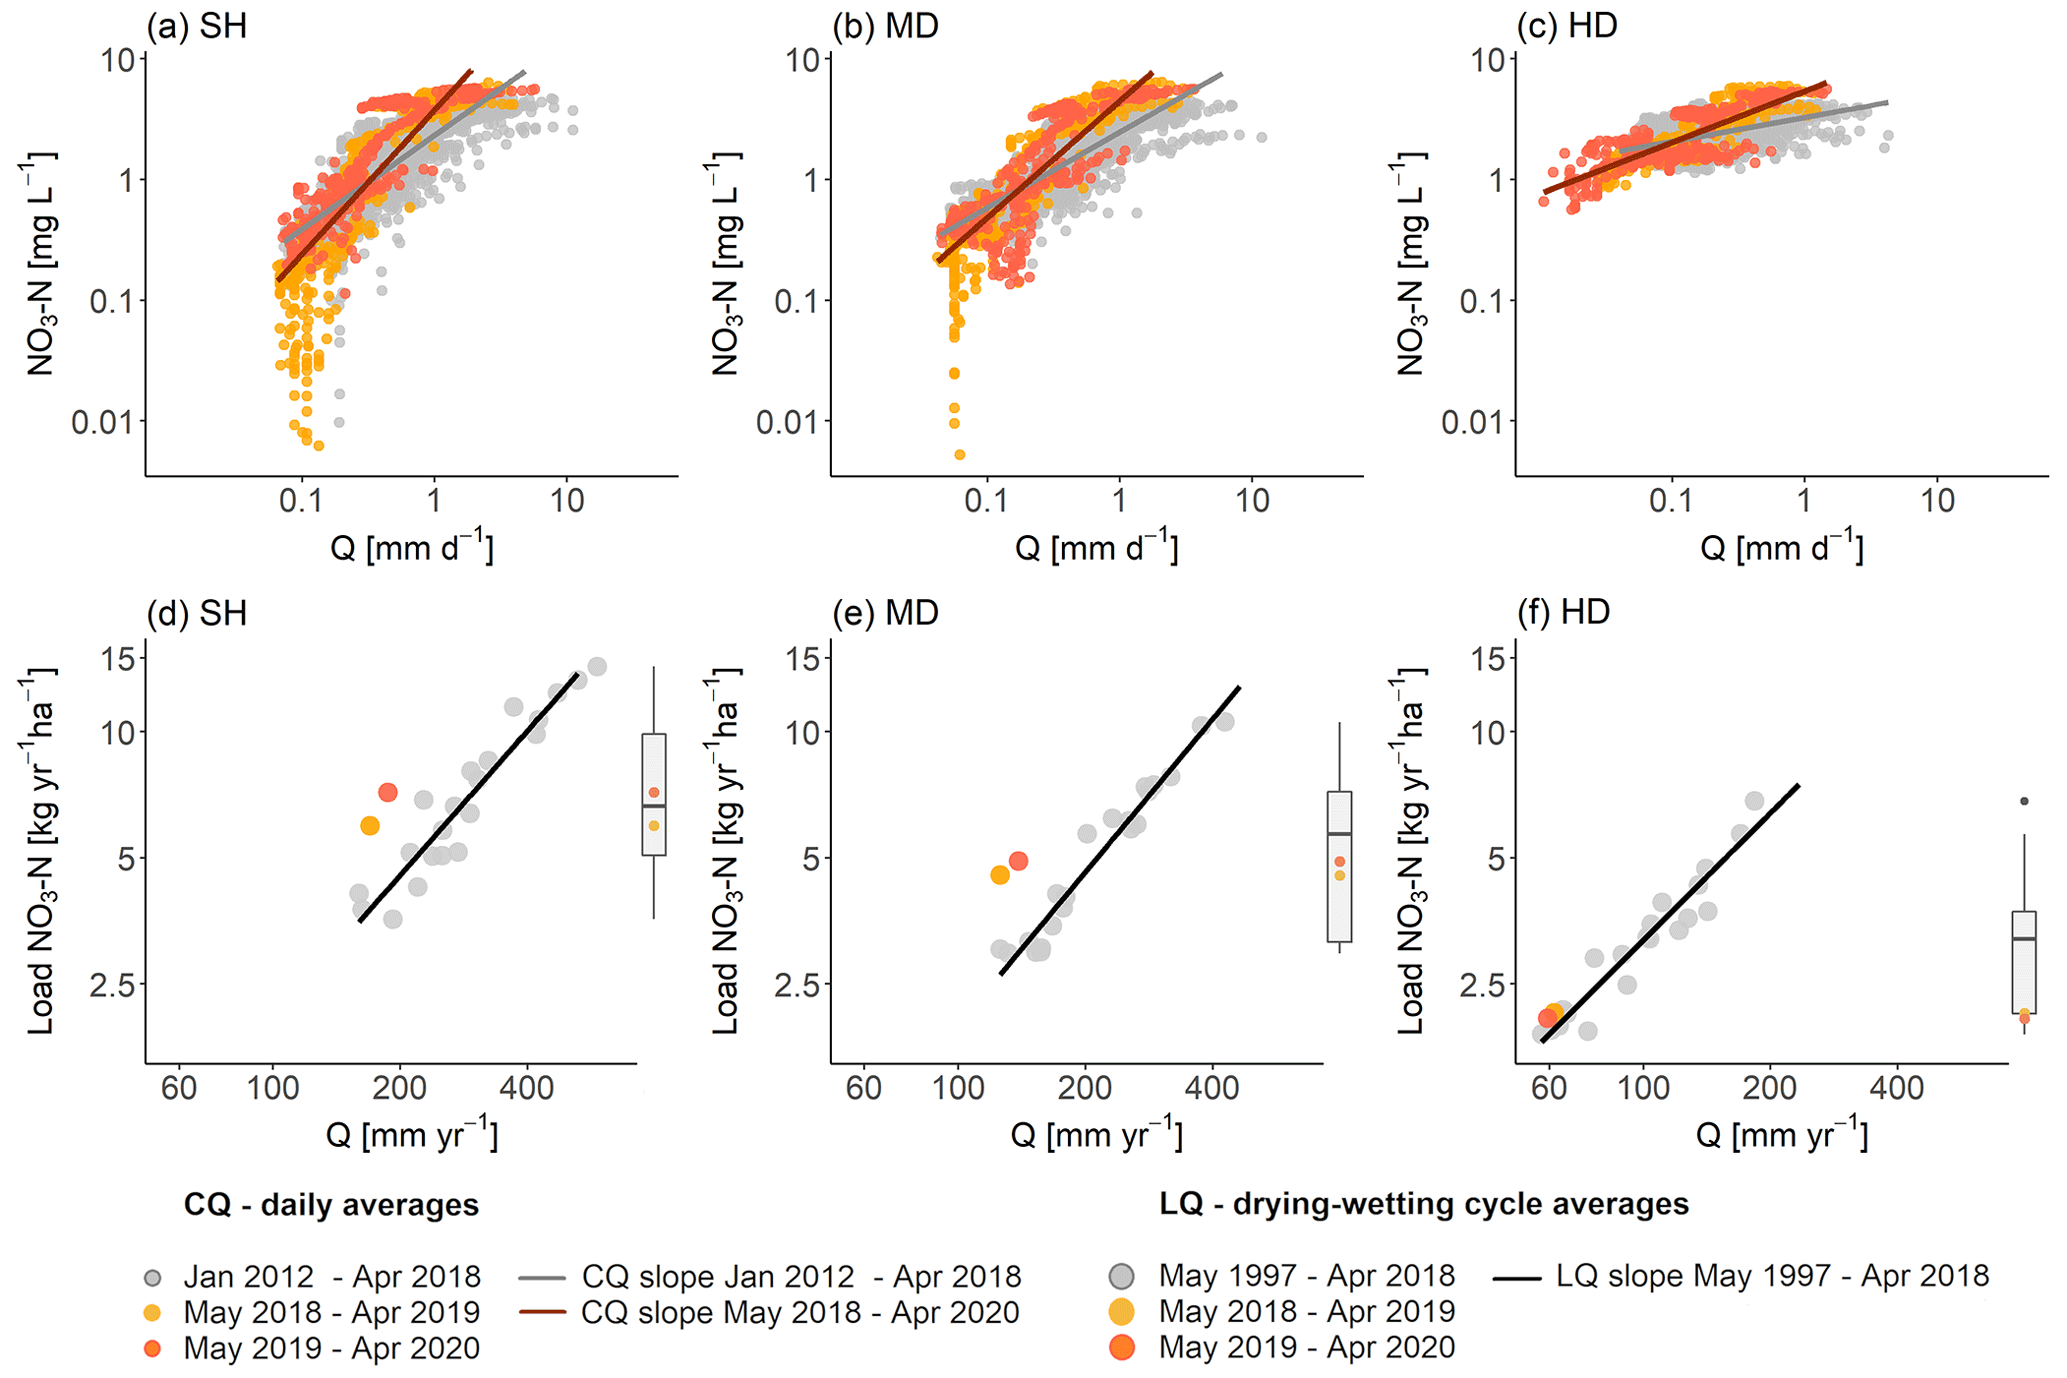
Figure 3Concentration–discharge (C–Q) and load–discharge (L–Q) relationships for the three sub-catchments of the Selke catchment (SH, MD, and HD). (a–c) Daily averaged nitrate concentration and discharge data with log-transformed axes. The lines show the C–Q slope for daily averages before the 2-year drought (grey) and since the start of the 2-year drought (dark red). (d–f) Annual averages for loads and discharge in the log–log space since 1997 (years starting in May). Black lines show the L–Q slope previous to the 2-year drought. Box plots at the right side of each panel (d–f) show the distribution of data points within the pre-drought load range and drought cycles indicated as colored dots.
Median nitrate-N loads per area over the years 1997–2017 were 6.6, 5.7, and 3.2 kg yr−1 ha−1 in SH, MD, and HD, respectively. During the 2-year drought, nitrate-N loads were in a similar range in SH (6.0 and 7.2 kg yr−1 ha−1 in 2018 and 2019, respectively) and lower but still within the interquartile range in MD (4.5 and 4.9 kg yr−1 ha−1) (Fig. 3d–f). They were clearly lower in HD with a load of 2.1 kg yr−1 ha−1 in both years (Fig. 3d–f).
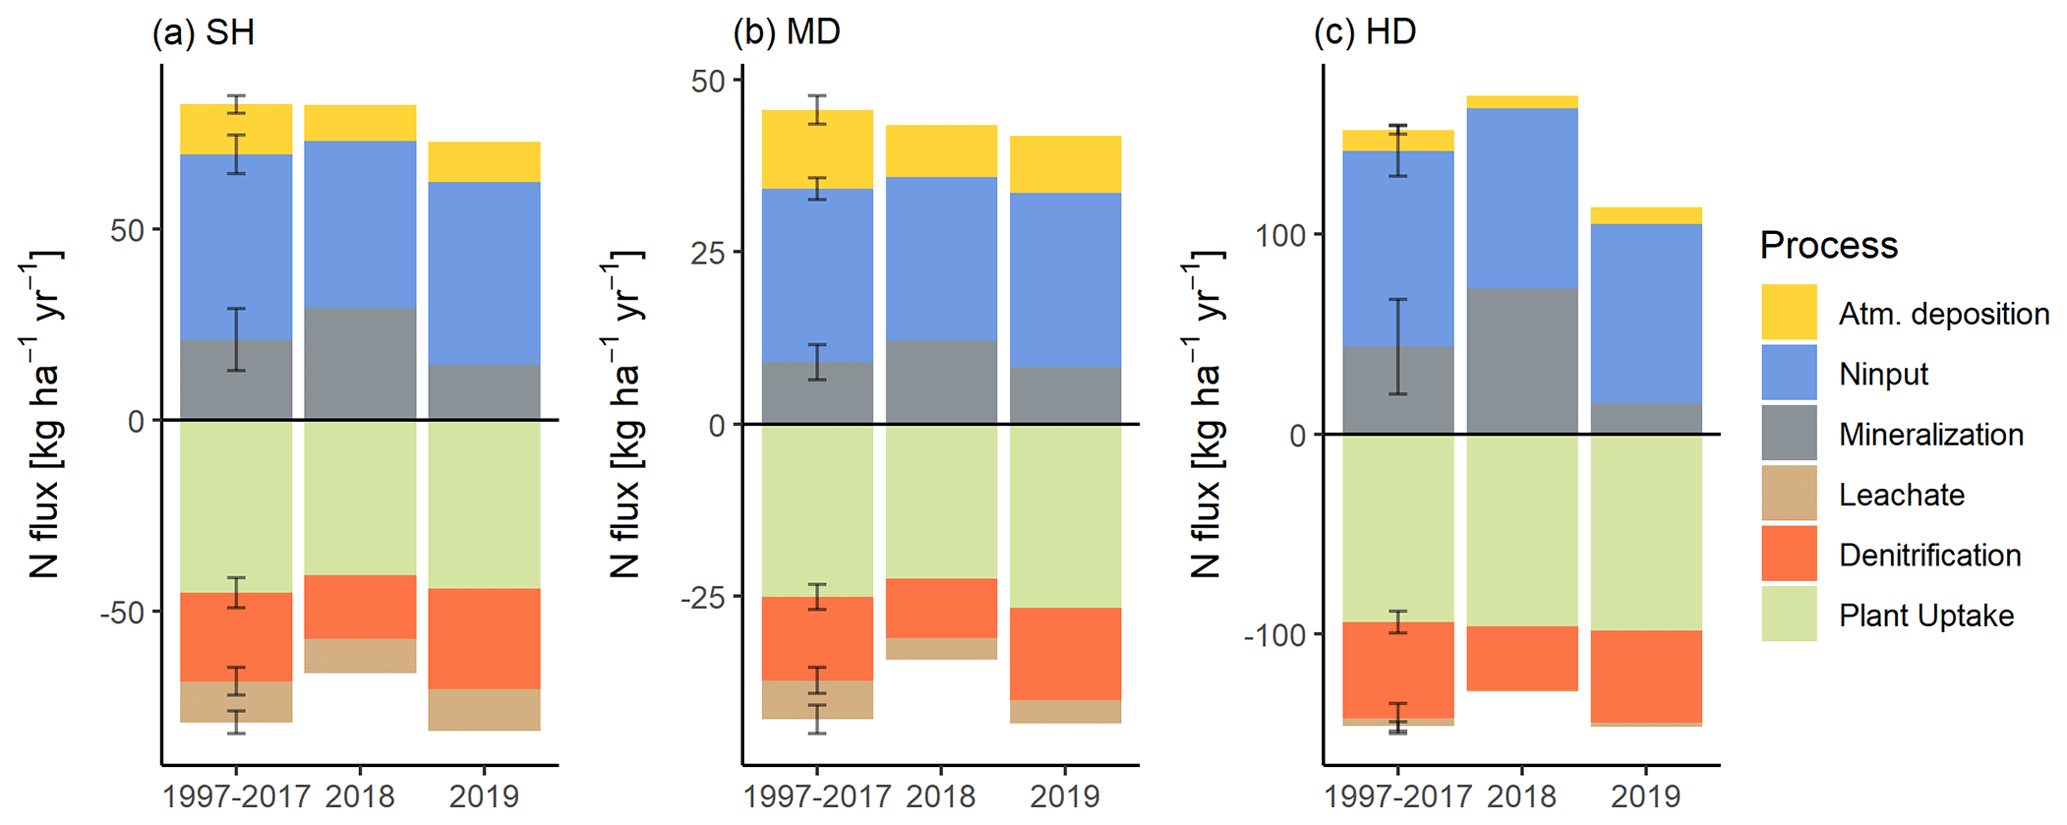
Figure 4N input and N fluxes simulated via mHM-SAS separately for the three Selke sub-catchments (SH, MD, and HD). N entering the catchment soils are shown as positive values, N fluxes leaving the catchment soils are shown as negative values. Error bars represent the standard deviation between annual averages from 1997 to 2017.
L–Q relationships showed a good fit (R2 0.9–0.96) with an L–Q slope close to 1 in all sub-catchments, reflecting that nitrate-N loads increased with increasing discharge (Fig. 3d–f). During the drought cycles 2018 and 2019, loads exported from the upper Selke were clearly above the loads expected from the long-term L–Q relationship. So, relative to discharge that was naturally low during the drought, loads were unexpectedly high. More specifically, exported loads at SH were 2.2 and 2.9 kg ha−1 yr−1 higher in 2018 and 2019 than expected from the long-term L–Q relationship, and at MD, loads were 1.9 kg ha−1 yr−1 higher in both years. In relative numbers, this is an increase of 57–73 %, compared to the predicted export from the L–Q relationship from previous years. In the lower Selke (HD), on the contrary, the difference between observed and expected nitrate-N export was marginal during the 2-year drought (0.2 kg ha−1 yr−1 in both years, equivalent to an increase of 10 %). However, exported nitrate loads in the lower Selke have generally decreased since 2011 (Winter et al., 2021). Therefore, 2013–2017 loads are the ones plotting clearly below the long-term L–Q slope (Fig. 3f); as such, the L–Q relationships from the 2-year drought can be seen as slightly increased if compared to the most recent years only. To illustrate, exported nitrate loads at HD during the 2-year drought are around 0.5 kg ha−1 yr−1 higher than expected from the 2013–2017 L–Q relationship.
Table 1Sub-catchment specific characteristics of the Selke catchment.
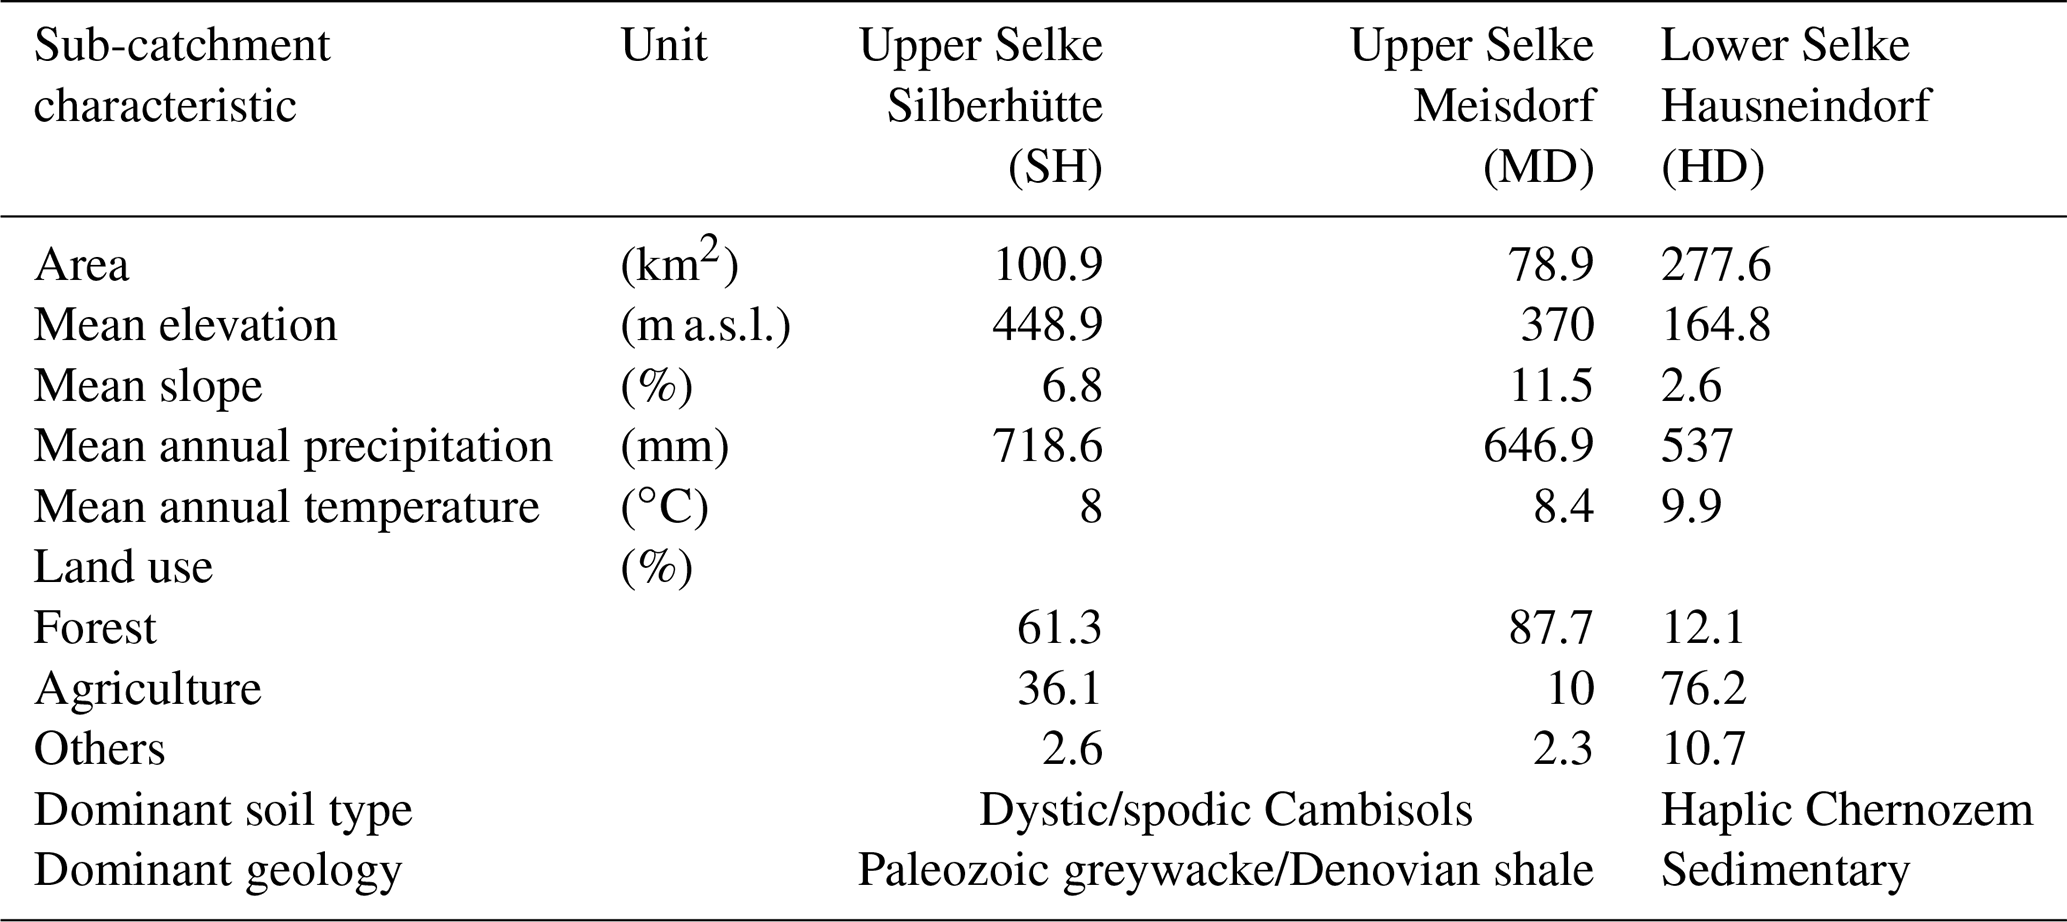
Note: catchment characteristics refer to spatially separated, not nested sub-catchments. Precipitation and temperature data were taken from the period 1997–2020.
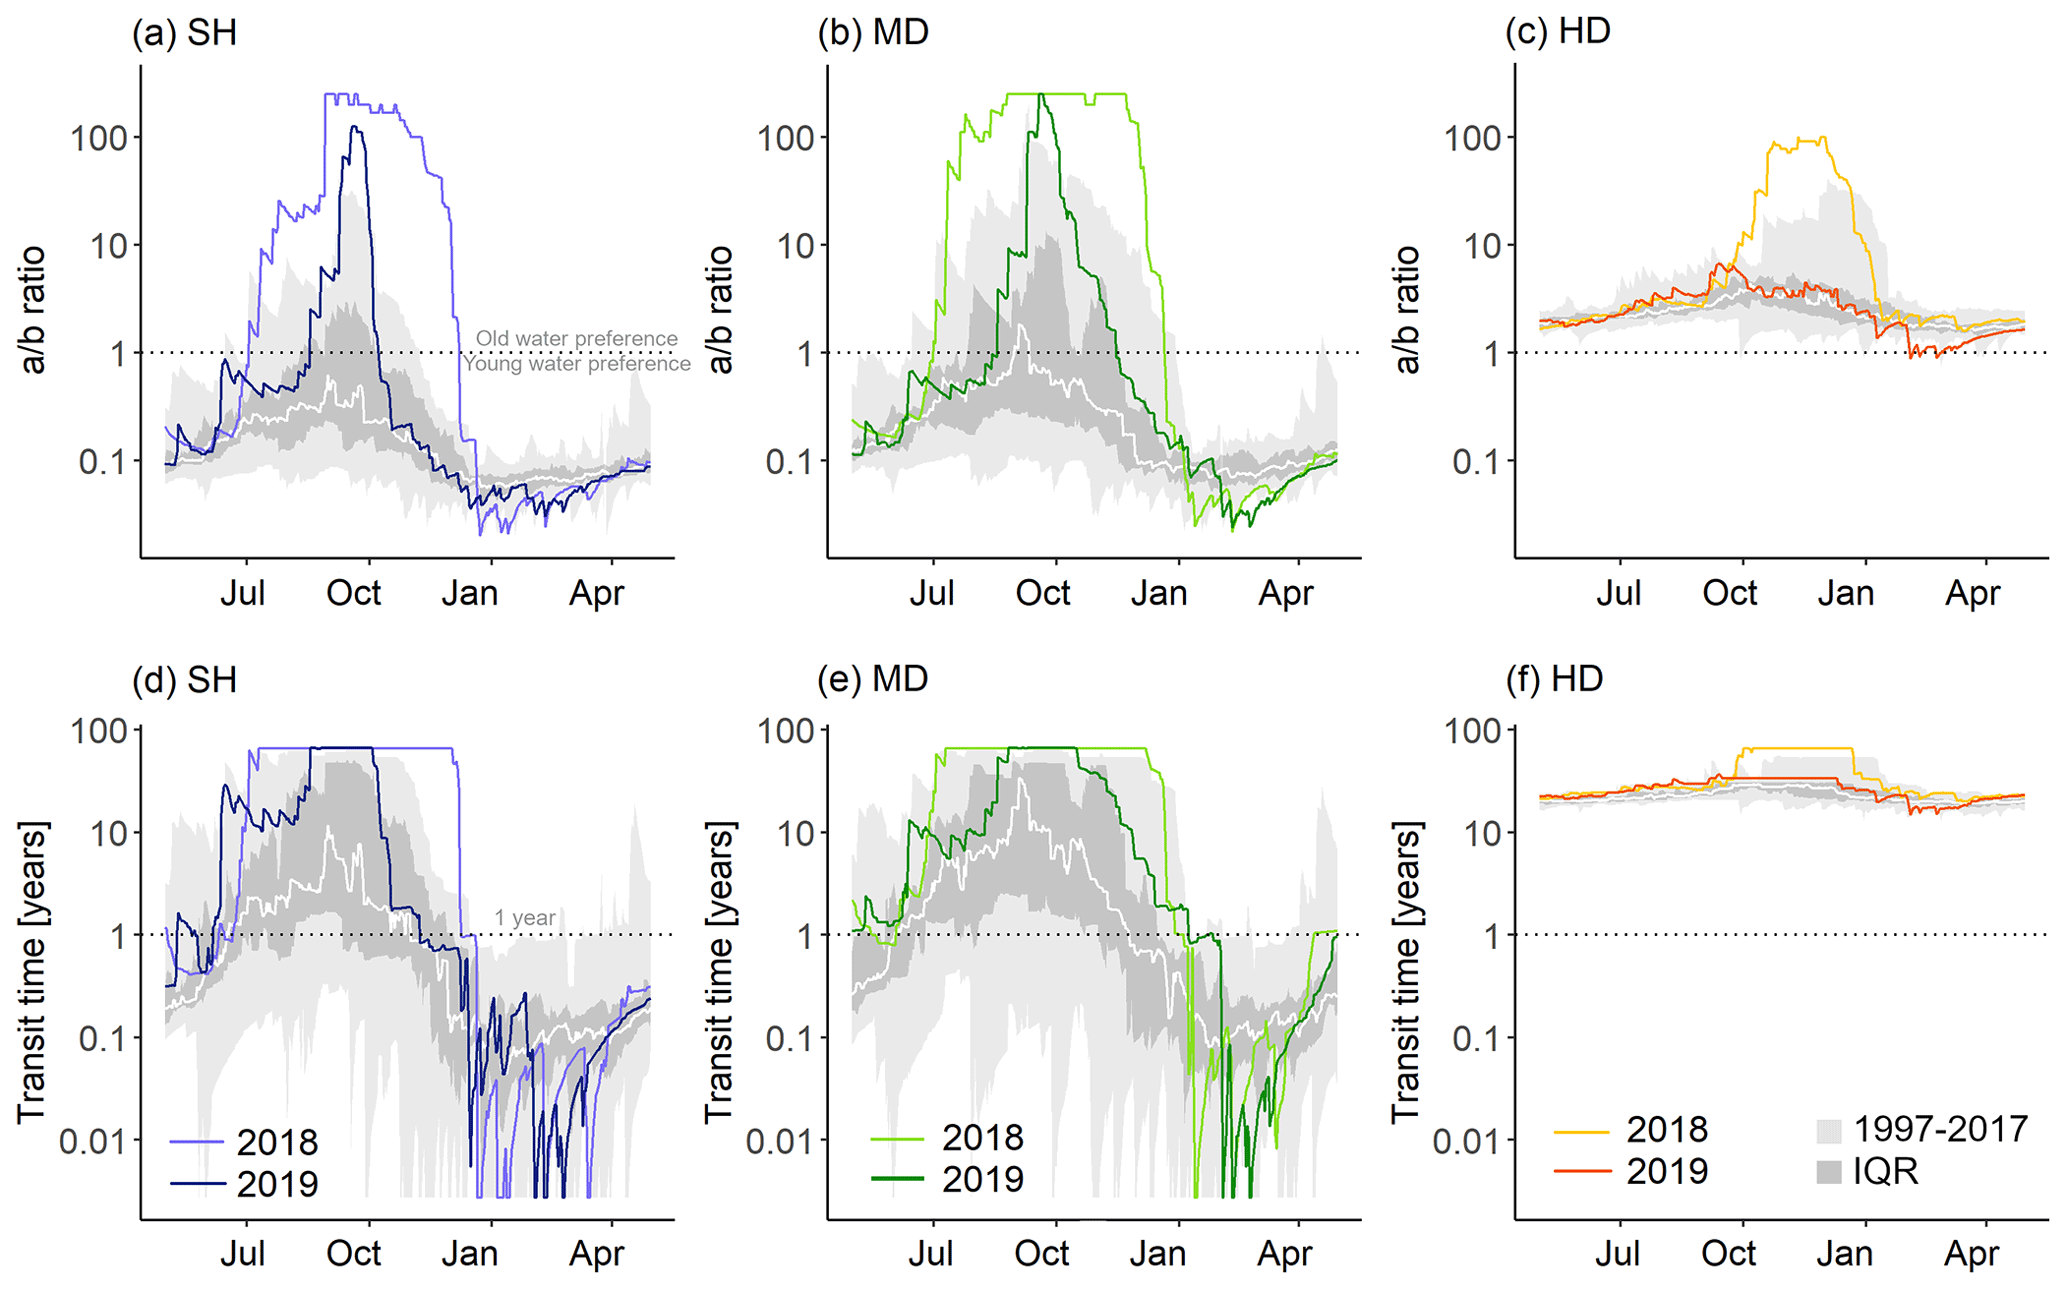
Figure 5Simulated sub-catchment-specific water age selection preference (a–c) as the ratio of the fitted parameters a and b, and (d–f) median transit times are given in years. Grey areas indicate the range of all years previous to the drought (1997–2017, with a year starting in May), and their interquartile range and white lines are the median of all pre-drought years. Colored lines indicate the 2-year drought, with the 2 years starting in May 2018 and 2019.
3.3 Simulated internal nitrogen fluxes
The sub-catchment-specific N fluxes, simulated via mHM-SAS (with a good model fit for in-stream nitrate concentrations) and averaged over the years starting in May, are depicted in Fig. 4. They show that particularly in 2018, which was the driest year of the 2-year drought (Fig. 1b), N fluxes clearly differed from the long-term average (1997–2017). Notably, mineralization rates in 2018 increased by 39 %, 36 %, and 66 % in SH, MD, and HD, respectively. In the same year, denitrification in the soils of the sub-catchments was 27–34 % lower than the long-term average, whereas plant uptake was reduced by around 10 % in the upper Selke (SH and MD) but not in the lower Selke (HD), likely due to differences in the soil type (Table 1). N in the leachates was relatively low in both cycles (2018 and 2019), especially in MD and HD, due to the dry soil moisture content (Fig. S1).
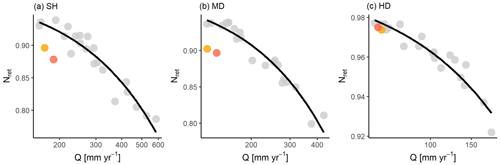
Figure 6Relationship between the N retention capacity of catchments (Nret) and log-scaled discharge (Q) at the nested catchment scale, given as annual averages (12-month period starting in May). Black lines represent the non-linear relationship between Nret and discharge (Q) prior to the 2-year drought (1997–2017), with log-transformed x axes.
3.4 Transit times and storage selection preference
Similar to nitrate concentrations and loads, the simulated ratio for SAS functions (indicative of young versus old water preference) and median TTs showed a different behavior during the 2-year drought compared to previous years, with clear contrasts between upper (SH and MD) and lower Selke (HD; Fig. 5). Upper Selke sub-catchments showed a young water preference ( ratio < 1) with shorter median TTs during the wet periods (January–April; median of 42 and 56 d in SH and MD, previous to the drought and median of 23 and 39 d during the drought). During dry periods (July–October) previous to the drought, the median of median TTs in the upper Selke was 2.5 and 7.0 years in SH and MD, respectively (Fig. 5d and e). Nevertheless, more than half of all years still showed a young water preference, even during dry periods (Fig. 5a and b). However, during the dry periods of the 2-year drought, median TTs were very long (median of median TTs was 66 years in both sub-catchments) with a pronounced old water preference, particularly in 2018. Note that the maximum TTs in the simulations are restricted to the number of years since the start of simulations plus the warm-up period, which explains the July–December plateau (Fig. 5). Long median TTs during the dry season can therefore be interpreted as >66 years. This cutoff likely causes an underestimation of the median of previous years as well and creates some additional uncertainty in the absolute numbers. However, this does not affect the general result of exceptionally high median TTs during the dry periods in 2018–2020 compared to previous years (1997–2017).
In the lower Selke sub-catchment (HD), there is a clear selection preference for old water throughout all years and periods (Fig. 3c). Even during wet periods, median TTs were relatively long (median 20 years) compared to the upper Selke sub-catchments (SH and MD; Fig. 5d–f). Similar to the upper Selke sub-catchments, median TTs during the dry periods in 2018 and 2019 were longer than normal, with a median of 30 years compared to 24 years in previous years.
3.5 Catchment retention capacity
In all cases, the sub-catchments retained the largest part of N input (≥0.79). This was most pronounced in HD, where retention capacity was always ≥0.89 (note that these values account for the nested catchment). The fit of the Nret–Q relationship (1997–2017) was high, with an R2 of 0.90, 0.94, and 0.91 in SH, MD, and HD, respectively. In all sub-catchments, Nret shows a clear decrease with decreasing annual discharge in all sub-catchments, which is steepest and most sensitive at low Nret and high discharge (Fig. S3) and flattening towards low discharge conditions (Fig. 6). Similar patterns could also be observed for the Nret–Q relationship with simulated nitrate leachates from the catchment soils. However, uncertainty for the simulated soil N retention is larger, due to uncertainty in the model parametrization (Fig. S4).
In the upper Selke (SH and MD), the Nret–Q relationship during the 2-year drought (2018–2019) was clearly lower than that of previous cycles (1997–2017). Nret dropped by around 0.04–0.05 compared to the long-term regression line, which can be translated into 1.8–2.8 kg N ha−1 yr−1 that are not retained but exported. In the lower part of the catchment (HD), Nret was very close to the long-term regression line (difference of 0.002).
4.1 Intra-annual variability of nitrate concentrations
The presented results show that the 2-year drought spanning the years 2018 and 2019 and across Central Europe had strong impacts on catchment water quality in terms of nitrate export. We found an increased intra-annual variability of nitrate export, with lower concentrations during the dry periods (July–October) and exceptionally high concentrations during the subsequent wet periods (January–April). This shows that the drought did not only affect nitrate fluxes in the soil leachates, as discussed in the 2020 Nitrate Report from the Netherlands (RIVM, 2021), but it can also propagate through catchments affecting in-stream nitrate concentrations at the catchment outlet within a relatively short time. These results are in close agreement with previous studies that similarly reported low nitrate concentrations during a drought and high concentrations during subsequent rewetting (Górski et al., 2019; Loecke et al., 2017; Morecroft et al., 2000; Mosley, 2015). For example, Loecke et al. (2017) reported that the shift from very dry to wet conditions resulted in an increase in flow-weighted nitrate export compared to previous years, and Davis et al. (2014) suggested that the antecedent soil moisture conditions play an important role in the response of nitrate export during runoff events.
The shift in the C–Q relationship towards a steeper C–Q slope (Fig. 3a–c) reflects that the intensification in the seasonality of nitrate export was not solely driven by low discharge due to the drought. Instead, nitrate concentrations during dry periods were even lower than expected from the C–Q relationship and higher during wet periods, showing an increased intra-annual variability compared to that of discharge. This increased concentration variability indicates that biogeochemical and hydrological processes (e.g., runoff generation processes; Lange and Haensler, 2012) within the catchment changed during the drought, affecting the availability and transport of nitrate. The exceptionally low nitrate concentrations during the dry periods of the 2-year drought can be explained by the strong old water preference during these periods (Fig. 5a–c). Nguyen et al. (2022) showed that old water in the upstream Selke catchment is considerably affected by denitrification (Damköhler number > 10), which can explain the relatively low nitrate concentrations. The pronounced old water preference in the upstream catchment during the 2-year drought is in agreement with a study by X. Yang et al. (2021). Using stable water isotopes as age tracers in a small (1.44 km2) headwater catchment of the Selke catchment, they found a large increase in stream water ages, driven by a decrease in younger surface runoff and stream discharge. Differences in the median TTs between this and our study (8 and 46 years) can be explained by the difference in the catchment area of around 2 orders of magnitude and by uncertainty in the estimation of longer TTs, especially as annually cycling isotope tracers show only limited applicability towards long TTs (Seeger and Weiler, 2014).
In the downstream sub-catchment, the potential for denitrification in groundwater is very low (Damköhler number < 1; Nguyen et al., 2022). Hannappel et al. (2018) looked at evidence for groundwater denitrification in the area of our study site and found such evidence only in the upstream but not in the downstream area, which can be explained by differences in the geology (Table 1) and a lack of electron donors in the aquifer which are needed for denitrification (Rivett et al., 2008). Therefore nitrate concentrations in the downstream sub-catchment do not significantly decrease with water ages and could, instead, still show signs of historically higher N inputs (Winter et al., 2021). Hence, the low nitrate concentrations during the dry periods are likely driven by the upstream catchment area. However, also the efficiency of instream N uptake is enhanced with higher temperatures (Nguyen et al., 2022), which is an additional factor explaining part of the low nitrate concentrations during drought, even more so in the lowland part of the catchment where light availability is higher and flow velocity is reduced (Rode et al., 2016). Therefore, a combination of both dilution of old and largely denitrified water from upstream and increased in-stream uptake efficiency, mainly downstream, are responsible for the low nitrate concentrations during the dry periods of 2018 and 2019.
While predominately old (pre-drought) water was exported during dry periods, the rates of denitrification and plant N uptake from the soils during 2018 decreased across the catchment. This decrease can be attributed to the very low soil moisture during the drought that inhibits denitrification (as implemented in the soil routines in HYPE; Lindström et al., 2010) and plant growth. Together with the deactivation of shallow flow paths, the reduced N removal can lead to an accumulation of inorganic N in the catchment soils. Similarly, the higher accumulation of organic material during summer and the rewetting of dry soils in autumn can cause a peak in mineralization that transforms organic material into mobile inorganic N (Campbell and Biederbeck, 1982; Haynes, 1986), in agreement with the simulated high mineralization rates for 2018 (Fig. 4). With the shift towards younger water fractions and median TTs < 2 months during the wetting and wet periods in the upstream sub-catchments, the accumulated and mineralized N pool can be rapidly transported to the stream network, which can explain the high nitrate-N concentration peaks (Fig. 2). In contrast, in the downstream sub-catchment, old water fractions dominate all year round (Fig. 5f), and therefore most of the accumulated N cannot reach the stream network within the subsequent wetting and wet period.
Note that the “wetting” and “wet periods” 2018 and 2019 are part of the 2-year drought and, in relative terms, were also exceptionally dry compared to previous wetting and wet periods, but they typically show a higher catchment wetness compared to “dry periods” due to pronounced hydro-meteorological seasonality over the study region (Sinha et al., 2016; J. Yang et al., 2018).
The changes in N cycling were only evident for the year starting in May 2018, not for the one starting in May 2019, which was dry but not as dry as in 2018 (Figs. 1b and 4). This indicates that the described perturbation in N cycling does only occur under severe drought conditions. In a small (0.6 km2) catchment, Burt et al. (2015) found evidence that post-drought mineralization can supply sufficient N to sustain increased nitrate concentrations through the next high-flow season. Hence, such drought legacies might have also built up in the larger Selke catchment and impacted nitrate export in subsequent years. One indication for this is that although the year 2018 was drier and had a stronger impact on soil N fluxes (Fig. 4), nitrate export dynamics for the year 2019 were comparable to the ones observed in 2018 (Fig. 3).
In comparison to other regions of the world, irrigation is not a common practice in the study area (EEA, 2018), but this might change in the future (Riediger et al., 2014). Crop irrigation would increase the soil moisture content and might therefore buffer drought impacts, such as the decrease in plant uptake and denitrification, and might lead to mobilization of nitrate, which would otherwise be retained in the upper soil until rewetting in autumn. As such, crop irrigation might counterbalance the reduction of N retention in the catchment soils and the accumulation of N during summer. However, irrigation would also increase the pressure on the available water resources and might enhance greenhouse gas emissions from agricultural soils (Sapkota et al., 2020)
4.2 Sub-catchment-specific contributions to the integral nitrate response to the drought
The spatial configuration of land use and other characteristics within a catchment can play an important role in nitrate export from the entire catchment and its temporal variability (Casquin et al., 2021; Dupas et al., 2019; Winter et al., 2021). In the Selke catchment, considering the pronounced differences between the upstream and the downstream area is crucial to understand the integrated signal of nitrate export at the catchment outlet (Winter et al., 2021). Previous studies showed that the forested upstream area contributed disproportionally to annual nitrate loads, despite having a lower N input, whereas the downstream part contributed most to nitrate export during low-flow periods (Nguyen et al., 2022; Winter et al., 2021). During the 2-year drought, this difference in the sub-catchment-specific contributions became even more pronounced. Water from the upstream catchment area during the dry periods was comparably low in nitrate, and therefore had the potential to dilute the higher concentrations from the downstream agricultural areas. Nonetheless, the contribution from the downstream area maintained nitrate-N concentrations at levels >1 mg L−1 even under low flow conditions during summer, when aquatic ecosystems are most vulnerable to eutrophication (Jeppesen et al., 2010; Whitehead et al., 2009). With rewetting, the ability of the forested upstream area to dilute downstream nitrate concentrations has been almost entirely lost, as nitrate concentrations reached similar or even higher levels than the downstream area (Figs. 1c and 2a–c). Therefore, the observed changes in immediate response to the drought with regard to the seasonal dynamic of nitrate concentrations at the catchment outlet were almost entirely controlled by the upstream area due to its shorter TTs and young water preference. The sub-catchment differences in median TTs and storage selection preferences can be explained by differences in landscape characteristics within the catchment. The upstream area is located in the Harz Mountains with higher precipitation, steeper slopes, and shallower soils and, in turn, a faster transit of water and shorter flow paths to the streams, which typically results in faster TTs and is reflected in a selection preference for younger water (Jiang et al., 2014; Tetzlaff et al., 2009; Table 1). In contrast, thick sedimentary aquifers, flat topography, and very sparse tile drainage in the downstream area favor long TTs and a preference for old water (Winter et al., 2021).
Considering the important role of the upstream, largely forested (87.7 %; Table 1) part of the catchment for the overall nitrate export, one should also consider the potential long-term impacts of the 2-year drought on forest ecosystems. Schuldt et al. (2020) showed that especially the dry summer in 2018 caused severe tree mortality in Central Europe, whereas Schnabel et al. (2022) could show in a German floodplain forest that the drought impact on trees was even stronger in 2019 due to an accumulated drought effect. Such forest dieback can cause increased nitrate concentrations (Kong et al., 2022; Mikkelson et al., 2013), but its effect on water quality can again be delayed for several years (Huber, 2005). Therefore, forest dieback should be considered as an additional drought-induced threat to stream water quality that might impact nitrate concentrations in the future.
4.3 Exported nitrate loads and catchment retention capacity
The overall discharge during the 2-year drought was very low. Nitrate loads, however, were only low in the downstream part of the catchment (HD). In the upstream area (SH and MD), nitrate loads were up to 73 % higher than expected from the long-term L–Q relationship. This can be explained by the exceptionally high nitrate concentrations during the wetting and wet periods of the 2-year drought (November–April, Fig. 2). As discussed above, these high nitrate concentrations are the result of reduced plant uptake and denitrification of N in the soils during the previous dry periods and short TTs during wet periods. Hence the increase of exported loads relative to discharge, but also relative to N input to the catchment, show that under severe drought, a catchment can lose a part of its functionality to retain N. The long-term L–Q relationship and the Nret–Q relationship showed good fits for the pre-drought year, indicating a strong discharge control. Scatter in these relationships might have been induced by other factors, such as temperature, controlling biogeochemical processes, and N availability (Nogueira et al., 2021) or specific runoff event characteristics (Winter et al., 2022). With climate change, temperature and other associated factors as well as runoff event characteristics were not stable between 1997 and 2017 (Fig. 1b; IPCC, 2018; Winter et al., 2022). Nevertheless, none of these years has shown a deviation from the L–Q relationship comparable to that in 2018 and 2019. This indicates that the 2-year drought considerably altered catchment functioning, whereas the overall L–Q relationship can be considered relatively stable over previous years.
We identified two drivers of a decrease in Nret, i.e., an increase in discharge and the 2-year drought (Fig. 7). The discharge-driven decrease in the Nret can be explained by hydrologic mobilization and transport dominating over biogeochemical processes such as N uptake and removal. In contrast, under dry (but not drought) conditions, the role of nitrate uptake and removal gains in relative importance, and with that, the retention capacity of the catchment increases. However, extreme hydro-meteorological events, such as the 2018–2019 drought, can cause a perturbation of those biogeochemical processes if soils are too dry to maintain functionality in terms of N cycling. The decrease of N uptake and removal can result in a divergence from the retention–discharge relationship, also for other years with very low discharge (Figs. 6 and 7). Until the end of the data record available for this study, no recovery from this loss in Nret in the upstream catchment area could be observed, but there has not yet been a specifically wet year since the drought in 2018. Therefore, the resilience of the sub-catchments (Hashimoto et al., 1982), in terms of their ability to recover from a loss in catchment N retention capacity after the 2-year drought, remains uncertain.
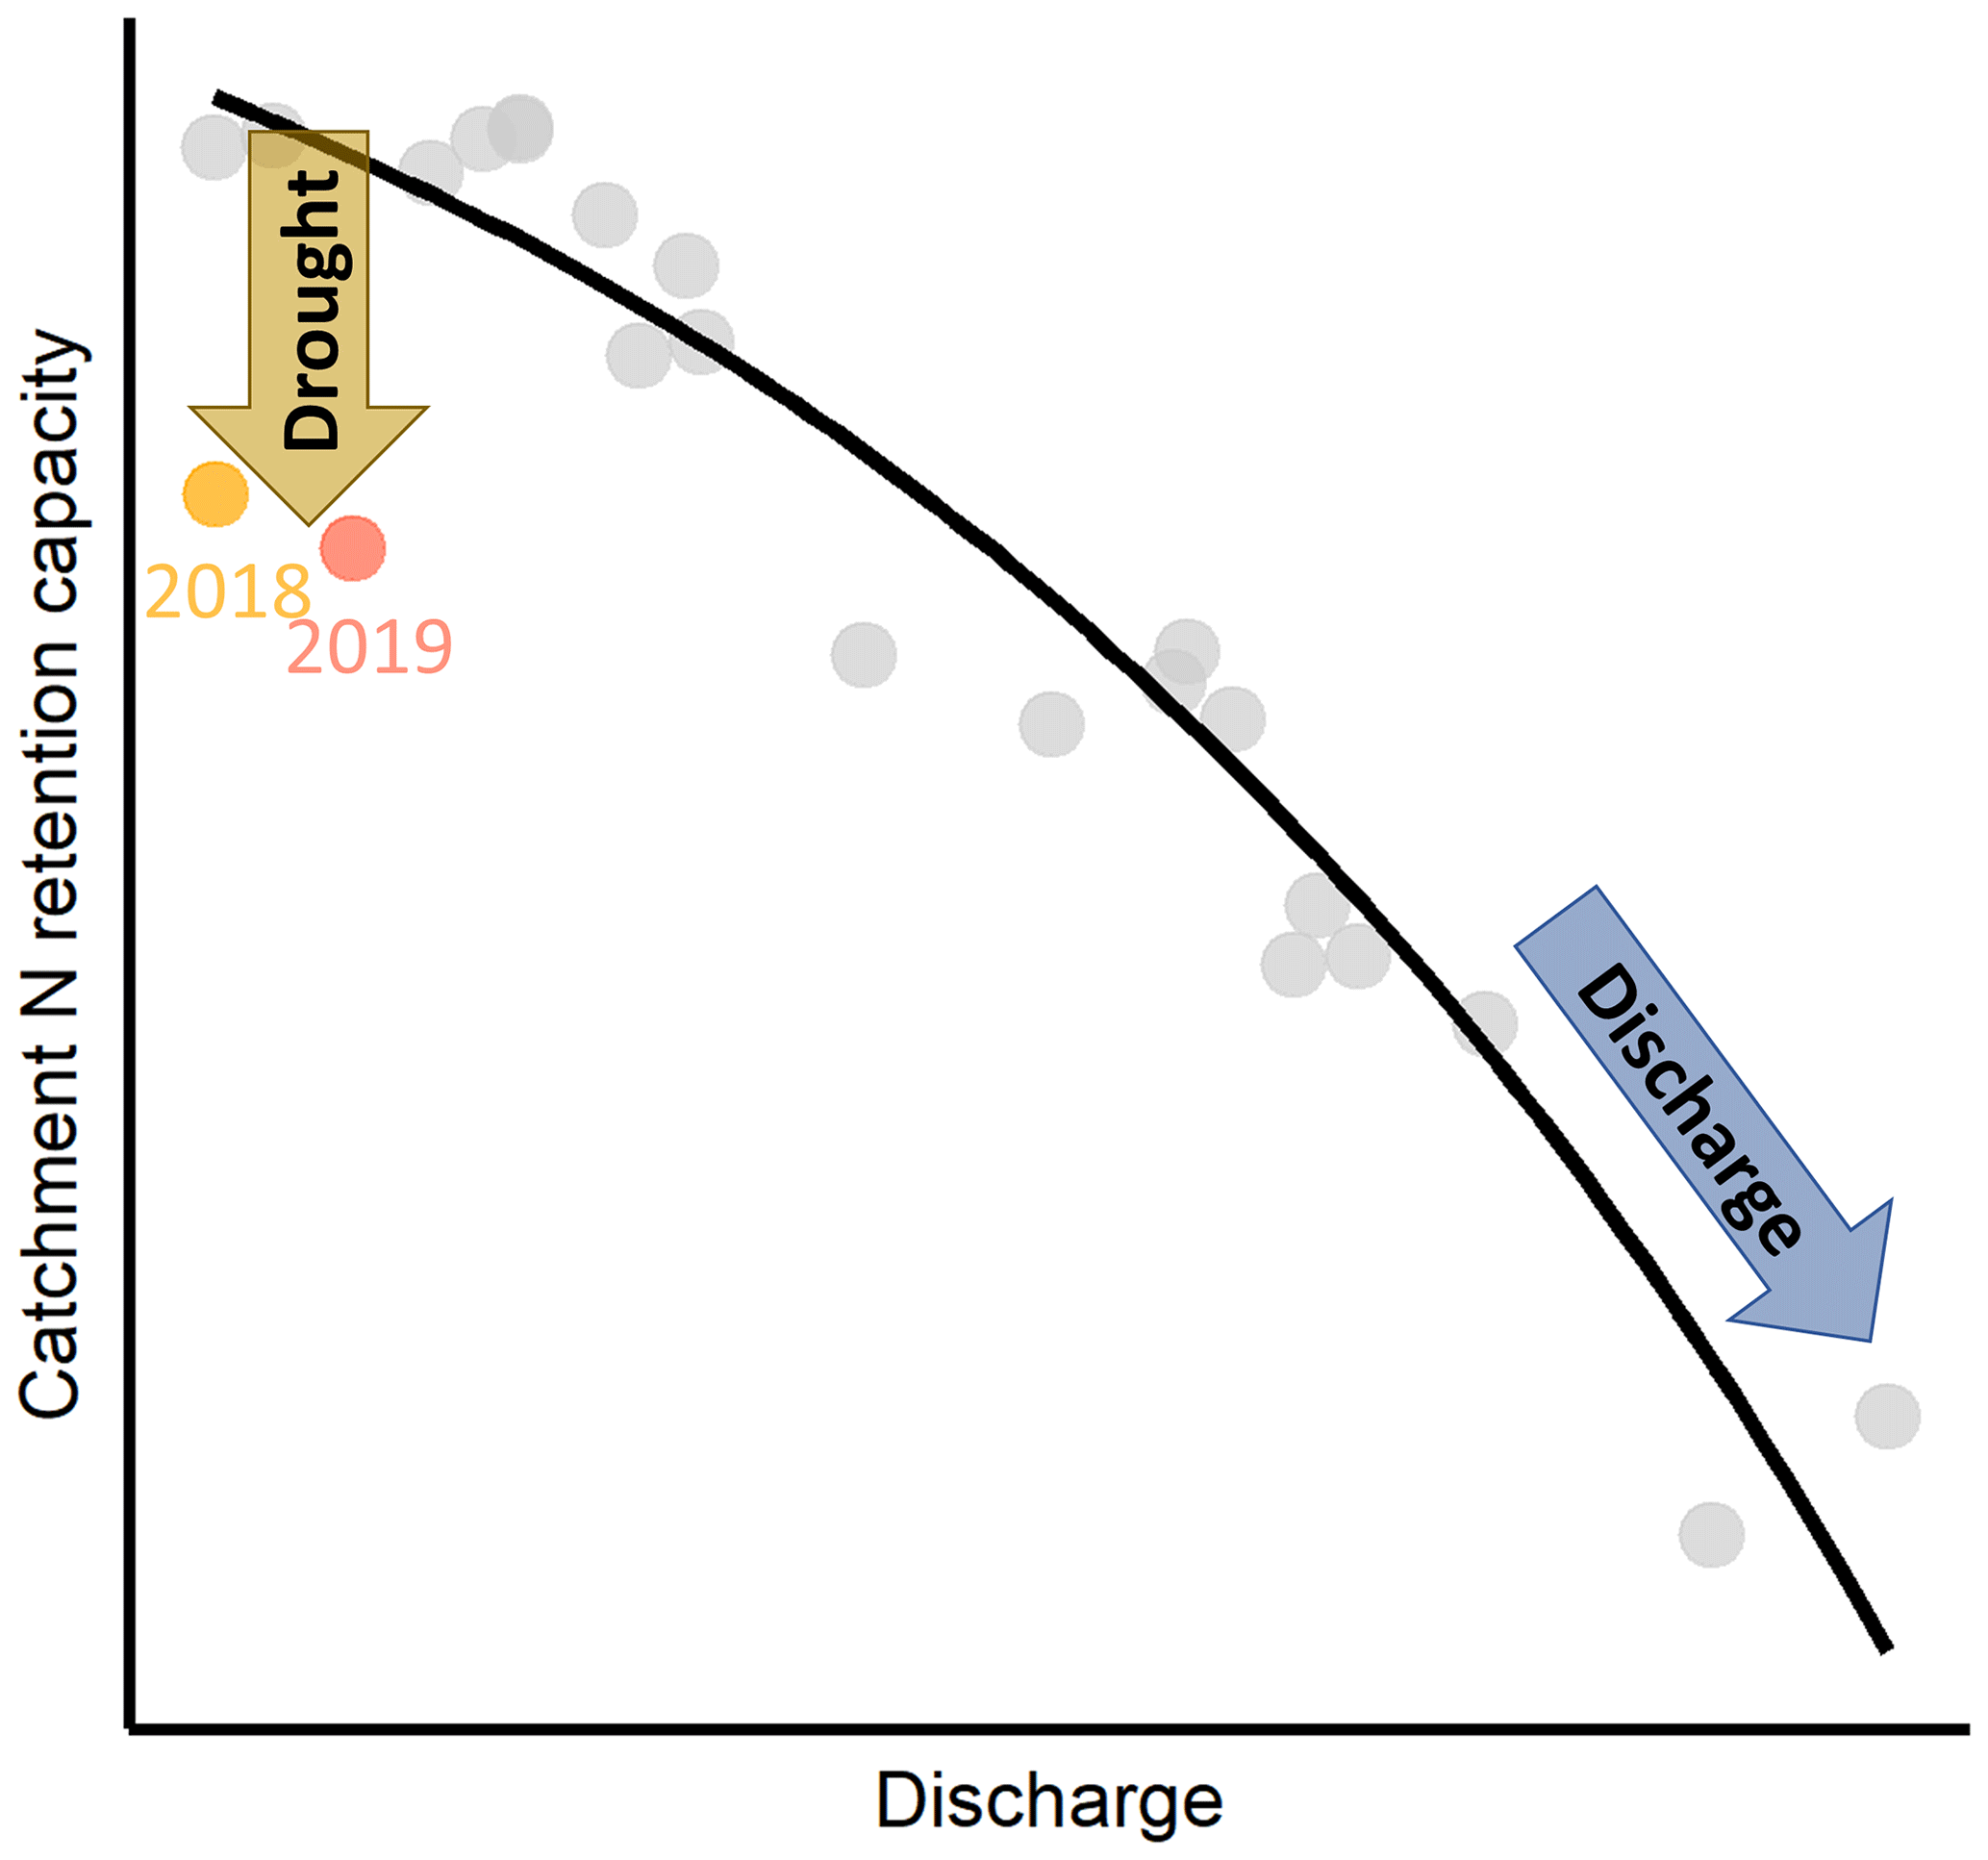
Figure 7Conceptual framework of the capacity of a catchment to retain N in relation to average discharge. The framework illustrates two potential drivers that cause a reduction in the catchment retention capacity. Those are either an increase in discharge (blue arrow) or a drought event (yellow arrow). Data were taken from the gauge at MD that gives an integrated signal of the upper Selke catchment, which is characterized by a relatively fast reaction in riverine nitrate export to drought.
When looking at N export at the sub-catchment gauges, the decrease in the catchment retention capacity is only evident in the upstream sub-catchments. This difference in catchment retention capacity can be explained by different sub-catchment-specific TTs. Whereas predominantly short TTs in the upstream sub-catchments during the wet period allow for a rapid response of stream nitrate concentrations to drought, long median TTs in the downstream sub-catchment (even under wet conditions) dampened such a fast drought response. Instead, increased N in the soil leachates, together with long median TTs, potentially generate a hydrological N legacy that might become visible at the catchment outlet years to decades later (Van Meter et al., 2016; Van Meter and Basu, 2015), especially under the assumption of low denitrification potential in groundwater (Nguyen et al., 2022). One indication is high nitrate concentrations in 2019 and 2020 in a groundwater observation well in the lower Selke catchment (Fig. S6). Moreover, Jutglar et al. (2021) reported immediate and delayed drought responses in the form of increasing nitrate concentrations in the groundwater in Southwest Germany after the drought in 2003. Besides such first evidence, estimating the potential biogeochemical and hydrological nitrogen legacies induced by severe drought will be a task for future research.
The presented study is among the first to assess the impact of the 2018–2019 drought in Central Europe on nitrate concentrations in a heterogeneous mesoscale catchment. We found that such an exceptional drought can have significant impacts on water quality in terms of nitrate concentrations, load export, and catchment N retention capacity.
C–Q relationships revealed an increased intra-annual variability in nitrate concentrations, with low concentrations during dry periods and exceptionally high concentrations during wet periods, mainly driven by the more responsive upstream part of the catchment. Low concentrations could be explained by a selection preference for old and largely denitrified water, whereas high concentrations reflect a reactivation of shallow and young flow paths that transport accumulated N from the catchment soils. The increased intra-annual variability was not only driven by a stronger temporal shift in N transport but also by a decrease in N uptake by plants and removal via denitrification during dry periods. Thus also, the overall provision of exportable nitrate increased, which was reflected in a decrease in the capacity of the catchment soils to retain N and an increase in nitrate loads at the (sub-)catchment outlets relative to the loads expected from the long-term L–Q relationship. We identified two drivers for a decrease in the catchment N retention capacity: (i) a decrease with increasing discharge that reduces the relative importance of soil N cycling compared to hydrological transport, or (ii) a severe drought that decreases N cycling by drying out the catchment soils. The subsequent transport of increased nitrate leaching from the soil zone to the stream network is dependent on the sub-catchment-specific TTs and the denitrification potential in the groundwater. In catchments with short median TTs, the catchment-retention capacity can decrease within the observation period. Instead, long TTs can dampen such a short-term response but potentially form a hydrological N legacy that might become visible at the catchment outlet years to decades later.
Hotter multi-year droughts are likely to become more frequent and more prolonged with climate change (Hari et al., 2020; IPCC, 2018). Our study shows that such climatic extremes are a threat not only to water quantity but also to water quality in terms of nitrate pollution, as they can reduce the capacity of the catchment soils and entire catchments to retain N. Moreover, such droughts have the potential to override positive effects of measures to improve water quality (e.g., two-stage ditches; Bieroza et al., 2019). Consequently, droughts need to be considered as an additional risk to water quality that can intensify the existing anthropogenic pressures. To counteract the additional risk, one should consider intensified restrictions on manure and fertilizer applications. Furthermore, our study emphasizes the role of catchment heterogeneity and TTs for a catchment's vulnerability to drought impacts on nitrate export and the timing of such impacts. Whereas fast-reacting sub-catchments with short TTs can contribute to immediate drought responses, slowly-reacting sub-catchments (long TTs) might build up drought-induced N legacies that could impact future water quality on the long term, depending on the subsurface denitrification potential. We could show that a severe drought can potentially amplify such sub-catchment specific differences. The increased variability of nitrate export on both temporal and spatial scales calls for an increased spatiotemporal frequency of water quality monitoring and more site-specific management plans for site-specific problems. This also means that more studies on drought effects on water quality in different catchments and also for other pollutants are needed to assess the additional risk that is posed by longer and hotter droughts.
The source code and input data for mHM-SAS are available at https://doi.org/10.5281/zenodo.7228149 (Nguyen, 2022). The source code for mHM-nitrate (X. Yang et al., 2018), on which mHM-SAS is built up upon, is available at https://git.ufz.de/yangx/mHM-Nitrate (Yang, 2023). The raw discharge data can be downloaded from the State Office of Flood Protection and Water Quality of Saxony Anhalt (LH) at https://gld.lhw-sachsen-anhalt.de/ (LHW, 2021). The raw meteorological data can be downloaded from Germany's National Meteorological Service (DWD) at https://opendata.dwd.de/climate_environment/CDC/grids_germany/daily/ (DWD, 2021), and gridded products based on Zink et al. (2017). Raw nitrate-N concentration data are archived in the TERENO database, available upon request through the TERENO-Portal (https://ddp.tereno.net/ddp; TERENO, 2021).
The supplement related to this article is available online at: https://doi.org/10.5194/hess-27-303-2023-supplement.
Conceptualization and main investigation, writing of the first draft, and visualization of this study was conducted by CW under the supervision of AM, JHF, and SRL. The analysis was carried out by CW and TVN. Data were provided by MR and RK. Project administration and funding acquisition was done by JHF. All authors reviewed and edited the paper.
At least one of the (co-)authors is a member of the editorial board of Hydrology and Earth System Sciences. The peer-review process was guided by an independent editor, and the authors also have no other competing interests to declare.
Publisher's note: Copernicus Publications remains neutral with regard to jurisdictional claims in published maps and institutional affiliations.
A cordial thank goes to the State Office of Flood Protection and Water Quality of Saxony-Anhalt (LHW) and Germany's National Meteorological Service (Deutscher Wetterdienst, DWD) for providing the discharge data and the meteorological data sets. We thank Jens Lange and one anonymous reviewer for their constructive feedback, which helped improve the original paper.
This research has been supported by the Helmholtz-Zentrum für Umweltforschung (Topic 5, subtopic 5.2) and the Helmholtz International Research School TRACER (HIRS-0017).
The article processing charges for this open-access publication were covered by the Helmholtz Centre for Environmental Research – UFZ.
This paper was edited by Matthew Hipsey and reviewed by Jens Lange and one anonymous referee.
Andersen, C. B., Lewis, G. P., and Sargent, K. A.: Influence of wastewater-treatment effluent on concentrations and fluxes of solutes in the Bush River, South Carolina, during extreme drought conditions, Environ. Geosci., 11, 28–41, https://doi.org/10.1306/eg.10200303017, 2004.
Bieroza, M., Bergström, L., Ulén, B., Djodjic, F., Tonderski, K., Heeb, A., Svensson, J., and Malgeryd, J.: Hydrologic Extremes and Legacy Sources Can Override Efforts to Mitigate Nutrient and Sediment Losses at the Catchment Scale, J. Environ. Qual., 48, 1314–1324, https://doi.org/10.2134/jeq2019.02.0063, 2019.
Burt, T. P., Worrall, F., Howden, N. J. K., and Anderson, M. G.: Shifts in discharge-concentration relationships as a small catchment recover from severe drought, Hydrol. Process., 29, 498–507, https://doi.org/10.1002/hyp.10169, 2015.
Campbell, C. A. and Biederbeck, V. O.: Changes in mineral N and numbers of bacteria and actinomycetes during two years under wheat-fallow in Southwestern Saskatchewan, Can. J. Soil Sci., 62, 125–137, https://doi.org/10.4141/cjss82-014, 1982.
Casquin, A., Dupas, R., Gu, S., Couic, E., Gruau, G., and Durand, P.: The influence of landscape spatial configuration on nitrogen and phosphorus exports in agricultural catchments, Landsc. Ecol., 36, 3383–3399, https://doi.org/10.1007/s10980-021-01308-5, 2021.
Cramer, M. D., Hawkins, H.-J., and Verboom, G. A.: The importance of nutritional regulation of plant water flux, Oecologia, 161, 15–24, https://doi.org/10.1007/s00442-009-1364-3, 2009.
Davis, C. A., Ward, A. S., Burgin, A. J., Loecke, T. D., Riveros-Iregui, D. A., Schnoebelen, D. J., Just, C. L., Thomas, S. A., Weber, L. J., and St. Clair, M. A.: Antecedent Moisture Controls on Stream Nitrate Flux in an Agricultural Watershed, J. Environ. Qual., 43, 1494–1503, https://doi.org/10.2134/jeq2013.11.0438, 2014.
Delpla, I., Jung, A.-V., Baures, E., Clement, M., and Thomas, O.: Impacts of climate change on surface water quality in relation to drinking water production, Environ. Int., 35, 1225–1233, https://doi.org/10.1016/j.envint.2009.07.001, 2009.
Dupas, R., Abbott, B. W., Minaudo, C., and Fovet, O.: Distribution of landscape units within catchments influences nutrient export dynamics, Front. Environ. Sci., 7, 43, https://doi.org/10.3389/fenvs.2019.00043, 2019.
DWD – Deutscher Wetterdienst: Index of /climate_environment/CDC/grids_germany/daily/, DWD [data set], https://opendata.dwd.de/climate_environment/CDC/grids_germany/daily/, last access: 29 June 2021.
EEA – European Environment Agency: Corine Land COver, European Environment Agency, Copenhagen, https://land.copernicus.eu/pan-european/corine-land-cover (last access: 20 July 2022), 2018.
Ehrhardt, S., Kumar, R., Fleckenstein, J. H., Attinger, S., and Musolff, A.: Trajectories of nitrate input and output in three nested catchments along a land use gradient, Hydrol. Earth Syst. Sci., 23, 3503–3524, https://doi.org/10.5194/hess-23-3503-2019, 2019.
Ehrhardt, S., Ebeling, P., Dupas, R., Kumar, R., Fleckenstein, J. H., and Musolff, A.: Nitrate transport and retention in Western European catchments are shaped by hydroclimate and subsurface properties, Water Resour. Res., 57, e2020WR029469, https://doi.org/10.1029/2020WR029469, 2021.
Fu, Z., Ciais, P., Bastos, A., Stoy, P. C., Yang, H., Green, J. K., Wang, B., Yu, K., Huang, Y., Knohl, A., Šigut, L., Gharun, M., Cuntz, M., Arriga, N., Roland, M., Peichl, M., Migliavacca, M., Cremonese, E., Varlagin, A., Brümmer, C., De la Motte, L. G., Fares, S., Buchmann, N., El-Madany, T. S., Pitacco, A., Vendrame, N., Li, Z., Vincke, C., Magliulo, E., and Koebsch, F.: Sensitivity of gross primary productivity to climatic drivers during the summer drought of 2018 in Europe, Philos. T. Roy. Soc. B, 375, 20190747, https://doi.org/10.1098/rstb.2019.0747, 2020.
Górski, J., Dragon, K., and Kaczmarek, P. M. J.: Nitrate pollution in the Warta River (Poland) between 1958 and 2016: trends and causes, Environ. Sci. Poll. Res., 26, 2038–2046, https://doi.org/10.1007/s11356-017-9798-3, 2019.
Hannappel, S., Köpp, C., and Bach, T.: Charakterisierung des Nitratabbauvermögens der Grundwasserleiter in Sachsen-Anhalt, Grundwasser, 23, 311–321, 2018.
Hari, V., Rakovec, O., Markonis, Y., Hanel, M., and Kumar, R.: Increased future occurrences of the exceptional 2018–2019 Central European drought under global warming, Scient. Rep., 10, 1–10, https://doi.org/10.1038/s41598-020-68872-9, 2020.
Hashimoto, T., Stedinger, J. R., and Loucks, D. P.: Reliability, resiliency, and vulnerability criteria for water resource system performance evaluation, Water Resour. Res., 18, 14–20, https://doi.org/10.1029/WR018i001p00014, 1982.
Haynes, R. J.: Mineral Nitrogen In THe Plant-Soil System, Academic Press, Inc., ISBN 0-12-334910-9, 1986.
Hirsch, R. M., Moyer, D. L., and Archfield, S. A.: Weighted regressions on time, discharge, and season (WRTDS), with an application to Chesapeake Bay river inputs 1, J. Am. Water Resour. Assoc., 46, 857–880, https://doi.org/10.1111/j.1752-1688.2010.00482.x, 2010.
Huber, C.: Long lasting nitrate leaching after bark beetle attack in the highlands of the Bavarian Forest National Park, J. Environ. Qual., 34, 1772–1779, https://doi.org/10.2134/jeq2004.0210, 2005.
IPCC: Global warming of 1.5 ∘C: an IPCC special report on the impacts of global warming of 1.5 ∘C above pre-industrial levels and related global greenhouse gas emission pathways, in the context of strengthening the global response to the threat of climate change, sustainable development, and efforts to eradicate poverty, edited by: Masson-Delmotte, V., Zhai, P., Pörtner, H.-O., Roberts, D., Skea, J., Shukla, P. R., Pirani, A., Moufouma-Okia, W., Péan, C., Pidcock, R., Connors, S., Matthews, J. B. R., Chen, Y., Zhou, X., Gomis, M. I., Lonnoy, E., Maycock, T., Tignor, M., and Waterfield, T., Intergovernmental Panel on Climate Change, https://www.ipcc.ch/sr15/download/ (last access: 8 June 2021), 2018.
Jarvie, H. P., Neal, C., Withers, P. J., Robinson, A., and Salter, N.: Nutrient water quality of the Wye catchment, UK: exploring patterns and fluxes using the Environment Agency data archives, Hydrol. Earth Syst. Sci., 7, 722–743, https://doi.org/10.5194/hess-7-722-2003, 2003.
Jawitz, J. W., Desormeaux, A. M., Annable, M. D., Borchardt, D., and Dobberfuhl, D.: Disaggregating landscape-scale nitrogen attenuation along hydrological flow paths, J. Geophys. Res.-Biogeo., 125, e2019JG005229, https://doi.org/10.1029/2019JG005229, 2020.
Jeppesen, E., Moss, B., Bennion, H., Carvalho, L., DeMeester, L., Feuchtmayr, H., Friberg, N., Gessner, M. O., Hefting, M., Lauridsen, T. L., Liboriussen, L., Malmquist, H. J., May, L., Meerhoff, M., Olafsson, J. S., Soons, M. B., and Verhoeven, J. T. A.: Interaction of Climate Change and Eutrophication, in: Climate Change Impacts on Freshwater Ecosystems, edited by: Kernan, M., Battarbee, R. W., and Moss, B., Wiley-Blackwell, Oxford, UK, 119–151, https://doi.org/10.1002/9781444327397.ch6, 2010.
Jiang, S., Jomaa, S., and Rode, M.: Modelling inorganic nitrogen leaching in nested mesoscale catchments in central Germany, Ecohydrology, 7, 1345–1362, https://doi.org/10.1002/eco.1462, 2014.
Jomaa, S., Aboud, I., Dupas, R., Yang, X., Rozemeijer, J., and Rode, M.: Improving nitrate load estimates in an agricultural catchment using Event Response Reconstruction, Environ. Monit. Assess., 190, 1–14, 2018.
Jutglar, K., Hellwig, J., Stoelzle, M., and Lange, J.: Post-drought increase in regional-scale groundwater nitrate in southwest Germany, Hydrol. Process., 35, e14307, https://doi.org/10.1002/hyp.14307, 2021.
Kong, X., Ghaffar, S., Determann, M., Friese, K., Jomaa, S., Mi, C., Shatwell, T., Rinke, K., and Rode, M.: Reservoir water quality deterioration due to deforestation emphasizes the indirect effects of global change, Water Res., 221, 118721, https://doi.org/10.1016/j.watres.2022.118721, 2022.
Lange, J., and Haensler, A.: Runoff generation following a prolonged dry period, J. Hydrol., 464–465, 157–164, https://doi.org/10.1016/j.jhydrol.2012.07.010, 2012.
LHW: https://gld.lhw-sachsen-anhalt.de/, last access: 24 February 2021.
Lindström, G., Pers, C., Rosberg, J., Strömqvist, J., and Arheimer, B.: Development and testing of the HYPE (Hydrological Predictions for the Environment) water quality model for different spatial scales, Hydrol. Res., 41, 295–319, https://doi.org/10.2166/nh.2010.007, 2010.
Loecke, T. D., Burgin, A. J., Riveros-Iregui, D. A., Ward, A. S., Thomas, S. A., Davis, C. A., and St. Clair, M. A.: Weather whiplash in agricultural regions drives deterioration of water quality, Biogeochemistry, 133, 7–15, https://doi.org/10.1007/s10533-017-0315-z, 2017.
Mikkelson, K. M., Bearup, L. A., Maxwell, R. M., Stednick, J. D., McCray, J. E., and Sharp, J. O.: Bark beetle infestation impacts on nutrient cycling, water quality and interdependent hydrological effects, Biogeochemistry, 115, 1–21, https://doi.org/10.1007/s10533-013-9875-8, 2013.
Minaudo, C., Dupas, R., Gascuel-Odoux, C., Roubeix, V., Danis, P.-A., and Moatar, F.: Seasonal and event-based concentration-discharge relationships to identify catchment controls on nutrient export regimes, Adv. Water Resour., 131, 103379, https://doi.org/10.1016/j.advwatres.2019.103379, 2019.
Morecroft, M. D., Burt, T. P., Taylor, M. E., and Rowland, A. P.: Effects of the 1995–1997 drought on nitrate leaching in lowland England, Soil Use Manage., 16, 117–123, https://doi.org/10.1111/j.1475-2743.2000.tb00186.x, 2000.
Mosley, L. M.: Drought impacts on the water quality of freshwater systems; review and integration, Earth-Sci. Rev., 140, 203–214, https://doi.org/10.1016/j.earscirev.2014.11.010, 2015.
Musolff, A., Zhan, Q., Dupas, R., Minaudo, C., Fleckenstein, J. H., Rode, M., Dehaspe, J., and Rinke, K.: Spatial and Temporal Variability in Concentration-Discharge Relationships at the Event Scale, Water Resour. Res., 57, e2020WR029442, https://doi.org/10.1029/2020WR029442, 2021.
Musolff, A., Schmidt, C., Selle, B., and Fleckenstein, J. H.: Catchment controls on solute export, Adv. Water Resour., 86, 133–146, https://doi.org/10.1016/j.advwatres.2015.09.026, 2015.
Nguyen, T. V.: mHM-SAS model (V2.0.0), Zenodo [code], https://doi.org/10.5281/zenodo.7228149, 2022.
Nguyen, T. V., Kumar, R., Lutz, S. R., Musolff, A., Yang, J., and Fleckenstein, J. H.: Modeling Nitrate Export From a Mesoscale Catchment Using StorAge Selection Functions, Water Resour. Res., 57, e2020WR028490, https://doi.org/10.1029/2020WR028490, 2021.
Nguyen, T. V., Kumar, R., Musolff, A., Lutz, S. R., Sarrazin, F., Attinger, S., and Fleckenstein, J. H.: Disparate Seasonal Nitrate Export From Nested Heterogeneous Subcatchments Revealed With StorAge Selection Functions, Water Resour. Res., 58, e2021WR030797, https://doi.org/10.1029/2021WR030797, 2022.
Nogueira, G. E. H., Schmidt, C., Brunner, P., Graeber, D., and Fleckenstein, J. H.: Transit-Time and Temperature Control the Spatial Patterns of Aerobic Respiration and Denitrification in the Riparian Zone, Water Resour. Res., 57, e2021WR030117, https://doi.org/10.1029/2021WR030117, 2021.
Oelsner, G. P., Brooks, P. D., and Hogan, J. F.: Nitrogen Sources and Sinks Within the Middle Rio Grande, New Mexico, J. Am. Water Resour. Assoc., 43, 850–863, https://doi.org/10.1111/j.1752-1688.2007.00071.x, 2007.
Outram, F. N., Lloyd, C. E. M., Jonczyk, J., Benskin, C. McW. H., Grant, F., Perks, M. T., Deasy, C., Burke, S. P., Collins, A. L., Freer, J., Haygarth, P. M., Hiscock, K. M., Johnes, P. J., and Lovett, A. L.: High-frequency monitoring of nitrogen and phosphorus response in three rural catchments to the end of the 2011–2012 drought in England, Hydrol. Earth Syst. Sci., 18, 3429–3448, https://doi.org/10.5194/hess-18-3429-2014, 2014.
Rakovec, O., Samaniego, L., Hari, V., Markonis, Y., Moravec, V., Thober, S., Hanel, M., and Kumar, R.: The 2018–2020 Multi-Year Drought Sets a New Benchmark in Europe, Earth's Future, 10, e2021EF002394, https://doi.org/10.1029/2021EF002394, 2022.
Riediger, J., Breckling, B., Nuske, R. S., and Schröder, W.: Will climate change increase irrigation requirements in agriculture of Central Europe? A simulation study for Northern Germany, Environ. Sci. Eur., 26, 18, https://doi.org/10.1186/s12302-014-0018-1, 2014.
Rivett, M. O., Buss, S. R., Morgan, P., Smith, J. W., and Bemment, C. D.: Nitrate attenuation in groundwater: a review of biogeochemical controlling processes, Water Res., 42, 4215–4232, 2008.
RIVM – National Institue for Public Health and the Environment: Agricultural practices and water quality in the Netherlands; status (2016–2019) and trend (1992–2019), https://www.rivm.nl/bibliotheek/rapporten/2020-0184.pdf, last access: 15 Septemper 2021.
Rode, M., Halbedel née Angelstein, S., Anis, M. R., Borchardt, D., and Weitere, M.: Continuous in-stream assimilatory nitrate uptake from high-frequency sensor measurements, Environ. Sci. Techno., 50, 5685–5694, https://doi.org/10.1021/acs.est.6b00943, 2016.
Samaniego, L., Thober, S., Kumar, R., Wanders, N., Rakovec, O., Pan, M., Zink, M., Sheffield, J., Wood, E. F., and Marx, A.: Anthropogenic warming exacerbates European soil moisture droughts, Nat. Clim. Change, 8, 421–426, https://doi.org/10.1038/s41558-018-0138-5, 2018.
Sapkota, A., Haghverdi, A., Avila, C. C. E., and Ying, S. C.: Irrigation and Greenhouse Gas Emissions: A Review of Field-Based Studies, Soil Syst., 4, 20, https://doi.org/10.3390/soilsystems4020020, 2020.
Schaefli, B. and Gupta, H. V.: Do Nash values have value?, Hydrol. Process., 21, 2075–2080, https://doi.org/10.1002/hyp.6825, 2007.
Schnabel, F., Purrucker, S., Schmitt, L., Engelmann, R. A., Kahl, A., Richter, R., Seele-Dilbat, C., Skiadaresis, G., and Wirth, C.: Cumulative growth and stress responses to the 2018–2019 drought in a European floodplain forest, Global Change Biol., 28, 1870–1883, https://doi.org/10.1111/gcb.16028, 2022.
Schuldt, B., Buras, A., Arend, M., Vitasse, Y., Beierkuhnlein, C., Damm, A., Gharun, M., Grams, T. E. E., Hauck, M., Hajek, P., Hartmann, H., Hiltbrunner, E., Hoch, G., Holloway-Phillips, M., Körner, C., Larysch, E., Lübbe, T., Nelson, D. B., Ramming, A., Rigling, A., Rose, L., Ruehr, N. K., Schumann, K., Weiser, F., Werner, C., Wohlgemuth, T., Zang, C. S., and Kahmen, A.: A first assessment of the impact of the extreme 2018 summer drought on Central European forests, Basic Appl. Ecol., 45, 86–103, https://doi.org/10.1016/j.baae.2020.04.003, 2020.
Seeger, S. and Weiler, M.: Reevaluation of transit time distributions, mean transit times and their relation to catchment topography, Hydrol. Earth Syst. Sci., 18, 4751–4771, https://doi.org/10.5194/hess-18-4751-2014, 2014.
Sinha, S., Rode, M., and Borchardt, D.: Examining runoff generation processes in the Selke catchment in central Germany: Insights from data and semi-distributed numerical model, J. Hydrol.: Reg. Stud., 7, 38–54, https://doi.org/10.1016/j.ejrh.2016.06.002, 2016.
Sprague, L. A.: Drought Effects on Water Quality in the South Platte River Basin, Colorado1, J. Ame. Water Resour. Assoc., 41, 11–24, https://doi.org/10.1111/j.1752-1688.2005.tb03713.x, 2005.
Stahl, K., Hisdal, H., Hannaford, J., Tallaksen, L. M., van Lanen, H. A. J., Sauquet, E., Demuth, S., Fendekova, M., and Jódar, J.: Streamflow trends in Europe: evidence from a dataset of near-natural catchments, Hydrol. Earth Syst. Sci., 14, 2367–2382, https://doi.org/10.5194/hess-14-2367-2010, 2010.
TERENO – Terrestrial Environmental Observatories: Data Discovery Portal, https://ddp.tereno.net/ddp, last access: 24 February 2021.
Tetzlaff, D., Seibert, J., McGuire, K. J., Laudon, H., Burns, D. A., Dunn, S. M., and Soulsby, C.: How does landscape structure influence catchment transit time across different geomorphic provinces?, Hydrol. Process., 23, 945–953, https://doi.org/10.1002/hyp.7240, 2009.
Thompson, S. E., Basu, N. B., Lascurain, J., Aubeneau, A., and Rao, P. S. C.: Relative dominance of hydrologic versus biogeochemical factors on solute export across impact gradients, Water Resour. Res., 47, W00J05, https://doi.org/10.1029/2010WR009605, 2011.
Van Der Velde, Y., Torfs, P., Van Der Zee, S., and Uijlenhoet, R.: Quantifying catchment-scale mixing and its effect on time-varying travel time distributions, Water Resour. Res., 48, W06536, https://doi.org/10.1029/2011WR011310, 2012.
Van Meter, K. J. and Basu, N. B.: Catchment legacies and time lags: A parsimonious watershed model to predict the effects of legacy storage on nitrogen export, PLoS One, 10, e0125971, https://doi.org/10.1371/journal.pone.0125971, 2015.
Van Meter, K. J., Basu, N. B., Veenstra, J. J., and Burras, C. L.: The nitrogen legacy: emerging evidence of nitrogen accumulation in anthropogenic landscapes, Environ. Res. Lett., 11, 035014, https://doi.org/10.1088/1748-9326/11/3/035014, 2016.
Van Vliet, M. T. H. and Zwolsman, J. J. G.: Impact of summer droughts on the water quality of the Meuse river, J. Hydrol., 353, 1–17, https://doi.org/10.1016/j.jhydrol.2008.01.001, 2008.
Whitehead, P. G., Wilby, R. L., Battarbee, R. W., Kernan, M., and Wade, A. J.: A review of the potential impacts of climate change on surface water quality, Hydrolog. Sci. J., 54, 101–123, https://doi.org/10.1623/hysj.54.1.101, 2009.
Winter, C., Lutz, S. R., Musolff, A., Kumar, R., Weber, M., and Fleckenstein, J. H.: Disentangling the impact of catchment heterogeneity on nitrate export dynamics from event to long-term time scales, Water Resour. Res., 57, e2020WR027992, https://doi.org/10.1029/2020WR027992, 2021.
Winter, C., Tarasova, L., Lutz, S. R., Musolff, A., Kumar, R., and Fleckenstein, J. H.: Explaining the Variability in High-Frequency Nitrate Export Patterns Using Long-Term Hydrological Event Classification, Water Resour. Res., 58, e2021WR030938, https://doi.org/10.1029/2021WR030938, 2022.
Wollschläger, U., Attinger, S., Borchardt, D., Brauns, M., Cuntz, M., Dietrich, P., Fleckenstein, J. H., Friese, K., Friesen, J., Harpke, A., Hildebrandt, A., Jäckel, G., Kamjunke, N., Knöller, K., Kögler, S., Kolditz, O., Krieg, R., Kumar, R., Lausch, A., Liess, M., Marx, A., Merz, R., Mueller, C., Musolff, A., Norf, H., Oswald, S. E., Rebmann, C., Reinstorf, F., Rode, M., Rink, K., Rinke, K., Samaniego, L., Vieweg, M., Vogel, H.-J., Weitere, M., Werban, U., Zink, M., and Zacharias, S.: The Bode hydrological observatory: a platform for integrated, interdisciplinary hydro-ecological research within the TERENO Harz/Central German Lowland Observatory, Environ. Earth Sci., 76, 29, https://doi.org/10.1007/s12665-016-6327-5, 2017.
Yang, J., Heidbüchel, I., Musolff, A., Reinstorf, F., and Fleckenstein, J. H.:. Exploring the dynamics of transit times and subsurface mixing in a small agricultural catchment, Water Resour. Res., 54, 2317–2335, https://doi.org/10.1002/2017WR021896, 2018.
Yang, X.: mHM-Nitrate, GitLab [code], https://git.ufz.de/yangx/mHM-Nitrate, last access: 12 January 2023.
Yang, X., Jomaa, S., Zink, M., Fleckenstein, J. H., Borchardt, D., and Rode, M.: A New Fully Distributed Model of Nitrate Transport and Removal at Catchment Scale, Water Resour. Res., 54, 5856–5877, https://doi.org/10.1029/2017WR022380, 2018.
Zink, M., Kumar, R., Cuntz, M., and Samaniego, L.: A high-resolution dataset of water fluxes and states for Germany accounting for parametric uncertainty, Hydrol. Earth Syst. Sci., 21, 1769–1790, https://doi.org/10.5194/hess-21-1769-2017, 2017.