the Creative Commons Attribution 4.0 License.
the Creative Commons Attribution 4.0 License.
 | 02 Aug 2023
Throughfall spatial patterns translate into spatial patterns of soil moisture dynamics – empirical evidence
Christine Fischer-Bedtke
Johanna Clara Metzger
Gökben Demir
Thomas Wutzler
Throughfall heterogeneity induced by the redistribution of precipitation in vegetation canopies has repeatedly been hypothesized to affect the variation in the soil water content and runoff behavior, especially in forests. However, observational studies relating the spatial variation in the soil water content directly to net precipitation are rare, and few confirm modeling hypotheses. Here, we investigate whether throughfall patterns affect the spatial heterogeneity in the soil water response in the main rooting zone. We assessed rainfall, throughfall and soil water content (at two depths, 7.5 and 27.5 cm) on a 1 ha temperate mixed-beech forest plot in Germany during the 2015 and 2016 growing seasons using independent, high-resolution, stratified, random designs. Because the throughfall and soil water content cannot be measured at the same location, we used kriging to derive the throughfall values at the locations where the soil water content was measured. We first explored the spatial variation and temporal stability of throughfall and soil water patterns and subsequently evaluated the effects of input (throughfall), soil properties (field capacity and macroporosity), and vegetation parameters (canopy cover and distance to the next tree) on the soil water content and dynamics.
Throughfall spatial patterns were related to canopy density. Although spatial autocorrelation decreased with increasing event sizes, temporally stable throughfall patterns emerged, leading to reoccurring higher- and lower-input locations across precipitation events. Linear mixed-effects model analysis showed that soil water content patterns were poorly related to spatial patterns of throughfall and that they were more influenced by unidentified, but time constant, factors.
Instead of the soil water content itself, the patterns of its increase after rainfall corresponded more closely to throughfall patterns: more water was stored in the soil in areas where throughfall was elevated. Furthermore, soil moisture patterns themselves affected the local soil water response, probably by mediating fast drainage and runoff. Locations with a low topsoil water content tended to store less of the input water, indicating preferential flow. In contrast, locations with a high water content stored less water in the subsoil. Moreover, the distance to the next tree and macroporosity modified how much water was retained in soil storage. Overall, throughfall patterns imprinted less on the soil water content and more on the soil water dynamics shortly after rainfall events; therefore, percolation rather than the soil water content may depend on the small-scale spatial heterogeneity in canopy input patterns.
- Article
(2961 KB) - Full-text XML
-
Supplement
(1412 KB) - BibTeX
- EndNote


Over the past decades, in order to understand and predict hydrological processes related to vegetation structure and land use change, there has been an increased interest in how water input at the soil surface is affected by vegetation canopies (Western et al., 2004; Savenije, 2004; Murray, 2014; Guswa et al., 2020; Oda et al., 2021). Due to interception losses, less water arrives below the canopy compared with above (Horton, 1919, and references therein; Carlyle-Moses and Gash, 2011), which has implications for the soil water balance (Durocher, 1990; Bouten et al., 1992; Schume et al., 2003; Klos et al., 2014; Metzger et al., 2017) and the overall water budget at the catchment scale (Brown et al., 2005; Oda et al., 2021).
Besides interception loss, the interaction of precipitation with the vegetation canopy causes the spatial redistribution of incoming water. This leads to characteristic spatial heterogeneity in the dripping (throughfall) and flowing (stemflow) below-canopy precipitation, causing enhanced water input to the soil surface at the local scale. For example, dripping point hot spots (enhanced water flow from peculiarities in the canopy; Falkengren-Grerup, 1989; Keim et al., 2005; Staelens et al., 2006; Voss et al., 2016) and stemflow hot spots (Levia and Germer, 2015; Carlyle-Moses et al., 2018) have been well documented. The available research suggests that both throughfall patterns and stemflow spatial distributions are reoccurring (Keim et al., 2005; Staelens et al., 2006; Zimmermann et al., 2008; Wullaert et al., 2009; Guswa and Spence, 2012; Metzger et al., 2017; Van Stan et al., 2020).
The observed persistence of spatial patterns of below-canopy precipitation has created a strong expectation that the aforementioned patterns affect soil water content patterns (Schume et al., 2003; Wullaert et al., 2009; Rosenbaum et al., 2012; Zehe et al., 2010) and hot spots of percolation or preferential flow (Bouten et al., 1992; Schume et al., 2003; Blume et al., 2009; Bachmair et al., 2012) in forests soils. However, this has only been partly confirmed with observations: for stemflow-affected locations, soil moisture microsites have repeatedly been demonstrated (Pressland, 1976; Durocher, 1990; Liang et al., 2007; Germer, 2013; Metzger et al., 2021). Stemflow can create a substantial funneling of water to the forest floor, and water availability on the forest floor can be locally enhanced by a factor of 10–100 (Levia and Germer, 2015; Carlyle-Moses et al., 2018; Metzger et al., 2021).
Much less research is available regarding how the less pronounced but still spatially persistent pattern of throughfall shapes soil water dynamics. Modeling has suggested that throughfall patterns influence the root zone soil moisture pattern (Coenders-Gerrits et al., 2013; Guswa, 2012). However, soil moisture patterns are also influenced by several other factors that create substantial heterogeneity, such as the heterogeneity in soil properties, local micro-topography, litter thickness or root water uptake (Bouten et al., 1992; Schume et al., 2003; Schwärzel et al., 2009; Gerrits and Savenije, 2011; Rosenbaum et al., 2012; Liang et al., 2017; Molina et al., 2019), and these factors are typically not fully captured in virtual experiments. In comparison to modeling work, observational studies have found that throughfall and root zone soil moisture are not related (Shachnovich et al., 2008; Rodrigues et al., 2022), only occasionally related (Metzger et al., 2017) or weakly related (Molina et al., 2019). In contrast, Klos et al. (2014) found a relation below the rooting zone by strategically sampling at high and low throughfall positions, and several authors (Zehe et al., 2010; Rosenbaum et al., 2012; Metzger et al., 2017) have found indirect evidence by interpreting the change in the spatial variation in the soil water content after precipitation events.
In light of the substantial heterogeneity in other influencing factors, one of the reasons for the limited direct observational evidence of the effect of throughfall on the soil water content may be the limited number of studies investigating the relation between below-canopy precipitation and soil water patterns in a dedicated and coordinated fashion. The characterization of spatial patterns, such as those of throughfall, requires a large number of throughfall samplers (Kimmins, 1973; Lloyd and Marques, 1988; Zimmermann et al., 2010; Van Stan et al., 2020), and the same is true for belowground observations. Furthermore, a fundamental challenge is that the soil water input and soil water content cannot be assessed at the same location, as throughfall measurements disturb infiltration into the soil.
Therefore, the objective of this study is to compare the patterns of soil water content, soil properties and throughfall using a dedicated high-spatial-resolution sampling design to reveal whether the input, distance to the next tree or soil properties affect the spatial variation in the soil water content and soil water response. We used independent designs for above- and belowground observations and applied kriging to derive the throughfall values at the locations where the soil water content was measured. The aims of the study were to (a) explore the spatial heterogeneity and temporal stability in throughfall and the soil water content and (b) evaluate the influence of soil properties (field capacity and macroporosity), vegetation parameters (canopy cover and distance to the next tree) and input variation (throughfall) on the variation in the soil water content and soil water content increase after precipitation.
2.1 Study area
The study was carried out in the Hainich Critical Zone Exploratory (CZE Hainich; see Küsel et al., 2016), run by the Collaborative Research Centre “AquaDiva”. The site is located in an unmanaged beech-dominated forest in the Hainich National Park, central Germany. The mean annual temperature is around 7.5–9.5 ∘C, depending on the position on the small mountain range. The total annual precipitation drops from 900 to less than 600 mm from ridge to valley (Küsel et al., 2016). The monitoring site as well as measurements of precipitation and soil moisture have been described in Metzger et al. (2017), and the important information is repeated here for completeness. The site covers an area of 1 ha and is situated at 365 m above sea level. The study area contains of 581 individual trees (diameter at breast height of ≥5 cm), representing a heterogeneous age structure. The soils in this area are dominantly Luvisols (Schrumpf et al., 2014; Kohlhepp et al., 2017). The species assemblage consists of 70 % European beech trees (Fagus sylvatica) and smaller proportions of sycamore maple (Acer pseudoplatanus), European ash (Fraxinus excelsior), European hornbeam (Carpinus betulus), large-leaved linden (Tilia platyphyllos), Norway maple (Acer platanoides) and Scots elm (Ulmus glabra). The weathered bedrock is at a depth of 15–87 cm (median depth 37 cm).
2.2 Precipitation measurements and processing
The precipitation sampling followed the procedure given in Metzger et al. (2017). Gross precipitation (Pg) and throughfall (PTF) were measured manually on a per-event basis in spring 2014, 2015 and 2016. The analysis of the effects of throughfall on the soil water content covers the period when soil moisture sensors were also active, i.e., from 18 June to 28 July 2015 and from 31 May to 14 July 2016. The installed throughfall collectors consisted of circular funnels (A=0.011 m2), the opening of which was placed about 37 cm above the ground surface. A table tennis ball was placed in the opening of the funnel to minimize evaporation.
Throughfall collectors were arranged in a stratified sampling design (Zimmermann et al., 2016). For this, the 1 ha plot was divided into 100 subplots (Fig. 1), each 10 m×10 m, and equipped with two randomly located throughfall samplers. Of those samplers, we selected 50 randomly and added another sampler in their immediate vicinity (0.1 m distance), thereby creating a “short transect”. Furthermore, we added four more samplers to 25 randomly selected short transects at 0.5, 1, 2 and 3 m from the first sampler of the short transect, thereby forming “long transects”. The direction of all transects was also randomly chosen. In total, we sampled n=350 throughfall positions. Sampling started 2 h after the end of rainfall and was carried out by collecting the volume of all sampling containers using graduated cylinders. Gross precipitation was measured at an adjacent (distance 250 m) open grassland using five funnels of the same type as the throughfall collectors.

Figure 1Experimental setup showing the 1 ha forest plot subdivided into a 10 m×10 m grid, yielding 100 subplots, and the positions of the throughfall samplers (pink crosses) and 49 soil water content subplots (blue) measured in a stratified random design with transects (see Sect. 2 for more details). The figure was sourced from Metzger et al. (2017).
In this research, we are specifically interested in re-occurring spatial patterns of throughfall and whether they translate to soil water dynamics. To characterize the spatial pattern, we decompose the measured throughfall into the spatial median () of event j and deviations from the median at the specific location i (δPTF,ij). δPTF,ij is calculated as follows:
where δPTF,ij represents the relative deviations of the spatially distributed throughfall (PTF,ij) at location i and event j from the spatial median of that event j. Equation (1) is a slight modification of the widely used concept of temporal stability introduced by Vachaud et al. (1985). As throughfall can contain outliers, we used the median () instead of the arithmetic mean for normalization, as already done by Zimmermann et al. (2008) and Wullaert et al. (2009a). Negative or positive values of δPTF,ij indicate locations with below- or above-average throughfall, respectively, while repeatedly low or high δPTF,ij values indicate persistent cold or hot spots of canopy throughfall across events, respectively. Equation (1) allows one to disentangle the temporal variation, e.g., the event size given by the event spatial median , from the spatial dispersion, characterized by δPTF,ij. Both are independent of each other and both are used in parallel as predictors of the soil water content and soil water content increase below. In the following, we omit the indices i and j for simplicity and refer to δPTF as the spatial pattern of throughfall for an event or event class.
To investigate the temporal persistence of the spatial pattern of throughfall, we derived temporal stability plots (Zimmermann et al., 2008; Wullaert et al., 2009) by looking at δPTF,ij across events at the specific location i. Additionally, we calculated the Spearman rank correlation coefficients between observations of different events, where high correlations indicate strong persistence (or temporal stability) of the throughfall pattern. We paired all events falling into a given rain event class according to Metzger et al. (2017): small (Pg≤3 mm), medium ( mm) and large (Pg>10 mm).
To relate the general precipitation and soil moisture conditions during the observation period to the average climate, we compared them with precipitation data from a nearby weather station (Mühlhausen-Windeberg, 20 km to the northeast) of the German Weather Service (DWD Climate Data Center, https://www.dwd.de/cdc, last access: 1 October 2019, ID 5593).
2.3 Soil water content measurements
The soil water measurements were first described in Metzger et al. (2017). The volumetric soil water content was monitored using a wireless sensor network (SoilNet; Bogena et al., 2010) equipped with SMT100 frequency domain sensors (TRUEBNER GmbH, Neustadt, Germany). Overall, 210 soil water content measurement points were distributed in a stratified random design in the blue subplots shown in Fig. 1: within each blue subplot, two sampling points were placed randomly. Additionally, transects with three additional measurement points (at 0.1, 2.0 and 6.0 m from the position) were added to a subset of 24 randomly selected points. Furthermore, 40 locations were added as transects near tree stems. At each soil moisture measurement location, sensors were installed at two depth: in the topsoil at 7.5 cm and in the subsoil at 27.5 cm. For this analysis, we used the data collected during the throughfall measurement campaigns from 18 June to 28 July 2015 and from 31 May to 14 July 2016.
At each location, we used soil moisture measurements for the hour preceding the observed rain event (θpre,ij) to characterize the soil initial moisture in the drained state and the maximum soil water content just after the rain event (θpost,ij) to characterize the post-event state. We also assessed the soil water content increase due to rainfall by calculating the change in the soil water content (Δθij) for each event j and each location i as follows:
Positive values of Δθij indicate a soil water content increase. In the following, we refer generally to Δθ (with indices omitted for simplicity) as “soil water content increase” or “soil moisture response” due to rainfall.
Equivalently to throughfall, we decomposed the soil water content into the event spatial median (, ) and relative deviations from that median (δθpre,ij, δθpost,ij) with indices for event j and location i omitted for simplicity in the following. As for throughfall, using the relative deviations of the soil water content alongside the medians in the statistical models (see below) provides us with two independent measures for one variable: one relating to the spatial pattern (δθpre,ij, δθpost,ij) and the other to the temporal variation (, ).
2.4 Canopy and soil property measurements
At the time of soil sensor installation, undisturbed soil samples were collected using metal-ring cylinders with a volume of 100 cm3. The distance between the sensor position and the soil sample collection was approximately 0.5 m. Soil properties were treated as if they were measured directly at the soil sensor location i. In order to determine the field capacity (θFC,i), the samples were saturated, left to drain in a sandbox with a hanging water column imposing a pressure of −60 hPa for 72 h and then weighed. The soil cores were subsequently dried for 24 h at 105 ∘C and weighed again to obtain the dry weight (mdry,i). The volumetric soil water content at field capacity (θFC,i) was derived from the weight difference of the sample at −60 hPa and mdry,i, assuming a density of water of . Bulk density (Dbd,i) was calculated from the soil dry weight and volume. Soil apparent porosity (φi) was calculated from the bulk density and assuming a constant density of the soil mineral component () as follows:
Macroporosity (θMP,i, also called the air capacity or air-filled porosity) was then determined as follows:
To characterize the canopy density, we counted the number of branches (canopy cover) above the throughfall samplers in 2014. However, these data were not available for soil water measurement locations.
2.5 Statistical analysis
All statistical analyses were processed with R (version 3.2.3; R Core Team, 2016). For the geostatistical analysis (detailed below), we used the geoR (Ribeiro and Diggle, 2001), georob (Papritz and Schwierz, 2020) and gstat (Pebesma, 2004; Gräler et al., 2016) packages. Linear mixed-effects models were implemented using the lme4 (Bates et al., 2015) and lmerTest (Kuznetsova et al., 2017) packages. The variance explained by fixed and random factors (conditional R2) and by only fixed effects (marginal R2; Nakagawa and Schielzeth, 2013) for the final model were calculated with the MuMIn package (Bartón, 2020).
2.5.1 Geostatistical estimation of throughfall
Throughfall was estimated at the soil water content measurement locations using kriging. The overall procedure for obtaining the variograms closely follows Zimmermann et al. (2016) with some adaptations taken from Voss et al. (2016). Important steps and decisions of the exploratory data and geostatistical analysis are as follows (see also visualization in Fig. S1 in the Supplement):
-
Exploratory analysis. First, we determined the skewness using the octile skew. None of the throughfall events had an octile skew larger than 0.2 or smaller than −0.2; therefore, we did not transform the data. If a spatial trend existed (p≤0.150), we used the residuals of the spatial regression model for the coordinates x and/or y instead of the real data in the following.
-
Variogram estimation using the method of moments (MoM). This step was performed to derive the best possible preliminary variogram with outliers present, which will be used for spatial outlier detection in Step 3. For this, we first calculated four empirical throughfall variograms using four different variogram estimators. We used both non-robust (Matheron, 1962) and robust (Cressie and Hawkins, 1980; Dowd, 1984; Genton, 1998) estimators as well as the sample.variogram function in the georob package in R. We chose lags centered at 0.125, 0.375 and 0.75, followed by a step size of 1 m up to 50 m. Next, we fitted three models (spherical, exponential and pure nugget) to each empirical variogram using the fit.variogram.model function in the georob package and chose the model with the lowest residual sum of squares for each variogram. This yielded four models, one for each of the variogram estimators stated above. We then assessed the fitted models with leave-one-out cross-validation using kriging. Based on this, we calculated the normalized kriging error (Θi,) and selected the empirical variogram with the median Θ nearest to the expected value of 0.455 for Step 3 (Lark, 2000), as done in Zimmermann et al. (2009)
-
Identification and spatial outlier removal. Before final variogram estimation using residual maximum likelihood (REML) in Step 4, spatial outliers were removed based on kriging and cross-validation using the provisional variogram obtained in Step 2. To identify a spatial outlier at location i, we used the standardized error of cross-validation, εs,i (Bárdossy and Kundzewicz, 1990; Lark, 2002). To classify an outlier, we used the Z statistics. Sampled points with () were removed (Zimmermann et al., 2016).
-
Variogram estimation by REML. After outlier removal, we applied REML to fit the theoretical variogram model, including the spatial trend if necessary, using the likfit function in the geoR package. We used the initial estimates from the provisional variogram (Step 2) for the sill, nugget and range parameters. The range relates to the distance over which the observations are still spatially correlated. In the following, we will use the term correlation length to refer to the effective range, e.g., the distance at which the variogram function approaches the sill asymptotically to 95 %. A high effective range indicates a high spatial correlation between two throughfall collectors. We checked the reliability of the final model with the Θ statistic (see above).
-
Kriging. Using the final theoretical variogram from Step 4, we applied ordinary kriging to predict throughfall values at the soil water content measurement locations. Locations where the kriging variance exceeded 95 % of the spatial variance were removed from further analysis.
2.5.2 The coefficient of quartile variation (CQV)
For event-scale assessments, we used quantile-based statistical metrics for descriptive statistics and correlation in order to avoid bias related to the event size or general soil moisture state. Both throughfall and soil moisture patterns can be skewed slightly (Famiglietti et al., 1998; Zimmermann and Zimmermann, 2014), even if the octile skew is less than 0.2, depending on the soil moisture state or event size. Moreover, as mentioned above, throughfall typically includes outliers due to dripping points (Falkengren-Grerup, 1989; Keim et al., 2005; Staelens et al., 2006; Voss et al., 2016). For the coefficient of variation, we used the CQV (Bonett, 2006) as an alternative:
where Q1 and Q3 represent the respective first and third quartiles. Like the classical coefficient of variation, the CQV is dimensionless statistical measure that describes the relative degree of scattering of the sample.
2.5.3 Linear mixed-effects models calculation
We applied linear mixed-effects (LME) models with a repeat-measurement structure to evaluate the influence of potential drivers explaining the soil water content or soil water content increase. We present results on the following dependent variables (see Table 1 for an overview): the spatial pattern of pre-event (δθpre) and post-event (δθpost) soil water content and soil water content increase ().
Table 1Overview of variables and symbols used in the statistical models.
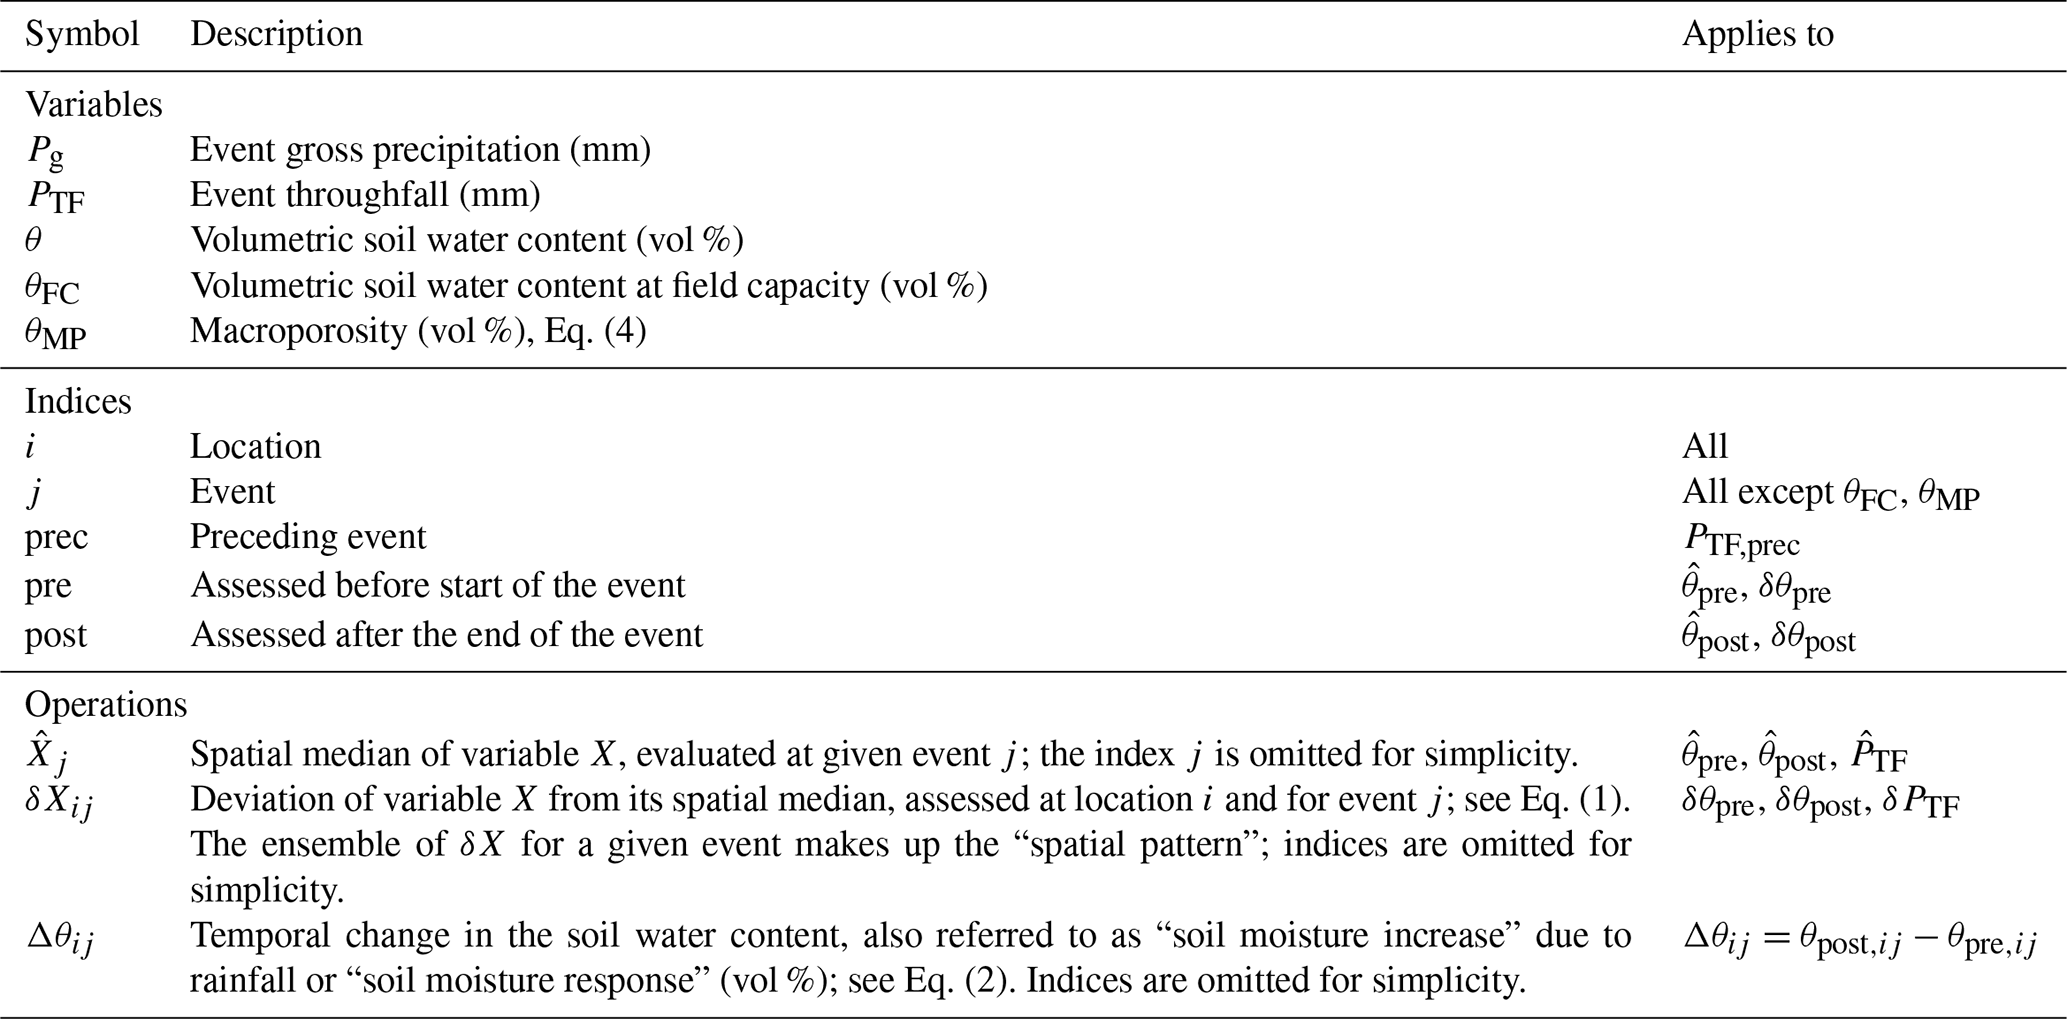
The independent variables (fixed effects) for δθpre were as follows: gross precipitation (Pg), distance to the nearest tree (dtree), macroporosity (θMP), field capacity (θFC) and throughfall of the preceding event (PTF,prec). The independent variables (fixed effects) for Δθ and δθpost were as follows: gross precipitation (Pg), spatial median of soil pre-event water content (), spatial pattern of soil pre-event water content (δθpre), distance to the nearest tree (dtree), macroporosity (θMP), field capacity (θFC), spatial median of throughfall () and spatial pattern of throughfall (δPTF). Year, day of year and sensor position were implemented as random effects, thereby accounting for repeated measurements. To avoid model overfitting, it is important that there are no strong correlations between the explanatory variables (Graham, 2003). To detect multicollinearity and to avoid potentially spurious models, we calculated the Spearman rank correlation coefficients (ρ) for all pairs of predictors (Table S1 in the Supplement). Before the analysis, we removed one of a pair of highly correlated predictors: gross precipitation (Pg, strong correlation with ) and field capacity (θFC, strong correlation with θMP). All variables (predictor and response) were scaled to center around 0 and have a standard deviation of 1 (z transformation). In this way, the fitted slopes of the model indicate how strongly a change in the predictor within its own range affects the response variable within its own range; hence, the slope estimate gives insight into the effect strength. Scaling has no effect on model selection. To obtain the minimal adequate models for the response variables, we started with the maximum model and removed all nonsignificant terms in a stepwise manner based on the Akaike information criterion (AIC). The main effects included in significant interactions were retained in the model.
3.1 Precipitation, throughfall and soil water content pattern
The summer rainfall (May–October) for the last 30 years (1986–2016) shows an average of 352 mm (Mühlhausen-Windeberg). During the two summer periods of this study (2015 and 2016), the annual rainfall was below the long-term mean (276 and 303 mm, respectively). However, the summer of 2015 was the third driest of the last 30 years (Metzger et al., 2017). The final winter months of 2014 were the driest of the 30 years period, and the 2014–2015 hydrological year was the second driest. The 2015–2016 hydrological year and the final winter months of 2015 received an average amount of precipitation.
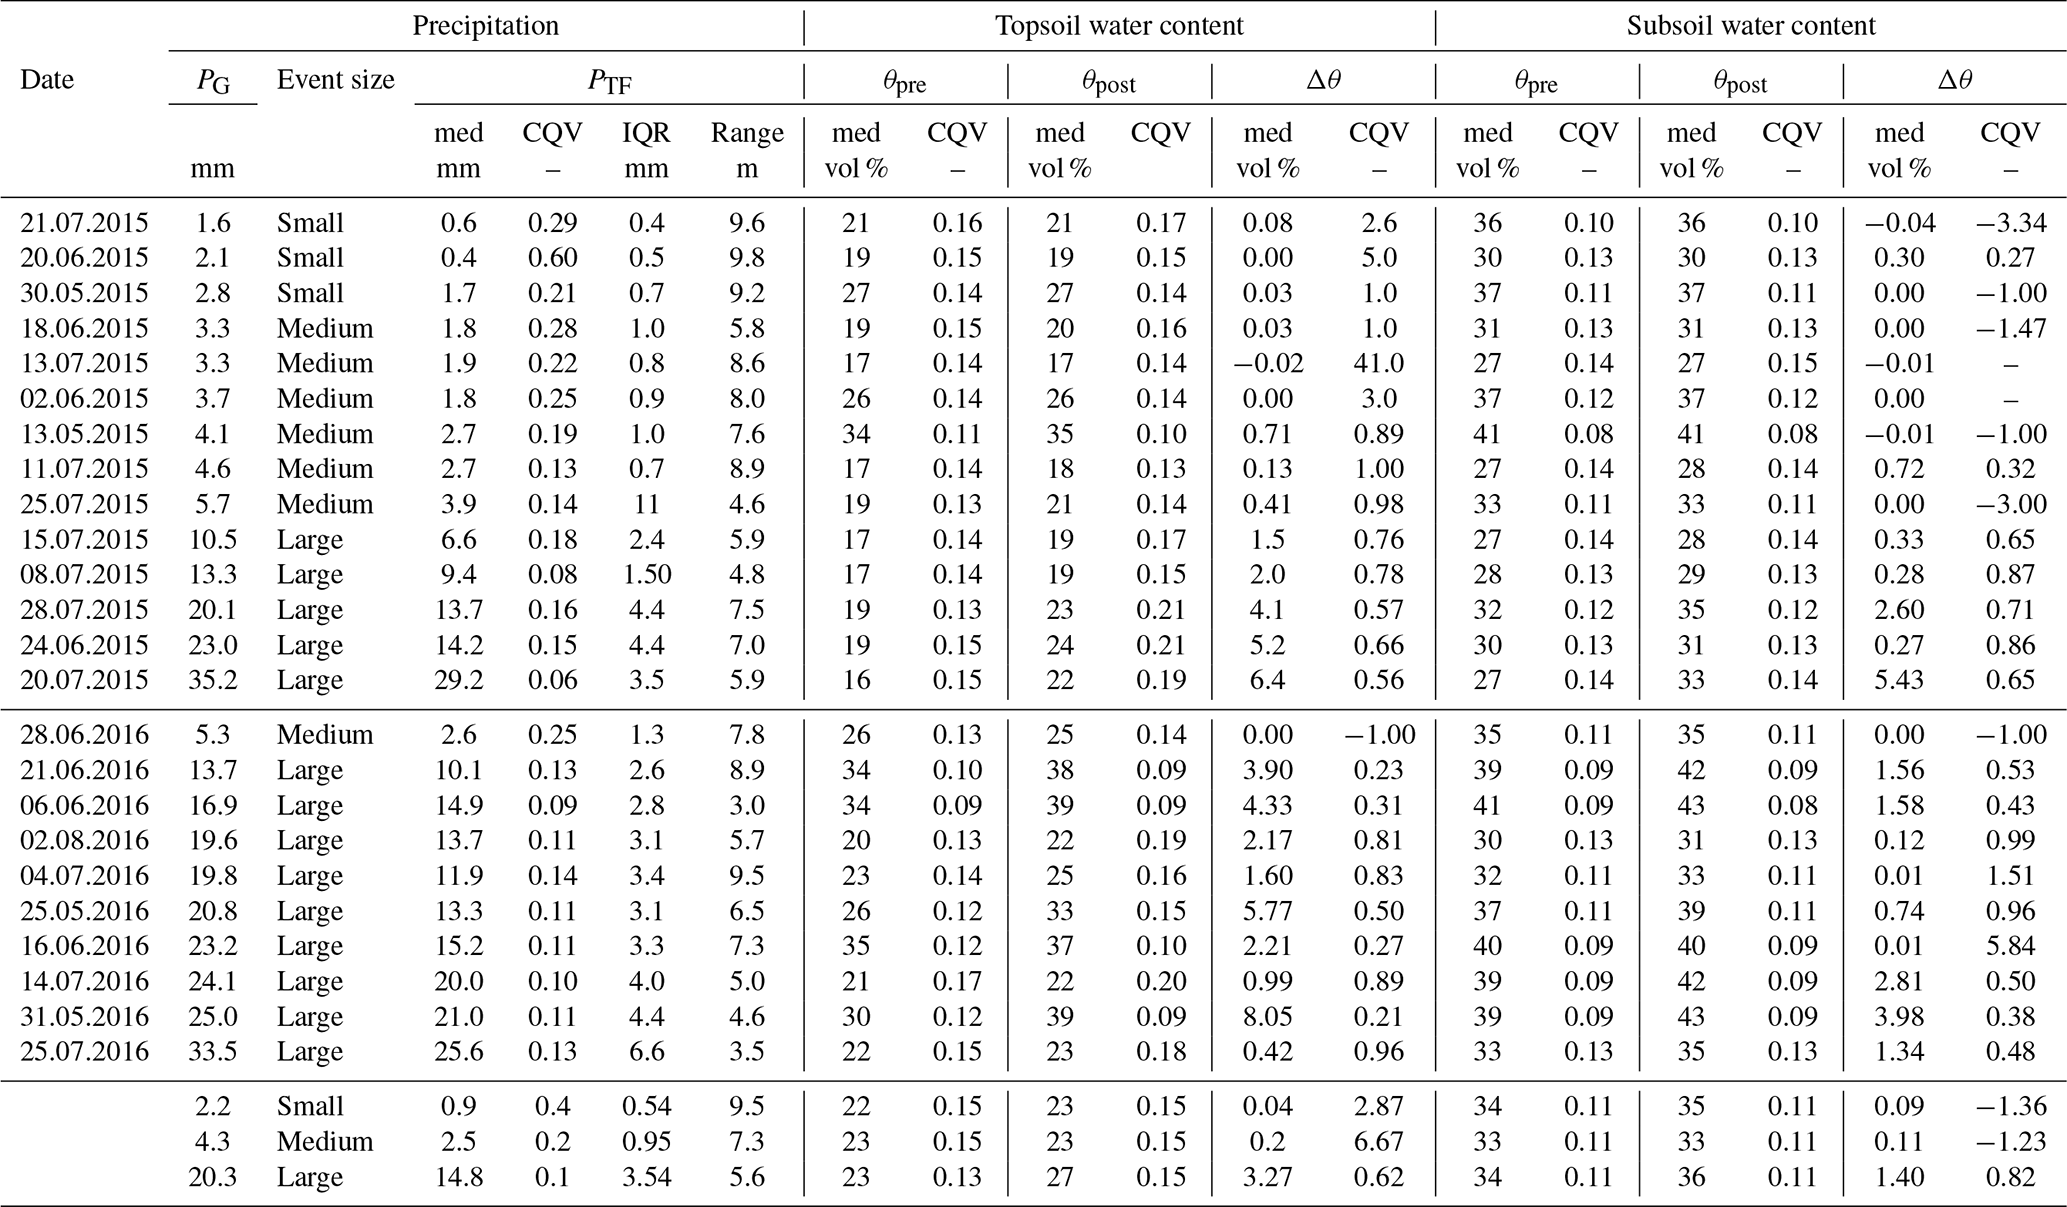
Descriptive statistics of the throughfall and soil water content (topsoil and subsoil) are given in Table 2. We observed 14 rainfall events in 2015 and 10 events in 2016. The gross precipitation ranged between 1.6 and 35.2 mm, with three small events, six medium events and five large events in 2015 and one medium event and nine large events in 2016. For both years, the soil water content increased with soil depth (Table 2). The soil water content increase (the difference between the post-event and pre-event soil water content, Δθ) was always higher in the topsoil compared with the subsoil. For smaller rainfall events, an increase in the soil water content was mainly limited to the topsoil, whereas an increase in the soil water content was noted at both soil depths following larger rainfall events.
Table 2Overview of observed rainfall event properties: event date, gross precipitation (Pg), spatial statistics of throughfall (PTF), soil water content before (θpre) and after (θpost) the rain event, and the soil water content increase (Δθ) in the topsoil and subsoil. The following statistics are presented: spatial median (med), coefficient of quartile variation (CQV), interquartile range (IQR) and effective range (Range).
3.2 Spatial pattern of throughfall and soil water content
The relation between the event size and correlation length of throughfall is shown in Fig. 2. More detailed information about the spatial distributions and the variogram parameters is given in Tables S2 and S3 in the Supplement. Throughfall correlation lengths increased with decreasing event size from on average 6.2 m for large events to 7.5 m for medium and 9.5 m for small events. In comparison, the canopy density correlation length was 7.5 m, i.e., similar to medium events. Throughfall and canopy density had a small nugget and a strong spatial dependence (nugget / sill ratio <25 %) for all events (Table S3). For both years, throughfall decreased significantly with increasing canopy density (Table S4 in the Supplement), although most of the spatial variance in throughfall was related to unknown random effects. While canopy density had no spatial trend (Table S2), throughfall had a spatial trend in less than half of the events (Table S2). These trends changed direction with time, were of varying strength, and occurred in small and large events.
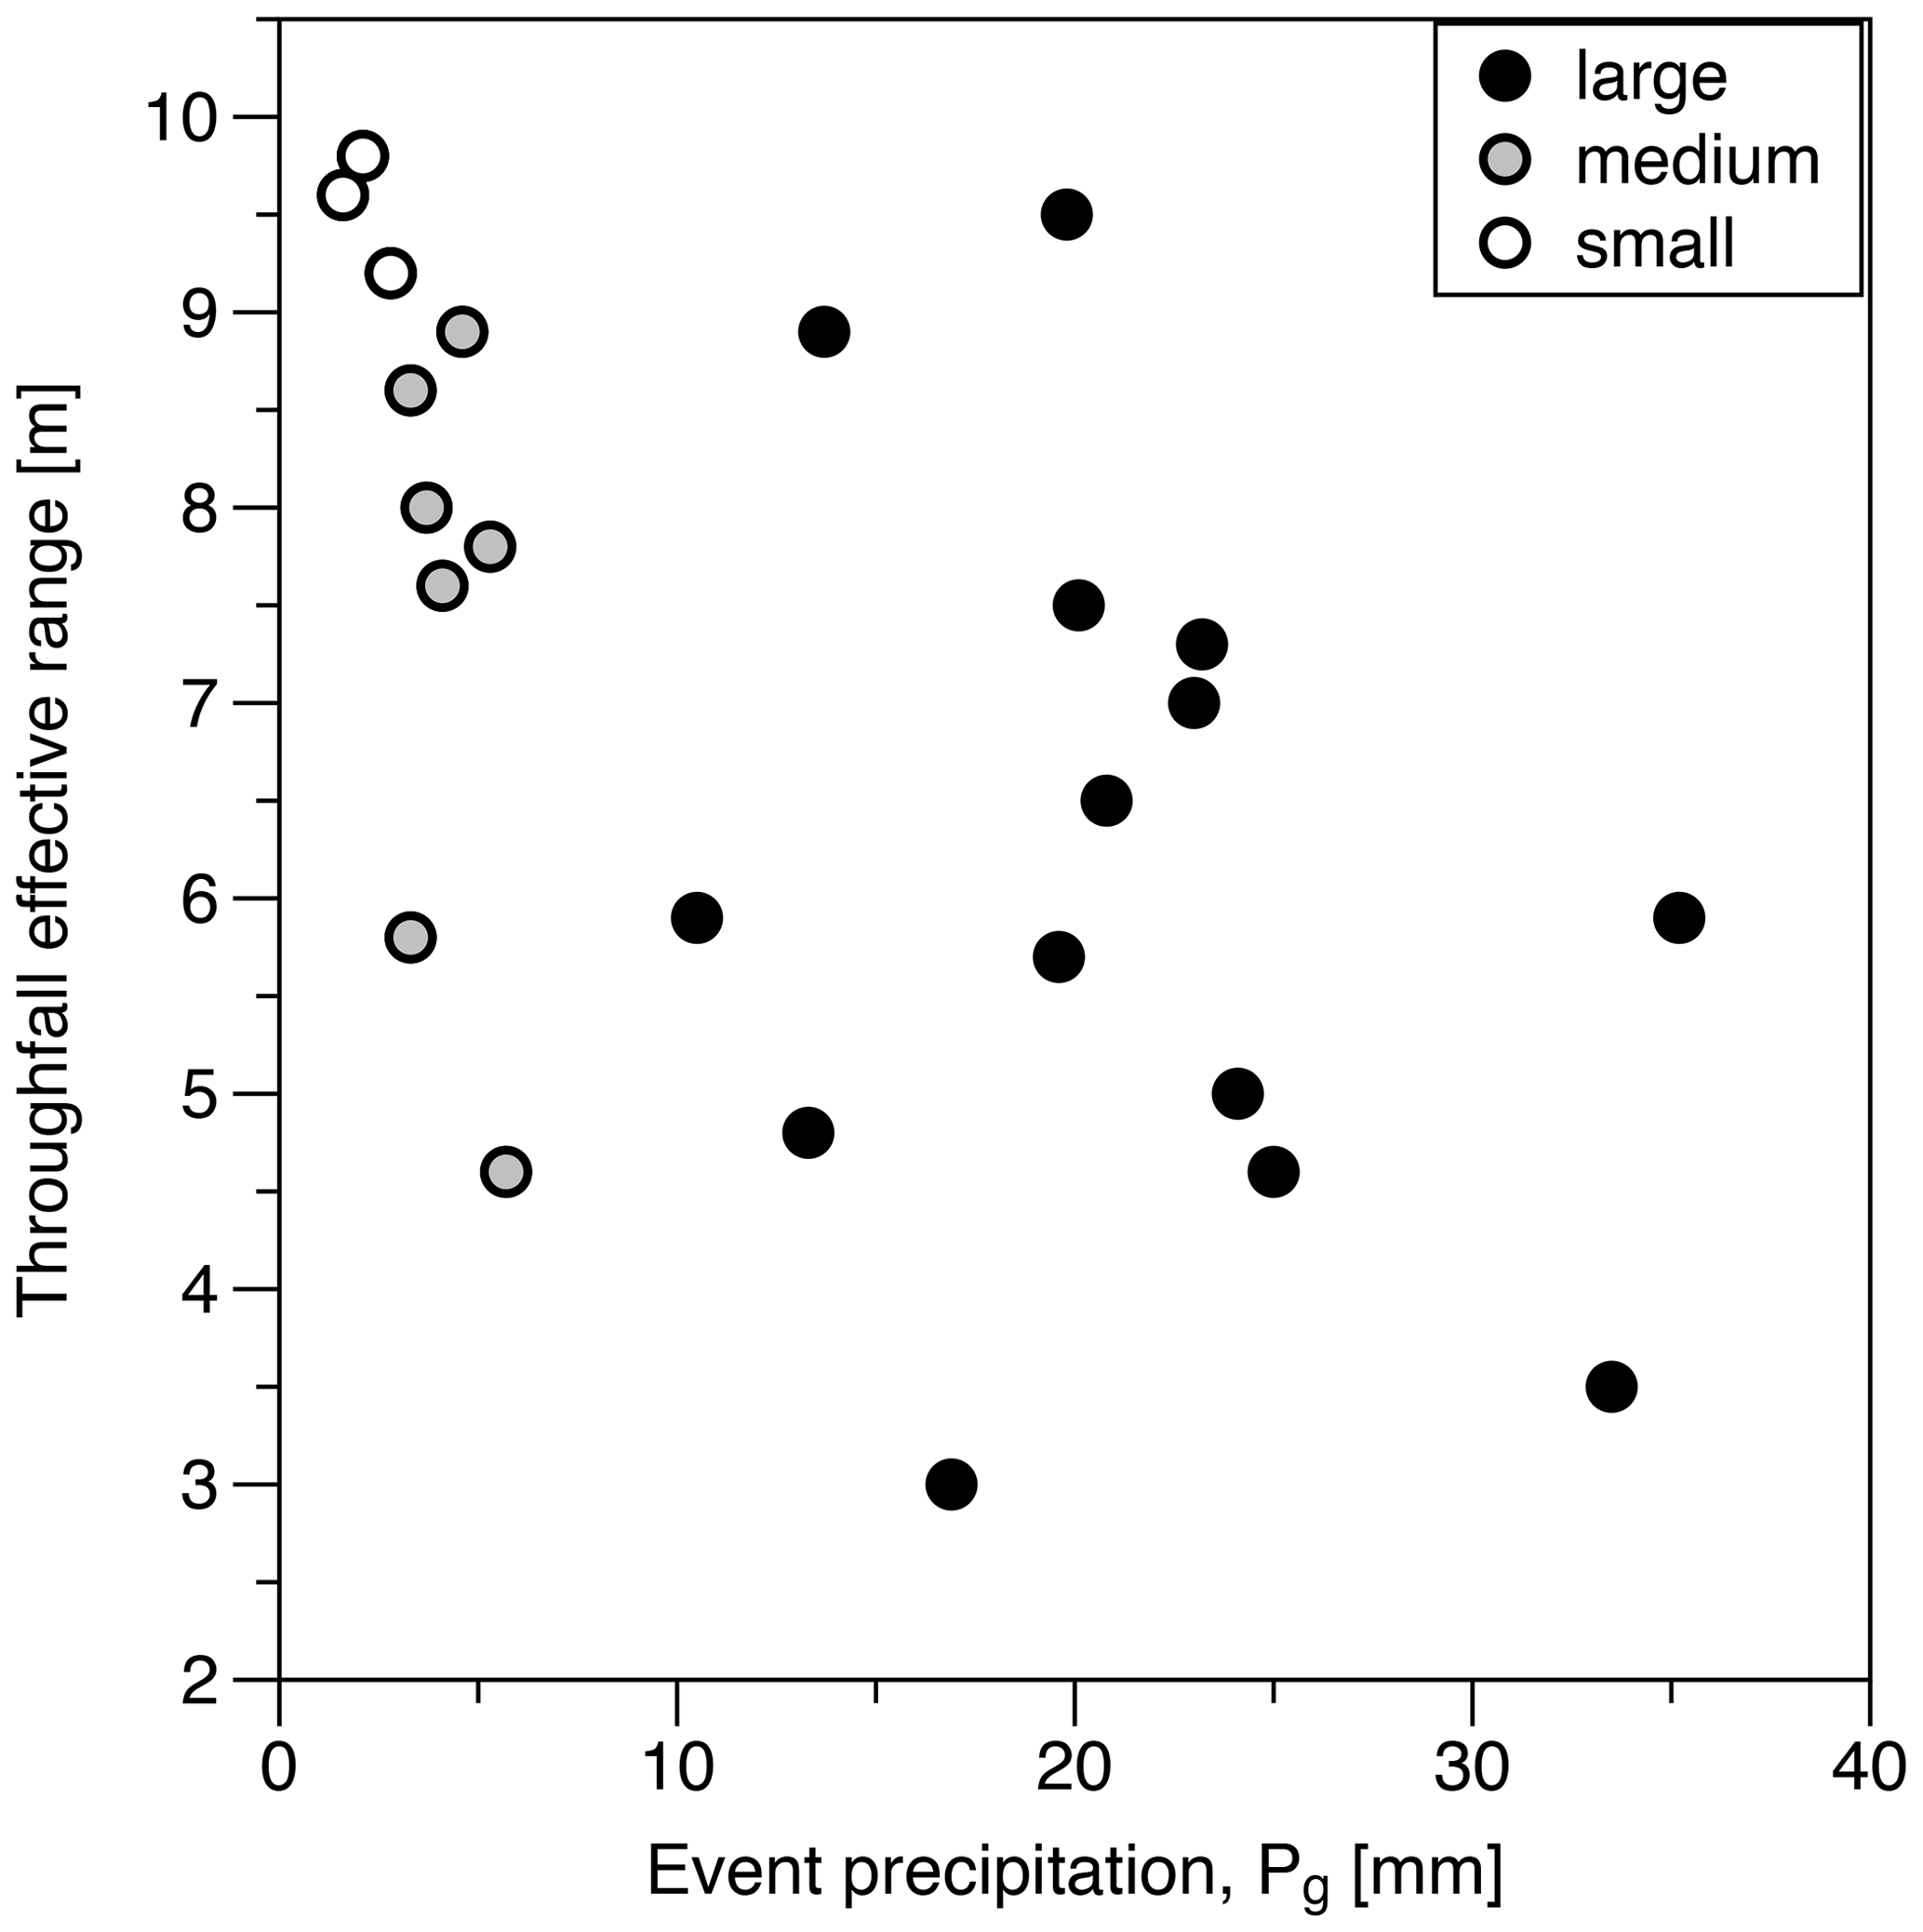
Figure 2Correlation length, given as effective range, derived from the throughfall variogram calculated for small (Pg<3 mm), medium ( mm) and large (Pg>10 mm) events.
The spatial variation in throughfall (interquartile range) increased with event throughfall, but the coefficient of quartile variation (CQV), which normalizes by event size, decreased (Table 2). The high Spearman rank correlation coefficient indicates a strong similarity of the spatial distribution of throughfall between individual events of the same size class (Fig. 3). Thus, throughfall produced persistent wet and dry spots, as also confirmed by time stability plots (Fig. S2 in the Supplement).
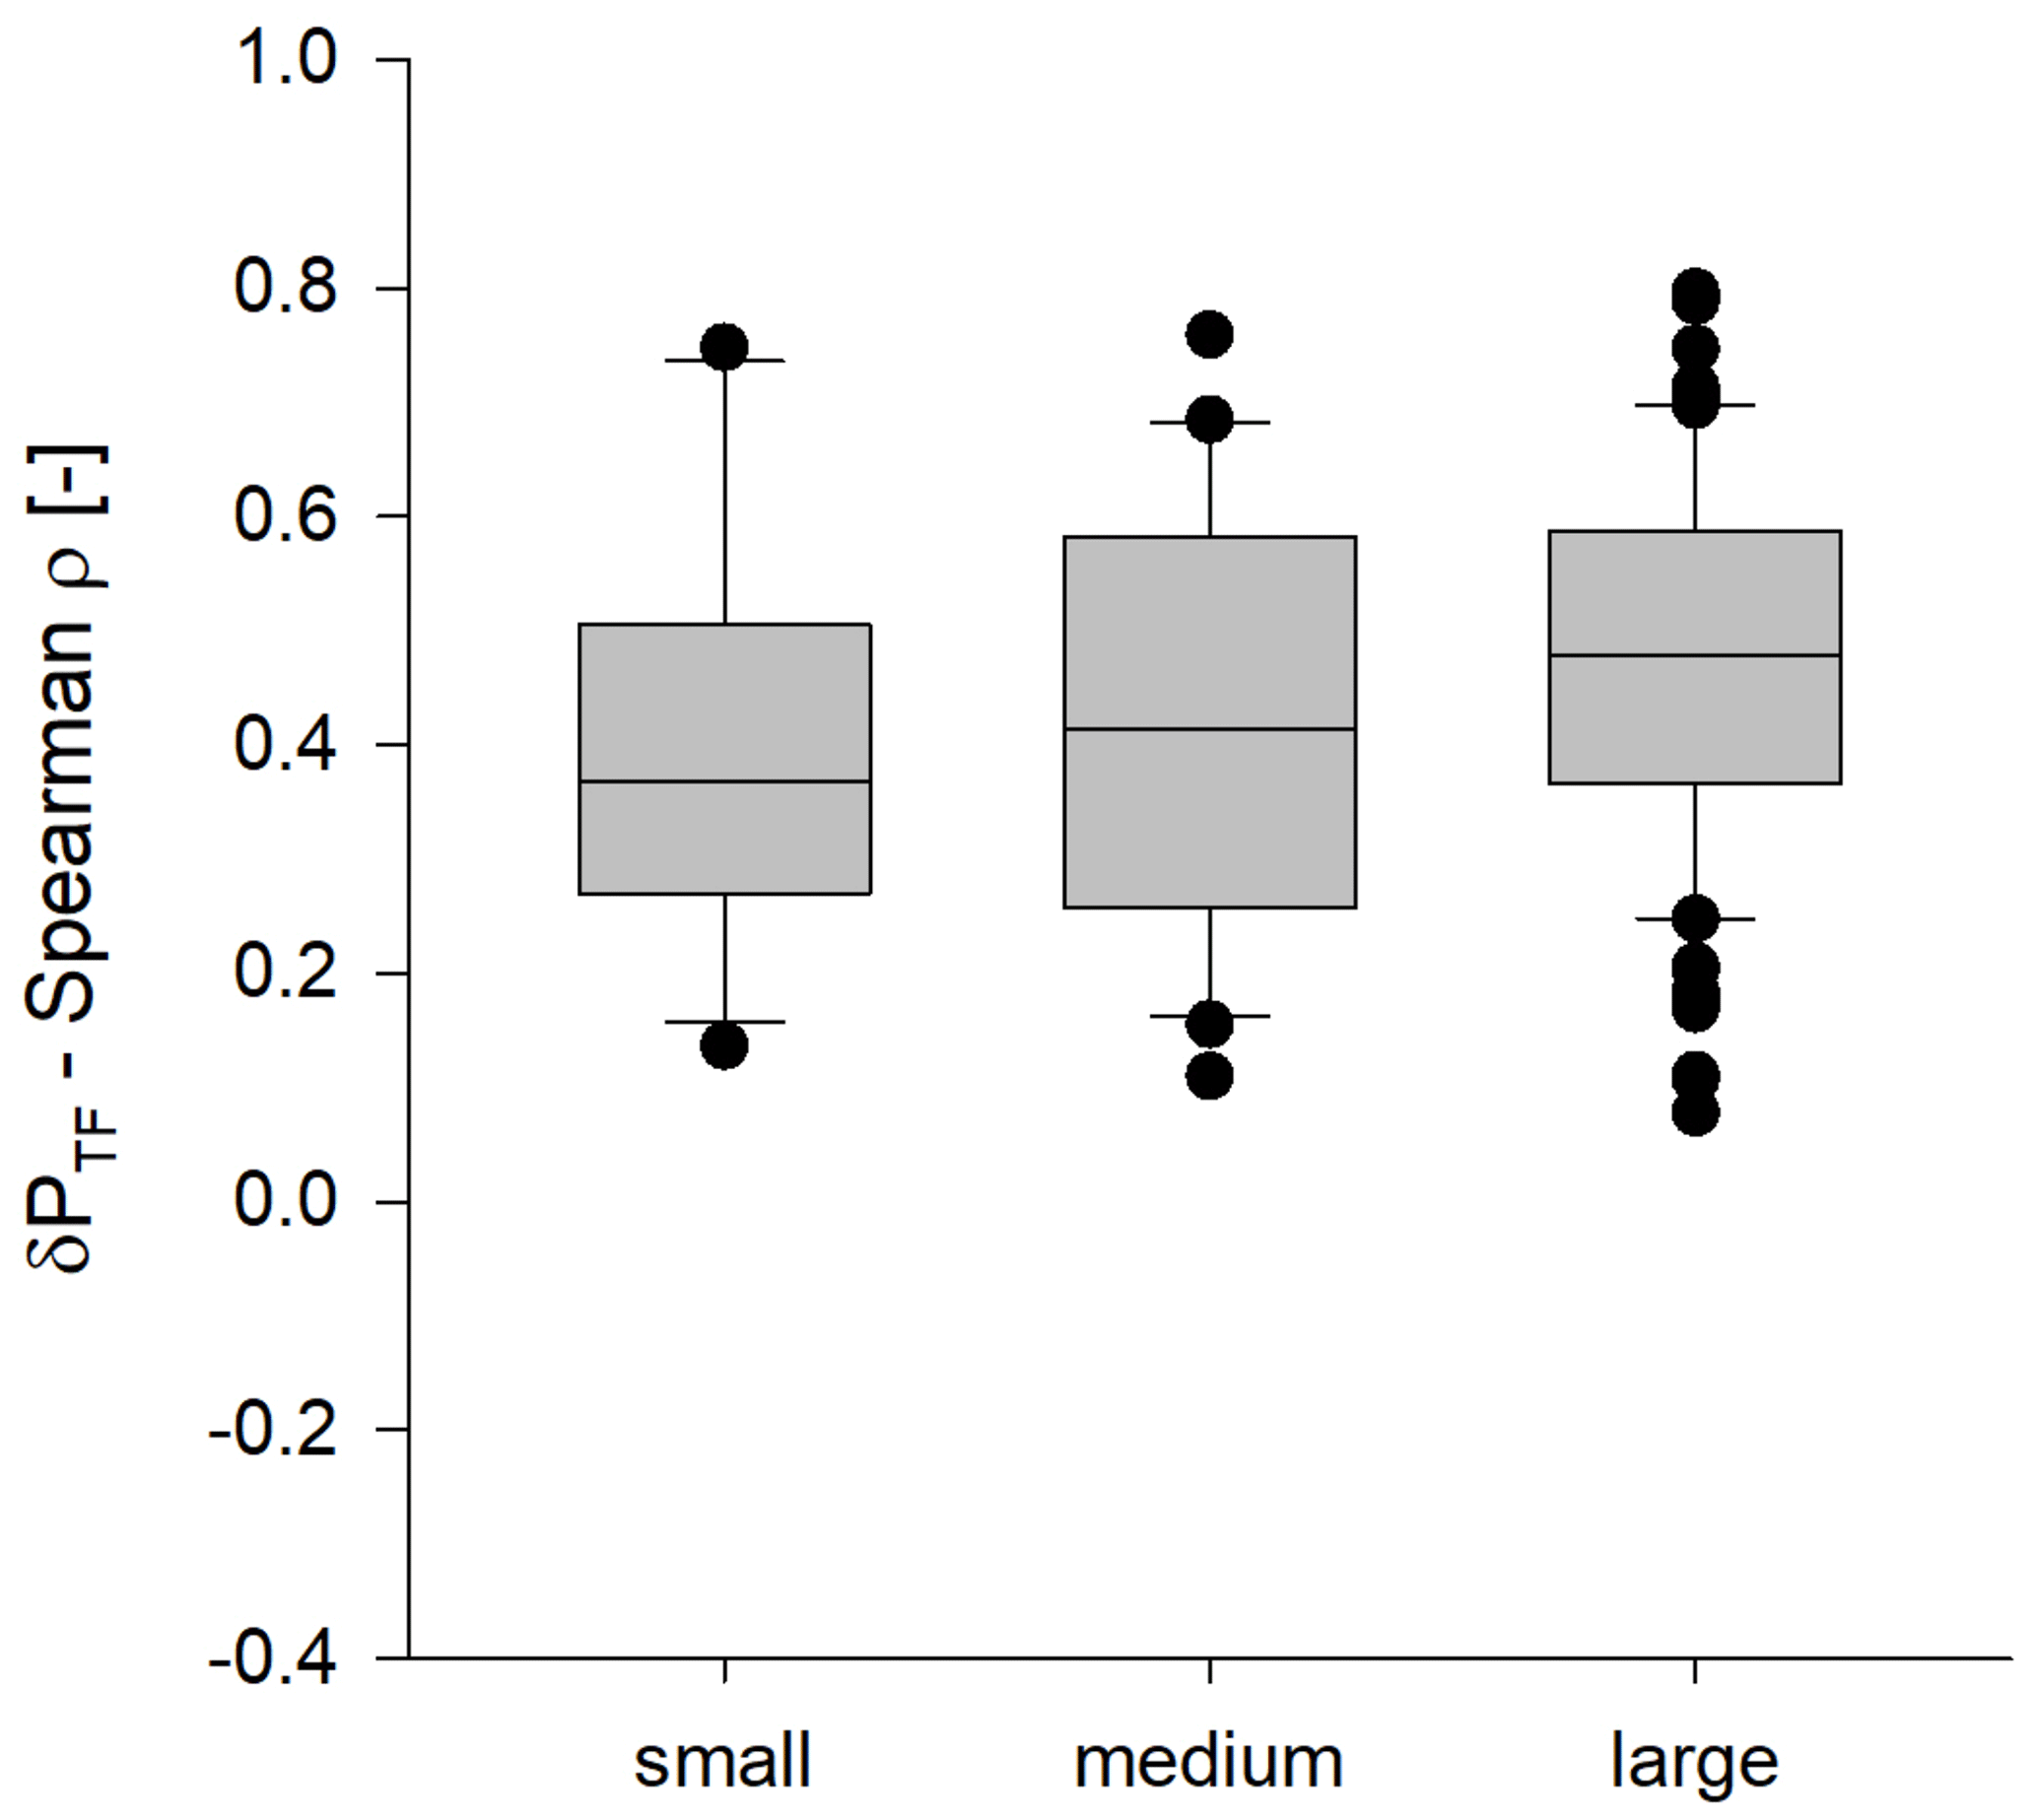
Figure 3Temporal stability of the spatial throughfall patterns. Shown are the pairwise (Spearman) correlation coefficients between throughfall (normalized deviation from the plot median, δPTF) from different precipitation events, grouped by the event size class: small (n=8), medium (n=11) and large (n=21).
The soil water content spatial variation coefficient (CQV) values decreased with increasing soil water content (expressed as the spatial median) and, consequently, with increasing soil depth (Table 2 and Fig. S3 in the Supplement). In the topsoil, the highest variation occurs in the post-event soil water content (Fig. S3) and is substantially higher than the pre-event soil water content, indicating that the event response enhanced the soil water content variation, especially under moderately dry (summer) conditions in topsoil. However, the highest CQV values by far were observed for the increase in the soil water content after rain (Δθ).
The pairwise correlation coefficients indicating the temporal stability of the spatial patterns were high for the pre-event (drained) soil water content (θpre) in both topsoil (Fig. 4a) and subsoil (Fig. 4b), with ρ≈0.78. For the post-event soil water content (θpost), they were significantly lower in the topsoil (ρ=0.70; Fig. 4c) than in the subsoil (ρ=0.77; Fig. 4d) (Mann–Whitney U test: , p=0.002). In the topsoil, they decreased with increasing event size, revealing that patterns were less similar after large precipitation events (Fig. 4a, c). In contrast, the spatial distribution of the soil water content increase after rain events () changed much more between events (Fig. 4e, f), leading to an overall lower correlation between the patterns. However, the similarity of the spatial distribution of Δθ increased with event size, especially in topsoil (Fig. 4e), confirming reoccurring wetting patterns, especially following larger events.
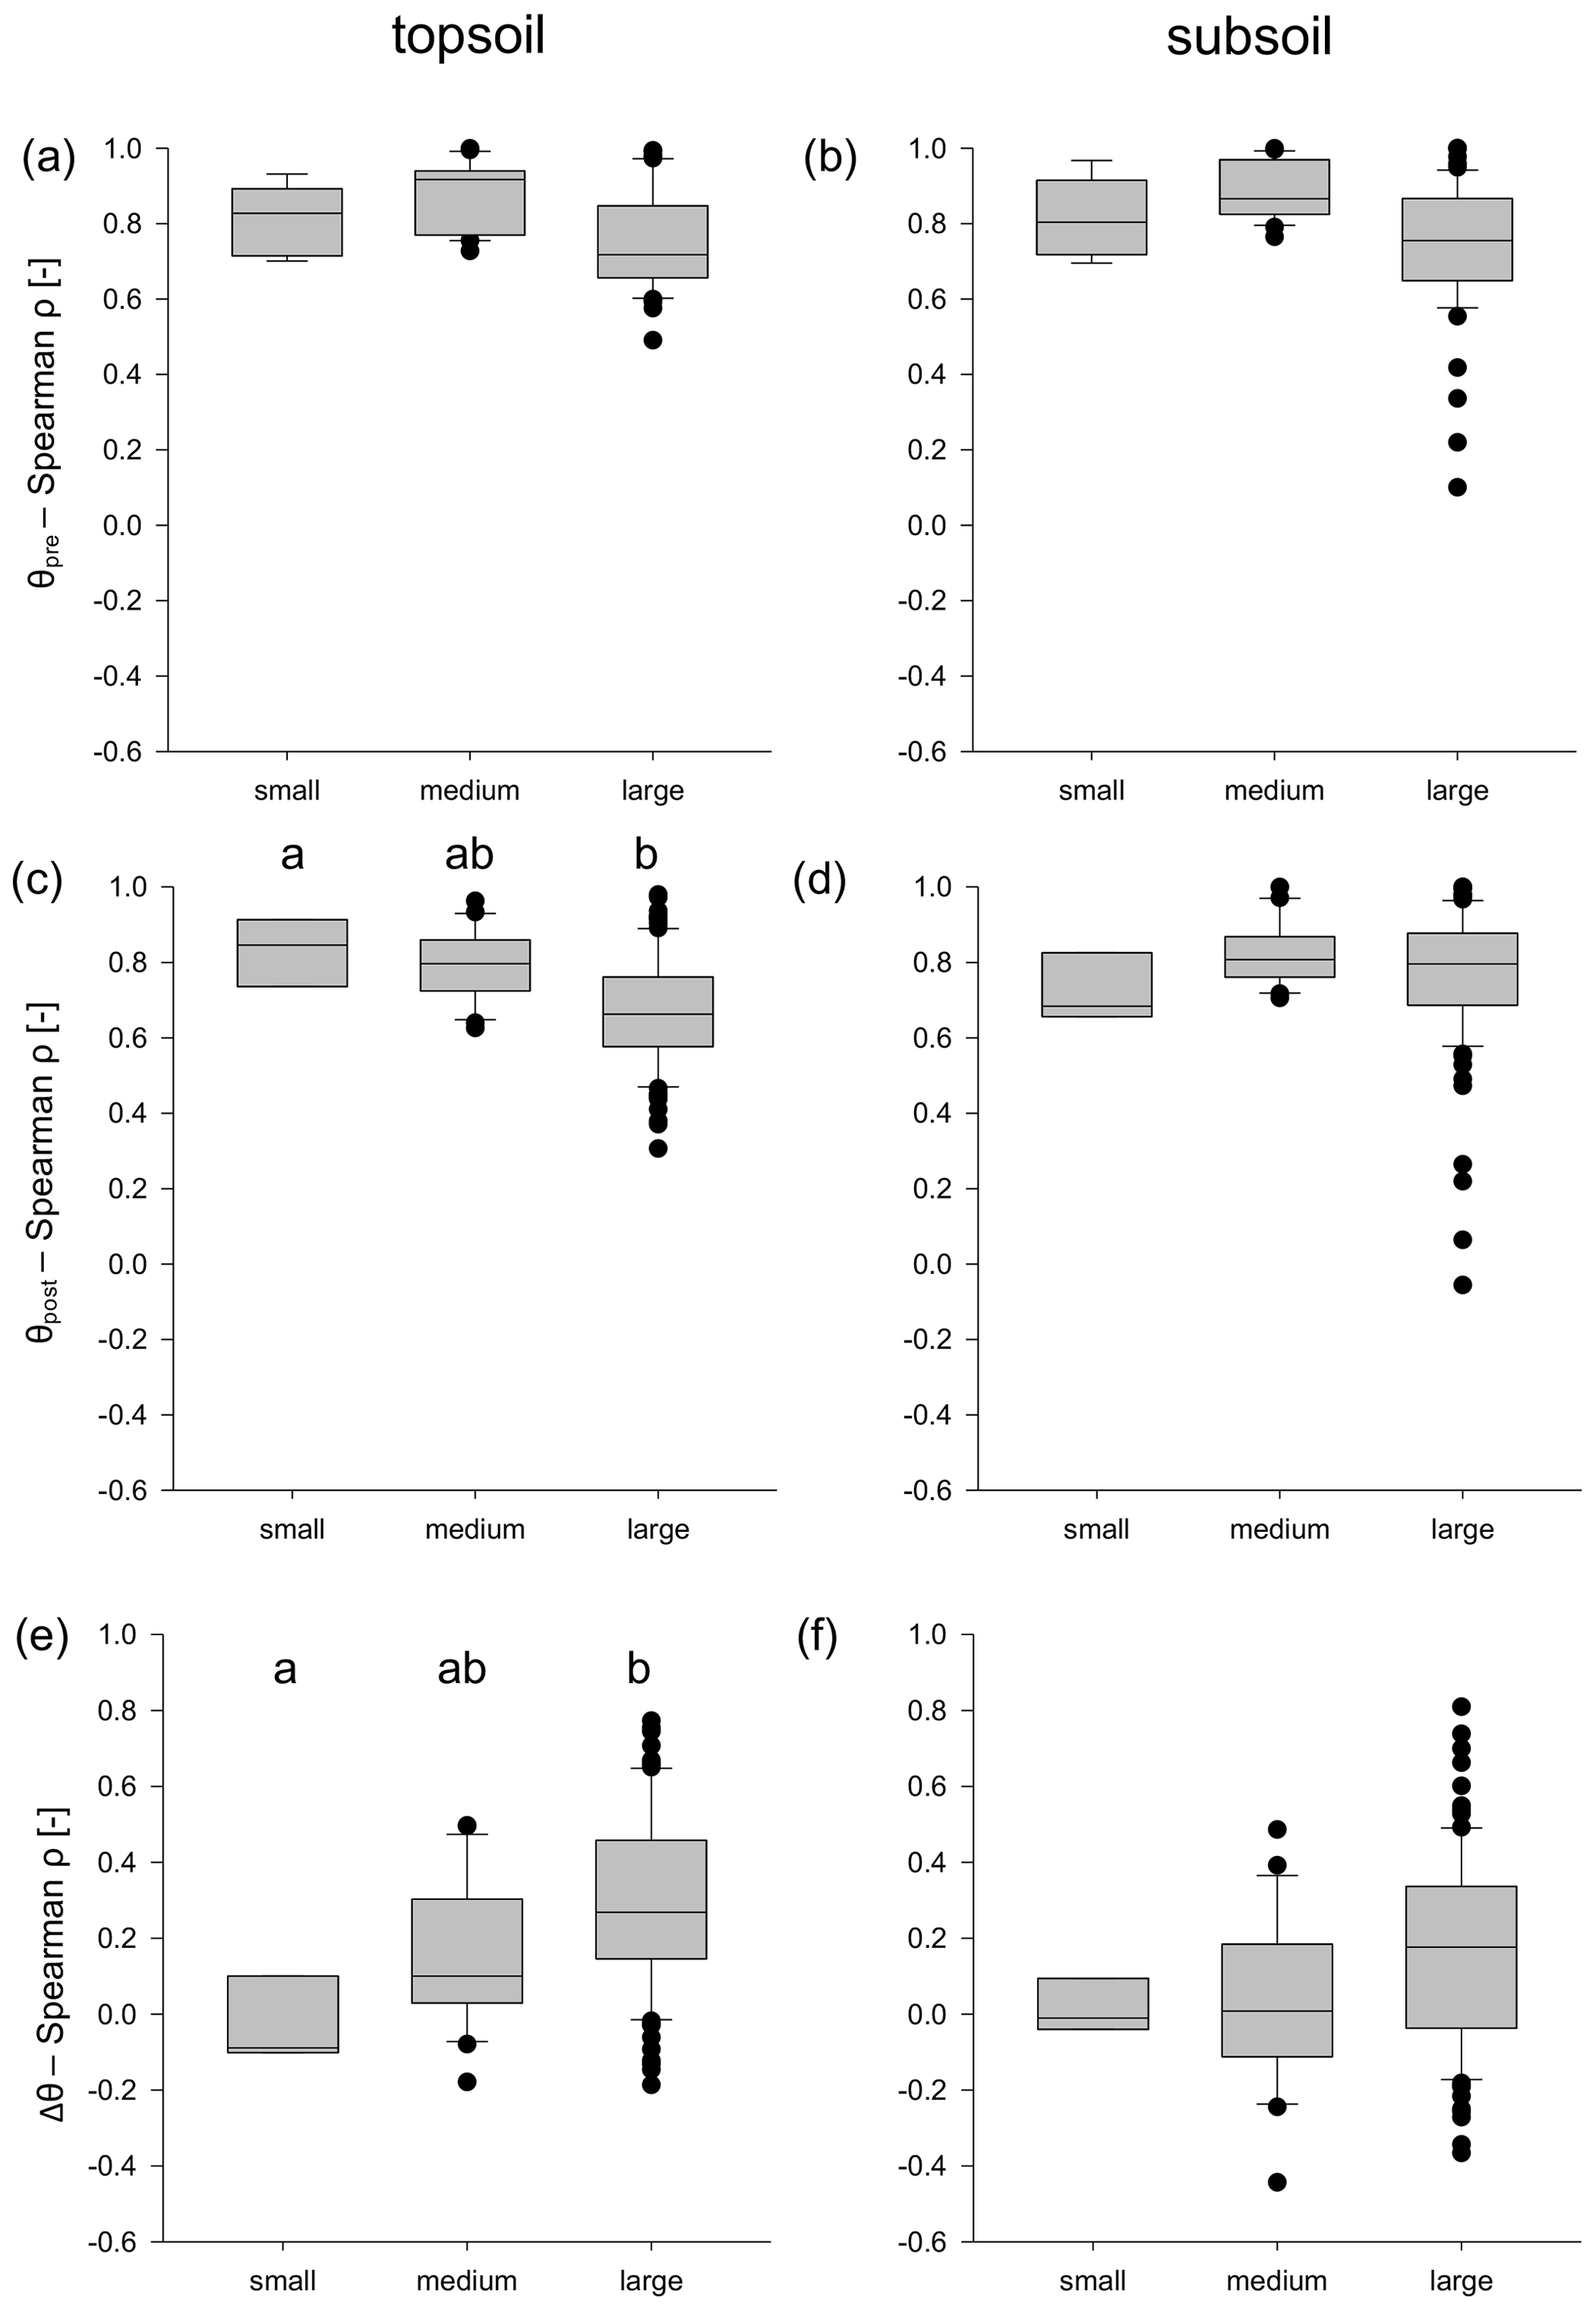
Figure 4Temporal autocorrelation of the spatial patterns of the pre- and post-event soil water content and increase in the soil water content after rainfall, calculated as pairwise (Spearman, ρ) correlation coefficients between all of the different precipitation events within the following event size classes: small (n=3), medium (n=7) and large (n=13). The figure panels show the following variables: (a, b) pre-event soil water content (θpre), (c, d) post-event soil water content (θpost), and (e, f) increase in the soil water content () in the (a, c, e) topsoil (−7.5 cm) and (b, d, f) subsoil (−27 cm). The differences between the event size classes were examined using a Duncan multiple-range test. The letters above the bars indicate a significant difference (p≤0.05) between the groups.
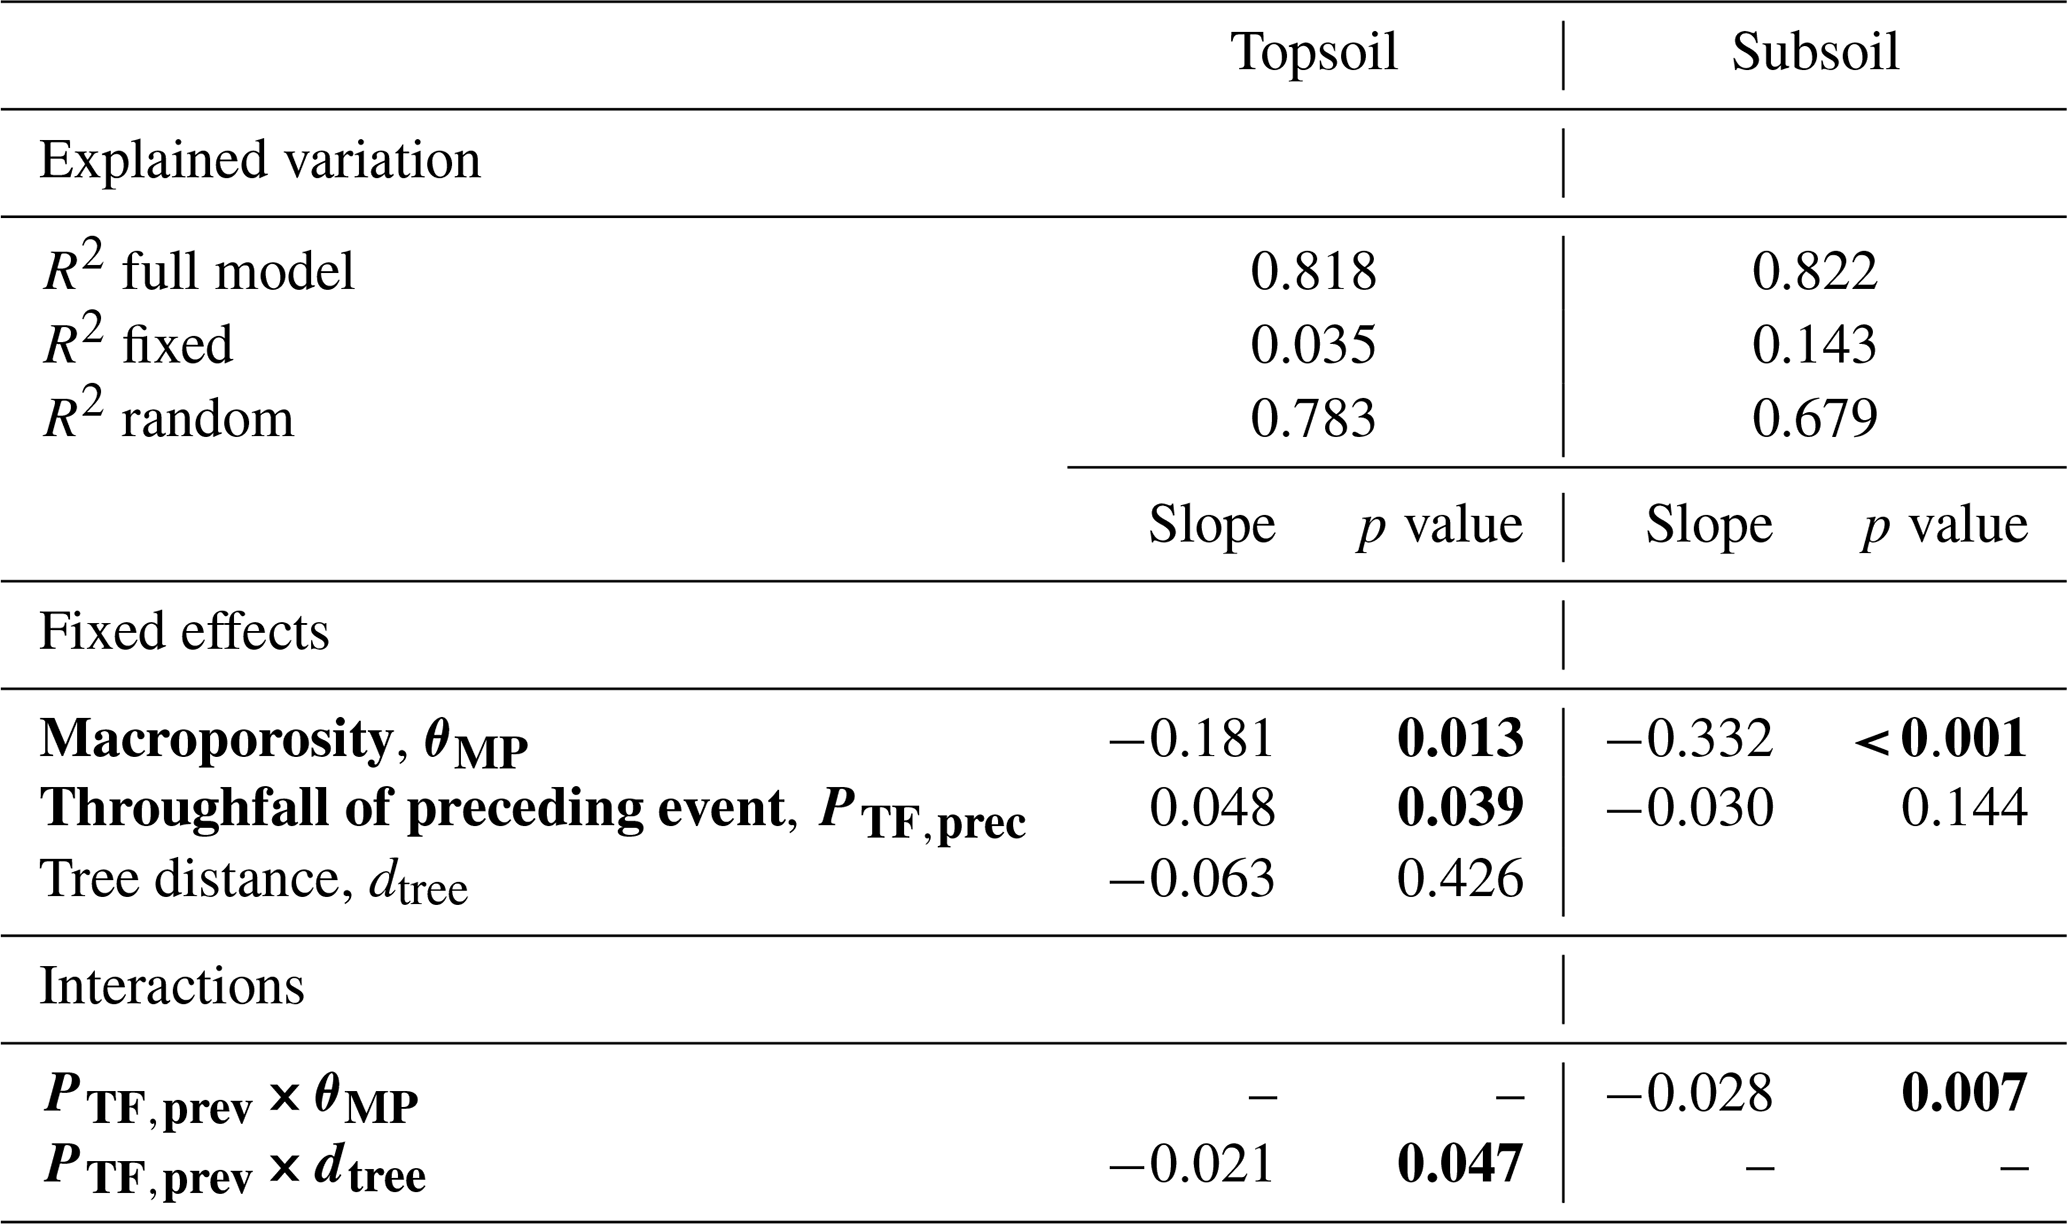
Table 3Factors affecting the pre-event soil water content patterns (δθpre) in the topsoil and subsoil. Results are shown for the best linear mixed-effects model; significant effects are highlighted in bold.
3.3 Factors influencing the soil water spatial distribution
3.3.1 Soil water content
In order to identify the basic drivers of the soil water content patterns in the drained state (δθpre), we used mixed-effects model selection. The resulting best models for the top- and subsoil are given in Table 3. The variance explained by fixed effects (marginal R2) was low, whereas the variance explained by fixed and random effects together (conditional R2) was high. The model for the subsoil showed an even higher marginal R2 compared with the topsoil as well as a somewhat higher influence of fixed effects. The most important effect identified for the topsoil and subsoil was macroporosity, with a lower soil water content (δθpre) related to locations of higher macroporosity (Table 3). In the topsoil, the throughfall of the preceding precipitation event also slightly affected the soil moisture pattern. The results for the soil water content itself in the drained state (θpre) are similar to those of δθpre, except that fixed effects explain even less variation (not shown).
The results of the best linear mixed-effects model relating the soil water content after a precipitation event to potential drivers are given for all events (Fig. 5a, c) and large events only (events with Pg>6 mm; Fig. 5b, d). The median initial soil water content (soil water content before the rain event, θpre) and its spatial pattern (δθpre) were the major drivers of either the absolute values of the spatially distributed soil water content after the rain event (θpost; Fig. 5a, b) or the spatial pattern of the soil water content after the rain event (δθpost). Other fixed (, δPTF, , θMP and dtree) and random effects contributed only a little, especially when small and medium events were excluded (Fig. 5b).

Figure 5Factors influencing (a, b) the local post-event soil water content (the peak soil water content after rainfall, θpost) and (c, d) the local soil water content increase due to rainfall (the difference between the soil water content after and before each event, Δθ). Slope estimates are shown for the best linear mixed-effects model including (a, c) all events and (b, d) large events only (Pg>6 mm). Significant effects are shown using thick lines, and the asterisks indicate the level of significance: p<0.001, and ∗ . All variables (predictors and responses) are z-scaled such that the slope indicates the effect strength. Pseudo-R2 values and a summary of all models, including those of small and medium events, are given in the Supplement (Tables S5 and S6).
3.3.2 Soil water response (Δθ)
The slope estimates of models explaining the soil water content increase (Δθ), i.e., how much water was locally added to the soil after rain, are visualized in Fig. 5c and d for all and large events, respectively. In general, a detectable (>1 %) change in Δθ was limited to large rainfall events (Table 2). The spatial patterns responded to several drivers (fixed effects) in the final model. There, the variance explained by fixed effects (marginal R2) was generally higher for subsoil compared with topsoil; moreover, it typically increased with event size and was highest for the models including all event sizes (Table S6). Therefore, in the following, we focus on the effects emerging from models including all events. We also visualize models for events falling in the large-event class, as it covers more than 80 % of the cumulated net precipitation received. The results for the individual event size classes are given in the Supplement (Tables S5 and S6).
Overall, local soil water content increase (Δθi) depended not only on the event median throughfall () but also on whether more or less throughfall (δPTF) was received locally and on local soil moisture conditions (δθpre). In the subsoil, macroporosity additionally directly affected the soil moisture response. All main effects are also included in interactions, meaning that a third variable influenced the relationship between an independent and dependent variable. For example, locally elevated throughfall enhanced the soil water increase, although more so with increasing event size (see the interaction of in Fig. 5c and d and Fig. 6a and b).
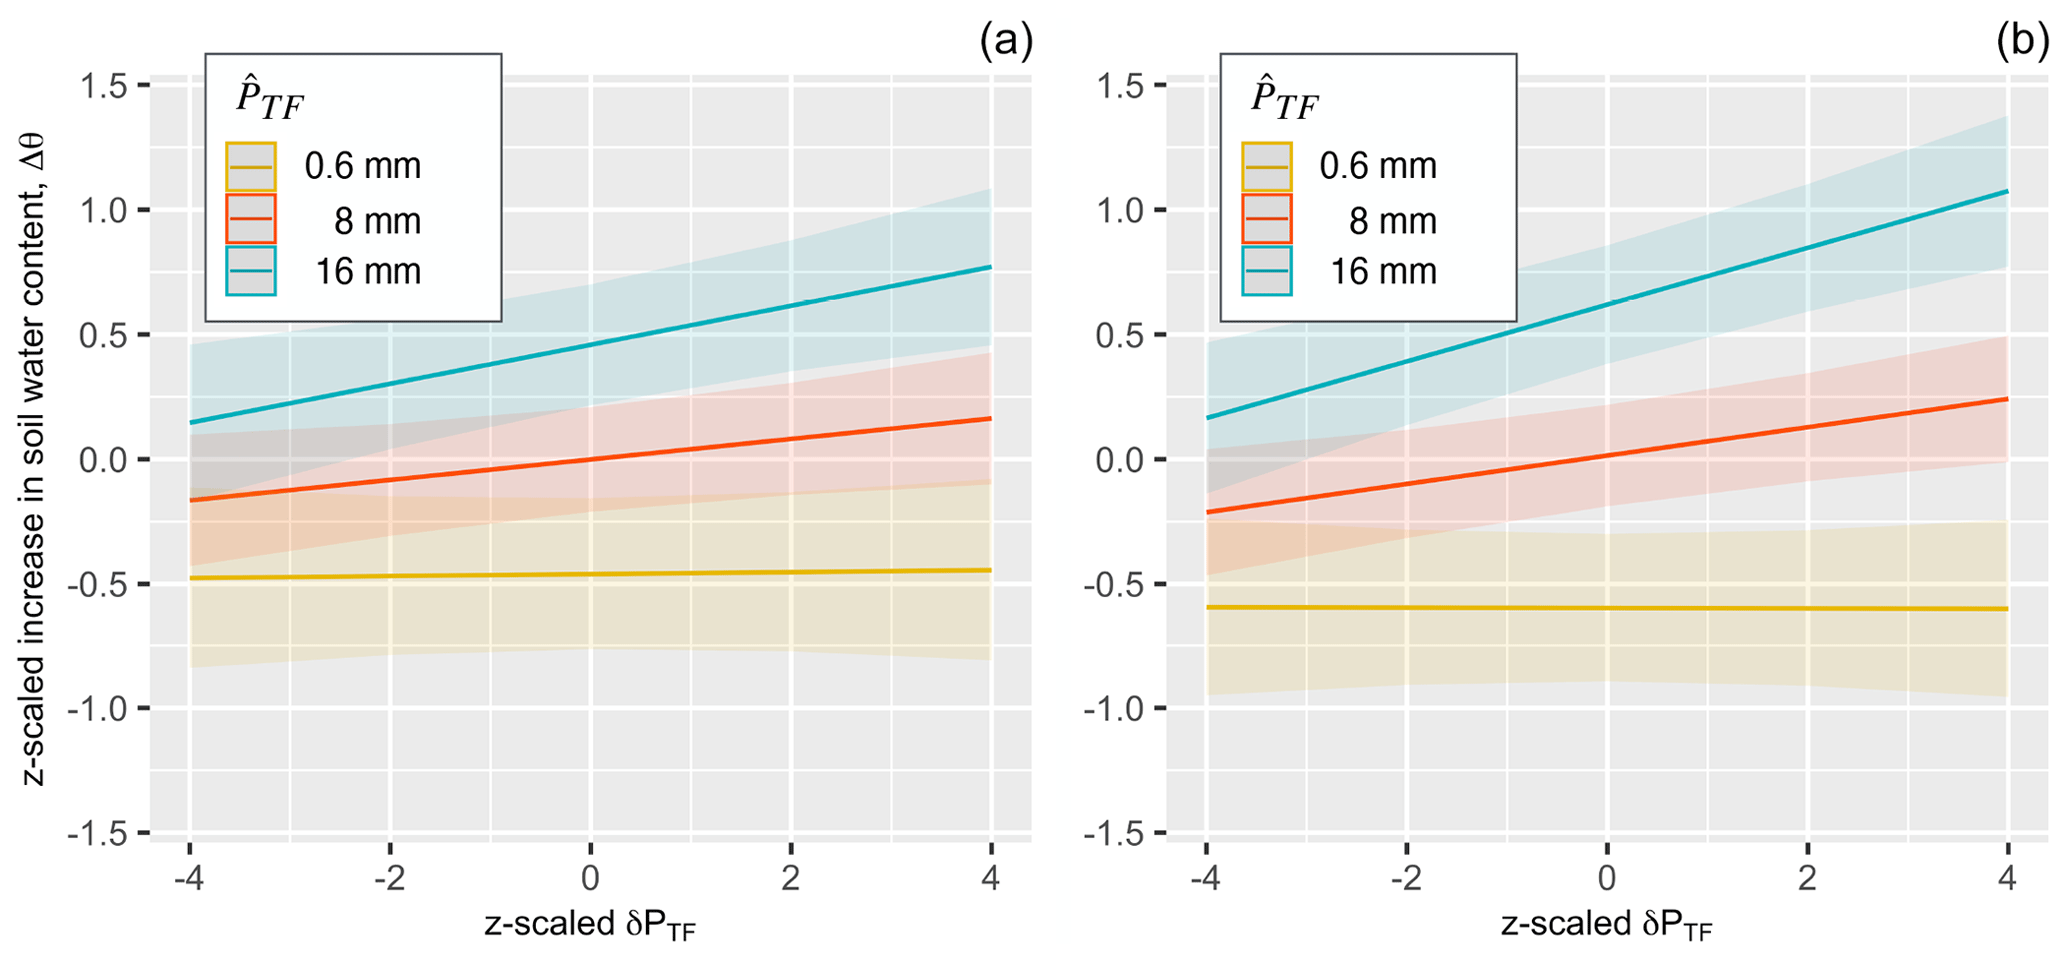
Figure 6Marginal plot of the interaction between the throughfall pattern (deviation of throughfall from the spatial median) and the median event throughfall () affecting the soil water content increase (Δθ) for all events in topsoil (a) and subsoil (b). Shown is the influence of the throughfall pattern (δPTF) on the local soil water content response (Δθi), grouped by the event size (the legend indicates the group central median event throughfall, ). Note that all values are z-scaled such that the slope indicates the effect strength. For example, the yellow line highlights small events, where the local soil water moisture response depends little on the spatial distribution of throughfall input. For large events, marked in blue, the soil moisture response is stronger in locations of above-average throughfall.
Spatial patterns of the pre-event (or initial or drained) soil water content (δθpre) notably affected top- and subsoil differently, making it the only factor yielding inverse effects on the soil water content increase at different soil depths. In topsoil, drier locations stored less water per event than moister spots (positive slope estimates), whereas the opposite was the case in subsoil (negative slope estimates). Notably, the slope of the interaction changes with the overall soil water conditions, consistently at both depths (see the interaction of in Fig. 5c and d and Fig. 7): under very dry soil conditions (summer, topsoil), locally moister soil admitted more water into the soil (positive slope in Fig. 7a), but less water was admitted under overall wet conditions (negative slope in spring topsoil and permanently in subsoil). This influence of the pre-event soil moisture patterns on moistening increased with event size (significant interaction , not visualized).
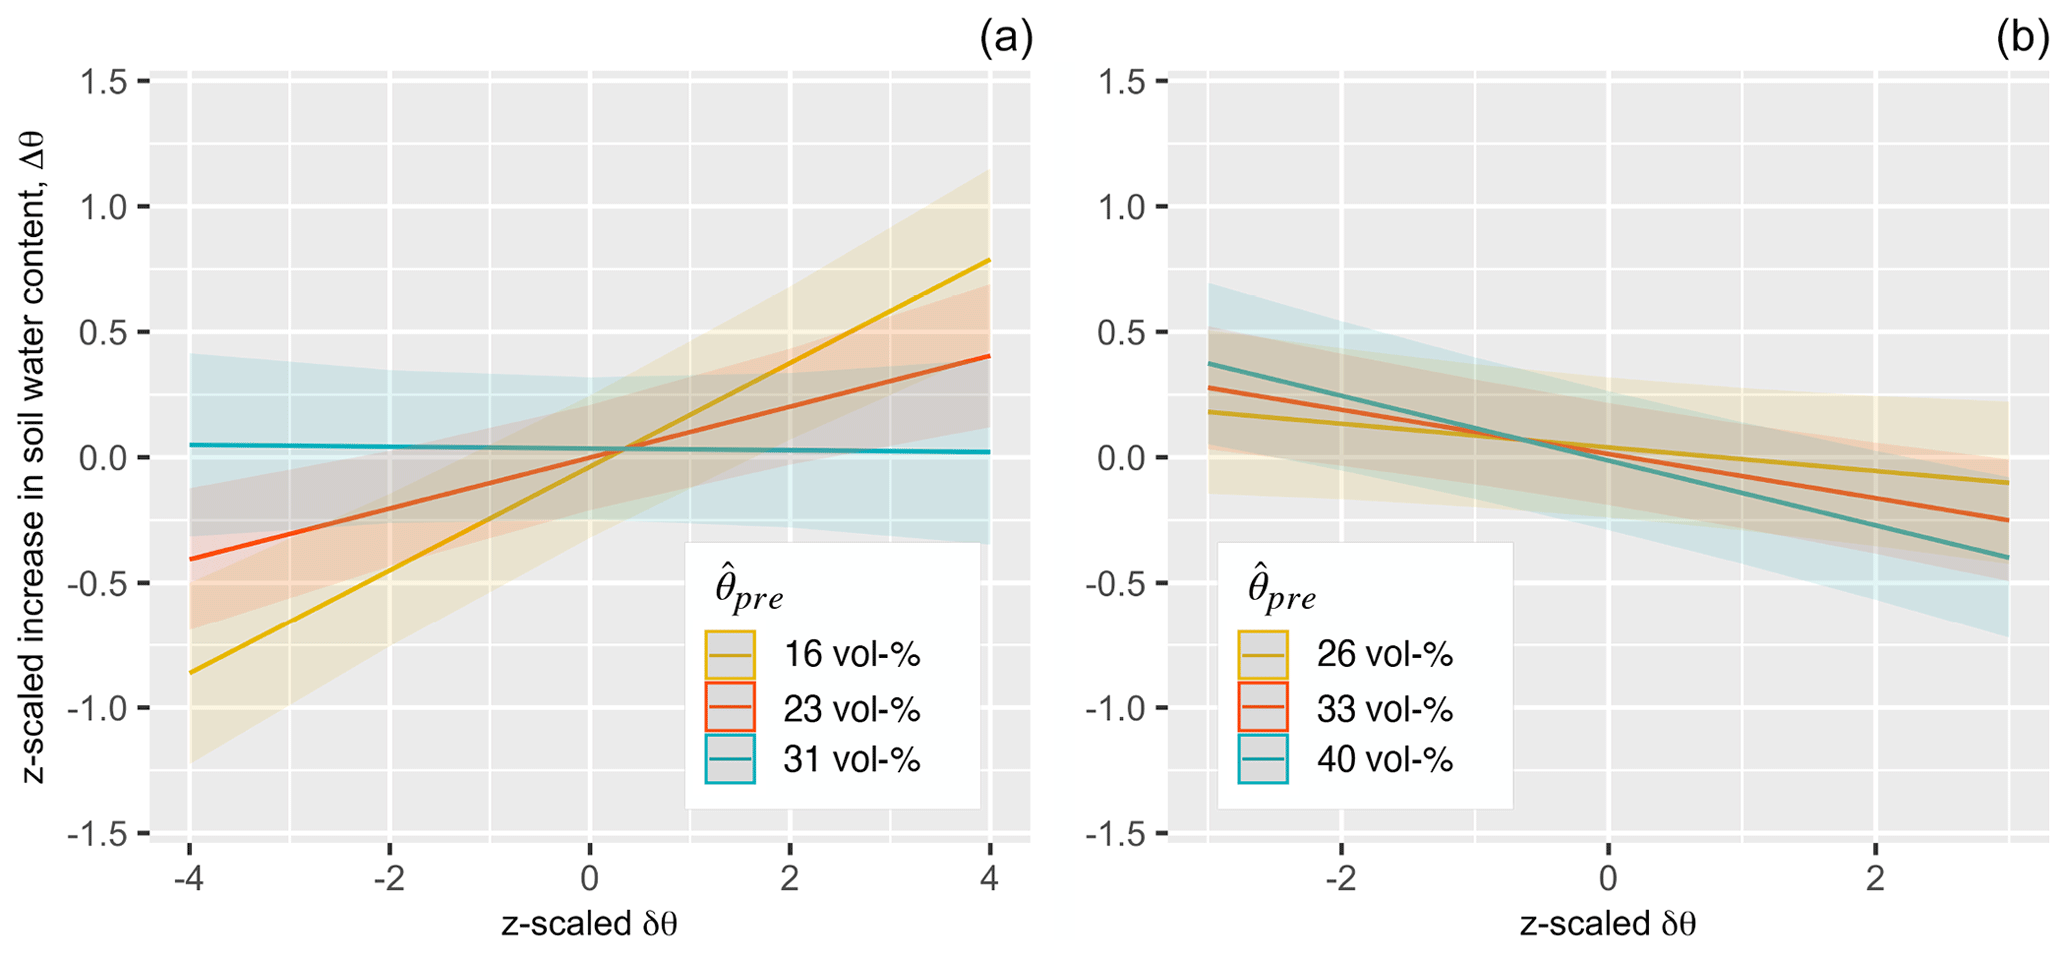
Figure 7Marginal plot of the interaction between the initial soil water content pattern (deviation of the pre-event soil water content from the spatial median) and the median soil water content () affecting the soil water content increase (Δθ) for all events in topsoil (a) and subsoil (b). Groups indicate the overall soil moisture conditions (the legend indicates the group central spatial median of the pre-event soil water content, ), and graphs show the relation between the initial soil water pattern and the local soil moisture response. All values are z-scaled such that the slope indicates not only the direction but also the strength of the effect. For example, the blue line shows how, under generally moist conditions (e.g., early spring), the soil moisture response to rain is dampened in moister locations (high values of δθpre), more prominently so in the subsoil. Additionally, when the topsoil is dry (e.g., summer, red and yellow lines), dry locations also store less water. In combination, this leads to a change in the slope direction in the topsoil over the year. The subsoil water content is always higher than that in topsoil; negative slopes (dampening in moist locations) are shown throughout.
Additionally, in the topsoil, the distance to the next tree affected the soil water response. Locations near trees reacted more strongly to event precipitation than those further away ( interactions), although only under generally moister soil conditions (interaction of in Fig. 5c and d). In the subsoil, higher macroporosity (θMP) dampened the soil water response (negative slope; Fig. 5c and d), more so when or where throughfall was high (interactions of and θMP×δPTF in Fig. 5c and d) and in drier locations (interaction of θMP×δθpre in Fig. 5c and d).
4.1 Strengths and weaknesses of the approach
In this analysis, we used extensive spatial data of canopy cover, throughfall and soil water content in order to assess the role of canopy processes in the belowground soil water response to precipitation. For this, we measured precipitation and the soil water content at different locations in order to avoid the disturbance of soil water dynamics due to precipitation measurement and to provide independent random measurement designs. To be able to relate observations at different locations, we used geostatistical methods to predict throughfall values at locations where the soil water content was measured. Throughfall spatial prediction was based on an extensive dataset of a substantial number (n=350) of samplers of comparatively small size (support is A=0.011 m2) in a stratified random design, spanning an extent more than 10 times the correlation lengths of most events. Throughfall showed strong spatial autocorrelation which was reflected by 90 % of the nugget / still ratios being lower than 10 % (Table S3). With the tight sampling at the shortest lag distance (at least 50 locations covered two samplers located directly next to each other), the nugget effect, or unresolved variance, can be attributed to the dispersion variance across the sampler (support) and to the spatial field shifting slightly within the rain event. The choice of the support scale affects the variance estimate, as demonstrated for throughfall by Zuecco et al. (2014). Here, the scale of the sampler and the soil moisture sensors is roughly the same; thus, the variance is appropriately captured for the intended purpose. The spatial correlation depended on the event size in that the correlation length decreased with increasing event rainfall (see the examples in Fig. S4 in the Supplement). In larger events, this decreased the range within which throughfall could be predicted and increased the number of locations with high kriging variance that were removed from the analysis. As a result, this decreased the sample size for large events compared with small and medium sized events. Regardless, for all sampled events, we could still rely on datasets of 59 points on average.
In order to estimate a reliable variogram, we had to remove spatial outliers contaminating the sample, which demonstrates that the throughfall spatial field is not entirely smooth. Outlier locations comprised on average 2.2 % of the spatial sample, were rarely recurring, and were not only related to throughfall hot spots (although they were mainly related to throughfall hot spots for large events). Throughfall hot spots have been related to interrupted flow lines leading to dripping points (Crockford and Richardson, 2000; Herwitz, 1987; Nanko et al., 2022; Staelens et al., 2006; Zimmermann et al., 2009) that can also move around slightly (Keim et al., 2005). In removing these outliers, our analysis neglects the role of dripping points in the soil moisture response. Additionally, kriging tends to smooth the estimates compared with the actual data (Oliver and Webster, 2014). However, the predicted throughfall showed approximately the same median and spatial variance here as the measured data (without outliers), indicating that this was not a concern and that the real variation was captured after the prediction procedure. Unfortunately, there is no perfect way to relate measurements obtained at different locations to each other. However, a large sample size of throughfall, a stratified design, outlier detection with robust variogram estimators and the use of residual maximum likelihood (REML) are established tools for estimating the variogram reliably (Lark, 2000; Voss et al., 2016). The latter provides an essential basis for kriging (Oliver and Webster, 2014). Cross-validation of the kriging estimates against observations (Lark, 2000; Oliver and Webster, 2014) provides further confidence in the variogram and kriging procedure for interpolating the aboveground data to the belowground locations.
In our analysis, we quantified only throughfall input and omitted the role of stemflow, which may play a role in locations near stems. Extrapolating stemflow input to soil moisture locations entails more prediction steps compared with throughfall. The spatial variation in stemflow depends not only on the species, tree and canopy size, neighborhood and individual morphology of the trees (Bellot and Escarre, 1998; Fan et al., 2015a; Levia et al., 2014; Levia and Germer, 2015; Van Stan et al., 2016; Metzger et al., 2019; Magliano et al., 2019) but also on the precipitation intensity and soil conditions determining the infiltration area (Herwitz, 1986; Carlyle-Moses et al., 2018; Metzger et al., 2021). Such a prediction would not only introduce a great deal of uncertainty but would also deviate from the main purpose of this study, which is to evaluate the role of throughfall heterogeneity. Therefore, in the model analysis, microsites near stems were accounted for by including the distance to the stem as a fixed effect in the model. This takes into account, to some extent, the potential influence of stemflow in the interpretation.
4.2 General (temporal and spatial) patterns of throughfall
In agreement with previous studies, the spatial variation coefficients of throughfall decrease with event size (Aussenac, 1970; Loustau et al., 1992; Llorens et al., 1997; Su et al., 2019; Metzger et al., 2017; Carlyle-Moses, 2004; Staelens et al., 2008; Van Stan et al., 2020). Several other studies have suggested that the spatial variation in throughfall depends on the amount of precipitation as well as on canopy characteristics (Loustau et al., 1992; Carlyle-Moses, 2004; Keim et al., 2005; Park and Cameron, 2008; Hsueh et al., 2016; Zimmermann et al., 2009; Herwitz and Slye, 1995). Similarly, at our site, canopy cover was a significant driver of the throughfall spatial distribution for all event size classes, although a small driver compared with the random effects. The spatial trends showed no clear pattern with event size and may have been related to a combination of slope aspect and wind conditions. The correlation length (effective range) of throughfall decreased with increasing event size and roughly corresponded to that of canopy cover for medium events. The change in the spatial pattern with event size underlines that not only canopy storage per se but also other processes like turbulence, wind shadows, the arrangement of canopy gaps or the formation of canopy dripping points can add persistent spatial organization to below-canopy precipitation (Carlyle-Moses, 2004; Keim et al., 2005; Park and Cameron, 2008; Staelens et al., 2008; Zimmermann et al., 2008; Wullaert et al., 2009; Li et al., 2016; Van Stan et al., 2020). Additionally, canopy features also affect within-canopy redistribution (André et al., 2011; Herwitz, 1987; Levia and Frost, 2006; Nanko et al., 2022), which could lead to reoccurring patterns not reflected by canopy density.
Overall, despite the changes in throughfall correlation lengths for different event size classes, throughfall patterns were temporally stable, indicating the existence of permanent hot and cold spots of throughfall, and these hot and cold spots were consistent across small, medium and large events. This is in line with several previous studies that have reported the temporal stability of throughfall patterns (Keim et al., 2005; Staelens et al., 2006; Wullaert et al., 2009; Zimmermann et al., 2009; Fathizadeh et al., 2014; Fan et al., 2015a; Metzger et al., 2017; Molina et al., 2019; Zhu et al., 2021; Rodrigues et al., 2022), even over several years (Wullaert et al., 2009; Rodrigues et al., 2022), although phenology and canopy development have also been observed to deteriorate spatial stability (Zimmermann et al., 2008; Fathizadeh et al., 2014). Furthermore, although spatial variation coefficients are smaller for large events compared with small events, absolute values vary much more in large events such that they have an arguably higher potential to induce spatial patterns in the soil water content or dynamics.
4.3 General soil water content patterns and potential drivers
The mean soil water content was generally lower in the topsoil compared with the subsoil. At our site, the shallow soil is underlain by undulating weathered, calcareous bedrock (Kohlhepp et al., 2017) of low hydraulic conductivity, and it may be locally broken through by tree roots. While the topsoil is well drained (i.e., saturated to field capacity in winter and much lower in summer), the deeper and finer-textured soil layer (Metzger et al., 2021) is influenced by the much less conductive regolith and a generally moister soil water content which very occasionally exceeds field capacity in winter (Metzger et al., 2017).
Much in agreement with previous studies in humid regions (Brocca et al., 2007; Korres et al., 2015; Rosenbaum et al., 2012; Metzger et al., 2017), the spatial variation in the soil water content increased in both the topsoil and subsoil under drier summer soil conditions. In an earlier study at the same site, a strong but short-lived increase in the spatial variation in the topsoil water content in summer was related to precipitation events (Metzger et al., 2017). Regardless, we found that the main controlling factor of the post-event soil water content was the spatial pattern of the pre-event soil water content, while the average throughfall and spatial pattern of throughfall, tree distance, and macroporosity were additional, although much less important, drivers. In other words, although the soil water content variation increases strongly after events, this variation can only be traced back to input patterns in a very limited fashion. This may, in part, be due to the small inputs of water compared with the overall soil water storage, leading to a strong memory effect of the pre-event soil water conditions on the post-event patterns. Furthermore, preferential flow already taking place during the event itself can blur the throughfall pattern within the soil storage (see below).
The soil water content spatial patterns in a drained state, in turn, were strongly driven by random effects. Those are factors that were not described by the measurements but that are temporally stable. These so-called local soil conditions are potentially related to soil hydraulic properties, root water uptake and microtopography (Famiglietti et al., 1998; Vereecken et al., 2007; Fan et al., 2015b). The mixed-effects models confirm, although with a very weak influence, that locations of higher macroporosity were drier at both depths, confirming the role of water retention in soil water patterns (Metzger et al., 2017) at this site. Moreover, the throughfall patterns of the previous event slightly affected the topsoil pre-event soil water content. Thus, an imprint of the throughfall pattern was carried over to the next pre-event soil conditions, but this is barely detectable and is negligible compared with the other sources of variation in the soil water content in a drained state.
4.4 Drivers of the soil water response (Δθ) to rainfall
In contrast to the absolute soil water content values discussed above, the local soil water response (i.e., increase in the soil water content following rainfall events) was clearly affected by the spatial throughfall pattern in both topsoil and subsoil, although this effect was modified by soil properties. As we tested the effect of the spatial pattern (δPTF) separately from the absolute values of event throughfall (), we are able to demonstrate the influence of spatial throughfall fields specifically. Among all of the drivers tested, the influence of spatial throughfall variation was not necessarily the strongest, but it was a consistently reoccurring factor. It appeared at both observed soil depths with a similar influence and was more pronounced for larger events. In other words, the spatial variation in the throughfall was a consistent driver of soil wetting.
Measurements ascertaining that the soil water content response is related to canopy drainage patterns are comparatively rare. Metzger et al. (2017) previously reported, for the same site but using a smaller dataset, that increases in the soil water content were correlated with event spatial throughfall patterns during larger rainfall events. Furthermore, Molina et al. (2019), using high-temporal-resolution soil moisture measurements, found a relationship between the average throughfall pattern and the soil water content response in the topsoil of a Mediterranean oak-dominated forest plot but not in a pine plot. Notably, Klos et al. (2014) showed that locations of high and low soil water content below the main rooting zone in a tropical rainforest corresponded to the end-members of high and low throughfall, whereas the soil water content above and below this depth was more homogenous. They concluded, from additional modeling, that preferential flow may have contributed to bypassing the main rooting zone. On the other hand, several studies, such as Raat et al. (2002), Shachnovich et al. (2008), and, more recently, Zhu et al. (2021) using lower-temporal-resolution soil water content measurements (incidentally all in coniferous forests) found no relationships between the spatial patterns of the soil water content and throughfall. All authors reported that the throughfall patterns were pronounced and stable in time and suggest that the forests floor impeded the transfer to soil water patterns. An additional explanation could be that the effect of spatial net precipitation patterns on the soil water content was so short-lived due to preferential flow (Metzger et al., 2017) that it was not observed by infrequent hand measurements. Overall, the stronger soil water response at sites with above-average throughfall indicates that throughfall hot spots and cold spots (Levia and Frost, 2006; Van Stan et al., 2020; Zimmermann et al., 2009) have an impact on the soil water dynamics, although they go almost unnoticed in the soil water content pattern (see above).
In addition to the throughfall pattern, the soil water response after large rainfall events also depended on the pattern of the pre-event soil water content at both depths. Notably, the slope of the relationship changes direction, making it the only factor that shows inverse effects in the top- and subsoil. This can be attributed to its interdependence on the soil water content and the difference in moisture between the two measurement depths. Especially under dry (summer) conditions, wetter topsoil locations stored more of the incoming precipitation water, while drier sites remained dry. This is a strong indication of preferential flow in dry soils, where, for example, hydrophobic conditions, cracks and low hydraulic conductivity of the matrix can enhance preferential flow (Hillel, 1998; Nimmo, 2021; Beven and Germann, 2013). On the other hand, the dampened water response in the wetter subsoil could be due to enhanced hydraulic conductivity and less free pore space (Vereecken et al., 2007; Hagen et al., 2020). It is noteworthy that effects under dry conditions are much stronger than under wet conditions, suggesting a stronger trigger for preferential flow there. Moreover, only at intermediate soil moisture conditions, the spatial distribution of pre-event soil water content had no influence on the spatial drainage behavior.
The soil water response also depended on the distance to the nearest tree in the topsoil and on soil properties (macroporosity) in the subsoil. The enhanced moistening of soils near stems is likely related to stemflow production (Metzger et al., 2019), which was not accounted for as input. Stemflow production generally increases with event size (Levia and Germer, 2015; Metzger et al., 2019), explaining the interaction in the model. The additional modification due to the soil water conditions can be explained by the systematically lower soil water content near tree trunks at the same site (Metzger et al., 2017, 2021), owing to lower soil water retention and likely enhanced drainage there.
Taken together, our data strongly suggest that, in addition to the spatial distribution of throughfall, the spatial pattern in drainage behavior affects the local soil water response to rainfall. Thus, both dry and wet locations can, water supply permitting, act as percolation hot spots, depending on the overall soil conditions. Bypass flow in forests has been repeatedly observed (e.g., Schume et al., 2003; Schwärzel et al., 2009; Bachmair et al., 2012; Blume et al., 2009; Demand et al., 2019), especially under dry summer conditions (Schume et al., 2003; Bachmair et al., 2012; Demand et al., 2019). The spatial variation in the infiltration water supply and intensity, such as is the case for below-canopy precipitation (Keim and Link, 2018), has been suggested as a potential cause of the initiation of finger flow (Nimmo, 2021), which is promoted by dry soil conditions. Moreover, hydrophobicity has been suggested to contribute to maintaining recurring finger flow paths (Blume et al., 2009). Furthermore, macropore flow along biopores (Lange et al., 2009; Nespoulous et al., 2019) and soil cracks (Schume et al., 2003) can be enhanced under dry forest soil conditions due to soil shrinking (Baram et al., 2012). While both finger flow and macropore flow may have contributed to the observed patterns in soil water response, macropore flow (more than finger flow) could explain enhanced matter export (Lehmann et al., 2021) as well as the fast response following the strong storms observed in the shallow aquifers of the AquaDiva Critical Zone Observatory (Lehmann and Totsche, 2020).
Overall, our results confirm that the effect of throughfall on the soil water content is weak, but this effect is stronger on the soil water response. This contrasts with previous modeling work (Coenders-Gerrits et al., 2013) that did not account for preferential flow. As the effect of the throughfall pattern on the soil water response also depends on local conditions related to hydraulic properties, its fate is much more likely to be found in the drainage fluxes, rather than the soil water storage. The further destiny of the net precipitation pattern arguably depends on the deeper subsurface hydrogeological setting. We deduce, however, that net precipitation hot spots have a strong chance of producing patterns of preferential flow below the main rooting zone, which is in line with previous work (Klos et al., 2014) and backs earlier hypotheses (Bouten et al., 1992; Schume et al., 2003).
In this study, we collected an extensive dataset to investigate the effect of throughfall spatial heterogeneity on the soil water response and checked which other factors (e.g., pre-event soil water content, macroporosity, and tree distance) modified the result. We first confirmed that throughfall patterns were stable in time and found that they related to the vegetation canopy density, although additional and partly unknown factors strongly affected throughfall distribution. We found that the post-event soil water content did have a very weak intrinsic relation to throughfall, although the variation in the soil water content clearly increased in the aftermath of rain events. The post-event soil water content pattern was overwhelmingly determined by the strong memory effect of the soil water storage and only slightly affected by soil properties, like macroporosity. In contrast, the soil water response showed a clear relation with the throughfall input pattern. In other words, our setup allowed us to confirm experimentally that throughfall patterns do imprint on soil water content dynamics, at least shortly after rain events. However, we also identified locations where the soil water response was dampened, likely due to enhanced fast drainage. These locations could be either very dry locations, likely promoting preferential flow, especially in the topsoil, or wet locations, promoting faster release of the incoming water. Our results demonstrate that throughfall spatial patterns leave a stronger imprint on soil water dynamics than on the soil water content directly, and they explain why the aboveground influence on soil hydrology has been so difficult to lay open in the past. Our findings are in line with previous research and contribute a more general process understanding of the belowground consequences of precipitation redistribution by forests. Most importantly, our results strongly suggest that throughfall patterns induce fast soil water flow with repeating spatial patterns. These patterns would, therefore, already be triggered within the canopy.
The event-based data on rainfall and throughfall (https://doi.org/10.5281/zenodo.8070279, Metzger and Hildebrandt, 2023) and on the soil water content response (https://doi.org/10.5281/zenodo.8063928, Fischer-Bedtke et al., 2023) for the rainfall events used in this work are available on Zenodo. They are supplemented by data on the experimental design, e.g., the locations of the throughfall measurement points and their attributes, including canopy cover (https://doi.org/10.5281/zenodo.8070196, Metzger et al., 2023a), and the soil moisture measurement points and their attributes, including soil hydraulic properties (https://doi.org/10.5281/zenodo.8065170, Metzger et al., 2023b).
The supplement related to this article is available online at: https://doi.org/10.5194/hess-27-2899-2023-supplement.
AH developed the project idea. All authors contributed to the collection of the raw data. CFB conducted the statistical analysis with valuable input from AH. CFB and AH wrote the first draft of the manuscript. All authors contributed to discussions and manuscript preparation.
At least one of the (co-)authors is a member of the editorial board of Hydrology and Earth System Sciences. The peer-review process was guided by an independent editor, and the authors also have no other competing interests to declare.
Publisher's note: Copernicus Publications remains neutral with regard to jurisdictional claims in published maps and institutional affiliations.
The authors wish to thank Murray Lark for insightful comments on the strategy for comparing above- and belowground spatial patterns that helped to shape the geostatistical analysis. We are also grateful to Beate and Alexander Zimmermann for sharing their insights, workflow and routines for variogram prediction with us. Moreover, we acknowledge the two anonymous reviewers for insightful and constructive feedback that improved this paper.
This study is part of the Collaborative Research Centre AquaDiva, Friedrich Schiller University Jena. We thank the Hainich CZE site manager, Robert Lehmann, and the Hainich National Park. Fieldwork permits were issued by the responsible state environmental offices of Thuringia.
This research has been supported by the Deutsche Forschungsgemeinschaft (DFG, German Research Foundation; grant no. SFB 1076, project no. 218627073).
The article processing charges for this open-access publication were covered by the Helmholtz Centre for Environmental Research – UFZ.
This paper was edited by Nadia Ursino and reviewed by two anonymous referees.
André, F., Jonard, M., Jonard, F., and Ponette, Q.: Spatial and temporal patterns of throughfall volume in a deciduous mixed-species stand, J. Hydrol., 400, 244–254, https://doi.org/10.1016/j.jhydrol.2011.01.037, 2011.
Aussenac, G.: Action du couvert forestier sur la distribution au sol des précipitations, Ann. Sci. Forest., 27, 383–399, https://doi.org/10.1051/forest/19700403, 1970.
Bachmair, S., Weiler, M., and Troch, P. A.: Intercomparing hillslope hydrological dynamics: Spatio-temporal variability and vegetation cover effects, Water Resour. Res., 48, 1–18, https://doi.org/10.1029/2011WR011196, 2012.
Baram, S., Kurtzman, D., and Dahan, O.: Water percolation through a clayey vadose zone, J. Hydrol., 424–425, 165–171, https://doi.org/10.1016/j.jhydrol.2011.12.040, 2012.
Bárdossy, A. and Kundzewicz, Z. W.: Geostatistical methods for detection of outliers in groundwater quality spatial fields, J. Hydrol., 115, 343–359, https://doi.org/10.1016/0022-1694(90)90213-H, 1990.
Bartón, K.: MuMIn: Multi-Model Inference, R package version 1.43.17, https://CRAN.R-project.org/src/contrib/Archive/MuMIn/ (last access: 2 February 2022), 2020.
Bates, D., Mächler, M., Bolker, B., and Walker, S.: Fitting Linear Mixed-Effects Models Using lme4, J. Stat. Softw., 67, 1–48, https://doi.org/10.18637/jss.v067.i01, 2015.
Bellot, J. and Escarre, A.: Stemflow and throughfall determination in a resprouted Mediterranean holm-oak forest, Ann. Sci. Forest., 55, 847–865, https://doi.org/10.1051/forest:19980708, 1998.
Beven, K. and Germann, P.: Macropores and water flow in soils revisited, Water Resour. Res., 49, 3071–3092, https://doi.org/10.1002/wrcr.20156, 2013.
Blume, T., Zehe, E., and Bronstert, A.: Use of soil moisture dynamics and patterns at different spatio-temporal scales for the investigation of subsurface flow processes, Hydrol. Earth Syst. Sci., 13, 1215–1233, https://doi.org/10.5194/hess-13-1215-2009, 2009.
Bogena, H. R., Herbst, M., Huisman, J. A., Rosenbaum, U., Weuthen, A., and Vereecken, H.: Potential of Wireless Sensor Networks for Measuring Soil Water Content Variability, Vadoze Zone J., 9, 1002–1013, https://doi.org/10.2136/vzj2009.0173, 2010.
Bonett, D. G.: Confidence interval for a coefficient of quartile variation, Comput. Stat. Data An., 50, 2953–2957, https://doi.org/10.1016/j.csda.2005.05.007, 2006.
Bouten, W., Heimovaara, T. J., and Tiktak, A.: Spatial patterns of throughfall and soil water dynamics in a Douglas fir stand, Water Resour. Res., 28, 3227–3233, https://doi.org/10.1029/92WR01764, 1992.
Brocca, L., Morbidelli, R., Melone, F., and Moramarco, T.: Soil moisture spatial variability in experimental areas of central Italy, J. Hydrol., 333, 356–373, https://doi.org/10.1016/j.jhydrol.2006.09.004, 2007.
Brown, A. E., Zhang, L., McMahon, T. A., Western, A. W., and Vertessy, R. A.: A review of paired catchment studies for determining changes in water yield resulting from alterations in vegetation, J. Hydrol., 310, 28–61, https://doi.org/10.1016/j.jhydrol.2004.12.010, 2005.
Carlyle-Moses, D. E.: Throughfall, stemflow, and canopy interception loss fluxes in a semi-arid Sierra Madre Oriental matorral community, J. Arid Environ., 58, 181–202, https://doi.org/10.1016/S0140-1963(03)00125-3, 2004.
Carlyle-Moses, D. E. and Gash, J. H. C.: Rainfall Interception Loss by Forest Canopies, in: Forest Hydrology and Biogeochemistry: Synthesis of Past Research and Future Directions, Ecological Studies 216, edited by: Levia, D. F., Carlyle-Moses, D. E., and Tanaka, T., Spinger Science+Business Media, 407–423, https://doi.org/10.1007/978-94-007-1363-5, 2011.
Carlyle-Moses, D. E., Iida, S., Germer, S., Llorens, P., Michalzik, B., Nanko, K., Tischer, A., and Levia, D. F.: Expressing stemflow commensurate with its ecohydrological importance, Adv. Water Resour., 121, 472–479, https://doi.org/10.1016/j.advwatres.2018.08.015, 2018.
Coenders-Gerrits, A. M. J., Hopp, L., Savenije, H. H. G., and Pfister, L.: The effect of spatial throughfall patterns on soil moisture patterns at the hillslope scale, Hydrol. Earth Syst. Sci., 17, 1749–1763, https://doi.org/10.5194/hess-17-1749-2013, 2013.
Cressie, N. and Hawkins, D. M.: Robust estimation of the variogram: I, Math. Geol., 12, 115–125, https://doi.org/10.1007/BF01035243, 1980.
Crockford, R. H. and Richardson, D. P.: Partitioning of rainfall into throughfall, stemflow and interception: effect of forest type, ground cover and climate, Hydrol. Process., 14, 2903–2920, https://doi.org/10.1002/1099-1085(200011/12)14:16/17<2903::AID-HYP126>3.0.CO;2-6, 2000.
Demand, D., Blume, T., and Weiler, M.: Spatio-temporal relevance and controls of preferential flow at the landscape scale, Hydrol. Earth Syst. Sci., 23, 4869–4889, https://doi.org/10.5194/hess-23-4869-2019, 2019.
Dowd, P. A.: The Variogram and Kriging: Robust and Resistant Estimators, in: Geostatistics for Natural Resources Characterization: Part 1, edited by: Verly, G., David, M., Journel, A. G., and Marechal, A., Springer Netherlands, Dordrecht, 91–106, https://doi.org/10.1007/978-94-009-3699-7_6, 1984.
Durocher, M. G.: Monitoring spatial variability of forest interception, Hydrol. Process., 4, 215–229, 1990.
Falkengren-Grerup, U.: Effect of stemflow on beech forest soils and vegetation in southern Sweden, Plant Ecol., 26, 341–352, 1989.
Famiglietti, J. S., Rudnicki, J. W., and Rodell, M.: Variability in surface moisture content along a hillslope transect: Rattlesnake Hill, Texas, J. Hydrol., 210, 259–281, https://doi.org/10.1016/S0022-1694(98)00187-5, 1998.
Fan, J., Oestergaard, K. T., Guyot, A., Jensen, D. G., and Lockington, D. A.: Spatial variability of throughfall and stemflow in an exotic pine plantation of subtropical coastal Australia, Hydrol. Process., 29, 793–804, https://doi.org/10.1002/hyp.10193, 2015a.
Fan, J., Scheuermann, A., Guyot, A., Baumgartl, T., and Lockington, D. A.: Quantifying spatiotemporal dynamics of root-zone soil water in a mixed forest on subtropical coastal sand dune using surface ERT and spatial TDR, J. Hydrol., 523, 475–488, https://doi.org/10.1016/j.jhydrol.2015.01.064, 2015b.
Fathizadeh, O., Attarod, P., Keim, R. F., Stein, A., Amiri, G. Z., and Darvishsefat, A. A.: Spatial heterogeneity and temporal stability of throughfall under individual Quercus brantii trees, Hydrol. Process., 28, 1124–1136, https://doi.org/10.1002/hyp.9638, 2014.
Fischer-Bedtke, C., Hildebrandt, A., and Metzger, J. C.: Soil water content before and after rain events, May–July 2014–2016, Hainich, Germany, project AquaDiva (1.0.0), Zenodo [data set], https://doi.org/10.5281/zenodo.8063928, 2023.
Genton, M. G.: Highly Robust Variogram Estimation, Math. Geol., 30, 213–221, https://doi.org/10.1023/A:1021728614555, 1998.
Germer, S.: Development of near-surface perched water tables during natural and artificial stemflow generation by babassu palms, J. Hydrol., 507, 262–272, https://doi.org/10.1016/j.jhydrol.2013.10.026, 2013.
Gerrits, A. M. J. and Savenije, H. H. G.: Forest Floor Interception, in: Forest Hydrology and Biogeochemistry: Synthesis of Past Research and Future Directions, edited by: Levia, D. F., Carlyle-Moses, D., and Tanaka, T., Springer Netherlands, Dordrecht, 445–454, https://doi.org/10.1007/978-94-007-1363-5_22, 2011.
Graham, M. H.: Confronting multicollinearity in ecological multiple regression, Ecology, 84, 2809–2815, https://doi.org/10.1890/02-3114, 2003.
Gräler, B., Pebesma, E., and Heuvelink, G.: Spatio-Temporal Interpolation using gstat, R J., 8, 204–218, 2016.
Guswa, A. J.: Canopy vs. Roots: Production and Destruction of Variability in Soil Moisture and Hydrologic Fluxes, Vadose Zone J., 11, vzj2011.0159, https://doi.org/10.2136/vzj2011.0159, 2012.
Guswa, A. J. and Spence, C. M.: Effect of throughfall variability on recharge: Application to hemlock and deciduous forests in western Massachusetts, Ecohydrology, 5, 563–574, https://doi.org/10.1002/eco.281, 2012.
Guswa, A. J., Tetzlaff, D., Selker, J. S., Carlyle-Moses, D. E., Boyer, E. W., Bruen, M., Cayuela, C., Creed, I. F., van de Giesen, N., Grasso, D., Hannah, D. M., Hudson, J. E., Hudson, S. A., Iida, S., Jackson, R. B., Katul, G. G., Kumagai, T., Llorens, P., Lopes Ribeiro, F., Michalzik, B., Nanko, K., Oster, C., Pataki, D. E., Peters, C. A., Rinaldo, A., Sanchez Carretero, D., Trifunovic, B., Zalewski, M., Haagsma, M., and Levia, D. F.: Advancing ecohydrology in the 21st century: A convergence of opportunities, Ecohydrology, 13, 1–14, https://doi.org/10.1002/eco.2208, 2020.
Hagen, K., Berger, A., Gartner, K., Geitner, C., Kofler, T., Kogelbauer, I., Kohl, B., Markart, G., Meißl, G., and Niedertscheider, K.: Event-based dynamics of the soil water content at Alpine sites (Tyrol, Austria), Catena, 194, 104682, https://doi.org/10.1016/j.catena.2020.104682, 2020.
Herwitz, S. R.: Infiltration-excess caused by Stemflow in a cyclone-prone tropical rainforest, Earth Surf. Proc. Land., 11, 401–412, https://doi.org/10.1002/esp.3290110406, 1986.
Herwitz, S. R.: Raindrop impact and water flow on the vegetative surfaces of trees and the effects on stemflow and throughfall generation, Earth Surf. Proc. Land., 12, 425–432, https://doi.org/10.1002/esp.3290120408, 1987.
Herwitz, S. R. and Slye, R. E.: Three-dimensional modeling of canopy tree interception of wind-driven rainfall, J. Hydrol., 168, 205–226, https://doi.org/10.1016/0022-1694(94)02643-P, 1995.
Hillel, D.: Environmental Soil Physics, Academic Press, Boston, 771 pp., ISBN 978-0-12-348525-0, 1998.
Horton, R. E.: Rainfall Interception, Mon. Weather Rev., 47, 603–623, https://doi.org/10.1175/1520-0493(1919)47<603:RI>2.0.CO;2, 1919.
Hsueh, Y. H., Allen, S. T., and Keim, R. F.: Fine-scale spatial variability of throughfall amount and isotopic composition under a hardwood forest canopy, Hydrol. Process., 30, 1796–1803, https://doi.org/10.1002/hyp.10772, 2016.
Keim, R., Skaugset, A., and Weiler, M.: Temporal persistence of spatial patterns in throughfall, J. Hydrol., 314, 263–274, https://doi.org/10.1016/j.jhydrol.2005.03.021, 2005.
Keim, R. F. and Link, T. E.: Linked spatial variability of throughfall amount and intensity during rainfall in a coniferous forest, Agr. Forest Meteorol., 248, 15–21, https://doi.org/10.1016/j.agrformet.2017.09.006, 2018.
Kimmins, J. P.: Some Statistical Aspects of Sampling Throughfall Precipitation in Nutrient Cycling Studies in British Columbian Coastal Forests, Ecology, 54, 1008–1019, https://doi.org/10.2307/1935567, 1973.
Klos, P. Z., Chain-Guadarrama, A., Link, T. E., Finegan, B., Vierling, L. A., and Chazdon, R.: Throughfall heterogeneity in tropical forested landscapes as a focal mechanism for deep percolation, J. Hydrol., 519, 2180–2188, https://doi.org/10.1016/j.jhydrol.2014.10.004, 2014.
Kohlhepp, B., Lehmann, R., Seeber, P., Küsel, K., Trumbore, S. E., and Totsche, K. U.: Aquifer configuration and geostructural links control the groundwater quality in thin-bedded carbonate–siliciclastic alternations of the Hainich CZE, central Germany, Hydrol. Earth Syst. Sci., 21, 6091–6116, https://doi.org/10.5194/hess-21-6091-2017, 2017.
Korres, W., Reichenau, T. G., Fiener, P., Koyama, C. N., Bogena, H. R., Cornelissen, T., Baatz, R., Herbst, M., Diekkrüger, B., Vereecken, H., and Schneider, K.: Spatio-temporal soil moisture patterns – A meta-analysis using plot to catchment scale data, J. Hydrol., 520, 326–341, https://doi.org/10.1016/j.jhydrol.2014.11.042, 2015.
Küsel, K., Totsche, K. U., Trumbore, S. E., Lehmann, R., Steinhäuser, C., and Herrmann, M.: How Deep Can Surface Signals Be Traced in the Critical Zone? Merging Biodiversity with Biogeochemistry Research in a Central German Muschelkalk Landscape, Front. Earth Sci., 4, 1–18, https://doi.org/10.3389/feart.2016.00032, 2016.
Kuznetsova, A., Brockhoff, P. B., and Christensen, R. H. B.: lmerTest Package: Tests in Linear Mixed Effects Models, J. Stat. Softw., 82, 1–26, https://doi.org/10.18637/jss.v082.i13, 2017.
Lange, B., Lüescher, P., and Germann, P. F.: Significance of tree roots for preferential infiltration in stagnic soils, Hydrol. Earth Syst. Sci., 13, 1809–1821, https://doi.org/10.5194/hess-13-1809-2009, 2009.
Lark, R. M.: A comparison of some robust estimators of the variogram for use in soil survey, Eur. J. Soil Sci., 51, 137–157, https://doi.org/10.1046/j.1365-2389.2000.00280.x, 2000.
Lark, R. M.: Modelling complex soil properties as contaminated regionalized variables, Geoderma, 106, 173–190, https://doi.org/10.1016/S0016-7061(01)00123-9, 2002.
Lehmann, K., Lehmann, R., and Totsche, K. U.: Event-driven dynamics of the total mobile inventory in undisturbed soil account for significant fluxes of particulate organic carbon, Sci. Total Environ., 756, 143774, https://doi.org/10.1016/j.scitotenv.2020.143774, 2021.
Lehmann, R. and Totsche, K. U.: Multi-directional flow dynamics shape groundwater quality in sloping bedrock strata, J. Hydrol., 580, 124291, https://doi.org/10.1016/j.jhydrol.2019.124291, 2020.
Levia, D. F. and Frost, E. E.: Variability of throughfall volume and solute inputs in wooded ecosystems, Progress in Physical Geography: Earth and Environment, 30, 605–632, https://doi.org/10.1177/0309133306071145, 2006.
Levia, D. F. and Germer, S.: A review of stemflow generation dynamics and stemflow-environment interactions in forests and shrublands, Rev. Geophys., 53, 673–714, https://doi.org/10.1002/2015RG000479, 2015.
Levia, D. F., Michalzik, B., Näthe, K., Bischoff, S., Richter, S., and Legates, D. R.: Differential stemflow yield from European beech saplings: The role of individual canopy structure metrics, Hydrol. Process., 40, 43–51, https://doi.org/10.1002/hyp.10124, 2014.
Li, X., Xiao, Q., Niu, J., Dymond, S., van Doorn, N. S., Yu, X., Xie, B., Lv, X., Zhang, K., and Li, J.: Process-based rainfall interception by small trees in Northern China: The effect of rainfall traits and crown structure characteristics, Agr. Forest Meteorol., 218–219, 65–73, https://doi.org/10.1016/j.agrformet.2015.11.017, 2016.
Liang, W. L., Li, S. L., and Hung, F. X.: Analysis of the contributions of topographic, soil, and vegetation features on the spatial distributions of surface soil moisture in a steep natural forested headwater catchment, Hydrol. Process., 31, 3796–3809, https://doi.org/10.1002/hyp.11290, 2017.
Liang, W.-L., Kosugi, K., and Mizuyama, T.: Heterogeneous Soil Water Dynamics around a Tree Growing on a Steep Hillslope, Vadose Zone J., 6, 879–889, https://doi.org/10.2136/vzj2007.0029, 2007.
Llorens, P., Poch, R., Latron, J., and Gallart, F.: Rainfall interception by a Pinus sylvestris forest patch overgrown in a Mediterranean mountainous abandoned area I. Monitoring design and results down to the event scale, J. Hydrol., 199, 331–345, https://doi.org/10.1016/S0022-1694(96)03334-3, 1997.
Lloyd, C. R. and Marques, A. D. O.: Spatial variability of throughfall and stemflow measurements in Amazonian rainforest, Agr. Forest Meteorol., 42, 63–73, https://doi.org/10.1016/0168-1923(88)90067-6, 1988.
Loustau, D., Berbigier, P., and Granier, A.: Interception loss, throughfall and stemflow in a maritime pine stand. II. An application of Gash's analytical model of interception, J. Hydrol., 138, 469–485, https://doi.org/10.1016/0022-1694(92)90131-E, 1992.
Magliano, P. N., Whitworth-Hulse, J. I., Florio, E. L., Aguirre, E. C., and Blanco, L. J.: Interception loss, throughfall and stemflow by Larrea divaricata: The role of rainfall characteristics and plant morphological attributes, Ecol. Res., 34, 753–764, https://doi.org/10.1111/1440-1703.12036, 2019.
Matheron, G.: Traité de géostatistique appliquée, Éditions Technip, Paris, 333 pp., https://www.sudoc.fr/004651340 (last access: 24 July 2023), 1962.
Metzger, J. C. and Hildebrandt, A.: Throughfall and rain event data, May–July 2014–2016, Hainich, Germany, project AquaDiva, Zenodo [data set], https://doi.org/10.5281/zenodo.8070279, 2023.
Metzger, J. C., Wutzler, T., Dalla Valle, N., Filipzik, J., Grauer, C., Lehmann, R., Roggenbuck, M., Schelhorn, D., Weckmüller, J., Küsel, K., Totsche, K. U., Trumbore, S., and Hildebrandt, A.: Vegetation impacts soil water content patterns by shaping canopy water fluxes and soil properties, Hydrol. Process., 31, 3783–3795, https://doi.org/10.1002/hyp.11274, 2017.
Metzger, J. C., Schumacher, J., Lange, M., and Hildebrandt, A.: Neighbourhood and stand structure affect stemflow generation in a heterogeneous deciduous temperate forest, Hydrol. Earth Syst. Sci., 23, 4433–4452, https://doi.org/10.5194/hess-23-4433-2019, 2019.
Metzger, J. C., Filipzik, J., Michalzik, B., and Hildebrandt, A.: Stemflow Infiltration Hotspots Create Soil Microsites Near Tree Stems in an Unmanaged Mixed Beech Forest, Frontiers in Forests and Global Change, 4, 1–14, https://doi.org/10.3389/ffgc.2021.701293, 2021.
Metzger, J. C., Hildebrandt, A., and Filipzik, J.: High-resolution throughfall measurement design, Hainich, Germany, project AquaDiva, Zenodo [data set], https://doi.org/10.5281/zenodo.8070196, 2023a.
Metzger, J. C., Hildebrandt, A., and Filipzik, J.: Soil moisture sensor network, design, location attributes and soil properties, Hainich, Germany, project AquaDiva, Zenodo [data set], https://doi.org/10.5281/zenodo.8065170, 2023b.
Molina, A. J., Llorens, P., Garcia-Estringana, P., Moreno de las Heras, M., Cayuela, C., Gallart, F., and Latron, J.: Contributions of throughfall, forest and soil characteristics to near-surface soil water-content variability at the plot scale in a mountainous Mediterranean area, Sci. Total Environ., 647, 1421–1432, https://doi.org/10.1016/j.scitotenv.2018.08.020, 2019.
Murray, S. J.: Trends in 20th century global rainfall interception as simulated by a dynamic global vegetation model: Implications for global water resources, Ecohydrology, 7, 102–114, https://doi.org/10.1002/eco.1325, 2014.
Nakagawa, S. and Schielzeth, H.: A general and simple method for obtaining R2 from generalized linear mixed-effects models, Methods Ecol. Evol., 4, 133–142, https://doi.org/10.1111/j.2041-210x.2012.00261.x, 2013.
Nanko, K., Keim, R. F., Hudson, S. A., and Levia, D. F.: Throughfall drop sizes suggest canopy flowpaths vary by phenophase, J. Hydrol., 612, 128144, https://doi.org/10.1016/j.jhydrol.2022.128144, 2022.
Nespoulous, J., Merino-Martín, L., Monnier, Y., Bouchet, D. C., Ramel, M., Dombey, R., Viennois, G., Mao, Z., Zhang, J.-L., Cao, K.-F., Le Bissonnais, Y., Sidle, R. C., and Stokes, A.: Tropical forest structure and understorey determine subsurface flow through biopores formed by plant roots, Catena, 181, 104061, https://doi.org/10.1016/j.catena.2019.05.007, 2019.
Nimmo, J. R.: The processes of preferential flow in the unsaturated zone, Soil Sci. Soc. Am. J., 85, 1–27, https://doi.org/10.1002/saj2.20143, 2021.
Oda, T., Egusa, T., Ohte, N., Hotta, N., Tanaka, N., Green, M. B., and Suzuki, M.: Effects of changes in canopy interception on stream runoff response and recovery following clear-cutting of a Japanese coniferous forest in Fukuroyamasawa Experimental Watershed in Japan, Hydrol. Process., 35, 1–14, https://doi.org/10.1002/hyp.14177, 2021.
Oliver, M. A. and Webster, R.: A tutorial guide to geostatistics: Computing and modelling variograms and kriging, Catena, 113, 56–69, https://doi.org/10.1016/j.catena.2013.09.006, 2014.
Papritz, A.: georob: Robust Geostatistical Analysis of Spatial Data, R package version 0.3-13, https://CRAN.R-project.org/package=georob (last access: 28 March 2020), 2020.
Park, A. and Cameron, J. L.: The influence of canopy traits on throughfall and stemflow in five tropical trees growing in a Panamanian plantation, Forest Ecol. Manag., 255, 1915–1925, https://doi.org/10.1016/j.foreco.2007.12.025, 2008.
Pebesma, E. J.: Multivariable geostatistics in S: the gstat package, Comput. Geosci., 30, 683–691, https://doi.org/10.1016/j.cageo.2004.03.012, 2004.
Pressland, A. J.: Soil Moisture Redistribution as Affected by Throughfall and Stemflow in an Arid Zone Shrub Community, Aust. J. Bot., 24, 641–649, 1976.
Raat, K. J., Draaijers, G. P. J., Schaap, M. G., Tietema, A., and Verstraten, J. M.: Spatial variability of throughfall water and chemistry and forest floor water content in a Douglas fir forest stand, Hydrol. Earth Syst. Sci., 6, 363–374, https://doi.org/10.5194/hess-6-363-2002, 2002.
R Core Team: R: A Language and Environment for Statistical Computing, R Foundation for Statistical Computing, Vienna, Austria, 2016.
Ribeiro Jr., P. J. and Diggle, P. J.: geoR: A Package for Geostatistical Analysis, R-NEWS, 1, 15–18, 2001.
Rodrigues, A. F., Terra, M. C. N. S., Mantovani, V. A., Cordeiro, N. G., Ribeiro, J. P. C., Guo, L., Nehren, U., Mello, J. M., and Mello, C. R.: Throughfall spatial variability in a neotropical forest: Have we correctly accounted for time stability?, J. Hydrol., 608, 127632, https://doi.org/10.1016/j.jhydrol.2022.127632, 2022.
Rosenbaum, U., Bogena, H. R., Herbst, M., Huisman, J. A., Peterson, T. J., Weuthen, A., Western, A. W., and Vereecken, H.: Seasonal and event dynamics of spatial soil moisture patterns at the small catchment scale, Water Resour. Res., 48, W10544, https://doi.org/10.1029/2011WR011518, 2012.
Savenije, H. H. G.: The importance of interception and why we should delete the term evapotranspiration from our vocabulary, Hydrol. Process., 18, 1507–1511, https://doi.org/10.1002/hyp.5563, 2004.
Schrumpf, M., Kaiser, K., and Schulze, E.-D.: Soil Organic Carbon and Total Nitrogen Gains in an Old Growth Deciduous Forest in Germany, PLoS ONE, 9, e89364, https://doi.org/10.1371/journal.pone.0089364, 2014.
Schume, H., Jost, G., and Katzensteiner, K.: Spatio-temporal analysis of the soil water content in a mixed Norway spruce (Picea abies (L.) Karst.)-European beech (Fagus sylvatica L.) stand, Geoderma, 112, 273–287, https://doi.org/10.1016/S0016-7061(02)00311-7, 2003.
Schwärzel, K., Menzer, A., Clausnitzer, F., Spank, U., Häntzschel, J., Grünwald, T., Köstner, B., Bernhofer, C., and Feger, K. H.: Soil water content measurements deliver reliable estimates of water fluxes: A comparative study in a beech and a spruce stand in the Tharandt forest (Saxony, Germany), Agr. Forest Meteorol., 149, 1994–2006, https://doi.org/10.1016/j.agrformet.2009.07.006, 2009.
Shachnovich, Y., Berliner, P. R., and Bar, P.: Rainfall interception and spatial distribution of throughfall in a pine forest planted in an arid zone, J. Hydrol., 349, 168–177, https://doi.org/10.1016/j.jhydrol.2007.10.051, 2008.
Staelens, J., De Schrijver, A., Verheyen, K., and Verhoest, N. E. C.: Spatial variability and temporal stability of throughfall water under a dominant beech (Fagus sylvatica L.) tree in relationship to canopy cover, J. Hydrol., 330, 651–662, https://doi.org/10.1016/j.jhydrol.2006.04.032, 2006.
Staelens, J., De Schrijver, A., Verheyen, K., and Verhoest, N. E. C.: Rainfall partitioning into throughfall, stemflow, and interception within a single beech (Fagus sylvatica L.) canopy: influence of foliation, rain event characteristics, and meteorology, Hydrol. Process., 22, 33–45, https://doi.org/10.1002/hyp.6610, 2008.
Su, L., Xie, Z., Xu, W., and Zhao, C.: Variability of throughfall quantity in a mixed evergreen-deciduous broadleaved forest in central China, J. Hydrol. Hydromech., 67, 225–231, https://doi.org/10.2478/johh-2019-0008, 2019.
Vachaud, G., Passerat De Silans, A., Balabanis, P., and Vauclin, M.: Temporal Stability of Spatially Measured Soil Water Probability Density Function, Soil Sci. Soc. Am. J., 49, 822–828, https://doi.org/10.2136/sssaj1985.03615995004900040006x, 1985.
Van Stan, J. T., Lewis, E. S., Hildebrandt, A., Rebmann, C., and Friesen, J.: Impact of interacting bark structure and rainfall conditions on stemflow variability in a temperate beech-oak forest, central Germany, Hydrolog. Sci. J., 61, 2071–2083, https://doi.org/10.1080/02626667.2015.1083104, 2016.
Van Stan, J. T., Hildebrandt, A., Friesen, J., Metzger, J. C., and Yankine, S. A.: Spatial Variability and Temporal Stability of Local Net Precipitation Patterns, in: Precipitation Partitioning by Vegetation, edited by: Van Stan II, J. T., Gutmann, E., and Friesen, J., Springer International Publishing, Cham, 89–104, https://doi.org/10.1007/978-3-030-29702-2_6, 2020.
Vereecken, H., Kamai, T., Harter, T., Kasteel, R., Hopmans, J., and Vanderborght, J.: Explaining soil moisture variability as a function of mean soil moisture: A stochastic unsaturated flow perspective, Geophys. Res. Lett., 34, 1–6, https://doi.org/10.1029/2007GL031813, 2007.
Voss, S., Zimmermann, B., and Zimmermann, A.: Detecting spatial structures in throughfall data: The effect of extent, sample size, sampling design, and variogram estimation method, J. Hydrol., 540, 527–537, https://doi.org/10.1016/j.jhydrol.2016.06.042, 2016.
Western, A. W., Zhou, S. L., Grayson, R. B., McMahon, T. A., Blöschl, G., and Wilson, D. J.: Spatial correlation of soil moisture in small catchments and its relationship to dominant spatial hydrological processes, J. Hydrol., 286, 113–134, https://doi.org/10.1016/j.jhydrol.2003.09.014, 2004.
Wullaert, H., Pohlert, T., Boy, J., Valarezo, C., and Wilcke, W.: Spatial throughfall heterogeneity in a montane rain forest in Ecuador: Extent, temporal stability and drivers, J. Hydrol., 377, 71–79, https://doi.org/10.1016/j.jhydrol.2009.08.001, 2009.
Zehe, E., Graeff, T., Morgner, M., Bauer, A., and Bronstert, A.: Plot and field scale soil moisture dynamics and subsurface wetness control on runoff generation in a headwater in the Ore Mountains, Hydrol. Earth Syst. Sci., 14, 873–889, https://doi.org/10.5194/hess-14-873-2010, 2010.
Zhu, X., He, Z., Du, J., Chen, L., Lin, P., and Tian, Q.: Spatial heterogeneity of throughfall and its contributions to the variability in near-surface soil water-content in semiarid mountains of China, Forest Ecol. Manag., 488, 119008, https://doi.org/10.1016/j.foreco.2021.119008, 2021.
Zimmermann, A. and Zimmermann, B.: Requirements for throughfall monitoring: The roles of temporal scale and canopy complexity, Agr. Forest Meteorol., 189–190, 125–139, https://doi.org/10.1016/j.agrformet.2014.01.014, 2014.
Zimmermann, A., Germer, S., Neill, C., Krusche, A. V., and Elsenbeer, H.: Spatio-temporal patterns of throughfall and solute deposition in an open tropical rain forest, J. Hydrol., 360, 87–102, https://doi.org/10.1016/j.jhydrol.2008.07.028, 2008.
Zimmermann, A., Zimmermann, B., and Elsenbeer, H.: Rainfall redistribution in a tropical forest: Spatial and temporal patterns, Water Resour. Res., 45, 1–18, https://doi.org/10.1029/2008WR007470, 2009.
Zimmermann, A., Voss, S., Metzger, J. C., Hildebrandt, A., and Zimmermann, B.: Capturing heterogeneity: The role of a study area's extent for estimating mean throughfall, J. Hydrol., 542, 781–789, https://doi.org/10.1016/j.jhydrol.2016.09.047, 2016.
Zimmermann, B., Zimmermann, A., Lark, R. M., and Elsenbeer, H.: Sampling procedures for throughfall monitoring: A simulation study, Water Resour. Res., 46, 1–15, https://doi.org/10.1029/2009WR007776, 2010.
Zuecco, G., Penna, D., van Meerveld, H. J., Hopp, L., Fontana, G. D., and Borga, M.: Comparison of two different types of throughfall collectors, Die Bodenkultur, 65, 51–56, 2014.