the Creative Commons Attribution 4.0 License.
the Creative Commons Attribution 4.0 License.
 | 02 Aug 2023
Isotope-derived young water fractions in streamflow across the tropical Andes mountains and Amazon floodplain
Daxs Herson Coayla Rimachi
Adan Julian Ccahuana Quispe
Abra Atwood
A. Joshua West
The role of topography in determining water transit times and pathways through catchments is unclear, especially in mountainous environments – yet these environments play central roles in global water, sediment, and biogeochemical fluxes. Since the vast majority of intensively monitored catchments are at northern latitudes, the interplay between water transit, topography, and other landscape and climatic characteristics is particularly underexplored in tropical environments. To address this gap, here we present the results of a multiyear hydrologic sampling campaign (twice-monthly and storm sampling) to quantify water transit in seven small catchments (<1.3 km2 area) across the transition from the Andes mountains to the Amazon floodplain in southern Peru. We use the stable isotope composition of water (δ18O) to calculate the fraction of streamflow comprised of recent precipitation (“young water fraction”) for each of the seven small catchments. Flow-weighted young water fractions (Fyw) are 5 %–26 % in the high-elevation mountains, 22 %–52 % in the mid-elevation mountains, and 7 % in the foreland floodplain. Across these catchments, topography does not exert a clear control on water transit; instead, stream Fyw is apparently controlled by a combination of hydroclimate (precipitation regime) and bedrock permeability. Mid-elevation sites are posited to have the highest Fyw due to more frequent and intense rainfall; less permeable bedrock and poorly developed soils may also facilitate high Fyw at these sites. Lowland soils have low Fyw due to very low flow path gradients despite low permeability. The data presented here highlight the complexity of factors that determine water transit in tropical mountainous catchments, particularly highlighting the role of intense orographic precipitation at mountain fronts in driving rapid conveyance of water through catchments. These results have implications for the response of Earth's montane “water towers” to climate change and for water–rock reactions that control global biogeochemical cycles.
- Article
(7956 KB) - Full-text XML
- BibTeX
- EndNote


The time that water takes to transit through a watershed provides a measure of the age of water as it leaves the system (sensu Benettin et al., 2022) and has important physical, chemical, and biological implications. Water transit times through catchments can influence how freshwater resources respond to a changing climate. Catchment transit times can also inform understanding of how water partitions into different fluxes (e.g., discharge vs. evapotranspiration), with implications for determining the age (or seasonal origin) of water used by vegetation (Allen et al., 2019; Kirchner and Allen, 2020; Rempe and Dietrich, 2018), and transit times are thought to influence water quality and regulate rates of chemical weathering and thus the alkalinity fluxes that control the geologic carbon cycle, because the flow of water can modulate the saturation state of fluids with respect to mineral weathering reactions (Ameli et al., 2017; Berner, 1978; Maher, 2010, 2011). Mountain watersheds often serve as sources of water, solute, and sediment fluxes to lowland ecosystems (Barnett et al., 2005; Gaillardet et al., 1999; Immerzeel et al., 2020; Viviroli et al., 2007), and mountain environments are especially sensitive to changing climate – emphasizing the particular importance of understanding water transit times in these settings. Tropical montane watersheds, in particular, play outsized roles in global water and biogeochemical cycles (Fekete et al., 2002; Meybeck, 1987) yet are underrepresented in studies of terrestrial water transit.
Previous research has suggested that topography, subsurface structure, and hydroclimate all play roles in determining the ages of water moving through mountainous watersheds. Some studies indicate that steeper slopes and shorter flow paths generally lead to faster water transit (McGlynn et al., 2003; McGuire et al., 2005; Tetzlaff et al., 2009), while others have found that steeper watersheds have slower water transit than more gently sloping catchments (Jasechko, 2016; Lutz et al., 2018). Other work has shown how the permeability of soil and bedrock and the associated depth of active flow paths can influence water transit times (Hale et al., 2016; Hale and McDonnell, 2016; Xiao et al., 2021; Asano and Uchida, 2012; Muñoz-Villers et al., 2016a). Finally, the timing and amount of precipitation can influence water transit through mountain landscapes (Gallart et al., 2020a; Stockinger et al., 2019; von Freyberg et al., 2018a; Wilusz et al., 2017). Disentangling the effects of topography, subsurface structure, and hydroclimate remains challenging, and few studies have tested ideas about the controls on water transit across the dramatic topographic gradients of major mountain ranges, i.e., from steep high-relief mountain catchments to the surrounding floodplains.
The stable isotopic composition of stream water and river water is a conservative tracer that provides powerful information about catchment transit times. For decades, many studies used time series of stable isotopes of water in streams and precipitation to calculate stream mean transit times or stream water “ages” (Małoszewski and Zuber, 1982; McGuire and McDonnell, 2006), but these calculations were prone to errors arising from aggregation biases and hydrologic nonstationarity (Kirchner, 2016a, b). Instead, recent work focuses on using stable isotope time series to calculate the fraction of water within a reservoir comprised of recent precipitation (e.g., precipitation that fell within the 2–3 preceding months). The fraction of recent precipitation is referred to as the young water fraction (Fyw) and is calculated from the ratio between the amplitude of the seasonal cycle of oxygen isotopes in water from streamflow and precipitation (Kirchner, 2016a, b). The young water fraction offers information about water transit over timescales relevant to many hydrologic problems, making it an appropriate tool for untangling the impacts of topography, subsurface structure, and hydroclimate on water transit in tropical watersheds.
The primary objective of this work was to test the factors controlling young water fractions in streamflow across a dramatic mountain-to-floodplain gradient in the tropics. We collected a 4-year time series (2016–2020) of approximately fortnightly stream water and precipitation water isotope samples from seven small (<1.3 km2) catchments in southern Peru spanning an elevation range of more than 3200 m and a gradient in catchment slopes from 38 to 4∘ in order to ask the following questions. (1) How do precipitation water and stream water isotopes vary seasonally, and how do they differ from one another among different catchments in this setting? (2) How does the young water fraction vary among catchments, and what topographic, subsurface, and hydroclimatic conditions are related to these variations? By beginning to differentiate among the factors that control the transit of water through tropical mountain systems, which are rarely studied, we offer insights into how projected changes in precipitation patterns may interact with the topography and subsurface conditions to shape water flow.
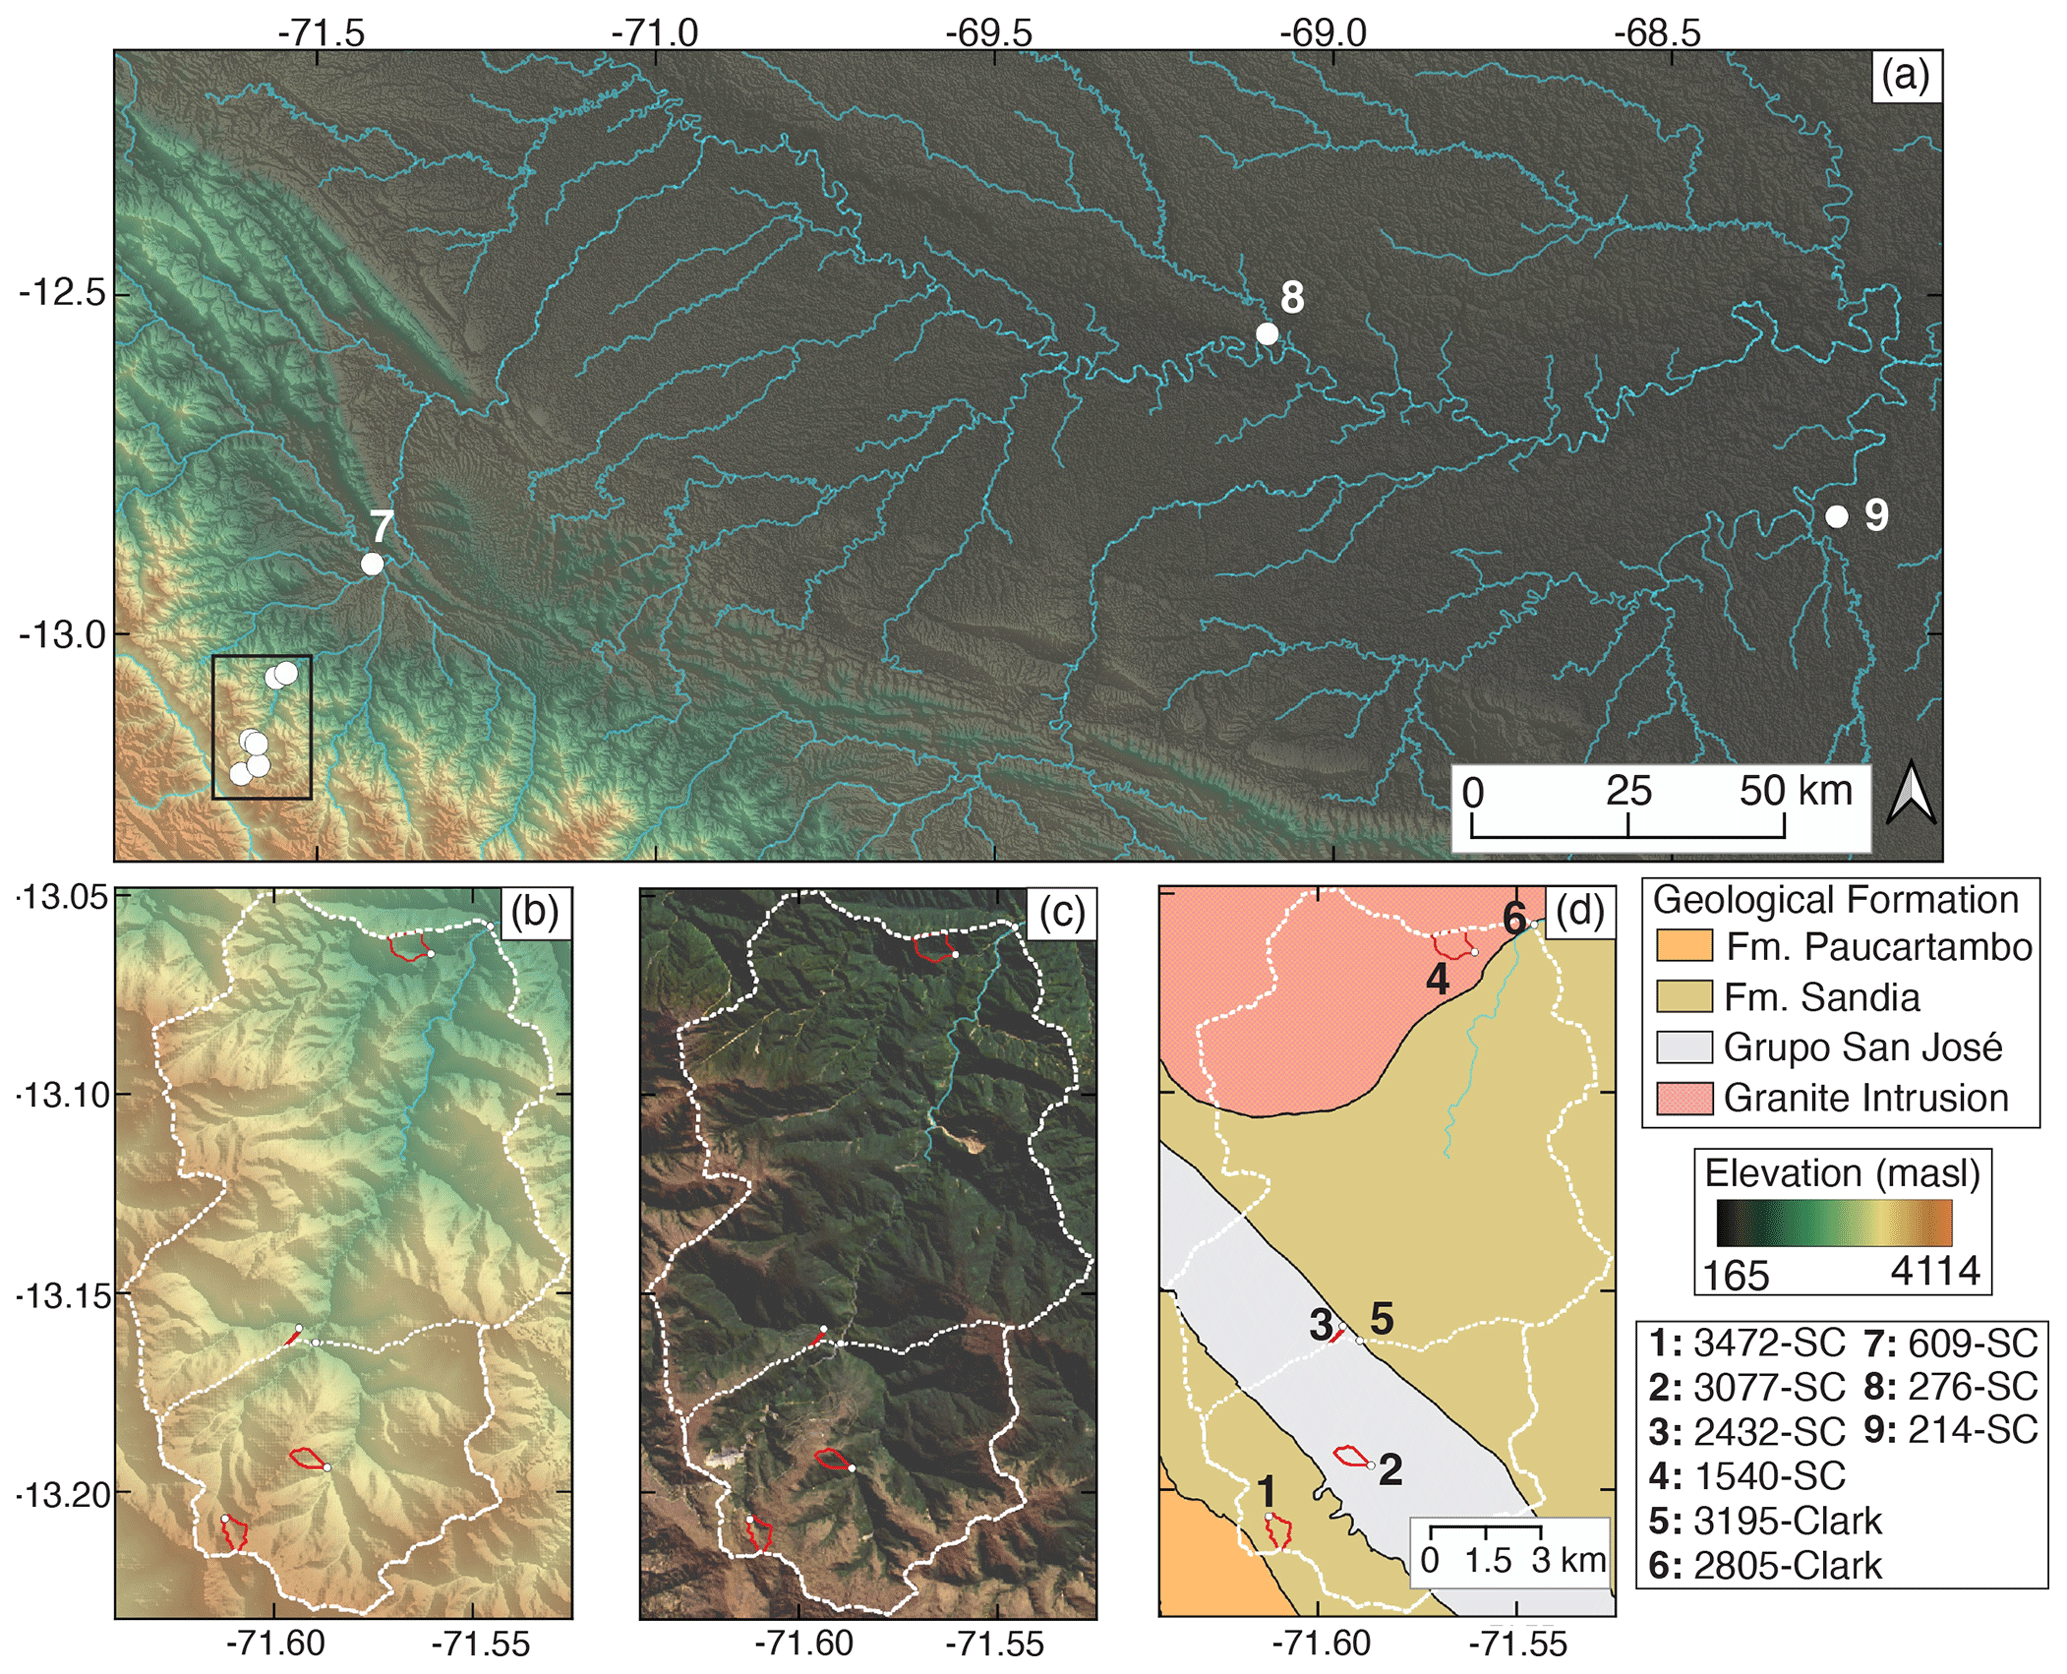
Figure 1(a) Digital elevation model (DEM, from Advanced Land Observing Satellite (ALOS) 30 m data) of the Andes mountains and Amazon floodplain in southern Peru. The stream network in panels (a–d) is for display only and does not represent the full extent of perennial streams in the study area. White circles indicate sampling locations. Panels (b–d) show the area within the black rectangle in panel (a), with small catchments from this study delineated by solid red lines and catchments from Clark et al. (2014) by dashed white lines. Panel (b) shows elevations of Andean sites, (c) Landsat imagery, and (d) geology using data from INGEMMET.
2.1 Study area and sampling design
In this study, we carried out detailed monitoring of seven small (areas ranging from 0.097 to 1.27 km2) catchments spanning the transition from the eastern flank of the Andes mountains to the Amazon foreland floodplain (Figs. 1 and 2, Table 1). The small catchments (SCs) in this study are referred to by their sampling point elevation in meters, followed by “-SC”. Two small catchments (3472-SC and 3077-SC) are in the high Andes mountains, underlain by fractured shale bedrock with mean slopes ∼ 25–35∘. Two mid-elevation small catchments (2432-SC and 1540-SC) are in the similarly steep mid-elevation Andes, with one (1540-SC) underlain by a granitic intrusion. One small catchment is situated in the foreland fold and thrust belt at the foothills of the Andes (609-SC), underlain by uplifted Andean sediments with a mean slope of 22.9∘. Two of the small catchments are situated on fluvial terraces in the foreland floodplain (276-SC and 214-SC), with the bedrock at these sites comprised of weathered sediments from the Andes. These catchments have much lower slopes, averaging 3–7∘. We also consider stable isotope data from two nested mesoscale catchments studied in Clark et al. (2014) (dashed white line in Fig. 1b–d). Clark et al. (2014) used stream, precipitation, and cloud water isotope data to constrain a regional water budget for the mesoscale Andean catchments. We reanalyzed their data to calculate stream young water fractions (Fyw) to complement the large amount of new data we report from our small study catchments across the elevation gradient. The catchments from Clark et al. (2014) are referred to by their mean elevation in meters, followed by “-Clark”: 3195-Clark (mean slope 28.7∘; total area 49.8 km2) and 2805-Clark (mean slope 31.6∘; total area 164 km2). Site 3195-Clark drains Andean shales, and site 2805-Clark drains Andean shales and the same granitic intrusion that underlies 1540-SC (Fig. 1d).
Table 1Characteristics of small catchments from this study and mesoscale catchments from Clark et al. (2014). TMCF: tropical montane cloud forest; TMF: tropical montane forest; TRF: tropical rainforest.
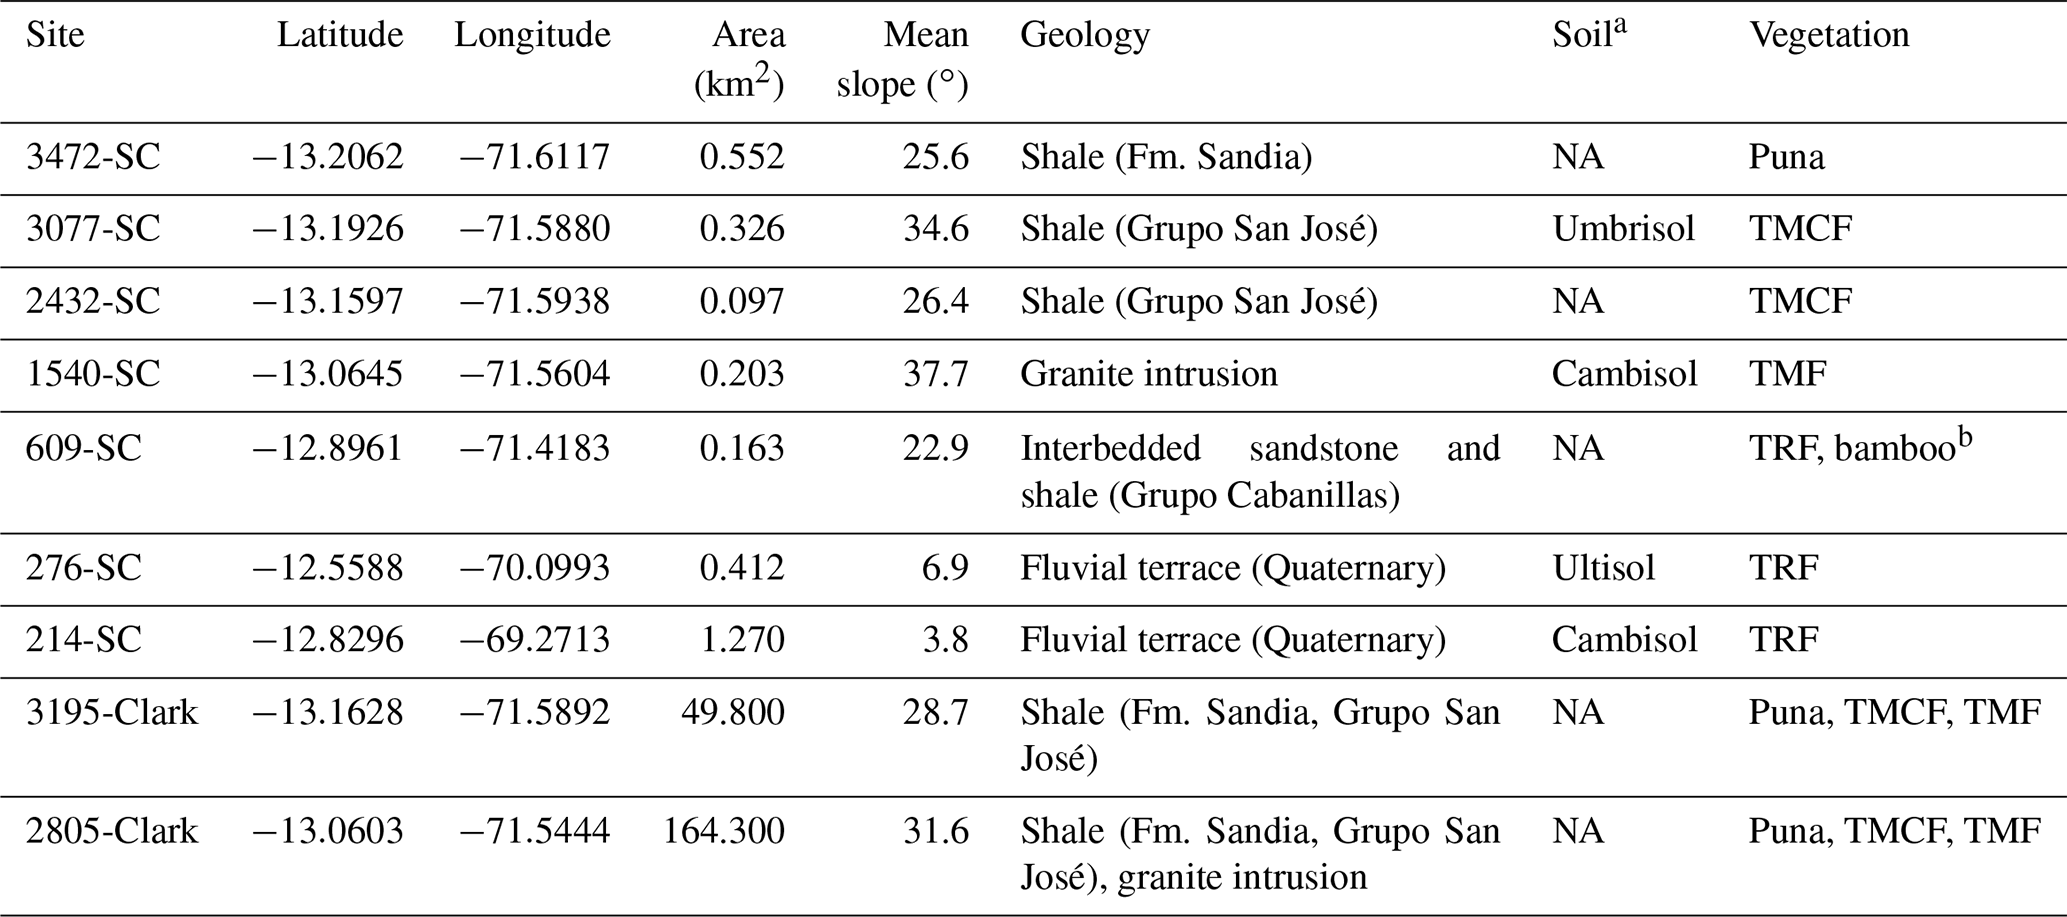
a Asner et al. (2017), Wu et al. (2019), Pitman et al. (2001). b Secondary-growth rainforest dominated by bamboo (Wu et al., 2019). NA: data not available.
The seven small streams were sampled approximately biweekly beginning in April 2016. In addition to stream sampling, precipitation was collected at sites 3077-SC, 1540-SC, 609-SC, 276-SC, and 214-SC. For sites 3472-SC and 2432-SC, we calculated approximate precipitation oxygen isotope values by linearly interpolating between nearby precipitation samples collected at higher and lower elevations, supported by the observation that in this region precipitation isotopes have a linear relationship with elevation (Ponton et al., 2014). Precipitation was collected in a bucket left out between each sampling, with a layer of oil to prevent evaporative loss. Point discharge was manually measured each time a sample was taken. For sites 3077-SC and 609-SC, continuous discharge was measured in 2019 and 2020 with WL16 Global Water Level Loggers. Rainfall amount data are from tipping buckets and Vaisala rain gauges maintained by the Andes Biodiversity and Ecosystem Research Group, a manual rain gauge maintained by the Los Amigos Biological Station, and rain gauges operated by the Servicio Nacional de Meteorología e Hidrología del Perú (SENAMHI). Stream baseflow indices were calculated for sites 3077-SC and 609-SC using the MATLAB HydRun hydrograph analysis package (Tang and Carey, 2017).
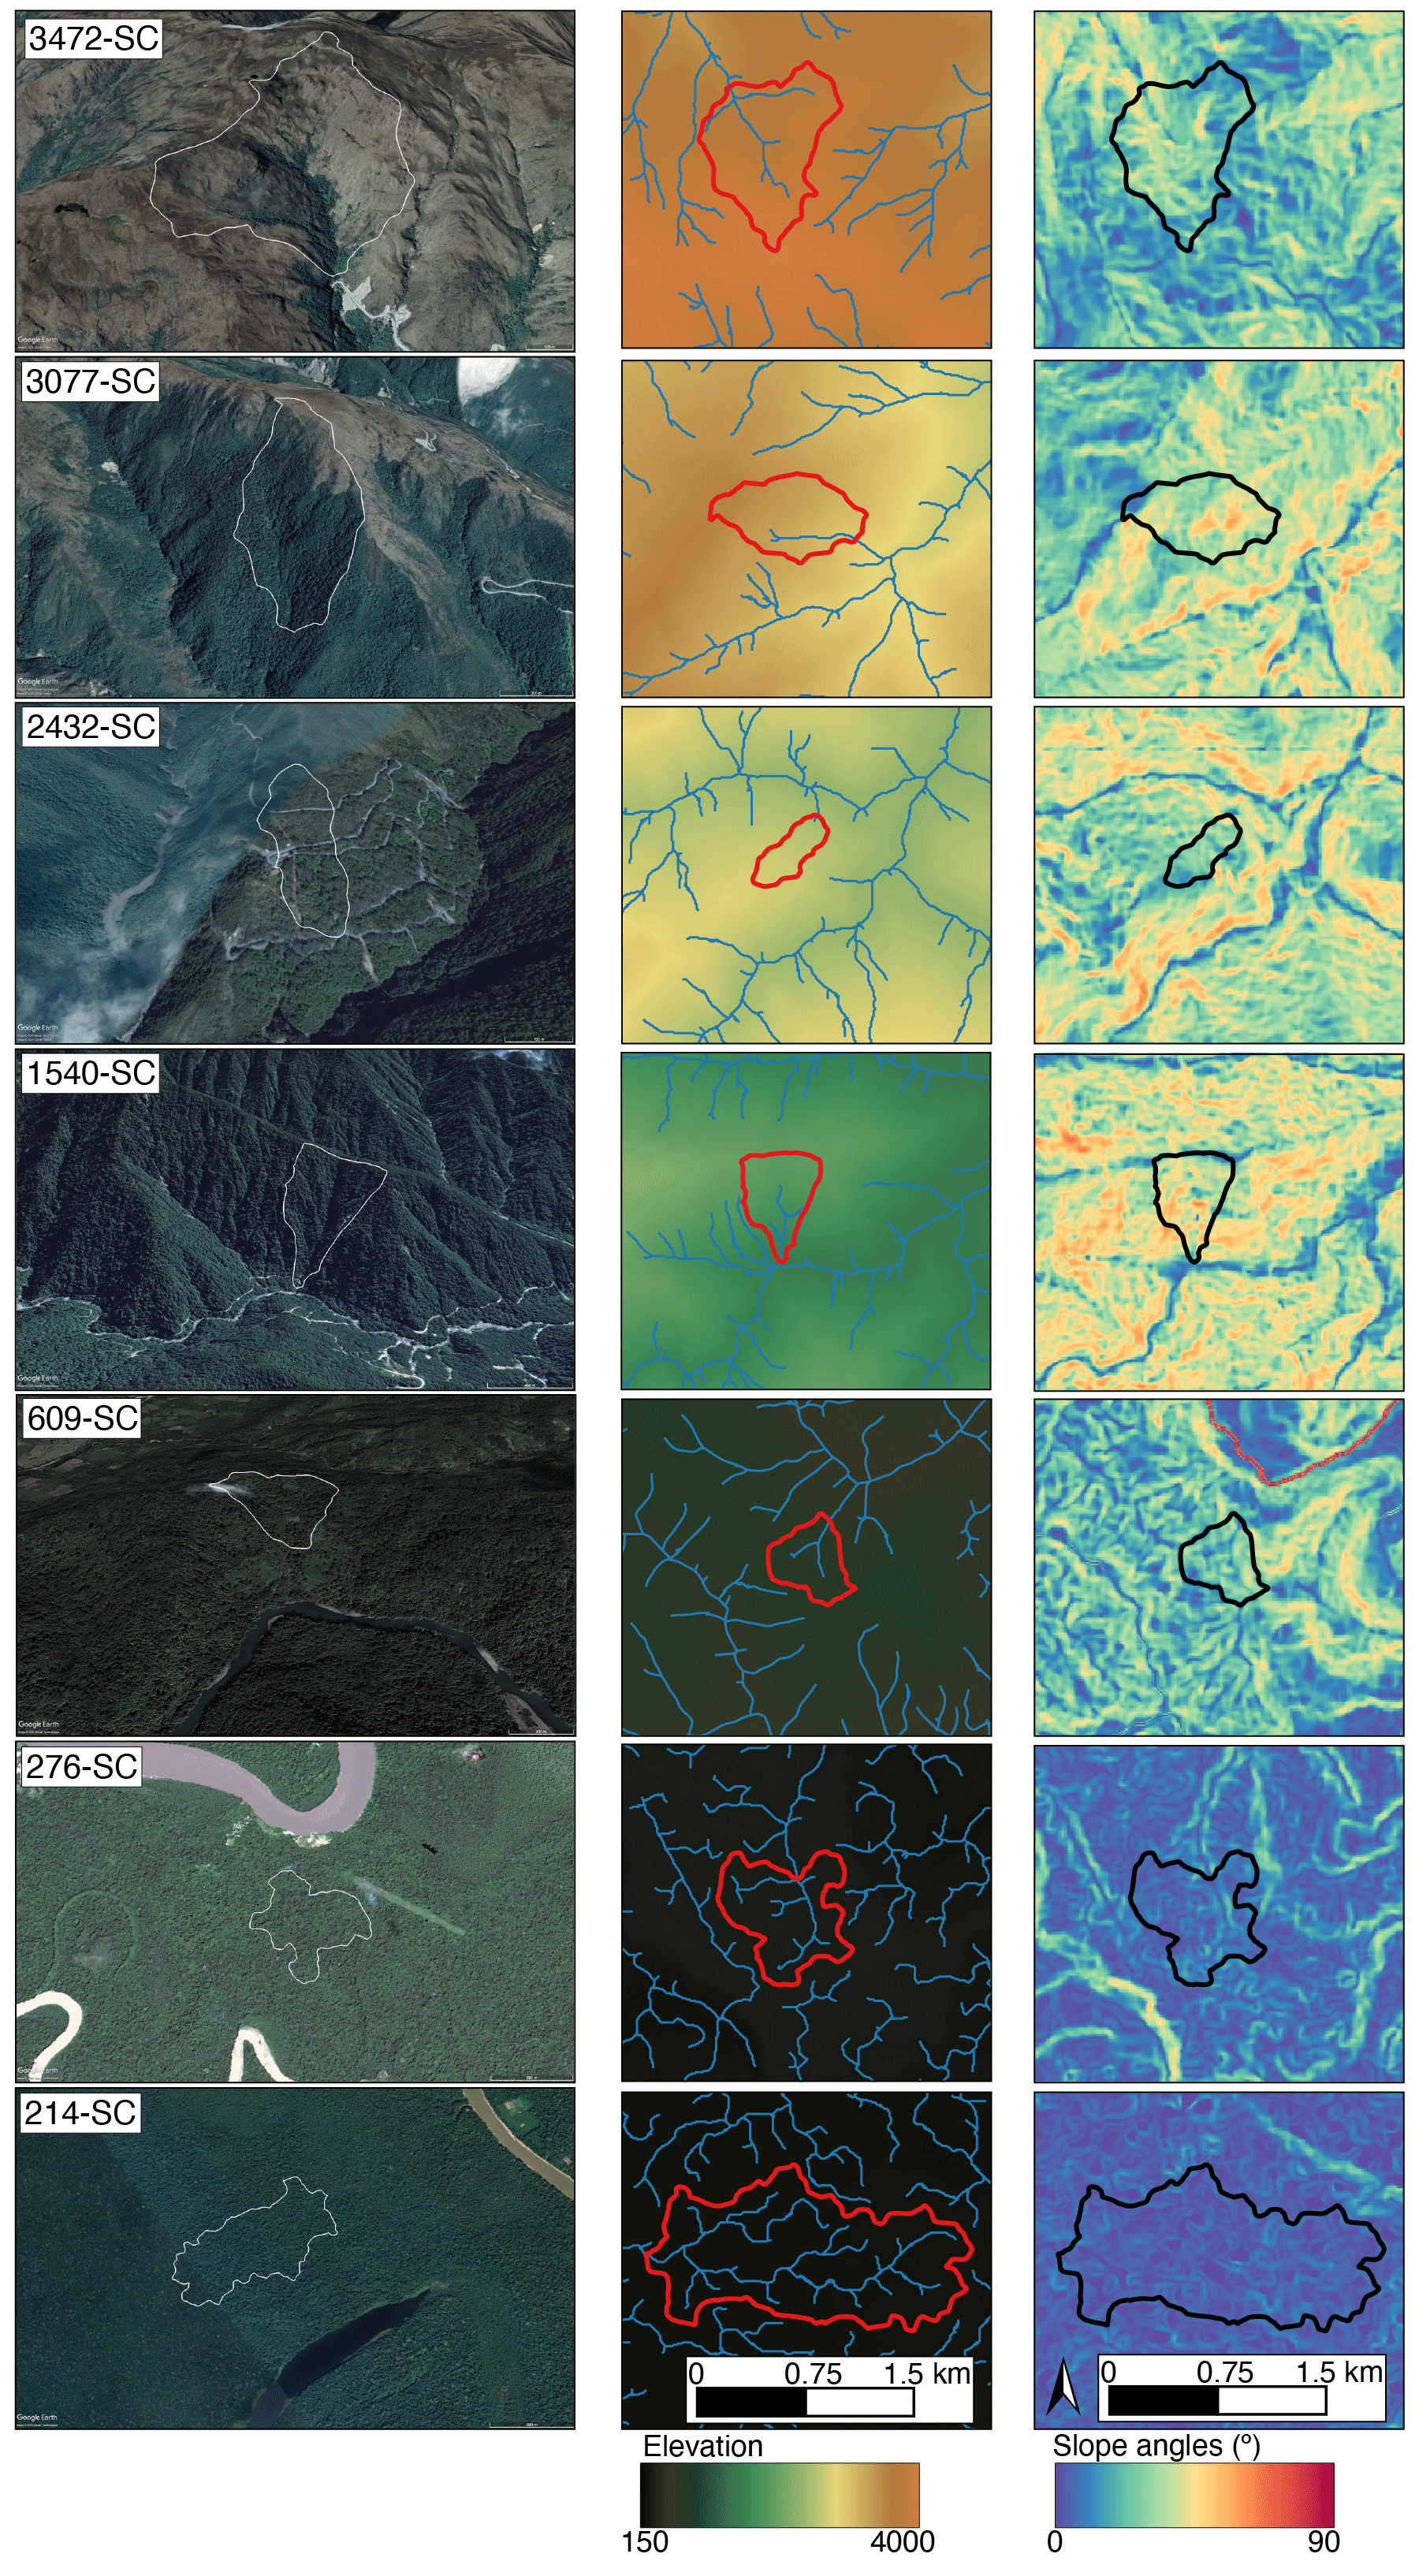
Figure 2Satellite imagery with catchment boundaries in white (first column; imagery: Google Earth, image © 2023, CNES/Airbus and Maxar Technologies), elevation maps with catchment boundaries in red, the smoothed stream network in blue (second column), and maps showing hillslope angles with catchment boundaries in black (third column) for each of the seven small catchments in this study. Elevation and slope angles derived from a smoothed 8 m DEM generated from stereo pairs of WorldView satellite images using the SETSM algorithm (see text).
2.2 Topographic analyses
We determined catchment topographic parameters based on digital elevation models (DEMs) generated from stereo pairs of WorldView satellite imagery using the Surface Extraction from Triangular irregular network-based Searchspace Minimization (SETSM) algorithm (Noh and Howat, 2015). We produced smoothed DEMs covering the studied catchment areas at 8 m horizontal spatial resolution using a combination of cross-track and in-track image pairs (several different image pairs were needed to cover all the study catchments). Topographic calculations were completed in GrassGIS (v8.2) using available algorithms (GRASS Development Team, 2022). Catchment areas were determined using multiple flow direction (MFD) routing for all except the Tambopata site, where only single (D8) flow routing yielded a physically reasonable hydrologic representation. Stream networks (as shown in the middle panel of Fig. 2) were defined based on a threshold flow accumulation area of 12 500 m2, which captured observed streams in the smallest catchment (2432-SC). A single threshold area is probably not appropriate across such diverse terrain but was adopted in our calculations for consistency. For each catchment, three metrics of flow path length were calculated: the distance to the catchment outlet along flow paths (using r.stream.distance; Jasiewicz and Metz, 2011), the distance along flow paths to the stream network defined by the 12 500 m2 accumulation threshold (also using r.stream.distance), and the length of all flow path vectors defined by one raster cell spacing between each flow line, calculated using r.flow. Because of the very low slope angles on the terrace surfaces, flowline computation was not possible for the two lowland catchments, 276-SC and 214-SC (SETSM-derived DEMs generally capture topographic metrics well, but noise may be relatively more pronounced in flatter terrain; e.g., see Atwood and West, 2022). Flow path gradients were calculated using r.stream.slope and catchment-wide slope angles with r.slope.aspect. Importantly, key topographic metrics such as slope angles and hillslope lengths are dependent on elevation model resolution as well as threshold values used to define stream channels (e.g., see the comparison in Clark et al., 2016, for the region in this study). Consequently, care should be taken in making any comparison with analogous values from other studies.
2.3 Stable isotope data analysis
Samples were analyzed for stable isotopes of water (δ18O and δD), with results reported here using permille notation relative to the Vienna Standard Mean Ocean Water standard. The stream oxygen or hydrogen isotope composition is referred to as and δDstream and precipitation oxygen and hydrogen isotope composition as and δDprecip. The analyses were carried out via two Los Gatos Research Liquid Water Isotope Analyzers (LGR) (Caltech and Lawrence Berkeley National Laboratory) and a Picarro L2130i cavity ring-down spectrometer (Chapman University). The internal error of isotope measurements on the Picarro was 0.1 ‰ or better for δ18O and 2 ‰ or better for δD. On the LGR at Lawrence Berkeley National Laboratory the internal error was 0.1 ‰ or better for δ18O and 1 ‰ or better for δD. On the LGR at Caltech the internal error was 0.3 ‰ or better for δ18O and 1 ‰ or better for δD. Long-term accuracy on certified isotope standards was within 1 standard deviation of the known isotopic values.
Young water fractions were calculated for each small catchment following Kirchner (2016a, b). Stream and precipitation oxygen isotope data were fit with Eq. (1):
where C is the concentration of a tracer in streams or precipitation, t is time, f is the frequency of the interval, a and b are the cosine and sine coefficients, and k is the vertical shift. The fit to stream and precipitation isotope data was performed with and without stream discharge and rainfall amount weighting. The young water fraction was then calculated using Eqs. (2)–(4):
where A is the amplitude of the seasonal cycle in stream and precipitation oxygen isotopes. In addition to calculating young water fractions using all of the stream water isotope data, we divided isotope data from each site into quartiles according to observed stream runoff and calculated young water fractions (again using Eqs. 1–4) for each quartile of stream runoff (sensu Gallart et al., 2020b).
In order to assess the uncertainty of the young water fraction estimates, we bootstrapped observations of stream and precipitation isotope values for each site. For each bootstrap resampling, we drew one sample at random from the complete dataset for each catchment and then repeated this resampling from the complete dataset until we had drawn the same number of random samples as the original dataset (e.g., for a dataset with 50 observations, we sampled 50 times, each time from the full dataset). We repeated this process 10 000 times for each stream and precipitation isotope dataset at each site. We then calculated Fyw from Eqs. (1) to (4) for each of those 10 000 bootstrapped datasets. This procedure allowed us to constrain the young water fraction as a distribution of values for each site.

Figure 3(a) Precipitation return interval for rain gauges near sites 3077-SC (ABERG Wayqecha rain gauge), 1540-SC (ABERG Trocha Union rain gauge), 609-SC (SENHAMI Chontachaca rain gauge), and 276-SC (ACCA Los Amigos rain gauge). (b) 3077-SC and 609-SC stream runoff records with baseflow indices (only these two sites had reliable continuous-discharge records).
For comparative purposes, we also generated a null dataset of young water fractions across all the sites. To do this, we first took individual stream and precipitation isotope values from each site and subtracted each observation from the site's mean stream and precipitation isotope value. This approach allowed us to normalize for differences in stream and precipitation isotope values across sites due to orographic effects. We combined the site-specific normalized stream and precipitation isotope datasets to create null datasets containing normalized stream (n=394) and precipitation (n=257) isotope values for all the sites. We then bootstrapped with replacement from the complete dataset, as described above, by drawing 394 observations from the stream dataset and 257 observations from the precipitation dataset. We repeated this 10 000 times each for the null stream and precipitation datasets and calculated Fyw from Eqs. (1) to (4) for each of those 10 000 bootstrapped datasets.
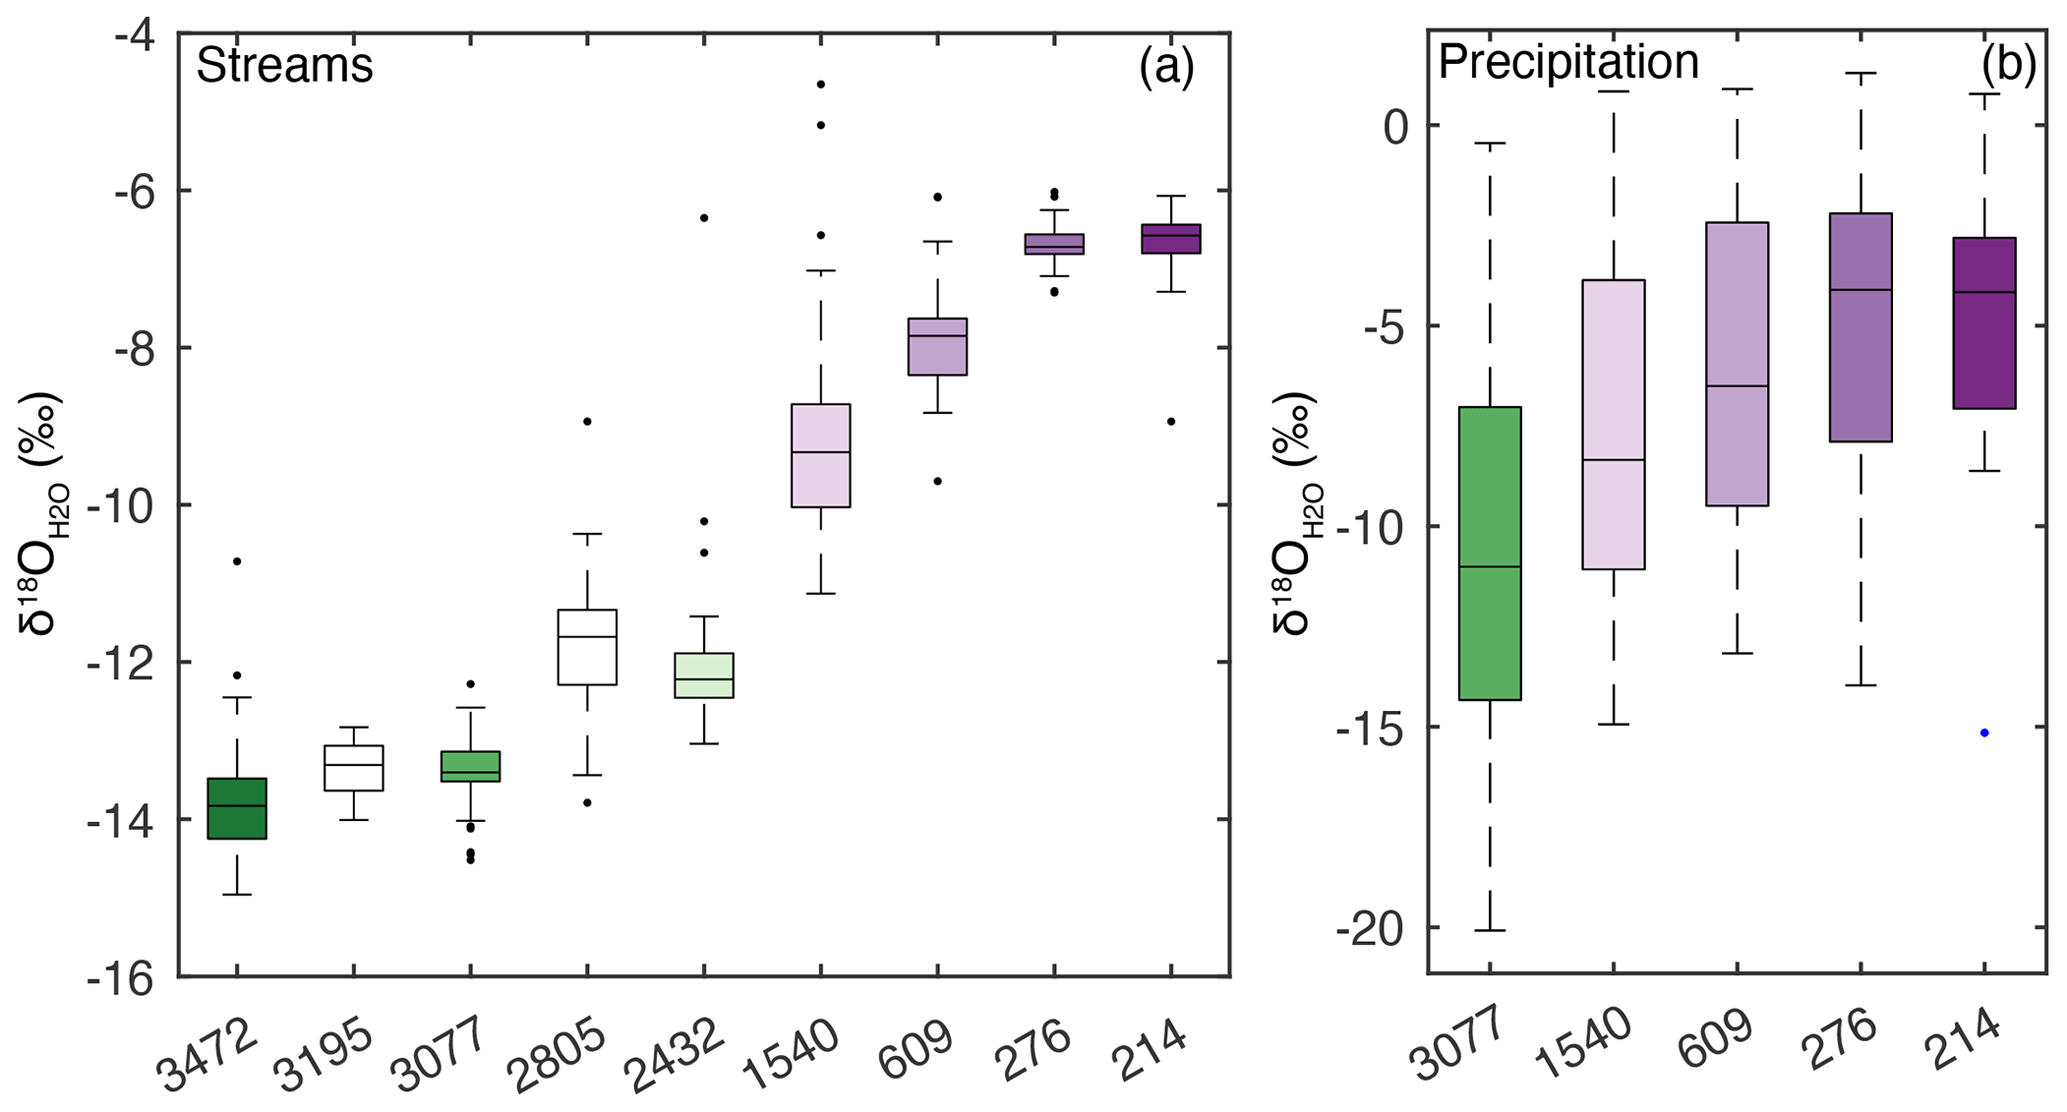
Figure 4(a) for small catchments and mesoscale catchments 3195-Clark and 2805-Clark (from Clark et al., 2014; boxes left uncolored). (b) for precipitation collected near five of the small catchments. Colors range from dark green to dark purple as a function of elevation. Boxes show the interquartile range, whiskers show the non-outlier maximum and minimum, and circles indicate outliers.
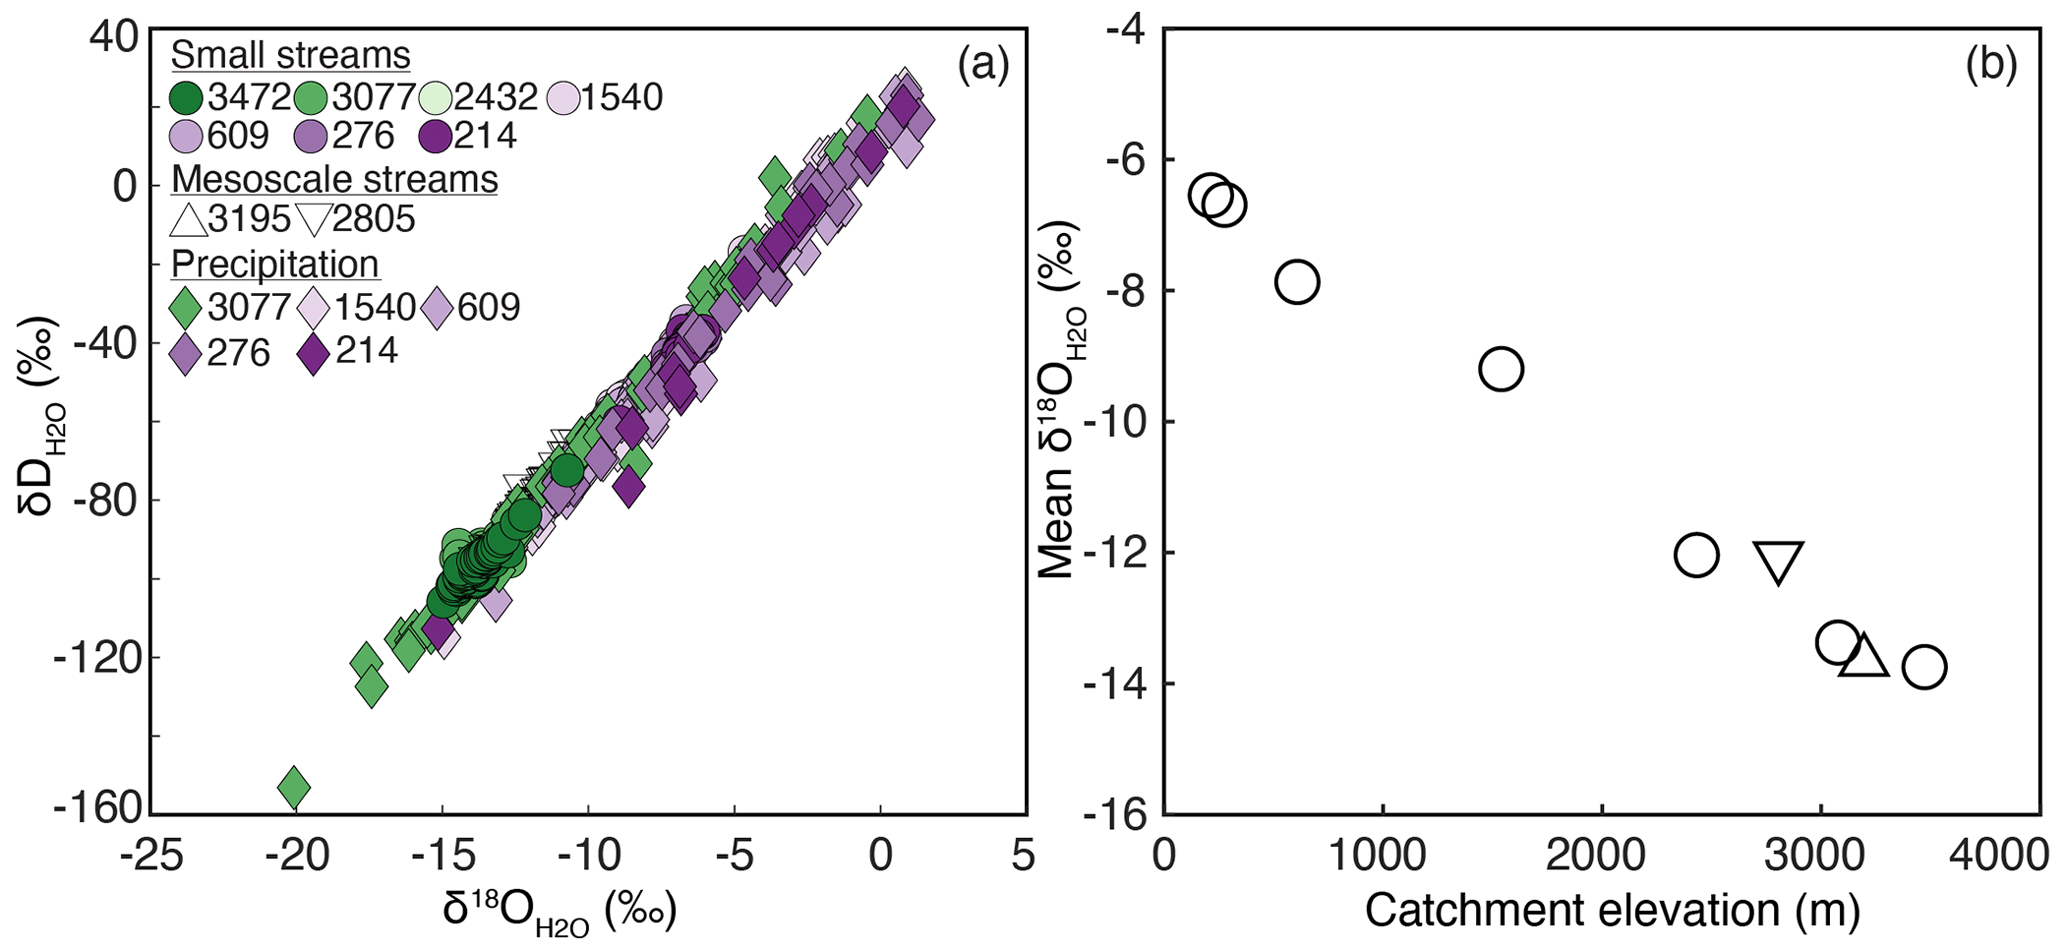
Figure 5(a) δ18O and δD of stream and precipitation. Colors for the small catchment data points range from dark green to dark purple as a function of elevation. (b) Mean (not flow-weighted) as a function of sampling-point elevation for small catchments and mean catchment elevation for mesoscale catchments. Circles represent small catchment stream isotopes, triangles show mesoscale catchment stream isotopes (from Clark et al., 2014), and diamonds show precipitation isotopes.
3.1 Rainfall and stream discharge
The frequency of storms and the amount of precipitation vary across the Andes mountain to Amazon floodplain transition due to orographic effects. Sites 214-SC and 276-SC have mean annual precipitation of ∼3200 mm (Rapp and Silman, 2012) and 2479 ± 275 mm (Amazon Conservation Association, unpublished data), respectively. As moisture moves across the foreland floodplain and reaches the Andean foothills and mid-elevation mountains, mean annual precipitation increases: at 872 m (closest to site 609-SC) mean annual precipitation is 5371 ± 507 mm (SENAMHI). The highest precipitation is measured in the mid-elevation mountains: at 1379 m mean annual precipitation is 10425 ± 1214 mm. At 2161 m mean annual precipitation is 8325 ± 687 mm. Precipitation amounts then decrease towards the high-elevation mountainous sites: at 2912 m mean annual precipitation is 4110 ± 418 mm. Site 1540-SC has the largest and most frequent rains (Fig. 3a), consistent with it being one of the sites with the greatest mean annual precipitation. Site 609-SC has the second-most frequent and most intense rains, while the high-elevation 3077-SC and foreland floodplain 276-SC have less frequent and less intense rains. The changes in hydroclimate from mountain foothills to high-elevation mountains are also reflected in stream discharge patterns (Fig. 3b); specifically, site 609-SC has a flashier hydrograph and lower baseflow index than site 3077-SC.
The discrete nature of the stream sampling and limited time resolution of our sample collection could introduce bias in the estimation of Fyw (Gallart et al., 2020b). As one check on how representative our sampling was of flow conditions, we compared mean stream runoff corresponding to times of sample collection with mean stream runoff from the continuous runoff records for sites 609-SC and 3077-SC. For site 609-SC the mean discharge during sample collection was 8.8 mm d−1, while the mean discharge of the continuous record was 8.0 mm d−1. For site 3077-SC the mean discharge during sample collection was 11.6 mm d−1, while the mean discharge of the continuous record was 11.0 mm d−1. The similarity in the mean values may reflect the low discharge variability at our tropical study sites compared with catchments in temperate and Mediterranean climates, yet even in this setting, incomplete sampling across the flashy hydrograph is expected to introduce uncertainty in calculated Fyw values.
3.2 Oxygen and hydrogen isotopes in streamflow and precipitation
The and values follow an orographic trend across the transition from the high Andes mountains to the foothills (3472-SC to 609-SC), with the highest-elevation streams showing the most isotopic depletion (Figs. 4–6). The trends with elevation are similar to those reported previously for this region (e.g., Ponton et al., 2014), here adding seasonal information. Our new data reveal that, along this same mountain-to-foothill transition, and δDprecip display marked seasonal cycles (amplitude 4 ‰–5 ‰). The average volume-weighted seasonal cycle amplitude is greatest in the high Andes mountains (4.3 ‰) and mid-elevation mountains (4.5 ‰) and lowest in the mountain foothills (3.7 ‰) and foreland floodplain (3.2 ‰) (Table 2, Figs. 4 and 6).
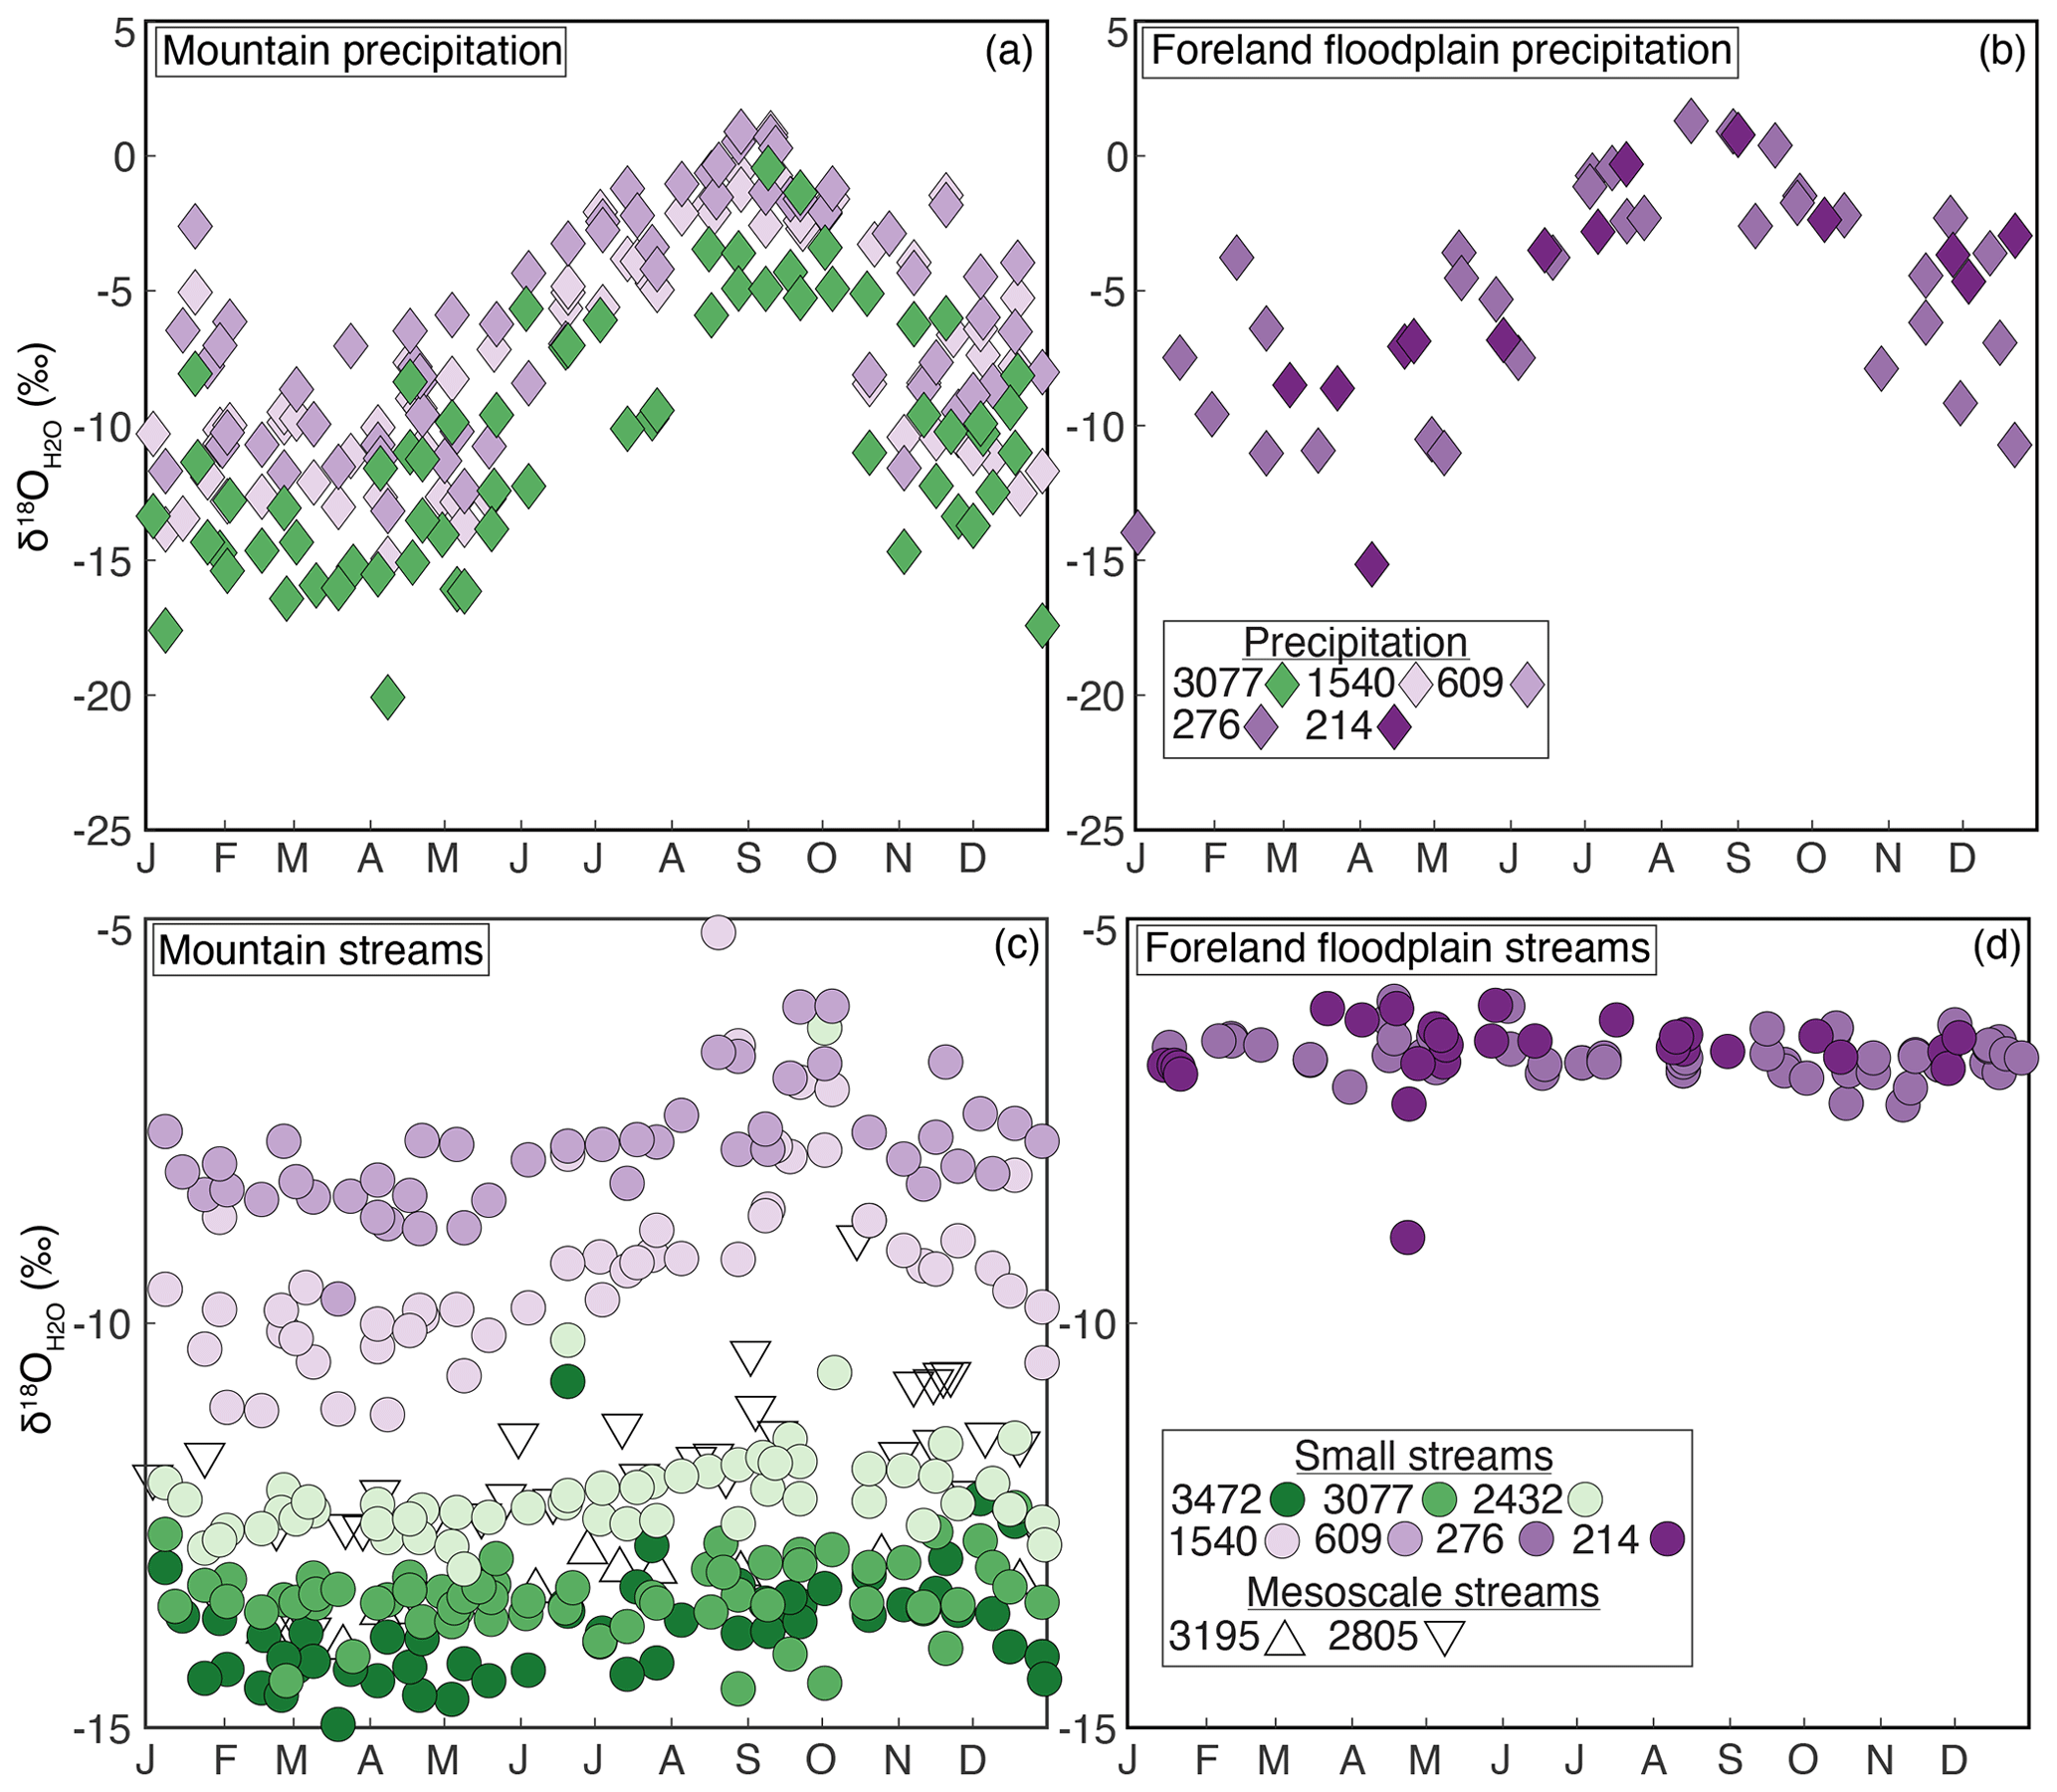
Figure 6 (a, b) and (c, d) for the duration of the study period (2016–2020), plotted by day of year. Refer to Fig. 7 for the fit of Eq. (1) to data. Circles represent from the small catchments, and triangles represent from the mesoscale catchments. Diamonds represent . Panels (a) and (c) show sites in the Andes and mountain foothills, and panels (b) and (d) show the foreland floodplain sites.
Relative to the inputs, values are damped. The degree of isotope dampening, and therefore the amplitude of the seasonal cycle, varies between the small catchments situated from the mountains to the foothills (Fig. 5). The seasonal amplitude of values is smallest within the Andes mountain (3472-SC, 3077-SC, 2432-SC) and foreland floodplain (276-SC and 214-SC) sites and highest for the mid-elevation mountain (1540-SC) and mountain foothill (609-SC) sites (Fig. 5). Of the two mesoscale catchments, 3195-Clark has a smaller seasonal amplitude in than 2805-Clark. Dual-isotope space (δ18O and δD) reveals no significant deviation from the local meteoric water line (Fig. 5), indicating no significant evaporative signal in the stream waters for any of the sites in this study.
Table 2Discharge and rainfall-weighted oxygen isotope seasonal cycle amplitude with propagated standard errors (Astream and Aprecip) derived from Eqs. (1) to (3). R2 values are included for the fit of Eq. (1) to stream and precipitation isotope data. N: number of stream and precipitation stable water isotope data from this study and Clark et al. (2014). Dashes (–) indicate locations without precipitation collection. For sites without precipitation collection, was linearly interpolated by elevation from the nearest sites.
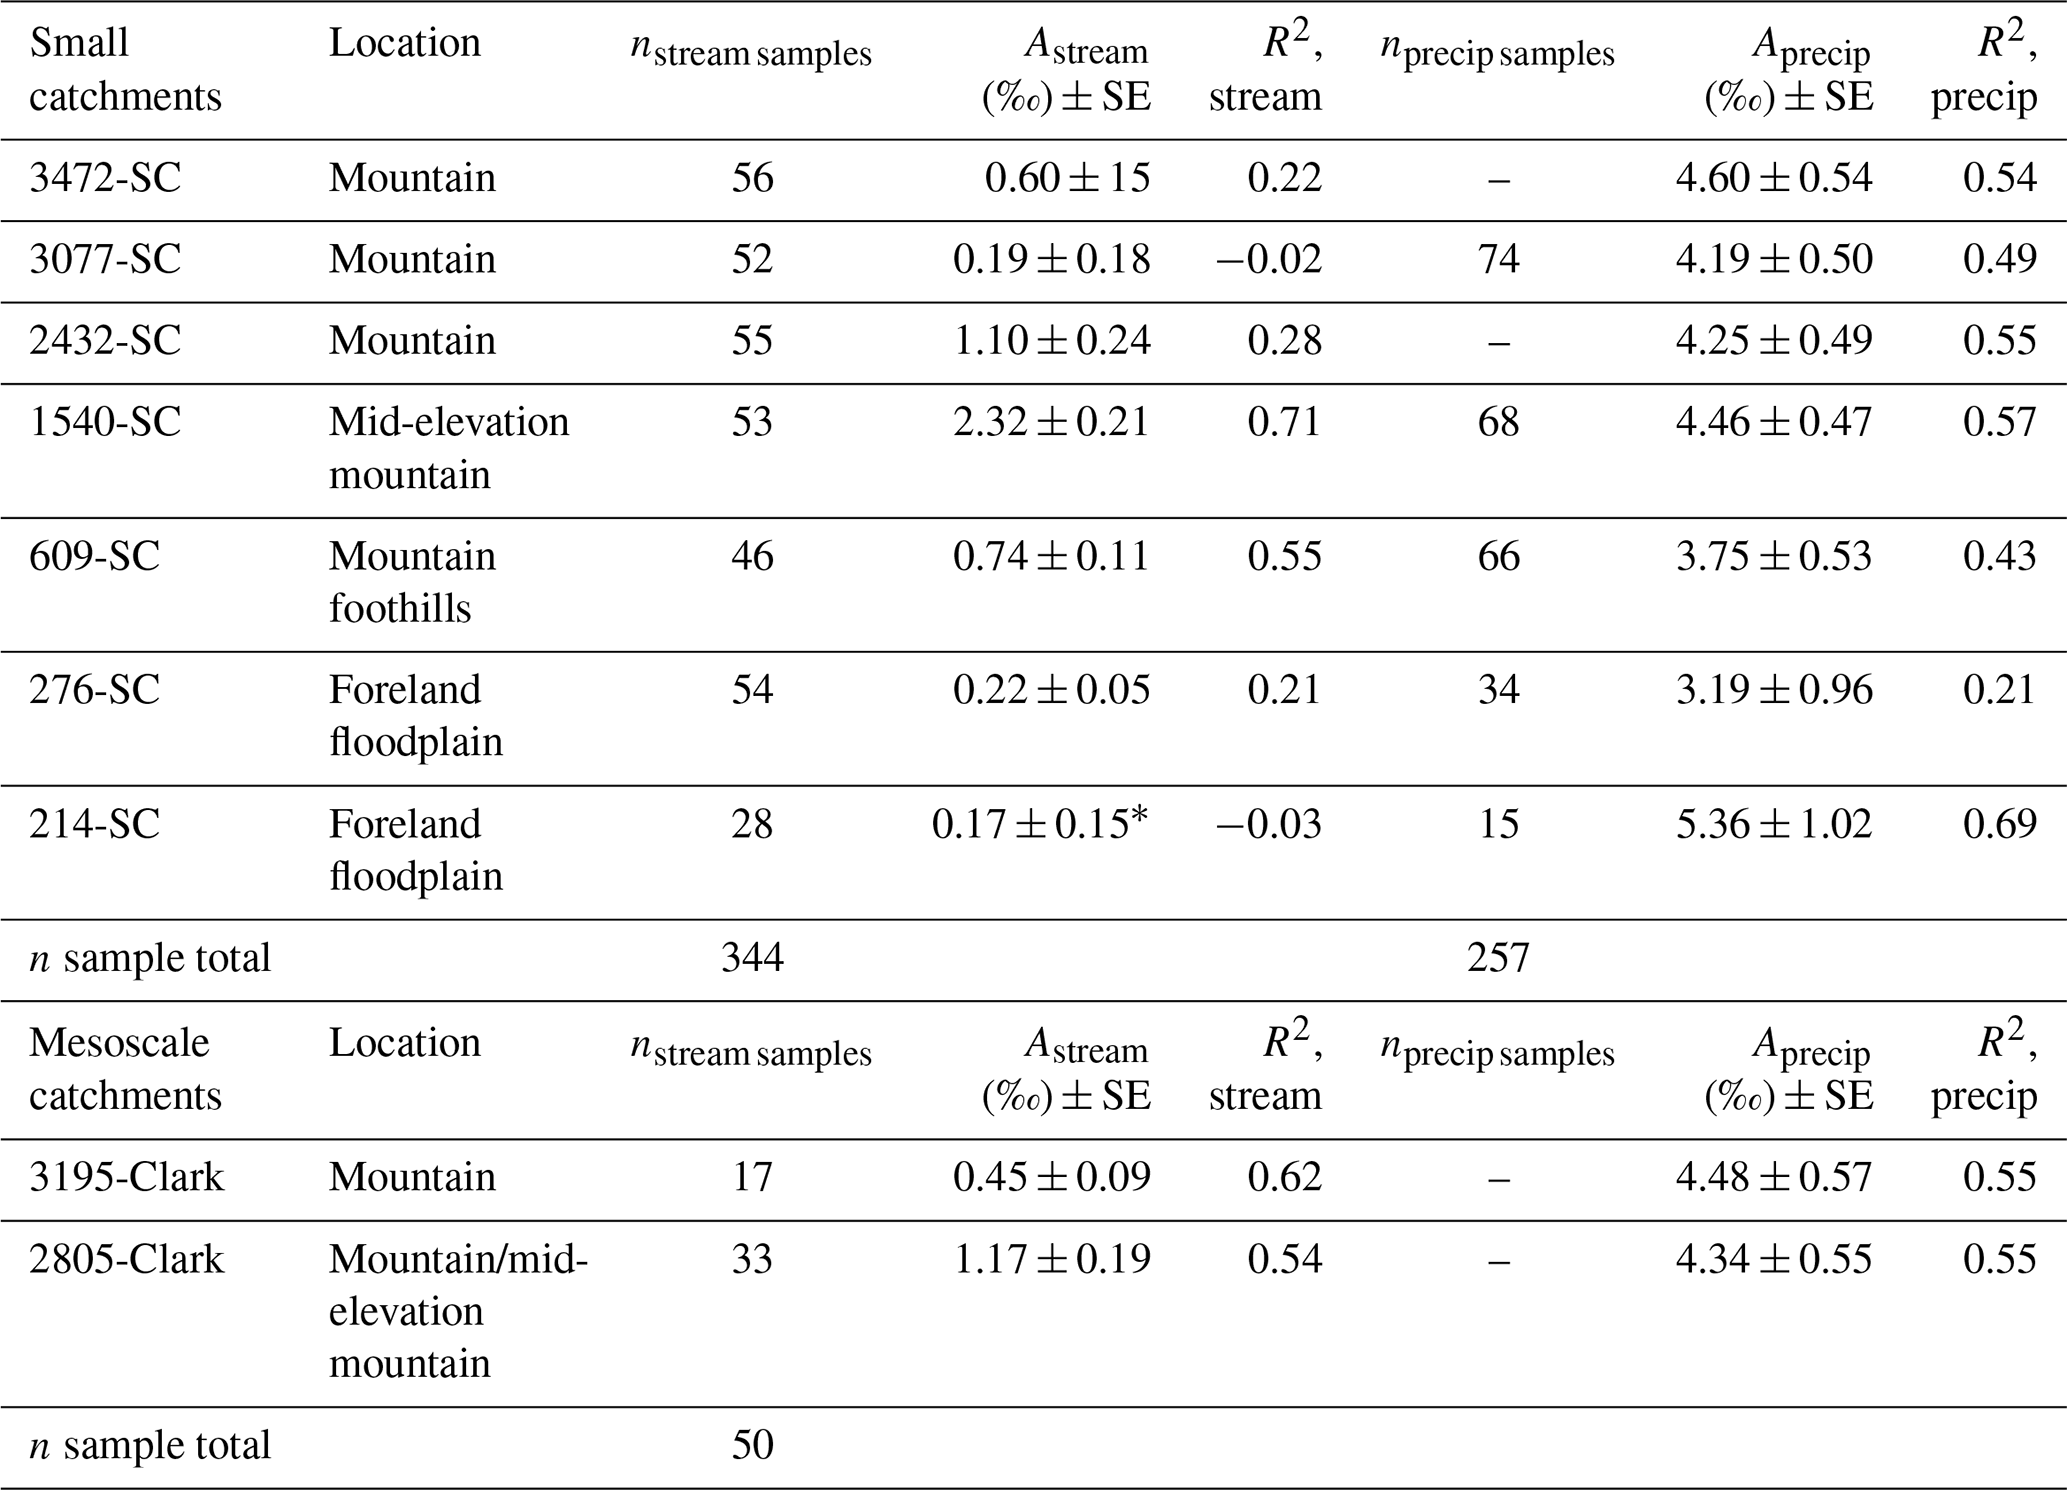
*Due to the limited data for site 214-SC, only unweighted seasonal cycle amplitudes and Fyw were calculated.
3.3 Young water fractions
Young water fractions (Fyw) vary between the catchments across the mountain-to-floodplain transition. Figure 8 shows the distribution of unweighted and flow-weighted Fyw obtained from the bootstrap resampling routine. Our bootstrap resampling offers one way of addressing the uncertainty associated with young water fraction calculations and demonstrates the reliance of Fyw on the inclusion (or exclusion) of a sampling event. Sites 3472-SC, 3077-SC, and 2432-SC have a flow-weighted Fyw between 5 % and 25 %. Mesoscale catchment 3195-Clark, draining approximately 50 km2 of Andean shales, has a flow-weighted Fyw of 10 %, on the lower end of the range of the flow-weighted Fyw seen in the three small Andean catchments. At mid-elevations, 1540-SC, which drains granitic intrusions, has a flow-weighted Fyw of 52 %. The second mesoscale catchment, 2805-Clark, which drains a 165 km2 area including Andean shales and granitic intrusions, has a flow-weighted Fyw of 27 %. Catchment 609-SC, in the foothills of the Andes and underlain by colluvium, has a flow-weighted Fyw of 22 %. Catchment 276-SC, located on a foreland floodplain fluvial terrace, has a flow-weighted Fyw of 7 %. For comparison, the null dataset, generated from a compilation of isotope data from all the sites, yields a Fyw of 7 %. In addition to changes in the mean values across the Andes–Amazon gradient, the distributions from the bootstrap resampling routine change across the region, with wider distributions for the mid-elevation catchments and tighter distributions in the high Andes and Amazon lowland catchments.
Figure 9 shows the relationship between key catchment characteristics and the weighted best estimate of the stream young water fraction (Fig. 9). There is no apparent relationship between Fyw and slope angle or flow path length, calculated either as the median distance to the stream network or the average length of all the flow paths (Fig. 9b, c, d). There is, however, some coherent pattern in Fyw across these catchments, including a “humped” relationship with elevation (Fig. 9a) and a positive relationship with mean annual precipitation from the nearest rain gauges (Fig. 9e). Additionally, all the sites (except for 276-SC, most likely due to a small number of sampling points) point to an increase in the stream young water fraction with increasing discharge quartiles (Fig. 7). These observations may help to explain the decoupling of Fyw and topography at these sites, as explored below.
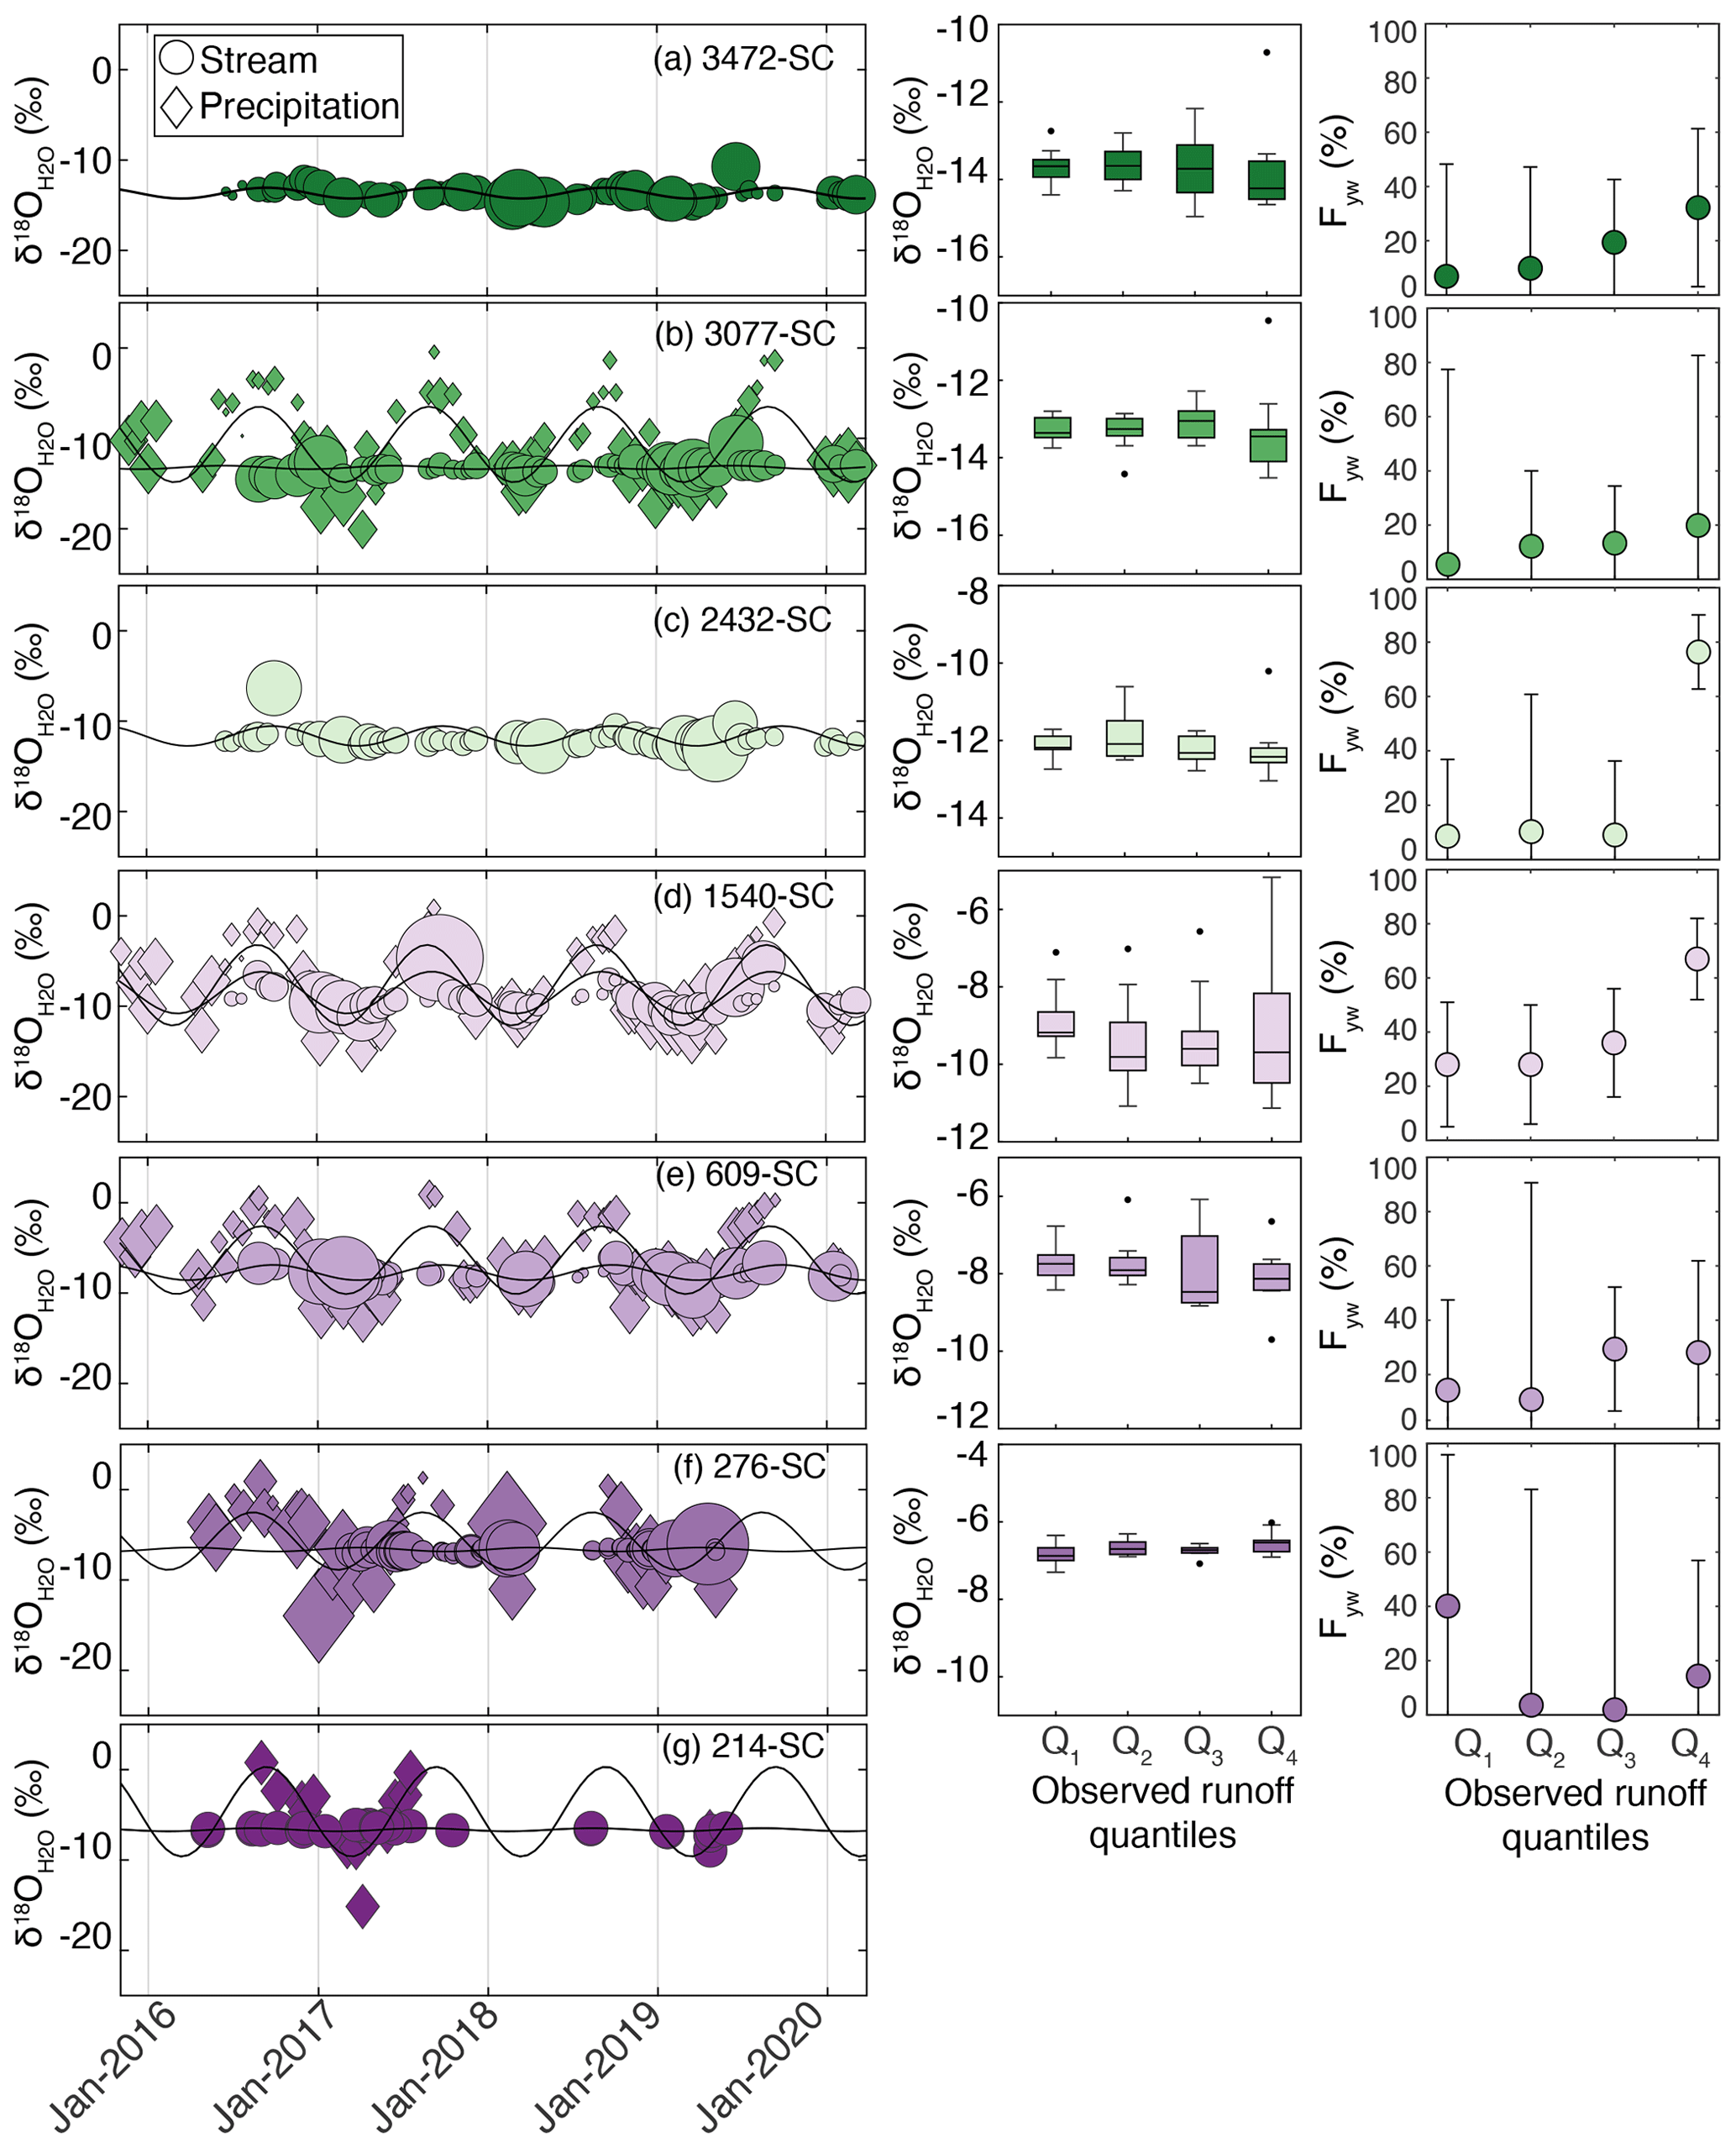
Figure 7(a–g) (solid circles) and (open diamonds) from twice-monthly sampling campaigns in each small catchment. The circles and diamonds are scaled using runoff and rainfall weights. Solid black lines indicate the weighted fit of Eq. (1) to and . Middle panel: distributions across observed quartiles (Q1= 0 %–25 %, Q2= 25 %–50 %, Q3= 50 %–75 %, Q4= 75 %–100 %) of runoff for each site. Right panel: young water fractions calculated for each quantile of observed runoff values; note that large uncertainties preclude extensive interpretation, but differences between catchments persist across all ranges of discharge. Data in panels (a–c) are from small catchments in the mountains, panel (d) is from the mid-elevation mountain small catchment, panel (e) is from the foothill small catchment, and panels (f, g) are from the foreland floodplain small catchment. Limited data from 214-SC prevented calculation as a function of runoff quartiles.
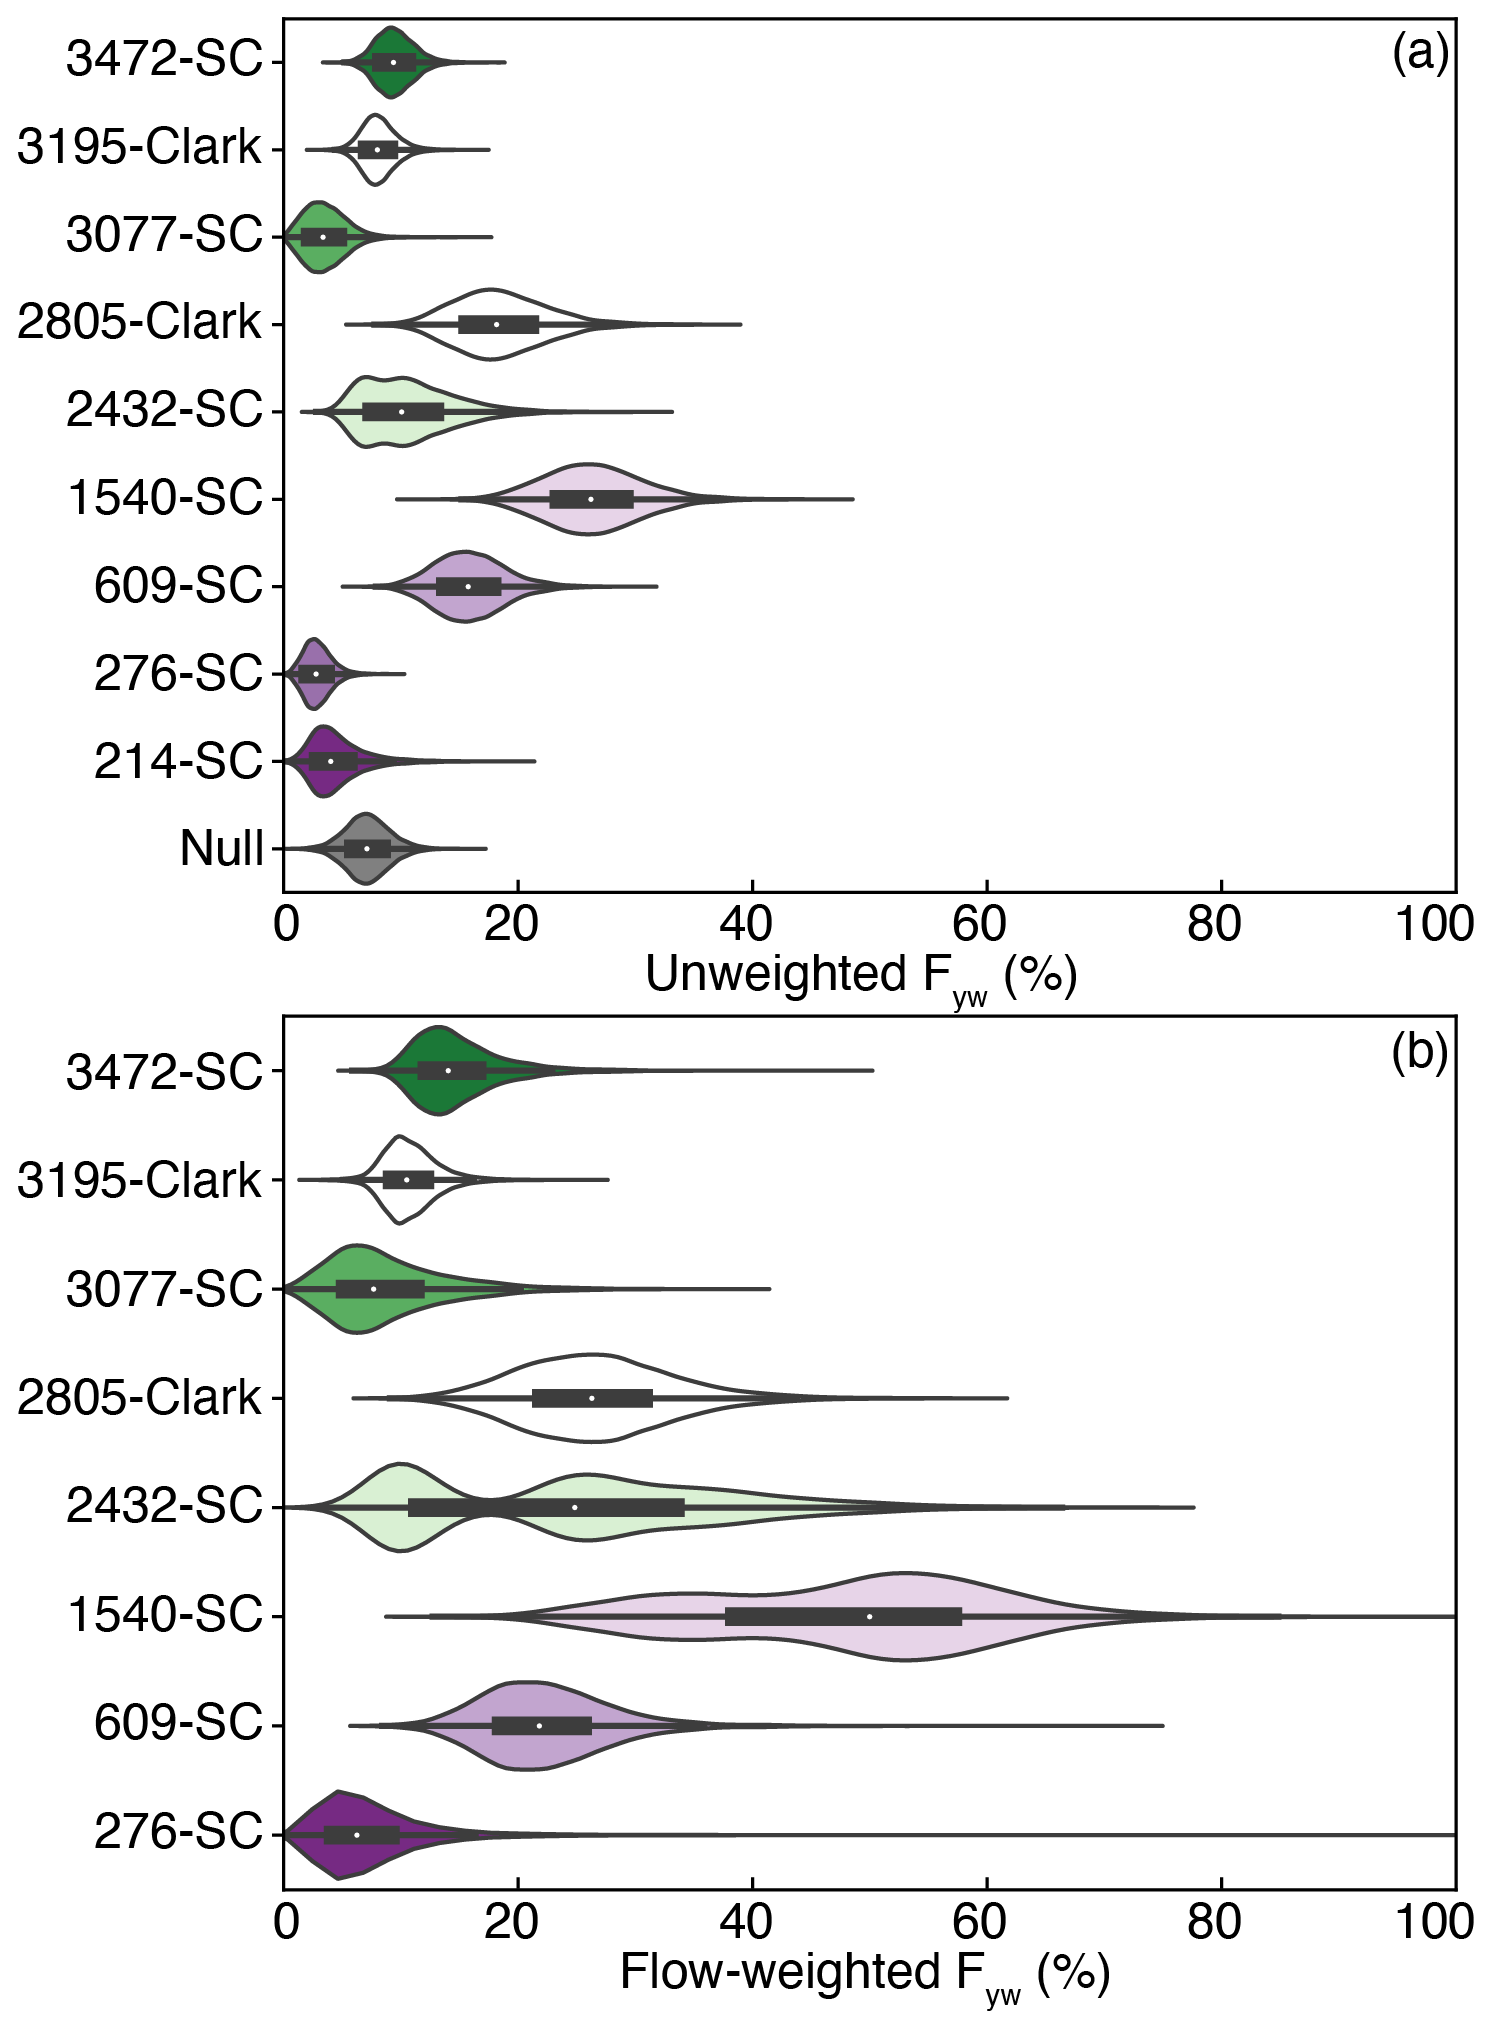
Figure 8Unweighted (a) and weighted (b) stream young water fractions for all catchments and a null dataset.
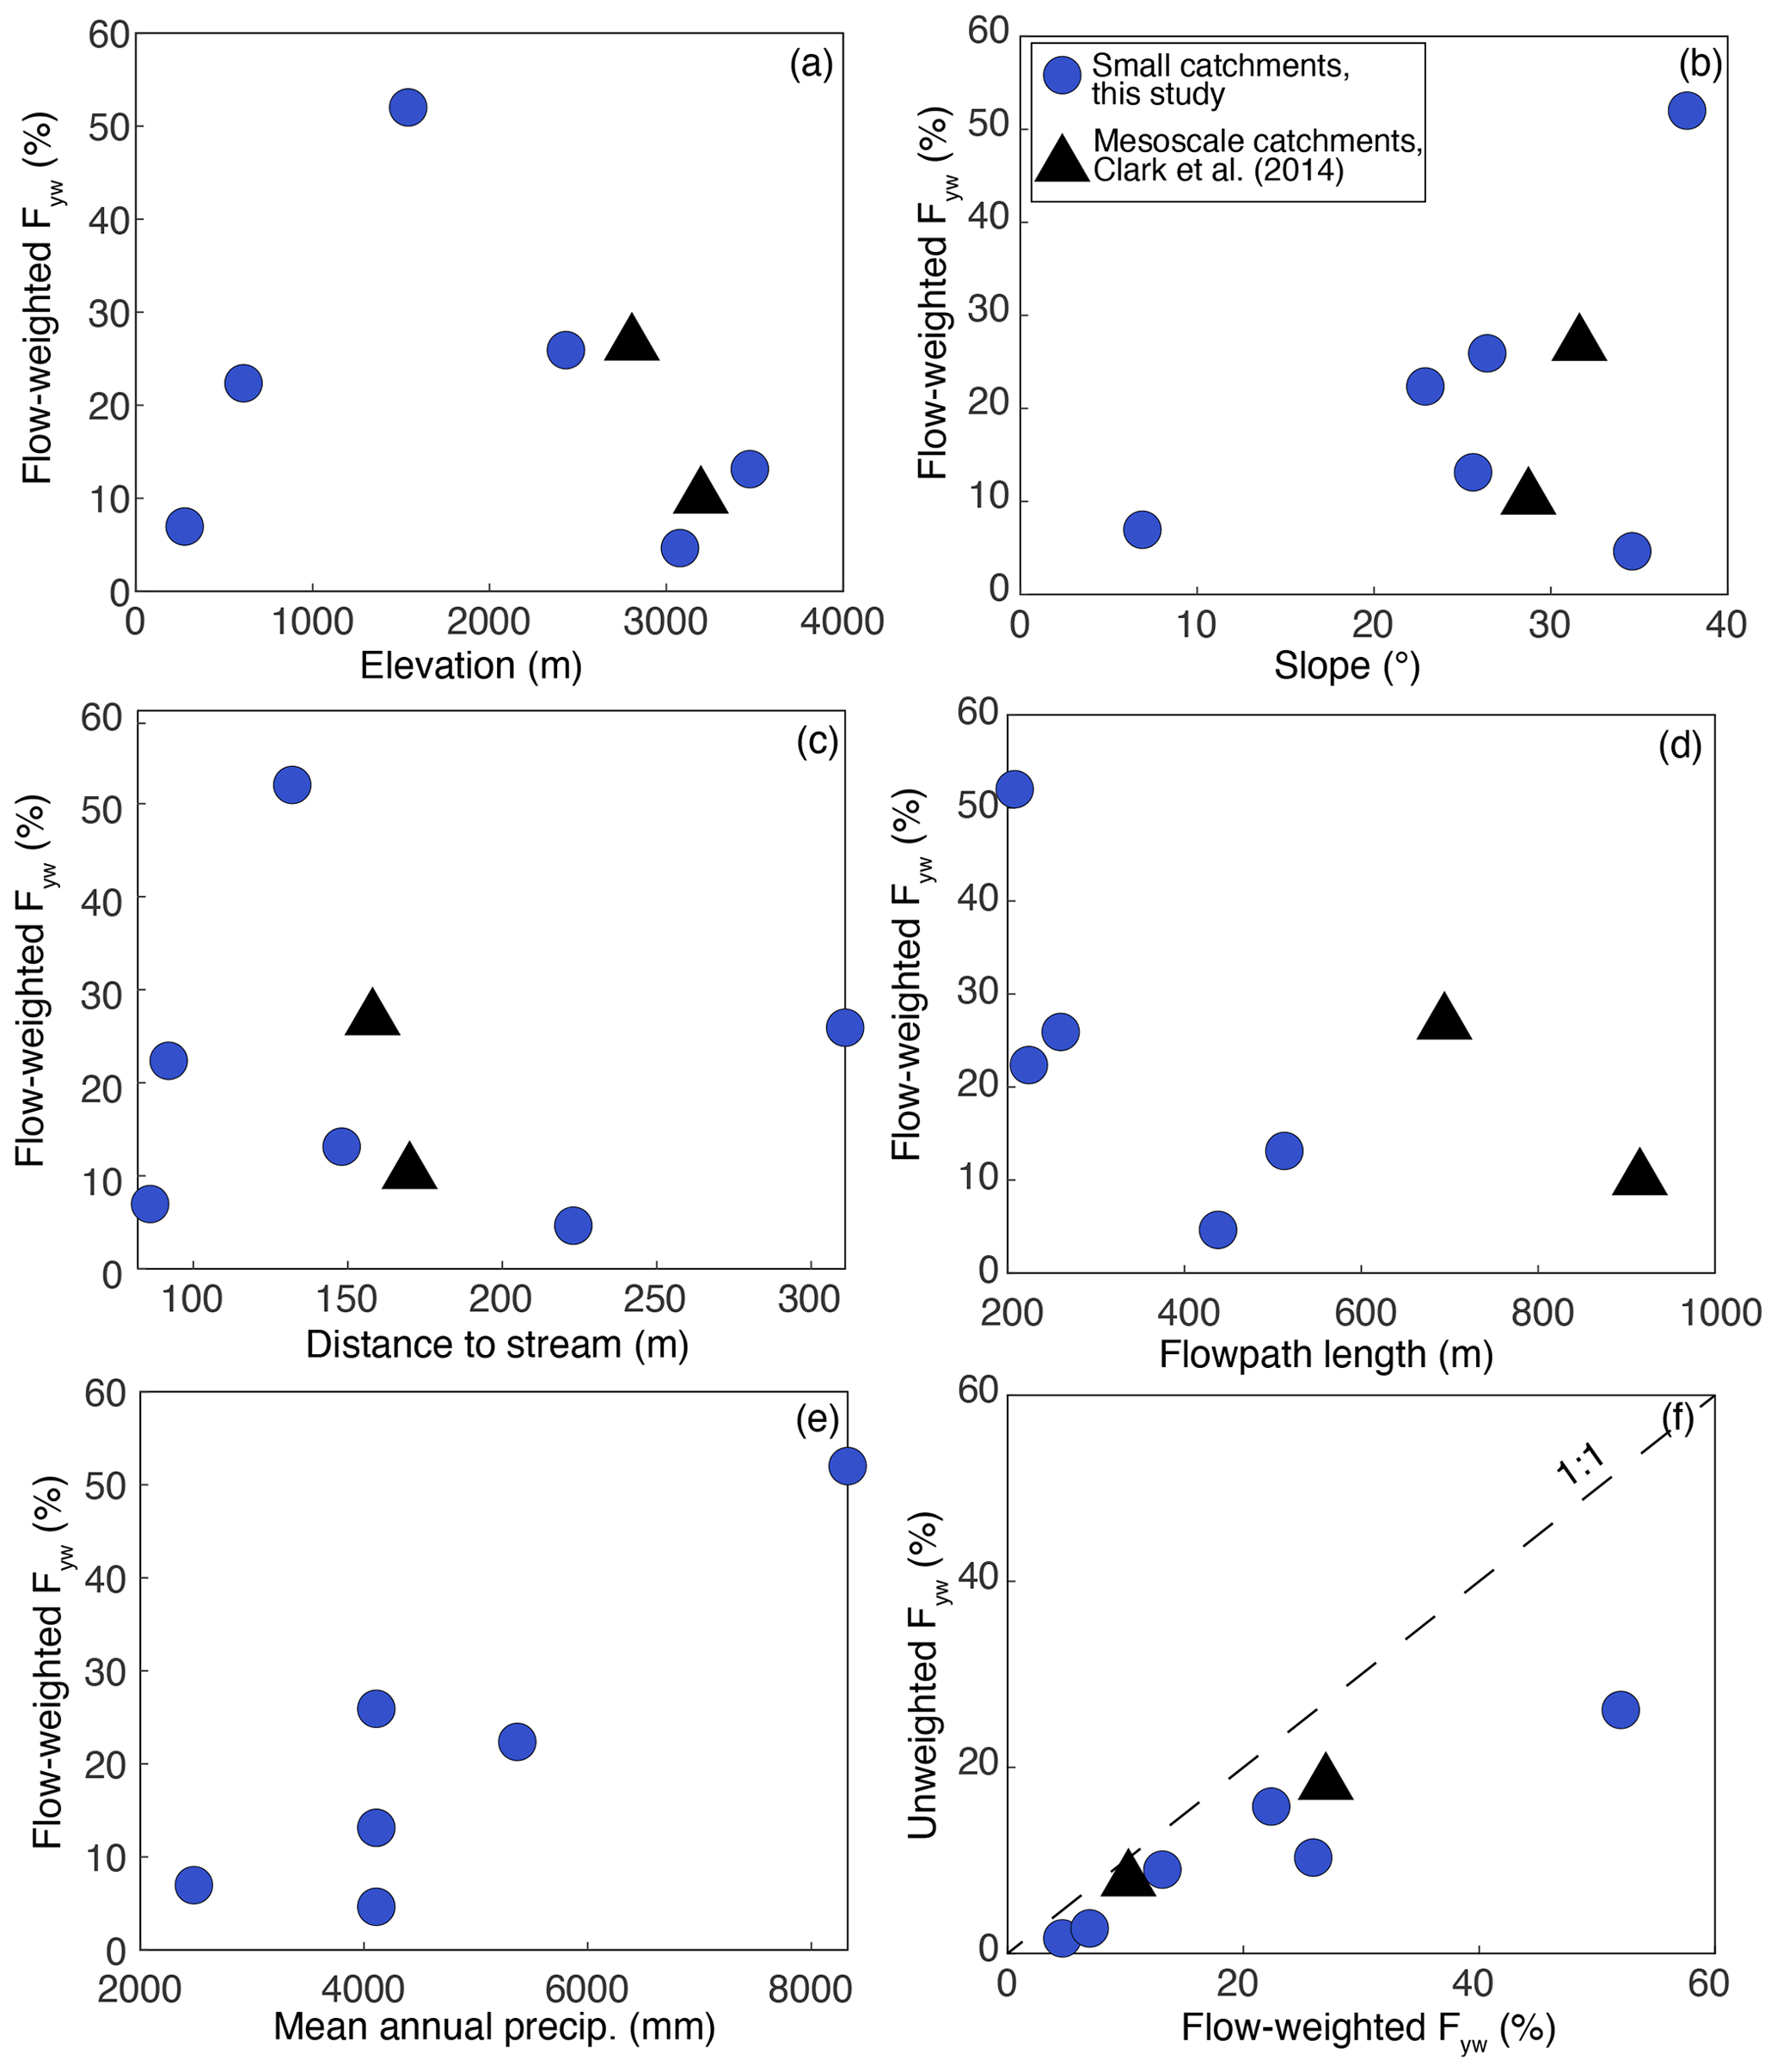
Figure 9Flow-weighted Fyw as a function of (a) catchment elevation at the sampling point for the small catchments and mean catchment elevation for the mesoscale catchments, (b) mean catchment slope, (c) median distance to the stream network along flow paths, (d) median length of all flow paths from their origin to the catchment outlet, and (e) mean annual precipitation at the nearest rain gauge to each catchment. Panel (f) compares flow-weighted mean Fyw to unweighted mean Fyw. Circles represent small catchments from this study, and triangles represent mesoscale catchments from Clark et al. (2014).
4.1 Hydroclimate and permeability control stream young water fractions
The small catchments in the high Andes mountains (3472-SC, 3077-SC, and 2432-SC) all have low Fyw, with flow-weighted Fyw between 5 % and 26 % and relatively tight distributions resulting from the bootstrap resampling routine. The mid-elevation small catchments show a wider range of bootstrap Fyw values tending toward much higher Fyw (Fig. 8). A larger range of Fyw values obtained from the bootstrap resampling routine indicates that the Fyw is sensitive to the inclusion or exclusion of points that lead to higher Fyw (i.e., streams with greater amplitude in δ18O have more variable isotope values that lead to a wider spread of Fyw values). The Fyw values inferred from the mesoscale catchments studied by Clark et al. (2014) are consistent with the patterns from the small catchments. The mesoscale catchment in the high Andes has a similar Fyw to that of the high-elevation small catchments (flow-weighted Fyw=10 %). In contrast, the mesoscale catchment that spans across the high elevations to mid-elevations (2805-Clark) has a flow-weighted Fyw of 27 %, consistent with a mixture of water with low Fyw from upstream portions of the study region and water with high Fyw from the mid-elevations. Overall, our data point to low and tightly distributed Fyw in the high mountains but higher and more broadly distributed Fyw in the mid-elevations.
The Fyw values found in this study are broadly similar to those from other mountainous regions previously studied but with some potentially interesting differences. Mountainous watersheds in Germany were found to have a flow-weighted median Fyw of 13 % and a 10th–90th percentile range of 4 %–17 % (Lutz et al., 2018), while Swiss Alpine streams had a flow-weighted median Fyw of 20 % and a 10th–90th percentile range of 10 %–38 % (von Freyburg et al., 2019). In comparison, the high Andean sites in this study have flow-weighted Fyw of 5 %–26 % at the lower end of these other studies, while the mid-elevation mountainous sites (1540-SC and 2805-Clark) had somewhat higher flow-weighted Fyw (52 % and 27 %, respectively) than found previously. Potential reasons for these differences are discussed below. At larger spatial scales, Jasechko et al. (2019) found a global flow-weighted mean Fyw of 34 % and a 10th–90th percentile range of 4 %–53 %. The Andes–Amazon results all fall within these global ranges, although the lowland sites have amongst the lowest Fyw observed anywhere (flow-weighted Fyw=7 %, unweighted Fyw=3 %).
We attribute the low Fyw observed in the high-mountain sites in our study at least in part to high permeability of the fractured shale bedrock. Fractures create conduits for fluid flow that can be magnified by dissolution of reactive minerals, such as the sulfides that are relatively abundant in the Paleozoic shale underlying our Andes mountain catchments. Previous studies of stream hydrochemistry in the region have emphasized the importance of sulfide mineral oxidation as a primary weathering process (Burt et al., 2021; Torres et al., 2016), and pyrite oxidation is known to generate porosity and permeability in shale bedrock (Gu et al., 2020). In our conceptual model of water transit, the combination of pore-scale chemical weathering and regional stresses creates a fractured subsurface that is conducive to long fluid flow paths, leading to overall low young water fractions in Andean streams.
The mid-elevation catchments differ in two respects that we think can explain the distinct transit times inferred for these streams. The higher Fyw values for watersheds between 2805 and 609 m coincide with a shift to a flashier hydroclimate: there are more rainfall events of higher magnitude at the mid-elevations compared to either the high Andes or the Amazon lowlands (Fig. 3a; see also Clark et al., 2016). Correspondingly, the stream hydrograph at 609-SC is flashier than at 3077-SC (Fig. 3b; these are the two catchments with a semi-continuous discharge record). A comparison of stream baseflow indices for sites 3077-SC and 609-SC shows a higher baseflow index for site 3077-SC (BFI = 0.77) and a lower baseflow index for site 609-SC (BFI = 0.64). We interpret the first-order shift in Fyw values from the high Andes (where baseflow indices are high) to the mid-elevations (where baseflow indices are lower) as being related to this change towards a wetter, stormier climate, suggesting a primary role for hydroclimate forcing in determining transit times in these mountainous catchments. An important role for precipitation and discharge regimes has emerged from other recent transit time studies focused on single catchments with higher-temporal-resolution data collection (Gallart et al., 2020b; von Freyberg et al., 2018b; Stockinger et al., 2016). We see some slight variability in the amplitude of as a function of discharge in our results (Fig. 6, following Gallart et al., 2020b). These trends are consistent with our interpretation that the precipitation regime plays a key role in determining water transit times at our sites, but we lack data across the range of discharge that would be needed for robust quantitative analysis of this effect. Higher-frequency sampling across gradients such as those in the Andes, though daunting given the logistical challenges of this environment, would be an interesting target for future work.
Superimposed on the overall differences that characterize the mid-elevation catchments, the Fyw in 1540-SC stands out as especially high (Fig. 9; flow-weighted Fyw >50 %). Unlike the other catchments in our study that are characterized by sedimentary bedrock, this catchment is underlain by a granitic intrusion (Clark et al., 2014). The especially high Fyw in this part of the study region may be related to the low permeability of this granite bedrock, which would prevent water from infiltrating deeply and which leads to rapid, near-surface flow paths over the steep topography. In their study in Oregon, USA, Hale et al. (2016) found that catchments with low-permeability bedrock showed much shorter water transit times than catchments with high-permeability bedrock and a stronger relationship between topography and water transit times. The high Fyw values we find at site 1540-SC are consistent with the argument that low-permeability bedrock and steep slopes contribute to deliver water to streams quickly. Thus, site 1540-SC highlights overlapping impacts of hydroclimate and lithology on Fyw in this setting: this catchment has the highest Fyw and a combination of high total precipitation and low-permeability granite bedrock. However, with our present data, it is not possible to distinguish which variable (hydroclimate or lithology) exerts a stronger control on Fyw.
4.2 Implications for the role of mountains in modulating water, erosional, and biogeochemical fluxes
The role of mountains as water towers, and particularly the response of these freshwater resources to climate change, depends in part on water transit times through mountain catchments. In revealing the importance of hydroclimate in determining transit times through mountain catchments, our results suggest that shifting precipitation regimes may be important in determining not just how much precipitation falls over mountain regions (or indeed the balance of snow and rain), but also the fate of precipitation as it makes its way through mountain catchments. If our spatial comparison of catchments across the Andes–Amazon region translates to temporal trends, then a flashier rainfall regime in the future might be expected to produce a wider range of transit times including higher young water fractions in streams draining mountainous terrain.
Our observations of higher young water factions at catchments with more precipitation echo other studies showing that the young water fraction increases at higher discharge (Gallart et al., 2020b; von Freyberg et al., 2018a). In this sense, our results are also consistent with recent studies suggesting that catchments can amplify rainfall variability (Müller Schmied et al., 2021) and that the young water fraction can vary on interannual timescales and is vulnerable to extreme weather events (Stockinger et al., 2019). The implications for downstream flooding and the buffering of droughts may warrant further consideration.
The hydrology of mountainous catchments may play important geological roles too. River discharge, and particularly discharge variability, exerts a primary control on erosion (e.g., Tucker and Bras, 2000). Longer transit times may dampen the relationship between precipitation variability and the river incision that drives mountain erosion; systematic relationships between topography and water transit times could therefore either dampen or amplify the erosional efficiency of a given precipitation regime. Catchment hydrology has also been invoked as central to the role of mountain building in the global carbon cycle over geologic timescales (Maher and Chamberlain, 2014). This argument depends on both the exposure of fresh minerals for chemical weathering by rapid erosion and systematic changes in hydrologic flow paths associated with mountain building. The mountainous sites within this study display a wide range of values in flow-weighted Fyw (from ∼ 5 % to 52 %; Fig. 9), with no systematic relationship between topography and Fyw. Although a global compilation of stream Fyw shows a general negative correlation between topographic relief and Fyw (Jasechko et al., 2016), that relationship is notably weak – and the Fyw from the small catchments studied here emphasize how other environmental factors (hydroclimate, catchment architecture) play important roles in determining the Fyw of streamflow. Moreover, when comparing across the high Andes and Amazon lowlands, there is remarkably little difference in Fyw despite dramatic differences in topography: catchments with average slope angles of ∼5 and ∼35∘ have similar flow-weighted Fyw: 5 % for site 3077-SC and 7 % for site 276-SC. This result argues against a systematic shift in water transit times associated with mountain building but rather for a variable response modulated by climatic and geologic factors – although our results do point to a wider range in Fyw associated with mountains rather than lowlands, at least for the tropical setting of the Andes–Amazon system.
While our results, and especially the Fyw of lowland catchments, may be specific to the Andes–Amazon setting, we expect the hydroclimatic and geological effects that we document here to be more generally relevant in other mountainous regions too. Orographic controls on precipitation tend to force the highest precipitation and the most intense rainfall along mountain fronts and at mid-elevations. In addition to the Andes, similar patterns have been shown in the Himalaya (Bookhagen and Burbank, 2006) and the European Alps (Napoli et al., 2019), and models predict complex spatial patterns of orographic precipitation that depend on several factors including climatic variables (e.g., Barros and Lettenmaier, 1994; Roe and Baker, 2006). The dependence of catchment transit times on hydroclimate, as we find in the Andes and as reported in other recent work (von Freyberg et al., 2018b; Gallart et al., 2020b), suggests that orographic effects on the rainfall regime may be a primary determinant of hydrologic processes in major mountain ranges. Similarly, we expect fractured bedrock and the associated high permeability to be generally characteristic of mountain systems as seen in our work and other studies (e.g., Muñoz-Villers et al., 2016; Moon et al., 2017), though our results also highlight how the geological complexity of mountains – such as the presence of a granitic intrusion in our study area of the Andes – can introduce heterogeneity. Full understanding of the role of mountainous regions in water, sediment, and geochemical cycles will depend on evaluating the role of these multiple factors in determining hydrological behavior.
We collected stream and precipitation samples for analysis of O and H stable isotope ratios at seven streams and four rainfall stations spanning the Andes–Amazon gradient. Samples were collected approximately twice monthly over a period of 4 years. The calculated stream young water fraction varied significantly between the sites. For the highest-elevation sites (3472-SC, 3077-SC, and 2432-SC), flow-weighted young water fractions varied between 5 % and 26 %. For the mid-elevation small catchments (1540-SC and 609-SC), flow-weighted young water fractions were higher, at 22 %–52 %. Catchments in the foreland floodplain had low young water fractions of 7 % when flow-weighted and 2 %–3 % when not weighted.
We suggest that the low young water fractions for the Andean catchments are a result of long flow paths in fractured shale. High young water fractions observed at mid-elevation sites result from a stormier climate and, in the case of 1540-SC, granitic bedrock with poorly developed soils and low permeability, meaning that water moves through the catchment more quickly. In the lowlands, low-permeability clay terraces and low relief together generate low young water fractions, highlighting the importance of the very low surface topography gradients in this setting. Thus, a combination of topography, climate, and bedrock properties conspires to determine water transit across the Andes–Amazon transition. Our results emphasize the complexity of the role of mountainous regions in the hydrological cycle with more factors than just topography likely to control young water fractions at the global scale. Accounting for the multiple factors that control water transit will be important for fully understanding the role of mountain water towers in water, sediment, and carbon fluxes.
Stream water and precipitation water isotope data as well as the MATLAB code for young water fraction analysis and the bootstrap resampling routine are available online via https://doi.org/10.4211/hs.c01ef51ca2b3495785d0f24c62142e23 (Burt et al., 2023).
EIB and AJW designed the study with input from DHCR and AJCQ. EIB, DHCR, and AJCQ carried out the monitoring. EIB analyzed the samples and did the data analysis with input from AJW. AJW and AA carried out the topographic analyses. EIB and AJW wrote the manuscript.
The contact author has declared that none of the authors has any competing interests.
Publisher’s note: Copernicus Publications remains neutral with regard to jurisdictional claims in published maps and institutional affiliations.
We thank the Andes Biodiversity and Ecosystem Research Group (ABERG) for field support and access to rainfall data. ABERG rainfall data were collected with the support of NSF DEB LTREB award 1754647 to Miles Silman. We thank Alex Sessions and Fenfang Wu at Caltech, Markus Bill at Lawrence Berkeley National Laboratory, and Fernando Silva at Chapman University for support with the stable isotope measurements. We thank Greg Goldsmith for support with stable isotope measurements and for helpful discussions. We thank Julien Emile-Geay for helpful discussions with respect to data analysis.
This research has been supported by the National Science Foundation (grant no. EAR-1455352).
This paper was edited by Markus Hrachowitz and reviewed by Francesc Gallart and one anonymous referee.
Allen, S. T., Kirchner, J. W., Braun, S., Siegwolf, R. T. W., and Goldsmith, G. R.: Seasonal origins of soil water used by trees, Hydrol. Earth Syst. Sci., 23, 1199–1210, https://doi.org/10.5194/hess-23-1199-2019, 2019.
Ameli, A. A., Beven, K., Erlandsson, M., Creed, I. F., McDonnell, J. J., and Bishop, K.: Primary weathering rates, water transit times, and concentration-discharge relations: A theoretical analysis for the critical zone: Weathering Rate, Permeability, Stream C-Q, Water Resour. Res., 53, 942–960, https://doi.org/10.1002/2016WR019448, 2017.
Asano, Y. and Uchida, T.: Flow path depth is the main controller of mean base flow transit times in a mountainous catchment: Flow Path Depth Controls Transit Times, Water Resour. Res., 48, W03512, https://doi.org/10.1029/2011WR010906, 2012.
Asner, G. P., Martin, R. E., Anderson, C. B., Kryston, K., Vaughn, N., Knapp, D. E., Bentley, L. P., Shenkin, A., Salinas, N., Sinca, F., Tupayachi, R., Quispe Huaypar, K., Montoya Pillco, M., Ccori Álvarez, F. D., Díaz, S., Enquist, B. J., and Malhi, Y.: Scale dependence of canopy trait distributions along a tropical forest elevation gradient, New Phytol., 214, 973–988, https://doi.org/10.1111/nph.14068, 2017.
Atwood, A. and West, A. J.: Evaluation of high-resolution DEMs from satellite imagery for geomorphic applications: A case study using the SETSM algorithm, Earth Surf. Proc. Land., 47, 706–722, https://doi.org/10.1002/esp.5263, 2022.
Barnett, T. P., Adam, J. C., and Lettenmaier, D. P.: Potential impacts of a warming climate on water availability in snow-dominated regions, Nature, 438, 303–309, https://doi.org/10.1038/nature04141, 2005.
Barros, A. P. and Lettenmaier, D. P.: Dynamic modeling of orographically induced precipitation, Rev. Geophys., 32, 265, https://doi.org/10.1029/94RG00625, 1994.
Benettin, P., Rodriguez, N. B., Sprenger, M., Kim, M., Klaus, J., Harman, C. J., van der Velde, Y., Hrachowitz, M., Botter, G., McGuire, K. J., Kirchner, J. W., Rinaldo, A., and McDonnell, J. J.: Transit Time Estimation in Catchments: Recent Developments and Future Directions, Water Resour. Res., 58, https://doi.org/10.1029/2022WR033096, 2022.
Berner, R. A.: Rate control of mineral dissolution under Earth surface conditions, Am. J. Sci., 278, 1235–1252, https://doi.org/10.2475/ajs.278.9.1235, 1978.
Bookhagen, B. and Burbank, D. W.: Topography, relief, and TRMM-derived rainfall variations along the Himalaya, Geophys. Res. Lett., 33, L08405, https://doi.org/10.1029/2006GL026037, 2006.
Burt, E. I., Bill, M., Conrad, M. E., Quispe, A. J. C., Christensen, J. N., Hilton, R. G., Dellinger, M., and West, A. J.: Conservative transport of dissolved sulfate across the Rio Madre de Dios floodplain in Peru, Geology, 49, 1064–1068, https://doi.org/10.1130/G48997.1, 2021.
Burt, E., Rimachi, D. H. C., Quispe, A. J. C., and West, A. J.: Oxygen and hydrogen isotopes in streams and precipitation and young water fractions across the Andes mountains and Amazon floodplain, HydroShare, https://doi.org/10.4211/hs.c01ef51ca2b3495785d0f24c62142e23, 2023.
Clark, K. E., Torres, M. A., West, A. J., Hilton, R. G., New, M., Horwath, A. B., Fisher, J. B., Rapp, J. M., Robles Caceres, A., and Malhi, Y.: The hydrological regime of a forested tropical Andean catchment, Hydrol. Earth Syst. Sci., 18, 5377–5397, https://doi.org/10.5194/hess-18-5377-2014, 2014.
Clark, K. E., West, A. J., Hilton, R. G., Asner, G. P., Quesada, C. A., Silman, M. R., Saatchi, S. S., Farfan-Rios, W., Martin, R. E., Horwath, A. B., Halladay, K., New, M., and Malhi, Y.: Storm-triggered landslides in the Peruvian Andes and implications for topography, carbon cycles, and biodiversity, Earth Surf. Dynam., 4, 47–70, https://doi.org/10.5194/esurf-4-47-2016, 2016.
Fekete, B. M., Vörösmarty, C. J., and Grabs, W.: High-resolution fields of global runoff combining observed river discharge and simulated water balances: High-resolution composite runoff fields, Global Biogeochem. Cy., 16, 15-1–15-10, https://doi.org/10.1029/1999GB001254, 2002.
Gaillardet, J., Dupré, B., Louvat, P., and Allègre, C. J.: Global silicate weathering and CO2 consumption rates deduced from the chemistry of large rivers, Chem. Geol., 159, 3–30, https://doi.org/10.1016/S0009-2541(99)00031-5, 1999.
Gallart, F., Valiente, M., Llorens, P., Cayuela, C., Sprenger, M., and Latron, J.: Investigating young water fractions in a small Mediterranean mountain catchment: Both precipitation forcing and sampling frequency matter, Hydrol. Process., 34, 3618–3634, https://doi.org/10.1002/hyp.13806, 2020a.
Gallart, F., von Freyberg, J., Valiente, M., Kirchner, J. W., Llorens, P., and Latron, J.: Technical note: An improved discharge sensitivity metric for young water fractions, Hydrol. Earth Syst. Sci., 24, 1101–1107, https://doi.org/10.5194/hess-24-1101-2020, 2020b.
GRASS Development Team: Geographic Resources Analysis Support System (GRASS) Software, Version 8.2. Open Source Geospatial Foundation, Electronic document, https://grass.osgeo.org (last access: 1 April 2023), 2022.
Gu, X., Rempe, D. M., Dietrich, W. E., West, A. J., Lin, T.-C., Jin, L., and Brantley, S. L.: Chemical reactions, porosity, and microfracturing in shale during weathering: The effect of erosion rate, Geochim. Cosmochim. Acta, 269, 63–100, https://doi.org/10.1016/j.gca.2019.09.044, 2020.
Hale, V. C. and McDonnell, J. J.: Effect of bedrock permeability on stream base flow mean transit time scaling relations: 1. A multiscale catchment intercomparison: bedrock permeability and mtt scaling relationships: part 1, Water Resour. Res., 52, 1358–1374, https://doi.org/10.1002/2014WR016124, 2016.
Hale, V. C., McDonnell, J. J., Stewart, M. K., Solomon, D. K., Doolitte, J., Ice, G. G., and Pack, R. T.: Effect of bedrock permeability on stream base flow mean transit time scaling relationships: 2. Process study of storage and release: bedrock permeability and mtt scaling relationships: part 2, Water Resour. Res., 52, 1375–1397, https://doi.org/10.1002/2015WR017660, 2016.
Immerzeel, W. W., Lutz, A. F., Andrade, M., Bahl, A., Biemans, H., Bolch, T., Hyde, S., Brumby, S., Davies, B. J., Elmore, A. C., Emmer, A., Feng, M., Fernández, A., Haritashya, U., Kargel, J. S., Koppes, M., Kraaijenbrink, P. D. A., Kulkarni, A. V., Mayewski, P. A., Nepal, S., Pacheco, P., Painter, T. H., Pellicciotti, F., Rajaram, H., Rupper, S., Sinisalo, A., Shrestha, A. B., Viviroli, D., Wada, Y., Xiao, C., Yao, T., and Baillie, J. E. M.: Importance and vulnerability of the world's water towers, Nature, 577, 364–369, https://doi.org/10.1038/s41586-019-1822-y, 2020.
Jasechko, S.: Partitioning young and old groundwater with geochemical tracers, Chem. Geol., 427, 35–42, https://doi.org/10.1016/j.chemgeo.2016.02.012, 2016.
Jasechko, S., Kirchner, J. W., Welker, J. M., and McDonnell, J. J.: Substantial proportion of global streamflow less than three months old, Nat. Geosci., 9, 126–129, https://doi.org/10.1038/ngeo2636, 2016.
Jasiewicz, J. and Metz, M.: A new GRASS GIS toolkit for Hortonian analysis of drainage networks, Comput. Geosci., 37, 1162–1173, https://doi.org/10.1016/j.cageo.2011.03.003, 2011.
Kirchner, J. W.: Aggregation in environmental systems – Part 1: Seasonal tracer cycles quantify young water fractions, but not mean transit times, in spatially heterogeneous catchments, Hydrol. Earth Syst. Sci., 20, 279–297, https://doi.org/10.5194/hess-20-279-2016, 2016a.
Kirchner, J. W.: Aggregation in environmental systems – Part 2: Catchment mean transit times and young water fractions under hydrologic nonstationarity, Hydrol. Earth Syst. Sci., 20, 299–328, https://doi.org/10.5194/hess-20-299-2016, 2016b.
Kirchner, J. W. and Allen, S. T.: Seasonal partitioning of precipitation between streamflow and evapotranspiration, inferred from end-member splitting analysis, Hydrol. Earth Syst. Sci., 24, 17–39, https://doi.org/10.5194/hess-24-17-2020, 2020.
Lutz, S. R., Krieg, R., Müller, C., Zink, M., Knöller, K., Samaniego, L., and Merz, R.: Spatial Patterns of Water Age: Using Young Water Fractions to Improve the Characterization of Transit Times in Contrasting Catchments, Water Resour. Res., 54, 4767–4784, https://doi.org/10.1029/2017WR022216, 2018.
Maher, K.: The dependence of chemical weathering rates on fluid residence time, Earth Planet. Sci. Lett., 294, 101–110, https://doi.org/10.1016/j.epsl.2010.03.010, 2010.
Maher, K.: The role of fluid residence time and topographic scales in determining chemical fluxes from landscapes, Earth Planet. Sci. Lett., 312, 48–58, https://doi.org/10.1016/j.epsl.2011.09.040, 2011.
Maher, K. and Chamberlain, C. P.: Hydrologic Regulation of Chemical Weathering and the Geologic Carbon Cycle, Science, 343, 1502–1504, https://doi.org/10.1126/science.1250770, 2014.
Małoszewski, P. and Zuber, A.: Determining the turnover time of groundwater systems with the aid of environmental tracers, J. Hydrol., 57, 207–231, https://doi.org/10.1016/0022-1694(82)90147-0, 1982.
McGlynn, B., McDonnell, J., Stewart, M., and Seibert, J.: On the relationships between catchment scale and streamwater mean residence time, Hydrol. Process., 17, 175–181, https://doi.org/10.1002/hyp.5085, 2003.
McGuire, K. J. and McDonnell, J. J.: A review and evaluation of catchment transit time modeling, J. Hydrol., 330, 543–563, https://doi.org/10.1016/j.jhydrol.2006.04.020, 2006.
McGuire, K. J., McDonnell, J. J., Weiler, M., Kendall, C., McGlynn, B. L., Welker, J. M., and Seibert, J.: The role of topography on catchment-scale water residence time: catchment-scale water residence time, Water Resour. Res., 41, W05002, https://doi.org/10.1029/2004WR003657, 2005.
Meybeck, M.: Global chemical weathering of surficial rocks estimated from river dissolved loads, Am. J. Sci., 287, 401, https://doi.org/10.2475/ajs.287.5.401, 1987.
Moon, S., Perron, J. T., Martel, S. J., Holbrook, W. S., and St. Clair, J.: A model of three-dimensional topographic stresses with implications for bedrock fractures, surface processes, and landscape evolution: Three-Dimensional Topographic Stress, J. Geophys. Res.-Earth, 122, 823–846, https://doi.org/10.1002/2016JF004155, 2017.
Müller Schmied, H., Cáceres, D., Eisner, S., Flörke, M., Herbert, C., Niemann, C., Peiris, T. A., Popat, E., Portmann, F. T., Reinecke, R., Schumacher, M., Shadkam, S., Telteu, C.-E., Trautmann, T., and Döll, P.: The global water resources and use model WaterGAP v2.2d: model description and evaluation, Geosci. Model Dev., 14, 1037–1079, https://doi.org/10.5194/gmd-14-1037-2021, 2021.
Muñoz-Villers, L. E., Geissert, D. R., Holwerda, F., and McDonnell, J. J.: Factors influencing stream baseflow transit times in tropical montane watersheds, Hydrol. Earth Syst. Sci., 20, 1621–1635, https://doi.org/10.5194/hess-20-1621-2016, 2016a.
Muñoz-Villers, L. E., Geissert, D. R., Holwerda, F., and McDonnell, J. J.: Factors influencing stream baseflow transit times in tropical montane watersheds, Hydrol. Earth Syst. Sci., 20, 1621–1635, https://doi.org/10.5194/hess-20-1621-2016, 2016b.
Napoli, A., Crespi, A., Ragone, F., Maugeri, M., and Pasquero, C.: Variability of orographic enhancement of precipitation in the Alpine region, Sci. Rep., 9, 13352, https://doi.org/10.1038/s41598-019-49974-5, 2019.
Noh, M.-J. and Howat, I. M.: Automated stereo-photogrammetric DEM generation at high latitudes: Surface Extraction with TIN-based Search-space Minimization (SETSM) validation and demonstration over glaciated regions, GIScience Remote Sens., 52, 198–217, https://doi.org/10.1080/15481603.2015.1008621, 2015.
Pitman, N. C. A., Terborgh, J. W., Silman, M. R., Núñez V, P., Neill, D. A., Cerón, C. E., Palacios, W. A., and Aulestia, M.: dominance and distribution of tree species in upper amazonian terra firme forests, Ecology, 82, 2101–2117, https://doi.org/10.1890/0012-9658(2001)082[2101:DADOTS]2.0.CO;2, 2001.
Ponton, C., West, A. J., Feakins, S. J., and Galy, V.: Leaf wax biomarkers in transit record river catchment composition, Geophys. Res. Lett., 41, 6420–6427, https://doi.org/10.1002/2014GL061328, 2014.
Rapp, J. and Silman, M.: Diurnal, seasonal, and altitudinal trends in microclimate across a tropical montane cloud forest, Clim. Res., 55, 17–32, https://doi.org/10.3354/cr01127, 2012.
Rempe, D. M. and Dietrich, W. E.: Direct observations of rock moisture, a hidden component of the hydrologic cycle, P. Natl. Acad. Sci. USA, 115, 2664–2669, https://doi.org/10.1073/pnas.1800141115, 2018.
Roe, G. H. and Baker, M. B.: Microphysical and Geometrical Controls on the Pattern of Orographic Precipitation, J. Atmos. Sci., 63, 861–880, https://doi.org/10.1175/JAS3619.1, 2006.
Stockinger, M. P., Bogena, H. R., Lücke, A., Diekkrüger, B., Cornelissen, T., and Vereecken, H.: Tracer sampling frequency influences estimates of young water fraction and streamwater transit time distribution, J. Hydrol., 541, 952–964, https://doi.org/10.1016/j.jhydrol.2016.08.007, 2016.
Stockinger, M. P., Bogena, H. R., Lücke, A., Stumpp, C., and Vereecken, H.: Time variability and uncertainty in the fraction of young water in a small headwater catchment, Hydrol. Earth Syst. Sci., 23, 4333–4347, https://doi.org/10.5194/hess-23-4333-2019, 2019.
Tang, W. and Carey, S. K.: HydRun: A MATLAB toolbox for rainfall-runoff analysis, Hydrol. Process., 31, 2670–2682, https://doi.org/10.1002/hyp.11185, 2017.
Tetzlaff, D., Seibert, J., McGuire, K. J., Laudon, H., Burns, D. A., Dunn, S. M., and Soulsby, C.: How does landscape structure influence catchment transit time across different geomorphic provinces?, Hydrol. Process., 23, 945–953, https://doi.org/10.1002/hyp.7240, 2009.
Torres, M. A., West, A. J., Clark, K. E., Paris, G., Bouchez, J., Ponton, C., Feakins, S. J., Galy, V., and Adkins, J. F.: The acid and alkalinity budgets of weathering in the Andes–Amazon system: Insights into the erosional control of global biogeochemical cycles, Earth Planet. Sci. Lett., 450, 381–391, https://doi.org/10.1016/j.epsl.2016.06.012, 2016.
Tucker, G. E. and Bras, R. L.: A stochastic approach to modeling the role of rainfall variability in drainage basin evolution, Water Resour. Res., 36, 1953–1964, https://doi.org/10.1029/2000WR900065, 2000.
Viviroli, D., Dürr, H. H., Messerli, B., Meybeck, M., and Weingartner, R.: Mountains of the world, water towers for humanity: Typology, mapping, and global significance: mountains as water towers for humanity, Water Resour. Res., 43, W07447, https://doi.org/10.1029/2006WR005653, 2007.
von Freyberg, J., Allen, S. T., Seeger, S., Weiler, M., and Kirchner, J. W.: Sensitivity of young water fractions to hydro-climatic forcing and landscape properties across 22 Swiss catchments, Hydrol. Earth Syst. Sci., 22, 3841–3861, https://doi.org/10.5194/hess-22-3841-2018, 2018a.
von Freyberg, J., Allen, S. T., Seeger, S., Weiler, M., and Kirchner, J. W.: Sensitivity of young water fractions to hydro-climatic forcing and landscape properties across 22 Swiss catchments, Hydrol. Earth Syst. Sci., 22, 3841–3861, https://doi.org/10.5194/hess-22-3841-2018, 2018b.
West, A., Galy, A., and Bickle, M.: Tectonic and climatic controls on silicate weathering, Earth Planet. Sci. Lett., 235, 211–228, https://doi.org/10.1016/j.epsl.2005.03.020, 2005.
Wilusz, D. C., Harman, C. J., and Ball, W. P.: Sensitivity of Catchment Transit Times to Rainfall Variability Under Present and Future Climates, Water Resour. Res., 53, 10231–10256, https://doi.org/10.1002/2017WR020894, 2017.
Wu, M. S., West, A. J., and Feakins, S. J.: Tropical soil profiles reveal the fate of plant wax biomarkers during soil storage, Org. Geochem., 128, 1–15, https://doi.org/10.1016/j.orggeochem.2018.12.011, 2019.
Xiao, D., Brantley, S. L., and Li, L.: Vertical Connectivity Regulates Water Transit Time and Chemical Weathering at the Hillslope Scale, Water Resour. Res., 57, e2020WR029207, https://doi.org/10.1029/2020WR029207, 2021.