the Creative Commons Attribution 4.0 License.
the Creative Commons Attribution 4.0 License.
 | 01 Aug 2023
Routing stemflow water through the soil via preferential flow: a dual-labelling approach with artificial tracers
Markus Flury
Jérôme Latron
Pilar Llorens
Stemflow and its belowground funnelling along roots and macropores may play an important role in the soil moisture redistribution in forest environments. In this study, a stemflow experiment on Pinus sylvestris L. (Scots pine) used artificial tracers to view and quantify preferential flow after stemflow infiltration into the soil. A total of 41 L of water labelled with enriched deuterium and brilliant blue FCF were applied at a flow rate of 7 L h−1 to the stem of a pine tree, which corresponds to the stemflow caused by about 50 mm of rainfall. Time domain reflectometry (TDR) probes were installed around the tree trunk to measure the high-resolution volumetric water content. A total of 1 d after the stemflow discharge, soil pits were dug in the different cardinal directions and at varying distances from the tree. Photographs were taken for imaging analysis to quantify preferential flow metrics. Soil samples were taken from the different profiles to analyse the dye concentrations and isotopic compositions. We found that stemflow infiltrated through an annulus-shaped area around the tree base. We observed a heterogenous spatiotemporal soil moisture response to stemflow and the occurrence of shallow perched water tables around the tree trunk. Dye staining demonstrated that stemflow infiltrated primarily along the surface of coarse roots and through macropores. The dye coverage was less extensive close to the soil surface and increased with depth and with proximity to the tree trunk. Lateral flow was also observed, mainly in the shallow soil layers. Our analyses demonstrate the prevalence of preferential flow. Deuterium and brilliant blue FCF concentrations were significantly correlated. The tracer concentrations decreased with increasing distance from the tree trunk, indicating dilution and mixing with residual soil water. Macropores, coarse roots (living or decayed) and perched water tables produced a complex network regulating the preferential flow. Our results suggest that stemflow affects soil moisture distribution, and thus likely also groundwater recharge and surface runoff. Our study provides insights into the soil hydrological processes that are regulated by stemflow belowground funnelling and improves our understanding of forest–water interactions.
- Article
(8425 KB) - Full-text XML
-
Supplement
(1065 KB) - BibTeX
- EndNote


Rainfall interception by forest canopies prevents rainfall from immediately reaching the soil, redistributing it in the form of throughfall and stemflow. Throughfall refers to the rainwater that may or may not have contact with vegetative surfaces and falls or drips to the forest ground, whereas stemflow is the proportion of rainwater that is channelled towards the bole and eventually flows downward and reaches the forest floor around the stem base. Stemflow contributes higher amounts of water and solutes in near-stem soils than the throughfall contribution in the rest of the forest (Carlyle-Moses et al., 2018). Stemflow varies widely across vegetation types and climatic regions (Levia and Frost, 2003; Llorens and Domingo, 2007; Yue et al., 2021). Recent research has unveiled biotic and abiotic factors that regulate stemflow production before it is funnelled belowground (Levia and Germer, 2015; Cayuela et al., 2018; Zhang et al., 2021). Although stemflow is not a major proportion of the overall catchment water balance, it can saturate near-stem soil and may enhance overland or subsurface matrix flow; contribute to soil water replenishment and groundwater recharge; produce soil erosion (Levia and Germer, 2015), transport chemicals and colloids (Van Stan et al., 2021); and influence root water uptake (Hildebrandt, 2020). Due to its importance in soil hydrology, biogeochemistry and ecohydrology, stemflow has become an active topic of research in recent years (Levia et al., 2011; Tucker et al., 2020; Van Stan et al., 2020; Magyar et al., 2021; Pinos et al., 2021; Tonello et al., 2021).
Root-induced bypass flow, introduced by Johnson and Lehmann (2006) as the “double-funnelling of trees”, refers to the process whereby an aboveground funnelling occurs when rainfall concentrates into stemflow, followed by a belowground funnelling process in which stemflow infiltrates into the soil along tree roots and macropores. Once stemflow occurs, its underground infiltration is governed by a complex interplay of soil physical properties, terrain slope and root architecture. While the concept of the double-funnelling phenomenon is well known, clarification of the underlying mechanisms is more challenging. Several experimental techniques, both invasive and non-invasive, have been used to study the stemflow belowground funnelling process of trees. The most common approaches are the monitoring of water fluxes by soil moisture sensors, the viewing of preferential flow paths by dye tracers or a combination of the two (Liang et al., 2011; Schwärzel et al., 2012; Spencer and van Meerveld, 2016; Gonzalez-Ollauri et al., 2020; Tischer et al., 2020). Recently, non-invasive geophysical techniques, such as ground-penetrating radar (GPR) and electrical resistivity tomography (ERT), have also been used to study belowground funnelling processes (Guo et al., 2020; Di Prima et al., 2022). The majority of these stemflow funnelling studies (of various deciduous and evergreen trees) found that stemflow infiltration leads to vertical and horizontal preferential flow along the surface of coarse roots, although matrix stemflow infiltration has been reported as well (Gonzalez-Ollauri et al., 2020).
Despite their potential for the study of water movement in the unsaturated zone, geophysical techniques often cannot resolve flow pathways at a small-scale resolution, which limits their usefulness in stemflow infiltration research (Fan et al., 2020). On the other hand, dye tracing for staining flow pathways has become an established way to show preferential flow in soils (Flury and Wai, 2003). The results obtained from staining experiments clearly illustrate the complicated patterns of water movement in the soil at a high spatial resolution (Ghodrati and Jury, 1990; Flury et al., 1994; Weiler and Flühler, 2004). However, the disadvantage of staining is that it is a destructive technique. Moreover, as dyes are adsorbed to some extent by the soil matrix (e.g. brilliant blue FCF; Ketelsen and Meyer-Windel, 1999; German-Heins and Flury, 2000), there is a certain degree of underestimation of the flow paths. Therefore, new approaches are needed to unravel the patterns of stemflow belowground infiltration. Stable isotopes, such as deuterium (2H), have been widely use in hydrology as conservative tracers (Kendall and McDonnell, 1998). In combination with dye tracers, they can be a powerful tool for unravelling stemflow belowground funnelling phenomena.
In this study, we developed an approach to characterize the stemflow belowground funnelling process by using high-resolution hydrometric monitoring and dual-tracer labelling (2H and dye). The main goals of our study were (1) to assess stemflow infiltration quantitatively by means of dye concentrations, isotopic compositions and hydrometric data (soil water content) and (2) to view the spatial distribution of preferential flow pathways within the soil by dye staining. The experiment was conducted in a Mediterranean ecosystem with pine forest cover, which had not been extensively investigated for stemflow belowground funnelling. This study is a contribution towards the mechanistic understanding of water infiltration patterns and water–root interactions in forested catchments.
2.1 Study site
The research was conducted at the Vallcebre research catchments in Catalonia, Spain, established as hydrological and ecohydrological research sites in 1988 (Llorens et al., 2018). The catchments are located 100 km north of Barcelona, in the southeastern part of the Pyrenees (42∘12′ N, 1∘49′ E). The climate is humid Mediterranean and characterized by a mean annual air temperature of 9.2 ∘C and a mean annual precipitation of 856 mm (for the 1999–2018 period). Precipitation is seasonal, with spring and autumn being the wettest seasons and summer and winter the driest. Nevertheless, summer convective storms also provide significant precipitation. Reference evapotranspiration shows a seasonal pattern with a maximum in summer of up to 6.9 mm d−1 and a mean annual rate of 823 mm. Soils developed over the mudstone lithology have a silty loam and silty clay loam texture and are characterized by a rapid decrease in their hydraulic conductivity at depth (Rubio et al., 2008).
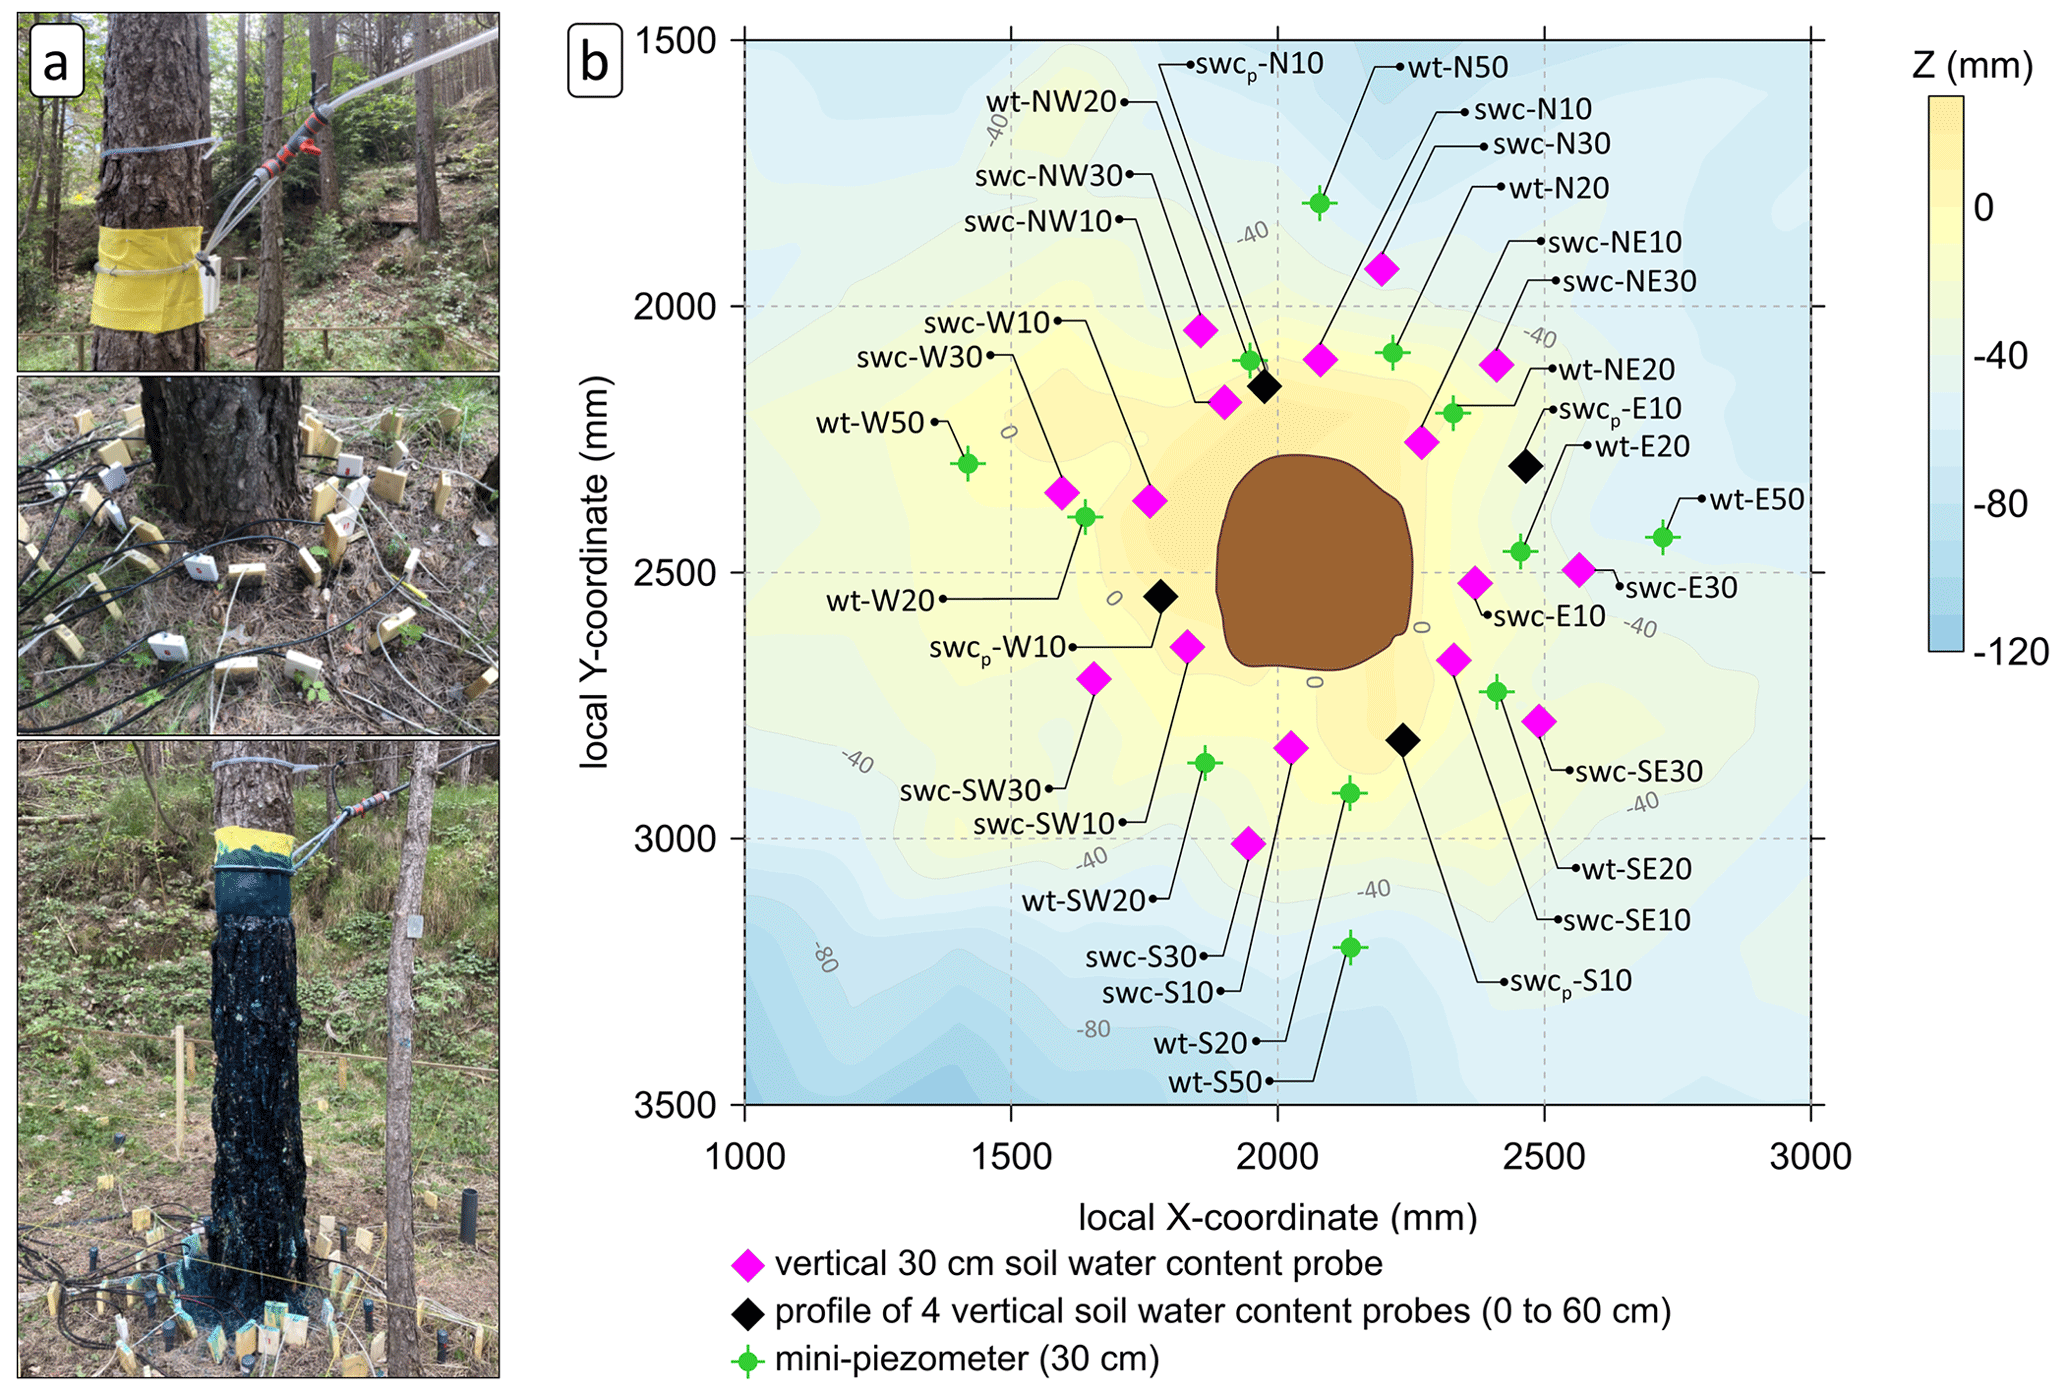
Figure 1Tracer experiment set-up. (a) Photographs of the artificial stemflow set-up and soil instrumentation before and after (last picture) the tracer experiment. (b) Top view of the experimental area showing microtopography and the location of instruments around the selected tree. The abbreviations used in the figure are as follows: swc – vertical 30 cm soil water content probe, swcp – profile of four vertical soil water content probes, wt – mini-piezometer (30 cm deep), N – north, E – east, S – south and W – west. The number in the label of each location refers to the distance (cm) from the tree trunk.
Nowadays, Scots pine (Pinus sylvestris L.) forests, which arose through afforestation of old agricultural terraces, are the main land cover of the catchment, but small fragments of original oak (Quercus pubescens Willd.) forests also occur (Poyatos et al., 2003). An experimental Scots pine forest stand (named Cal Rotes) was delineated within the Can Vila catchment to investigate forest–water interactions. The stand density is 1189 trees per hectare and the basal area is 45.1 m2 ha−1. One mature pine tree (with a diameter at breast height of 27.3 cm and a basal area of 585.3 cm2), which had been previously instrumented for stemflow measurement during a 6-month period (Cayuela et al., 2018), was selected for our stemflow infiltration experiment. This tree is representative of the plot's diameter at breast height (DBH) distribution and is situated on a flat area on an old abandoned agricultural terrace. Further, it has sufficient space around it for the placement of all of the hydrometric equipment.
2.2 Artificial stemflow experimental set-up
To simulate stemflow (Fig. 1), the approach of Llorens et al. (2022) was adopted in this study. A flexible PVC plastic tube (internal diameter of 10 mm) was placed around the experimental tree at breast height (1.3 m). As the trunks of pine trees are very rough, the outer bark of the tree was removed to assist the assembly of the tube. The plastic tube was perforated on the inside with 2 mm holes every 4–5 cm, such that the holes were in contact with the trunk surface. To ensure uniform wetting of the stem and to prevent splashing of water, cloths were placed between the bole and the tube. The tube was connected by a Y-shaped tubing connector to a water tank. A stopcock was installed upstream of the Y-shaped tubing connector to regulate and control the flow rate.
Our system was designed to discharge water from a tank that was located 9 m above in an upper terrace (∼35 m away from the trunk), creating a gravity-fed water system. The volumetric soil water content (SWC, cm3 cm−3 or %) was monitored by sixteen 30 cm long time domain reflectometry (TDR) probes (CS615 probes, Campbell Scientific, Logan, UT, USA). The probes were placed vertically in two circular rings, 10 and 30 cm from the trunk every 45∘, i.e. facing the cardinal and intercardinal directions (Fig. 1). When a physical obstacle was encountered (e.g. coarse roots or rocks) that did not allow the installation of the probe, the probe was placed as close as possible to the intended position. The TDR probes were measured every 20 s and averaged at 1 min intervals by a datalogger (Data Taker DT85, Thermo Fisher Scientific Inc., Waltham, MA, USA). The TDR probes had previously been calibrated with long-term manual TDR measurements performed with a Tektronix 1502-C cable tester (Tektronix Inc., Beaverton, OR, USA) at the study plot. In addition, in each main cardinal direction (N, S, E, and W), the SWC was monitored by four TDR probes of different lengths (CS605 probes, Campbell Scientific, Logan, UT, USA) that had been installed vertically at depths of 0–10, 0–20, 30–40 and 30–60 cm (Fig. 1) 2 years prior to the experiment. For their installation, holes with a diameter equal to the distance between the TDR probe external rods were made manually with a soil auger, and the TDR probe was stuck into the undisturbed soil once the hole had the selected depth. The probes were measured manually every 30 min with a Tektronix 1502-C cable tester.
Two piezometers were placed at 1.7 and 2.0 m depth at a distance 1.6 m from the tree bole in opposite directions (northwest and southeast, respectively) in order to monitor and sample groundwater. Water levels were measured every 20 min with dataloggers (Micro-Diver, Van Essen Instruments, Delft, South Holland, the Netherlands). Finally, twelve 30 cm deep mini-piezometers were placed at different distances (between 20 and 50 cm from the bole of the tree) in the cardinal and intercardinal directions to sample the soil water in the shallow layer (Fig. 1). When a physical obstacle was encountered, the mini-piezometer was placed as close as possible to the intended position. The water level was measured about every 30 min, and water samples were collected for all of the piezometers at 1 h intervals throughout the experiment.
Using the tree location as the centre point, a level mesh (4.8 m × 4.8 m with a grid size of 0.2 m) was placed above the ground. As depicted in Fig. 1, the mesh was used as a coordinate system to georeference the installed instruments and to characterize the local topography around the tree. The vertical distance (z) from the mesh intersection to the actual ground surface was measured, using the mesh level as the reference plane. All z values were corrected to represent the surrounding topography in relation to the tree base (z=0), and a digital elevation model (0.2 m resolution) was interpolated from these data, with the tree base as the reference elevation (Surfer v.18, Golden Software, Golden, CO, USA).
Unlike other stemflow infiltration studies (e.g. Schwärzel et al., 2012; Llorens et al., 2022), forest litter surrounding the tree bole was not removed prior to the experiment. The litter, which was 4.7±2.4 cm thick according to Molina et al. (2019), was left in place in order to better replicate natural stemflow infiltration conditions.
The stemflow experiment was conducted on 26 May 2021 when the soil had a moderate moisture condition (a mean prior volumetric soil water content of 32 %). During the previous 20 d, only 15 mm of rain was recorded, of which 6.4 mm occurred on 22 May. We applied 41 L of stemflow water labelled with enriched deuterium and brilliant blue FCF dye at a flow rate of 7 L h−1. This amount and rate of stemflow correspond to that commonly generated by a 50 mm rainfall event for this particular tree (Cayuela et al., 2018). Enriched deuterium (99.96 % fractional 2H abundance; Eurisotop, Cambridge Isotope Laboratories, Saint-Aubin, France) was mixed with the water to obtain a deuterium isotopic composition of ∼500 ‰. To calculate the amount of enriched deuterium to be applied, we used the “D-enriched water” Excel spreadsheet by Alex Sessions of the Division of Geological and Planetary Sciences, Caltech (http://web.gps.caltech.edu/~als/resources, last access: 26 July 2023). To validate the amount of enriched deuterium added, preliminary mixing tests were performed and a sample of the final mixture was sent for isotopic analysis. brilliant blue FCF (Proquimac, Barcelona, Spain) was selected as the dye tracer because of its favourable physicochemical and toxicological characteristics (Flury and Flühler, 1994, 1995). The dye shows a Langmuir-type of sorption behaviour in soil (German-Heins and Flury, 2000). Thus, the higher the concentration, the less relative sorption is expected, as sorption sites become saturated with the dye tracer. In our experiment, a brilliant blue FCF concentration of 5 g L−1 was used (Flury and Flühler, 1994).
2.3 Stemflow infiltration area
Just after the experiment was finished, litter was carefully removed from the surrounding area of the tree base. As per the methodology outlined in Llorens et al. (2022), a plastic mesh was positioned over the soil surface and the infiltration area (m2) was estimated by counting the total number of grid areas covering dye-stained soil and multiplying by the grid-square area (1.27 cm2 per grid square).
2.4 Plot excavation and soil sampling
A total of 1 d after the dual-labelled water application, we opened four vertical trenches (30 cm deep and 100 cm wide) in the four cardinal directions at 40 cm distance from the tree bole. Later, two more cross-sections were opened at a distance of 25 and 10 cm in each direction (Fig. 2). Over the course of the day (27 May 2021), a total of 12 soil profiles were excavated and photographed. The face of each profile was levelled by a steel scraper knife to minimize shadows caused by its unevenness. For each of the 12 soil profiles, dye-stained (blue) and non-stained areas were sampled with steel cylinders (100 cm3) to measure the dye concentration and isotopic composition. In total, 63 samples were collected and their location georeferenced. Immediately after the samples were taken, they were covered with plastic film, placed into coolers to maintain soil moisture and prevent evaporation, and transported to the laboratory.
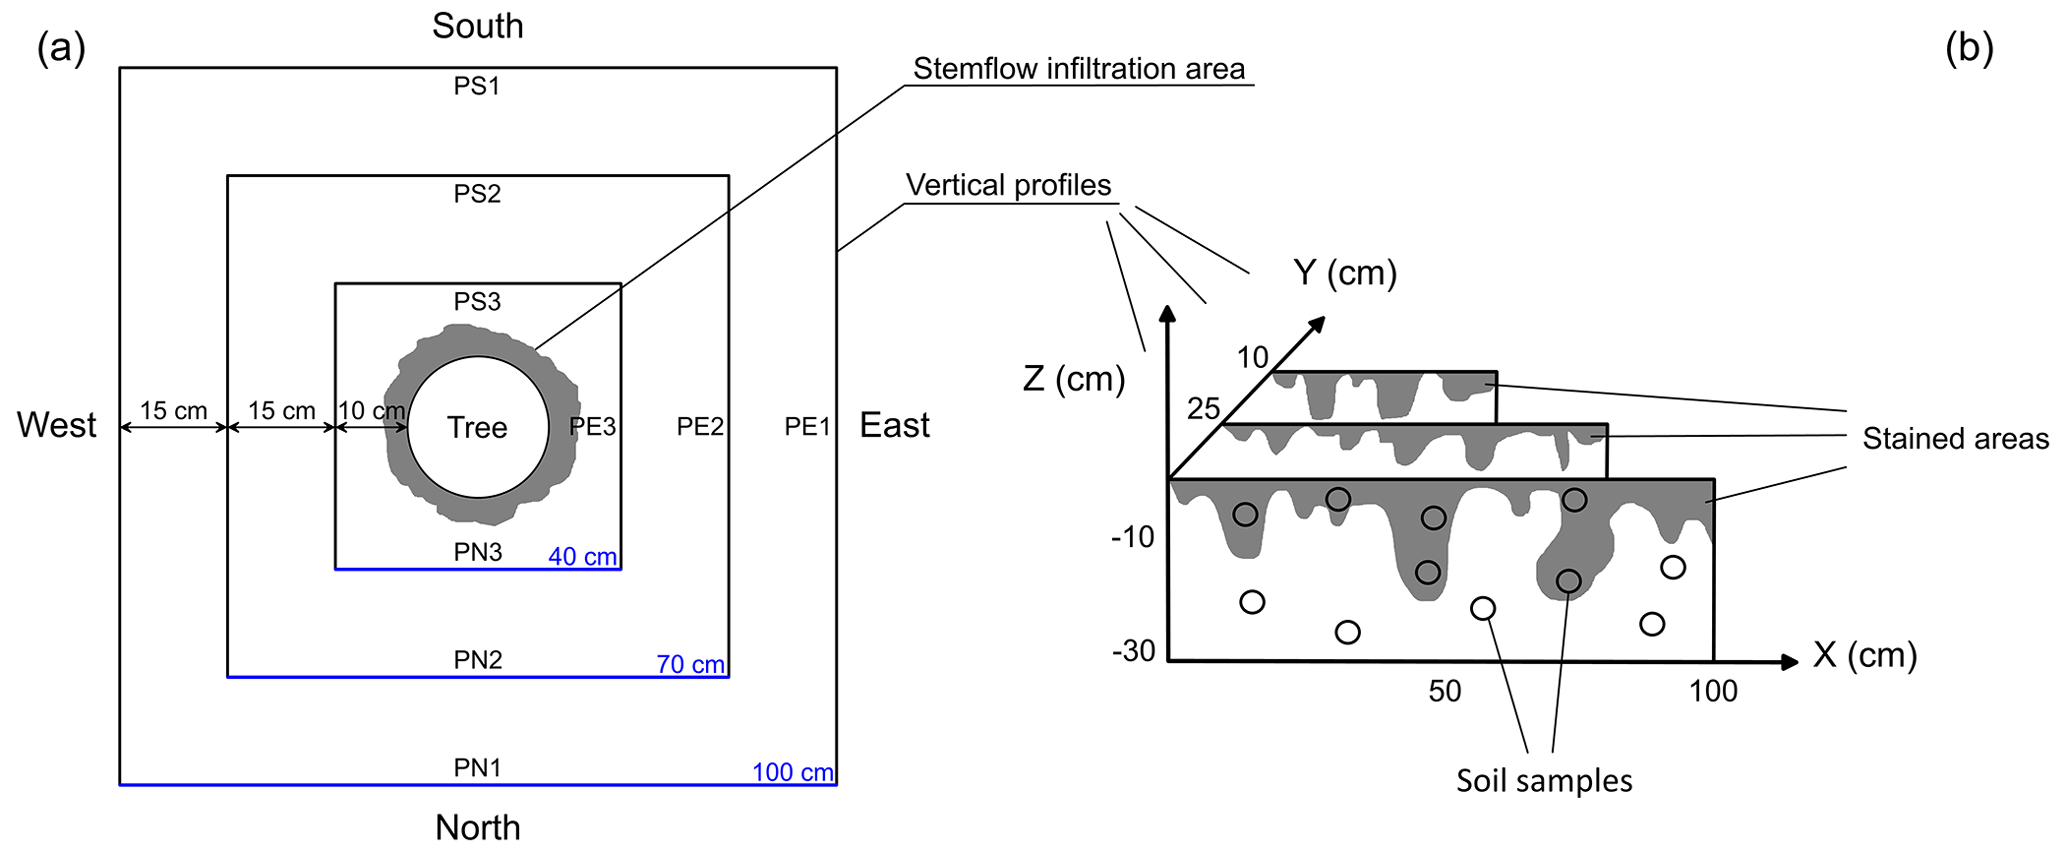
Figure 2(a) Top view of the experimental plot with squares indicating the location of the vertical soil profiles excavated around the tree. (b) Schematic of vertical soil profiles with dye patterns.
2.5 Image analysis and preferential flow indices
Photographs of the soil profiles were taken using a cell phone equipped with a dual-lens camera system of 12 MP (iPhone 11, Apple Inc., CA, USA). The photographs were edited for geometric correction, contrast and brightness, using Adobe Photoshop 21.2.12 (Adobe Inc., San José, CA, USA). As the photographs were taken at different times of the day with varying illumination (e.g. shadows vs. sunlight), a primary colour scale was utilized to recalibrate the colours and illumination in each photograph (Fig. 3a). The saturation of the blue stains was then maximized to make it easier to distinguish dye intensities (Fig. 3b).
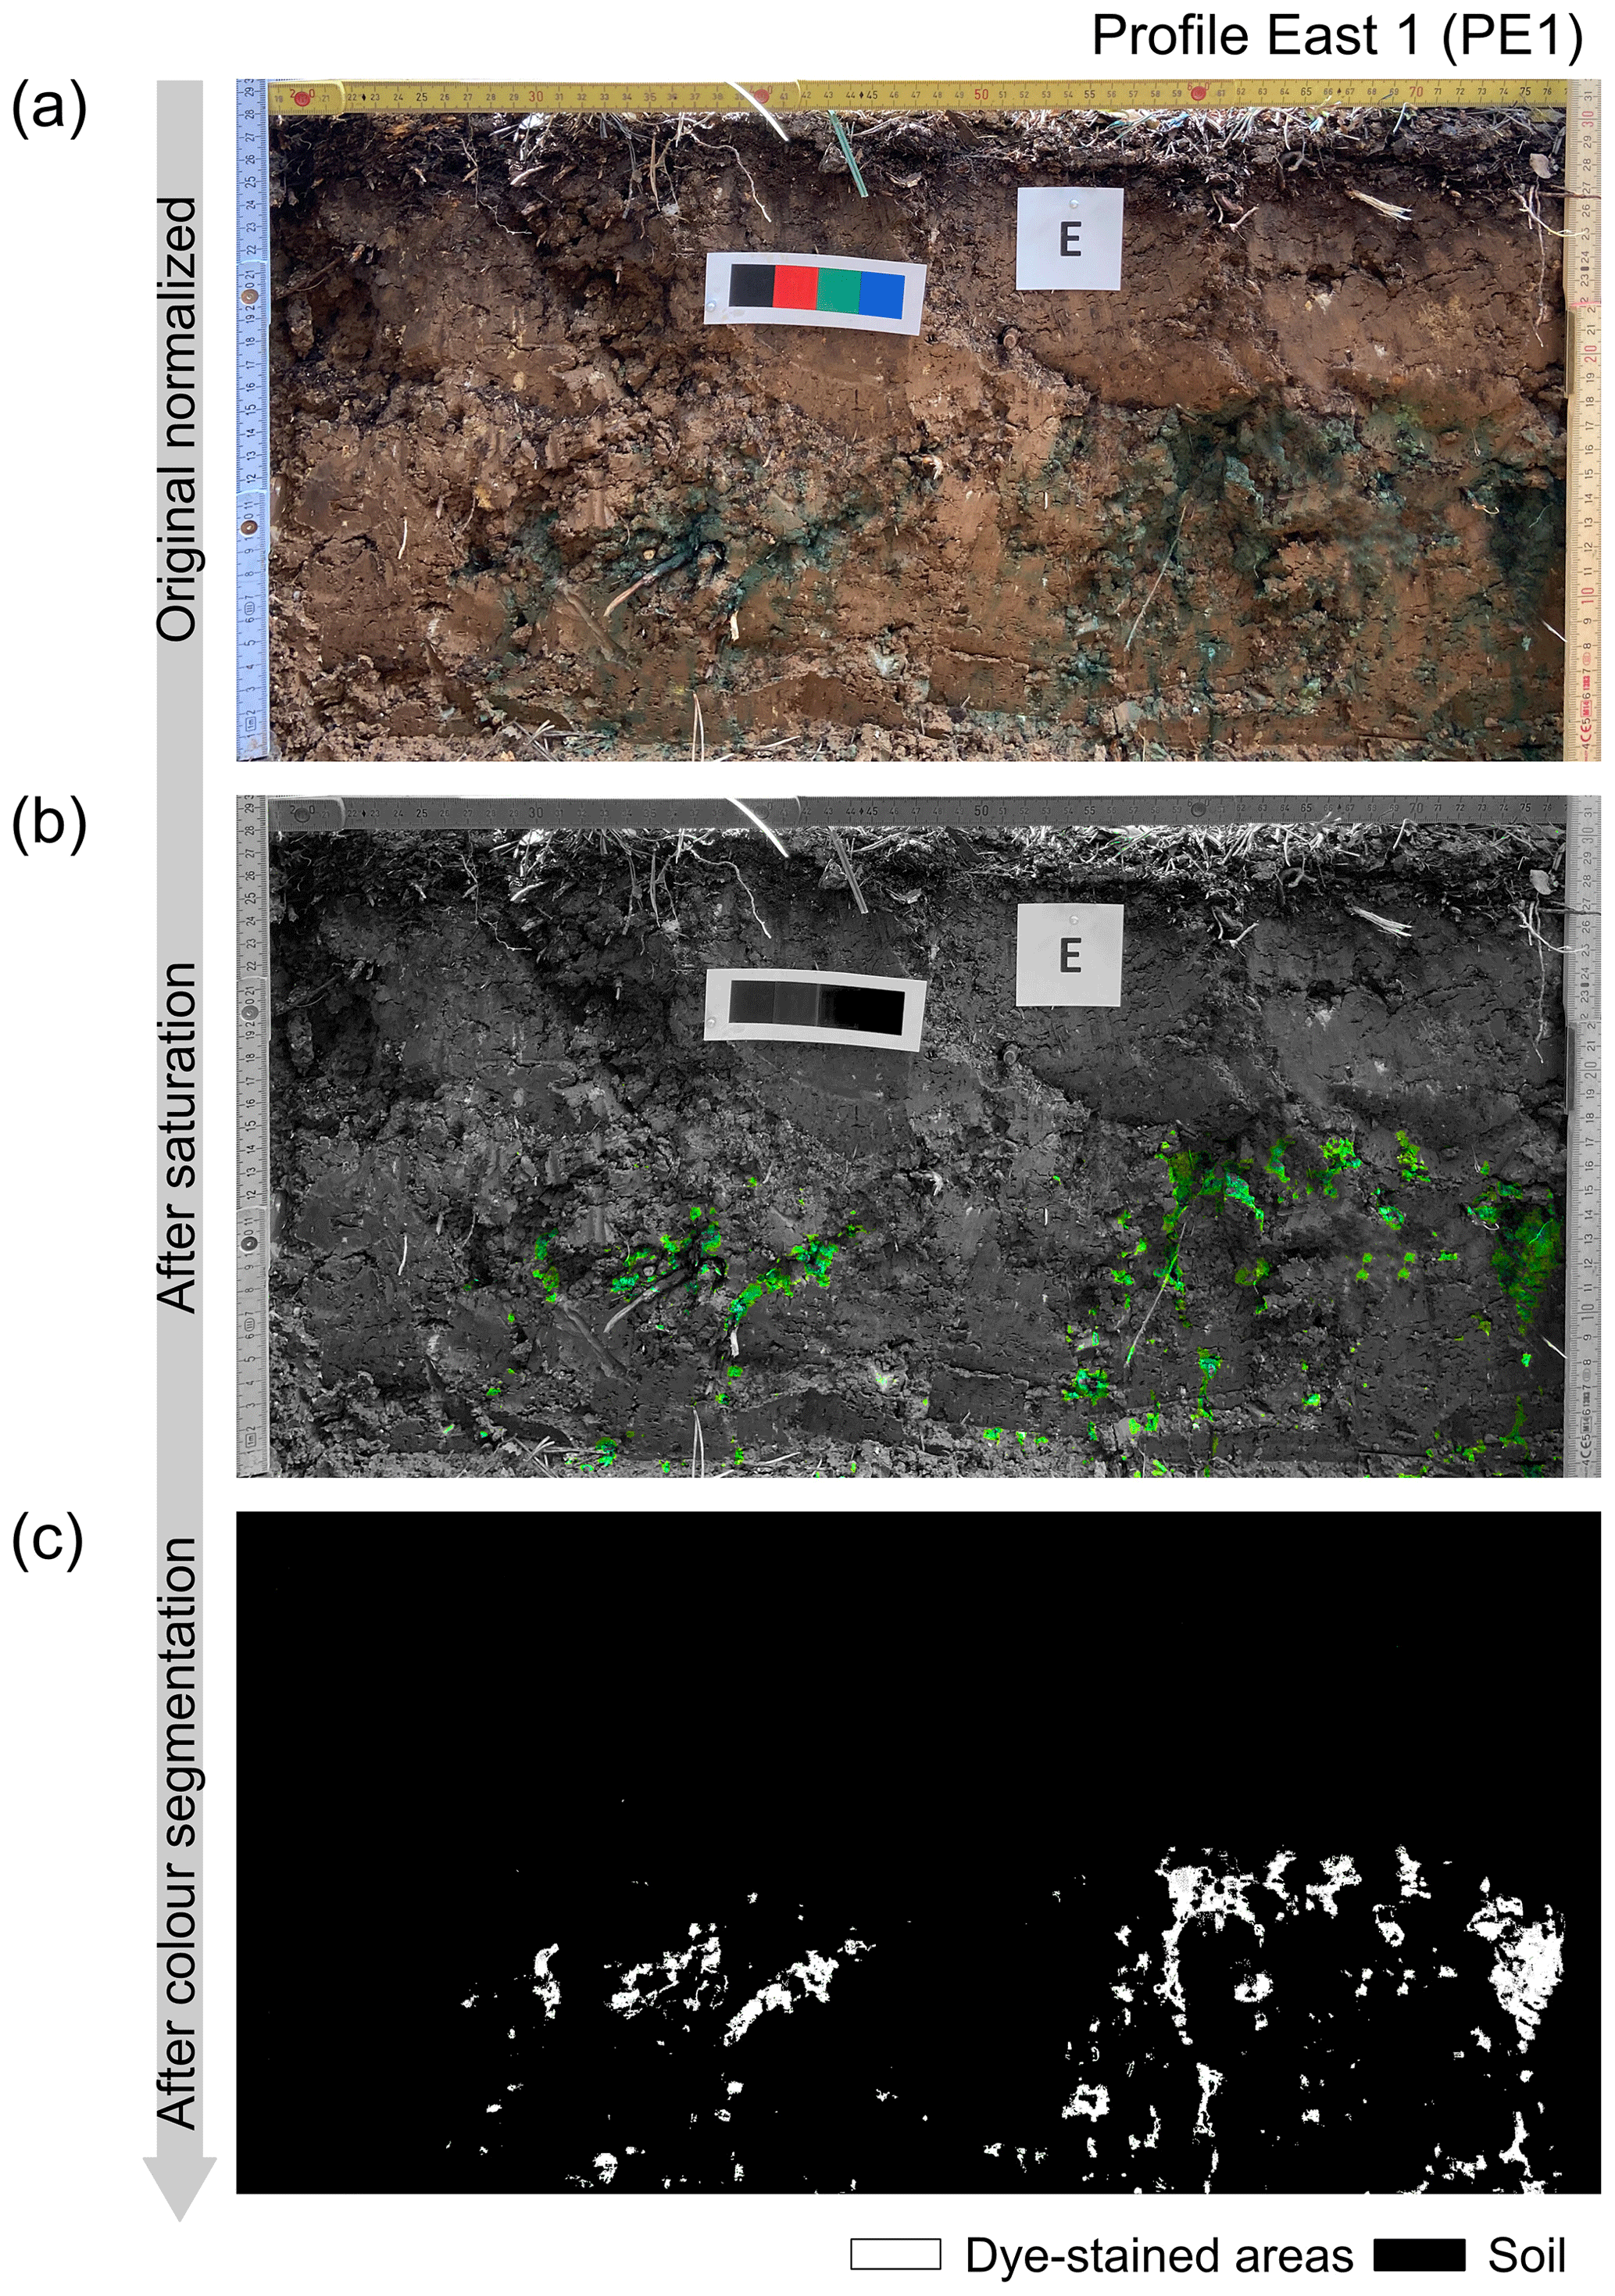
Figure 3Image analysis procedure of soil profile photographs: (a) geometric correction, recalibration of colours and illumination; (b) colour saturation adjustment; and (c) colour segmentation using a supervised classification.
These corrected images were then used to classify dye-stained and non-stained areas with the maximum-likelihood supervised classification tool in ArcGIS 10.4.1 (Environmental Systems Research Institute Inc., Redlands, CA, USA) (Fig. 3c). The maximum-likelihood classification assigns each cell in the input raster to the class that it has the highest probability of belonging to. Identifiable dye-stained and non-stained areas of interest were manually digitized for each image and used as a training set for the classification tool. Unwanted objects were manually masked out to prevent potential inaccuracies in the classification process.
Digitized images were then further analysed to quantify several preferential flow indices. These indices were calculated as follows:
-
Dye coverage (Dc, %) (Flury et al., 1994) is the proportion of the dye-stained area in relation to the total area of the soil profile under consideration. It was calculated in 10 mm depth increments (dye coverage profile) and for the entire profile (total dye coverage). Total dye coverage is lower when there is a higher degree of preferential flow.
-
Uniform infiltration depth (UniFr, cm) (Van Schaik, 2009) is the depth at which the dye coverage decreases below 80 %. High values indicate a uniform infiltration process, whereas low values indicate preferential flow.
-
Preferential flow fraction (PFfr, %) (Van Schaik, 2009), defined as the fraction of the total infiltration that flows through preferential flow paths, is calculated as
where Wp is the width of the profile (cm) and Tsa is the total stained area (cm2).
-
Length index (Li, unitless) (Bargués Tobella et al., 2014), defined as the sum of the absolute differences between the dye coverage (Dc, %) of two consecutive depth intervals i and i+1 in a vertical profile of n intervals, is calculated as
This index is related to the degree of heterogeneity of the dye infiltration pattern, with higher Li values indicating greater preferential flow.
-
Peak index (Pi, unitless) (Bargués Tobella et al., 2014) is the number of times that the vertical line defined by the total dye coverage intersects the dye coverage profile. This parameter is also related to the heterogeneity of the stained patterns, with high values of the parameter indicating a high degree of preferential flow.
-
Mass fractal dimension (Ds, unitless) (Hatano and Booltink, 1992; Hatano et al., 1992) is related to the basic shape of an object (staining patterns), for example a dot, line or plane. Ds can be derived by fractioning a stained profile into squares (pixels) of side r (the smallest value of r corresponding to the width of an original pixel) and then counting the number of partially stained squares, N(r). Repetition of this process with increasing r values gives a series of N(r) values. Double-logarithmic plots of N(r) against r show a linear correlation from which Ds is calculated from the slope as
where c is a constant. Ds is calculated in the range of 0 to 2. Ds=0 when the stained pattern is a dot pattern, Ds=1 when it is a line pattern (long and slender) and Ds=2 when it is the dimension of a completely filled area.
2.6 Dye concentration analysis
A similar dye extraction procedure to that of Forrer et al. (2000) was followed. An aliquot of 1 g was taken from the centre of each soil core on the external side. The external side of the soil sampled using the steel ring corresponds to the one captured in the photographs. This aliquot was then mixed with 5 mL of deionized water, shaken overhead for 3 h and centrifuged for 30 min at 3000 rpm (ROTINA 420, Hettich, Kirchlengern, North Rhine-Westphalia, Germany). The concentration of brilliant blue FCF of the supernatant was measured by UV–Vis spectrophotometry at a wavelength of 630 nm, based on a previously established calibration curve relating absorbance (A) to dye concentration (Cd, mg L−1) (Cd=6.83 A; R2=0.99). Because we did not determine the dry mass of the soil cores, the dye concentration in the soil was then expressed as the mass of dye per mass of wet soil (C, mg kg−1 of wet soil).
2.7 Isotopic analysis
A sufficient aliquot to fill a test tube (20 mL) was taken from the internal side of each of the 63 core samples. These samples were sent to the Scientific and Technical Services of the University of Lleida for isotopic analysis. Soil samples were subjected to cryogenic extraction, and the stable water isotopes (δ18O and δ2H, ‰) were determined by cavity ring-down spectroscopy (Picarro L2120-i analyser, Picarro Inc., Santa Clara, CA, USA). The equipment had an accuracy of <0.1 ‰ for δ18O and <0.4 ‰ for δ2H, based on the repetition of four reference samples provided by the International Atomic Energy Agency (IAEA). All isotopic data were expressed in terms of δ values and calculated as follows:
where VSMOW is Vienna Standard Mean Ocean Water and R is the isotope ratio (18OO or 2HH).
2.8 Soil characteristics
To characterize the soil at the experimental site, six vertical 30 cm depth profiles were dug in the vicinity (<1 m) around the monitored tree. A depth of 30 cm was the maximum because no significant changes in soil physical properties had been observed in similar forest stands in the same study area beyond that depth (Rubio et al., 2008). Tree roots encountered during excavation were cut and removed. Six soil cores were taken with steel cylinders (100 cm3) in 5 cm depth intervals from the soil surface down to 30 cm in order to determine volumetric soil water content (VWC, cm3 cm−3), bulk density (BD, g cm−3), soil texture, organic matter content (OM, %) and porosity (ε, %). Once taken, samples were immediately covered with plastic film and placed inside coolers to maintain sample moisture. The volumetric soil water content and bulk density were determined for each core, and the latter was used to calculate porosity, assuming a particle density of 2.65 g cm−3 (Hao et al., 2007). The soil organic matter content was determined by loss on ignition, following Wang et al. (2012).
For soil texture analysis, the protocol described in Faé et al. (2019) was used. The dry soil cores were disaggregated and then a representative, well-mixed 50 g aliquot was collected from each sample. Gravel (diameter > 2 mm) was removed by sieving. Organic matter was then removed by use of 15 % hydrogen peroxide, and clay aggregates were dispersed with sodium hexametaphosphate. The soil was next sieved through a 50 µm mesh to separate sand-sized particles (0.05 to 2 mm). To determine the silt and clay fractions, four subsamples were taken from the <50 µm suspension and analysed by laser diffraction (Mastersizer 2000, Malvern Panalytical Ltd., Malvern, Worcestershire, UK). Prior to the analysis, the samples were sonicated for 30 s. Instrument parameters were set to refracting index 1.52, absorption 0.1, stirrer speed 750 rpm, pump speed 1750 rpm and analysis time 30 s. The soil texture (sand, silt and clay fractions) and bulk density were then used to calculate saturated hydraulic conductivity by the Rosetta v.3 pedotransfer functions model (Zhang and Schaap, 2017).
In addition, to determine the isotopic composition of the soil profile before the experiment (see Sect. 2.7), disturbed soil samples were taken in each intercardinal direction from the experimental tree, at a distance of 3 m from the stem. Samples were taken at the following depth increments: 0–5, 5–10, 10–20, 20–30, 40–50 and 90–100 cm.
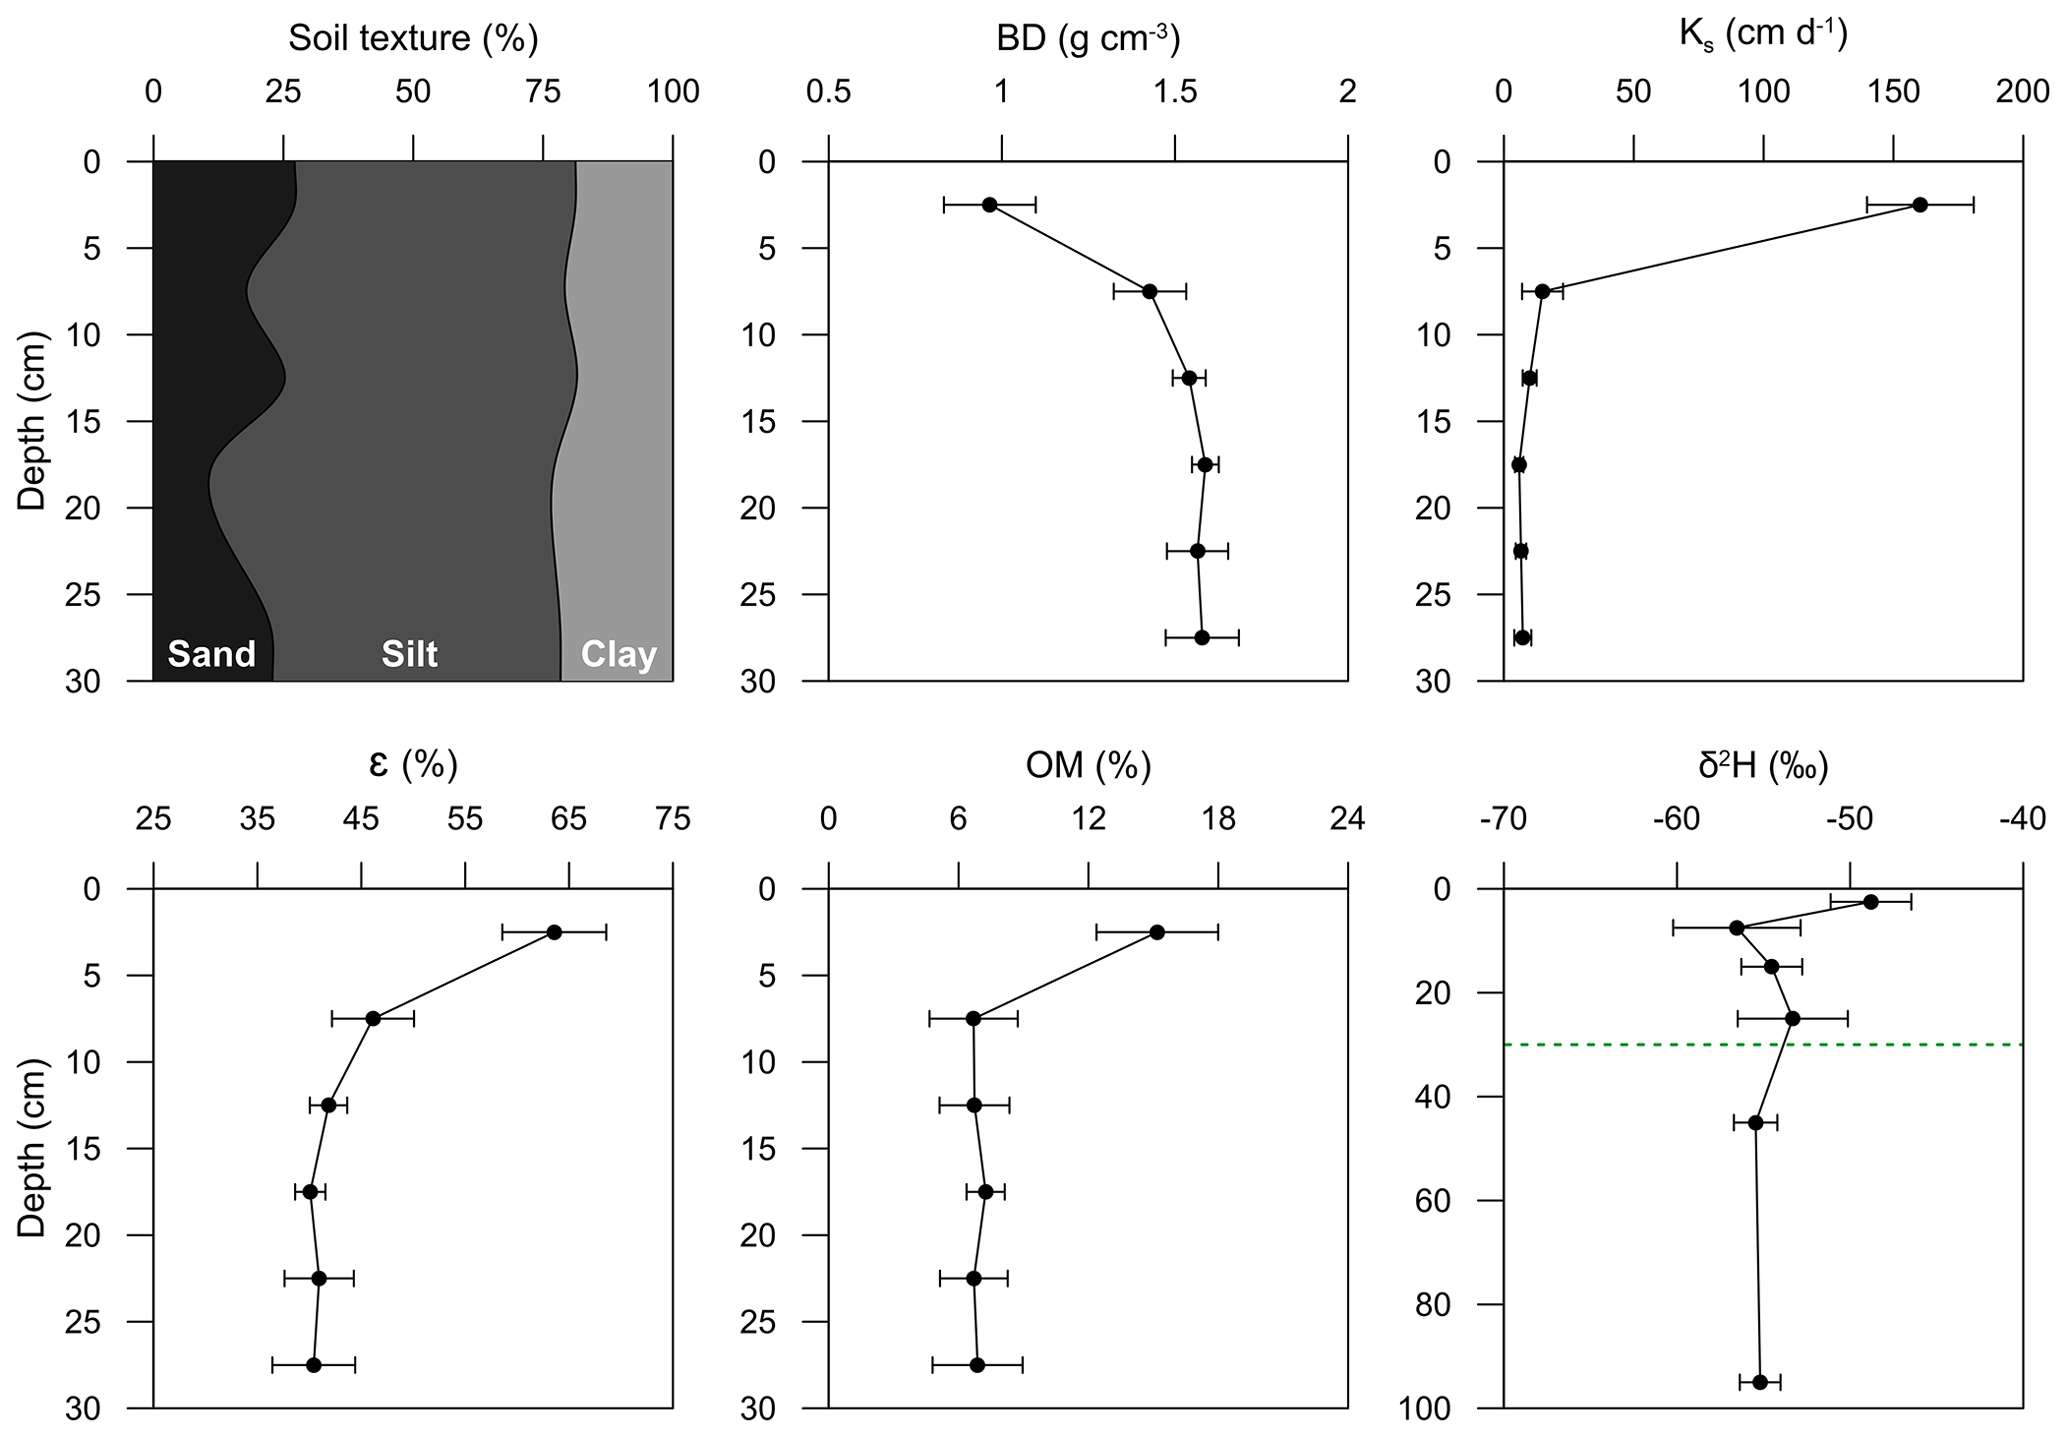
Figure 4Soil physical properties at the pine forest stand. The abbreviations and variables used in the figure are as follows: BD – bulk density, Ks – saturated hydraulic conductivity, ε – porosity, OM – organic matter content and δ2H – deuterium isotopic composition of soil water. Note the different scales of the depth axes for the isotopic composition (the green dotted line is the 30 cm depth). Data represent means and standard deviations (n=6 for physical properties and n=4 for isotopic composition).
3.1 Soil characteristics
Data obtained from the 30 cm depth profiles were pooled (n=6) to characterize the physical properties of the soil at the forest stand. Similarly, the isotopic composition values of the four soil cores were also pooled. Figure 4 shows the average and standard deviation of the soil properties. Soil texture was classified as silt loam according to the United States Department of Agriculture (USDA) classification (USDA, 2017). Bulk density increased from about 1 g cm−3 at the topsoil to 1.6 g cm−3 at 30 cm depth. Similar bulk density values were observed by Rubio et al. (2008) in the same study area at 50 cm depth. We did not expect root growth or development to be restricted at our site, as root growth in silt loam soils will only be affected at bulk density values > 1.6 g cm−3 (Zisa et al., 1980). The increase in bulk density corresponds to a decrease in the saturated hydraulic conductivity, porosity and organic matter content with depth (Rubio et al., 2008). Soil porosity decreased by about 24 % from the topsoil to the subsoil, whereas the water content at field capacity declined by only about 2 %. The high organic matter content in the topsoil (16 %) is due to high amounts of litter on the forest floor, as found by Molina et al. (2019). The δ2H decrease (from −48 ‰ in the topsoil to −55 ‰ at 100 cm depth) is due to evaporation, which was also observed by Sprenger et al. (2019) in the same forest stand.
3.2 Stemflow infiltration area
There are few studies that have used dye tracers to calculate the stemflow infiltration area (see the review by Carlyle-Moses et al., 2020). In our experiment, stemflow infiltrated into the soil in an annular shape around the base of the tree trunk and no surface runoff was observed. The area of the annular shape was 0.14 m2, which is smaller than the infiltration area of 0.245 m2 reported by Schwärzel et al. (2012). However, the other stemflow infiltration areas reported are usually much smaller (e.g. Carlyle-Moses et al., 2018; Metzger et al., 2021; Llorens et al., 2022). In pine forests, there is usually a thick litter layer that repels water (Iovino et al., 2018) and causes the stemflow infiltration area to expand beyond the immediate vicinity of the tree trunk. The stemflow infiltration area found in this study should be interpreted with caution, as it corresponds to a specific amount (50 mm) and discharge (7 L h−1) and to specific antecedent moisture conditions and soil physical properties, and we suspect that it may vary as any of these conditions change.
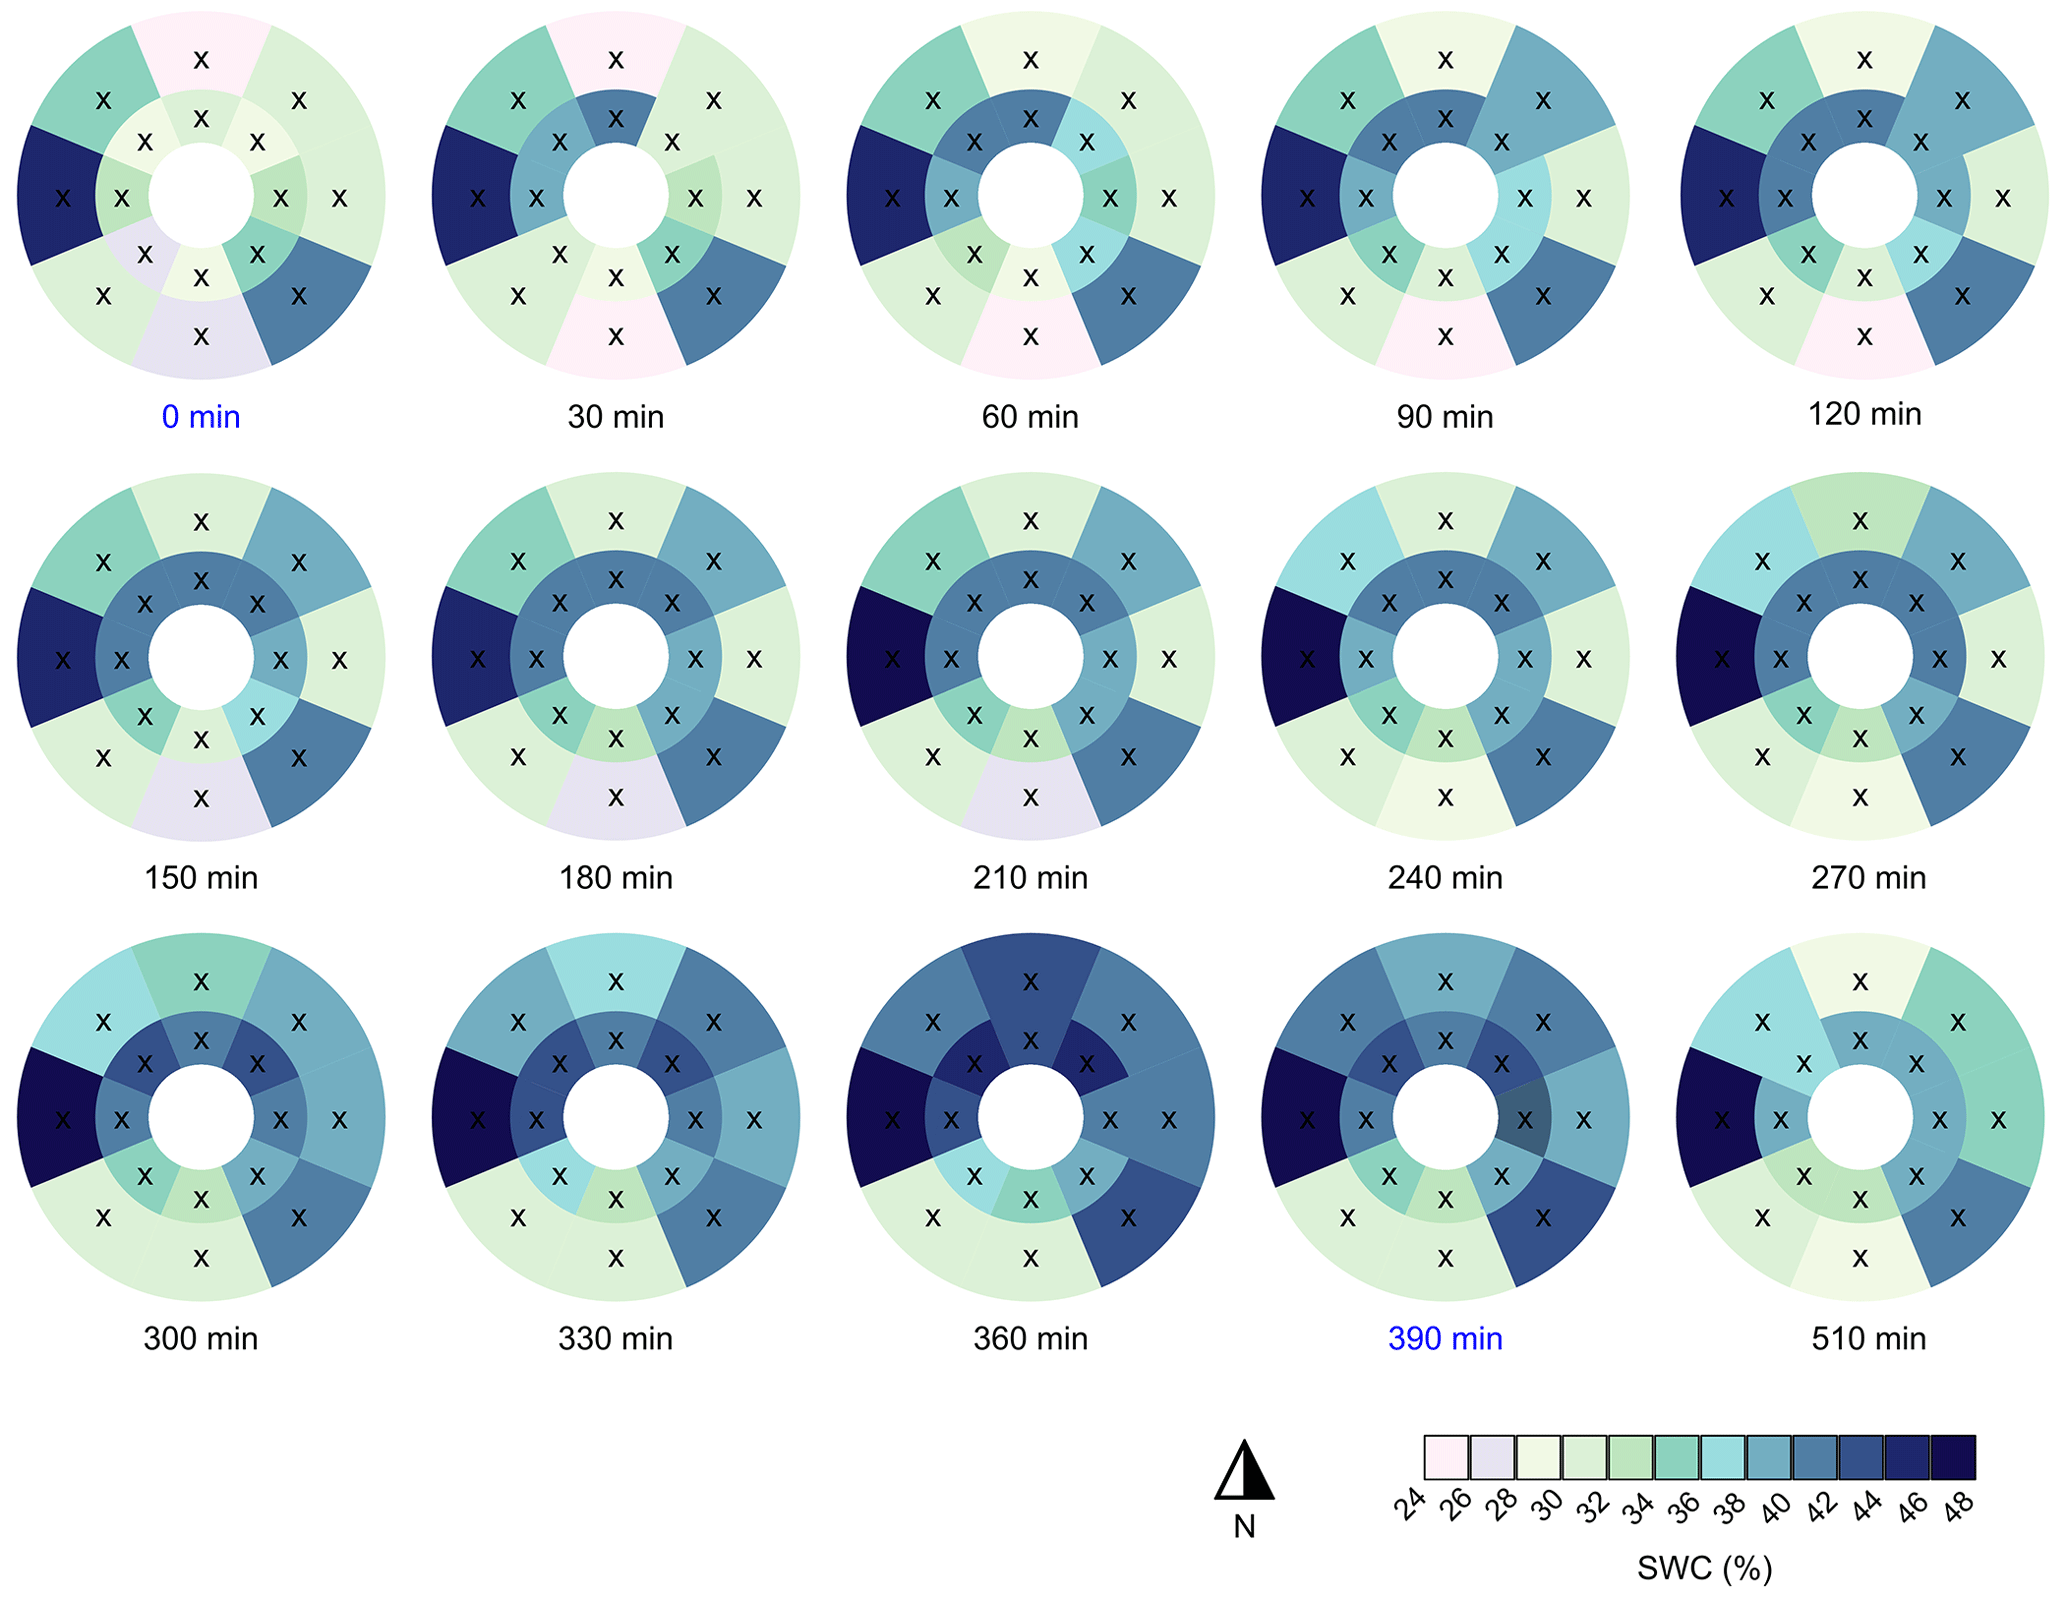
Figure 5Time series of the spatial patterns of the volumetric soil water content (SWC) during the experiment. Artificial stemflow was initiated at t=0 min and stopped after around t=390 min (highlighted in blue). Cross marks denote TDR sensors (approximate locations) and the white circle represents the tree trunk.
3.3 Soil water content dynamics
The spatial distribution of the soil water content around the tree before stemflow initiation was highly heterogeneous, and it remained so during the stemflow experiment (Fig. 5). The spatial variability in the SWC showed a decrease in the coefficient of variation throughout the experiment from 17 % to 11 % towards the end. The detailed temporal dynamics of the SWC measured with the different TDR probes is shown in Fig. S1 in the Supplement. A heterogeneous volumetric SWC around a tree, induced by stemflow, was also observed by others (Liang et al., 2011; Tischer et al., 2020). It should be noted that the SWC response caused by stemflow infiltration can change depending on antecedent soil moisture conditions which could lead to different water flow dynamics (Kobayashi and Shimizu, 2007). Table 1 shows the pre- and post-stemflow SWC (0 and 510 min), the maximum SWC peak and the time elapsed until its occurrence for each of the TDR probes.
Table 1Soil water content measured with TDR probes in different directions around the tree trunk. Pre-stemflow corresponds to t=0 min and post-stemflow to t=510 min. Peak SWC is the maximum during the experiment.
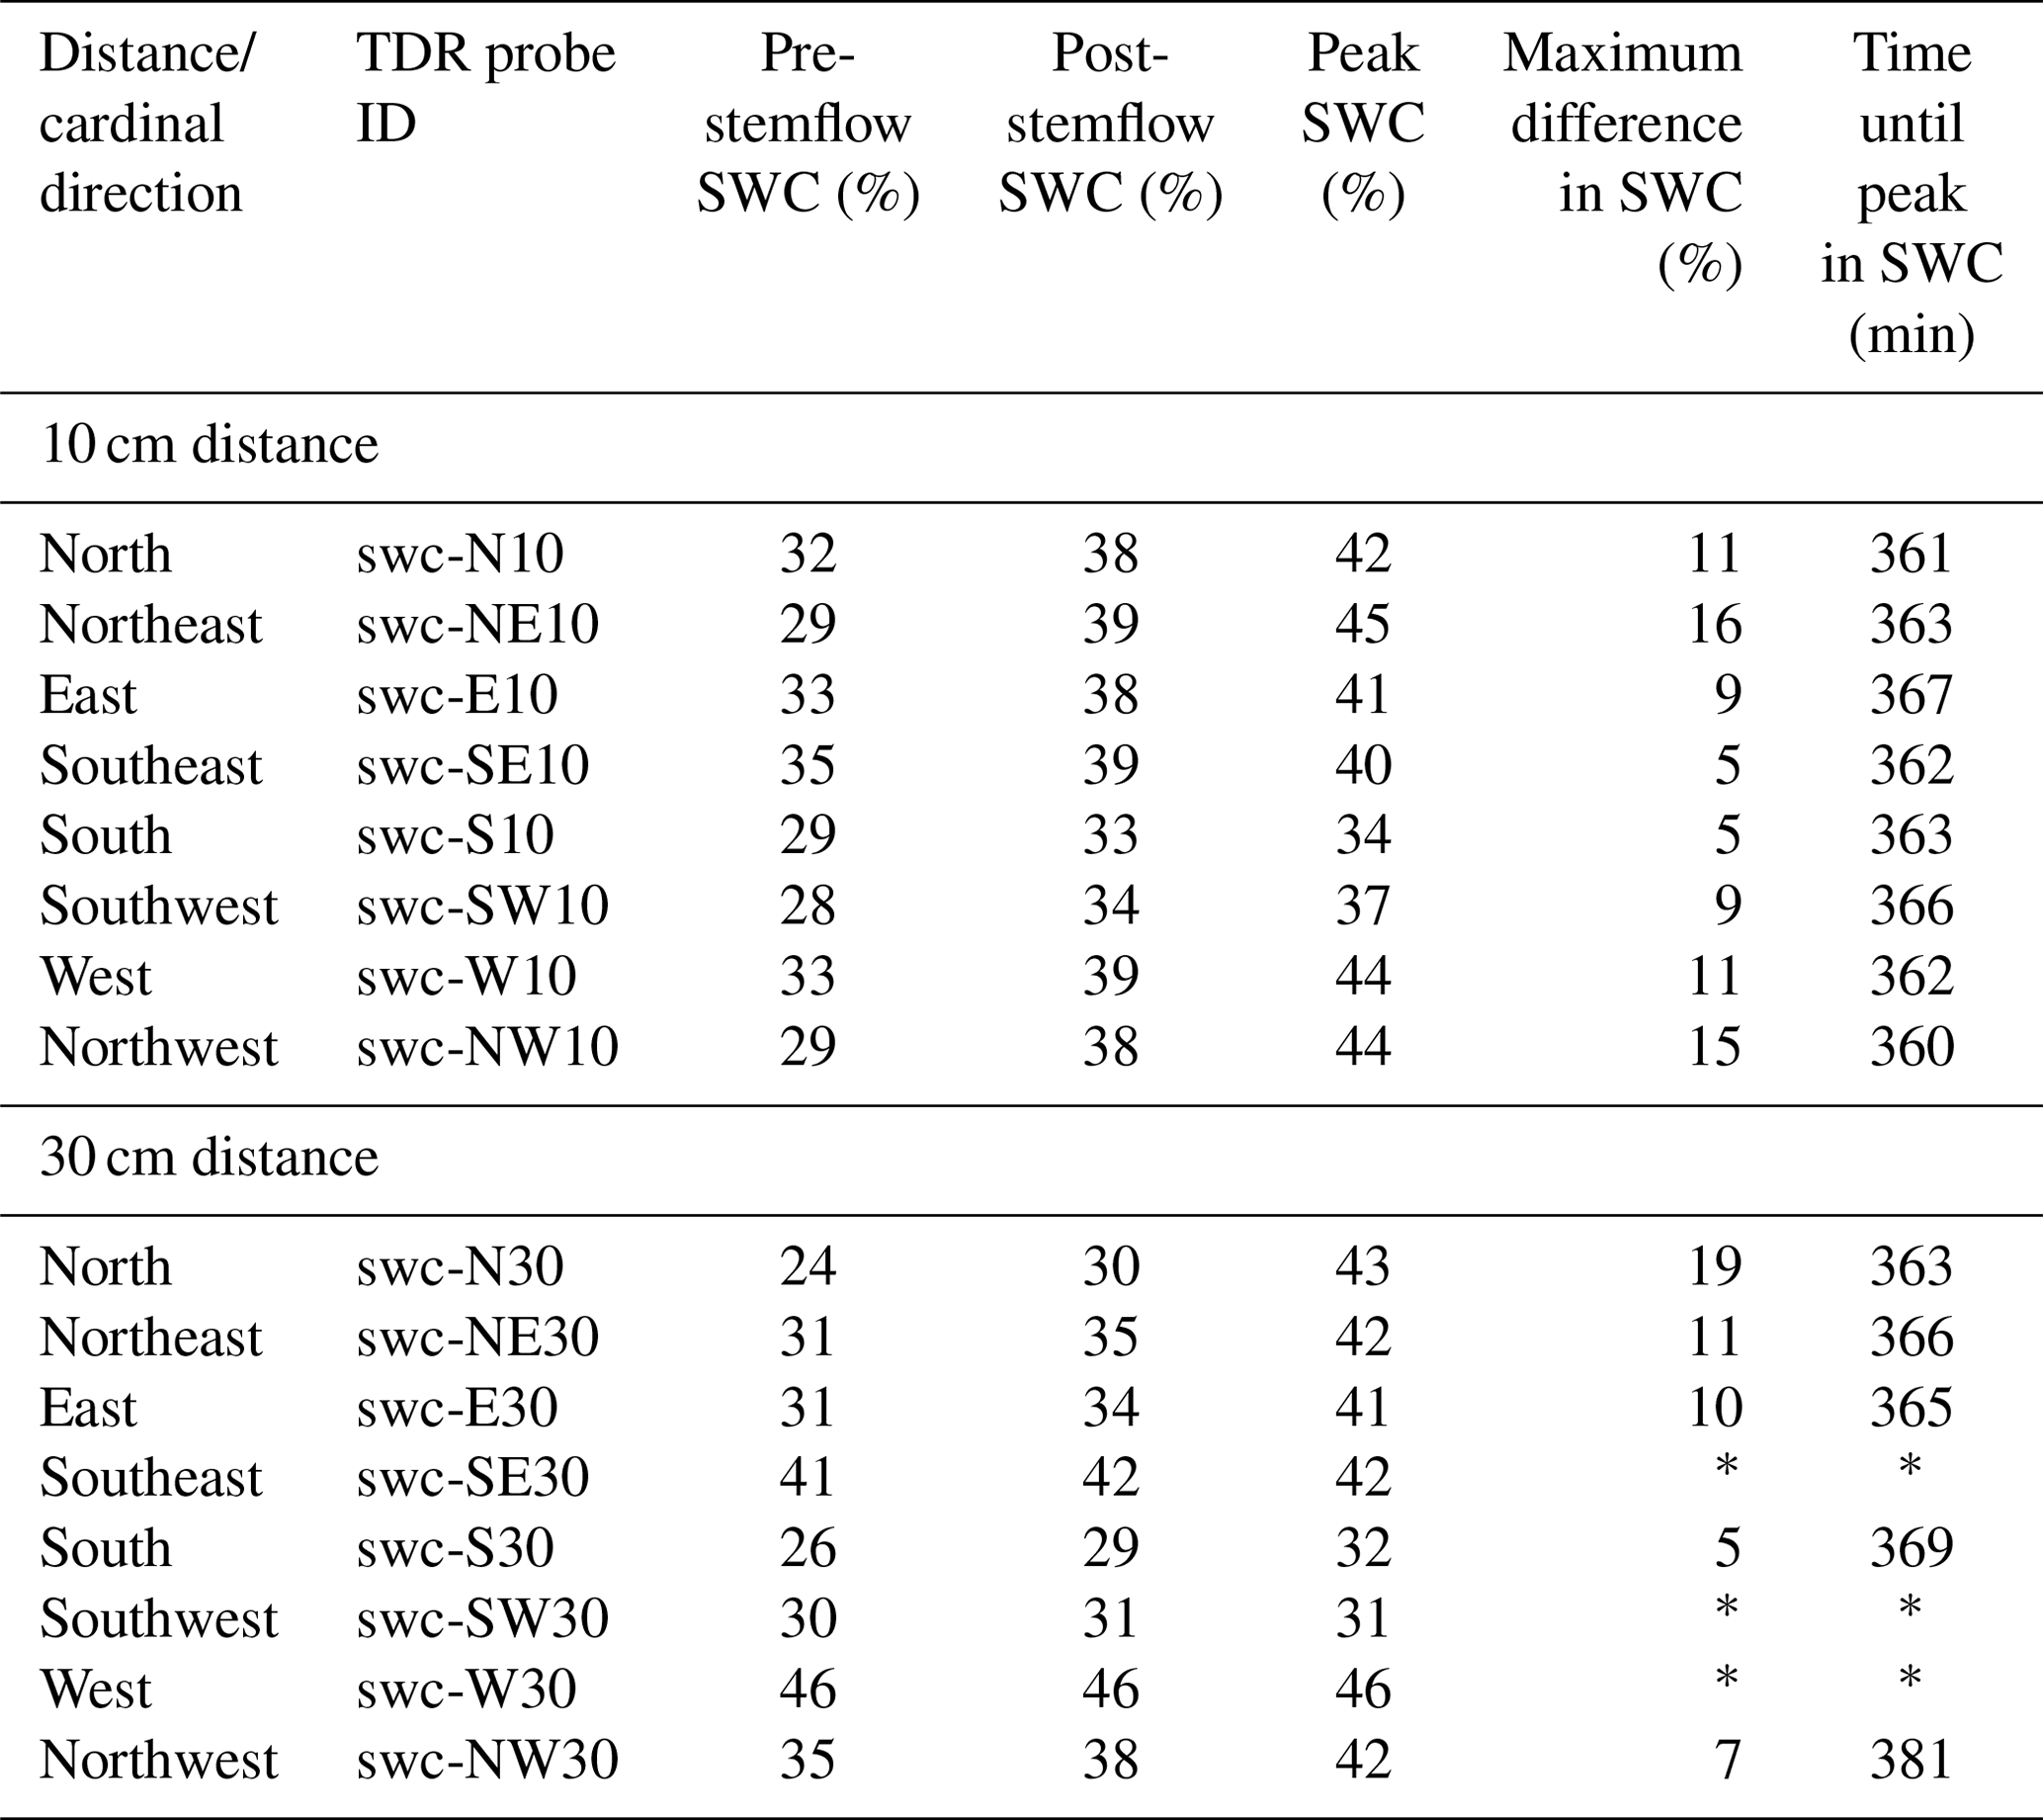
* No real peak was observed.
The pre-stemflow SWC showed near-saturated conditions for the southeast and west directions at 30 cm distance from the trunk (Figs. 5 and S1, Table 1). These near-saturated conditions explain the lack of response of these TDR probes during the stemflow experiment. The other TDR sensors, however, responded to the stemflow, as shown by the increase in the SWC over time (Figs. 5, S1). As expected, a faster response was observed in the TDR probes closer to the trunk: at 10 cm earlier than at 30 cm (Fig. S1). Nevertheless, the maximum difference in the SWC (i.e. difference between the max SWC and the pre-stemflow SWC) was similar at both distances (Table 1). The post-stemflow SWC (∼2 h after the end of the experiment) showed a small decrease in soil moisture from peak values, indicating that soil water was gradually percolating to deeper soil horizons while the upper horizon remained at field capacity (Fig. S1).
Figure 5 shows that stemflow water was mostly directed to the west, north and east, whereas the southwest and south received less. The northeast and northwest locations at 10 cm distance showed the greatest increases in the SWC (15 % and 16 %), while the SWC in the southeast and south only increased by 5 %. At 30 cm distance, the SWC to the north increased by 19 %, whereas TDR probes to the southwest and west showed no change in the SWC (Figs. 5 and S1, Table 1). In all of the TDR probes that responded to stemflow, the maximum SWC was reached close to the end of the experiment (i.e. around 6 h after initiation of the stemflow).
Our results show that stemflow affects the SWC in the topsoil, even at a horizontal distance of 30 cm from the trunk. Similarly, Carlyle-Moses et al. (2018) used a dye tracer experiment to demonstrate that stemflow infiltrated directly into the soil adjacent to stems and extended belowground to horizontal distances of up to 35 cm from the stems of juvenile lodgepole pine. Contrarily, our finding differs from that of Tischer et al. (2020), who suggested that the topsoil water content at a distance of 20 cm from the trunk of a European beech and sycamore was mainly driven by throughfall rather than stemflow during a stemflow dye tracer experiment conducted on natural rainfall events. On the other hand, Metzger et al. (2017, 2021) found that the SWC was lower in the immediate vicinity of tree stems than in distal areas, due to the differences in soil physical properties (such as lower field capacity and greater saturated hydraulic conductivity near the stem), and suggested that macroporosity enhances drainage near the tree trunk. These dissimilarities may be because our study excluded the throughfall contribution and examined only and exclusively stemflow infiltration dynamics. Our study found that, in the absence of throughfall, the SWC responded similarly to stemflow at 10 and 30 cm from the trunk, indicating that lateral flow was occurring even in the shallow soil layers. We found that stemflow was preferentially funnelled belowground through coarse roots (see Sect. 3.5). Thus, lateral stemflow redistribution within the soil was driven by the root architecture of Scots pines, which develops both horizontal (growing in shallow soil layers) and vertical (growing down to deep soil layers) coarse roots, along with their corresponding fine roots (Fig. S2).
The dynamics of the SWC at different depths also revealed marked differences between the cardinal directions (Fig. 6). In general, the pre-stemflow SWC is greater at depth, and surface probes show a more pronounced response to stemflow towards the end of the experiment (post-stemflow SWC). As expected, the shallower probes exhibited the most pronounced SWC response with a maximum increase ranging from 14 % to 20 %. This is because the surface soil layer (0–10 cm) is the first to become wetter, and the continuous reception of stemflow water contributes to its quicker saturation. However, there is indication of bypass flow, as shown by the faster response of deeper TDR probes, i.e. the TDR probe at 30–60 cm in the east profile and the TDR probe at 30–40 cm in the south profile reacted to the stemflow more quickly than the other probes did (Fig. 6b, c, d). Bypass flow, either by a macropore channel or root presence, leads to spatially irregular wetting of the soil profile with differing flow velocities that allow infiltrating water to move farther and reach deeper soil layers with minimal interaction with the bulk soil (Gerke, 2011).
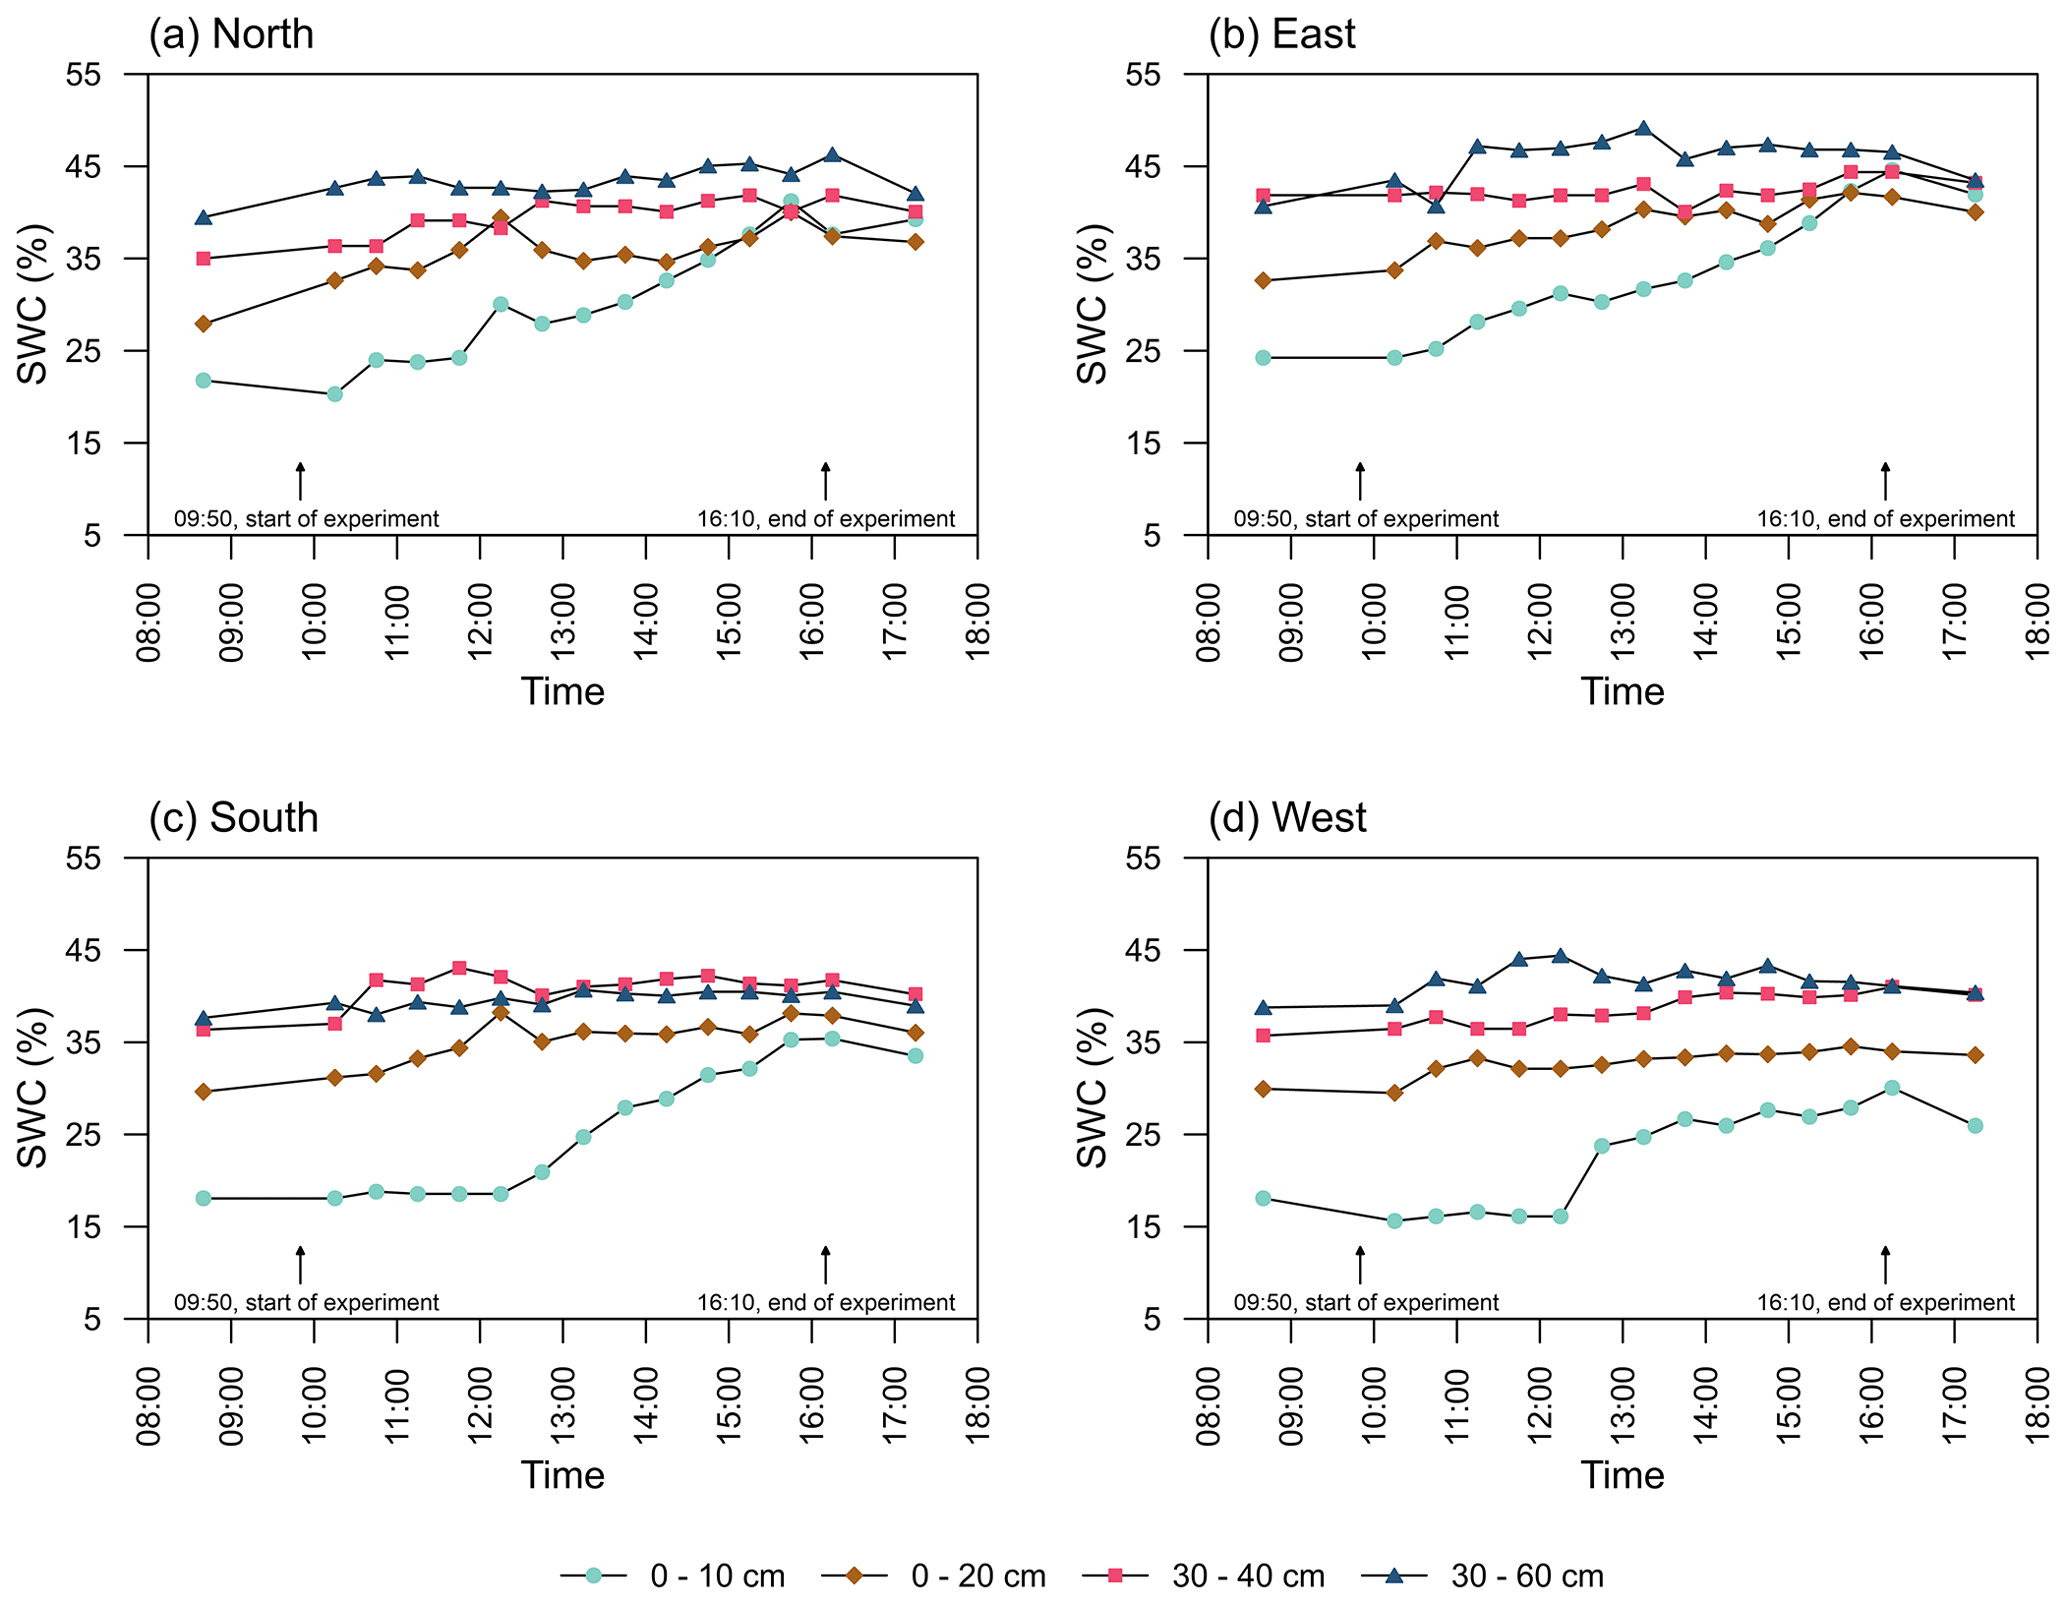
Figure 6Temporal evolution of the volumetric soil water content (SWC) in the depth profiles of each cardinal direction during the stemflow experiment. (All times referenced in the figure are local times.)
3.4 Water table dynamics
Water levels monitored by the mini-piezometers indicated the presence of temporary perched water tables around the tree trunk during the stemflow experiment (Fig. 7). Even near-saturated locations (TDR probes swc-SE30 and swc-W30) received stemflow water, as indicated by the occurrence of blue water in nearby mini-piezometers wt-SE20 and wt-W20, respectively (Fig. S3). However, no SWC response to stemflow was observed at these locations because the soil was already saturated. Although some of the mini-piezometers were close to TDR probes, the relationship between them showed some inconsistencies. For example, no water was observed in mini-piezometer wt-NW20, located between TDR probes swc-NW10 and swc-NW30, which showed maximum SWC changes of 15 % and 7 %, respectively, nor was any water found in mini-piezometer wt-N20 situated close to TDR probes swc-N10 and swc-N30, which showed maximum SWC changes of 11 % and 19 %, respectively (Table 1). This result is likely due to water flowing rapidly through the preferential flow channels and not reaching a positive pore water pressure. On the contrary, increasing water levels were observed at mini-piezometer wt-S20, which was located near TDR probes swc-S10 and swc-S30, which both had a maximum SWC change of only 5 %. However, simultaneous increases in water levels and SWC were observed for mini-piezometers wt-NE20 and wt-E20 (to a lesser extent) and TDR probes swc-NE10 and swc-E10, which were close to each other.

Figure 7Time series of spatial patterns of water level in the 12 mini-piezometers during the experiment. Light pink areas indicate that no water level was detected in the 30 cm deep mini-piezometer, whereas dotted areas indicate zones that were not monitored. Artificial stemflow was initiated at t=0 min and stopped after around t=385 min (highlighted in blue). Cross marks denote mini-piezometers (approximate locations) and the white circle represents the tree trunk.
Mini-piezometers wt-N50, wt-S50 and wt-W50, which were located more than 30 cm from the trunk (Fig. 1), did not register any increase in water level. However, mini-piezometer wt-E50 had a minor increase in water level. Moreover, the groundwater table itself, monitored with northwest and southeast piezometers (1.7 and 2.0 m deep, respectively) at 1.6 m distance from the tree trunk, did not provide any evidence of a change in groundwater levels (Fig. S4). Taken together, the piezometer and SWC measurements down to 30 cm belowground level demonstrate the great temporal and spatial heterogeneity of the soil water dynamics of stemflow infiltration.
3.5 Image analysis of stemflow stain patterns and preferential flow paths
The dye coverage observed in the different vertical soil profiles for the four cardinal directions shows clear indications of preferential flow (Fig. 8). Every cardinal direction shows the same overall pattern of greater dye coverage with increasing proximity to the tree trunk. Similarly, but in horizontal soil profiles, Tischer et al. (2020) reported stemflow stain patterns around the tree base, indicating a decrease in dye coverage with increasing depth from the surface of the organic layer. The distribution of our dye patterns differs from those observed in previous studies of trees conducted on hillslopes (Schwärzel et al., 2012; Spencer and van Meerveld, 2016; Gonzalez-Ollauri et al., 2020), in which dye coverage was found to be lower in the upslope than in the downslope profiles and a clear downward movement of the dye was seen at increasing distance from the tree. We observed the greatest dye coverage in the immediate vicinity of the tree (at 10 cm distance), which suggests that the majority of the stemflow infiltration water was directed vertically. This is likely a consequence of the flat area at our experimental site.
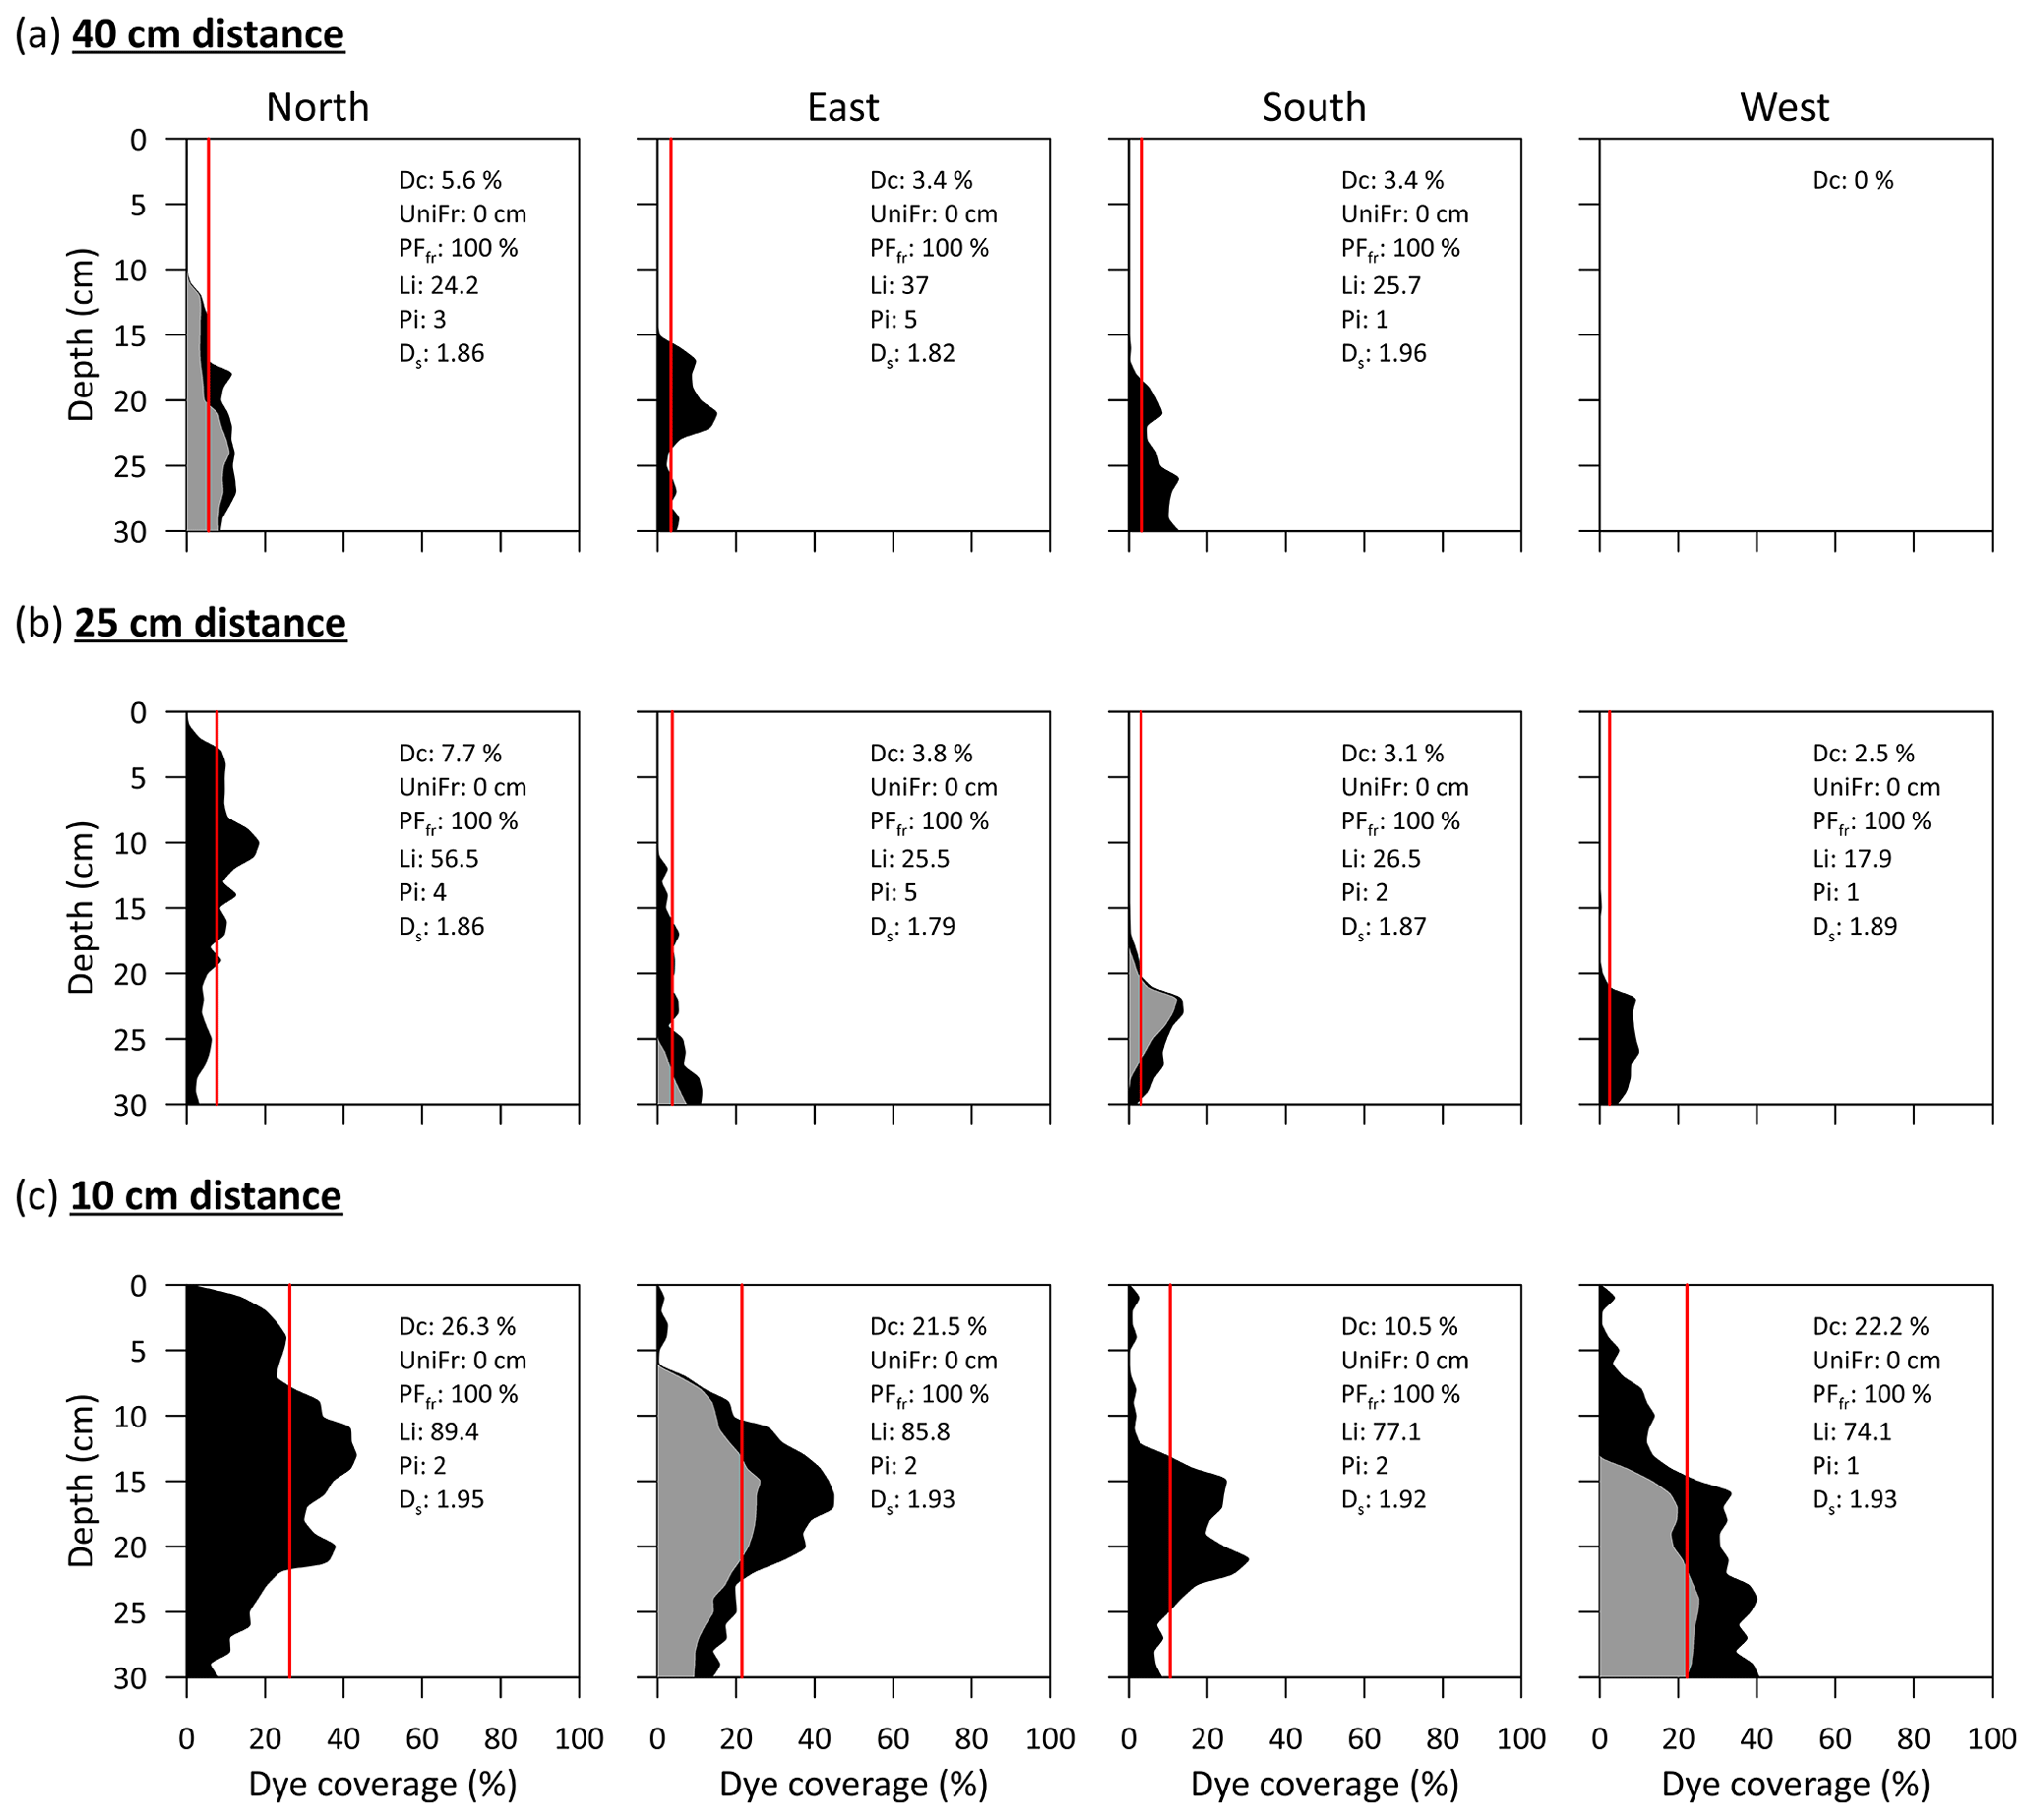
Figure 8Dye coverage (black denotes soil-stained areas and grey denotes root-stained areas) of the different soil profiles at a distance of (a) 40 cm, (b) 25 cm and (c) 10 cm from the tree trunk. Root-stained areas refer to the area occupied by stained roots in line with the soil profile. The following parameters to quantify the degree of preferential flow are shown within each graph: Dc – dye coverage (%), also shown as a red line; UniFr – uniform infiltration depth (cm); PFfr – preferential flow fraction (%); Li – length index; Pi – peak index; and Ds – fractal dimension.
The metrics to characterize the different dye patterns (see Sect. 2.5) corroborate the prevalence of preferential flow (Fig. 8, inserts). The maximum dye coverage observed was less than 30 %, highlighting that water flowed through only a small portion of the soil matrix. The metrics of uniform infiltration depth and the preferential flow fraction indicate the absence of matrix flow (UniFr = 0 cm) and the dominance of preferential flow (PFfr=100 %). The length index (Li) increased with proximity to the trunk and indicated greater irregularity in the dye patterns and, hence, increased preferential flow. Similarly, the peak flow metric (Pi) showed irregular stained profiles. However, lower values were observed at 10 cm distance where direct infiltration is occurring, indicating a less irregular stained pattern. The fractal dimension (Ds) of the stained patterns ranged from 1.79 to 1.96, indicating that the preferential flow pattern occurred in extensive areas (Hatano and Booltink, 1992).
A substantial fraction of bypass and lateral flow occurred along the surface of coarse roots. Living roots can impede flow locally and change the flow towards soil around the root that is non-compacted and highly conductive (Noguchi et al., 1997). In some of the soil profiles, stained roots contributed larger areas to the dye patterns than stained soil (Fig. 8a north, 8b south, and 8c east and west). This pronounced stemflow belowground funnelling along coarse roots is shown in Fig. 9. The same phenomenon was observed in several field studies using dye tracers (e.g. Liang et al., 2011; Schwärzel et al., 2012; Spencer and van Meerveld, 2016; Gonzalez-Ollauri et al., 2020; Tischer et al., 2020) and geophysical techniques (Guo et al., 2020). The dye coverage in our profiles often showed less coverage in the shallow soil layers (0–15 cm) than at greater depth (Fig. 8). This indicates enhanced bypass flow in the shallow soil layers and increasing dye–matrix interaction in deeper layers. This is of great ecohydrological importance, as it may affect processes such as increased moisture, element deposition and contamination in deeper soil layers, where increased dye–matrix interaction has been evidenced. Increased dye–matrix interaction occurs when macropore channels become discontinuous and roots branch out more. This aspect was described by Van Stiphout et al. (1987) as “Internal Catchment”. Moreover, the soil matrix between macropores (i.e. the next smaller pore fraction) must be saturated before water can flow to the next macropore (Beven and Germann, 2013). Although few small stones were found during the excavation, these may influence preferential flow. We observed that some macropores were intersected by stones and extended dye coverage was found around these stones.
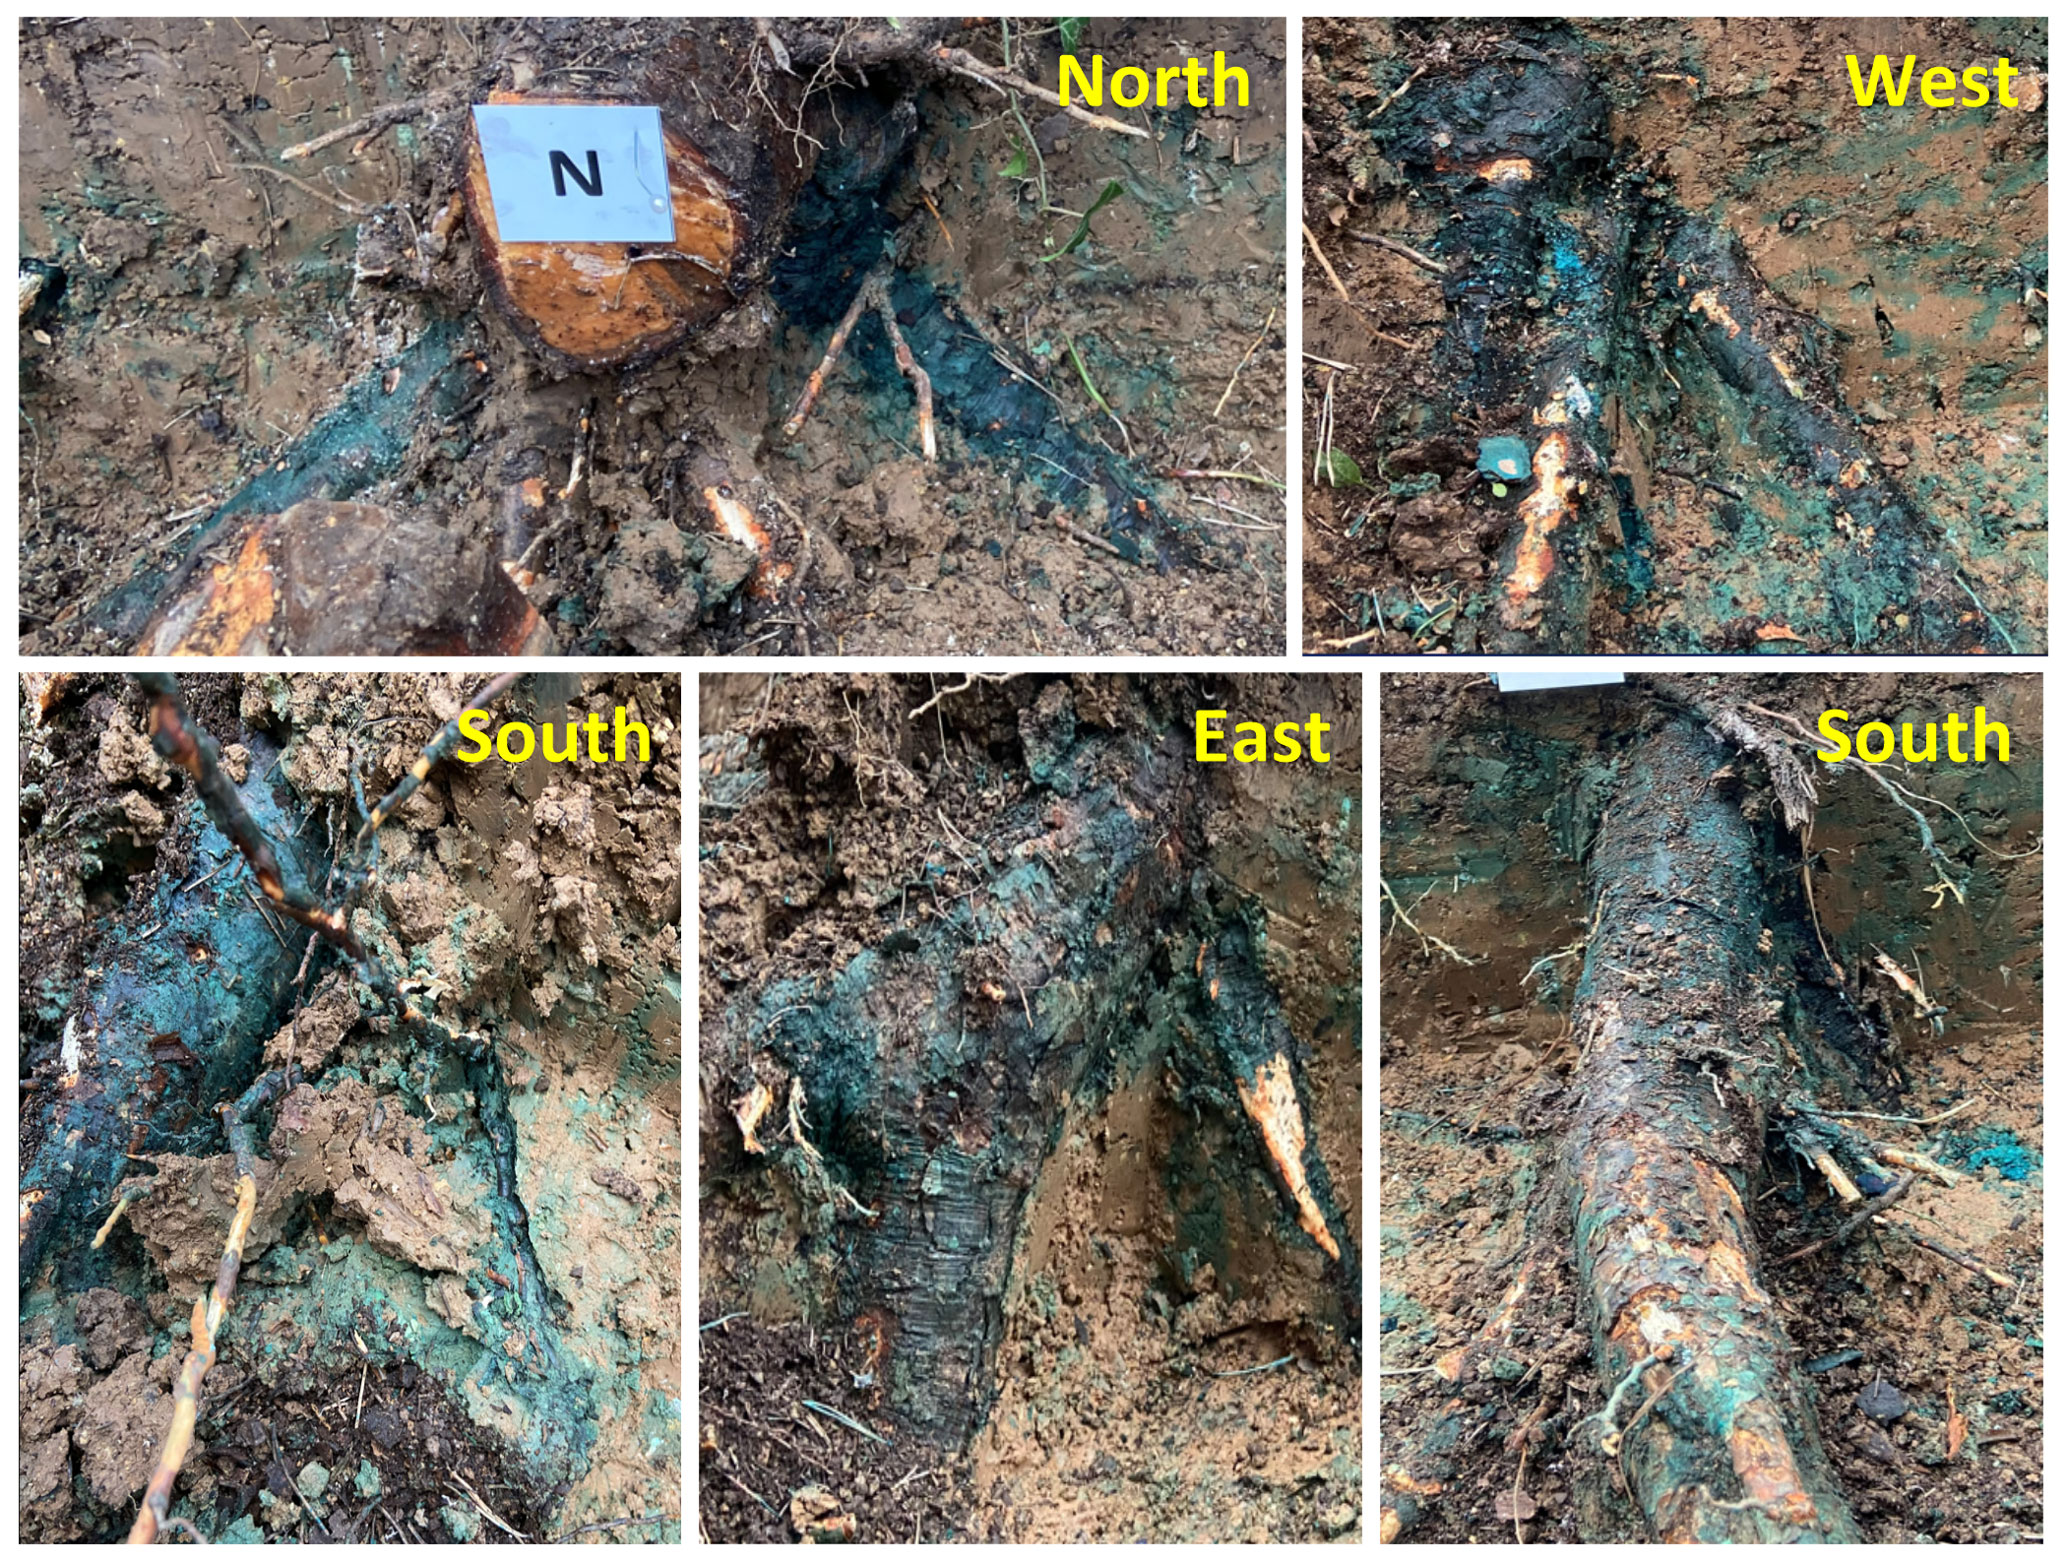
Figure 9Examples of stained roots observed during the excavation of the soil profiles around the tree trunk, illustrating the preferential belowground funnelling of stemflow along coarse roots.
It should be noted that stemflow stain infiltration patterns could behave differently with other tree species and their associated root–soil systems, soil physical and chemical properties, and antecedent soil moisture conditions (Phillips et al., 2019). For example, using dual-tracer infiltration experiments, Luo et al. (2019, 2023) found that the degree of preferential flow was greater in coniferous than deciduous forest soil and that roots enhanced preferential flow, strongly influencing the distribution of the soil water content. This highlights the important role of tree species and forest composition on preferential flows. In addition, slope topography plays a key role in determining stemflow infiltration by diverting most of the stemflow water downslope through gravity, which can lead to overland-flow generation (Gonzalez-Ollauri et al., 2020).
The non-uniform dye patterns and SWC heterogeneity around the tree during the stemflow experiment can be attributed to four factors. First, the preferential flow of stemflow on the trunk itself can affect the aforementioned factors (as shown in Pinos et al., 2021). Although stemflow was evenly discharged around the trunk at a height of 1.3 m, preferential flow on the trunk was observed below this height. Second, the non-uniform infiltration of stemflow into the soil and preferential flow in the soil due to the presence of coarse roots, which redistribute water flow both vertically and horizontally, can cause heterogeneity (Schwärzel et al., 2012). Third, the temporary presence of local perched water tables can result in non-uniform dye patterns and SWC heterogeneity (Liang et al., 2011). Finally, non-uniformity can result from a heterogeneous soil structure (Metzger et al., 2017, 2021).
3.6 Dye and deuterium concentrations in soil samples
As expected, the concentrations of both tracers in the preferential flow paths (i.e. the stained areas) were significantly higher than in the surrounding soil matrix (i.e. the non-stained areas). In general, the concentrations of brilliant blue FCF and of the deuterium isotopic composition in the soil samples decreased with distance from the tree (R2=0.49 for both tracers; Fig. 10). Moreover, the maximum concentrations of both tracers in the different consecutive profiles also decreased with increasing distance from the trunk (Table S1 in the Supplement). The brilliant blue FCF concentrations and deuterium isotopic compositions ranged from 0 to 473 mg kg−1 of soil and from −56.5 ‰ to 277.1 ‰, respectively. For both tracers, the concentrations found in soil were considerably smaller than the original concentration of the labelled stemflow water, with the maximum measured in soil samples representing 9.5 % and 55.4 % of their original concentrations for brilliant blue FCF and deuterium, respectively. This can be explained by (1) sorption of brilliant blue FCF on the trunk bark and soil surfaces and (2) dilution of the stemflow water by residual soil water.
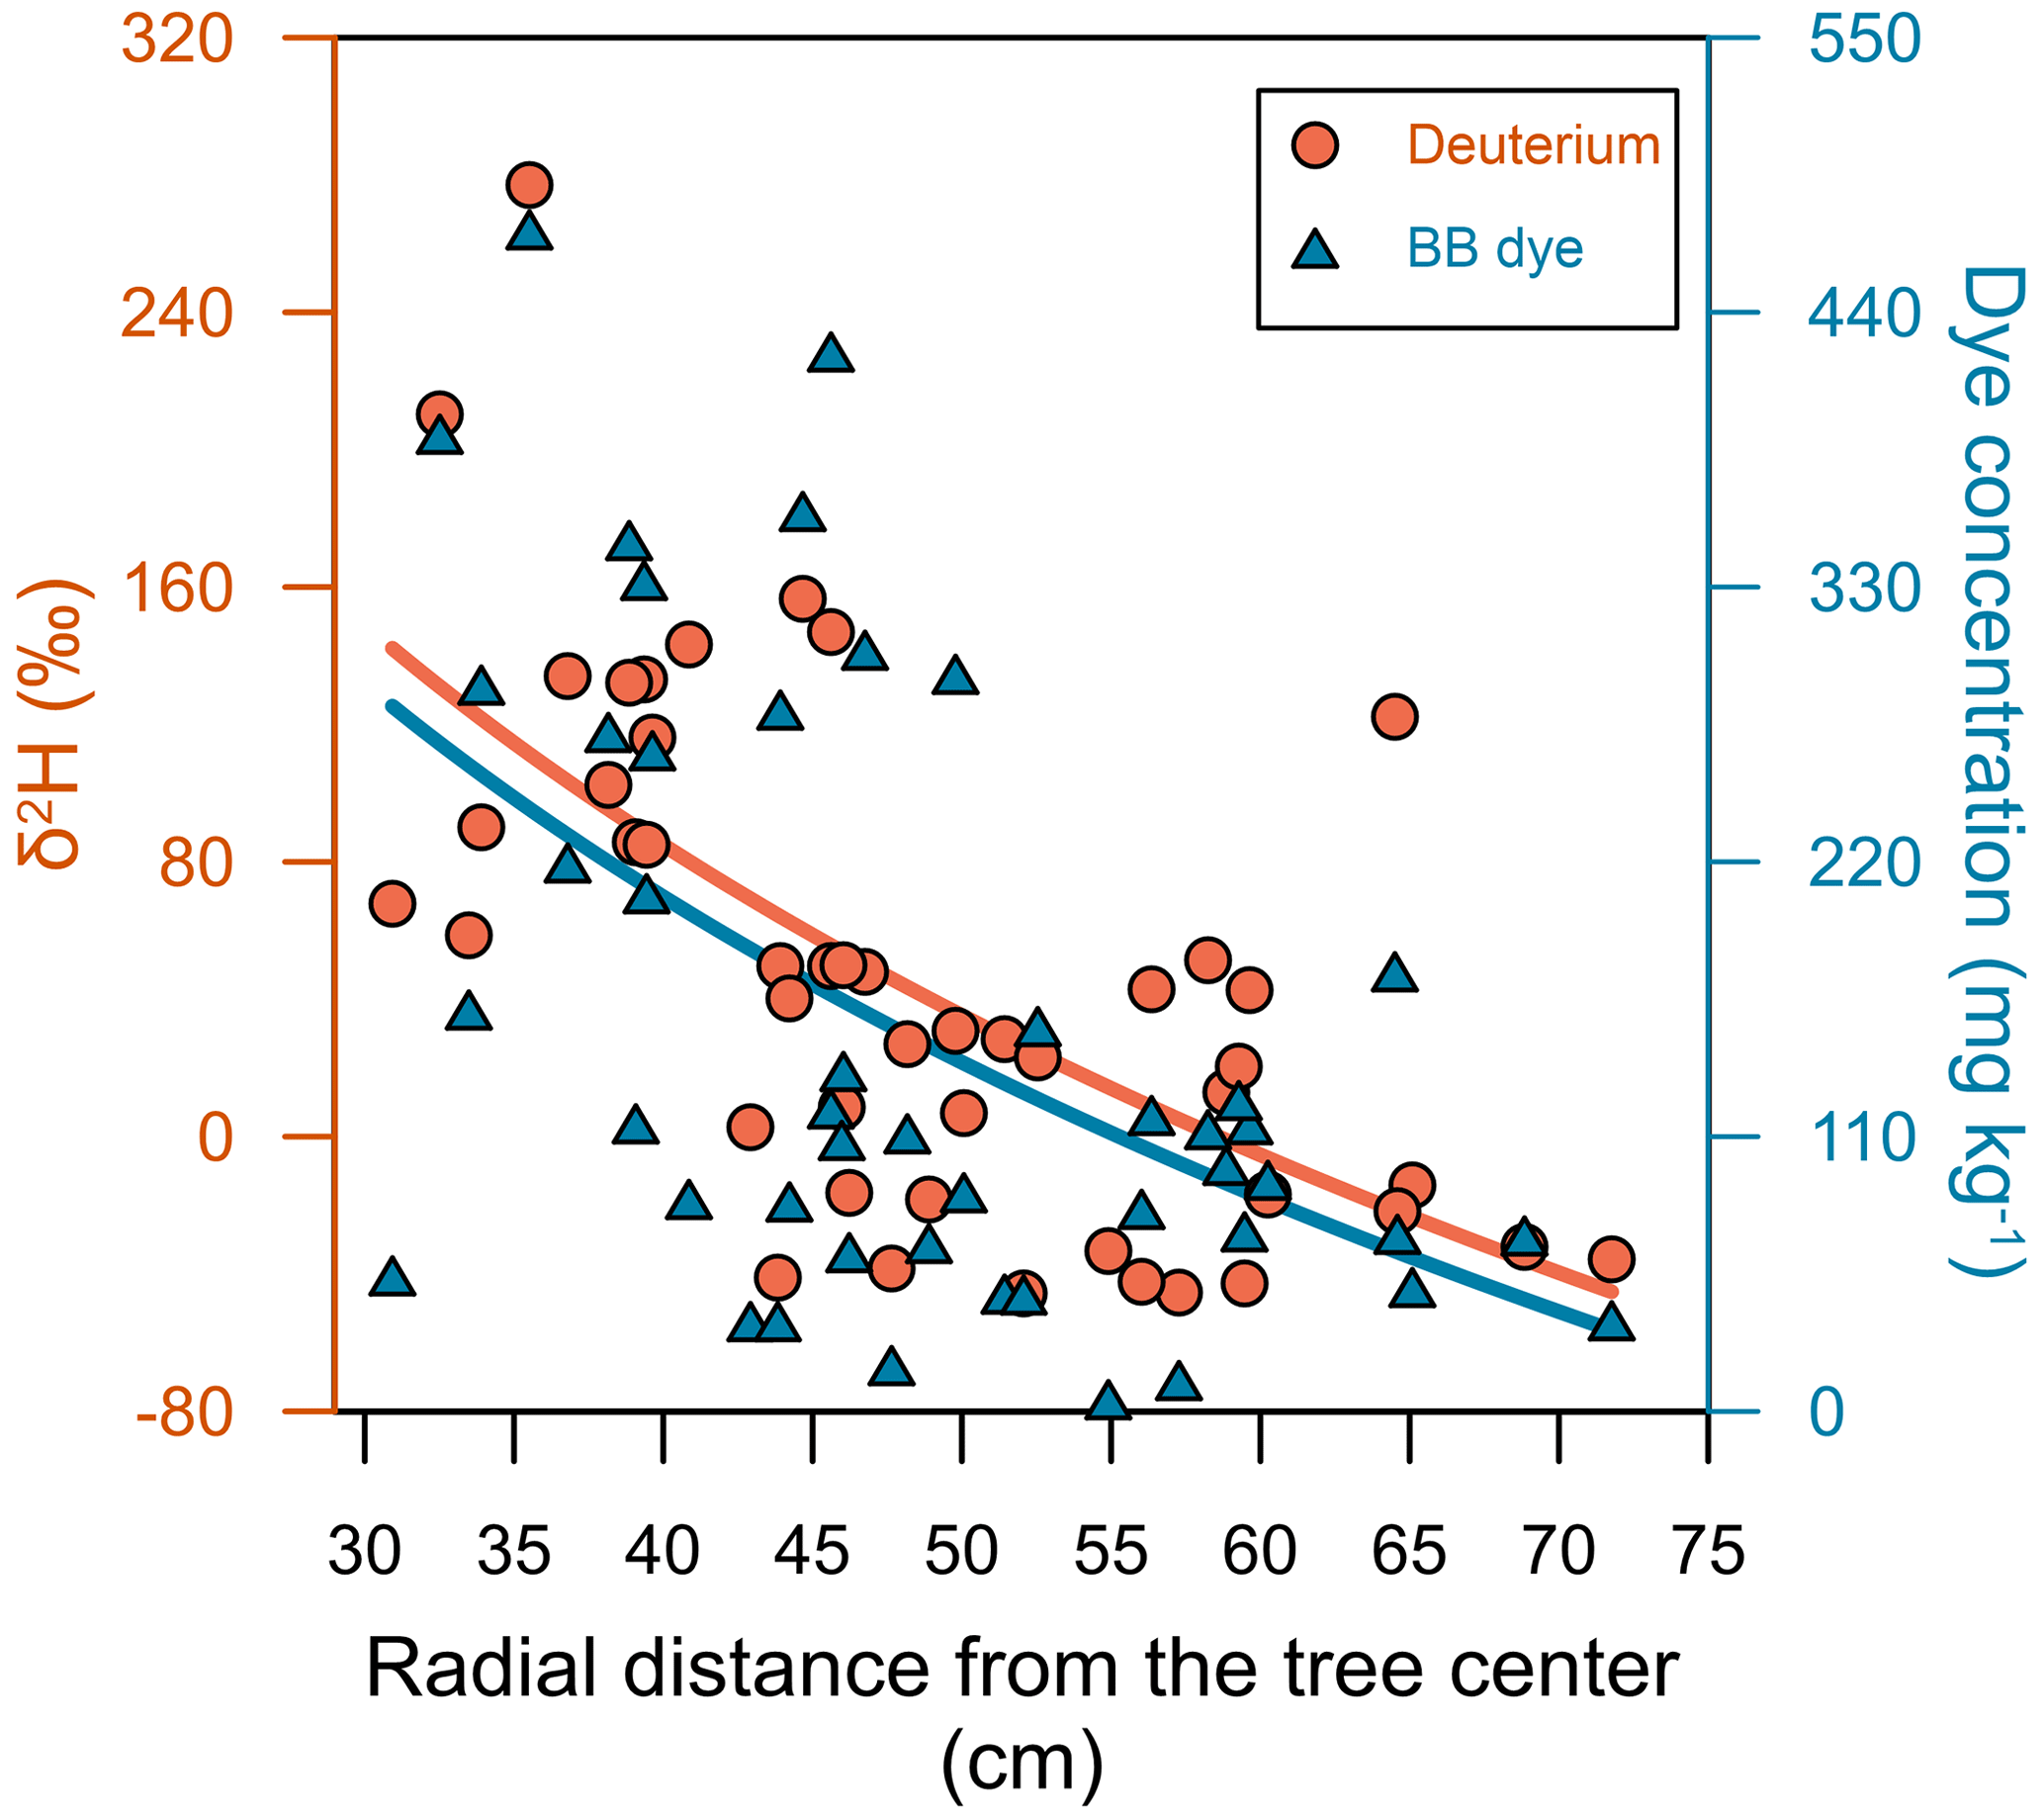
Figure 10Relationships of the travel distance (three-dimensional coordinate system) with the deuterium isotopic composition and brilliant blue FCF dye concentration for the 63 soil samples. Solid lines indicate logarithmic fits.
Both tracers were significantly correlated (p<0.01, R2=0.78; Fig. S5): there was no evidence that deuterium moved deeper or farther through the soil than the dye tracer. This suggests that the two tracers can be used interchangeably to delineate preferential flow pathways. It is known that brilliant blue FCF sorbs to soil surfaces and is, therefore, retarded to some extent (Flury and Flühler, 1995), but the close correlation of brilliant blue FCF with deuterium in our study shows that the stemflow water was mainly moving along preferential flow pathways with minimal interactions with adsorbing surfaces.
The water samples taken from the mini-piezometer revealed that the temporary perched water tables have a similar brilliant blue FCF concentration to the original stemflow water of ∼5 g L−1 (Table S2). This corroborates the prevalence of preferential flow of the stemflow water once it infiltrates into the soil. However, deeper groundwater (>1 m depth) did not show the presence of dye or deuterium enrichment, indicating that stemflow water did not penetrate deep into the subsoil.
Stemflow infiltration occurred in an annulus-shaped area in the vicinity of the trunk and was characterized by high spatiotemporal variability. In some near-stem locations, perched water tables developed at shallow depths. The dye patterns and isotopic composition demonstrated (qualitatively and quantitatively) the dominance of preferential flow in the soil. The belowground funnelling phenomenon was clearly shown by the infiltration of stemflow into the soil along the surface of coarse roots and macropore channels. The root architecture was the main driver of stemflow water redistribution both horizontally and vertically in the soil matrix, followed by bypass flow along the macropore network.
The dual-tracer approach (brilliant blue FCF dye and deuterium) and in situ sensing of soil moisture delineate and quantify stemflow belowground funnelling well. brilliant blue FCF has proven to be an excellent dye tracer to stain and measure preferential flow pathways. The concentration (5 g L−1) used correctly ensured that mobility would not be limited (despite its possible sorption by trunk bark and soil surfaces) by the local conditions of the present study (i.e. rough bark and silt loam soils). On the other hand, deuterium is a conservative tracer, but preferential flow paths can only be identified with extensive soil sampling and analyses.
We conclude that the root architecture of trees leads to preferential flow and, thus, the non-uniform distribution of water in the soil profile. The funnelling effect causes water to infiltrate along roots and macropores near the soil surface and deeper in the soil. Our results are in line with previous research and contribute a more general mechanistic understanding of belowground stemflow infiltration in forests. Most importantly, our results suggests that stemflow belowground funnelling is an important hydrological and ecological feature in humid Mediterranean forest catchments.
The field data and photographs from the present experiment are available upon request from Juan Pinos or Pilar Llorens.
The supplement related to this article is available online at: https://doi.org/10.5194/hess-27-2865-2023-supplement.
PL, JL and JP designed and conducted the experiment. JP, JL and MF carried out the data analysis and wrote the initial draft of the paper. All authors discussed the results and edited the paper.
At least one of the (co-)authors is a member of the editorial board of Hydrology and Earth System Sciences. The peer-review process was guided by an independent editor, and the authors also have no other competing interests to declare.
Publisher's note: Copernicus Publications remains neutral with regard to jurisdictional claims in published maps and institutional affiliations.
The authors are grateful to Gisel Bertran, Miguel Corriols and Francesc Gallart for their support during the fieldwork. We also wish to thank Antonio Molina, Elisenda Sánchez, Carles Cayuela, Mariano Moreno de las Heras and Alejandro Blanco for their help during the preparation phase of the experiment.
This research has been supported by the Spanish Ministry of Science and Innovation (Ministerio de Ciencia e Innovación, Agencia Estatal de Investigación; grant nos. BES-2017-082234, CEX2018-000794-S and PID2019-106583RB-I00).
The publication fee for this work was covered by the CSIC Open Access Publication Support Initiative through its Unit of Information Resources for Research (URICI).
This paper was edited by Loes van Schaik and reviewed by Alejandro Gonzalez Ollauri and one anonymous referee.
Bargués Tobella, A., Reese, H., Almaw, A., Bayala, J., Malmer, A., Laudon, H., and Ilstedt, U.: The effect of trees on preferential flow and soil infiltrability in an agroforestry parkland in semiarid Burkina Faso, Water Resour. Res., 50, 3342–3354, https://doi.org/10.1002/2013WR015197, 2014.
Beven, K. and Germann, P.: Macropores and water flow in soils revisited, Water Resour. Res., 49, 3071–3092, https://doi.org/10.1002/wrcr.20156, 2013.
Carlyle-Moses, D. E., Iida, S., Germer, S., Llorens, P., Michalzik, B., Nanko, K., Tischer, A., and Levia, D. F.: Expressing stemflow commensurate with its ecohydrological importance, Adv. Water Resour., 121, 472–479, https://doi.org/10.1016/j.advwatres.2018.08.015, 2018.
Carlyle-Moses, D. E., Iida, S., Germer, S., Llorens, P., Michalzik, B., Nanko, K., Tanaka, T., Tischer, A., and Levia, D. F.: Commentary: What we know about stemflow's infiltration area, Front. Forests Global Change, 3, 577247, https://doi.org/10.3389/ffgc.2020.577247, 2020.
Cayuela, C., Llorens, P., Sánchez-Costa, E., Levia, D. F., and Latron, J.: Effect of biotic and abiotic factors on inter-and intra-event variability in stemflow rates in oak and pine stands in a Mediterranean mountain area, J. Hydrol., 560, 396–406, https://doi.org/10.1016/j.jhydrol.2018.03.050, 2018.
Di Prima, S., Giannini, V., Roder, L. R., Giadrossich, F., Lassabatere, L., Stewart, R. D., Abou Najm, M. R., Longo, V., Campus, S., Winiarski, T., Angulo-Jaramillo, R., del Campo, A., Capello, G., Biddoccu, M., Roggero P. P., and Pirastru, M.: Coupling time-lapse ground penetrating radar surveys and infiltration experiments to characterize two types of non-uniform flow, Sci. Total Environ., 806, 150410, https://doi.org/10.1016/j.scitotenv.2021.150410, 2022.
Faé, G. S., Montes, F., Bazilevskaya, E., Añó, R. M., and Kemanian, A. R.: Making soil particle size analysis by laser diffraction compatible with standard soil texture determination methods, Soil Sci. Soc. Am. J., 83, 1244–1252, https://doi.org/10.2136/sssaj2018.10.0385, 2019.
Fan, B., Liu, X., Zhu, Q., Qin, G., Li, J., Lin, H., and Guo, L.: Exploring the interplay between infiltration dynamics and Critical Zone structures with multiscale geophysical imaging: A review, Geoderma, 374, 114431, https://doi.org/10.1016/j.geoderma.2020.114431, 2020.
Flury, M. and Flühler, H.: Brilliant Blue FCF as a dye tracer for solute transport studies - a toxicological overview, J. Environ. Qual., 23, 1108–1112, https://doi.org/10.2134/jeq1994.00472425002300050037x, 1994.
Flury, M. and Flühler, H.: Tracer characteristics of Brilliant Blue FCF, Soil Sci. Soc. Am. J., 59, 22–27, https://doi.org/10.2136/sssaj1995.03615995005900010003x, 1995.
Flury, M. and Wai, N. N.: Dyes as tracers for vadose zone hydrology, Rev. Geophys., 41, 1002, https://doi.org/10.1029/2001RG000109, 2003.
Flury, M., Flühler, H., Jury, W. A., and Leuenberger, J.: Susceptibility of soils to preferential flow of water: A field study, Water Resour. Res., 30, 1945–1954, https://doi.org/10.1029/94WR00871, 1994.
Forrer, I., Papritz, A., Kasteel, R., Flühler, H., and Luca, D.: Quantifying dye tracers in soil profiles by image processing, Eur. J. Soil Sci., 51, 313-322, https://doi.org/10.1046/j.1365-2389.2000.00315.x, 2000.
Gerke, H. H.: Bypass flow in soil, in: Encyclopedia of Agrophysics, edited by: Gliński, J., Horabik, J., and Lipiec, J., Springer, Dordrecht, the Netherlands, 100–105, https://doi.org/10.1007/978-90-481-3585-1_23, 2011.
German-Heins, J. and Flury, M.: Sorption of Brilliant Blue FCF in soils as affected by pH and ionic strength, Geoderma, 97, 87–101, https://doi.org/10.1016/S0016-7061(00)00027-6, 2000.
Ghodrati, M. and Jury, W. A.: A field study using dyes to characterize preferential flow of water, Soil Sci. Soc. Am. J., 54, 1558–1563, https://doi.org/10.2136/sssaj1990.03615995005400060008x, 1990.
Gonzalez-Ollauri, A., Stokes, A., and Mickovski, S. B.: A novel framework to study the effect of tree architectural traits on stemflow yield and its consequences for soil-water dynamics, J. Hydrol., 582, 124448, https://doi.org/10.1016/j.jhydrol.2019.124448, 2020.
Guo, L., Mount, G. J., Hudson, S., Lin, H., and Levia, D.: Pairing geophysical techniques improves understanding of the near-surface Critical Zone: Visualization of preferential routing of stemflow along coarse roots, Geoderma, 357, 113953, https://doi.org/10.1016/j.geoderma.2019.113953, 2020.
Hao, X., Ball, B. C., Culley, J. L. B., Carter, M. R., and Parkin, G. W.: Soil density and porosity, in: Soil Sampling and Methods of Analysis, Earth Sciences, Environment & Agriculture, edited by: Carter, M. R. and Gregorich, E. G., CRC Press, Boca Raton, FL, USA, 743–759, https://doi.org/10.1201/9781420005271, 2007.
Hatano, R. and Booltink, H. W. G.: Using fractal dimensions of stained flow patterns in a clay soil to predict bypass flow, J. Hydrol., 135, 121–131, https://doi.org/10.1016/0022-1694(92)90084-9, 1992.
Hatano, R., Kawamura, N., Ikeda, J., and Sakuma, T.: Evaluation of the effect of morphological features of flow paths on solute transport by using fractal dimensions of methylene blue staining pattern, Geoderma, 53, 31–44, https://doi.org/10.1016/0016-7061(92)90019-4, 1992.
Hildebrandt, A.: Root-Water Relations and Interactions in Mixed Forest Settings, in: Forest-Water Interactions, Ecological Studies (Analysis and Synthesis), edited by: Levia, D. F., Carlyle-Moses, D. E., Iida, S., Michalzik, B., Nanko, K., and Tischer, A., Springer, Cham, Zug, Switzerland, 319–348, https://doi.org/10.1007/978-3-030-26086-6_14, 2020.
Iovino, M., Pekárová, P., Hallett, P. D., Pekár, J., Lichner, L., Mataix-Solera, J., Alagna, V., Walsh, R., Raffan, A., Schacht, K., and Rodný, M.: Extent and persistence of soil water repellency induced by pines in different geographic regions, J. Hydrol. Hydromech., 66, 360–368, https://doi.org/10.2478/johh-2018-0024, 2018.
Johnson, M. S. and Lehmann, J.: Double-funneling of trees: stemflow and root-induced preferential flow, Écoscience, 13, 324–333, https://doi.org/10.2980/i1195-6860-13-3-324.1, 2006.
Kendall, C. and McDonnell, J. J. (Eds.): Isotope Tracers in Catchment Hydrology, Elsevier, Amsterdam, the Netherlands, paperback ISBN 9780444501554, eBook ISBN 9780080929156, 1998.
Ketelsen, H. and Meyer-Windel, S.: Adsorption of brilliant blue FCF by soils, Geoderma, 90, 131–145, https://doi.org/10.1016/S0016-7061(98)00119-0, 1999.
Kobayashi, M. and Shimizu, T.: Soil water repellency in a Japanese cypress plantation restricts increases in soil water storage during rainfall events, Hydrol. Process., 21, 2356–2364, https://doi.org/10.1002/hyp.6754, 2007.
Levia, D. F. and Frost, E. E.: A review and evaluation of stemflow literature in the hydrologic and biogeochemical cycles of forested and agricultural ecosystems, J. Hydrol., 274, 1–29, https://doi.org/10.1016/S0022-1694(02)00399-2, 2003.
Levia, D. F. and Germer, S.: A review of stemflow generation dynamics and stemflow-environment interactions in forests and shrublands, Rev. Geophys., 53, 673–714, https://doi.org/10.1002/2015RG000479, 2015.
Levia, D. F., Carlyle-Moses, D., and Tanaka, T. (Eds.): Forest Hydrology and Biogeochemistry: Synthesis of Past Research and Future Directions, Springer, Dordrecht, the Netherlands, https://doi.org/10.1007/978-94-007-1363-5, 2011.
Liang, W. L., Kosugi, K. I., and Mizuyama, T.: Soil water dynamics around a tree on a hillslope with or without rainwater supplied by stemflow, Water Resour. Res., 47, W02541, https://doi.org/10.1029/2010WR009856, 2011.
Llorens, P. and Domingo, F.: Rainfall partitioning by vegetation under Mediterranean conditions. A review of studies in Europe, J. Hydrol., 335, 37–54, https://doi.org/10.1016/j.jhydrol.2006.10.032, 2007.
Llorens, P., Gallart, F., Cayuela, C., Roig-Planasdemunt, M., Casellas, E., Molina, A. J., Moreno-de las Heras, M., Bertran, G., Sánchez-Costa, E., and Latron, J.: What have we learnt about Mediterranean catchment hydrology? 30 years observing hydrological processes in the Vallcebre research catchments, Geogr. Res. Lett., 44, 475–501, https://doi.org/10.18172/cig.3432, 2018.
Llorens, P., Latron, J., Carlyle-Moses, D. E., Näthe, K., Chang, J. L., Nanko, K., Iida, S., and Levia, D. F.: Stemflow infiltration areas into forest soils around American beech (Fagus grandifolia Ehrh.) trees, Ecohydrology, 15, e2369, https://doi.org/10.1002/eco.2369, 2022.
Luo, Z., Niu, J., Zhang, L., Chen, X., Zhang, W., Xie, B., Du, J., Zhu, Z., Wu, S., and Li, X.: Roots-enhanced preferential flows in deciduous and coniferous forest soils revealed by dual-tracer experiments, J. Environ. Qual., 48, 136–146, https://doi.org/10.2134/jeq2018.03.0091, 2019.
Luo, Z., Niu, J., He, S., Zhang, L., Chen, X., Tan, B., Wang, D., and Berndtsson, R.: Linking roots, preferential flow, and soil moisture redistribution in deciduous and coniferous forest soils, J. Soils Sediments, 23, 1524–1538, https://doi.org/10.1007/s11368-022-03375-w, 2023.
Magyar, D., Van Stan, J. T., and Sridhar, K. R.: Hypothesis and theory: fungal spores in stemflow and potential bark sources, Front. Forests Global Change, 4, 623758, https://doi.org/10.3389/ffgc.2021.623758, 2021.
Metzger, J. C., Wutzler, T., Dalla Valle, N., Filipzik, J., Grauer, C., Lehmann, R., Roggenbuck, M., Schelhorn, D., Weckmüller, J., Küsel, K., Totsche, K. U., Trumbore, S., and Hildebrandt, A.: Vegetation impacts soil water content patterns by shaping canopy water fluxes and soil properties, Hydrol. Process., 31, 3783–3795, https://doi.org/10.1002/hyp.11274, 2017.
Metzger, J. C., Filipzik, J., Michalzik, B., and Hildebrandt, A.: Stemflow infiltration hotspots create soil microsites near tree stems in an unmanaged mixed beech forest, Front. Forests Global Change, 4, 701293, https://doi.org/10.3389/ffgc.2021.701293, 2021.
Molina, A. J., Llorens, P., Garcia-Estringana, P., de Las Heras, M. M., Cayuela, C., Gallart, F., and Latron, J.: Contributions of throughfall, forest and soil characteristics to near-surface soil water-content variability at the plot scale in a mountainous Mediterranean area, Sci. Total Environ., 647, 1421–1432, https://doi.org/10.1016/j.scitotenv.2018.08.020, 2019.
Noguchi, S., Nik, A. R., Kasran, B., Tani, M., Sammori, T., and Morisada, K.: Soil physical properties and preferential flow pathways in tropical rain forest, Bukit Tarek, Peninsular Malaysia, J. Forest Res., 2, 115–120, https://doi.org/10.1007/BF02348479, 1997.
Phillips, T. H., Baker, M. E., Lautar, K., Yesilonis, I., and Pavao-Zuckerman, M. A.: The capacity of urban forest patches to infiltrate stormwater is influenced by soil physical properties and soil moisture, J. Environ. Manage., 246, 11–18, https://doi.org/10.1016/j.jenvman.2019.05.127, 2019.
Pinos, J., Latron, J., Levia, D. F., and Llorens, P.: Drivers of the circumferential variation of stemflow inputs on the boles of Pinus sylvestris L. (Scots pine), Ecohydrology, 14, e2348, https://doi.org/10.1002/eco.2348, 2021.
Poyatos, R., Latron, J., and Llorens, P.: Land use and land cover change after agricultural abandonment, Mt. Res. Dev., 23, 362–368, https://doi.org/10.1659/0276-4741(2003)023[0362:LUALCC]2.0.CO;2, 2003.
Rubio, C. M., Llorens, P., and Gallart, F.: Uncertainty and efficiency of pedotransfer functions for estimating water retention characteristics of soils, Eur. J. Soil Sci., 59, 339–347, https://doi.org/10.1111/j.1365-2389.2007.01002.x, 2008.
Schwärzel, K., Ebermann, S., and Schalling, N.: Evidence of double-funneling effect of beech trees by visualization of flow pathways using dye tracer, J. Hydrol., 470, 184–192, https://doi.org/10.1016/j.jhydrol.2012.08.048, 2012.
Spencer, S. A. and van Meerveld, H. V.: Double funnelling in a mature coastal British Columbia forest: spatial patterns of stemflow after infiltration, Hydrol. Process., 30, 4185–4201, https://doi.org/10.1002/hyp.10936, 2016.
Sprenger, M., Llorens, P., Cayuela, C., Gallart, F., and Latron, J.: Mechanisms of consistently disjunct soil water pools over (pore) space and time, Hydrol. Earth Syst. Sci., 23, 2751–2762, https://doi.org/10.5194/hess-23-2751-2019, 2019.
Tischer, A., Michalzik, B., and Lotze, R.: Nonuniform but highly preferential stemflow routing along bark surfaces and actual smaller infiltration areas than previously assumed: A case study on European beech (Fagus sylvatica L.) and sycamore maple (Acer pseudoplatanus L.), Ecohydrology, 13, e2230, https://doi.org/10.1002/eco.2230, 2020.
Tonello, K. C., Campos, S. D., de Menezes, A. J., Bramorski, J., Mathias, S. L., and Lima, M. T.: How is bark absorbability and wettability related to stemflow yield? Observations from isolated trees in the Brazilian Cerrado, Front. Forests Global Change, 4, 650665, https://doi.org/10.3389/ffgc.2021.650665, 2021.
Tucker, A., Levia, D. F., Katul, G. G., Nanko, K., and Rossi, L. F.: A network model for stemflow solute transport, Appl. Math. Model., 88, 266–282, https://doi.org/10.1016/j.apm.2020.06.047, 2020.
USDA, Soil survey manual, in: Soil Survey Division Staff, Soil Conservation Service Volume Handbook 18, in: Chapter 3, US Department of Agriculture, https://www.nrcs.usda.gov/sites/default/files/2022-09/SSM-ch3.pdf (last access: 26 July 2023), 2017.
Van Schaik, N. L. M. B.: Spatial variability of infiltration patterns related to site characteristics in a semi-arid watershed, Catena, 78, 36–47, https://doi.org/10.1016/j.catena.2009.02.017, 2009.
Van Stan, J. T., Gutmann, E., and Friesen, J. (Eds.): Precipitation Partitioning by Vegetation: A Global Synthesis, Springer, Cham, Switzerland, https://doi.org/10.1007/978-3-030-29702-2, 2020.
Van Stan, J. T., Ponette-González, A. G., Swanson, T., and Weathers, K. C.: Throughfall and stemflow are major hydrologic highways for particulate traffic through tree canopies, Front. Ecol. Environ., 19, 404–410, https://doi.org/10.1002/fee.2360, 2021.
Van Stiphout, T. P. J., Van Lanen, H. A. J., Boersma, O. H., and Bouma, J.: The effect of bypass flow and internal catchment of rain on the water regime in a clay loam grassland soil, J. Hydrol., 95, 1–11, https://doi.org/10.1016/0022-1694(87)90111-9, 1987.
Wang, X., Wang, J., and Zhang, J.: Comparisons of three methods for organic and inorganic carbon in calcareous soils of northwestern China, PLOS ONE, 7, e44334, https://doi.org/10.1371/journal.pone.0044334, 2012.
Weiler, M. and Flühler, H.: Inferring flow types from dye patterns in macroporous soils, Geoderma, 120, 137–153, https://doi.org/10.1016/j.geoderma.2003.08.014, 2004.
Yue, K., De Frenne, P., Fornara, D. A., Van Meerbeek, K., Li, W., Peng, X., Ni, X., Peng, Y., Wu, F., Yang, Y., and Peñuelas, J.: Global patterns and drivers of rainfall partitioning by trees and shrubs, Global Change Biol., 27, 3350–3357, https://doi.org/10.1111/gcb.15644, 2021.
Zhang, Y. and Schaap, M. G.: Weighted recalibration of the Rosetta pedotransfer model with improved estimates of hydraulic parameter distributions and summary statistics (Rosetta3), J. Hydrol., 547, 39–53, https://doi.org/10.1016/j.jhydrol.2017.01.004, 2017.
Zhang, Y., Wang, X., Pan, Y., Hu, R., and Chen, N.: Global quantitative synthesis of effects of biotic and abiotic factors on stemflow production in woody ecosystems, Global Ecol. Biogeogr., 30, 1713–1723, https://doi.org/10.1111/geb.13322, 2021.
Zisa, R. P., Halverson, H. G., and Stout, B. B.: Establishment and early growth of conifers on compact soils in urban areas, Res. Pap. NE-451, US Department of Agriculture, Forest Service, Northeastern Forest Experiment Station, Broomall, PA, USA, 8 pp., https://www.fs.usda.gov/research/treesearch/14985 (last access: 26 July 2023), 1980.