the Creative Commons Attribution 4.0 License.
the Creative Commons Attribution 4.0 License.
 | 10 Jul 2023
Improving soil aquifer treatment efficiency using air injection into the subsurface
Ido Arad
Aviya Ziner
Shany Ben Moshe
Noam Weisbrod
Alex Furman
Soil aquifer treatment (SAT) is an effective and sustainable technology for wastewater or stormwater treatment, storage, and reuse. During SAT, the vadose zone acts as a pseudo-reactor in which physical and biochemical processes are utilized to improve the infiltrated-water quality. Dissolved oxygen (DO) is necessary for aerobic microbial oxidation of carbon and nitrogen species in the effluent. Therefore, to enhance aeration, SAT is generally operated in flooding and drying cycles. While long drying periods (DPs) lead to better oxidizing conditions and improve water quality, they reduce recharge volumes. As the population grows, the quantity of effluent directed to SAT sites increases, and increasing recharge volumes become a concern and often a limiting factor for SAT usage.
In this study, direct subsurface air injection SAT (Air-SAT) was tested as an alternative to long-DP operation. Six long-column experiments were conducted (2 m column) that aimed to examine the effect of air injection on the soil's water content, oxidation–reduction potential (ORP), DO concentrations, infiltrated amounts, and ultimate outflow quality. In addition to basic parameters, such as dissolved organic C (DOC) and N species, the effluent quality analysis also included an examination of three emerging water contaminants: ibuprofen, carbamazepine, and 1H-benzotriazole. Pulsed-air-injection experiments were conducted during continuous flooding using different operation modes (i.e., air pulse durations, frequencies, and airflow rates).
Our results show that Air-SAT operation doubled the time during which infiltration was possible (i.e., the infiltration was continuous with no downtime) and allowed up to a 46 % higher mean infiltration rate in some cases. As a result, the infiltration volumes in the Air-SAT modes were 47 %–203 % higher than conventional flooding–drying operation (FDO). A longer air pulse duration (60 min vs. 8 min) and higher airflow rate (∼2 L min−1 vs. ∼1 L min−1) led to a higher mean infiltration rate, whereas a high pulse frequency (4.5 h−1) led to a lower mean infiltration rate compared with low-frequency operation (24 h−1).
Air injection also allowed good recovery of the ORP and DO levels in the soil, especially in the high-frequency Air-SAT experiments, where steady aerobic conditions were maintained during most of the flooding. Consequently, the mean DOC, total Kjeldahl N (TKN), and ibuprofen removal values in these experiments were up to 9 %, 40 %, and 65 % higher than those with FDO, respectively. However, high-frequency Air-SAT during continuous flooding also led to significant deterioration of the mean infiltration rate, probably due to enhanced biological clogging. Hence, it may be more feasible and beneficial to combine it with conventional FDO, allowing a steady infiltration rate and increased recharge volumes while sustaining high effluent quality. While these results still need to be verified at full scale, they highlight the possibility of using air injection to minimize the DP length and alleviate the pressure on existing SAT sites.
- Article
(3457 KB) - Full-text XML
-
Supplement
(1358 KB) - BibTeX
- EndNote


With the growing global population and an increased need for water, wastewater (WW) reuse has become essential worldwide, especially in arid and semiarid regions (Montwedi et al., 2021; Qureshi, 2020; Steduto et al., 2012). Soil aquifer treatment (SAT), a subfield of managed aquifer recharge (MAR), is a nature-based, robust, and cost-effective system for WW or stormwater treatment, storage, and reuse (Sharma and Kennedy, 2017). SAT systems usually involve a cluster of infiltration ponds surrounded by production and monitoring wells (Idelovitch and Michail, 1984; Sharma and Kennedy, 2017). The feed water is intermittently infiltrated through a deep vadose zone into the aquifer. During the infiltration, physical and biochemical processes (e.g., filtration of suspended solids, adsorption to the soil components, and biodegradation) occur, and water quality is greatly improved (Gharoon and Pagilla, 2021; Goren et al., 2014). The reclaimed effluent is stored in the aquifer and can be used for many applications. For example, using an SAT system, the Dan Region Project WW treatment plant (Shafdan) in Israel produces more than 160×106 m3 yr−1= of reclaimed effluent that is used for unrestricted crop irrigation (Aharoni et al., 2020).
SAT takes advantage of various microbe-mediated processes that take place during infiltration. Although physical and chemical mechanisms (e.g., adsorption) can, in principle, remove organic pollutants in SAT, the primary mechanism for removing dissolved organic matter (DOM) is biodegradation (Quanrud et al., 1996; Rauch and Drewes, 2005). This is because the organic load is too high for efficient removal by physical and chemical mechanisms alone. Therefore, increasing the SAT biodegradation efficiency is of the utmost importance (Brooks et al., 2020). DOM can be oxidized aerobically, using O2 as the terminal electron acceptor or by other terminal electron acceptors such as NO, i.e., denitrification (Goren et al., 2014). However, DOM removal in SAT is more efficient under aerobic conditions (Ben Moshe et al., 2021)
The effluent that enters an SAT system typically contains several forms of N, such as organic N, NH, NO, and NO (Icekson-Tal et al., 2003; Bouwer, 1991). Organic-N ammonification occurs under both aerobic and anaerobic conditions (Stefanakis et al., 2014), but its rate is higher under aerobic conditions, as populations of ammonifying bacteria thrive under high dissolved oxygen (DO) levels (Ruan et al., 2009). Aerobic conditions in SAT are also essential for nitrification – the oxidation of NH to NO and the subsequent oxidation of NO to NO (Mienis and Arye, 2018). N can be removed from the effluent via the filtration of suspended solids, along with the adsorption of N compounds to the soil minerals and organic matter (Van Raaphorst and Malschaert, 1996; Idelovitch et al., 2003). In addition, N can also be removed by biochemical processes: microorganisms in the soil assimilate NH and NO into their tissues, whereas denitrifying microbes can reduce NO, ultimately producing N2 gas (Jetten, 2008). In this work, we follow the definitions of Sohsalam and Sirianuntapiboon (2008), who used the ranges of above 300, 100–300 mV, and below 100 mV.
In conclusion, O2 is necessary for various biogeochemical processes that enhance the effluent quality in SAT. Therefore, in order to maintain an efficient process, SAT is generally operated in cycles of flooding and drying. The drying periods (DPs) were designated mainly to recover gaseous O2 and, thus, the DO levels in the soil profile by allowing air to enter the soil (Icekson-Tal et al., 2003). Ben Moshe et al. (2020) showed that longer DPs led to better aeration in the deeper parts of the soil profile and, consequently, to lower outflow concentrations of dissolved organic C (DOC), dissolved organic N (DON), and NH. Sallwey et al. (2020) found a similar trend: the removal of six examined contaminants of emerging concern (CECs) increased significantly when the DPs became longer. However, long DPs allow a shorter time for infiltration and smaller recharge volumes. As the population grows, the quantity of effluent directed to SAT sites increases while land resources become precious. Under such conditions, long DPs become less feasible.
This study explored the feasibility of actively injecting air into the subsurface to enhance DO availability in SAT (Air-SAT). This approach, which, to the best of our knowledge, has not been tested before in the context of SAT, may be an alternative to long-DP operation, allowing higher reclaimed effluent quantities without compromising water quality. We examined the effect of air injection on the infiltration volumes, soil biogeochemical state, and ultimate outflow quality at the laboratory scale. In addition to macro-pollutants (DOM and N species), we also explored the removal of three well-known CECs that are commonly detected in effluent: the antiinflammatory medication ibuprofen (IBP), the anticonvulsant medication carbamazepine (CBZ), and the corrosion inhibitor 1H-benzotriazole (BTR).
2.1 The experimental system
A 200 cm high polycarbonate column consisting of 20 modules was designed and constructed. Each module had dimensions of 20 cm × 10 cm × 10 cm. The top three modules were kept empty for flooding, and the lower module was used for drainage. The remaining 16 modules were packed with sandy soil from the upper meter of the Shafdan SAT site in Israel (Fig. 1a). The column was modular with a perfect seal between modules (both rubber ring, shape fit, and overall pressing of the column with external long screws from top to bottom). The soil texture (96.4 % sand, 2.1 % silt, and 1.5 % clay) was determined using the hydrometer method (Gee and Or, 2002), and the initial total organic C (TOC) content (0.87 %) was determined using the loss-on-ignition method (Dean, 1974).
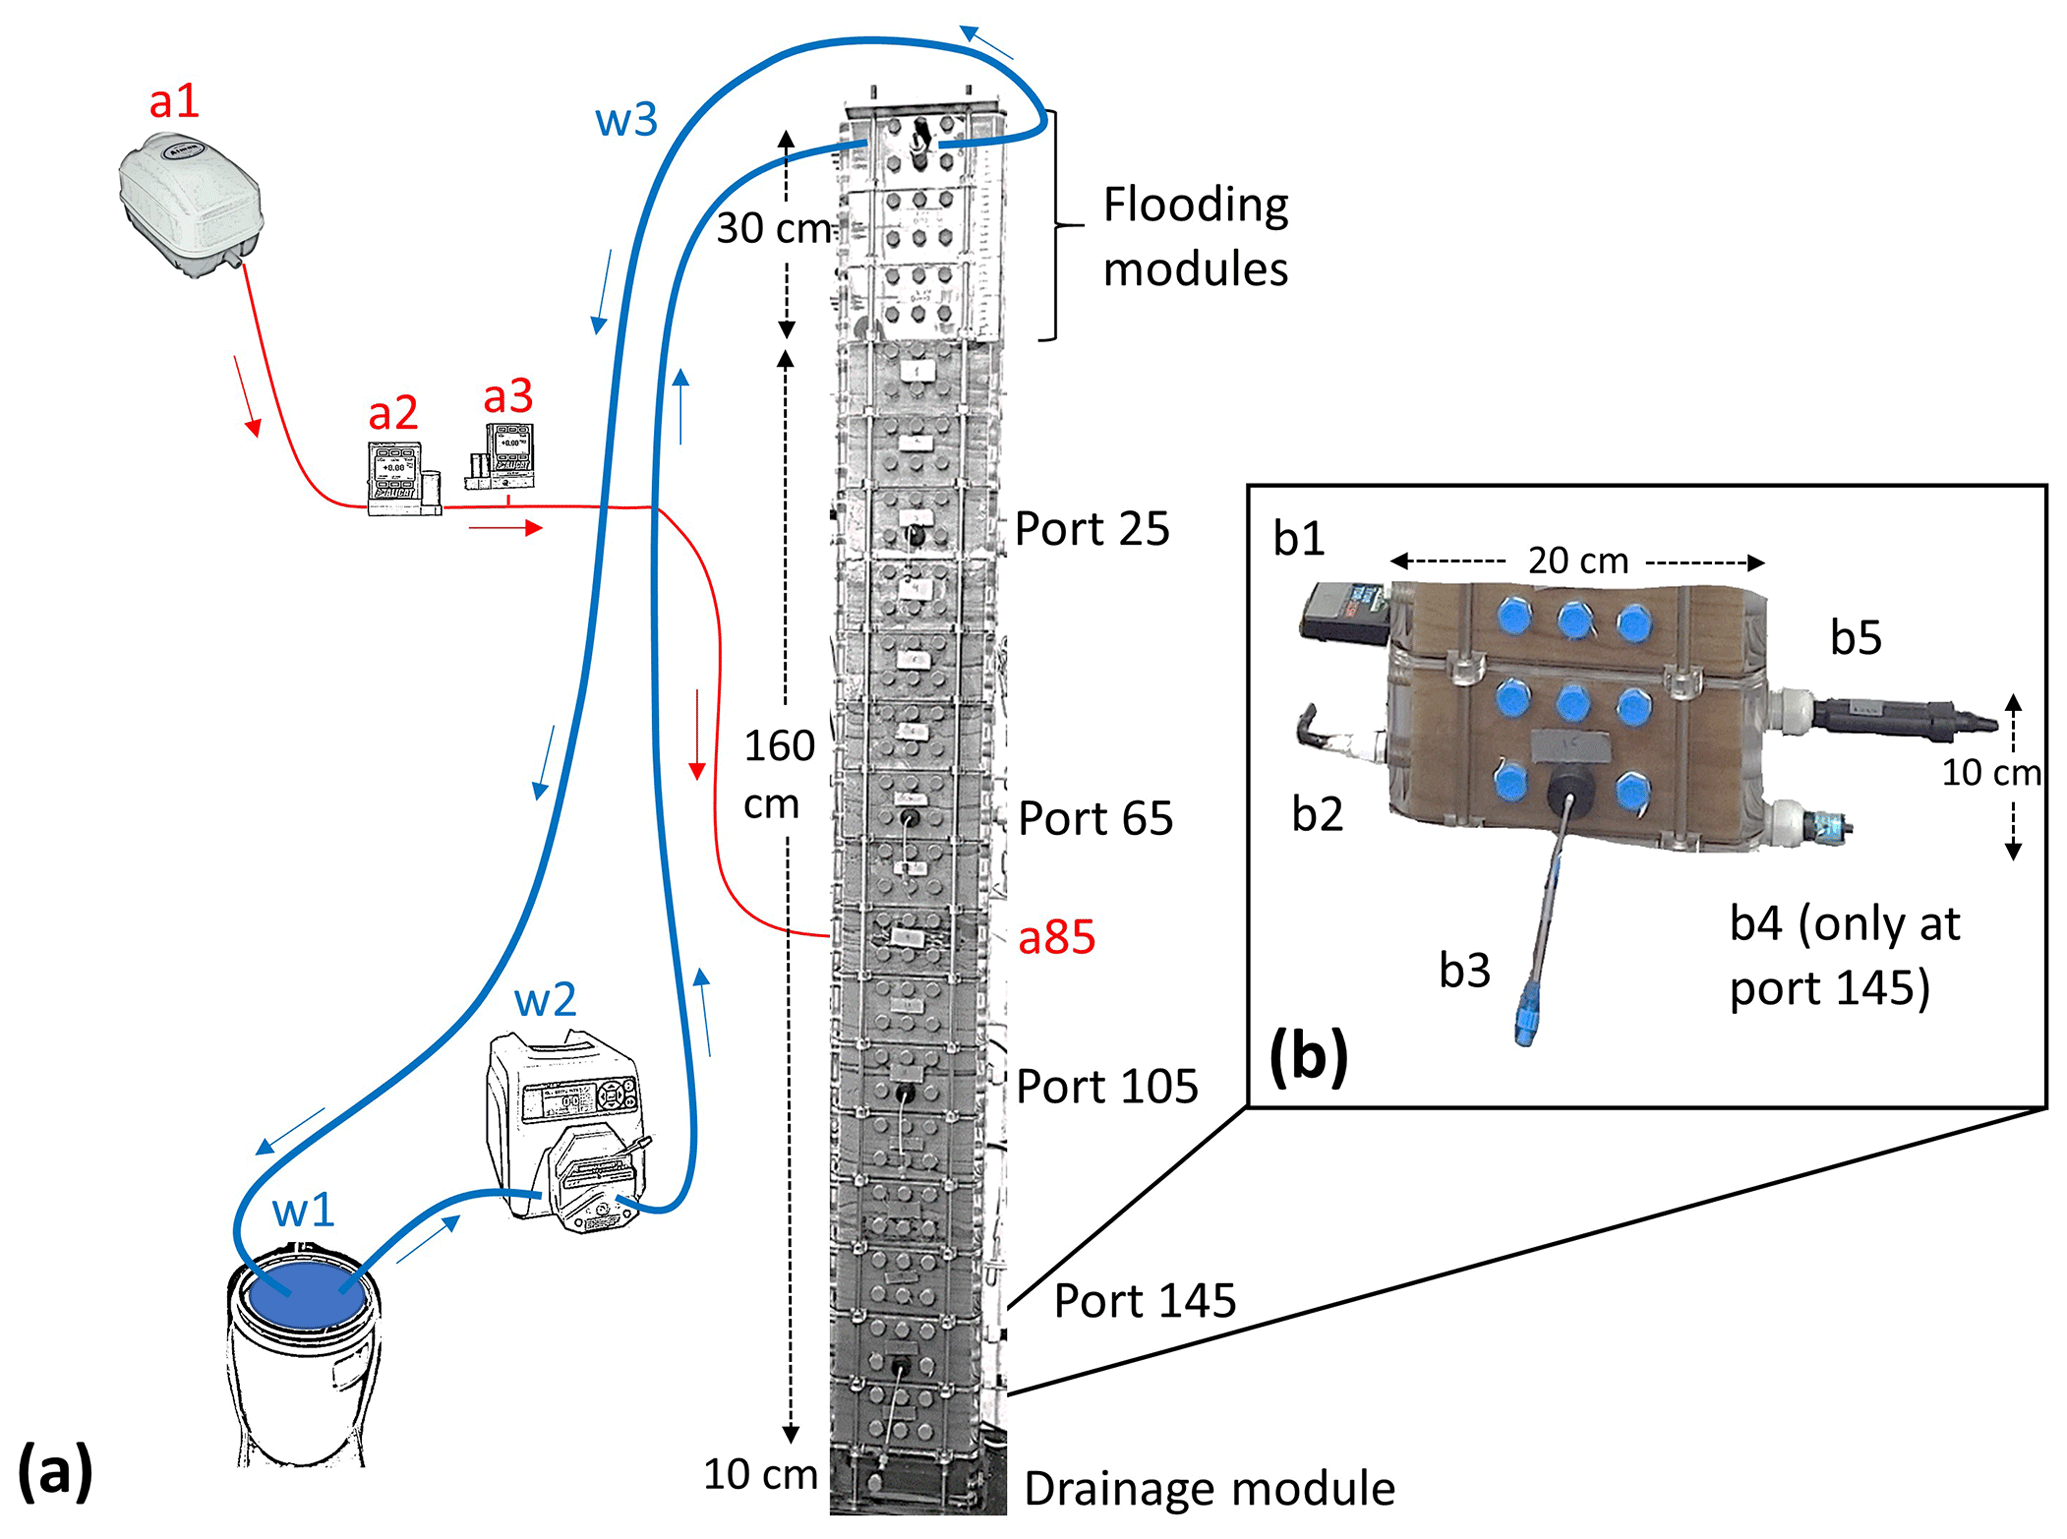
Figure 1Panel (a) presents the experimental system with the locations of the measuring ports and the air injection port. The ports are referenced in the text using their depth below ground level (cm). The effluent inflow system is highlighted in blue (thick lines): w1 – effluent container, w2 – peristaltic pump, and w3 – overflow hose. The air system is highlighted in red (thin lines): a1 – air pump, a2 – digital flow controller, a3 – digital pressure meter, and a85 – injection port. Panel (b) shows the installation of the devices at each measuring port: b1 - volumetric water content (VWC) sensor, b2 – oxidation–reduction potential (ORP) sensor, b3 – Rhizon, b4 –reference electrode, and b5 – luminescent dissolved oxygen (LDO) sensor.
Synthetic effluent was prepared and stored in a stirred plastic container with volume scale marks. It was introduced into the column using a peristaltic pump. The top of the column had an overflow outlet, which enabled a maximal head of ∼23 cm. Compressed air was supplied to the system by an air pump and injected at a depth of 85 cm (below the soil surface level) using a buried air stone. The volumetric airflow rate was controlled using a digital flow controller, which also measured the air temperature (MC-10SLPM, Alicat Scientific, Tucson, AZ, USA). The injection pressure was measured by a digital pressure controller (serving as a pressure meter), Alicat Scientific model PC-30PSIG (Fig. 1a). Air injection rate, temperature, and pressure were recorded at 0.5 min intervals. Using these data and assuming air to be an ideal gas, the standard volumetric flow rate (i.e., the volumetric flow rate at standard conditions of T=273.15 K and P=1 bar) was calculated (Eq. S1 in the Supplement).
Four measurement ports were located at depths of 25, 65, 105, and 145 cm below the soil surface (Fig. 1a). Each port was equipped with a volumetric water content (VWC) sensor (TDR-315H, Acclima, Meridian, ID, USA), an oxidation–reduction potential (ORP) sensor (art. no. 461, ecoTech, Bonn, Germany), a Rhizon for pore-water sampling (MOM 10 cm, Rhizosphere, Wageningen, Netherlands), and a luminescent dissolved oxygen (LDO) probe (LDO10101, Hach-Lange GmbH, Düsseldorf, Germany). An Ag / AgCl ORP reference electrode filled with 3 mol L−1 KCl electrolyte (ecoTech model 4622) was located only at the deepest port (Fig. 1b). In addition, a pre-calibrated pressure sensor (MPX2010DP, NXP Semiconductors, Eindhoven, Netherlands) was used to measure the surface pressure (hydrostatic) head. The sensors' data were collected every 1 min using a CR1000 data logger (Campbell Scientific, Logan, UT, USA), except for the oxygen data, which were recorded using two HQ40d meters (Hach-Lange GmbH).
2.2 Column experiments
Six 72 h column experiments were conducted. All experiments started with a dry system (i.e., after at least 9 d of drainage) and no ponding on top. The effluent was supplied at higher rate than the infiltration, and the surface head (SH) increased at the beginning of each flooding period (FP) for ∼1 h until it reached a maximal value of ∼23 cm and then remained constant for the rest of the FP.
Here, the six experiments are divided into three main experiments and three secondary experiments. The first main experiment included a 24 h FP, a 24 h DP, and another subsequent 24 h of flooding. It was operated without any active air injection (Table 1). The term FP refers to the duration of time during which effluent was pumped to the top of the column. The DP started when the pump was turned off and ended at the beginning of the second FP. This experiment, which was conducted twice, is referred to here as FDO (flooding–drying operation), and it represents the conventional intermittent operation used at SAT sites.
Table 1The operational parameters of the three main and three secondary experiments.
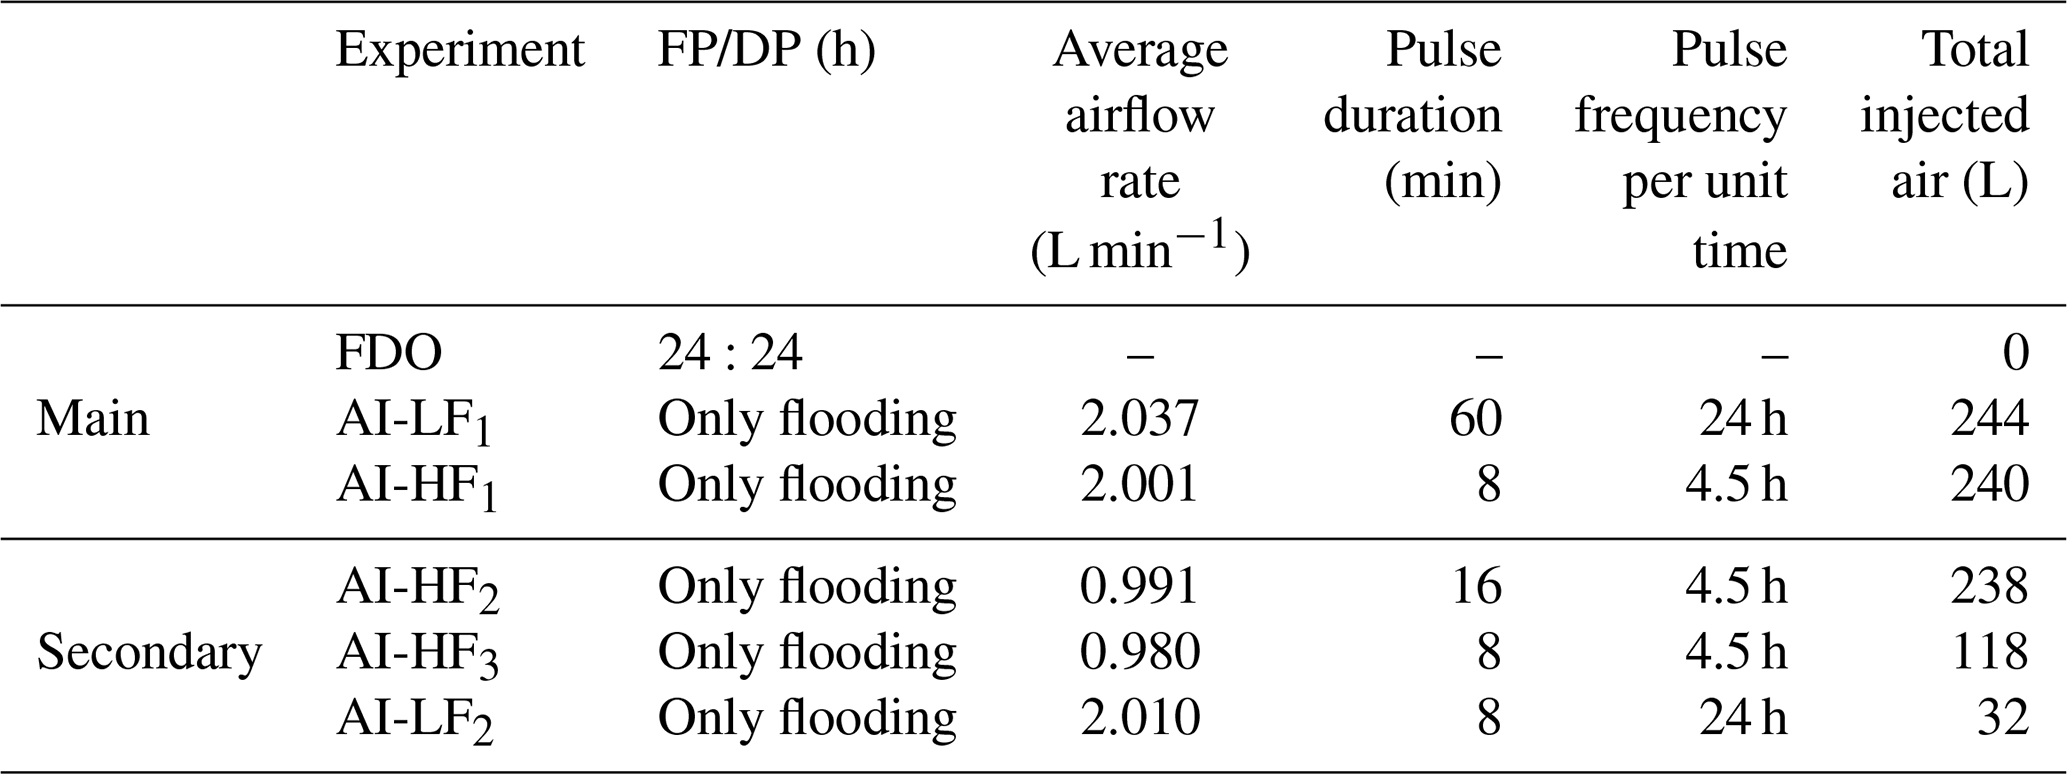
The two other main experiments were designed to examine the effect of air injection, at different operation modes (i.e., pulse durations and frequencies), on the biogeochemical efficiency of the SAT system. Both included one continuous 72 h FP during which compressed air was injected at an 85 cm depth in pulses at a rate of ∼2 L min−1. They are noted here as AI-LF1 and AI-HF1; the abbreviation AI stands for air injection (Table 1), and LF and HF denote the pulse frequency (low and high, respectively). During AI-LF1, air was injected into the subsurface for 60 min every 24 h of flooding. In contrast, during AI-HF1, air was injected for only 8 min, but the pulse frequency was significantly higher: one pulse every 4.5 h of flooding. These specific pulse durations and frequencies were designed to achieve equal volumes of injected air in each of the two experiments (Table 1).
The secondary experiments AI-HF2 and AI-HF3 aimed to examine the impact of the airflow rate. The airflow rates in both experiments were approximately half (∼1 L min−1) that used in the main experiment AI-HF1 (∼2 L min−1), whereas the pulse frequency was similar (4.5 h−1). In AI-HF3, the pulse duration was identical to AI-HF1 (8 min), which effectively meant that approximately half the air volume was injected. In AI-HF2, the duration was doubled (16 min) in order to ensure a similar overall volume of injected air (Table 1).
The secondary experiment AI-LF2 was designed to connect the main experiments AI-LF1 and AI-HF1. This experiment included short 8 min pulses (similarly to AI-HF1) injected at low frequency (every 24 h, as in AI-LF1) and an airflow rate of ∼2 L min−1. Note that, in comparison to the three other air-injection experiments, the volumes of air injected in AI-HF3 and AI-LF2 were smaller (118 L and 32 L, respectively; Table 1).
Effluent samples along the profile were collected twice a day at approximately identical times for each experiment (t∼4.3, 23.7, 28.4, 47.7, 52.4, and 71.6 h, where t=0 is the beginning of each experiment). In the FDO experiment, samples were not taken at t∼28.4 and 47.7 h, as the soil was too dry. At the same times, the inflow effluent was also sampled to confirm that no significant changes in its composition occurred during the experiments. The infiltration volumes were measured manually by reading the container's scale marks, and the mean infiltration flux (cm h−1) was calculated as the infiltration volume over a given time interval (cm3 h−1) divided by the cross-sectional area of the chamber (A=195.03 cm2). As a pressure transducer was not functioning for some of the experiments, the fluxes are averaged over time, as presented in Fig. 2. After each experiment, the column was flushed with tap water for 12 h to restrict clogging and was left to dry for several days until mean ORP levels recovered above 185 mV (i.e., aerobic conditions prevailed along the column). The mean ORP was calculated as the arithmetic mean of the ORP measured at the four ports along the column. To clarify, mean ORP is calculated only for the purpose of discussion of overall system functionality.
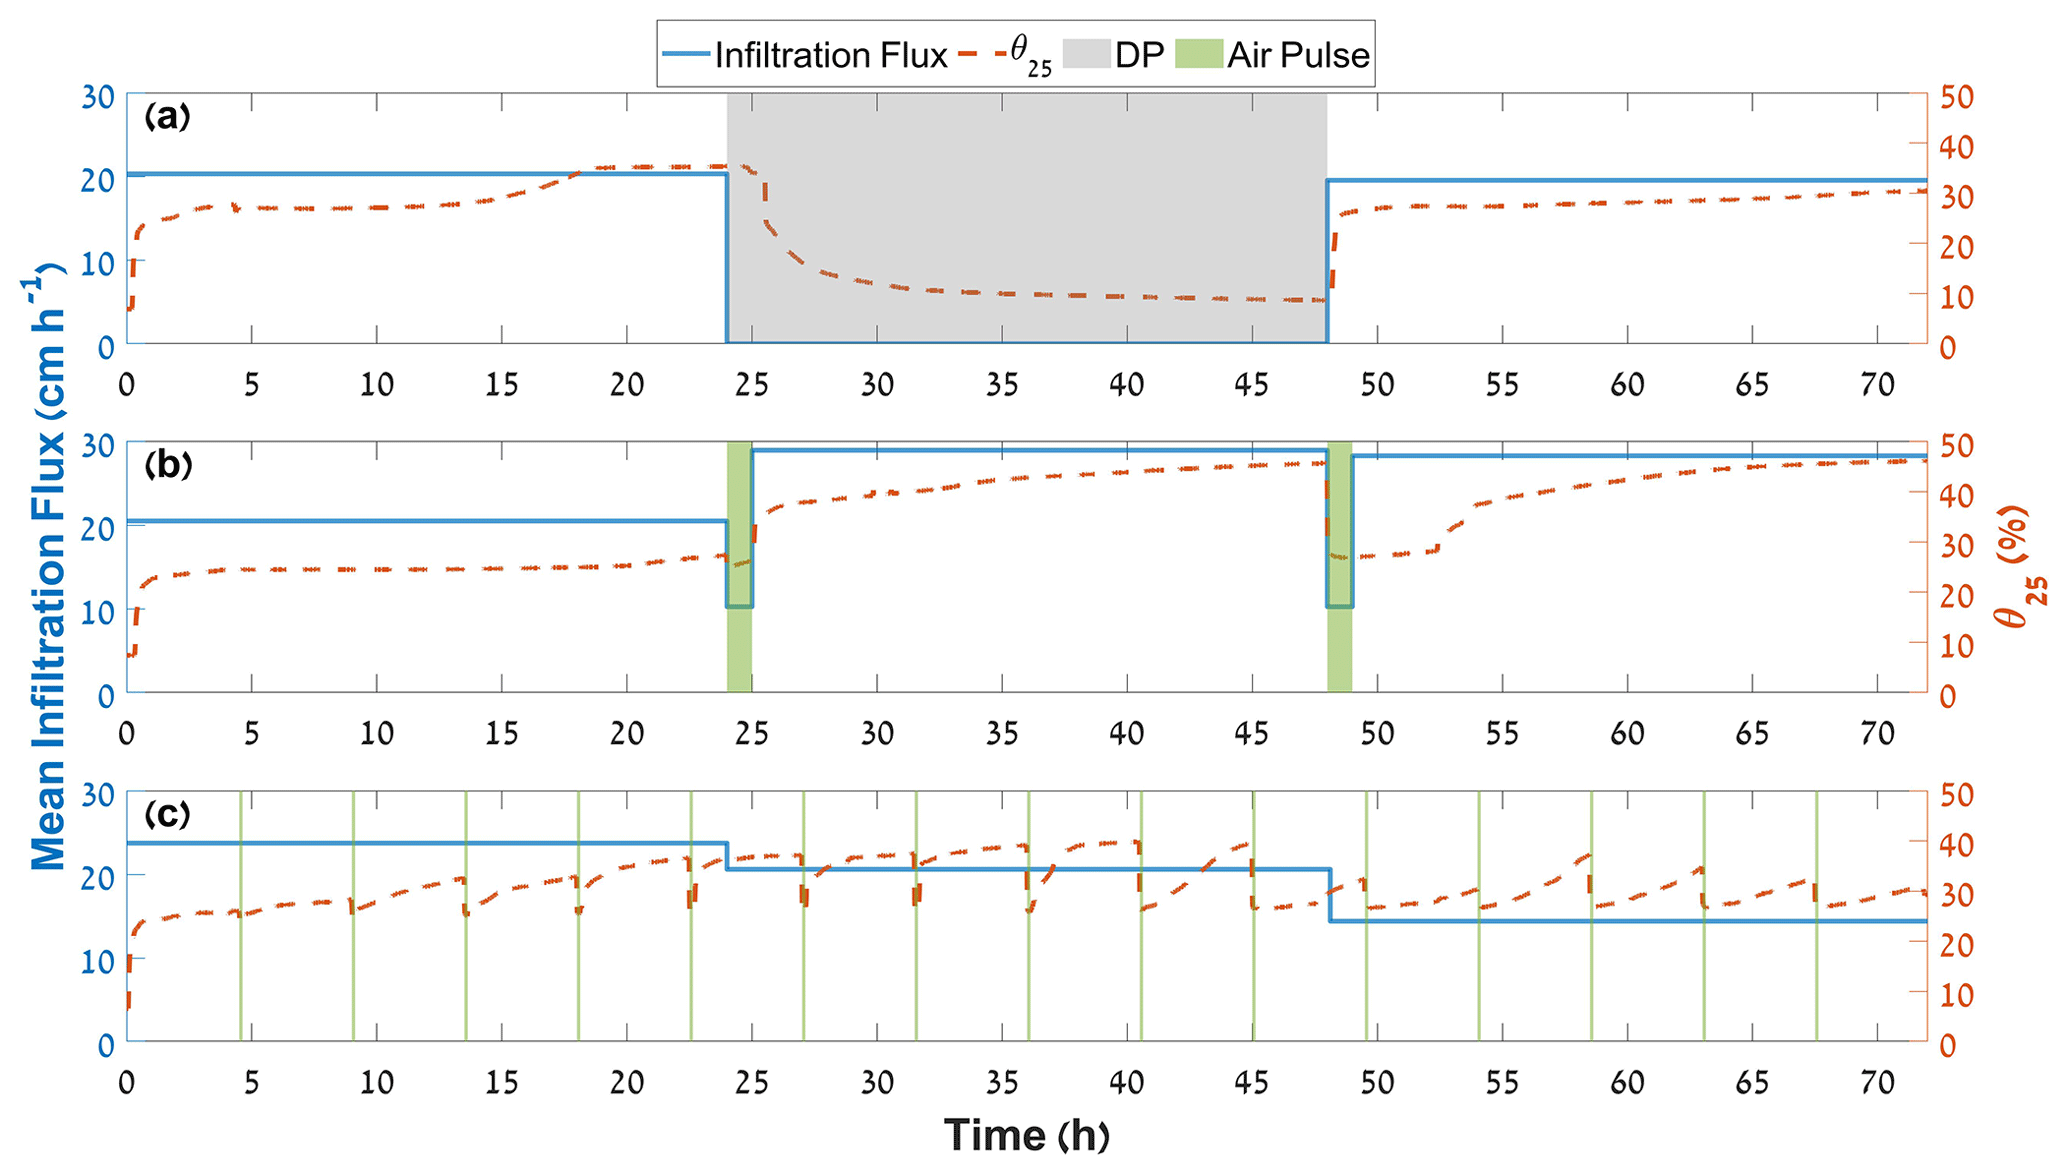
Figure 2The volumetric water content (VWC) at a depth of 25 cm below the soil surface (θ25) and the mean infiltration flux during FDO, AI-LF1, and AI-HF1 (panels a–c, respectively). Gray areas symbolize DP, whereas green areas symbolize the air pulses.
2.3 Synthetic effluent composition and preparation
The synthetic effluent included mainly NH, glucose, and urea dissolved in tap water. Its composition was designed to include a moderate load of DOC as well as organic and inorganic N species around the concentrations found at the Shafdan SAT sites (Aharoni et al., 2020). Glucose was the primary C source (accounted for ∼99 % of the DOC). Although not ideal, the use of glucose is common in WW degradation studies (e.g., Liu and Logan, 2004; Liao et al., 2001). NH, total Kjeldahl N (TKN), NO, total N (TN), and DOC concentrations for the synthetic effluent, analyzed throughout the main experiments, are presented in Table 2. In addition, the synthetic effluent also included the emerging contaminants IBP, CBZ, and BTR at low levels, around the concentrations found in effluent collected from a municipal WW treatment plant in Germany (Table 2; Sallwey et al., 2020). Characterization of the synthetic effluent for each respective experiment (including the secondary experiments) is available in the Supplement (Tables S3, S4). To prepare the effluent, the following chemicals were used: ammonium chloride (NH4Cl, >99.5 %, spectrum), D-(+)-glucose monohydrate (C6H12O6 ⋅ H2O, >97.5 %, Sigma-Aldrich), urea (CH4N2O, >99 %, Sigma-Aldrich), ibuprofen (C13H18O2, >98 %, Sigma-Aldrich), carbamazepine (C15H12N2O, >98 %, Sigma-Aldrich), and 1H-benzotriazole (C6H5N3, >99 %, Acros Organics).
Table 2Inflow composition of the synthetic effluent in the three main experiments, presented as the mean ± SD.

2.4 Chemical analysis
Prior to the chemical analysis, all effluent samples were passed through a 0.22 µm filter. NH was measured using a colorimetric method (Willis et al., 1996) with a GENESYS 150 spectrophotometer (Thermo Scientific, Waltham, MA, USA). NO and NO were measured using an ion chromatograph (881 Compact IC pro, Metrohm AG, Herisau, Switzerland). DOC and TN were determined using a total organic C analyzer (TOC-VCPH) equipped with a TN module unit (TNM-1) (Shimadzu, Kyoto, Japan) after the samples were acidified with HCl to achieve a pH value of 2–3. TKN concentrations were calculated as the difference between the concentrations of TN and the oxidized N (NO and NO) as follows:
where [TKN], [TN], [NO], and [NO] are all in milligrams of nitrogen per liter.
IBP, CBZ, and BTR were analyzed using a liquid chromatograph (Agilent 1110, Agilent Technologies, Santa Clara, CA, USA) coupled to a triple-quadrupole mass spectrometer (API 3200, Applied Biosystems/SCIEX Instruments, Waltham, MA, USA) equipped with electrospray ionization (ESI). An RP-18 end-capped column with a 5 µm particle size (Purospher® STAR, Merck, Darmstadt, Germany) was used at 30 ∘C for separation. The eluent flow rate was 0.4 mL min−1, and the injection volumes were 20 µL. A detailed description of the liquid chromatography tandem mass spectrometry (LC-MS/MS) analytical procedures appears in the Supplement.
3.1 Effluent infiltration
Figure 2 compares the VWC at a depth of 25 cm below the soil surface (θ25) and the mean infiltration flux between the FDO (intermittent flooding–drying operation), AI-LF1 (60 min long, ∼2 L min−1 air pulse every 24 h of continuous effluent infiltration), and AI-HF1 (8 min long, ∼2 L min−1 pulse every 4.5 h of continuous infiltration) experiments. During the first 24 h of FDO and AI-LF1, when there was no active air injection into the subsurface, the mean infiltration flux was similar between these two experiments. In FDO and AI-LF1, the first VWC increase (i.e., the arrival of the wetting front) was observed after 12 and 18 min, respectively, and another increase can be noticed after 14 and 20 h (less pronounced), respectively. At the end of the first 24 h, θ25 reached apparent steady-state conditions, with a water content of 35.4 % in FDO and 27.5 % in AI-LF1 (Fig. 2a, b). The difference between the two treatments is possibly due to a more significant air entrapment during AI-LF1. The impact of air entrapment on the soil's water content during water infiltration was demonstrated by Mizrahi et al. (2016).
After 24 h of flooding, air was injected for 60 min in AI-LF1, and θ25 slightly decreased (Fig. 2b), while a more significant reduction in the VWC was observed at depths of 65, 105, and 145 cm (Figs. S1b, S2b, and S3b in the Supplement, respectively). An immediate reduction in the VWC along the profile was also detected during the second pulse (48 h; Figs. 2b, S1b, S2b, S3b). This phenomenon (i.e., a reduction in the VWC as a result of the injection of pressurized air into sandy soil) has been demonstrated in numerous studies (e.g., Dror et al., 2004; Ben-Noah et al., 2021; Zang and Li, 2021) and can be explained by the fact that the air pushed the effluent away from its flow pathways. As the unsaturated hydraulic conductivity is an increasing function of the VWC (van Genuchten, 1980), a reduction in the mean infiltration flux during the air pulses, as a result of the creation of low-conductivity zones, could be expected. Indeed, during the first pulse, the mean infiltration flux was decreased by half – from a mean value of 20.51 cm h−1 in the first 24 h to 10.25 cm h−1 during the pulse. During the second pulse (48 h), this reduction was even more drastic (−65 %; Fig. 2b).
Between the two air pulses in AI-LF1, θ25 increased from 26.3 % to 45.8 %. This value (i.e., θ25=45.8 %) is 18.3 % higher than the steady-state VWC reached at this depth before the first pulse (θ25=27.5 %). A similar phenomenon – a sharp increase in water content – was observed following the second pulse (Fig. 2b). We suggest that the air injection formed new preferential pathways (PFPs) for both effluent and air, allowing the release of entrapped air and also creating wider pores. It is not certain that crusts were formed in this controlled experiment, but they do exist in SAT systems. The air pulses possibly helped break surface and subsurface crusts that are often formed and cause clogging during the operation of SAT systems. Such crusts can be formed by chemical, physical, or biological factors, such as the chemical precipitation of compounds found in the effluent, accumulation of suspended solids, and growth of biofilm (Barry et al., 2017; Pavelic et al., 2011; Thuy et al., 2022).
This evidence (i.e., increased VWC following the air pulse) was observed at 60 (θ25; Fig. 2b) and 20 cm (θ65; Fig. S1b) above the air source but was not observed at 20 (θ105; Fig. S2b) and 60 cm (θ145; Fig. S3b) below it, probably because the airflow pattern was mostly upward due to the buoyancy force. The decrease in θ105 and θ145 during the air injection (Figs. S2b and S3b, respectively) is likely due to the reduced flux above, but its timing also indicates direct air movement downwards.
As expected, in AI-LF1, the increased VWC following the air injection allowed an increased mean infiltration rate: the flux after the first and second pulse (28.98 and 28.31 cm h−1, respectively) was 38 %–41 % higher than before the first pulse (20.51 cm h−1; Fig. 2b). Meanwhile, in FDO, the mean infiltration flux in the second FP (19.44 cm h−1; Fig. 2a) was 4 % lower compared with the first FP (20.30 cm h−1) and 31 % lower compared with the last 23 h of AI-LF1 (Fig. 2b).
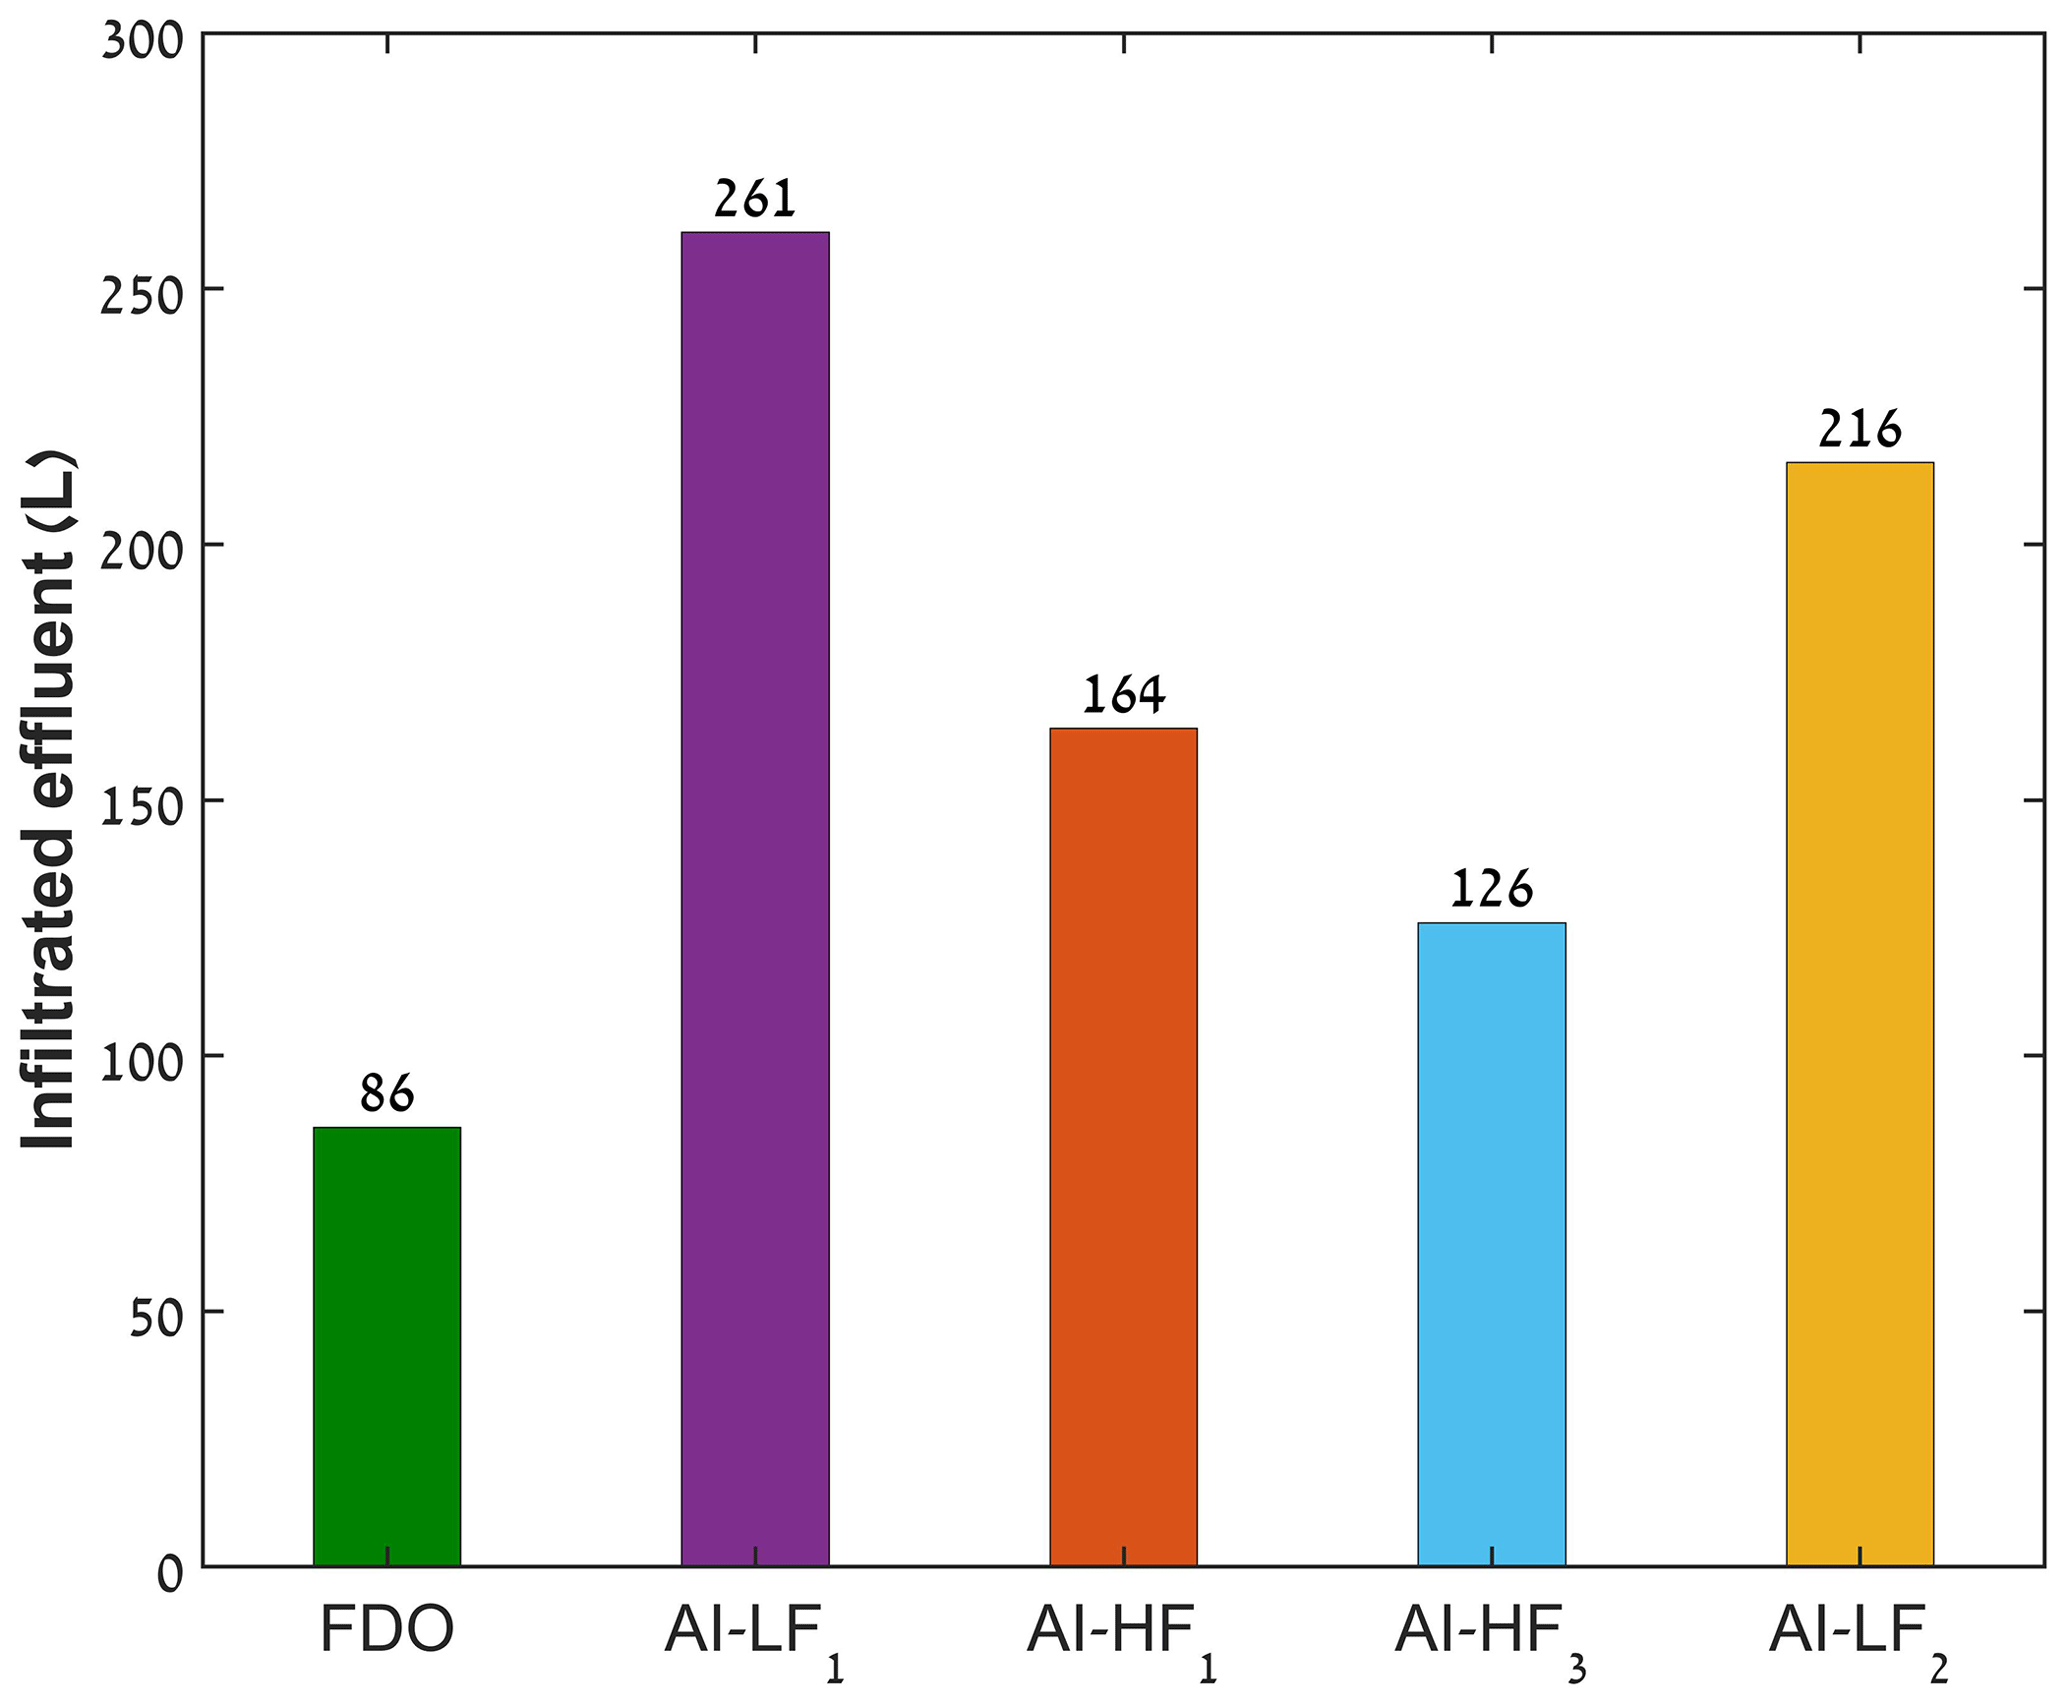
Figure 3Infiltration volumes during the last 48 h of FDO (average of the two replicates), AI-LF1, AI-HF1, AI-HF3, and AI-LF2. The volumes infiltrated in the first 24 h are excluded here in order to minimize the impact of the starting conditions.
In AI-HF1, as in AI-LF1, each air pulse led to an immediate but temporary decrease in the VWC along the profile (Figs. 2c, S1c, S2c, S3c). This drop in the water content is due to air impeding infiltration while gravitational drainage continues (drainage measurements were not conducted at a high enough resolution to confirm enhanced drainage due to air pressure). The mean infiltration flux, which was higher than the flux in AI-LF1 and FDO during the first 24 h (23.71 cm h−1), decreased over time. In the last 24 h, it reached a minimum value of 14.31 cm h−1 – 26 % lower compared with the last 24 h of FDO and 49 % lower compared with the last 23 h of AI-LF1 (Fig. 2c). This deterioration can be explained by the gradual formation of low-conductivity clogging layers. The overall trend of a decline in the maximal values of θ25 during the last 24 h of AI-HF1 (Fig. 2c) supports this hypothesis. This trend was not observed during the first 48 h, although there was a decline in the mean infiltration flux (Fig. 2c), suggesting that the clogging processes mainly occurred at shallower depths at the beginning of AI-HF1. Apparently, the short pulses were less efficient with respect to improving entrapped air release and recharge than the longer ones, as the water content reached values of around 40 % in this case, compared with values of around 45 % in AI-LF1.
Air-SAT operation allowed much higher recharge volumes compared with traditional FDO. For fairness of comparison (i.e., not including the early stages that are more affected by the initial conditions), we use only the last 48 h for comparison between treatments. While only 86 L infiltrated in FDO, the infiltration amounts were significantly higher in AI-LF1 and AI-HF1 (261 and 164 L, respectively; Fig. 3). The main reason for this gap is the flooding time: while infiltration could be continuous in AI-HF1 and AI-LF1 due to air injection, a 24 h period was hydraulically wasted on drying in FDO. Isolating only FDO and AI-HF1, the larger amount of time dedicated to flooding is actually the only reason for the aforementioned gap, as the mean infiltration flux during the last 48 h of AI-HF1 (17.52 cm h−1) was lower than the flux during the second FP of FDO (19.44 cm h−1; Fig. 2a). In AI-LF1, in addition to the doubled flooding time, the significantly higher infiltration rate compared with FDO (Fig. 2) is another reason for the 3 times higher infiltration volume (Fig. 3).
In fact, due to the high infiltration rate observed in AI-LF1, the infiltration volume in this experiment was 59 % higher than in AI-HF1 (Fig. 3), although the experiments' flooding and aeration times were identical. This leads us to the conclusion that the difference in the mean infiltration rate is related to the pulse frequency and duration. The high-frequency operation mode (AI-HF1) induced steadier aerobic conditions (Fig. 4), which are more suitable for fast biofilm growth (Lappin-Scott and Bass, 2001; Naz et al., 2013). As a result, biological clogging might be more significant in this experiment, causing infiltration rate deterioration. Note that this deterioration, apparently caused by clogging, also occurred in the less-oxidizing experiments (FDO and AI-LF1), although less significantly (Fig. 2). In addition to the increased clogging effect, high-frequency injection also seemed to physically hinder the soil from reaching water-saturated conditions (Fig. 2c), resulting in a reduced infiltration flux.
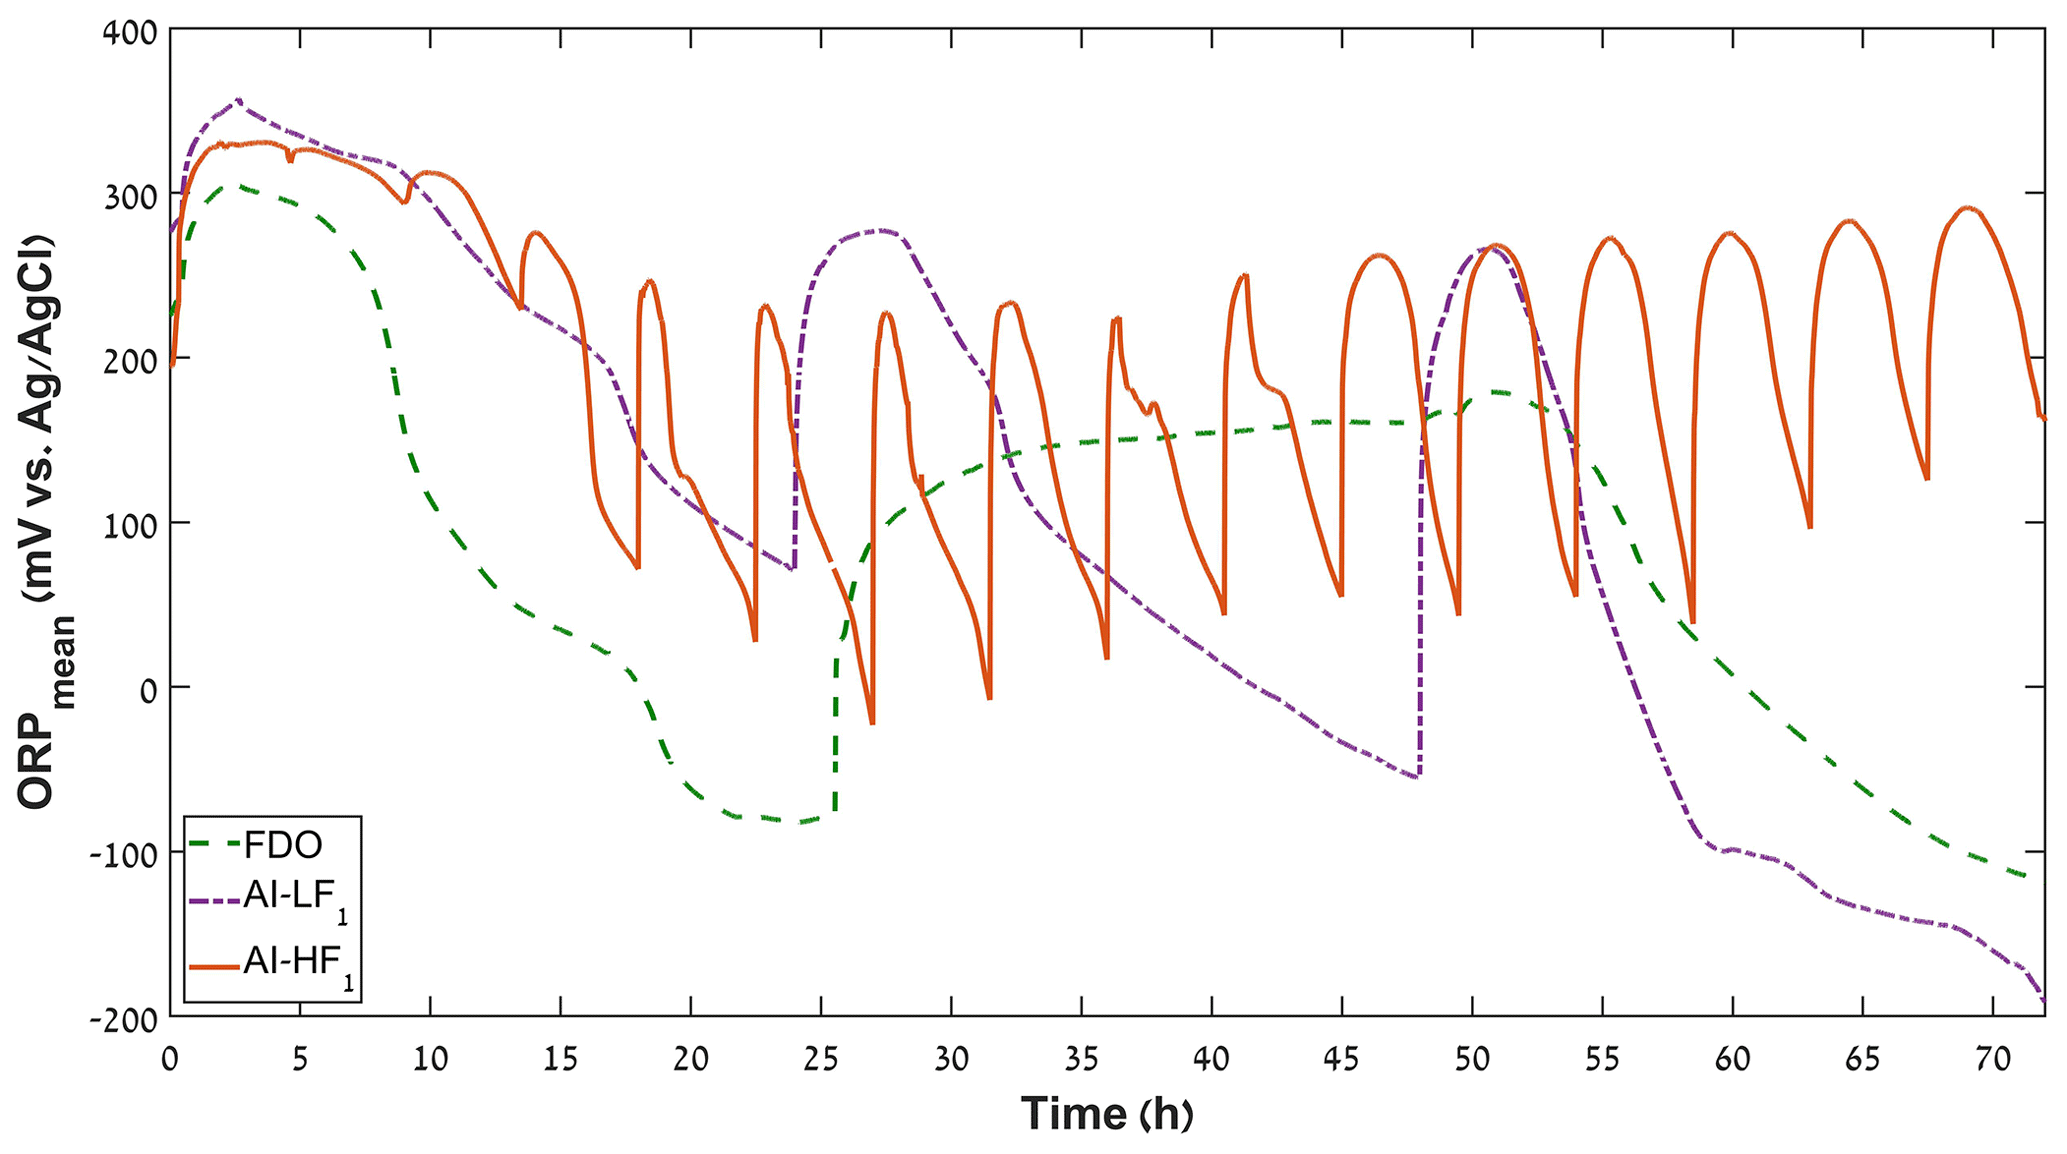
Figure 4The ORPmean (arithmetic mean of the ORP measured at depths of 25, 65, 105, and 145 cm below the soil surface) during FDO, AI-LF1, and AI-HF1.
An additional possible explanation for the higher infiltration rate in AI-LF1 is the difference in the pulse duration. We hypothesize that the 60 min of active air injection in AI-LF1 might have been more efficient with respect to forming new PFPs and improving entrapped air release and recharge compared with the short 8 min pulse performed in AI-HF1. We did not investigate mechanical changes in the soil structure caused by the injected air, but this is a possible mechanism (see Mizrahi et al., 2016). The secondary experiment AI-LF2, which shared a pulse frequency with AI-LF1 (24 h−1) and a duration with AI-HF1 (8 min; Table 1), can help distinguish between these two mechanisms explaining the higher mean infiltration rate in AI-LF1 (i.e., reduced clogging and enhanced creation of PFPs). The infiltration volume in this experiment was 216–45 L lower than in AI-LF1 but 52 L higher than in AI-HF1 (Fig. 3). Hence, we conclude that both mechanisms occurred simultaneously, and long pulses (60 min) lead to a higher mean infiltration rate than short pulses (8 min) in our system, whereas injecting air at a high frequency (4.5 h−1) leads to a lower rate than low-frequency (24 h−1) injection.
In addition to the pulse duration and frequency, the airflow rate also influenced the recharge volume. In AI-HF1, the infiltration volume was 30 % higher (Fig. 3) than in AI-HF3, which was characterized by the same pulse duration (8 min) and frequency (4.5 h−1) but approximately half the airflow rate (0.980 L min−1) (Table 1). These results suggest that, like a longer pulse duration, a higher airflow rate is more efficient with respect to forming PFPs and opening local clogging, which causes an increased infiltration rate. PFP formation, however, may result in a lower effluent quality due to a shorter detention time and less interaction with the degrading microorganisms. Our results hint that this undesired phenomenon truly occurred during AI-LF1 (Figs. 5, 6).
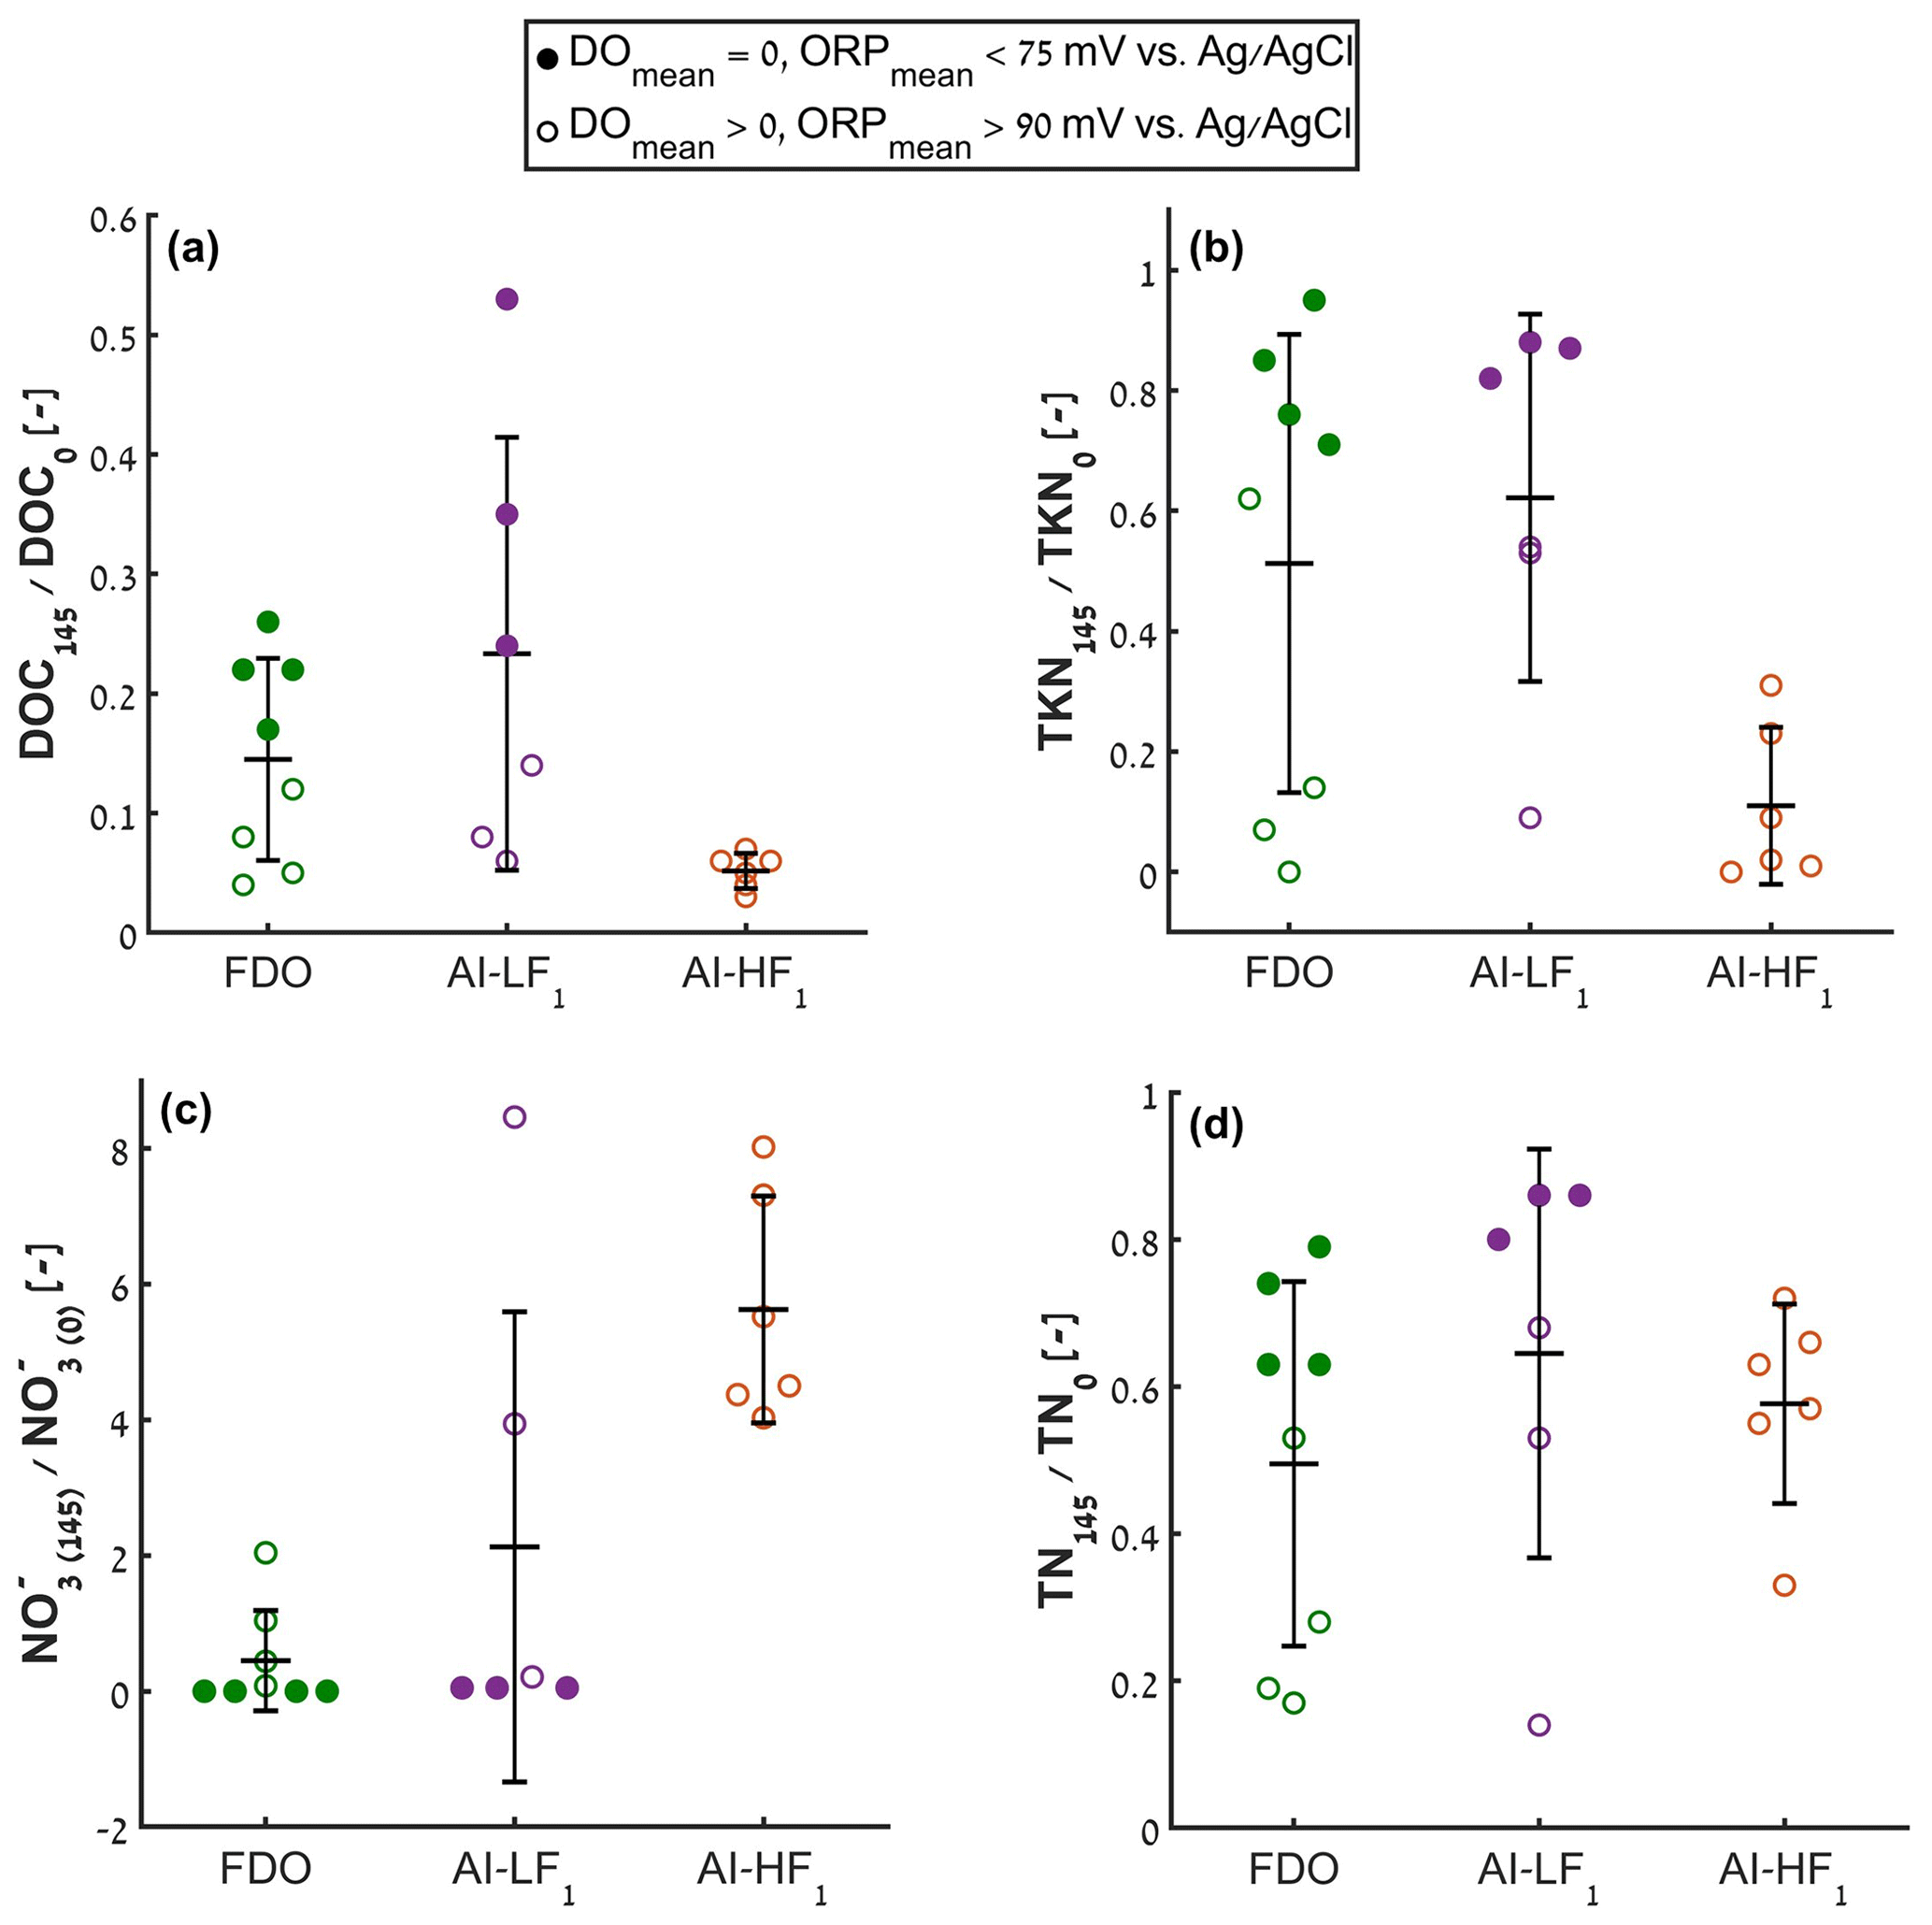
Figure 5Concentrations of DOC (a), TKN (b), NO (c), and TN (d) at a depth of 145 cm during FDO, AI-LF1, and AI-HF1. All concentrations are normalized to the inlet concentration of the same species. The horizontal line represents the arithmetic mean and the error bars show ±1 SD. Values below the quantitation limit (QL) were regarded as QL. The QLs of the relevant species are available in the Supplement (Table S7). Filled dots indicate samples taken when the mean DO throughout the column was 0 and the mean ORP was lower than 75 mV, whereas unfilled dots indicate samples taken when the mean DO was higher than 0 and the mean ORP was higher than 90 mV.
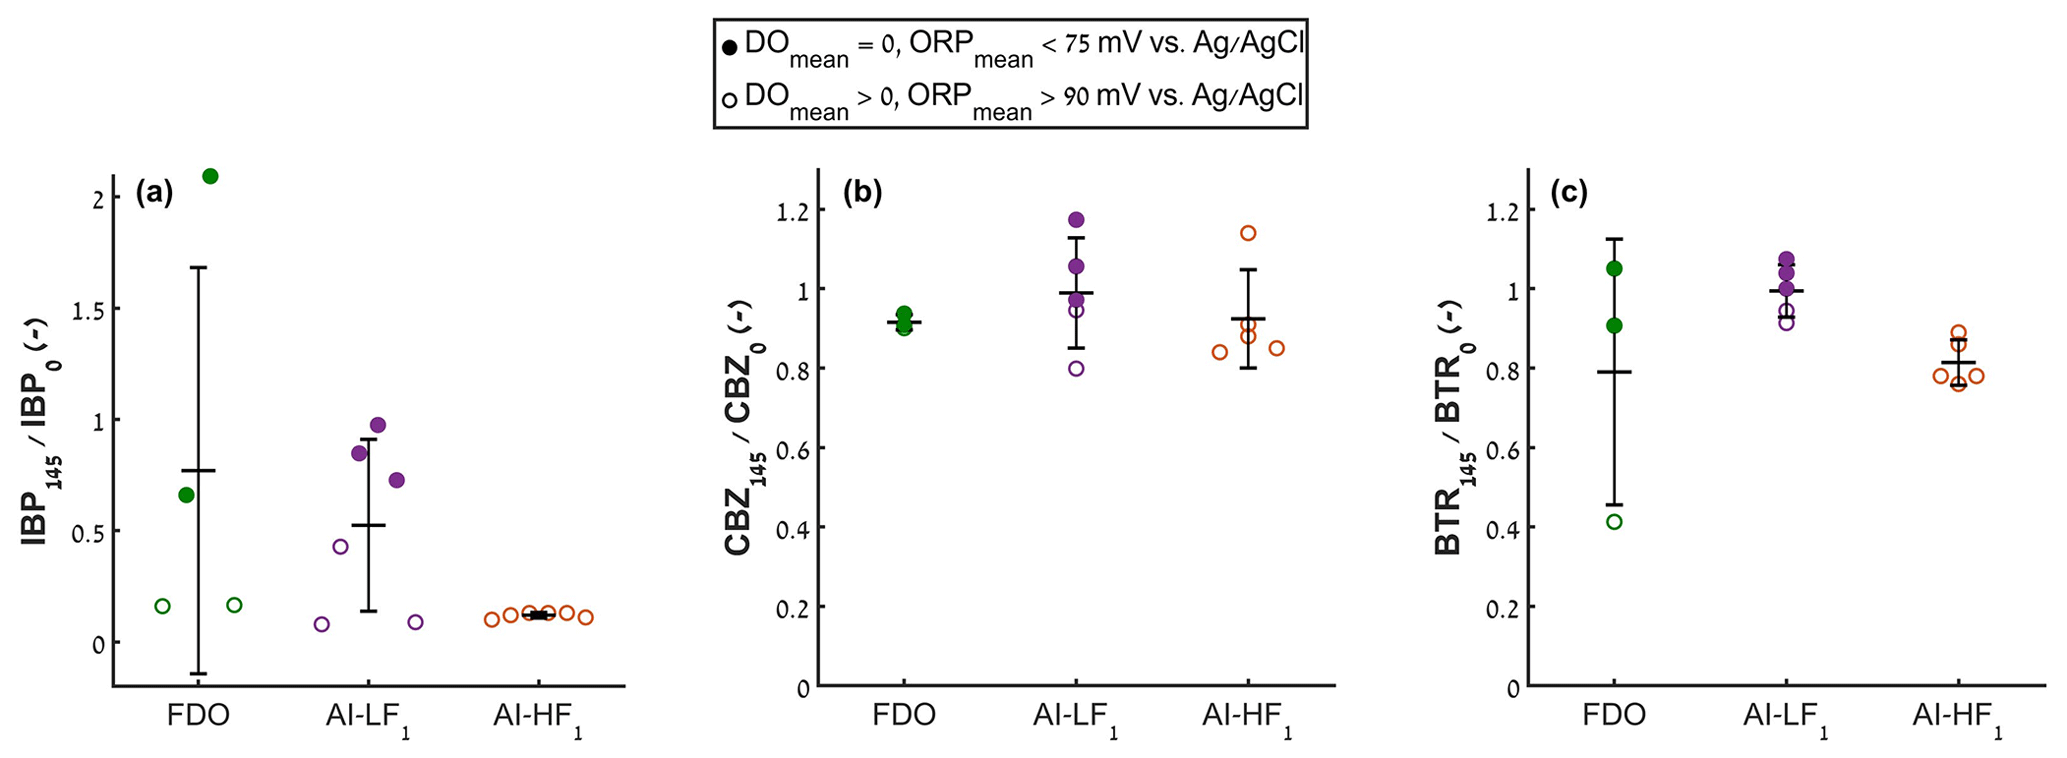
Figure 6Concentrations of IBP (a), CBZ (b), and BTR (c) at a depth of 145 cm during FDO, AI-LF1, and AI-HF1. The concentrations are normalized to the inlet concentration of the same species. The horizontal line represents the arithmetic mean, and the error bars show ±1 SD. Values below the detection limit (DL) were regarded as DL. The DLs of the relevant species are available in the Supplement (Table S7). Filled dots indicate samples taken when the mean DO throughout the column was 0 and the mean ORP was lower than 75 mV, whereas unfilled dots indicate samples taken when the mean DO was higher than 0 and the mean ORP was higher than 90 mV. In FDO, samples were taken and analyzed for only one replicate. In addition, for CBZ and BTR, the first sample from each experiment (taken at t∼4.3 h) was excluded as an outlier because it showed much lower concentrations than the others, apparently due to temporary retardation of the compound as a result of its interactions with soil components.
The relatively small infiltration volume observed in AI-HF3 is mainly due to a gradual decrease in the mean infiltration rate – from 22.01 cm h−1 during the first 24 h to 15.38 cm h−1 during the second and 11.54 cm h−1 in the last 24 h (Table S5). In fact, our results show that high-frequency Air-SAT (represented here by AI-HF1 and AI-HF3) leads to a significant deterioration in the infiltration rate.
3.2 Effluent quality
Figure 4 compares the mean ORP throughout the column (arithmetic mean of the ORP measured at depths of 25, 65, 105, and 145 cm below the soil surface; ORPmean) between the FDO, AI-LF1, and AI-HF1 experiments. Although mean values miss the spatial variation, we present them here for the sake of conciseness and provide the full ORP trends in the Supplement (Fig. S4).
At the beginning of each of the three experiments, ORPmean sharply increased (Fig. 4) due to the drainage of residual water at 145 cm depth (Fig. S3), followed by air penetration and ORP rise at this depth (Fig. S4d). Afterward, ORPmean generally declined with time (Fig. 4) owing to limited aeration of the column, while O2 and other electron acceptors were consumed by the soil system's microbial community. This expected decline proceeded in AI-LF1 until the beginning of the first air pulse (t=24 h; Fig. 4). Meanwhile, in FDO, ORPmean began to increase significantly 1.5 h after the DP had started (t=25.5 h; Fig. 4), following the decrease in the VWC along the column (Figs. 2a, S1a, S2a) and atmospheric air penetration. It is important to note that the soil was still covered with effluent for roughly 1.33 h after the pump was turned off, which did not allow for significant air penetration (Fig. S5).
Both the air pulses in AI-LF1 and the DP in FDO led to a recovery of the ORP levels in the soil. However, this recovery was only partial. In FDO, the maximal ORPmean during the first FP was 306 mV, whereas this value deteriorated to 179 mV during the second FP. While the passive aeration in this experiment successfully recovered the ORP near the surface (depths of 25 and 65 cm below the soil surface; Fig. S4a, b), the ORP remained low at the deepest measured depth (145 cm below the soil surface) during the DP (Fig. S4d). Turkeltaub et al. (2022) found a similar trend at the Shafdan SAT site in Israel, where, at one of the measurement stations, neither short nor longer DPs (∼2, ∼3 d, respectively) managed to recover the ORP at 100 cm depth.
In contrast, active aeration in AI-LF1 succeeded where the passive aeration failed: the ORP at 145 cm depth increased immediately in response to the air pulses (Fig. S4d), even though the injection was performed 60 cm above (Fig. 1). This observation supports our aforementioned hypothesis that direct air movement downwards occurred simultaneously to the major air movement upwards. However, in AI-LF1, ORPmean generally declined with time. The maximal ORPmean during the first 24 h was 357 mV; following the first and the second pulse, the maximal ORPmean was 277 and 266 mV, respectively (Fig. 4). This overall deterioration indicates that this operation mode is unsatisfactory for the reliable maintenance of aerobic WW treatment. Extending the pulse duration may lead to better recovery, but the trade-off is lower infiltration volumes (as there is a longer period characterized by diminished infiltration flux) and higher energy costs.
AI-HF1 included much shorter pulses (8 min) than AI-LF1 (60 min) (Table 1). However, the pulses' frequency (every 4.5 h) did not allow the ORPmean to deteriorate to the range of the highly negative values that were observed during FDO and AI-LF1. The minimal ORPmean observed during AI-HF1 was −23 mV, whereas this value was −119 and −192 mV in FDO and AI-LF1, respectively (Fig. 4). In AI-HF1, the deterioration in the ORP levels with time was much less drastic than in AI-LF1. In fact, there was even an overall trend of increase in the ORPmean during the last 48 h. In summary, the high-frequency operation mode (AI-HF1) maintained higher and steadier ORP levels compared with low-frequency operation (AI-LF1) and the intermittent operation (FDO) (Fig. 4).
Generally, the better and steadier oxidizing conditions in AI-HF1 led to better and steadier effluent quality compared with AI-LF1 and FDO (Fig. 5). For example, the normalized DOC concentration at a depth of 145 cm (DOC145 DOC0) was lower in AI-HF1 (mean = 0.05; i.e., 95 % removal) than in FDO (mean = 0.14) (Fig. 5a). A Mann–Whitney U (MWU) test indicated that this difference is statistically significant (p=0.04, α=0.05). As discussed earlier, DOC degradation in SAT is enhanced under oxidizing conditions; therefore, it should be expected that the highest DOC removal would be observed in the most oxidizing experiment (AI-HF1). Correspondingly, the low-frequency operation mode (AI-LF1), which showed the most negative ORP levels (Fig. 4), also showed the highest DOC concentrations at a depth of 145 cm b.g.l. (below ground level) (mean = 0.23). As discussed earlier, the formation of PFPs and the reduced detention time in AI-LF1 might also have harmed the obtained effluent quality in this experiment.
The normalized DOC145 in AI-HF1 was not only lower but also steadier (SD = 0.01) than in FDO and AI-LF1 (SD = 0.08 and 0.18, respectively; Fig. 5a). Unsurprisingly, the worst (i.e., highest) DOC145 values were observed when there was no DO throughout the column (i.e., DOmean=0) and ORPmean was lower than 75 mV (indicated by filled dots in Fig. 5). When at least some parts of the soil were characterized by aerobic conditions (i.e., DOmean>0 and ORPmean>90 mV, indicated by unfilled dots), lower concentrations were observed (Fig. 5a).
The preferred oxidizing conditions in AI-HF1 also promoted the removal of reduced forms of N (TKN): the normalized TKN145 was lower in AI-HF1 (mean = 0.11) than in conventional FDO (mean = 0.51) (Fig. 5b). We expected these results because, as discussed earlier, TKN is biologically removed in SAT through the mineralization of organic N to NH and the following nitrification, which are both enhanced under aerobic conditions. However, it should be noted that the difference in the normalized TKN145 between AI-HF1 and FDO was statistically less significant than the difference in the DOC145 (MWU test, p=0.08, α=0.05). Like the DOC, the TKN concentrations in AI-HF1 were relatively steady throughout the experiment, whereas low ORP levels and O2 absence in parts of each experiment (Figs. 4 and S6, respectively) led to poor TKN removal in FDO and AI-LF1 (Fig. 5b). In terms of TKN, AI-LF1 again showed the poorest effluent quality: less than 40 % of removal on average (Fig. 5b).
The main product of coupled mineralization–nitrification is NO. Hence, it can be expected that high NO concentrations will be observed when these processes are enhanced and lead to high TKN removal. Indeed, in AI-HF1, the mean NO was ∼5.5 times higher than its mean inlet concentration (Fig. 5c). This finding is not unusual: an increase in the NO concentration in the first meters of SAT systems has also been observed in previous lab experiments and in the field (Grinshpan et al., 2022; Sallwey et al., 2020; Wilson et al., 1995). Meanwhile, in FDO and AI-LF1, the mean NO concentrations were much lower (Fig. 5c), as the TKN removal values were also lower (Fig. 5b). The difference in the normalized NO between AI-HF1 (mean = 5.63) and FDO (mean = 0.45) was statistically significant (MWU test, p=0.0007, α=0.05). As opposed to the DOC and TKN, lack of O2 led to low NO concentrations (Fig. 5c). This makes sense because nitrification (NH to NO) is an aerobic process that does not occur in the absence of O2, and these anoxic conditions promote NO removal by denitrification (Mienis and Arye, 2018). In regions where nitrate levels are of major concern, this should be taken into account.
As N removal by denitrification is an anoxic process, it could be expected that TN concentrations in the mostly aerobic AI-HF1 would be higher than in FDO and AI-LF1. However, the normalized TN145 during AI-HF1 (mean = 0.58) was not statistically different (MWU test, p=0.60, α=0.05) from the normalized TN145 during FDO (mean = 0.50) and was even lower than the normalized TN145 in AI-LF1 (mean = 0.64) (Fig. 5d). In addition, it should be noted that the worst N removal values (i.e., highest TN concentrations) were observed when O2 was absent from the soil (Fig. 5d). These findings indicate that, although O2 absence is vital for efficient denitrification, O2 presence is essential for N removal in SAT, as aerobic nitrification is a necessary stage in converting reduced forms of N (organic N and NH) to N2. In other words, reducing conditions in SAT restrict the creation of NO and can turn it into a limiting factor with respect to N removal by denitrification.
In this study, air injection significantly influenced O2 availability and the ORP above and below the injection port, creating, in some cases, a fully oxidized soil profile (Figs. S4, S6) which inhibited N removal by denitrification. However, at real SAT sites, where the soil profile is much deeper and larger, the impact of shallow air injection on deep parts of the soil is expected to be negligible, as (due to buoyancy) the injected air will probably move mostly upward. Hence, in the field, air injection into the subsurface may divide the vadose zone into two pseudo-reactors. The upper pseudo-reactor, located above the injection port, will be characterized by stable oxidizing conditions that enhance aerobic DOC degradation, organic-N mineralization, and nitrification, and the lower one, located below the injection port, will be characterized by anoxic conditions that enhance denitrification. As a result, Air-SAT may lead to even better N removal than presented here. This, however, is yet to be tested.
High-frequency air injection also led to consistently higher removal of the emerging contaminant IBP (Fig. 6a): the normalized IBP145 was lower in AI-HF1 (mean = 0.12) than in FDO (mean = 0.77). This difference was statistically significant (MWU test, p=0.01, α=0.05). In addition, like the DOC and TKN, IBP concentrations also showed dependency on the soil's ORP and O2 presence (Fig. 6a). Numerous studies, such as Amy and Drewes (2007), He et al. (2020), and Onesios and Bouwer (2012), have found that IBP is efficiently removed during SAT. Sallwey et al. (2020) also demonstrated that its efficient removal (>80 %) is preserved under different flooding–drying regimes, suggesting that IBP is relatively insensitive to DO fluctuations throughout the soil profile. However, our results indicate that, although IBP can be removed efficiently (>80 %) under mean DO levels that are lower than 1 mg L−1 (Fig. S7), its removal is poor when O2 is totally absent (<40 %; Figs. 6a, S7). Hence, to maintain a steady, high removal of IBP, it is necessary to preserve aerobic conditions in the top layers of SAT sites, using either passive aeration (i.e., DPs) or active aeration.
The other two examined CECs showed much poorer removal than IBP. Furthermore, they showed weak dependency on the soil redox conditions and on the operation mode itself (Fig. 6b, c). CBZ mean removal was less than 10 % during the three main experiments (Fig. 6b), while BTR removal was only 1 %–21 % on average (Fig. 6c). The CBZ removal that we observed matches with findings from previous studies, which showed that CBZ is very persistent during SAT (Usman et al., 2018; Sopilniak et al., 2018; He et al., 2020) and that its limited removal is associated mainly with sorption rather than with biodegradation (Martínez-Hernández et al., 2016). Hence, air injection, which enhanced aerobic biodegradation but probably did not have a meaningful impact on sorption processes, also did not improve CBZ removal.
With respect to BTR, previous studies' results are equivocal and site-specific. Filter et al. (2017) and Wünsch et al. (2019) reported poor BTR removal (<30 %) during column experiments with sediment cores from the Saatwinkel SAT site in Germany and soil from the Lange Erlen site in Switzerland, respectively. On the other hand, Glorian et al. (2018) reported 77 %–98 % BTR removal at bank filtration sites in northern India. In addition, Rodríguez-Escales et al. (2017) and Sallwey et al. (2020) demonstrated that BTR removal in SAT depends on soil redox conditions: aerobic conditions are preferable. Hence, although the BTR removal was insufficient in our study and air injection did not improve it, we believe that air injection may be beneficial under different circumstances; for example, it is possible that the limiting factor with respect to BTR biodegradation in our study was not DO availability but other factors, such as a lack of proper microbial community or specific nutrients. At SAT sites where the aforementioned factors are abundant, low DO concentrations may hinder BTR removal. Under such conditions, active air injection can induce steady aerobic conditions that will enhance the biodegradability of BTR and lead to better effluent quality.
In contrast to recharge volumes (Fig. 3), the airflow rate did not significantly impact the obtained effluent quality in the outflow: the concentrations of macro-pollutants and CECs at a depth of 145 cm in the secondary experiment AI-HF2 were similar to AI-HF1 (Tables S6, S7). This experiment (i.e., AI-HF2) was identical to AI-HF1 in terms of hydraulic operation (continuous infiltration) and pulse frequency (4.5 h−1), but the average airflow rate was approximately half that of AI-HF1 (0.991 L min−1). In addition, the pulse duration in this experiment was double (16 min) that used in AI-HF1 (8 min) in order to achieve a similar overall volume of injected air (Table 1), which allows a fair comparison in terms of effluent quality.
The use of subsurface air injection as an alternative to long-DP operation in SAT (Air-SAT) was tested in a series of long-column experiments. Synthetic effluent was continuously introduced into the column for 72 h. At the same time, compressed air was injected in pulses at different durations (8, 16, and 60 min), frequencies (4.5 and 24 h−1), and flow rates (∼1 and ∼2 L min−1) at a depth of 85 cm below the soil surface. ORP, VWC, and DO were monitored along the column, and effluent samples were collected at various depths and analyzed for N species, DOC, and selected CECs (IBP, CBZ, and BTR). In addition, the injection pressure, temperature, infiltration rates, and overall infiltration volumes were measured throughout each experiment. All of the results were compared to a conventional flooding–drying operation.
Air-SAT operation allowed more effluent infiltration than the flooding–drying regime. The significantly increased recharge volumes were achieved mainly due to the increased infiltration time. In addition, the mean infiltration rate, which decreased by ∼50 % during the air pulses, recovered after them and, in some cases, even reached significantly higher values than in conventional intermittent operation, probably due to the creation of new PFPs for both effluent and air. Moreover, we found that a longer pulse duration and higher airflow rate led to an increased infiltration rate. In contrast, a high pulse frequency led to a lower infiltration rate than observed in low-frequency operation, apparently owing to enhanced biological clogging. In the long run, this form of operation can significantly decrease the recharge capacity of SAT sites; therefore, we do not recommend using it without DPs, which, besides DO recovery, also have a significant role in maintaining a steady infiltration flux during SAT operation. DPs recover the infiltration rate by allowing the drying, cracking, and decomposition of clogging layers (Bouwer, 2002) as well as enabling the periodic tillage of the basin's surface, which breaks the clogging crusts and removes unwanted vegetation (Negev et al., 2020). Apparently, air injection cannot induce such mechanisms efficiently. Hence, we suggest that active air injection should be incorporated into conventional intermittent operation, although likely with much longer wetting times and shorter and less frequent DPs than usually utilized. This combination of both active and passive aeration can reduce the required drying length while sustaining a steady infiltration rate.
As seen for DPs, air injection managed to recover the ORP and DO levels along the soil profile. In fact, high-frequency Air-SAT during continuous flooding maintained better and steadier oxidizing conditions than flooding–drying operation. These conditions led to higher removal of DOC, TKN, and IBP; similar removal of total N; and higher concentrations of NO3. On the other hand, low-frequency Air-SAT, which excelled in terms of infiltration rate, induced unsteady oxidizing conditions that led to similar or even worse effluent quality than conventional operation.
In terms of effluent quality, short-pulse, high-frequency Air-SAT seems to be the best operation mode. However, this operation mode induces steady aerobic conditions that apparently lead to enhanced biological clogging and infiltration rate deterioration. In long-term operation, this deterioration can be critical, and the DPs, which are known to play a significant role in maintaining a steady infiltration rate in SAT, may reduce it. Hence, we suggest that air injection may be utilized during conventional intermittent operation, allowing shorter DPs and higher recharge volumes while sustaining a steady infiltration rate.
This preliminary study highlights the possibility of using subsurface soil air injection as an alternative to increase the recharge capacity of existing SAT sites while maintaining high effluent quality. Subsurface air injection may also solve some of the potential problems of agricultural SAT, where appropriate DO and ORP conditions are important for crop health (Grinshpan et al., 2021, 2022). However, to reach the point of full application, further research is necessary, including a pilot study, techno-economic assessment, and optimization of the operational parameters (i.e., the injection ports' spread across the basin, injection depth, airflow rate, pulse frequency, and pulse duration).
| AI | Air injection |
| BTR | 1H-Benzotriazole |
| CBZ | Carbamazepine |
| CEC | Contaminant of emerging concern |
| DO | Dissolved oxygen |
| DOM | Dissolved organic matter |
| DON | Dissolved organic N |
| DP | Drying period |
| FDO | Flooding–drying operation |
| FP | Flooding period |
| HF | High frequency |
| IBP | Ibuprofen |
| LDO | Luminescent dissolved oxygen |
| LF | Low frequency |
| MAR | Managed aquifer recharge |
| ORP | Oxidation–reduction potential |
| SAT | Soil aquifer treatment |
| SD | Standard deviation |
| SH | Surface head |
| TKN | Total Kjeldahl N |
| TN | Total nitrogen |
| TOC | Total organic C |
| VWC | Volumetric water content |
| WW | Wastewater |
The data that support the findings of this study are available at https://doi.org/10.5281/zenodo.7265560 (Arad et al., 2023) or upon request from the corresponding author.
The supplement related to this article is available online at: https://doi.org/10.5194/hess-27-2509-2023-supplement.
IA, AZ, and SBM prepared the experimental setup. IA, SBM, AF, and NW designed the experiments. IA and AZ carried out the experiments. IA analyzed the data and prepared the paper with contributions from all co-authors.
The contact author has declared that none of the authors has any competing interests.
Publisher's note: Copernicus Publications remains neutral with regard to jurisdictional claims in published maps and institutional affiliations.
The authors wish to thank Nura Azzam for analytical assistance.
This work was financed within the framework of the German–Israeli Water Technology Cooperation Program (project no. WT1601/2689), by the German Federal Ministry of Education and Research (BMBF) and the Israeli Ministry of Science, Technology and Space (MOST). This work was also supported by the Israel–US Collaborative Water–Energy Research Center (CoWERC) via the Binational Industrial Research and Development Foundation (BIRD) Energy Center (grant no. EC-15).
This paper was edited by Insa Neuweiler and reviewed by Helen Dahlke and one anonymous referee.
Aharoni, A., Negev, I., Cohen, E., Bar, O., Shtrasler, L., Orgad, O., Gabay, R., and Shevach, Y.: Monitoring Shafdan effluents recharge and the third line project: 2019 Yearly Report, Mekorot – National water co., Tel Aviv-Yafo, Israel, 2020.
Amy, G. and Drewes, J.: Soil aquifer treatment (SAT) as a natural and sustainable wastewater reclamation/reuse technology: Fate of wastewater effluent organic Matter (EfoM) and trace organic compounds, Environ. Monit. Assess., 129, 19–26, https://doi.org/10.1007/s10661-006-9421-4, 2007.
Arad, I., Ziner, A., Ben Moshe, S., Weisbrod, N., and Furman, A.: Improving soil aquifer treatment efficiency using air injection into the subsurface – Data set, Zenodo [data set], https://doi.org/10.5281/zenodo.7265560, 2023.
Barry, K. E., Vanderzalm, J. L., Miotlinski, K., and Dillon, P. J.: Assessing the impact of recycled water quality and clogging on infiltration rates at a pioneering Soil Aquifer Treatment (SAT) site in Alice Springs, Northern Territory (NT), Australia, Water, 9, 179, https://doi.org/10.3390/w9030179, 2017.
Ben Moshe, S., Weisbrod, N., Barquero, F., Sallwey, J., Orgad, O., and Furman, A.: On the role of operational dynamics in biogeochemical efficiency of a soil aquifer treatment system, Hydrol. Earth Syst. Sci., 24, 417–426, https://doi.org/10.5194/hess-24-417-2020, 2020.
Ben Moshe, S., Weisbrod, N., and Furman, A.: Optimization of soil aquifer treatment (SAT) operation using a reactive transport model, Vadose Zone J., 20, e20095, https://doi.org/10.1002/vzj2.20095, 2021.
Ben-Noah, I., Nitsan, I., and Friedman, S. P.: Forced gas injection and water infiltration into sand – A two-phase flow barrel and column experiment, Soil Sci. Soc. Am. J., 85, 40–58, https://doi.org/10.1002/saj2.20138, 2021.
Bouwer, H.: Ground Water Recharge with sewage effluent, Water Sci. Technol., 23, 2099–2108, https://doi.org/10.2166/wst.1991.0666, 1991.
Bouwer, H.: Artificial recharge of groundwater: hydrogeology and engineering, Hydrogeol. J., 10, 121–142, https://doi.org/10.1007/s10040-001-0182-4, 2002.
Brooks, J., Weisbrod, N., and Bar-Zeev, E.: Revisiting soil Aquifer treatment: Improving biodegradation and filtration efficiency using a highly porous material, Water, 12, 3593, https://doi.org/10.3390/w12123593, 2020.
Dean, W. E.: Determination of carbonate and organic matter in calcareous sediments and sedimentary rocks by loss on ignition; comparison with other methods, J. Sediment. Res., 44, 242–248, https://doi.org/10.1306/74D729D2-2B21-11D7-8648000102C1865D, 1974.
Dror, I., Berkowitz, B., and Gorelick, S. M.: Effects of air injection on flow through porous media: Observations and analyses of laboratory-scale processes, Water. Resour. Res., 40, W09203, https://doi.org/10.1029/2003WR002960, 2004.
Filter, J., Jekel, M., and Ruhl, A. S.: Impacts of accumulated particulate organic matter on oxygen consumption and organic micro-pollutant elimination in bank filtration and soil aquifer treatment, Water, 9, 349, https://doi.org/10.3390/w9050349, 2017.
Gee, G. W. and Or, D.: 2.4 Particle-size analysis, in: Methods of soil analysis: Part 4 physical methods, vol. 5, Wiley Online Library, 255–293, https://doi.org/10.2136/sssabookser5.4.c12, 2002.
Gharoon, N. and Pagilla, K. R.: Critical review of effluent dissolved organic nitrogen removal by soil/aquifer-based treatment systems, Chemosphere, 269, 129406, https://doi.org/10.1016/j.chemosphere.2020.129406, 2021.
Glorian, H., Börnick, H., Sandhu, C., and Grischek, T.: Water quality monitoring in northern India for an evaluation of the efficiency of bank filtration sites, Water, 10, 1804, https://doi.org/10.3390/w10121804, 2018.
Goren, O., Burg, A., Gavrieli, I., Negev, I., Guttman, J., Kraitzer, T., Kloppmann, W., and Lazar, B.: Biogeochemical processes in infiltration basins and their impact on the recharging effluent, the soil aquifer treatment (SAT) system of the Shafdan plant, Israel, Appl. Geochem., 48, 58–69, https://doi.org/10.1016/j.apgeochem.2014.06.017, 2014.
Grinshpan, M., Furman, A., Dahlke, H. E., Raveh, E., and Weisbrod, N.: From managed aquifer recharge to soil aquifer treatment on agricultural soils: Concepts and challenges, Agr. Water Manage., 255, 106991, https://doi.org/10.1016/j.agwat.2021.106991, 2021.
Grinshpan, M., Turkeltaub, T., Furman, A., Raveh, E., and Weisbrod, N.: On the use of orchards to support soil aquifer treatment systems, Agr. Water Manage., 260, 107315, https://doi.org/10.1016/j.agwat.2021.107315, 2022.
He, K., Asada, Y., Echigo, S., and Itoh, S.: Biodegradation of pharmaceuticals and personal care products in the sequential combination of activated sludge treatment and soil aquifer treatment, Environ. Technol., 41, 378–388, https://doi.org/10.1080/09593330.2018.1499810, 2020.
Icekson-Tal, N., Avraham, O., Sack, J., and Cikurel, H.: Water reuse in Israel – The Dan Region Project: evaluation of water quality and reliability of plant's operation, Water Sci. Tech.-W. Sup., 3, 231–237, https://doi.org/10.2166/ws.2003.0067, 2003.
Idelovitch, E. and Michail, M.: Soil-aquifer treatment: a new approach to an old method of wastewater reuse, J. Water Pollut. Con. F., 56, 936–943, 1984.
Idelovitch, E., Icekson-Tal, N., Avraham, O., and Michail, M.: The long-term performance of Soil Aquifer Treatment (SAT) for effluent reuse, Water Sci. Tech.-W. Sup., 3, 239–246, https://doi.org/10.2166/ws.2003.0068, 2003.
Jetten, M. S. M.: The microbial nitrogen cycle, Environ. Microbiol., 10, 2903–2909, https://doi.org/10.1111/j.1462-2920.2008.01786.x, 2008.
Lappin-Scott, H. M. and Bass, C.: Biofilm formation: attachment, growth, and detachment of microbes from surfaces, Am. J. Infect. Control, 29, 250–251, https://doi.org/10.1067/mic.2001.115674, 2001.
Liao, B. Q., Allen, D. G., Droppo, I. G., Leppard, G. G., and Liss, S. N.: Surface properties of sludge and their role in bioflocculation and settleability, Water Res., 35, 339–350, 2001.
Liu, H. and Logan, B. E.: Electricity generation using an air-cathode single chamber microbial fuel cell in the presence and absence of a proton exchange membrane. Environ. Sci. Technol., 38, 4040–4046, 2004.
Martínez-Hernández, V., Meffe, R., Herrera López, S., and de Bustamante, I.: The role of sorption and biodegradation in the removal of acetaminophen, carbamazepine, caffeine, naproxen and sulfamethoxazole during soil contact: A kinetics study, Sci. Total Environ., 559, 232–241, https://doi.org/10.1016/j.scitotenv.2016.03.131, 2016.
Mienis, O. and Arye, G.: Long-term nitrogen behavior under treated wastewater infiltration basins in a soil-aquifer treatment (SAT) system, Water Res., 134, 192–199, https://doi.org/10.1016/j.watres.2018.01.069, 2018.
Mizrahi, G., Furman, A., and Weisbrod, N.: Infiltration under confined air conditions: Impact of Inclined Soil Surface, Vadose Zone J., 15, vzj2016.04.0034, https://doi.org/10.2136/vzj2016.04.0034, 2016.
Montwedi, M., Munyaradzi, M., Pinoy, L., Dutta, A., Ikumi, D. S., Motoasca, E., and van der Bruggen, B.: Resource recovery from and management of wastewater in rural South Africa: Possibilities and practices, J. Water Process. Eng., 40, 101978, https://doi.org/10.1016/j.jwpe.2021.101978, 2021.
Naz, I., Batool, S. A. U., Ali, N., Khatoon, N., Atiq, N., Hameed, A., and Ahmed, S.: Monitoring of growth and physiological activities of biofilm during succession on polystyrene from activated sludge under aerobic and anaerobic conditions, Environ. Monit. Assess., 185, 6881–6892, https://doi.org/10.1007/s10661-013-3072-z, 2013.
Negev, I., Shechter, T., Shtrasler, L., Rozenbach, H., and Livne, A.: The effect of soil tillage equipment on the recharge capacity of infiltration ponds, Water, 12, 541, https://doi.org/10.3390/w12020541, 2020.
Onesios, K. M. and Bouwer, E. J.: Biological removal of pharmaceuticals and personal care products during laboratory soil aquifer treatment simulation with different primary substrate concentrations, Water Res., 46, 2365–2375, https://doi.org/10.1016/j.watres.2012.02.001, 2012.
Pavelic, P., Dillon, P. J., Mucha, M., Nakai, T., Barry, K. E., and Bestland, E.: Laboratory assessment of factors affecting soil clogging of soil aquifer treatment systems, Water Res., 45, 3153–3163, https://doi.org/10.1016/j.watres.2011.03.027, 2011.
Quanrud, D. M., Arnold, R. G., Wilson, L. G., Gordon, H. J., Graham, D. W., and Amy, G. L.: Fate of Organics during Column Studies of Soil Aquifer Treatment, J. Environ. Eng., 122, 314–321, https://doi.org/10.1061/(asce)0733-9372(1996)122:4(314), 1996.
Qureshi, A. S.: Challenges and prospects of using treated wastewater to manage water scarcity crises in the Gulf Cooperation Council (GCC) countries, Water, 12, 1971, https://doi.org/10.3390/w12071971, 2020.
Rauch, T. and Drewes, J. E.: Quantifying Biological Organic Carbon Removal in Groundwater Recharge Systems, J. Environ. Eng., 131, 909–923, https://doi.org/10.1061/(asce)0733-9372(2005)131:6(909), 2005.
Rodríguez-Escales, P., Fernàndez-Garcia, D., Drechsel, J., Folch, A., and Sanchez-Vila, X.: Improving degradation of emerging organic compounds by applying chaotic advection in Managed Aquifer Recharge in randomly heterogeneous porous media, Water. Resour. Res., 53, 4376–4392, https://doi.org/10.1002/2016WR020333, 2017.
Ruan, A., He, R., Xu, S., and Lin, T.: Effect of dissolved oxygen on nitrogen purification of microbial ecosystem in sediments, J. Environ. Sci. Health A, 44, 397–405, https://doi.org/10.1080/10934520802659778, 2009.
Sallwey, J., Jurado, A., Barquero, F., and Fahl, J.: Enhanced removal of contaminants of emerging concern through hydraulic adjustments in soil aquifer treatment, Water, 12, 2627, https://doi.org/10.3390/w12092627, 2020.
Sharma, S. K. and Kennedy, M. D.: Soil aquifer treatment for wastewater treatment and reuse, Int. Biodeter. Biodegr., 119, 671–677, https://doi.org/10.1016/j.ibiod.2016.09.013, 2017.
Sohsalam, P. and Sirianuntapiboon, S.:Feasibility of using constructed wetland treatment for molasses wastewater treatment, Bioresour. Technol., 99, 5610–5616, 2008.
Sopilniak, A., Elkayam, R., Rossin, A. V., and Lev, O.: Emerging organic pollutants in the vadose zone of a soil aquifer treatment system: Pore water extraction using positive displacement, Chemosphere, 190, 383–392, https://doi.org/10.1016/j.chemosphere.2017.10.010, 2018.
Steduto, P., Faures, J. M., Hoogeveen, J., Winpenny, J., and Burke, J.: Coping with water scarcity: an action framework for agriculture and food security, FAO water reports, FAO, ISBN 9789251073049, 2012.
Stefanakis, A., Akratos C. S., and Tsihrintzis V. A.: Vertical flow constructed wetlands: eco-engineering systems for wastewater and sludge treatment, in: 1st Edn., Elsevier Science, Newnes, ISBN 9780124046870, 2014.
Thuy, V. K., He, K., Echigo, S., Asada, Y., and Itoh, S.: Impact of biological clogging and pretreatments on the operation of soil aquifer treatments for wastewater reclamation, Water Cycle, 3, 35–43, https://doi.org/10.1016/j.watcyc.2022.03.001, 2022.
Turkeltaub, T., Furman, A., Mannheim, R., and Weisbrod, N.: Continuous monitoring of a soil aquifer treatment system's physico-chemical conditions to optimize operational performance, Hydrol. Earth Syst. Sci., 26, 1565–1578, https://doi.org/10.5194/hess-26-1565-2022, 2022.
Usman, M., Waseem, M., Mani, N., and Andiego, G.: Optimization of Soil Aquifer Treatment by Chemical Oxidation with Hydrogen Peroxide Addition, Pollution, 4, 369–379, https://doi.org/10.15480/882.3610, 2018.
van Genuchten, M. T.: A Closed-form equation for predicting the hydraulic conductivity of unsaturated soils, Soil Sci. Soc. Am. J., 44, 892–898, https://doi.org/10.2136/sssaj1980.03615995004400050002x, 1980.
Van Raaphorst, W. and Malschaert, J. F. P.: Ammonium adsorption in superficial North Sea sediments, Cont. Shelf. Res., 16, 1415–1435, https://doi.org/10.1016/0278-4343(95)00081-X, 1996.
Willis, R. B., Montgomery, M. E., and Allen, P. R.: Improved method for manual, colorimetric determination of total kjeldahl nitrogen using salicylate, J. Agric. Food Chem., 44, 1804–1807, https://doi.org/10.1021/jf950522b, 1996.
Wilson, L. G., Amy, G. L., Gerba, C. P., Gordon, H., Johnson, B., and Miller, J.: Water quality changes during soil aquifer treatment of tertiary effluent, Water Environ. Res., 67, 371–376, https://doi.org/10.2175/106143095X131600, 1995.
Wünsch, R., Plattner, J., Cayon, D., Eugster, F., Gebhardt, J., Wülser, R., von Gunten, U., and Wintgens, T.: Surface water treatment by UV/H2O2 with subsequent soil aquifer treatment: Impact on micropollutants, dissolved organic matter and biological activity, Environ. Sci. Water Res. Technol., 5, 1709–1722, https://doi.org/10.1039/c9ew00547a, 2019.
Zang, Y. and Li, M.: Numerical assessment of compressed air injection for mitigating seawater intrusion in a coastal unconfined aquifer, J Hydrol., 595, 125964, https://doi.org/10.1016/j.jhydrol.2021.125964, 2021.