the Creative Commons Attribution 4.0 License.
the Creative Commons Attribution 4.0 License.
 | 14 Jun 2023
Relationship of seasonal variations in drip water δ13CDIC, δ18O, and trace elements with surface and physical cave conditions of La Vallina cave, NW Spain
Oliver Kost
Saúl González-Lemos
Laura Rodríguez-Rodríguez
Jakub Sliwinski
Laura Endres
Negar Haghipour
Cave-monitoring studies clarify the climatic, surface vegetation, and karst processes affecting the cave system and lay the foundation for interpreting geochemical stalagmite records. Here we report the monitoring of cave air, bedrock chemistry, and drip water δ13CDIC, δ18O, and δD, as well as 16 trace elements, covering a full annual cycle spanning the 16 months between November 2019 and March 2021 in La Vallina cave in the northwestern Iberian Peninsula. While decreased rainfall and increased evapotranspiration in the summer months lead to a strong reduction in drip rates, there is little seasonal variation in δ18O and δD in a given drip, likely reflecting the discrete moderately mixed to well-mixed karst water reservoirs. Small differences in δ18O and δD between drip sites are attributed to variable evaporation intensity and/or transit times. The carbon isotope signature of the dissolved inorganic carbon of drip water (δ13CDIC) is likely driven by seasonal changes in the temperature controlling biological processes (vegetation and microbial soil activity), resulting in minimum δ13CDIC in summer and autumn months. Increased bedrock dissolution due to higher soil pCO2 in summer and autumn results in increased trace element concentrations of congruently dissolved elements. Cave air measurements (pCO2, δ13Cair, and temperature) indicate the seasonal ventilation (winter) and stagnation (summer) of cave air. The opposite effects of reduced cave air pCO2, seasonally variable biological activity, and increased drip rate limit the extent of the seasonal variation in degassing and prior calcite precipitation (PCP) supported by trace elements ( index). Estimated stalagmite growth rates using monitoring data suggest biannual phases of potential calcite precipitation in summer and winter and growth cessation during spring and autumn, depending on cave and drip water conditions and the location within the cave, which has important implications for the proxy interpretation of stalagmite records.
- Article
(10392 KB) - Full-text XML
- BibTeX
- EndNote


While speleothems represent long-lasting paleoclimate archives with a host of potential elemental and isotopic proxies for climate, the interpretation of these proxies depends on the understanding of complex physical, chemical, and biological processes. Because of ongoing improvements in the sensitivity of inductively coupled plasma mass spectrometry (ICP-MS), and in situ techniques such as laser ablation (LA)-ICP-MS, a wider range of trace elements can be analyzed at unprecedented precision and spatial resolution, shedding light on seasonal and subannual variations in trace element abundance in stalagmites (e.g., Faraji et al., 2021; Sliwinski and Stoll, 2021). For this reason, the limiting factor in interpreting the trace element signals in speleothems is no longer analytical instrumentation but rather our understanding of underlying physical processes. Cave-monitoring studies provide one important approach for improving the understanding of speleothem proxies because the measurements of elemental or isotopic composition of drip water can be compared with instrumental measurements of seasonal or interannual variations in parameters of climatic interest, such as infiltration rate, rainfall amount and origin, and temperature (e.g., Breitenbach et al., 2015; Hartland et al., 2012; Riechelmann et al., 2011; Spötl et al., 2005). Cave drip waters represent a unique window on the flow rates and biogeochemistry of infiltrating groundwater in karst regions, providing information on parts of the system which are otherwise difficult to sample.
Speleothem studies have traditionally relied heavily on the interpretation of δ18O, and global monitoring comparisons have confirmed that drip water δ18O generally follows rainwater compositions (Baker et al., 2019). However, seasonal changes in rainwater δ18O can appear, with a significant lag and attenuation by the karst reservoir (e.g., Moreno et al., 2014; Markowska et al., 2016). Evaporative fractionation of karst water in the vadose zone affects the water isotopic composition and can even exceed the rainwater imprint (Baker et al., 2019; Markowska et al., 2016). Differences in the importance of recharge from different seasons may contribute to δ18O differences among coeval stalagmites (e.g., Bradley et al., 2010), in addition to the evaporative and degassing effects of prior calcite precipitation (PCP; Deininger et al., 2021), and remains to be resolved through further monitoring studies.
The variation in trace element ratios in speleothems has most commonly been attributed to the effects of PCP for divalent cations, like Mg, Sr, and Ba (e.g., Fairchild and Treble, 2009; Sinclair et al., 2012), and on the effect of organic chelation on the colloidal transport of some insoluble metals (e.g., Cu, Ni, and Zn; Hartland et al., 2012; Borsato et al., 2007). Drip water monitoring has demonstrated PCP processes in several cave systems (e.g., Fairchild et al., 2000; Riechelmann et al., 2011; Sinclair et al., 2012) and shown that seasonal cave ventilation, in addition to drip rate, can regulate the degree of PCP occurring in drip waters (Mattey et al., 2010). However, while many monitored drip waters often show the covariation in , , and Ba/Ca expected from PCP, these ratios often do not covary in coeval stalagmites in ways expected from PCP (Sinclair et al., 2012; Stoll et al., 2012). Such deviations may be due to variations in partitioning coefficients of some trace elements (e.g., Stoll et al., 2012; Wassenburg et al., 2020) or may reflect heterogeneity in Mg content and solubility of different phases in the host rock (e.g., Tremaine et al., 2016). Drip water monitoring can be used to ascertain the significance of this latter process.
Transition metals, P and Y, are increasingly reported in speleothems and typically related to colloidal transport processes, but the very low concentrations of these elements in drip waters has meant that very few studies have reported monitoring data (Baldini et al., 2012; Hartland et al., 2012). Seasonal peaks in Y in stalagmites have been attributed to periods of high discharge at the end of the growing season in autumn (Borsato et al., 2007), yet a high-resolution drip-water-monitoring study found the highest Y concentrations in dry late summer months, potentially due to significant dry dust deposition in the collection vials residing in the cave (Baldini et al., 2012). Therefore, it remains uncertain if the speleothem content of these insoluble elements is controlled exclusively by drip water deposition and if flux in water is dependent only on hydrological factors or also on the factors regulating biological production of chelating ligands.
Carbon isotopic ratios are measured in stalagmite samples synchronously with δ18O but have been less frequently interpreted as a proxy because they are affected by both soil/vegetation processes and the degassing of drip waters prior to and during speleothem deposition. Their effect on δ13C can thus be difficult to deconvolve (e.g., Fohlmeister et al., 2020; Frisia et al., 2011; Lyu et al., 2020). Monitoring the δ13C of dissolved inorganic carbon (δ13CDIC) in drip water would be useful to evaluate these processes but has been limited (e.g., Fohlmeister et al., 2020; Frisia et al., 2011; Spötl et al., 2005) and may be affected by variable and extensive degassing during sample collection. Some studies report analyses of δ13CDIC on samples which have resided in the cave for weeks to months and therefore been subject to very long exchange and degassing times and may not be representative of the δ13CDIC involved in speleothem deposition. Most carbon isotope interpretation is therefore based on theoretical models (Deininger and Scholz, 2019) with limited observational comparison.
Here we evaluate the response of drip water stable isotopes and trace elements to variations in ventilation, temperature, hydrological variability, and local vegetation activity through a 16-month monitoring study in La Vallina cave, NW Spain. This cave is the site of a number of paleoclimatic records reconstructed from stalagmites (e.g., Sliwinski and Stoll, 2021; Stoll et al., 2013, 2015) and features seasonal climate cycles and cave ventilation dynamics which are expected to be representative of many midlatitude systems. We demonstrate that δ13CDIC of drip water varies seasonally and is tightly linked to variations in vegetation and soil respiration processes primarily controlled by ambient temperature. Cave air CO2 data help us to understand cave ventilation processes and can constrain the δ13C of the respired soil endmember. Furthermore, we document seasonal differences in the intensity of bedrock dissolution driven by seasonally changing water acidity controlled by soil pCO2. In this study, we discuss varying concentrations of 16 elements and the relationship to bedrock dissolution, prior calcite precipitation (PCP), and drip rate. Oxygen isotope data suggest multiple discrete moderately mixed to well-mixed drip water reservoirs fed by rainwater. Such cave-monitoring data sets can help to constrain process models like CaveCalc (Owen et al., 2018) or I-STAL (Stoll et al., 2012); we illustrate this by modeling seasons of maximum stalagmite growth based on cave air and drip water chemistry data.
La Vallina cave (43∘24′36′′ N, 4∘48′24′′ W; 70 m a.s.l.) is situated in Carboniferous limestone (Barcaliente formation; Gibbons and Moreno, 2002; Álvarez et al., 2019) and belongs to the North Iberia Speleothem Archive (NISA; Stoll et al., 2013, 2015; Fig. 1a). The entrance is situated 70 m a.s.l. (above sea level) on a northward-facing hillslope at a distance of 2.5 km from the coast, and the typical rock thickness above the cave is about 5–30 m (Fig. 1c; Table 1). The vegetation covering the cave varies from oak trees to recently grown eucalyptus and shrub/grassland (Fig. 1b and c). There are also patches used for stock farming (cows, horses, and sheep), while sporadic dolines indicate the karstification of the host rock. La Vallina cave consists of two major galleries on top of one another (Fig. 1b and c).
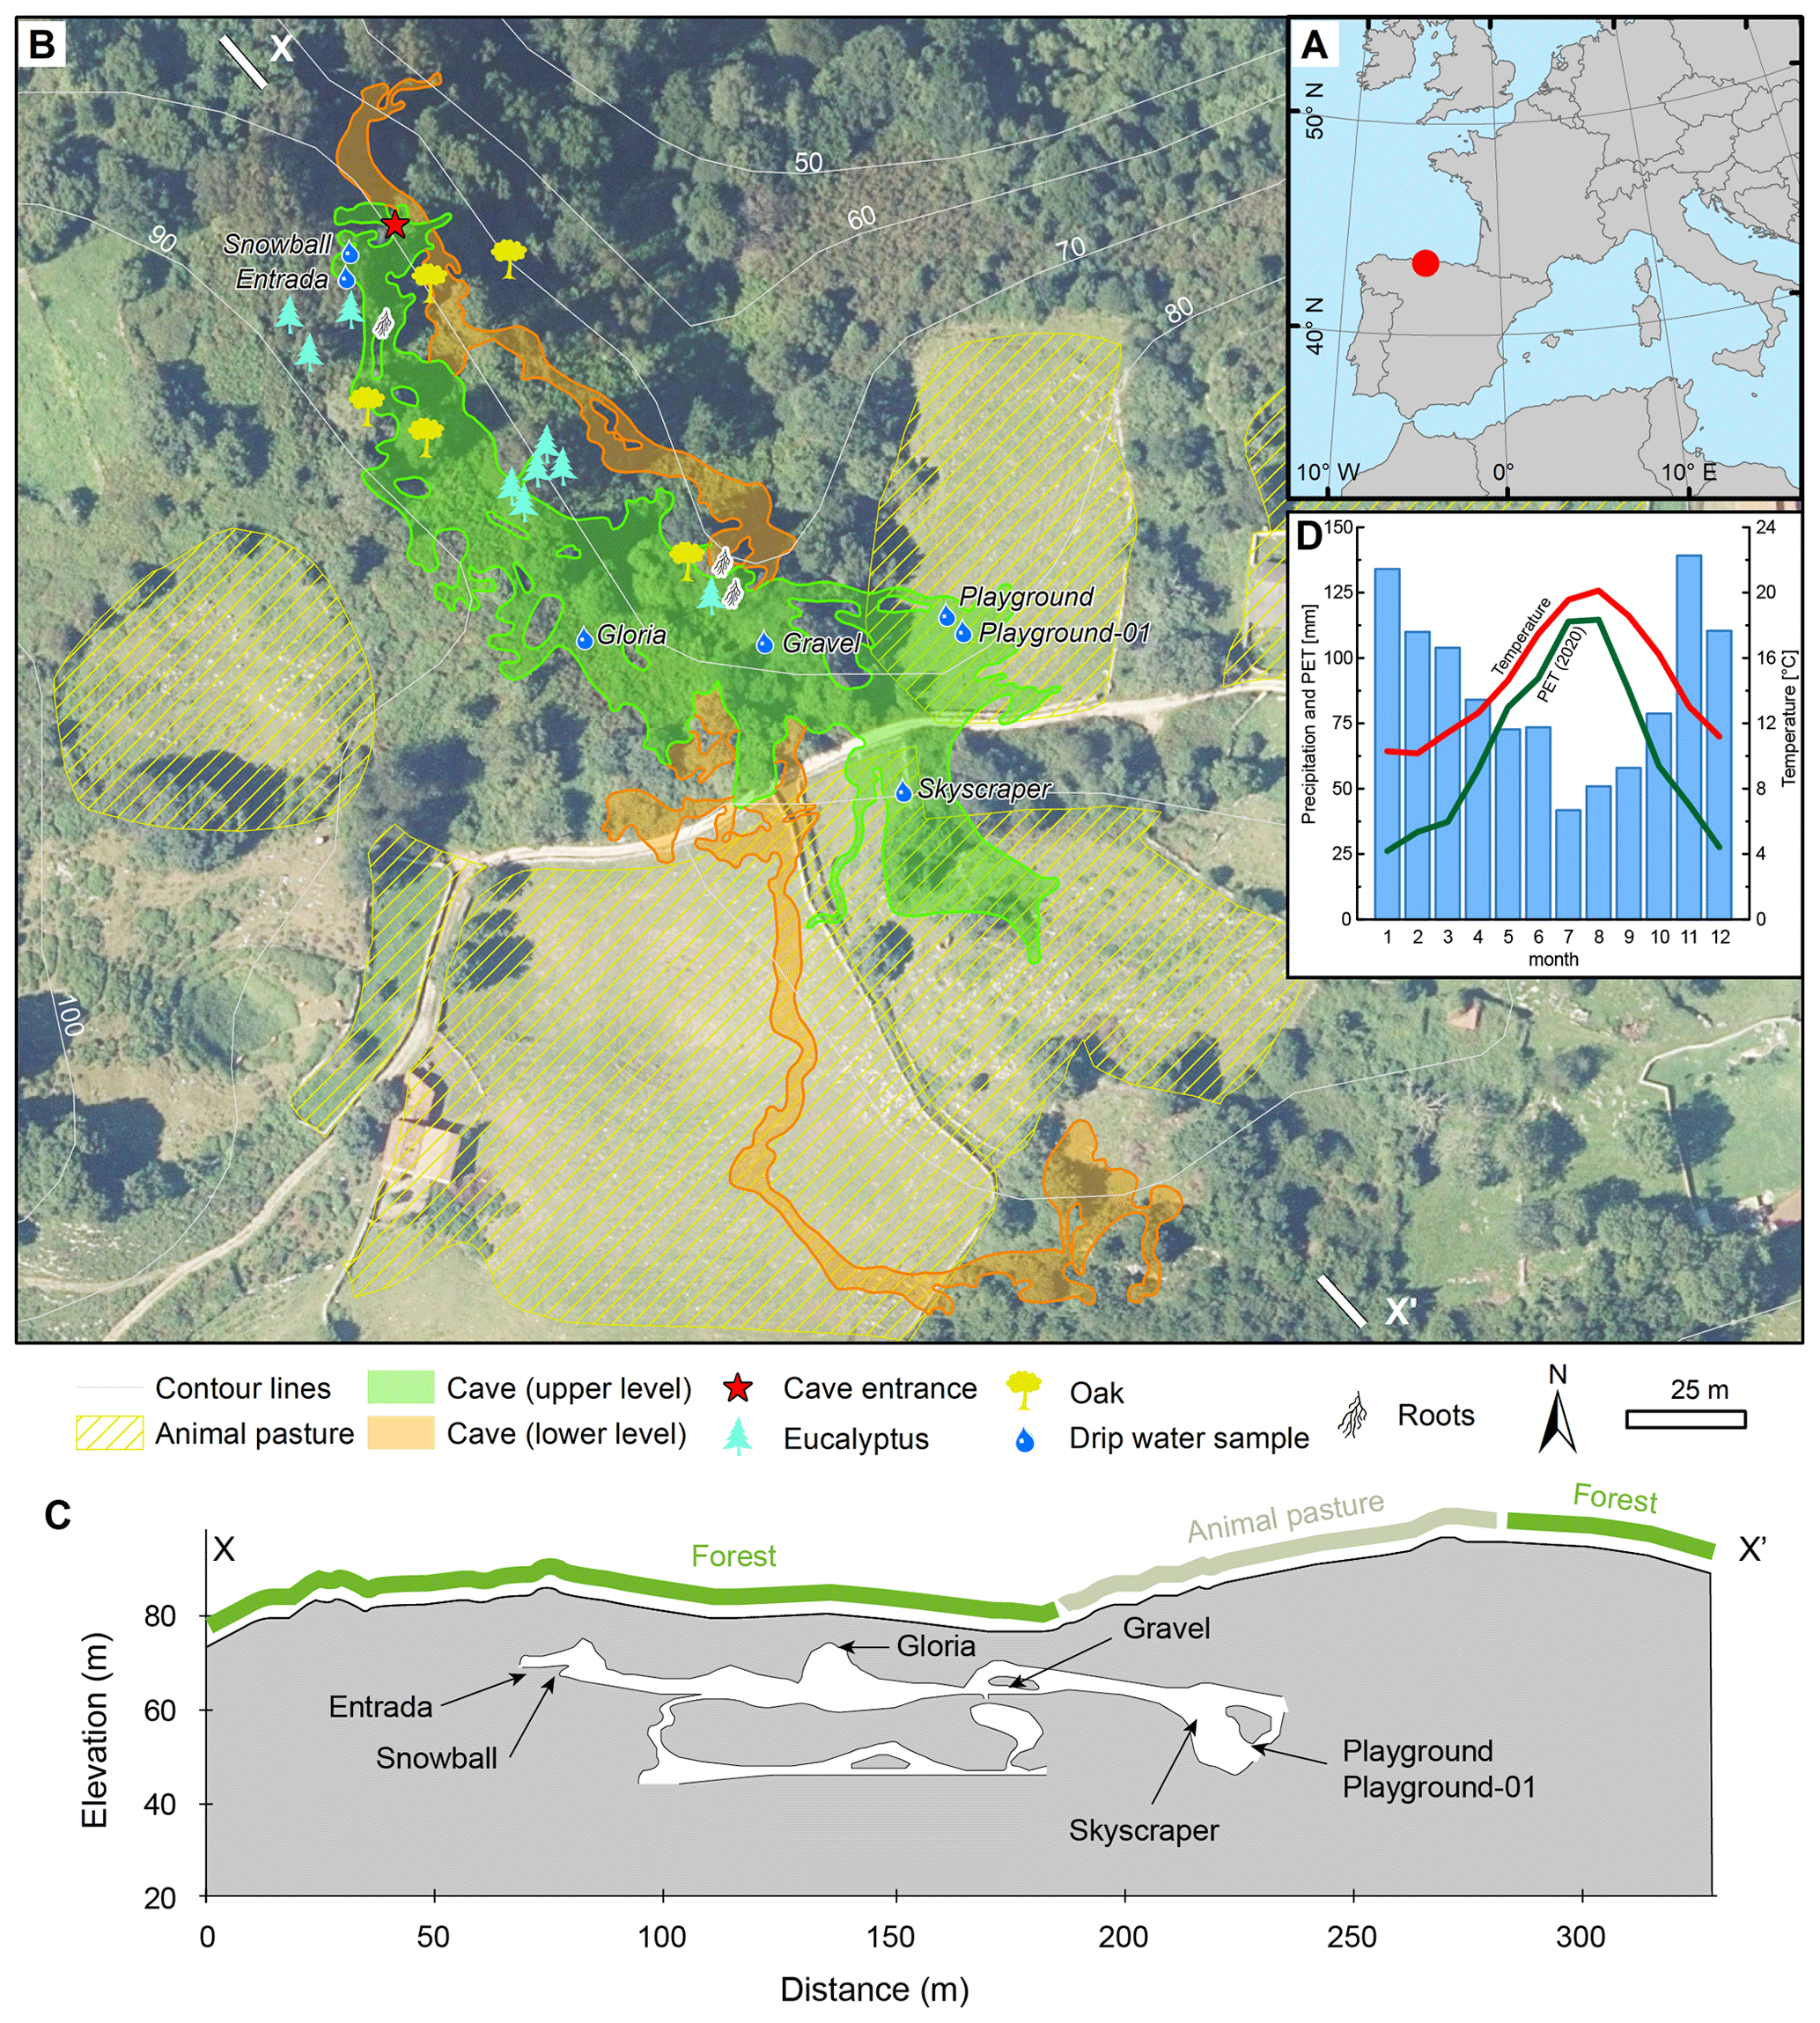
Figure 1The monitoring site situation. (a) Northern Iberian Speleothem Archive (NISA). (b) La Vallina cave with two cave galleries shown in an aerial image and a digital elevation model (DEM) from 2017 (Instituto Geográfico Nacional, 2017). (c) Cross section (X–X′) of La Vallina cave with projected sampling sites. (d) Climogram from the Llanes weather station with 20-year (2000–2020; data from AEMET, 2021) averages of the temperature (red), precipitation (blue bars), and monthly potential evapotranspiration (PET, green) for 2020. Maps were generated with ArcGIS, using publicly available data from the Spanish Instituto Geográfico Nacional (2017).
Table 1Cave environment measurements at monitoring locations giving ranges (min–max) or mean values and variations (% RSD). The full data set of temperature, cave air parameters (pCO2 and δ13Cair), and drip water dissolved inorganic carbon (DIC) measurements (δ13CDIC) is plotted in Fig. 2. The full time series of drip rate and δ18O is plotted in Fig. 3.

a Isotopic ratios reported relative to Vienna Pee Dee Belemnite (VPDB) and Vienna Standard Mean Ocean Water (VSMOW). b Not a complete seasonal cycle.
The nearby weather station of Llanes (43∘25′13′′ N, 4∘44′53′′ W; 10 m a.s.l.), 4.75 km northeast of the cave, provides weather and climate data, with daily and monthly average precipitation and temperature varying between 40–140 mm per month and 10–20 ∘C, respectively (based on the years 2000–2020; Fig. 1d; AEMET, 2021). According to the Köppen–Geiger classification, La Vallina cave is situated in a Cfb-type (temperate oceanic or subtropical highland) climate (Peel et al., 2007). Thus, the NW Iberian Peninsula is characterized as a temperate oceanic climate with mild winters. Regarding the annual precipitation, there is a water deficit in summer when potential evapotranspiration overcomes precipitation (Fig. 1d). Nevertheless, the aridity index based on the ratio of precipitation to potential evapotranspiration () is equal to 2.1, classifying NISA as humid, according to the United Nations Environment Programme (UNEP) classification (UNEP, 1997). The monitored period of 2019–2021 was 16 % wetter compared to the 20-year average precipitation.
Drip site Gloria is situated 12.8 m beneath shrubby and ferny vegetation cover (Fig. 1b and c). The drip water samples were taken from a soda straw on the cave ceiling. Gravel is a zone that is highly decorated with helictites and eccentric soda straws at the cave ceiling 6.8 m beneath shrubby vegetation cover and nearby trees (oak and eucalyptus) whose roots reach the cave. The location takes its name from evidence of a gravel-filled vertical shaft in the overlying bedrock. The sampled soda straw for Gravel was changed over the course of the monitoring period with one that is less than 0.3 m, since the originally chosen soda straw dried out and another one broke off. Playground and Playground-01 (starting at the end of October 2020) are situated a few meters apart and covered by 24.1 m of bedrock situated beneath grassland used as animal pasture for part of the year. The exceptional drip site Skyscraper is a stalactite with very high flow rate (shower-like), suggesting joint flow from a wider area focusing at this stalactite hanging a few meters above the ground. Since the ceiling was not reachable, dissolved inorganic carbon (DIC) sampling was not undertaken on most monitoring days. Skyscraper is situated at the transition between grassland and bushes, with a single oak tree, and is overlain by 30.7 m bedrock. Entrada (starting September 2020) and Snowball (from January 2021) were added to the sampling sites later in the study to capture drip water from a more tree-covered area and thinner (ca. 7.0 m) bedrock cover. These latter locations are nearer to the cave entrance and rapidly exchange cave air with the atmosphere.
Over the course of 16 months (November 2019 until March 2021), a complete seasonal cycle was monitored at the four locations (named Gloria, Gravel, Playground, and Skyscraper), except that no samples could be taken between 24 February and 5 May 2020 due to the lockdown restrictions of the COVID-19 pandemic. In the second half of the monitoring period, additional locations were added (Entrada, Playground-01, and Snowball; see the sample description). In autumn 2020, a biweekly routine was intended to catch the onset of the rainy season accompanied with colder temperatures affecting cave air stability. All samples were collected instantaneously in a single 1–30 min period so that variations in conditions between sampling days are not reflected in the drip water chemistry. This strategy, rather than aggregated bottle collection of water samples, was adopted to obtain optimal geochemical data on parameters which evolve during long collection periods in the cave, such as δ13CDIC (degassing) and Ca concentration (calcite precipitation) or dust deposition. All water samples reflect collection from the same soda straw drip source, except at the location Gravel, where the same soda straw was not always active and was substituted for an adjacent one on different samplings. Cave temperature and relative humidity were recorded at each sampling site (Table 1). Cave air samples were collected for pCO2 and δ13Cair, aliquots of drip water were sampled for geochemical analysis (δ13CDIC, δD, and δ18O and trace elements), and drip rates were recorded by counting drips to constrain the hydrological variation. Meteorological data (temperature and precipitation) were obtained from the nearby meteorological station in Llanes (AEMET, 2021), but no weather station data from Llanes are available between July and October 2019, so we have limited context of conditions just prior to the start of the monitoring period.
Cave temperature and humidity were measured with a Vaisala HUMICAP HM70 handheld meter equipped with a HMP75 probe from June 2020 to March 2021. Measurement accuracy for relative humidity (RH) is ±1 %, and the temperature value accuracy is ±0.2,∘C at +20 ∘C. Cave air was collected using a 200 mL syringe (human breath influence avoided) and injected into 0.6 L Supel™-Inert Multi-Layer Foil aluminum gas sampling bags. The carbon isotopic composition and pCO2 of cave air was measured on a cavity ring-down spectrometer (CRDS), using the Picarro G2131-i Isotopic CO2 instrument at ETH Zürich. To apply an offline calibration, two concentration reference gases (399.6 ppmv, parts per million by volume, and 2000 ppmv CO2 in synthetic air) and two additional isotope reference gases (δ13C = −27.8 ‰ and −2.8 ‰ VPDB) were used. Measurement uncertainty (2 SD) for pCO2 is <5 % of the measured value. Measurement uncertainty (2 SD) for δ13C is typically 0.3 ‰. At low pCO2 concentrations, the isotopic uncertainty can be higher due to lower instrument sensitivity (up to 1 ‰ at Forest samples).
For drip water δ13CDIC measurements, drip water was collected directly from soda straw stalactites on the cave ceiling using a 1 mL syringe to minimize the degassing effects. Additionally, to evaluate the degassing and equilibration evolution of drip water exposed to cave air, a few samples along the flow path on a flowstone were collected. The sampled water was injected into He-flushed glass vials (Labco Exetainer®) prepared with 150 µL pure phosphoric acid, following the procedure of Spötl et al. (2005). Samples were shipped to ETH Zürich and measured within a week of collection using a Thermo Fisher Scientific GasBench II, equipped with a CTC autosampler and coupled to a ConFlo IV interface and a DELTA V Plus mass spectrometer. The δ13CDIC measurement uncertainty (1 SD) was typically in a range of ±0.18 ‰ or lower. Two in-house-calibrated sodium bicarbonate powders (−4.66 ‰ and −7.94 ‰ VPDB) were used for standardization. Linearity and signal intensity effects were considered.
Several drip waters were analyzed for radiocarbon with the MICADAS gas ion source at ETH Zürich (Ruff et al., 2007). Samples were purged with He (99.96 % purity) under a flow of 80 mbar min−1. Then, 200 µL of H3PO4 (85 %) were added to the Labco vials, and the CO2 was introduced to the gas ion source using a carbonate handling system (CHS). The International Atomic Energy Agency (IAEA)-C1 (14C dead carbonate standard) was used as blank material, and the National Institute of Standards and Technology Standard Reference Material (NIST SRM) 4990C oxalic acid (OXAII) was used for standard normalization and to check the stability of the measurement. A coral standard (F14C = 0.9447) was used as reference material. If we assume that the freshly respired soil carbon has F14C = 1 (fully modern), then the dead carbon fraction (DCF) can be estimated by the following:
since after percolating through the karst and dissolution of bedrock containing dead carbon the F14C of drip water is reduced, resulting in a higher DCF. We evaluate this assumption further in Sect. 5.
The oxygen and hydrogen isotope composition of drip water was determined from drip water aliquots directly sampled in 3.5 mL Labco vials. By recording the time until the vial was filled, a drip rate (mL min−1) was determined; a normalized drip rate was derived by comparing the drip rate at each site to the maximal drip rate for that site. The samples were measured on a Picarro L2130-I Isotopic H2O vaporization instrument at ETH Zürich. A sample standard bracketing method was applied, using three in-house water standards (Mediterranean Sea water, with 11.8 ‰ δD and 2.01 ‰ δ18O, Lake Zurich water, with −76.4 ‰ δD and −10.94 ‰ δ18O, and Siberian water, with −264.7 ‰ δD and −33.95 ‰ δ18O), which were calibrated relative to the IAEA-certified standards (SLAP2, GISP, and VSMOW2b). Seven replicates were measured for each sample, where only the last four were used to determine the isotopic composition to minimize memory effects. Measurement uncertainty (1 SD) is lower than 0.10 ‰ for δ18O and 1.15 ‰ for δD. We compare drip water variation with published rain isotope analyses for previous years (Moreno et al., 2021), since no Global Network of Isotopes in Precipitation (GNIP) monitoring at nearby stations is available for the interval of our drip water monitoring.
For elemental analysis, drip water was collected directly in 2 mL Eppendorf tubes which were previously cleaned in a 5 % HNO3 acid bath and rinsed several times with Milli-Q® water to minimize the vial contamination. To avoid contamination from the metal syringes used in DIC sampling, water for these samples was allowed to drip from the soda straw directly into the tube. Unlike the DIC sample, the water therefore experienced some PCP at the tip of the soda straw. To avoid in-vial calcite precipitation, tubes were filled in the cave with no headspace and sealed. In the lab, drip water was centrifuged to separate any particulate matter, after which 500 µL of the supernatant were transferred into Teflon vials and acidified with 15 µL high-purity (double-distilled) 65 % HNO3 to bring the sample to match the matrix of the standards (2 % HNO3). This reduces clogging of the ICP-MS nebulizer related to water surface tension and prevents any in-vial calcite precipitation.
In-house trace element standards were prepared using certified mono-element standards (ISO 17034 certified reference material by Inorganic Ventures) mixed in a 2 % HNO3 matrix to yield multielement calibration standards covering the range of drip water chemistry. Drip water trace elements were measured on an Agilent 8800 QQQ (triple quad) ICP-MS at ETH Zürich. The following list of 16 elements is well above the level of quantification (LOQ): Li, Na, Mg, Al, Si, S, K, Ca, Cr, Mn, Cu, As, Sr, Y, Ba, and U (Table A1). Although K is seldom reported in trace element studies due to tailing of the ICP carrier gas (40Ar) on 39K and interference with 38Ar1H, analysis in collision mode with H2 reduces the Ar tailing so that measured 39K intensities are stable and several orders of magnitude above LOQ. Likewise, intensities of 25Mg and 55Mn are measured in H2 collision mode to improve the measurement stability and to avoid 40Ar15N+ interferences, respectively. Helium collision mode gives the most stable measurements for 23Na by reducing the 46Ca interference. 32S and 29Si are mass shifted in O2 reaction mode (+16 mass units) to reduce interferences by O2 and N2, respectively. Other elements are measured without any collision/reaction gases. Measurement uncertainties are typically in the range of a few percent relative standard deviation (RSD; three replicates). The range of elemental concentrations spans from low pptv (parts per trillion by volume; pg g−1) levels (e.g., Y, Cr, or Cu) up to tens of ppmv (µg g−1) levels (Na, S, Mg, Si or Ca). In the figures (e.g., Fig. 4), we illustrate trace element (TE) data above LOQ (Table A1).
Rock samples were collected from fallen blocks of limestone on the floor throughout the cave and in some locations on the cave wall (Table A2). From each hand specimen, powder was extracted with a 1 mm dental drill and homogenized before dissolution in 2 % HNO3 to analyze trace elements with an Agilent 8800 QQQ-ICP-MS at ETH Zürich using the intensity ratio calibration (de Villiers et al., 2002) and in-house multielement standards of varying trace element to Ca ratios but with Ca concentrations matched to samples (400 ppmv). Aliquots of the rock powder were measured for stable isotopes (δ13C and δ18O) on a Thermo Fisher Scientific GasBench II, equipped with a CTC autosampler and coupled to a ConFlo IV interface and a DELTA V Plus mass spectrometer. ISOLAB B and MS2 (carbonate reference material) were used for standardization, yielding uncertainties typically less than 0.1 ‰.
Principal component analysis (PCA) was applied using MATLAB after applying a z-score normalization to elemental concentrations of individual drip sites. Elements yielding sub-LOQ values were defined as 0 to compute the PCA. This multidimensional (cor 1, PC 2, …, PC n) element controls the chemical signal and allows the grouping of elements with similar behavior. Similar analysis has previously been used in speleothem studies (e.g., Borsato et al., 2007; Fairchild et al., 2010; Treble et al., 2016).
We estimate relative variations in PCP at each drip site prior to our drip water collection, using the ratio, since we infer that both elements (Sr and Ca) are primarily bedrock dissolution controlled. To avoid the potential influence of marine salt contributions in this ocean proximal cave, we intentionally do not use the more commonly used ratio as a PCP proxy. Assuming congruent dissolution, the ratio increases with increasing Ca loss due to PCP. As a relative index of PCP, we calculate the following index:
of each specific drip site is the least affected by PCP and is defined as having a index of 1, and the index describes the percentage of residual Ca. For example, a value of 0.8 means that 80 % of the reference Ca remains in solution and 20 % is lost to PCP.
We employ the CaveCalc model (Owen et al., 2018) to explore the processes responsible for δ13CDIC control. By comparing simulations and monitored data, we can rule out potential drivers controlling δ13CDIC. Furthermore, we applied the I-STAL model (Stoll et al., 2012) using drip water Ca concentrations, cave air conditions (pCO2 and temperature), and drip intervals to simulate a full annual cycle of stalagmite growth at the perennially monitored sites. I-STAL simulates stalagmite growth using the kinetic model of Dreybrodt (1999), which is based on the oversaturation defined by the difference between the measured Ca concentration and the Ca concentration at equilibrium with CaCO3 at the cave temperature and atmosphere. The resulting average deposition rate of calcite was converted into an instantaneous vertical growth rate (µm yr−1).
4.1 Cave air
During the monitored period, the relative humidity is always higher than 90 % (Table 1). The cave temperature shows very limited seasonal variation (Fig. 2a), varying by less than 1 ∘C at a mean temperature of 13.9 ∘C deep in the cave (Table 1). This is slightly colder than the 20-year average temperature of Llanes weather station (14.7 ∘C). Closer to the cave entrance, where the exchange with outside air is greater (Entrada, Snowball, and Gloria), temperature ranges from 13.5 to 15.2 ∘C.
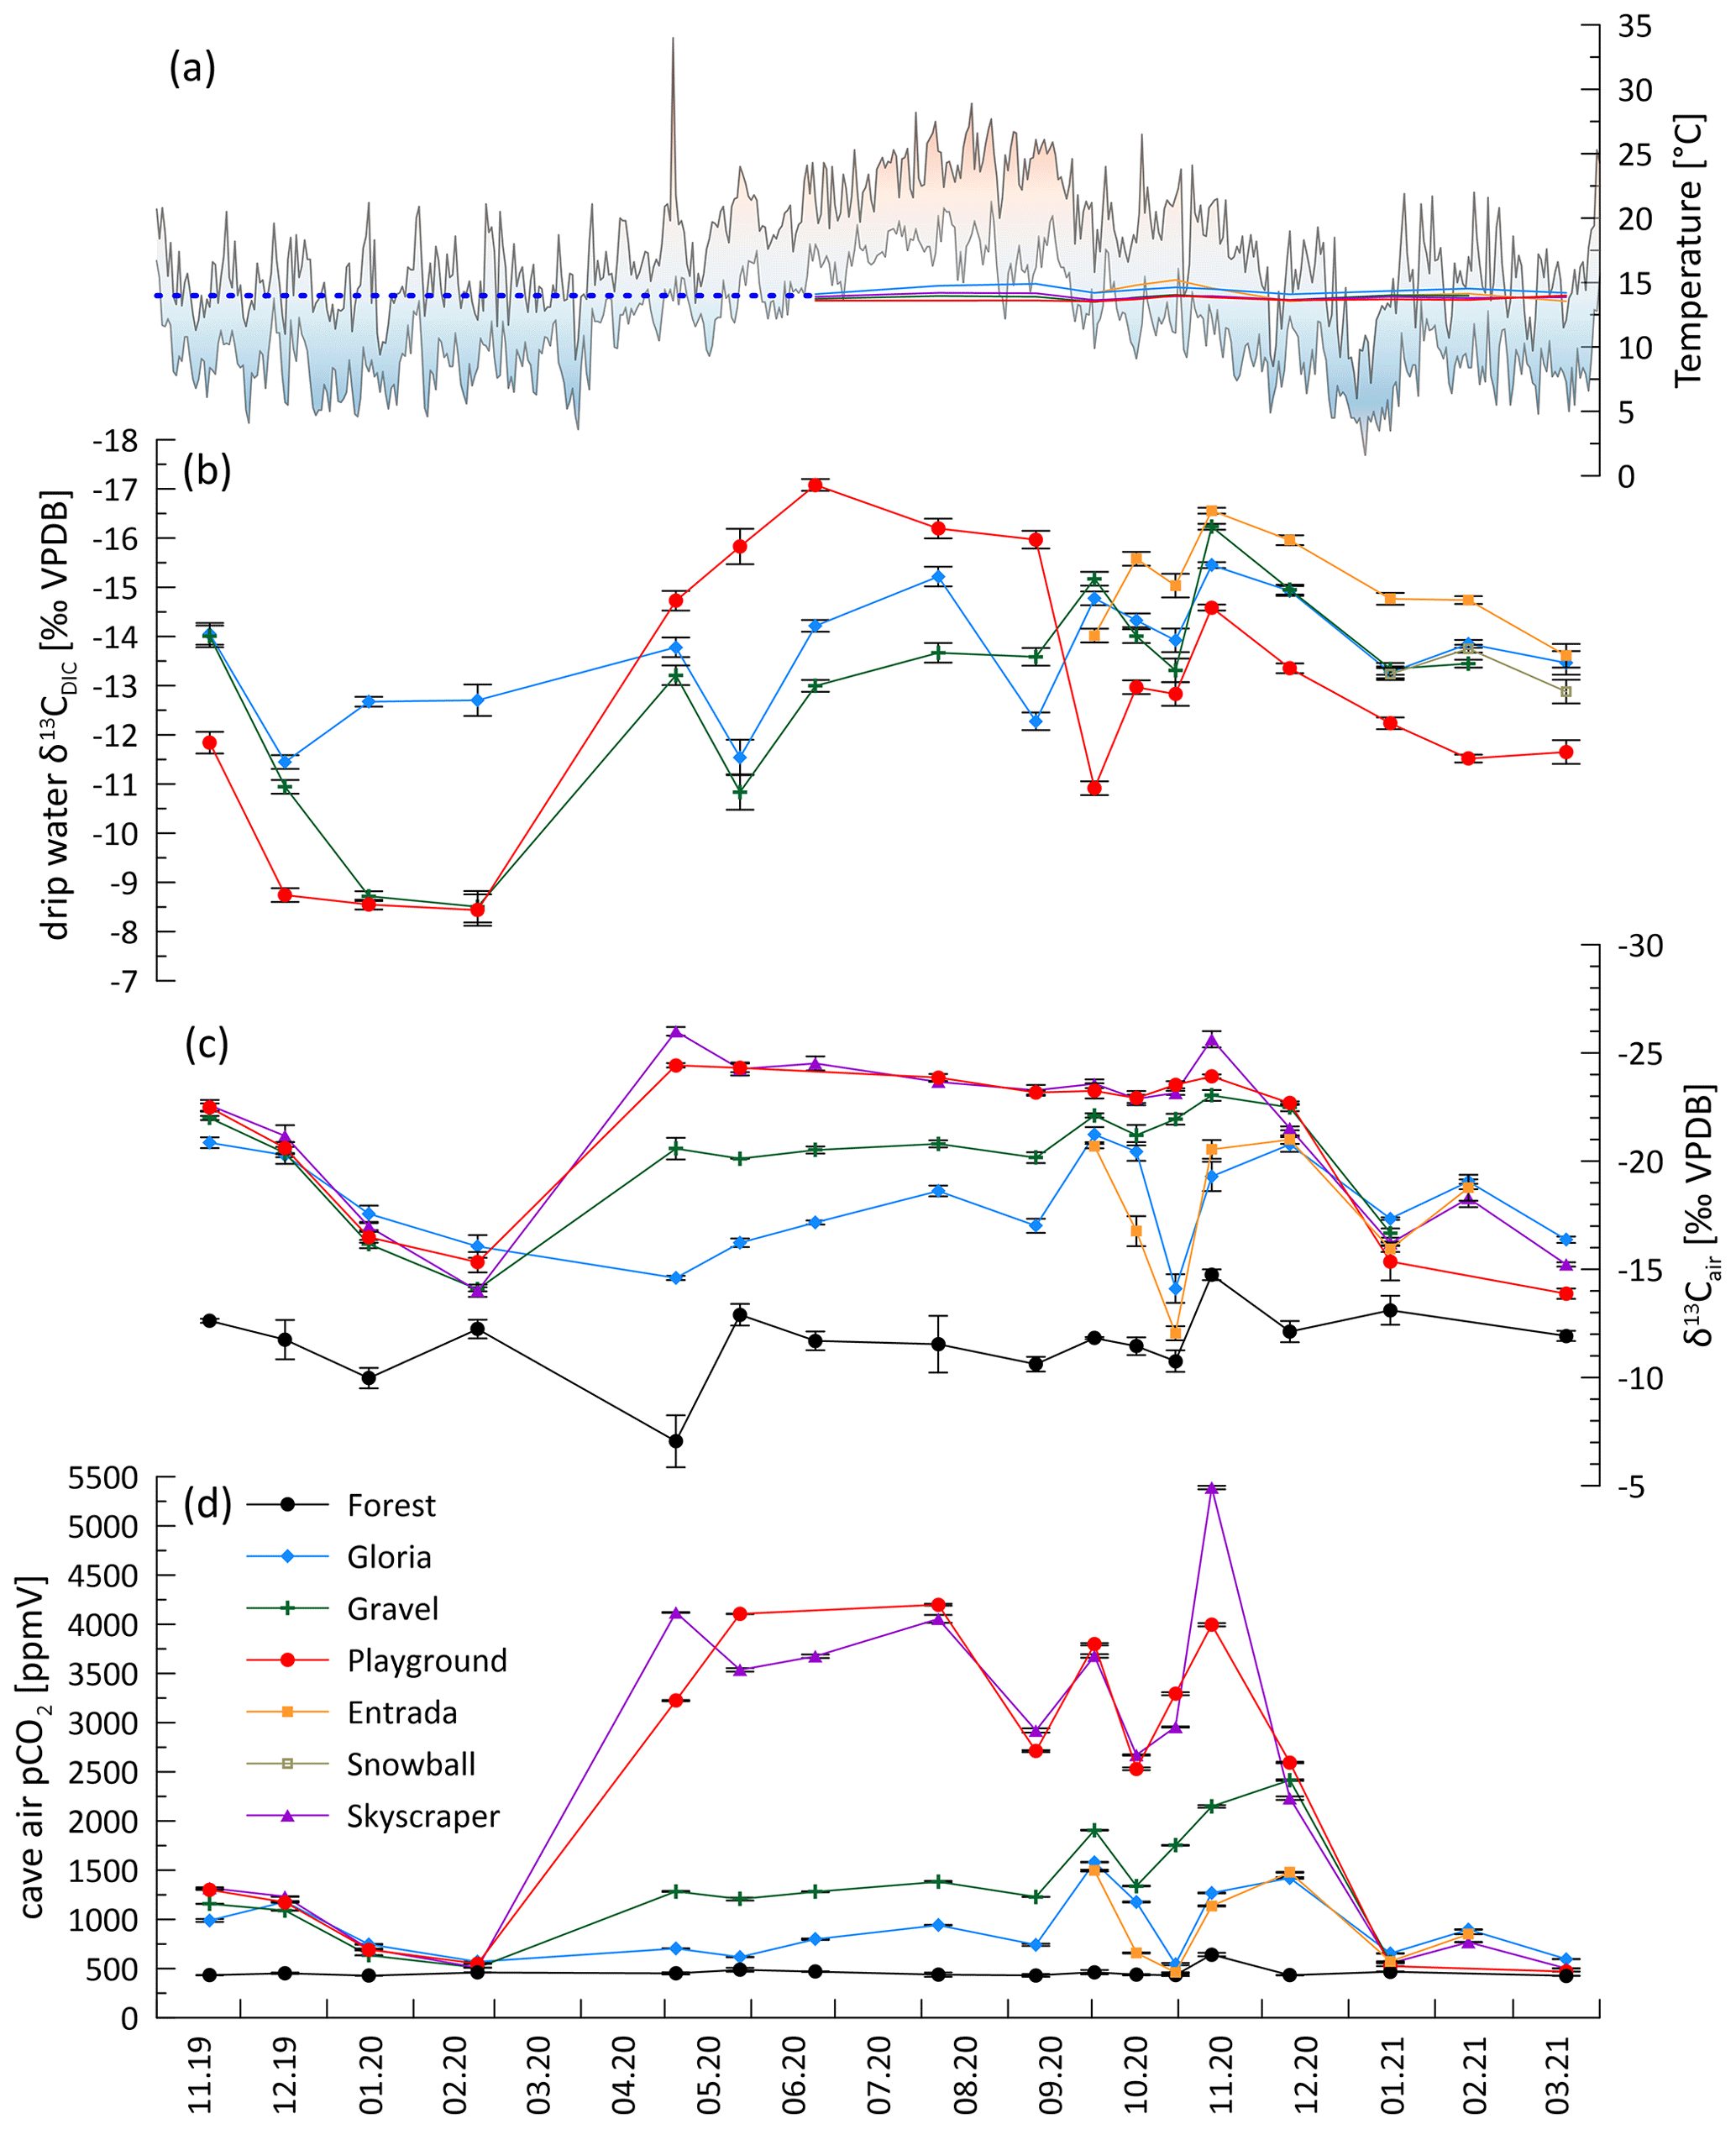
Figure 2Cave air conditions and drip water DIC over time. (a) Daily outside temperature range (min–max) in Llanes (AEMET, 2021) and cave air temperature. The dashed blue line extrapolates the constant cave air temperature. (b) Drip water δ13CDIC. (c) Cave air δ13Cair. (d) Cave air pCO2. Note the reversed y axes for panels (b) and (c).
Cave air CO2 concentration (pCO2) increases in spring and remains high in the summer and autumn months before dropping to ambient air levels in winter when atmospheric air temperature is similar to or lower than the cave air temperature and density differences that drive the exchange of cave air. Coincident with the differing external air temperature evolution, the cold season pCO2 decline was earlier in 2019 than 2020 but in both years coincides with outside air temperatures dropping below cave air temperature (Fig. 2a and d). Between December 2019 to February 2020 and December 2020 to January 2021, the cave air pCO2 dropped to almost outside air conditions (black line in Fig. 2d; sampled in the surrounding forest). However, contrasting seasonal temperature changes in autumn led to different seasonal CO2 patterns in some sites. At Gravel and Skyscraper, CO2 increased and reached its highest pCO2 in November and December 2020 (>5000 ppmv), following an initial drop in September and October 2020, whereas in November 2019 the pCO2 reached only 1320 ppmv. Topographically lower positions in the cave accumulate CO2, and concentrations reach 4000–5400 ppmv (Skyscraper and Playground). Topographically higher portions of the cave feature maximal pCO2 of 1500–2500 ppmv (Gravel, Gloria, and Entrada).
A seasonal structure is evident in the carbon isotopic composition of cave CO2 (δ13Cair; to distinguish from δ13CDIC). While the measured air outside the cave remains fairly constant over the year (average of −11.6 ‰; black line), cave air evolves to very negative δ13C values in spring and remains very negative during the summer months. The most negative δ13Cair values are reached at locations with high pCO2 deeper in the cave (Skyscraper, with −26.0 ‰ in May 2020). The δ13Cair approaches the outside air conditions between December and February 2020 or January 2021 in both monitored winters, coincident with the cave air CO2 concentration decrease. The timing of the autumn transition differs among the sites.
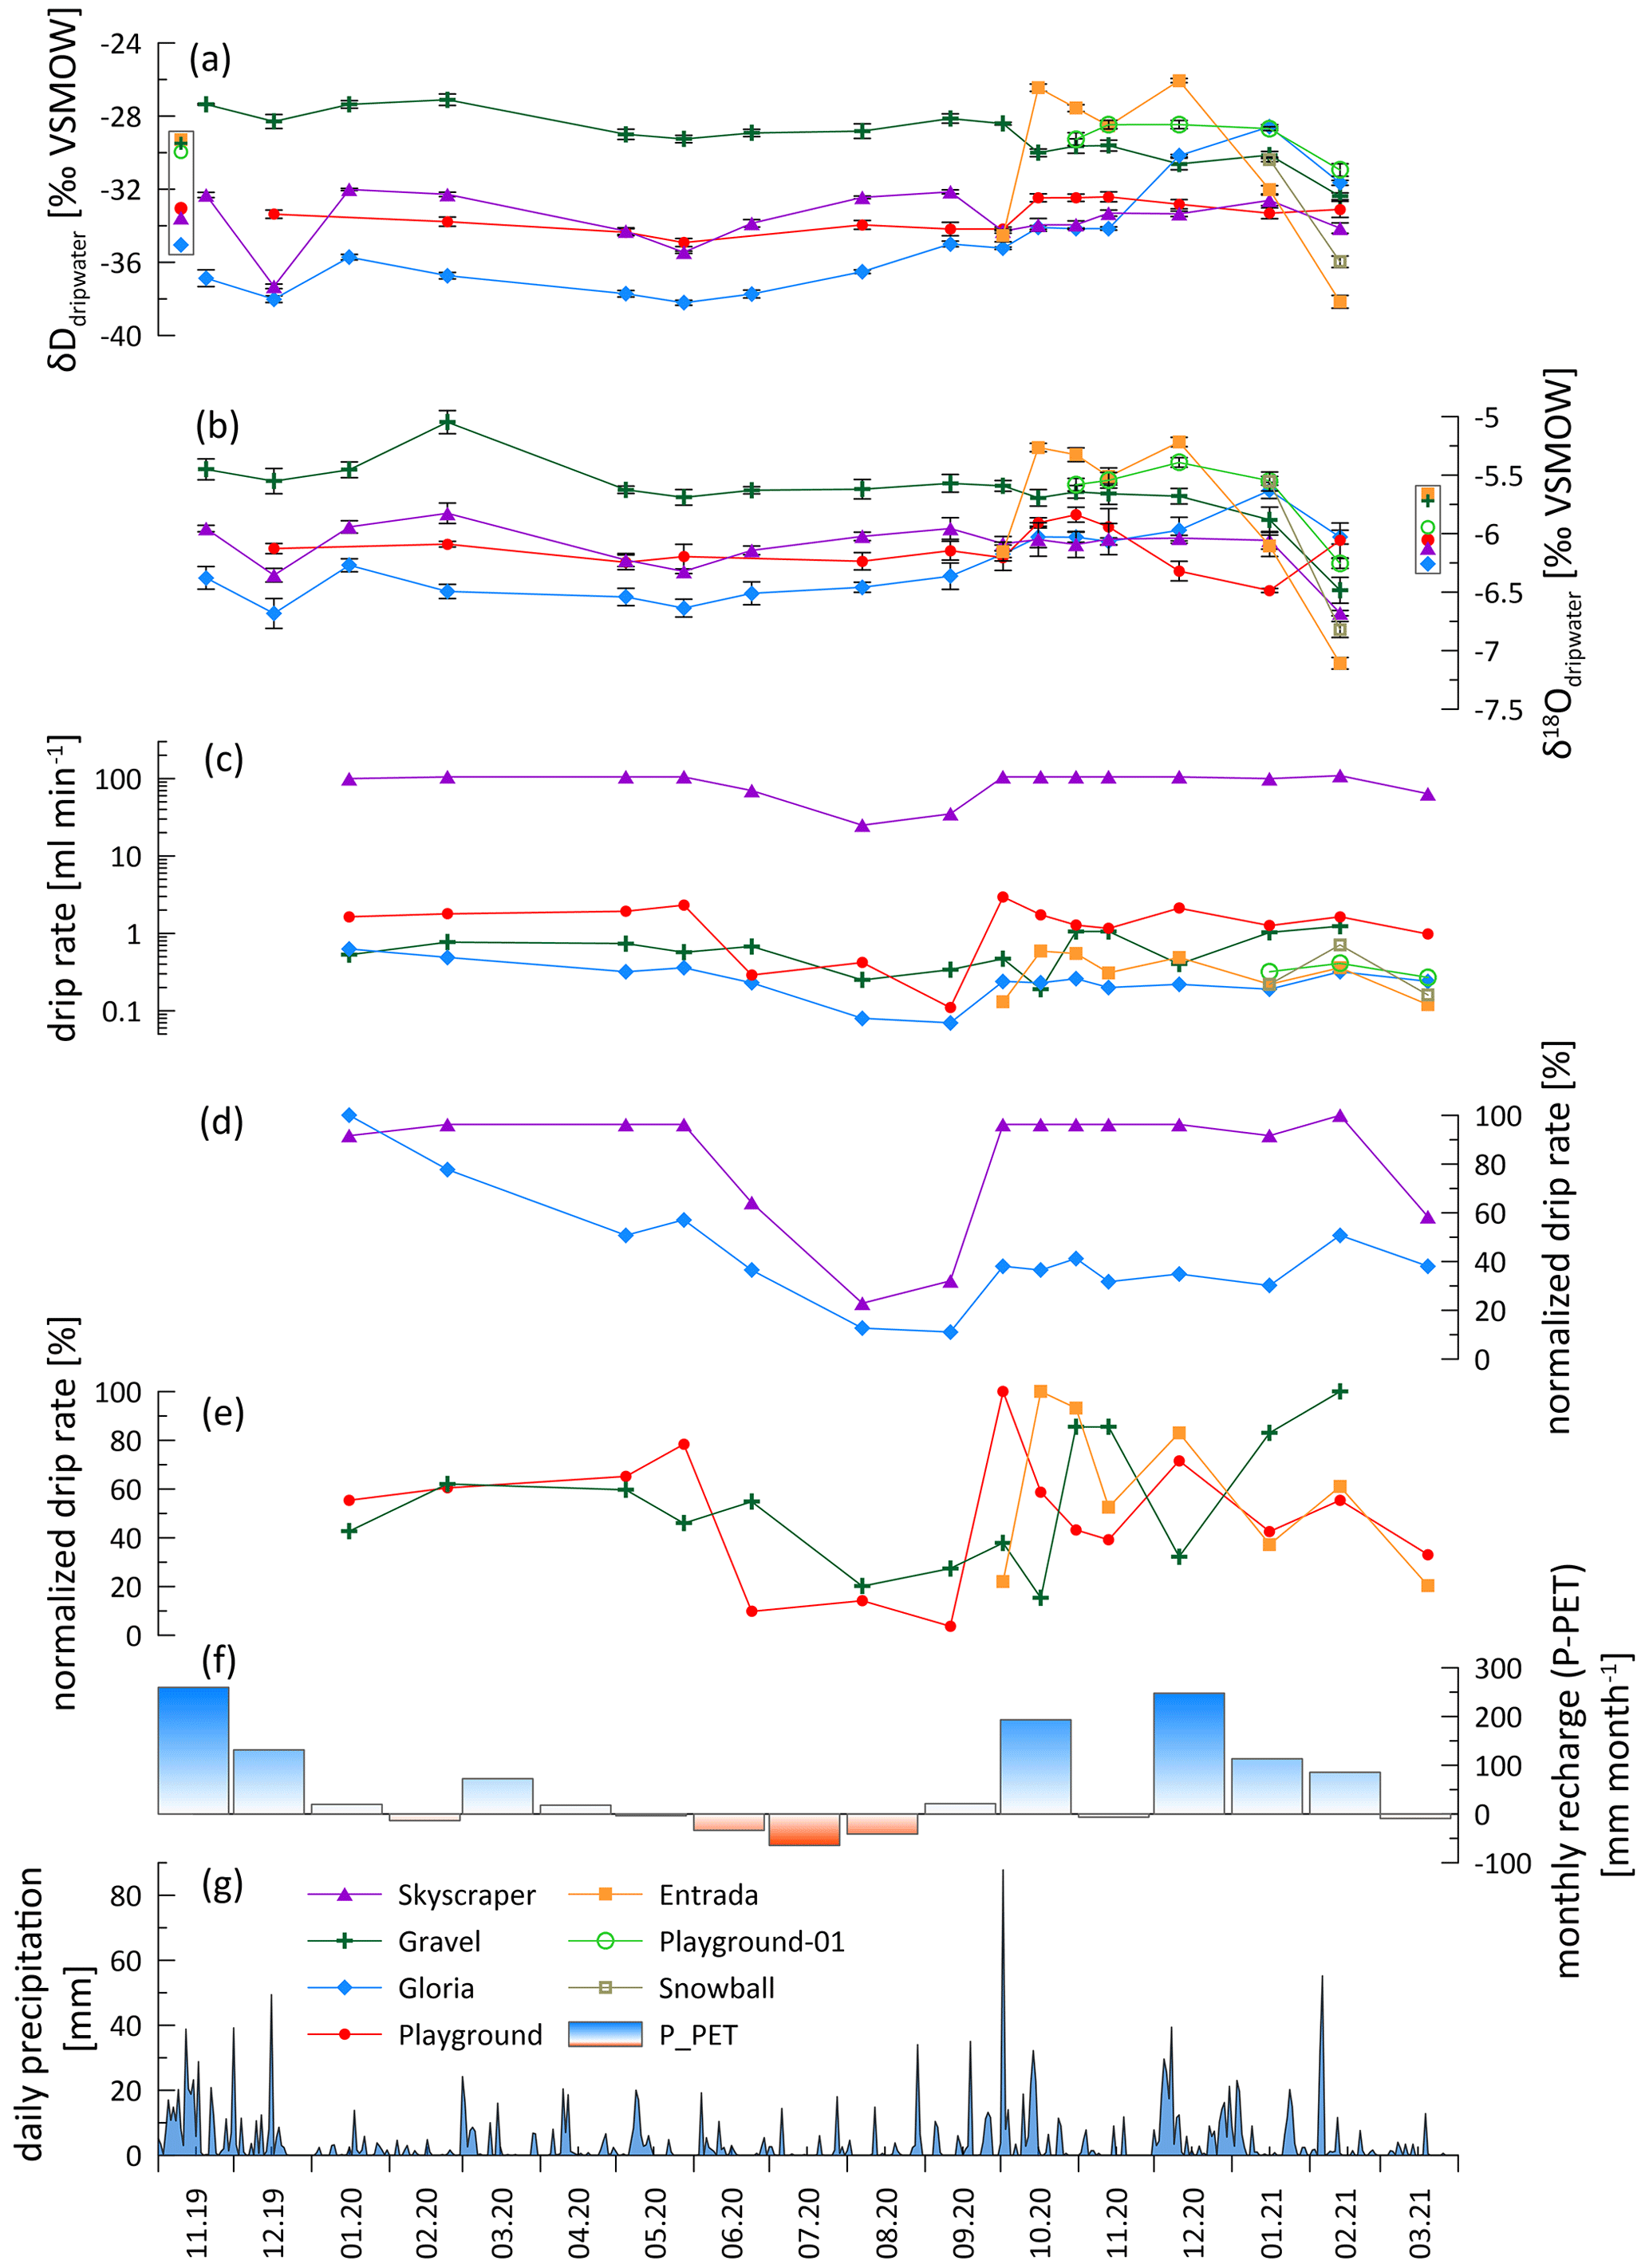
Figure 3Hydrological conditions and water chemistry. (a) Hydrogen isotopic drip water composition (δDdripwater). (b) Oxygen isotopic drip water composition (δ18Odripwater). (c) Absolute drip rate (log scale). (d) Normalized drip rate of less responsive drip sites (Skyscraper and Gloria). (e) Normalized drip rate of strongly responsive drip sites with different lags to recharge (Playground, Gravel, and Entrada). (f) Monthly recharge calculated by subtracting potential evapotranspiration (PET) from precipitation (P). (g) Daily precipitation recorded in Llanes (AEMET, 2021). In panels (a) and (b), the data points in a box next to the y axis represent the amount-weighted average values of each drip site.
4.2 Dissolved inorganic carbon (DIC) of drip water
The drip water δ13CDIC varies seasonally, with the most negative values (−17.0 ‰) being observed in the summer and autumn months. In winter, the δ13CDIC generally increases (to −8.4 ‰ at Playground; Table 1; Fig. 2b). The maximum seasonal contrast can exceed 7 ‰ (Playground, with 8.6 ‰and red in Fig. 2; Gravel, with 7.7 ‰and green in Fig. 2), whereas the seasonal range is modest at other sites (4.0 ‰ at Gloria).
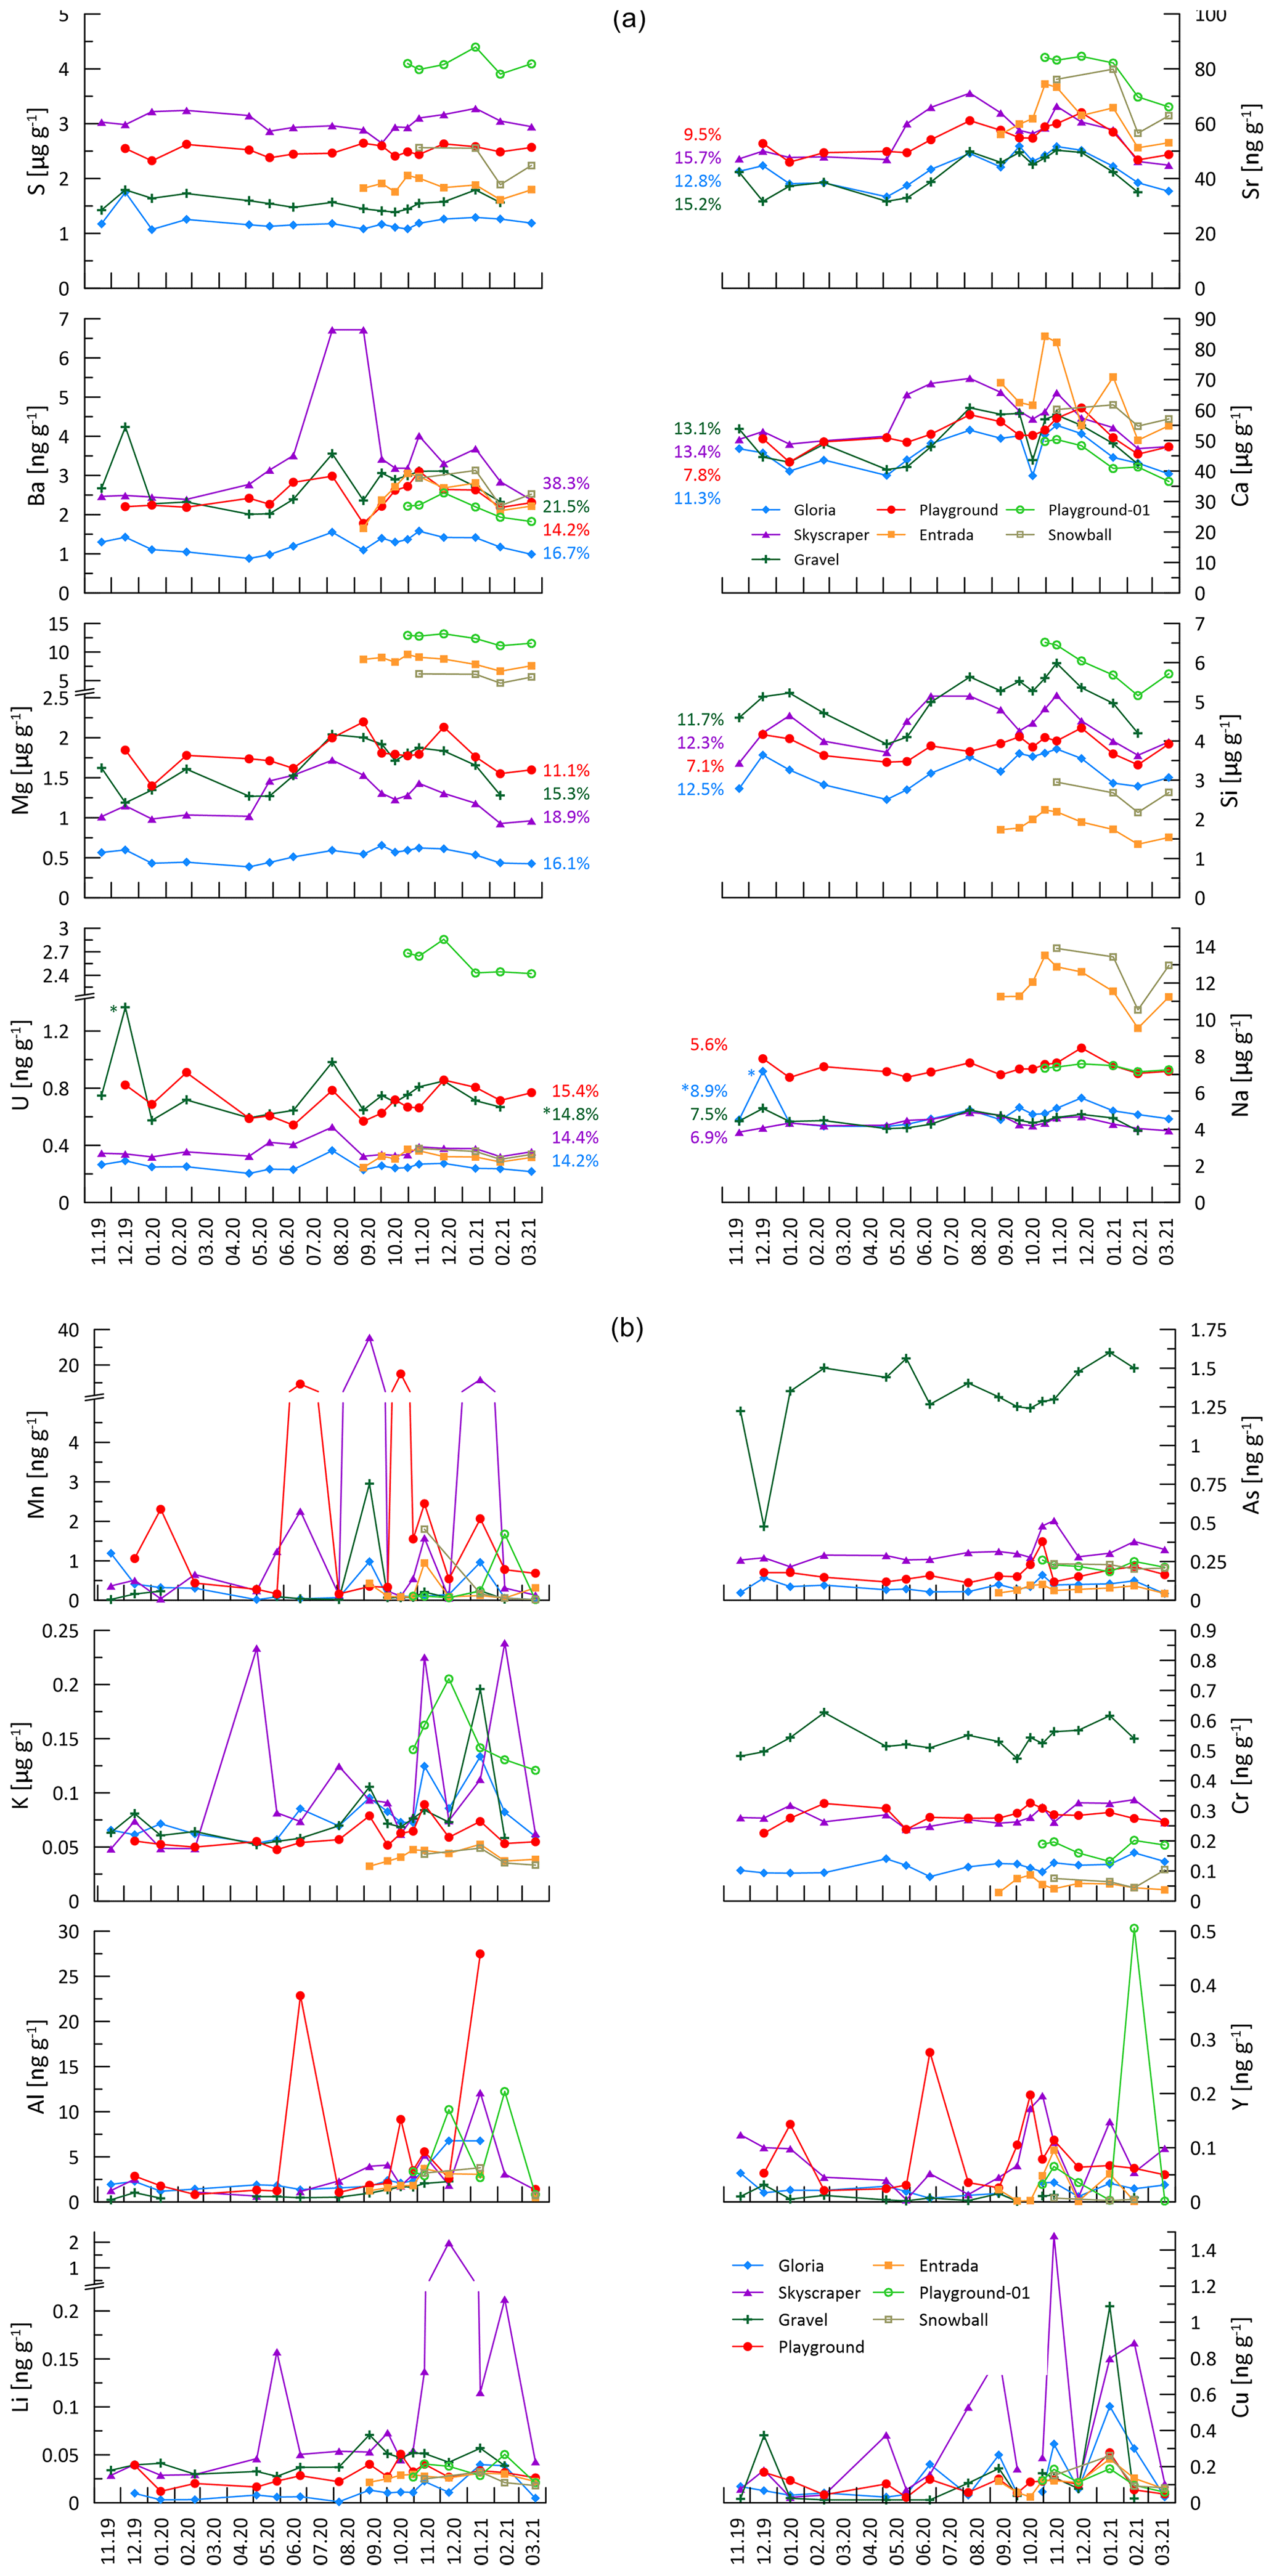
Figure 4Analyzed elemental concentration. In the first part of this figure (PC 1 elements and sulfur), the colored numbers give the percent RSD of the variation to give an impression of how much the seasonal amplitude changes. Numbers with an asterisk are cleared of outliers (outliers are >25 % higher than second-highest concentration). The second part of the figure contains the spikier elements controlled by principal components (PCs) 2 and 3. Note that concentrations can be given in ppmv (µg g−1) or in ppbv (parts per billion by volume; ng g−1). Missing data points denote points below LOQ.
4.3 Hydrological conditions
Although there are large differences (several orders of magnitude) in the absolute drip rates across the various drip sites (Table 1; Fig. 3d), all sites exhibit a similar seasonal pattern of variation and a similar fractional reduction in drip rate in the dry season (Fig. 3d and e). In summer, most drip sites drop to 10 %–25 % of the highest discharge, coincident with the lower rainfall (P) and higher temperatures, which maximize potential and actual evapotranspiration (PET; Fig. 1d). While the calculated PET may overestimate the actual evapotranspiration (AET) and therefore could underestimate actual water balance, it nonetheless serves to illustrate the trend in seasonal variation in the water balance and avoids the uncertainties in assigning a single crop coefficient over a landscape of heterogeneous vegetation cover as required for AET. Recharge of the water reservoir potentially only occurs when the water balance is positive (Fig. 3e). However, persistent drip rates suggest that the water reservoir never dries out (Fig. 3d). There may be different timescales of response to recharge (P−PET) among sites; Playground and Skyscraper (red and purple, respectively) appear to respond more rapidly than Gravel (green; Fig. 3e and f).
4.4 Isotopic composition of the drip water
Drip water δ18O shows limited variation for most individual drip sites (Fig. 3). All sampling sites (except Playground) follow a trend towards more negative values in the last 2 months of the monitoring period. At Skyscraper and Playground, δ18O variability is 0.9 ‰ (−5.8 ‰ to −6.7 ‰) and 0.7 ‰ (−5.8 ‰ to −6.5 ‰), respectively, with no further seasonal pattern. Contrasting temporal patterns in δ18O and δD occur at Gloria, which features the most negative values at the start of the monitoring in winter 2019/2020, and Gravel, which features more negative values later in the monitoring period in winter (2020/2021). At the start of monitoring, Gravel δ18O is 1.5 ‰ more positive than Gloria, but the drip water at the two sites converges towards the end of monitoring.
The short time series of Entrada reveals higher-amplitude variability in both isotope ratios (−5.2 ‰ to −7.1 ‰ δ18O; −26 ‰ to −38 ‰ δD). Within the short data sets of Playground-01, we observe a contrasting trend and higher variability compared to the nearby Playground drip site (opposite trend in δ18O and δD; Fig. 3a and b). In general, δ18O and δD are more stable during the dry season, suggesting no change in the individual water reservoir by recharge.
4.5 Trace elements in drip water and bedrock and temporal variation in PCP
Of the 16 trace elements (TEs) analyzed in this study, P, Fe, Co, Ni, Zn, Cd, and Pb did not yield sufficient detectability (mostly below LOQ) and are not discussed further. At a given drip site, concentrations of many elements show seasonal variability (e.g., Ca, Si, and Sr), whereas others feature event-scale peaks (e.g., Mn, Y, and Cu) independent of the seasonal cycle. The absolute concentration range of elements Mg, S, Na, and U differs significantly among different drip sites.
In the PCA for each of the four main drip-water-monitoring sites (Gravel, Gloria, Skyscraper, and Playground), the first three principal components (PCs 1–3) explain at least 60 % of the signal variation (up to 75 % for Gravel) and comprise similar elemental loadings (Fig. 5). Coefficients of PCs 1–3 are controlled by similar groups of elements, with a consistency that suggests that they are controlled by the same environmental factors (Fig. 5). The elements Na, Mg, Si, Ca, Sr, Ba, and U are strongly controlled by PC 1 (28 %–40 % of total variation). PC 2 explains about a fifth (18 %–22 %) of the trace element signal variation and is controlled by elements such as Li, Al, K, Cr, Mn, Cu, As, and Y. The third component (PC 3) accounts for 10 %–18 % of the elemental concentrations and is most associated with S, Cr, Cu, and As. There are exceptions to these trends (e.g., poor associations of PC 2 with Li at Skyscraper, PC 2 with Cu at Gravel, and PC 3 with Cu at Gloria and Skyscraper), and discussing every single element at the individual drip sites would go beyond the scope of this study, so we focus on interpretations where at least two drip sites show strong element-specific PCs.
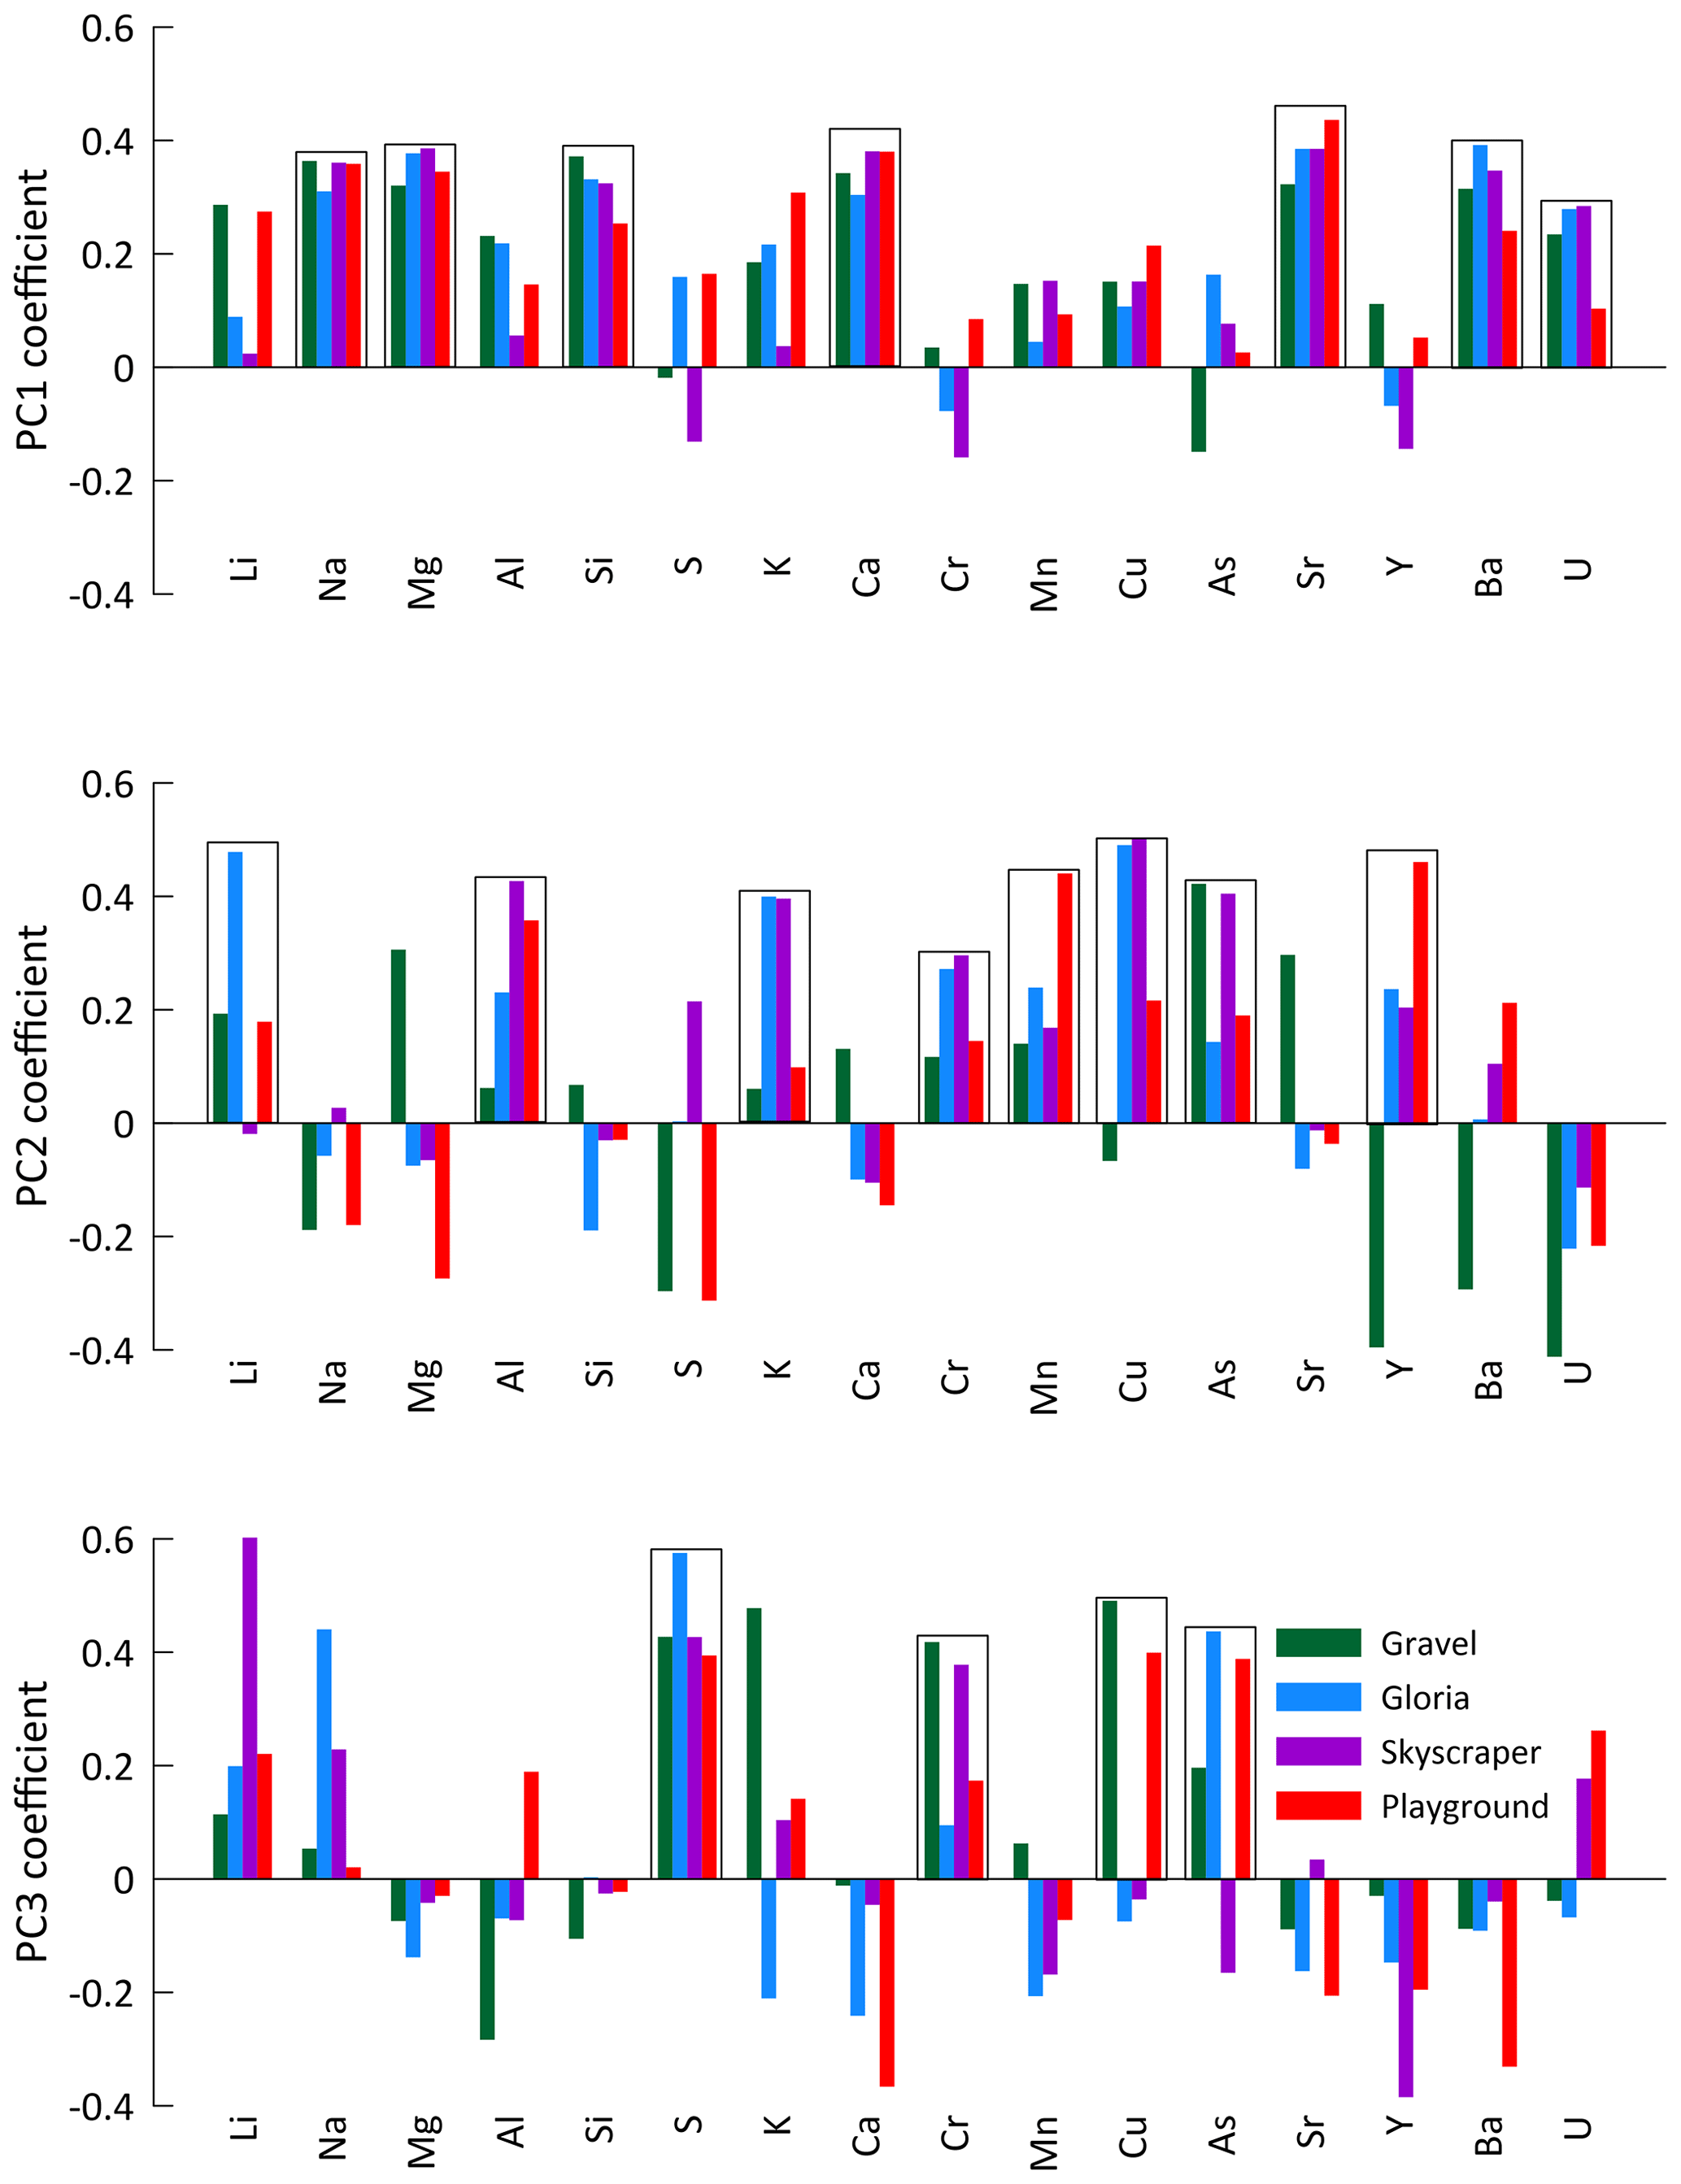
Figure 5The first three principal components (PCs 1–3) of the principal component analysis (PCA) applied to the element concentration of drip water from individual drip sites. Boxes indicate the elements of generally similar behavior controlled by specific PCs.
Increased PCP, indicated by a lower index, occurs in autumn and early winter (Fig. 6b). Gravel and Gloria exhibit the strongest variation in the degree of PCP, with index values decreasing down to 0.60, indicating 40 % loss of Ca relative to the reference. Playground and Skyscraper reveal detectable Ca loss up to 15 % in autumn and early winter. Frequently, higher PCP has been attributed to a slower drip rate, which allows the drip water to degas longer and precipitate while hanging on the cave ceiling (stalactite formation). However, in our drip water data set, no relationship between the drip rate and the index is found, and the months with the lowest index paradoxically happen to be months with increased drip rates (Fig. A2a–c). PCP also does not increase during negative P−PET so is not driven by an increase in air-filled voids in the karst system caused by the seasonal water deficit. Figure A1 indicates a close relationship between and , suggesting both elements are affected by PCP. If using index instead of index, then a similar temporal pattern and amplitude of Ca loss is revealed.
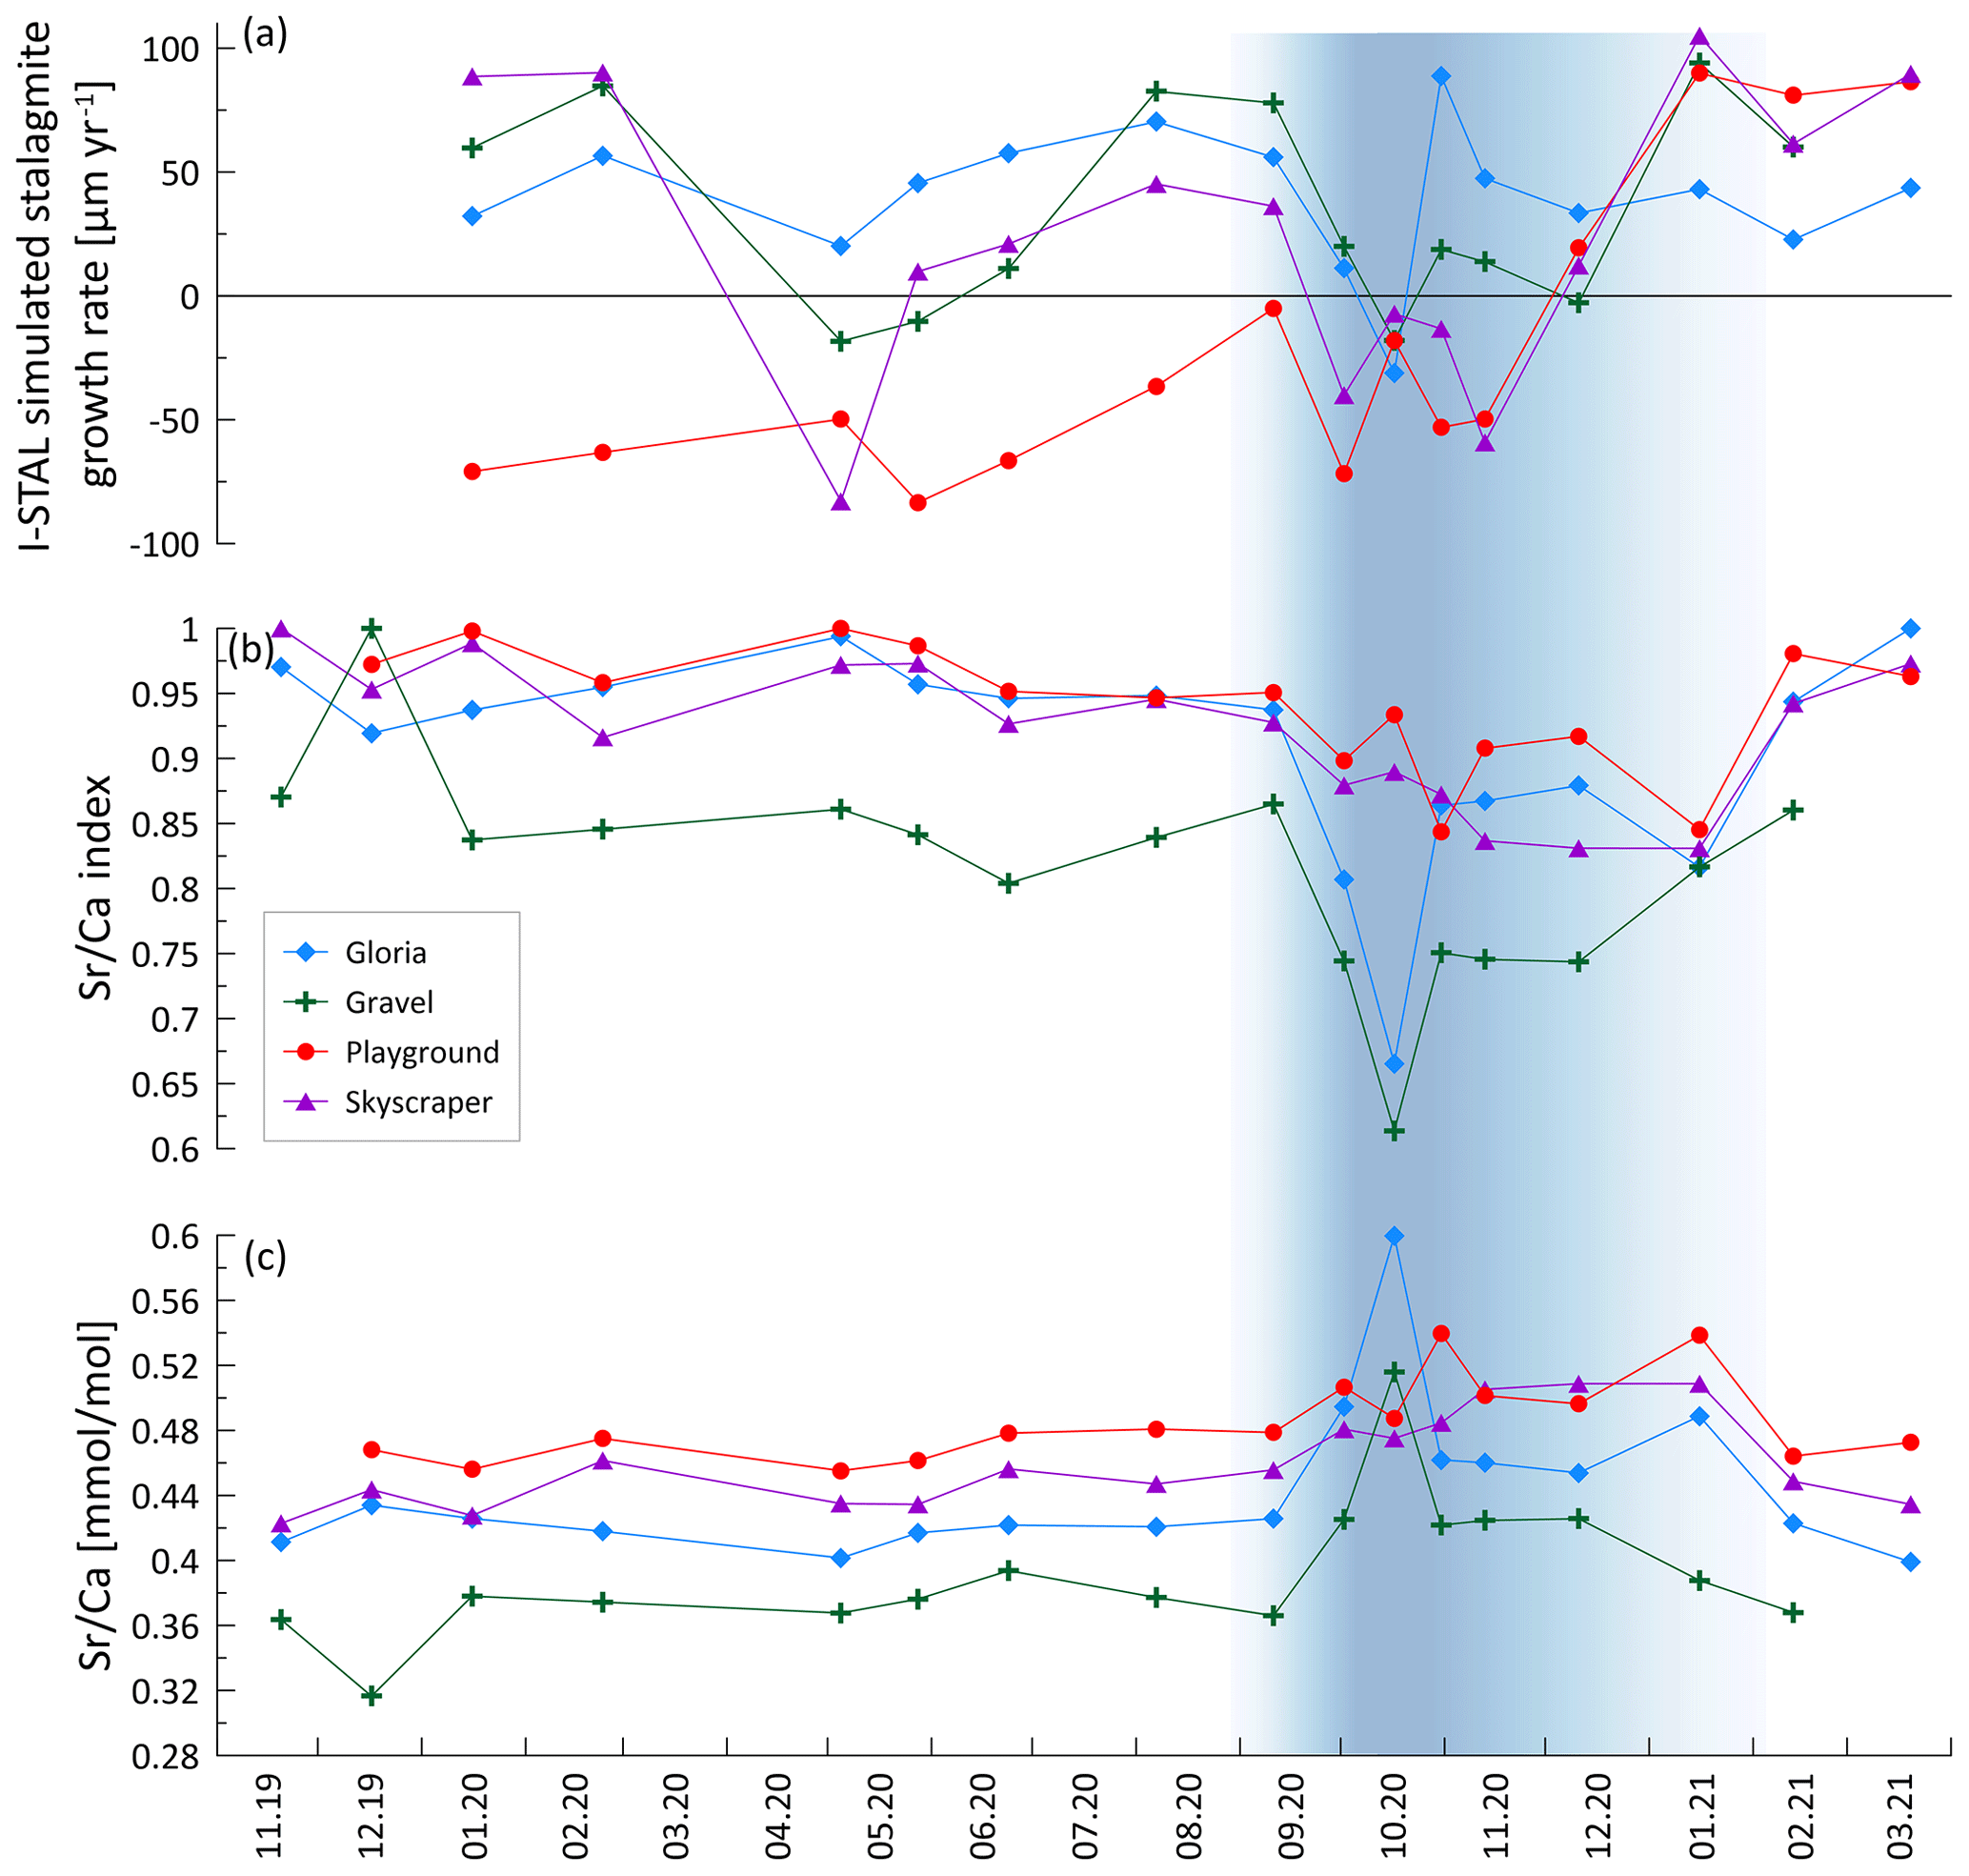
Figure 6Prior calcite precipitation (PCP) indicated by and its impact on the growth rate. (a) I-STAL-simulated stalagmite growth rate, (b) index, and (c) ratio of measured drip water. The blue band indicates a phase of intensified PCP in some drip locations likely contributing to reduced stalagmite growth.
Potential stalagmite growth rate simulated with I-STAL using measured cave conditions suggests a seasonally biased growth in summer and winter, with intervals of reduced or inhibited growth in spring and autumn (Fig. 6a). Growth inhibition in autumn coincides with increased PCP, as suggested by a decreased index (blue shading in Fig. 6). Stalagmite growth simulated in I-STAL can reach up to 100 µm yr−1 and occasionally shows negative growth rates, suggesting growth cessation or, potentially, dissolution (undersaturation). In the case of Playground, simulations indicate growth in winter 2020/2021 but not winter 2019/2020 (Fig. 6a).
In bedrock sampled from fallen blocks throughout the cave, some elements exhibit a very high degree of spatial variation, at times exceeding an order of magnitude (Table A2). To compare drip water and bedrock, we use the ratio, which is relatively insensitive to the degree of PCP and/or additional sources (e.g., marine). Direct comparison of ratios of bedrock and drip water shows that some elements feature overlapping ranges in the bedrock and drip water (U, Ca, Li, and Cu; Fig. 7). Other elements such as Na, Si, and S have much higher ratios in drip water compared to bedrock, while Mg, Ba, As, K, and Cr are moderately enriched. Elements such as Al, Y, and Mn have much lower ratios in drip water than in the sampled bedrock.
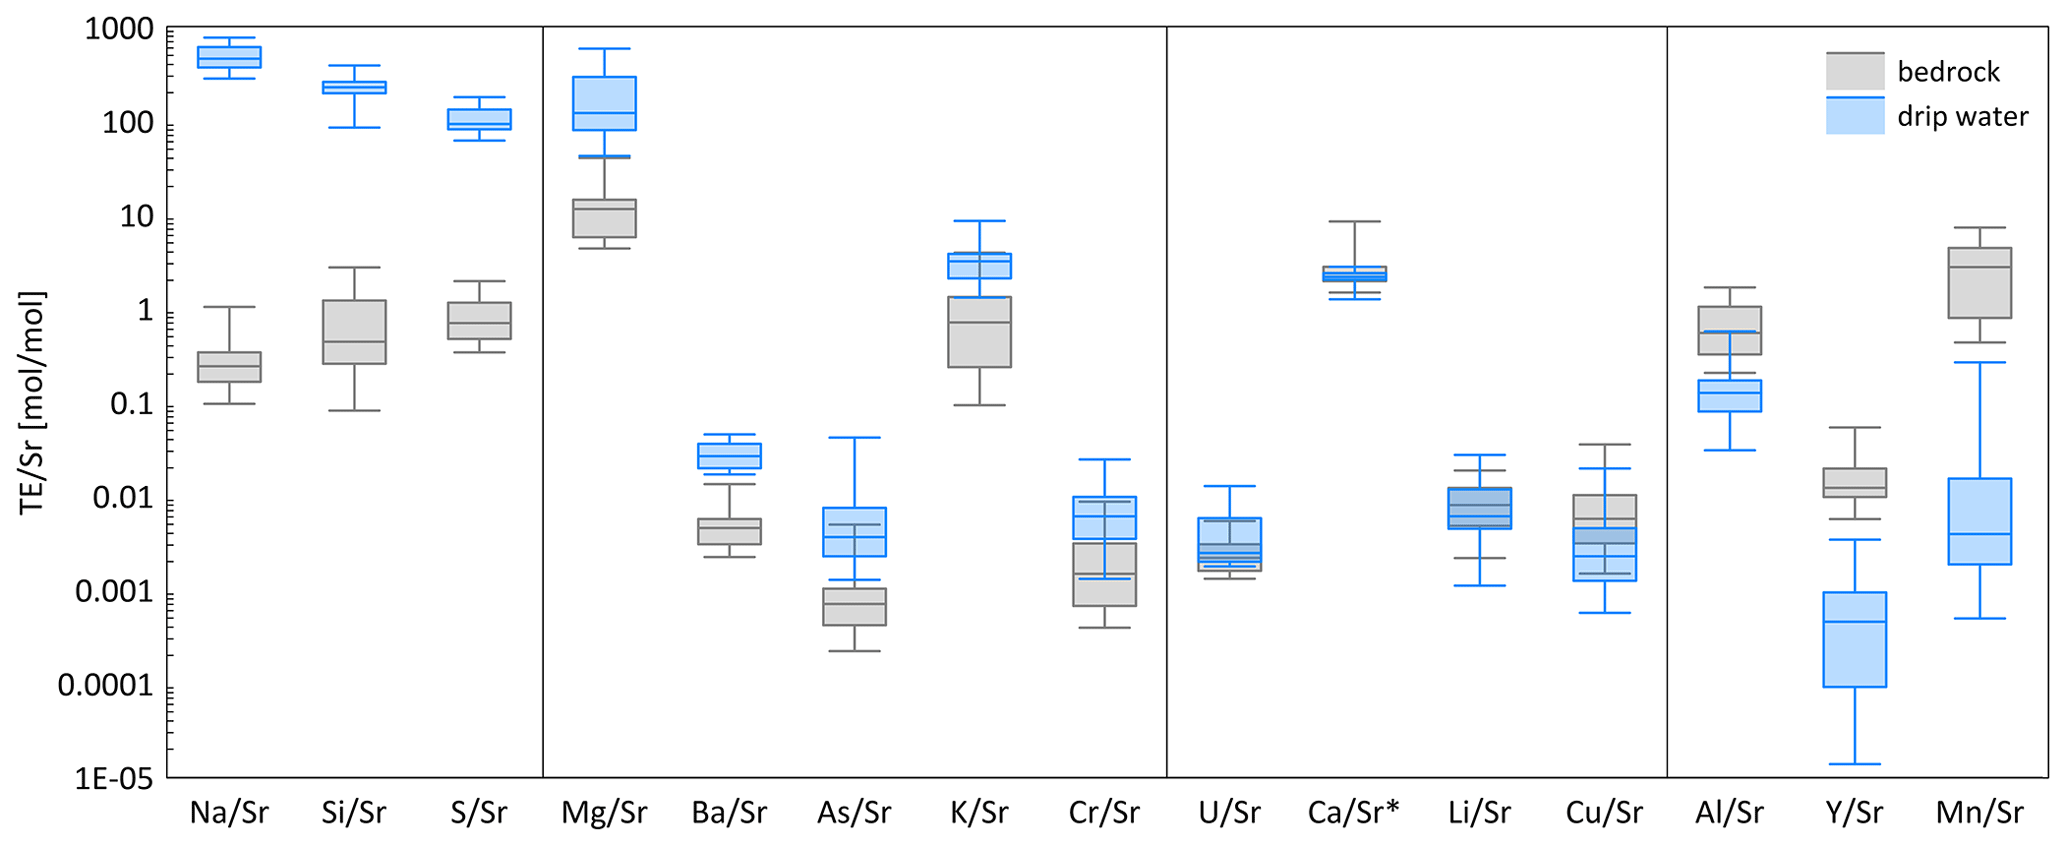
Figure 7Box-and-whisker diagram comparing measured ranges of bedrock and drip water ordered by the difference in median between bedrock and drip water. From left to right: enriched elements relative to bedrock (Na, Si, and S), moderately enriched elements (Mg, Ba, As, K, and Cr), congruent elements (U, Ca, Li, and Cu), and depleted elements (Al, Y, and Mn). * Note that the unit for Ca/Sr (in mol mmol−1) differs from the others.
5.1 Seasonal evolution of cave air composition and estimation of δ13C of the respired endmember
The maximum cave air pCO2 in summer and minimum in winter is consistent with the seasonal ventilation of the cave controlled by the density contrast between the cave and outside air, a process common to many caves in regions with significant seasonal temperature contrast (James et al., 2015). The cave pCO2 approaches exterior values during periods when the exterior temperature drops below cave temperature, triggering the inflow of external air through the cave entrance. In warm periods, when outside air is warmer than the cave, advection through the entrance is limited, and the cave air composition approaches that of the overlying soil and karst. Although the monitoring resolution is low, it suggests that the ventilation regime responds quickly to exterior temperature, typically within a few days to a week. We also see evidence of variations in the efficiency of ventilation within the cave due to cave morphology. In the warm periods, high CO2 preferentially accumulates in the lower, more isolated locations like Skyscraper and Playground. At the onset of ventilation (November–December 2020), decreasing CO2 concentrations are first attained in these lower galleries (higher-level locations remain high in pCO2), where dense air inflow from the exterior concentrates in the lower portions of the cave. These differences within the cave affect the degree of drip water oversaturation and the seasonality of speleothem growth in different cave sectors (see Sect. 5.4.2).
In addition to the ventilation effect, the CO2 in the cave may also be affected by variations in the CO2 concentration of the soil, which may not always covary with the exterior temperature. Although soil respiration rates generally are highest at higher temperatures, heterotrophic respiration also depends on the supply of labile organic matter and soil moisture (Krishna and Mohan, 2017). High cave pCO2 concentrations in mid-November 2020, despite exterior temperatures near the ventilation threshold, suggest a high CO2 supply from the soil/karst, which may reflect high rate of microbial degradation of recently fallen leaf litter in addition to optimal moisture conditions and mild temperatures for soil respiration (Krishna and Mohan, 2017). Detailed soil air sampling studies have the potential to elucidate the seasonal concentration and isotopic variations in this endmember but are beyond the scope of the present study.
As a result of the changing ventilation regime, δ13Cair of cave CO2 varies along a mixing line defined by the exterior atmosphere and the respired CO2 source in the soil and karst (Fig. 8). Using the measured forest values to define the local exterior endmember (−11.6 ‰), our data suggest an isotopic value for the respired endmember of −25.6 ‰, consistent with the range of recent C3 ecosystems (range of −24 ‰ to −32 ‰; e.g., Mattey et al., 2016; O'Leary, 1988; Pataki et al., 2003). The large range of pCO2 and δ13Cair values places tight constraints on the Keeling plot, and the uncertainty in the intercept (SD of y intercept = 0.21) is relatively small compared to other Keeling plot applications (Frisia et al., 2011; Pataki et al., 2003; Riechelmann et al., 2011). Unlike some other cave systems (Frisia et al., 2011; Waring et al., 2017), our cave air samples define a single line typical of a two-component mixture and do not show evidence of degassing of drip water as a significant influence on the isotopic ratio of cave pCO2. That is, while the influence of drip water CO2 degassing is likely low in summer due to low drip rates and high cave pCO2, we do not see any evidence of a change in slope in winter due to higher drip rates and lower pCO2. The active cave ventilation in winter further dilutes and removes the degassed CO2.
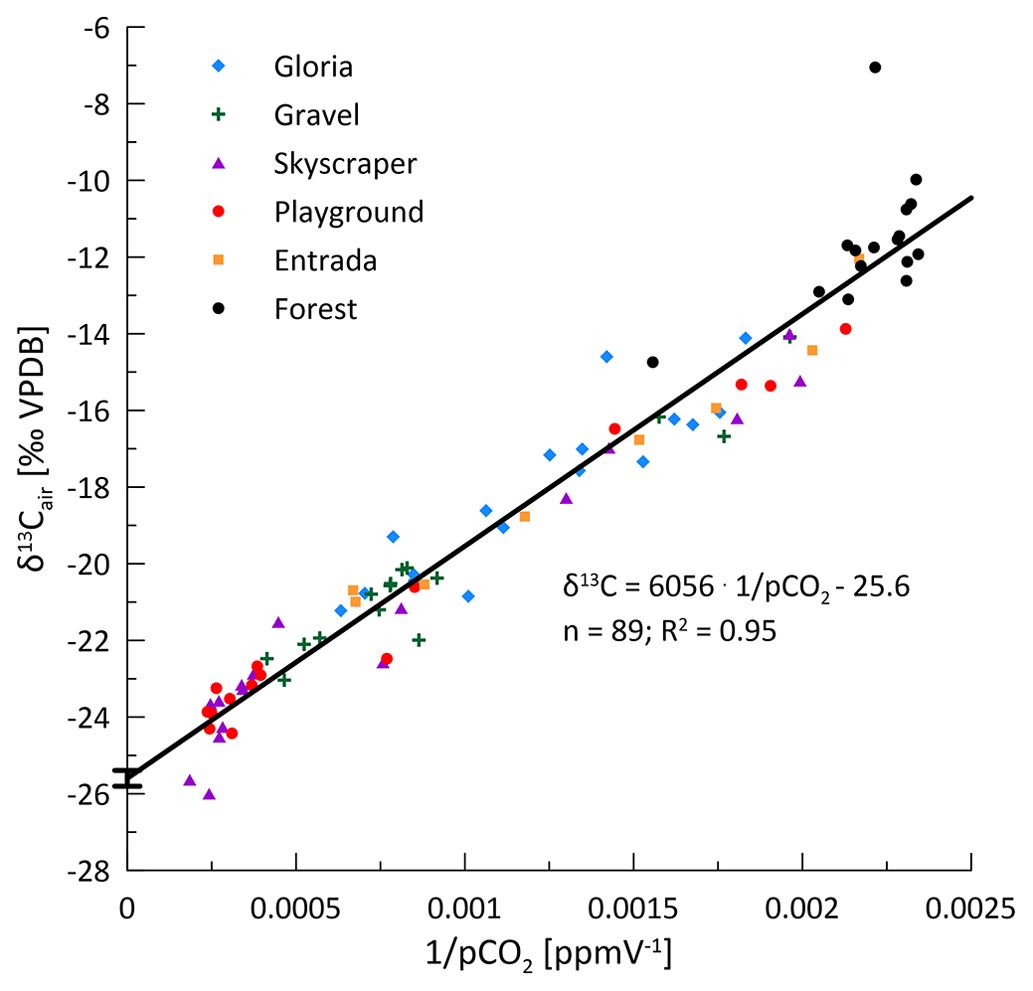
Figure 8Keeling plot based on cave air measurements. The mixing line (black line) suggests a mixture between the two endmembers of respired soil air (−25.6 ‰) and atmospheric air (−11.6 ‰).
5.2 Meteoric water recharge and hydrology
On a seasonal scale, the drip rate is controlled by precipitation and potential evapotranspiration (P−PET). Recently published hydrological models from semi-arid caves suggest that a recharge threshold has to be overcome (saturated soil and epikarst) to contribute to the deeper water reservoir feeding the cave drip water (Markowska et al., 2016; Baker et al., 2021), consistent with rainfall-triggered recharge of the water reservoir feeding the drip sites in our wet season (October–April).
Drip rates of Entrada and Playground mirror the structure of the monthly recharge (P−PET), suggesting a close relationship with potential recharge (Fig. 3). Hence, when P−PET is negative in summer, any rain is likely evaporated and does not recharge the water reservoir. Even with a lower actual evapotranspiration (AET), summer recharge is reduced. However, the active drips in summer suggest a large water reservoir, in line with the well-mixed reservoir discussed below, which does not dry out during summer and keeps drips active even if recharge is minimal. A nonlinear relationship between rain and drip rate can result from passing the precipitation vs. evapotranspiration threshold (Fairchild and Baker, 2012) or when water storage reservoirs overflow (Bradley et al., 2010). However, the long median interval between drip rate measurements in this study (28 d) complicates efforts to derive relationships between the drip rate and rainfall or precipitation–evapotranspiration and precludes the use of quantitative flow models such as bucket models to derive recharge thresholds and overflow capacity (Baker et al., 2020, 2021), since we cannot ascertain if our single estimation of the drip rate reflects peak discharge or the rising or falling limb of discharge after a precipitation event. For example, we did not identify a relationship between the 7 d antecedent cumulative rainfall and drip rate, as found in studies featuring higher-resolution drip rate data (Baker et al., 2020, 2021). Continuous hydrographs recording drip rates or tracer experiments would be necessary to determine the response time to rain events and to define thresholds of the rainfall amount affecting drip sites individually (Markowska et al., 2016; Baker et al., 2020, 2021).
Despite the long intervals between sampling, our data suggest that there may be some site-specific response behaviors at the onset of the rainy season. Despite having the thickest overlying bedrock, Skyscraper and Playground respond quickly to the onset of the rainy season (likely related to the piston effect pushing water through the reservoir), while Gravel and Entrada react in a delayed fashion. Although rainfall amounts were similar during the two monitored wet seasons, Gloria has higher drip rates during the 2019–2020 wet season than in 2020–2021, which could reflect higher evapotranspiration during the warmer 2020–2021 winter, differences in recharge prior to the start of monitoring and the size of the discrete stores, or a change in the flow path routing (Markowska et al., 2016). However, Gravel exhibits the opposite behavior, which may reflect complexities in hydrological routing at this site, such as overflow reservoirs (Bradley et al., 2010), which are consistent with the variation in terms of which soda straw hosts drip at this location.
The δD and δ18O of drip waters provide some further constraint on the hydrological behavior. While the amount-weighted δ18Orain of successive months varies by several per mille in some years (Moreno et al., 2021), there are no seasonal cycles in δ18Odripwater and no change over the onset of the wet season (Figs. 3 and A3). Although precipitation events span over 10 ‰, the majority of our sampled drip locations feature a very limited (<1.1 ‰) range in δ18O across the monitored period (Fig. 9). Within a given drip location, the limited variation in δ18O suggests the mixing of individual recharge events within the flow and storage system of that drip, so that the isotopic signatures of individual precipitation events are attenuated. The similar attenuation of event-scale variability has been described previously (e.g., Riechelmann et al., 2011; Feng et al., 2014; Tadros et al., 2016). In a region with similarly wide range in the δ18O of precipitation events, drip waters with an attenuated range of 1 ‰ variability have been classified as being well-mixed cave waters characterizing diffuse flows (Domínguez-Villar et al., 2021). In our monitoring, the drip site exhibiting the largest range (1.9 ‰) was Entrada. Such a level of variance (e.g., up to 3 ‰) has been described to result from partially well-mixed waters which are fed by preferential drainage routes (Domínguez-Villar et al., 2021). We note that Entrada features a small bedrock thickness (7 m) and also large trees with root penetration into the cave. Root channels have been observed to provide preferential flow routes in some karst systems (Dasgupta et al., 2006). The Gravel location also features slightly greater (1.4 ‰) variation than other locations and also is near root systems and is inferred to reflect a sediment filled chimney which may also have altered flow pathways compared to limestone. Despite the overall high attenuation of individual events, at the end of the monitoring, δD and δ18O at all drip sites (except Playground) shift to negative values, suggesting a change in the water composition of those discrete reservoirs. We hypothesize that a rain event with strongly negative isotopic compositions in early February causes such a shift. Strongly negative rainfall events of substantial volume are possible, as seen in Fig. 9, which could recharge the reservoir during conditions with high recharge.
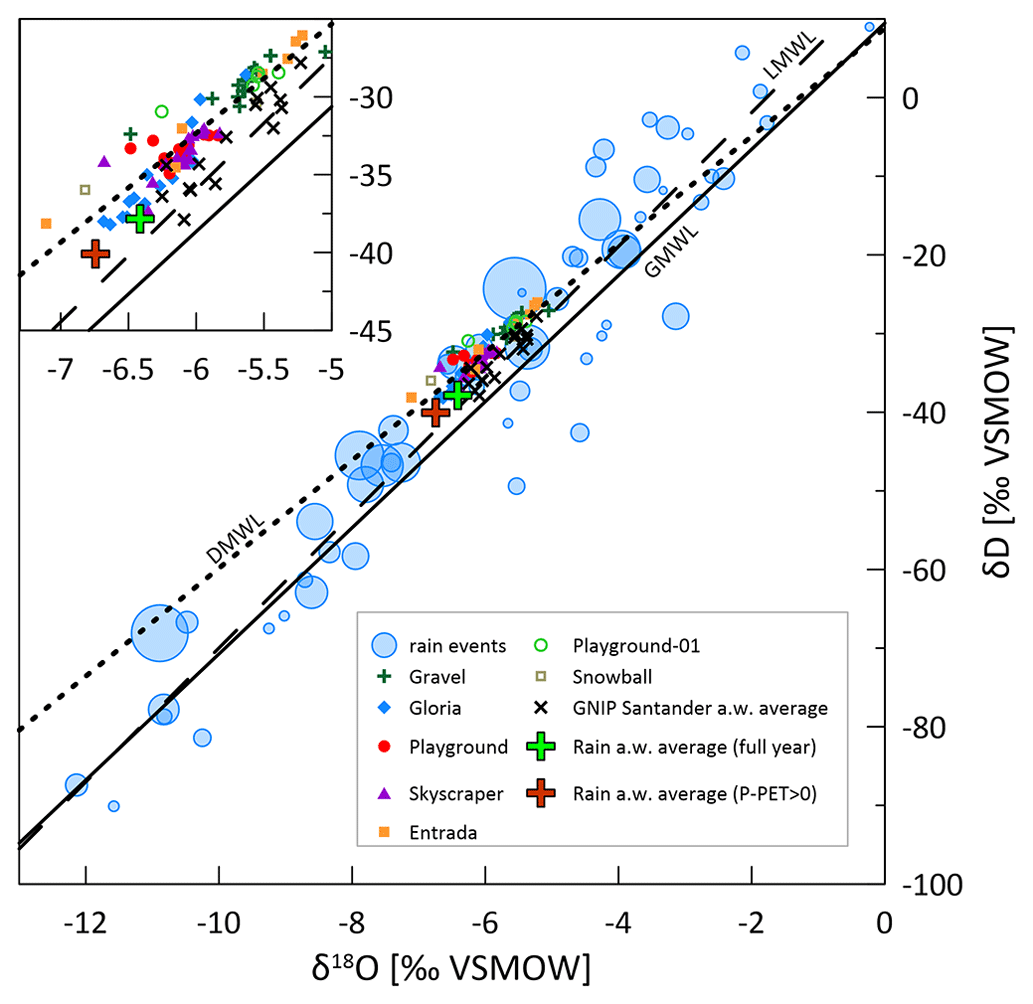
Figure 9Meteoric water lines of drip water and local rain events. The size of the blue bubbles indicates the rain amount of the individual rain events between February 2015 and February 2016 (Moreno et al., 2021). The green cross represents the full annual amount-weighted average of local precipitation. The brown cross accounts for positive P−PET months only (recharge). Black crosses reveal the interannual variability in rainfall represented by the amount-weighted annual average of GNIP station Santander for 2000–2015. For the 2019–2021 cave monitoring, drip water (drip water meteoric water line or DWML of δD = 7.01δ18O + 9.72, where R2=0.83; stippled), local rainwater (local meteoric water line or LMWL δD = 8.5δ18O + 15.1, where R2=0.92; dashed; data from Moreno et al., 2021), and the global meteoric water line (GMWL δD = 8.0δ18O + 10; Craig, 1961) are also shown. The meteoric water line or MWL for GNIP Santander 2000–2015 (not shown) is fairly similar to the dashed line.
The spatial variations in the average δ18O of drip waters suggest that there is not a single well-mixed reservoir that supplies all drip locations throughout the cave. Prior studies have shown that nearby drip sites can undergo very different routing in the unsaturated zone undergoing different evaporative fractionation (Treble et al., 2022; Markowska et al., 2016). The heterogenous coverage by deep-rooted trees such as Eucalyptus may contribute to lateral variations in evaporative fractionation because they can increase evaporation from the upper soil horizons via the hydraulic redistribution of deep groundwater to the upper soil (Brooksbank et al., 2011). The spatial differences may also reflect the variation in the dominance of diffuse and preferential flow routes and differing transit times. From our data set, we are unable to quantify the water transit time because rain δ18O monitoring covers neither the year of drip sampling nor the prior year. Thus, we cannot rule out the possibility that intersite differences may reflect varying average transit times among drips, so that the amount-weighted drip water δ18O of different drips would converge over a suitably long time period which leads to averaged interannual differences in the amount-weighted δ18O of precipitation. If significant differences in the mean transit times existed among drip sites, and the amount-weighted average precipitation in the year prior to monitoring was more positive than that during the monitored season, then drips with slower average transit times might be off; a per mille in the yearly precipitation amount-weighted average δ18O is seen among the available precipitation data (Fig. 9), which includes 15 years from GNIP station Santander in the period 2000–2015 (no recent data available; IAEA/WMO, 2022) and individual rain events monitored near Oviedo from February 2015 to February 2016 (Moreno et al., 2021). In the 2015–2016 series, considering the amount-weighted average of months with (months with recharge; brown cross), the δ18O is 0.3 ‰ more negative compared to the full annual rain (Fig. 9; green cross; Moreno et al., 2021). We observe that at drip sites located under the same bedrock thickness and vegetation, such as Playground and Playground-01 (located 3 m apart in the same gallery), the slower drip rate (Playground-01) features a more positive average δ18O and δD, which could be compatible with a slower average transit time.
Additionally, the flow pathways can also affect which precipitation events recharge the aquifer. In some settings dominated by diffuse recharge through the soil, summer rainfall might not contribute to the water reservoir if the recharge threshold is not exceeded. However, this effect is suggested to be minor in caves with higher than 1.5 (Baker et al., 2019). In our setting ( 2.4), the amount-weighted δ18O during months of positive water balance is only 0.3 ‰ lower in δ18O. Nonetheless, preferential flow routes may allow recharge even in months with a negative water balance, which in some sites may result in recharge from the less negative precipitation events which characterize the summer months (Domínguez-Villar et al., 2021). Sites like Entrada, with the proximity to root systems entering the cave and facilitating preferential flow, feature a higher average δ18O and δD than sites with a comparable or greater drip rate but no large trees or roots, like Gloria or Playground. The spatially variable vegetation, with variable transpiration water demand, may also affect the recharge threshold. Finally, isotopic fractionation of rainwater by evaporation in the soil and the unsaturated zone before entering the discrete water reservoir could contribute to the slight shallowing of the drip water meteoric water line (DMWL) relative to the local meteoric water line (LMWL), and the variable influence of evaporation could contribute to the spatial pattern in mean drip water (δ18O), similar to Baker et al. (2019) and Bradley et al. (2010).
These findings of a moderately mixed to well-mixed water reservoir, likely recording a mean annual amount-weighted δ18O signal and buffered against individual rainwater recharge events (especially during the dry season when P−PET is negative; Fig. 3) is crucial when interpreting stalagmite δ18O records. Site-specific evaporative effects on δ18Odripwater can lead to offsets in coeval speleothems from the same cave. These effects may be more extreme now due to spatially variable vegetation and extreme evapotranspiration of perennially green Eucalyptus (Brooksbank et al., 2011), compared to native deciduous oaks. Nonetheless, sites with a slow drip rate could in some cases be characterized by more positive δ18O of drip water, and therefore calcite, than sites of more rapid drip flow due to stronger or weaker evaporative effects along the drip water flow path, respectively. This may be consistent with observations of slowly growing stalagmites having higher δ18O (Stoll et al., 2015) if slow growth were in part caused by slow drip rates and potentially concomitant high levels of PCP. Thus, the disequilibrium effects in δ18O being incorporated into speleothem calcite may not be required to explain differences in δ18O in coeval speleothems in the same cave. Stalagmites from cave sectors with a thinner overlying bedrock thickness may result in a less well-mixed water reservoir and thus reflect seasonal changes in rainwater δ18O recharge.
5.3 Controls of δ13CDIC
Several factors may potentially contribute to the strong seasonality in drip water δ13CDIC marked by higher δ13CDIC in the winter season. A decrease in soil pCO2 in colder seasons could produce this trend because the δ13C of soil CO2 is expected to fall on the mixing line between the atmosphere and a respired endmember (similar to Fig. 8), so that periods of higher soil pCO2 are characterized by lower δ13C of the soil CO2 and therefore DIC in drip waters. Although we have no direct soil CO2 measurements, soil pCO2 in similar climates is elevated in the warm season and can be enhanced by greater soil moisture (Borsato et al., 2015; Frisia et al., 2011; Hasenmueller et al., 2015; Hodges et al., 2019). A shift to more closed system dissolution in the colder and wetter season could also contribute to the trend of higher δ13CDIC in the colder seasons. Additionally, the equilibration of the drip water with cave air could also lead to a seasonal trend because of the higher δ13Cair of cave air in the ventilated winter season. Finally, if PCP were more extensive in the winter season, then it would also increase δ13CDIC due to the preferential degassing of light 12C carbon isotopes when cave air pCO2 is low. To evaluate these processes, we consider the indicators of PCP and the degree of bedrock dissolution in addition to calculations generated by the CaveCalc model (Owen et al., 2018).
Our data on PCP suggest that PCP cannot be the main driver of seasonal variations in the δ13CDIC at any of our three sites with full 16-month monitoring data. The range in PCP at most sites is small and is modeled to have only a limited effect on the δ13CDIC, and the samples of high δ13CDIC do not correspond to the samples of the highest PCP (Fig. 10). Variations in soil pCO2, with concomitant variations in the δ13C of soil CO2, as defined by a mixing line between atmospheric CO2 and respired CO2 (Fig. 8), could explain the observed covariation of Ca and δ13CDIC at some sites (e.g., Gloria), which reflects the greater degree of bedrock dissolution accompanying higher soil pCO2 (increased Ca concentration). However, the very large range of δ13CDIC at constant Ca and PCP, especially in Playground (and Gravel) is not consistent with variation in soil pCO2 as the only process.
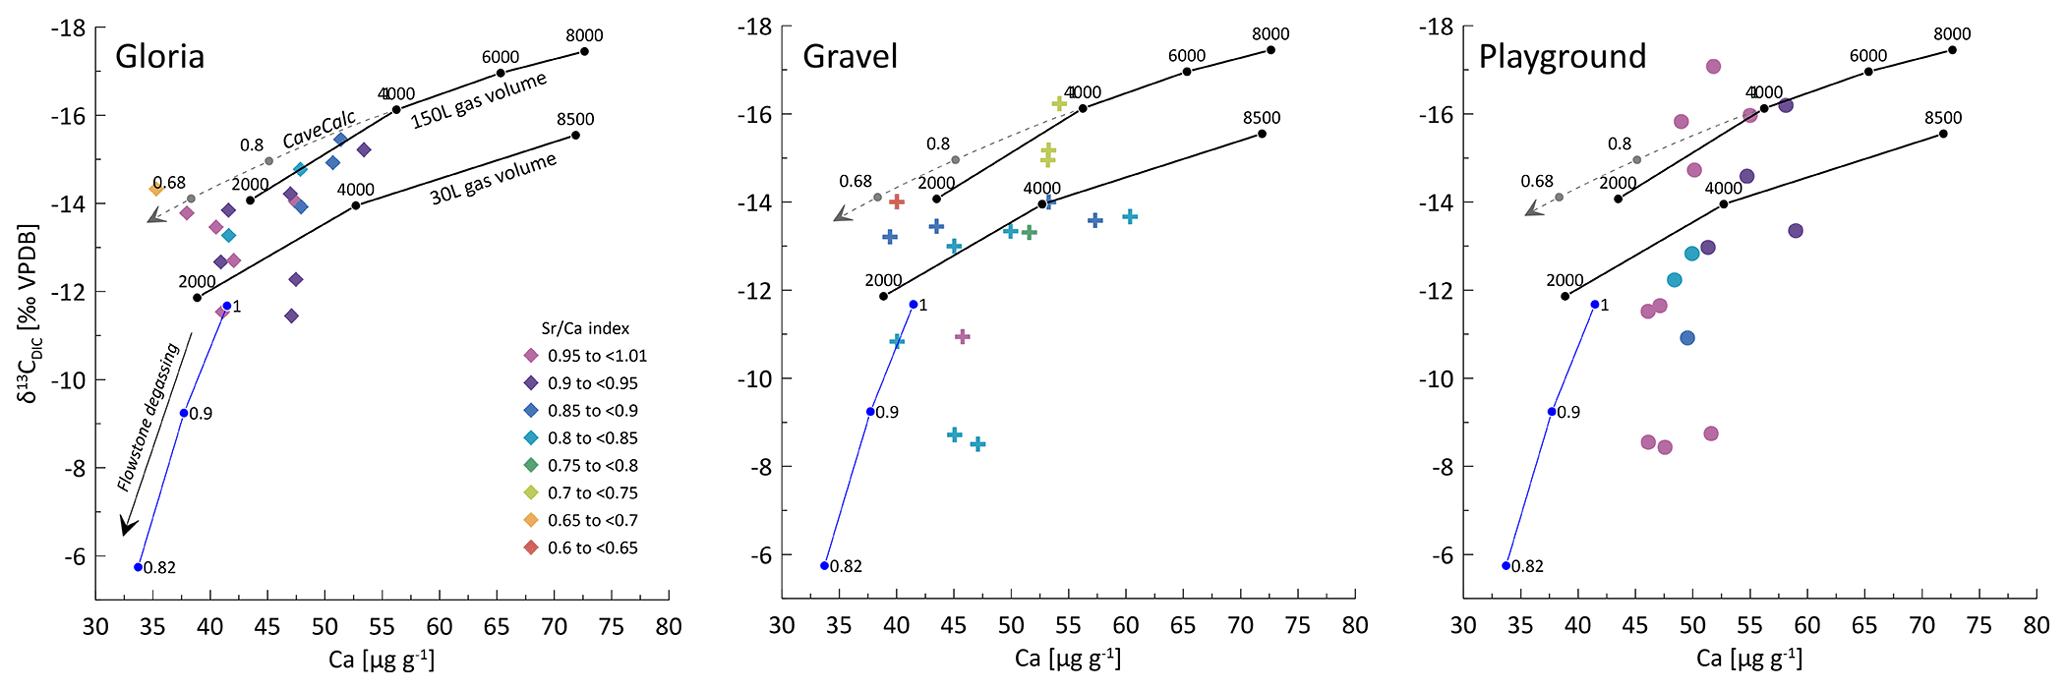
Figure 10CaveCalc simulations compared with monitoring data of three individual sites (Gloria, Gravel, and Playground) color coded by index ranges. Black markings show CaveCalc simulations (Owen et al., 2018), with different gas volumes (150 and 30 L) representing a more open and closed system, respectively. Along the black line, the soil pCO2 (labels) is changing using a respired endmember (δ13C) found by the Keeling plot (Fig. 8). The dashed line projects the modeled evolution of degassing, starting with 4000 ppmv soil pCO2 and labeled with the fraction of Ca remaining ( index). The blue line marks a degassing evolution along a flowstone measured during the monitoring campaign, where labels indicate the remaining Ca fraction ( index).
Previous speleothem-based studies of the 14C dead carbon fraction (DCF) in stalagmites in La Vallina and nearby caves show the average DCF values from 3 %–12 % (Lechleitner et al., 2021), which suggests a mostly open system dissolution. Nonetheless, a shift from very open (3 % DCF) to moderately open (12 % DCF) would be accompanied by a 0.75 ‰ increase in the δ13CDIC, which is minor compared to the seasonal variations of several per mille (Fig. 2). In tropical settings, DCF has been shown to increase with higher water flow (Noronha et al., 2014). Thus, periods of higher drip rates in the cold season could, in principle, lead to lower gas exchange volumes and more closed system dissolution, contributing to the seasonal increase in δ13CDIC. The similarity of F14C in the drip water of multiple seasons, equivalent to a DCF of 5 %–8 % if the respired carbon has F14C = 1, suggests that the seasonal variation in DCF is not large enough to explain the large observed shift in δ13CDIC (Fig. A4).
Two additional processes not possible to explore with these CaveCalc simulations are (1) a decrease in the δ13C of the respired endmember in soils and (2) kinetically enhanced degassing and exchange with cave air. A change in the δ13C of the respired endmember, driving a change in δ13CDIC without a concomitant change in Ca, is difficult to detect in our cave air monitoring because the cave air in the coldest times samples ventilated atmosphere air not soil and karst air. Such a change could occur if there were a change in the relative importance of the root vs. heterotrophic respiration or the importance of soil vs. bedrock organic matter (OM) sources if these featured OM sources were of contrasting δ13C. We find strong seasonal variations at Playground (8.6 ‰ δ13CDIC range), which is covered by pasture, whereas other monitoring sites are located beneath bushes or trees and undergo less variability in δ13CDIC. Deeper roots of larger plants could maintain higher autotrophic respiration in winter in these sites, compared to shallow rooted grasses, especially since the temperature range in the surface soil occupied by grass roots is much larger than that at depths of a few meters spanned by tree roots (Benzaama et al., 2018). Local changes in δ13C of soil CO2 could further be controlled by vegetation cover since the microbial degradation of fallen leaves in autumn and winter might contribute substantially to the negative δ13CDIC imprint in late autumn.
Kinetically enhanced degassing and exchange with cave air potentially influences the δ13CDIC at some drip sites (e.g., Playground or Gravel) since PCP and DCF alone did not explain the variations in δ13CDIC. Here, δ13CDIC is hypothesized to be affected not only by the source δ13C of the soil but also by the degree of drip water degassing (i.e., increased degassing leads to more positive δ13CDIC due to a preferential loss of 12C). A cave experiment, where drip water was sampled along a flowstone to track the degassing and CaCO3 precipitation evolution likely due to cave air exchange, results in a steeper slope (blue line in Fig. 10) compared to the CaveCalc-modeled degassing line (dashed gray line in Fig. 10). This suggests that kinetically enhanced exchange with cave air might be important, since δ13CDIC changes by almost 6 ‰ without losing appreciable Ca and comparable index ranges (numbers along blue line) compared to the CaveCalc degassing line (dashed). For Gravel and Playground, a statistically significant correlation between cave air δ13Cair and drip water δ13CDIC emerges, suggesting an exchange with cave air (Fig. A5a). Additionally, the modest inverse correlation between drip water δ13CDIC and cave air pCO2 at these sites is consistent with the greater extent of degassing (and potentially PCP) during periods of low cave air pCO2 (Fig. A5b). Such a correlation with cave air δ13C could be a causal mechanism (equilibration) or an accidental correlation because cave air δ13C and drip water δ13CDIC are both controlled by temperature. The slope of the in-cave-derived degassing line (blue line) appears parallel to the drip water samples (e.g., Playground), with the least negative δ13CDIC values and no substantial loss in Ca and therefore a high index.
These results indicate strong variations in δ13CDIC, which reflect both a temperature control on biomass (respired endmember) and potential controls by kinetic degassing (PCP) or equilibration with cave air. No evidence for a substantial dead carbon contribution from dissolved bedrock is found (Fig. A4). Our results are consistent with the long-term suggestion of strong temperature control of speleothem δ13C (e.g., Genty et al., 2006; Lechleitner et al., 2021; Moreno et al., 2010). Significant seasonality in drip water δ13CDIC means that the interpretation of speleothem δ13C may need to account for the seasonality of calcite deposition where the calcite deposition is not year-round (further discussion in Sect. 5.4.2).
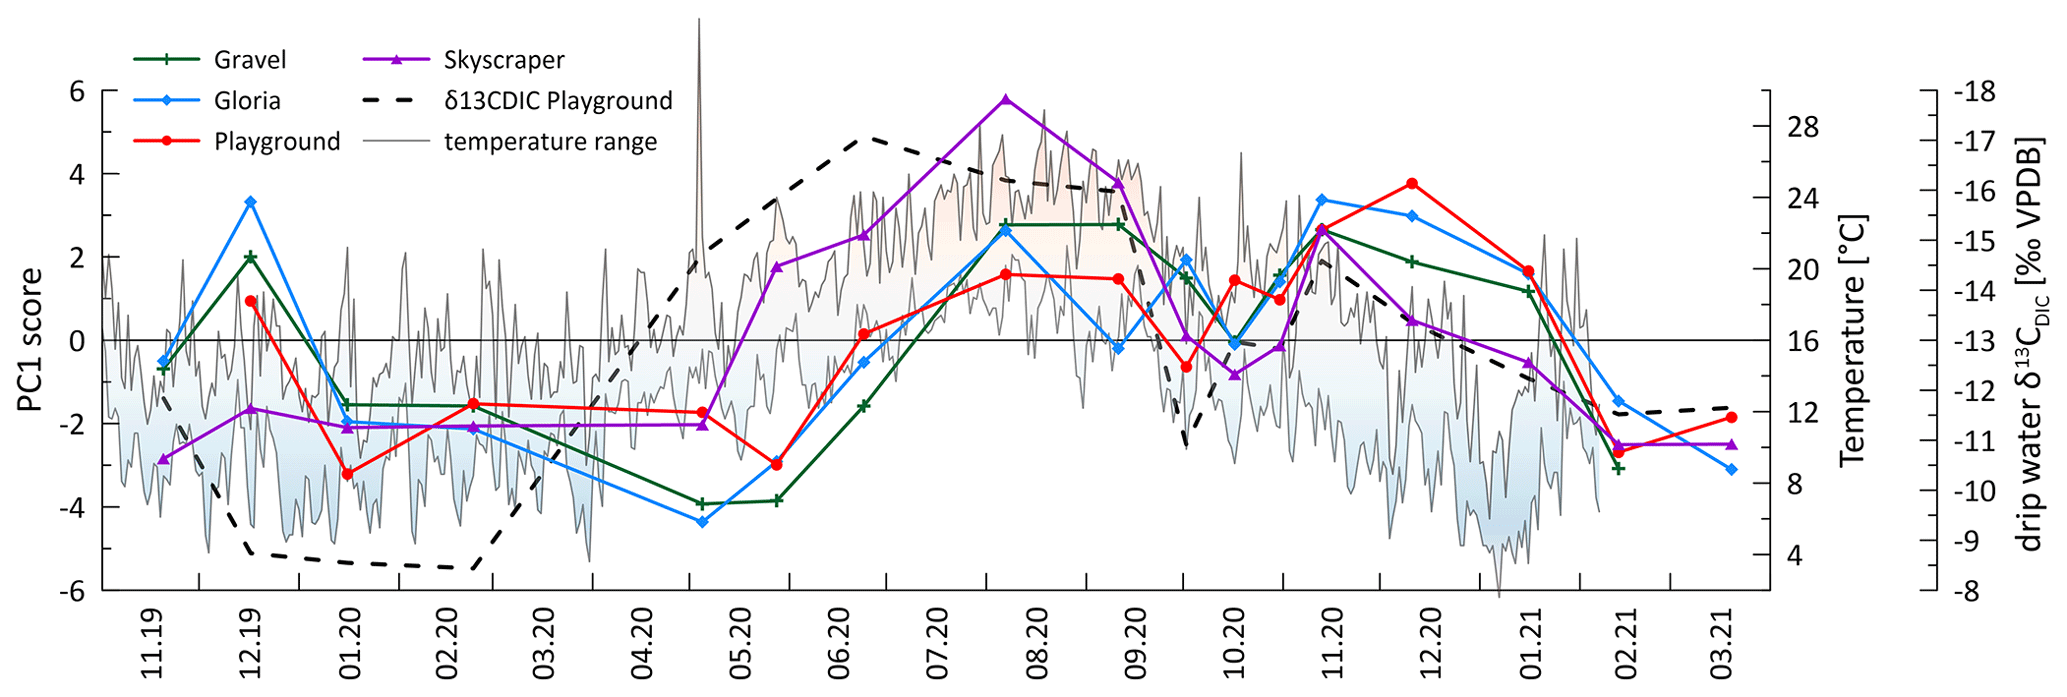
Figure 11The temporal evolution of the score of PC 1 (colored curves) suggests stronger bedrock dissolution in summer and early autumn, as well as winter, likely due to higher soil pCO2. A clear relationship with temperature (daily min–max with color shading) and δ13CDIC (dashed line; note the inverted y scale) emerges, suggesting an interrelationship.
5.4 Seasonal variation in bedrock dissolution and saturation state
5.4.1 Seasonal cycle in bedrock dissolution
Elements dissolved congruently from limestone, including Ca and Sr (and other PC 1 elements), follow a seasonal cycle with a similar amplitude, as shown in Fig. 4 (indicated by the % RSD of element concentration). The cycle is interpreted to result from the changing bedrock dissolution intensity (colored lines in Fig. 11) driven by temperature (shaded range in Fig. 11), with a higher dissolution in the summer and autumn months due to higher soil CO2 concentration and lower dissolution in winter and early spring (represented by the dashed line in Fig. 11). While PCP could in principle affect the concentration of Ca, it has a very limited effect on the concentration of elements with partitioning coefficients much lower than 1, as is the case for Sr (Wassenburg et al., 2020) and U (Weremeichik et al., 2017). Therefore, the similar amplitude variation in Ca, Sr, and U suggests that the seasonal cycle in Ca concentration is also predominantly controlled by the bedrock dissolution intensity. Seasonal summer and autumn maxima in soil pCO2 were interpreted from changes in δ13CDIC (dashed line in Fig. 11), which would result in stronger bedrock dissolution because of the higher CO2 acidifying the percolating water. The inverse relationship between the Sr concentration and δ13CDIC supports this finding (Fig. A6). The effect of higher soil pCO2 may also be amplified by more open system dissolution conditions which would enhance the degree of bedrock dissolution, as CO2 is continuously supplied and maintains the acidity of percolating waters.
5.4.2 Drivers of temporal variations in PCP and growth rate
PCP is expected to be maximized by slow drip rates (long exposure), high drip water oversaturation due to high initial Ca from bedrock dissolution, and low cave pCO2 from cold season ventilation. Because the former factor is maximized in the summer season, but the ventilation works to increase the latter effect in the cold season, PCP shows little seasonal variation in many sites (e.g., Playground and Skyscraper; Fig. 6). At sites with a pronounced variation in PCP in October 2020 (Gravel and Gloria), the minimum in the index occurs when the drip rate just starts increasing (Fig. A2c does not indicate a strong correlation).
In La Vallina, the cave starts to ventilate around the time when the index indicates increased PCP (Figs. 2 and 6). Consequently, the stronger CO2 gradient between the enriched drip water and ventilated cave air enhances degassing and favors PCP, as described previously for other cave systems (Mattey et al., 2016). Direct comparison of the drip site-specific index with the local cave air pCO2 does not show a strong relationship (Fig. A2b). However, Gravel and Gloria indicate a substantial Ca loss in October, likely related to a strong CO2 gradient due to a ventilation event, while Skyscraper and Playground do not show such a significant PCP imprint because the cave air CO2 is still relatively high deeper in the cave. The CO2 gradient can also be strengthened by a higher drip water carbonate concentration when soil pCO2 increases. Indeed, stronger bedrock dissolution represented by higher Sr concentration is anticorrelated with the index, suggesting increased PCP with higher soil pCO2 (Fig. A2a). Nonlinear relationships of driving parameters likely complicate this interpretation. Nevertheless, a seasonal maximum in the extent of PCP is likely conditioned by multiple variables, including low cave pCO2, high soil pCO2, and potentially low drip rate, which could be explored by further modeling. We suggest that the seasonal PCP regulation in La Vallina is complex because the effect of the lower summer drip rate is counteracted by the effect of higher summer cave pCO2, which differs from systems with coincident low summer drip rate and low summer cave pCO2, such as in Gibraltar (Mattey et al., 2016), which have shown a strong seasonal control of PCP. Even rapidly dripping Skyscraper features some seasonal PCP (17 % suggested by ), which may indicate that the rapid drip rate results from convergent flow and that the opportunity for PCP occurred at higher levels in the karst system.
Seasonal variation in the deposition rate of stalagmites can influence the proxy interpretation. Using a monthly monitoring drip rate, Ca concentration, and cave pCO2 data as input parameters, stalagmite growth can be simulated with I-STAL (Stoll et al., 2012). For most drip sites, simulated growth phases occur in summer and winter and are interrupted by growth cessations in spring and autumn (Fig. 6), due to a complex interplay between Ca concentration and CO2 in drip water relative to the cave environment (pCO2 and drip interval) at a constant temperature, in addition to increased PCP inhibiting stalagmite growth in autumn. In the case of Gravel, Skyscraper, and Gloria, the reduction in drip water supersaturation due to PCP is sufficient to cause growth cessation in autumn, but the lower cave air pCO2 in these two locations leads to significant growth rates in these sites during winter months. An exception is Playground, which is simulated to only grow during the last few months of the monitoring period. Stalagmites growing during multiple seasons with only short phases of inhibited growth (e.g., Gloria) might exhibit different geochemical signals than stalagmites like Playground only growing in winter, which should be accounted for when interpreting analyses derived from micromilling techniques which most often do not resolve the subannual changes but are averaging multiyear periods. Furthermore, periods without growth or with reduced growth can alter the seasonal pattern of TE (Borsato et al., 2007) or subannual stable isotopes (Johnson et al., 2006) and therefore impact the interpretation of stalagmite geochemical analysis from microscale measurements (e.g., seasonal layers in fluorescence images or LA-ICP-MS tracks). The annual simulated growth rates are in the range of active stalagmites from La Vallina cave (Sliwinski et al., 2023).
5.4.3 Other sources for enriched elements compared to bedrock
Elements with high PC 1 loading coefficients (Na, Si, Mg, and Ba) show a similar seasonal pattern to Ca, Sr, and U, which were primarily controlled by bedrock dissolution (Sect. 5.4.1). However, drip water ratios of , , , and are significantly higher than those of the measured bedrock samples (Fig. 7), suggesting that these elements have additional sources beyond the congruent dissolution of the limestone bedrock which we sampled or incongruent dissolution takes place.
The temporal variations in drip water Na concentrations are only about 50 % to 80 % of the amplitude of those of Ca (% RSD in Fig. 4), an attenuation which is consistent with dual sources of Na to drip waters. That is, if the limestone dissolution is seasonally variable but the non-limestone Na sources were constant or if the delivery were buffered by cation exchange in soils (Tadros et al., 2019), then this would lead to the attenuation of the seasonal pattern of variation in the limestone-sourced Na. One likely contributor to Na in drip water is wet and dry deposition of marine aerosols on the land surface above the cave, due to the proximity of the cave to the Atlantic Ocean coastline (Tremaine et al., 2016). No clear relationship is found between Na concentration and proximity of trees (which would act as aerosol traps). Pastures capture marine aerosols less efficiently; however, at monitoring sites beneath the pasture, Na concentrations are elevated (Playground and Playground-01). This might be related to salt added to animal feed or the excrement of animals containing salts (Hamamoto and Uchida, 2015). Direct advection of marine aerosols into the cave by Aeolian input may be significant near the cave entrance where Na concentrations are generally higher (Entrada and Snowball; Dredge et al., 2013). Since Na is dominated by marine and potentially anthropogenic sources, no evidence for cation exchange with clay minerals in the soil or karst acting as a hydrologically controlled sink/source is found, as observed in clay-rich settings such as in SE Australia (Tadros et al., 2019).
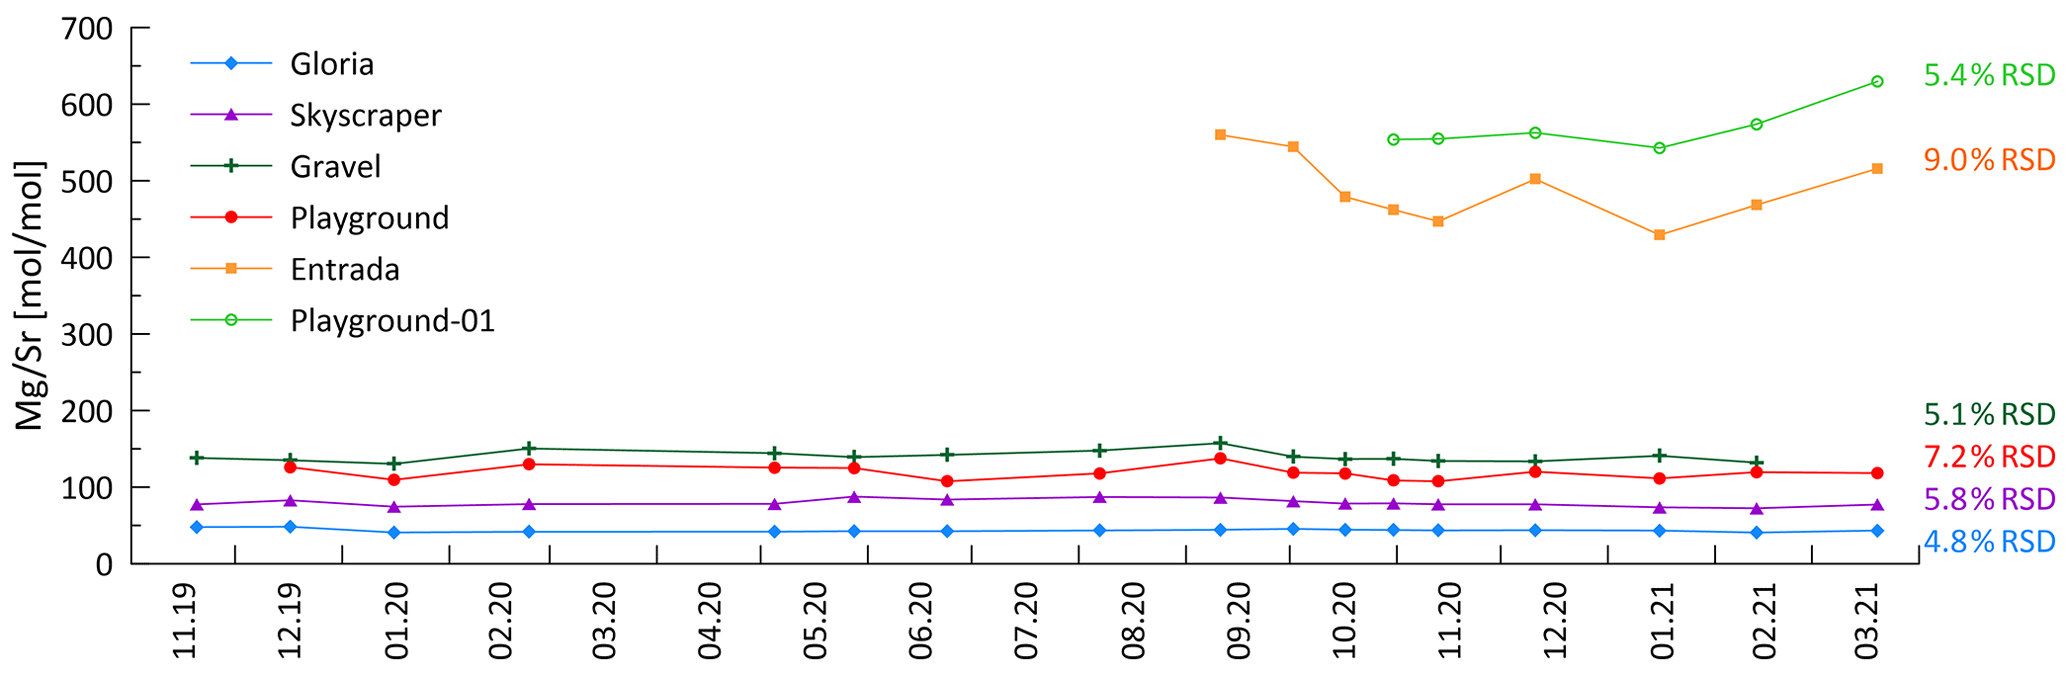
Figure 12Constant ratio over the monitoring period indicates congruent bedrock dissolution. Higher RSD is recorded at Entrada (orange) which might be influenced by Aeolian marine aerosol input near the cave entrance (Fig. A7). Mg contributed from dolomitized zones might contribute to substantially higher at sites like Entrada and Playground-01.
Assuming a marine aerosol contribution for Na, similar trends should be visible in Mg and S as well. The inferred direct marine aerosol deposition near the entrance at Entrada could contribute to the correlation of with , which is only observed at Entrada (Fig. A7). Fittingly, this site also has slightly higher variability in at Entrada (9.0 % RSD; Fig. 12). However, marine contribution alone cannot be the only cause for the elevated Mg and S concentrations at the different drip sites. Notably, Playground-01, Entrada, and Snowball have substantially higher Mg concentrations decoupled from Na (Fig. 4). We suggest that variations in the Mg (and S) concentration in different bedrock zones drives this variation. The presence of minor dolomite phases in some sectors of the host rock would be an important source of higher Mg (Tremaine and Froelich, 2013). Our analyzed bedrock samples do not yield the high Mg concentrations expected from pure dolomite. However, our collection may not sample the full range of bedrock compositions, and bedrock exposures in some locations show textures typical of the weathering residue of dolomite. Within the flow route of a given drip water site, the lower solubility of dolomitic components of the host rock can lead to higher drip water Mg content with longer water–rock interaction times (Fairchild and Baker, 2012). At all monitored sites, the ratio of drip water varies by less than 10 %, despite order-of-magnitude changes in the drip rate (Fig. 12). This suggests a constant background Mg contribution and congruent bedrock dissolution over the monitored timescale. Nonetheless, changes in flow paths over long timescales could potentially cause infiltrating water to interact with bedrock of a different composition, a factor which may need to be considered in interpretation of long-term stalagmite trace element records.
Elements like Si and Ba, which are also observed to be substantially enriched relative to congruent dissolution of sampled bedrock, might be enhanced by leaching from silicate phases such as quartz-rich sands which are present as infills in both levels of the cave or from clay minerals (Eylem et al., 1990). Ba can also be released by desorption from hydrous ferric oxides when pH is changing (Mishra and Tiwary, 1999). Calculations performed with PHREEQC (Parkhurst and Appelo, 2013) suggest that at cave conditions the highest measured drip water Si concentrations are close to saturation relative to quartz, which may explain the low-amplitude variations in the concentrations (Fig. 4). Longer water–rock contact times in summer may explain the slight increase in concentrations in summer.
5.5 Episodic delivery of colloidal elements
The seasonal-scale variation observed in the major cations does not apply universally. Transition metals, Al and Y, in addition to Li and K, show different patterns of variation and are most strongly represented by PC 2 elements (Li, Al, K, Cr, Mn, Cu, As, and Y; Fig. 5). Of these, Li, Al, K, Mn, Cu, and Y feature high-amplitude, short-term variations, at least in some drip sites (Fig. 4). Insoluble elements such as Al, Mn, Cu, and Y have previously been attributed to detrital and colloidal phases rather than dissolved transport, with colloids strongly associated with organic macromolecules (e.g., Hartland et al., 2012, 2014). The variations reflected in PC 2 indicate that high concentrations of these elements occur predominantly in the wet season (Fig. A8), although no relationships between hydrology and any elements emerge. As discussed earlier (Sect. 5.2), the sampling resolution is poorly suited to test relationships between the rainfall and drip rate and therefore complicates interpretation of the hydrological control on drip water chemistry. Aggregate monthly collections between sampling days would potentially be necessary to show better correlations between recharge and colloidally delivered elements.
Some transition metals (Cu, Cr, and As), which might be expected to be colloidally transported, exhibit a temporal variation different from Al, Mn, and Y (PC 3; Fig. A8), suggesting additional controlling processes. For instance, ligand binding efficiency may be different for some of these elements, or they may be in different sizes of colloidal fractions (Hartland et al., 2012, 2014). Biomass take-up and release could be another possibility complicating the interpretation of these elements. Sulfur is dominantly controlled by PC 3 and is related to Cu, Cr, and As (Fig. 5). Sulfur could potentially be affected by variations in bedrock pyrite oxidation. Other possibilities include redox changes and oxygen exposure related to the hydrology and contact with reducing materials (affecting the speciation of some of these elements) or the release of biologically bound elements when vegetation degrades at the end of the growing season (e.g., As, Cu, and Cr; Kabata-Pendias and Pendias, 2000).
In many stalagmites, elements like Cr, Mn, Cu, or Y covary seasonally (Borsato et al., 2007; Sliwinski and Stoll, 2021). Similar observations were made in drip water studies by Baldini et al. (2012), but drip waters in the present study demonstrate that typical colloidal elements show high-frequency events (spiky signals in Fig. 4) and are independent of each other (Table A3). Consequently, our data from this system are not consistent with synchronous enrichment in these elements in drip water as a cause for synchronous enrichment in speleothem (e.g., Borsato et al., 2007). Nevertheless, more events of colloidal element spikes during the wet season are observed, which could also be related to the decomposition of biomass producing more organic colloids (Baldini et al., 2012). However, drip waters might not be the main contributor of those elements, and they may be more controlled by deposition of particulates by air transport (e.g., dust during ventilation events, in-cave activity, or block fall; Fairchild et al., 2010). Particulates could be trapped by the wet stalagmite surface and become incorporated into the stalagmite with calcite precipitation. Alternatively, in stalagmites with slow growth, a concentrating effect could enrich these elements, as has been described for Y (Sliwinski et al., 2023). Although we do not study farmed calcite samples here, we propose that the calcite growth rate (or growth cessations) in relation to the drip-water-derived (or dust-derived) deposition can influence element incorporation in the stalagmite. During growth cessations, those TE accumulate (sticking) on the surface of a stalagmite and are incorporated into calcite when stalagmite growth restarts. A synchronous enriched layer emerges when analyzing TE in stalagmites (e.g., by LA-ICP-MS methods; Sliwinski and Stoll, 2021; Borsato et al., 2007). Future investigations combining colloidal TE in drip water and farmed calcite would improve the understanding of the calcite incorporation of such elements.
Over 16 months, monitoring of sampled La Vallina cave air (pCO2 and δ13Cair) and cave conditions (temperature and drip rates), in addition to drip water chemistry (δ13CDIC, δ18O, and δD; 16 trace elements) and bedrock chemistry, occurred. The main findings include the following:
-
Although drip rates in the summer season of low rainfall and high evapotranspiration dropped to about 20 % of the maximum winter season drip rate, the limited temporal variation in drip water δ18O and δD suggests a moderately mixed to well-mixed karst water reservoir at nearly all sites, as averaged by rainfall composition during recharge phases (positive P−PET). Isotopic offsets among sites are attributed to the varying significance of evaporation in the soil and karst prior to entering the discrete water reservoir and different transit times of water through the discrete reservoirs.
-
The carbon isotopic ratio of drip water (δ13CDIC) is lowest in summer and autumn and is likely controlled by biological processes of the covering vegetation and soil (root respiration and microbial activity). Temperature may be the dominant driver of vegetation, soil pCO2, and δ13CDIC on the seasonal scale, but additional factors such as soil moisture and the degradation of leaf matter in autumn, which enhances microbial activity, may also contribute to δ13CDIC variation. We do not find evidence for significant changes in the degree of open vs. closed system dissolution on the basis of 14C drip water measurements. Potential equilibration with cave air cannot be excluded.
-
Elements congruently dissolved from the host bedrock suggest higher degrees of bedrock dissolution in the summer and autumn months of higher soil pCO2. We find a limited significance of PCP in most drip water locations because the season of lowest cave pCO2 is also the season of highest drip rate, so two key drivers of PCP feature opposing seasonal trends. Estimation of speleothem growth rate using monitoring data suggests that some drip sites may precipitate CaCO3 in only one part of the year, whereas other locations may feature more continuous growth.
-
Other sources of elements substantially enriched, as compared to bedrock composition, are discussed. We find neither a synchronous autumnal peak in the concentration of insoluble (colloidal and detrital) trace elements nor a correlation between their concentration and drip rate, although the maximum concentrations in many of these elements generally occur in the wetter season. Synchronous peaks in such elements in stalagmites may therefore reflect other processes related to seasonal minima in speleothem growth or additional deposition from directly advected aerosols.
-
The combination of monitoring cave conditions, hydrology, and drip water chemistry clarifies processes significant to interpretation of speleothem records in this and other seasonally ventilating midlatitude cave systems.
Table A1Limit of quantification (LOQ) of elements measured on an Agilent 8800 QQQ-ICP-MS at ETH Zürich. To detect the LOQ, a series of dilutions of a standard solution was measured. Elements of samples not yielding a sufficient signal above the LOQ are listed in italics. Figure 6 in the paper shows data only above the LOQ.
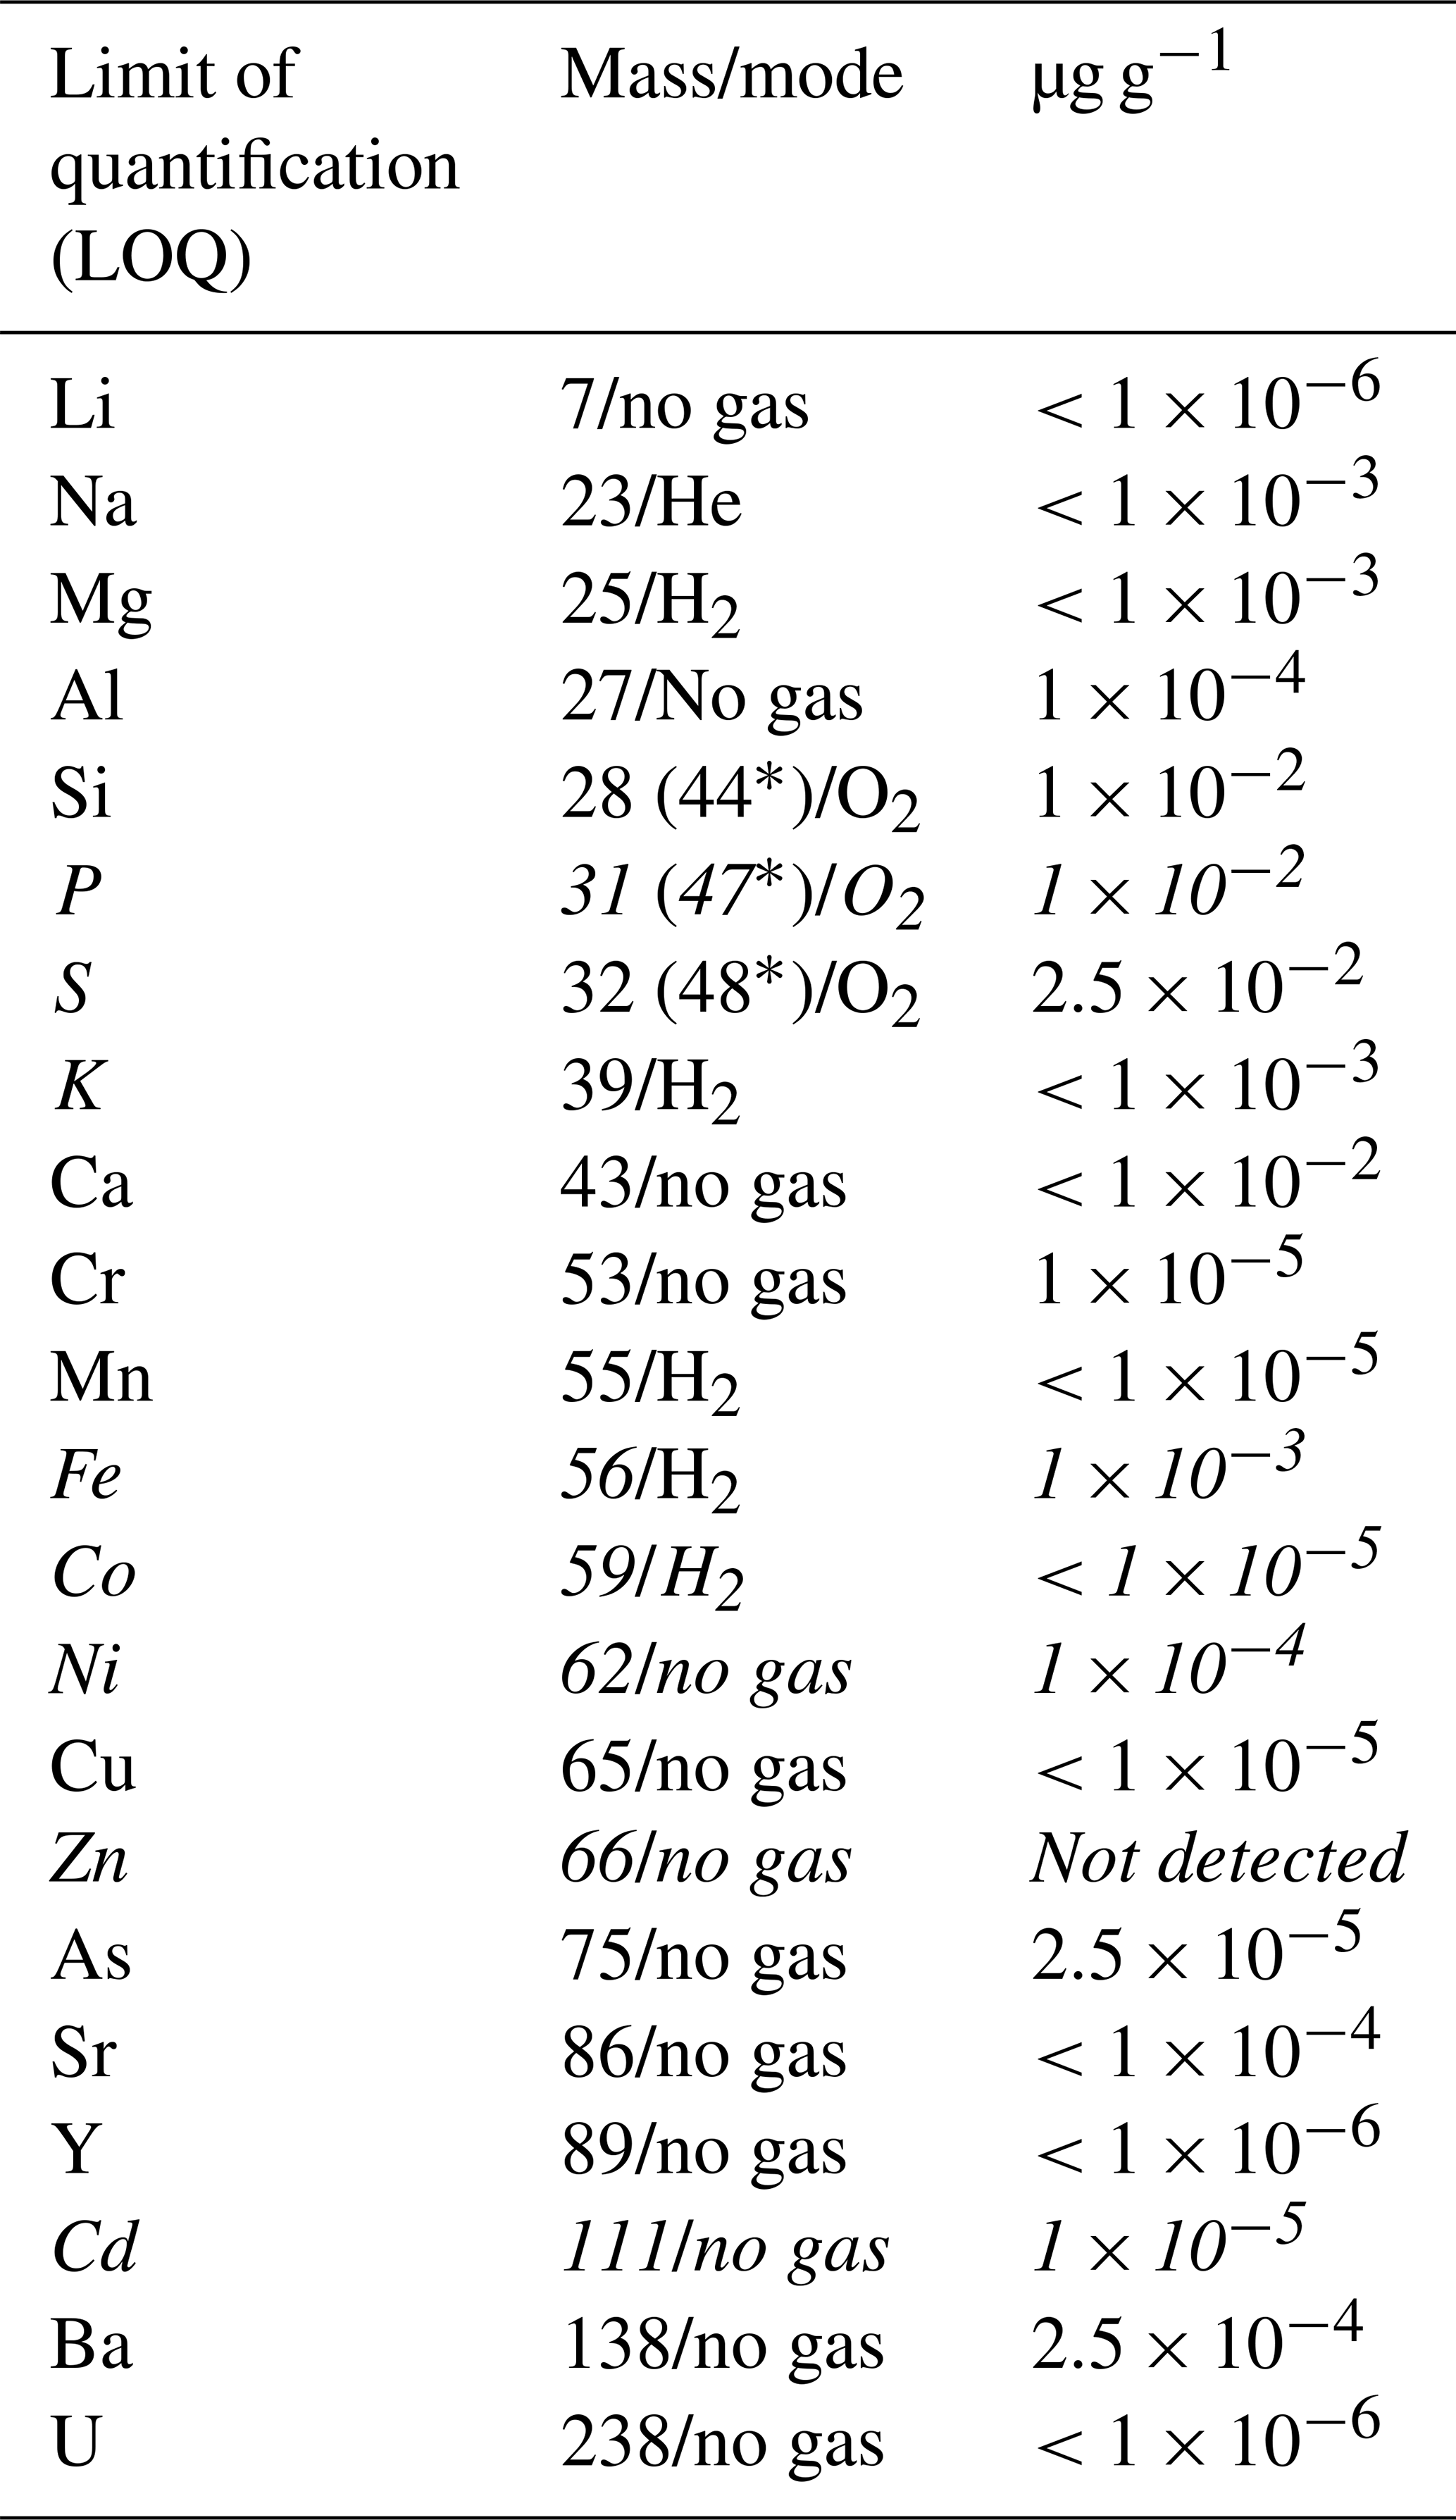
* Mass shift (+16) of the second quadrupole after a reaction with 16O in the reaction cell.
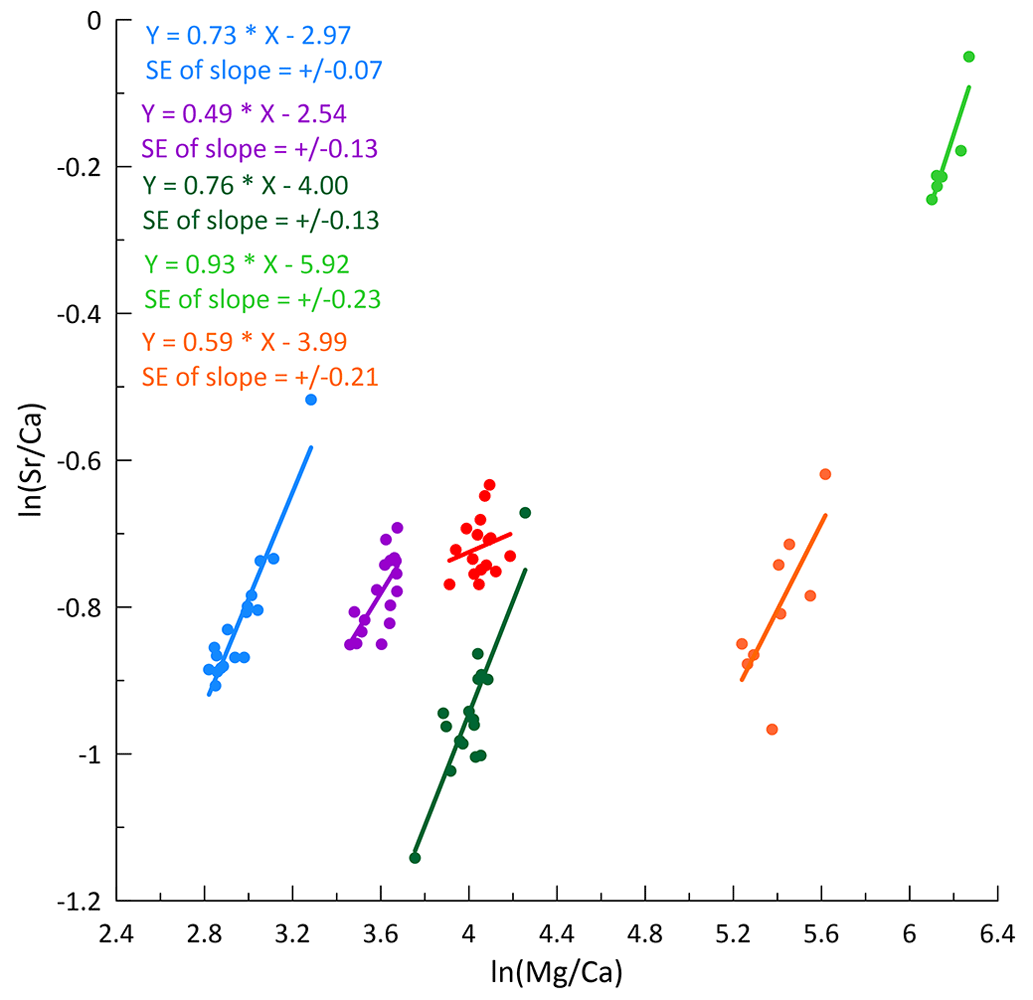
Figure A1Sinclair plot showing a clear relationship between and affected by PCP. The data set of Playground does not yield a statistically significant (p value too large) slope to be reported. Slope error (SE) is also given and often overlaps with the proposed slopes (Sinclair et al., 2012; Wassenburg et al., 2020). Additionally, varying partitioning coefficients affect the slopes.
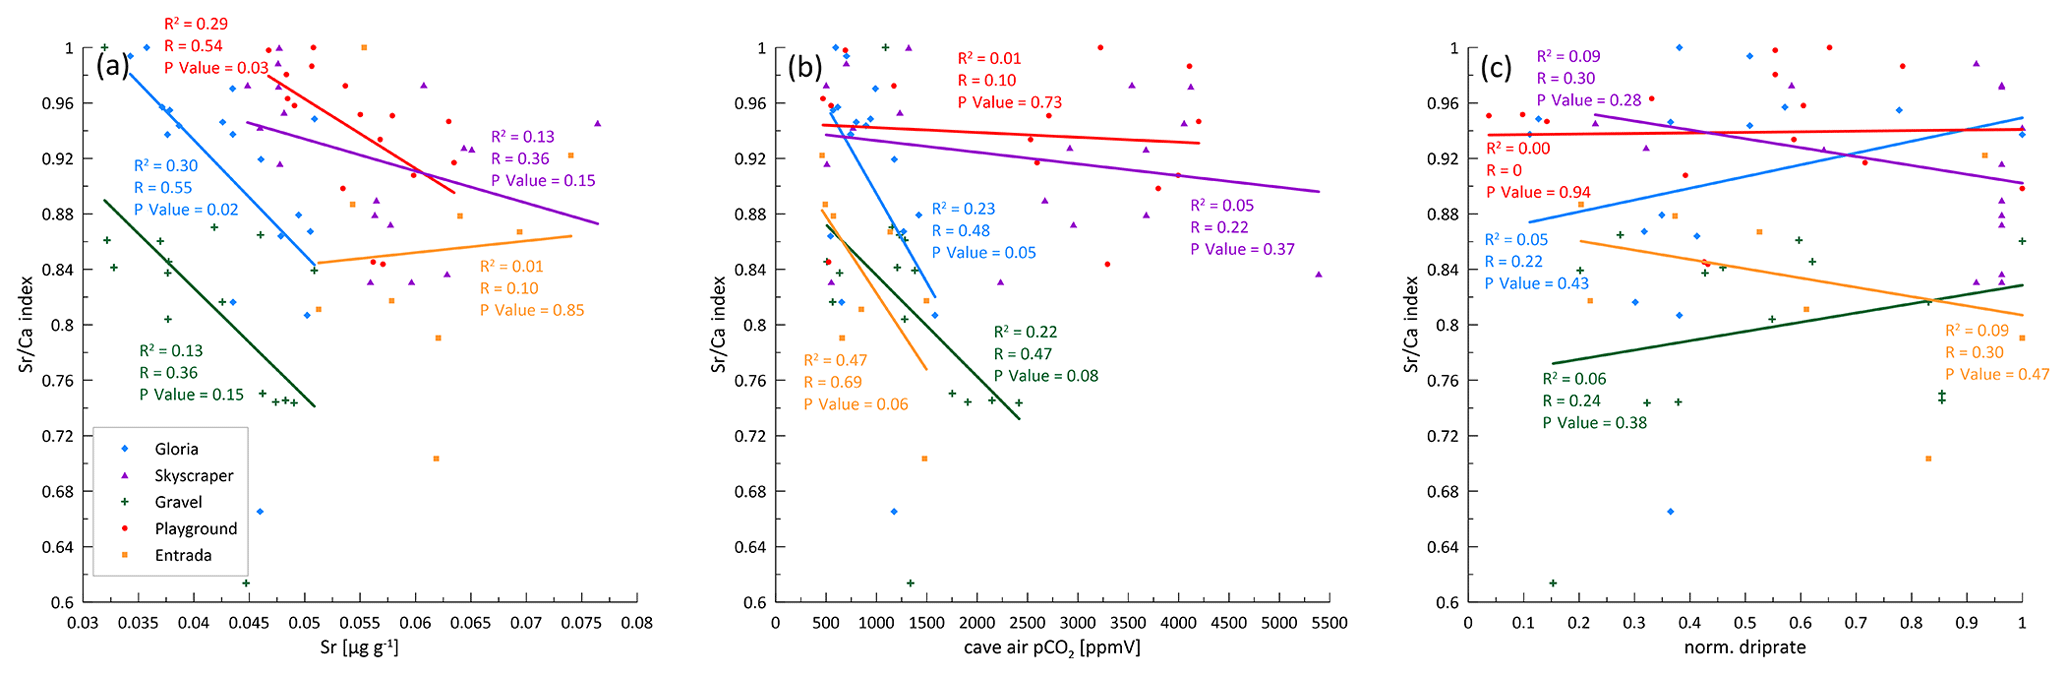
Figure A2Checking the potential driver of PCP indicated by the index. Weak relationships between the index and (a) the Sr concentration (representing soil CO2) and (b) cave air pCO2 (Gloria and Gravel) emerge. However, (c) the drip rate is hardly related to the index. A stronger CO2 gradient between the drip water and air in contact with drip water increases the PCP potential. Also, a longer exposure time at slower drip rates might increase degassing, thus favoring PCP.
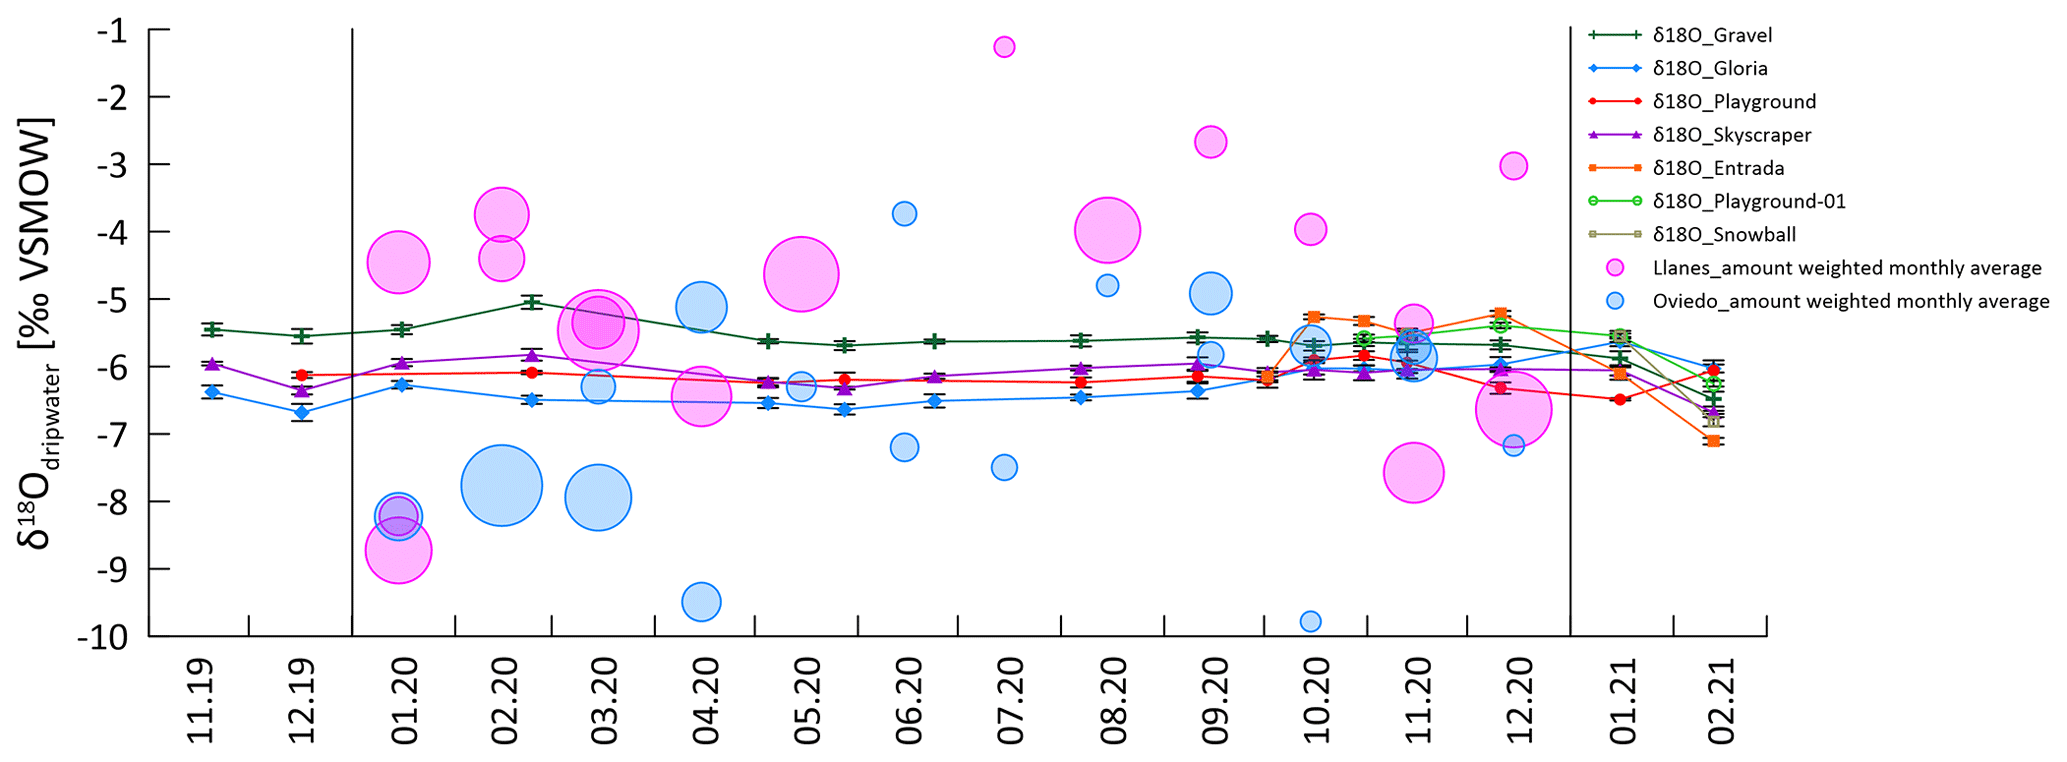
Figure A3Drip water δ18O compared with two independent rainfall-monitoring studies from NW Spain (Moreno et al., 2021; Stoll et al., 2015). The bubble size represents rain amount, and the δ18O values are rainfall amount-weighted monthly averages. Because these cases of monitoring were performed in other years (2006–2009 and 2015–2016), the monthly averages are plotted on top of the year 2020 (marked with vertical lines). A seasonal trend is visible in rainfall, with fewer negative δ18O values in summer months (and less rain), although variations are big between different years and months. The drip water δ18O signal supports the statement of a rather well-mixed drip water recharge reservoir. There can be multiple circles (pink and blue) because the monitoring of the rain was sampled for more than one seasonal cycle.
Table A2 ratios of bedrock samples from La Vallina cave. Note that the units for and Mn/Ca (mmol mol−1) are different to those of the other elements (µmol mol−1).
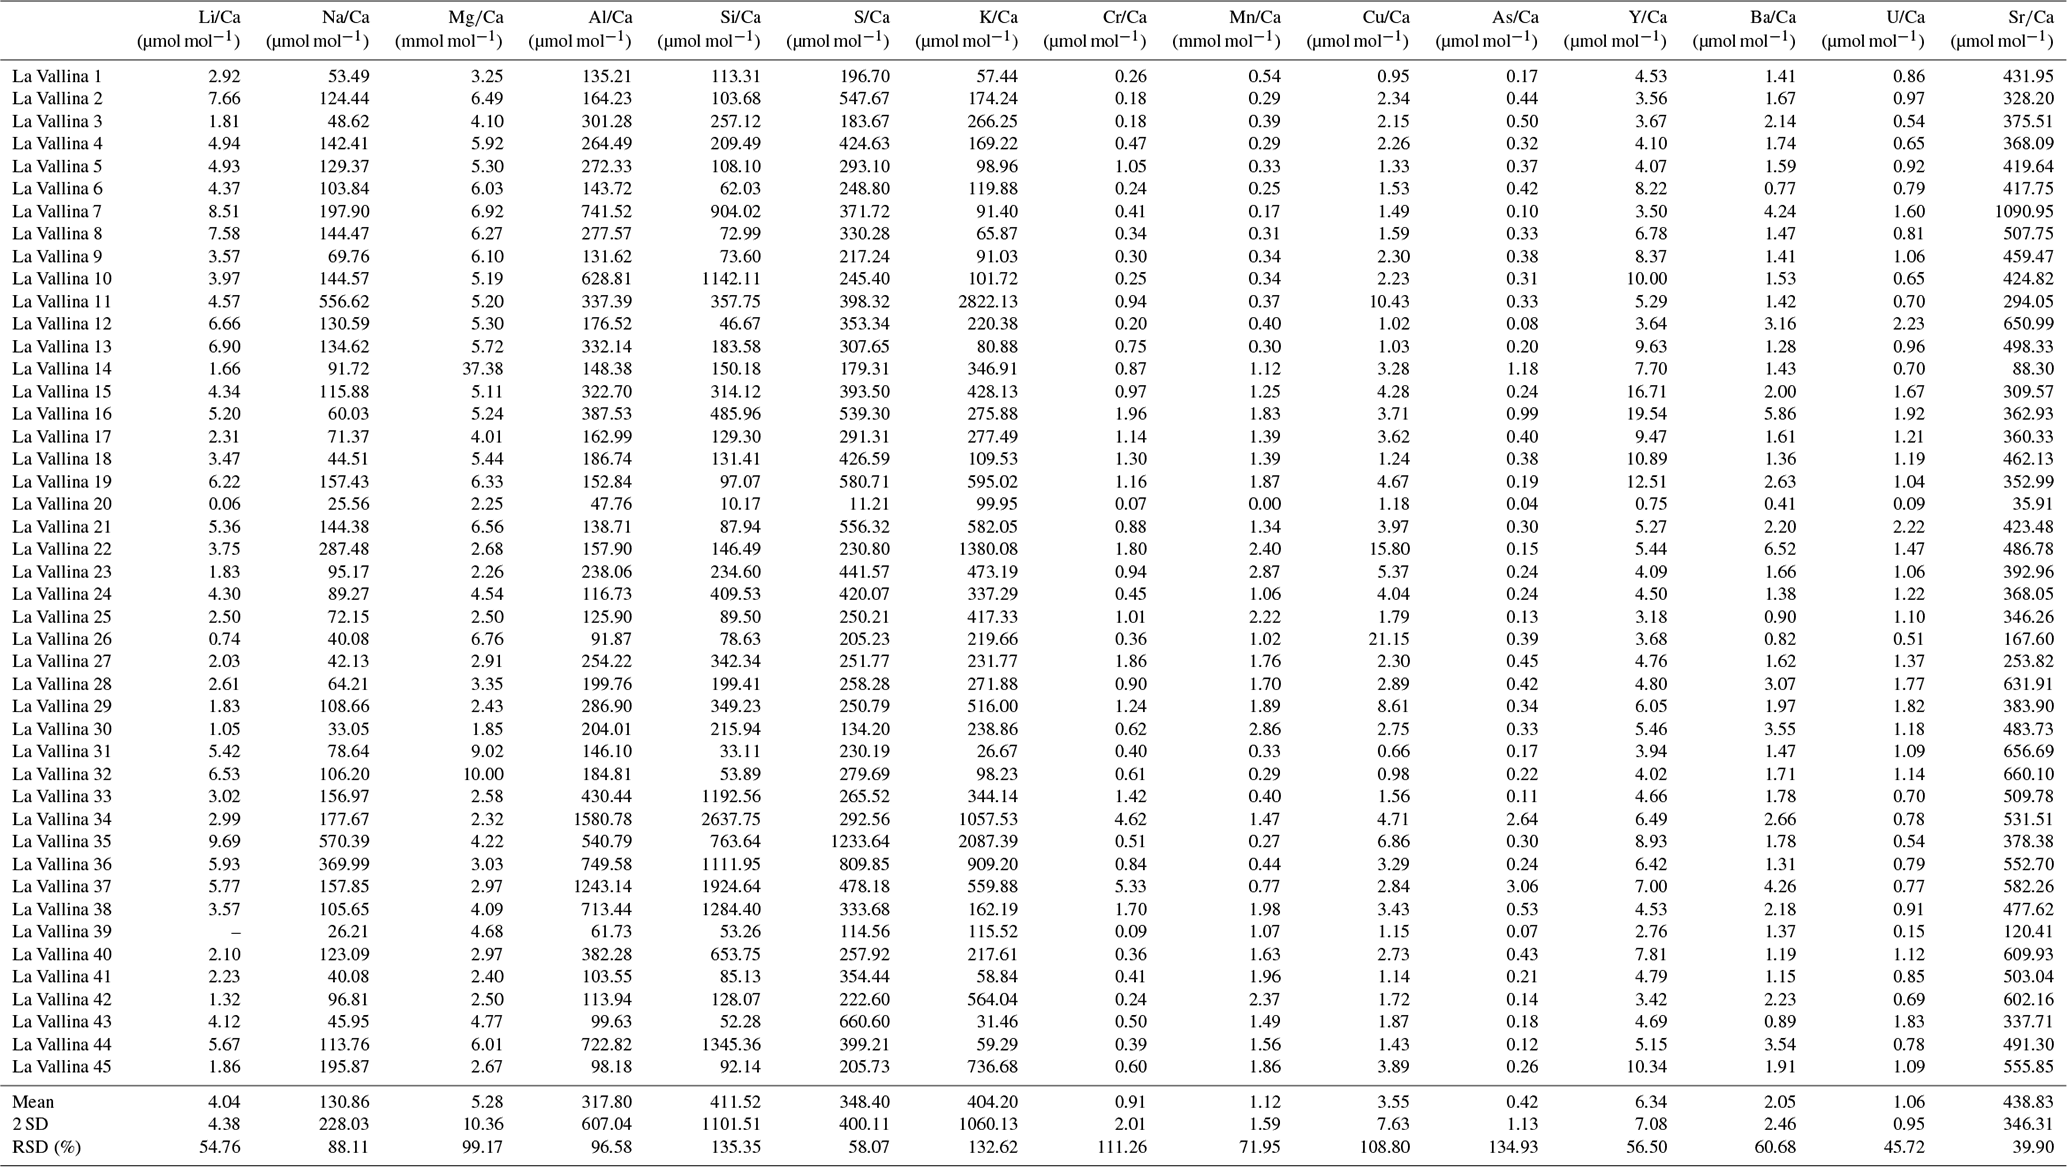
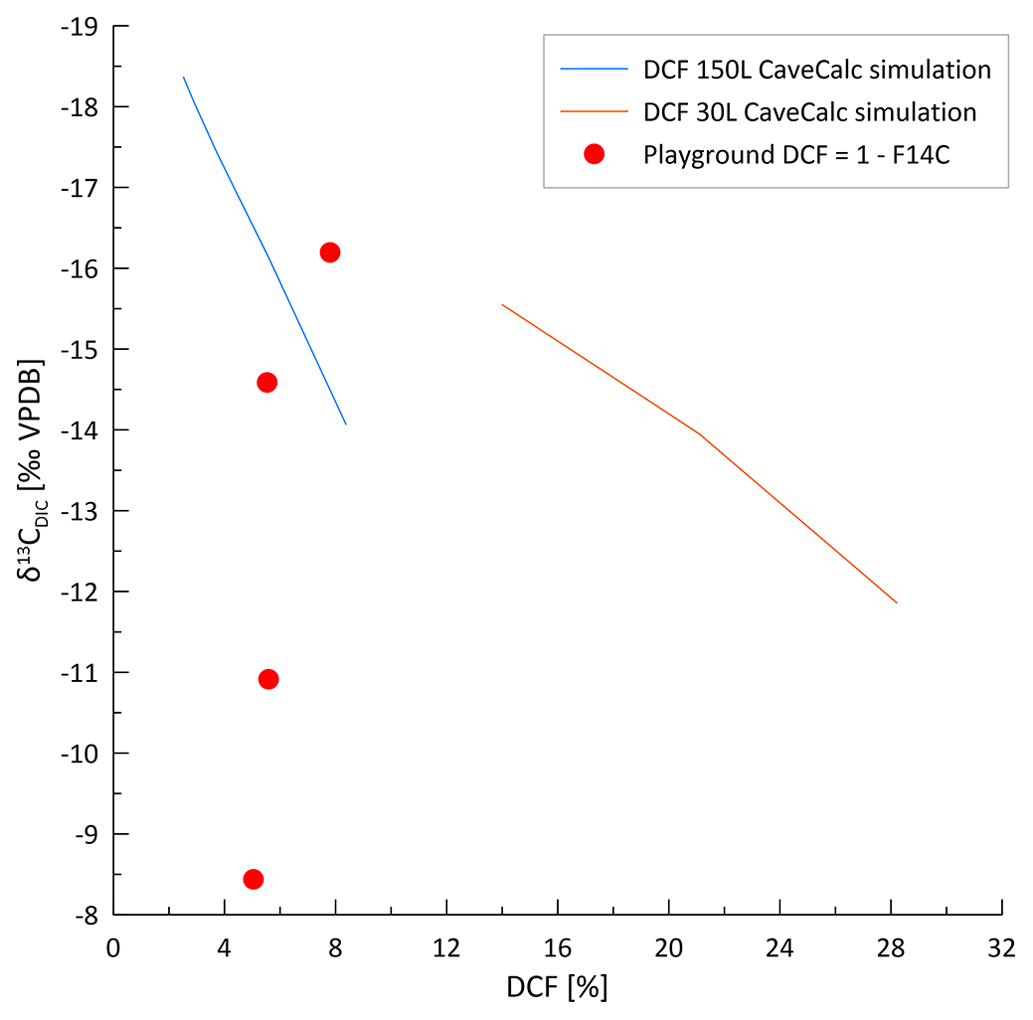
Figure A4DCF calculated from fraction modern (F14C; red dots) in contrast to CaveCalc simulations, with different gas volumes representing different open (150 L) vs. closed (30 L) system conditions. Consequently, the measured range of DCF (5 %–8 %) does not explain the range in δ13CDIC.
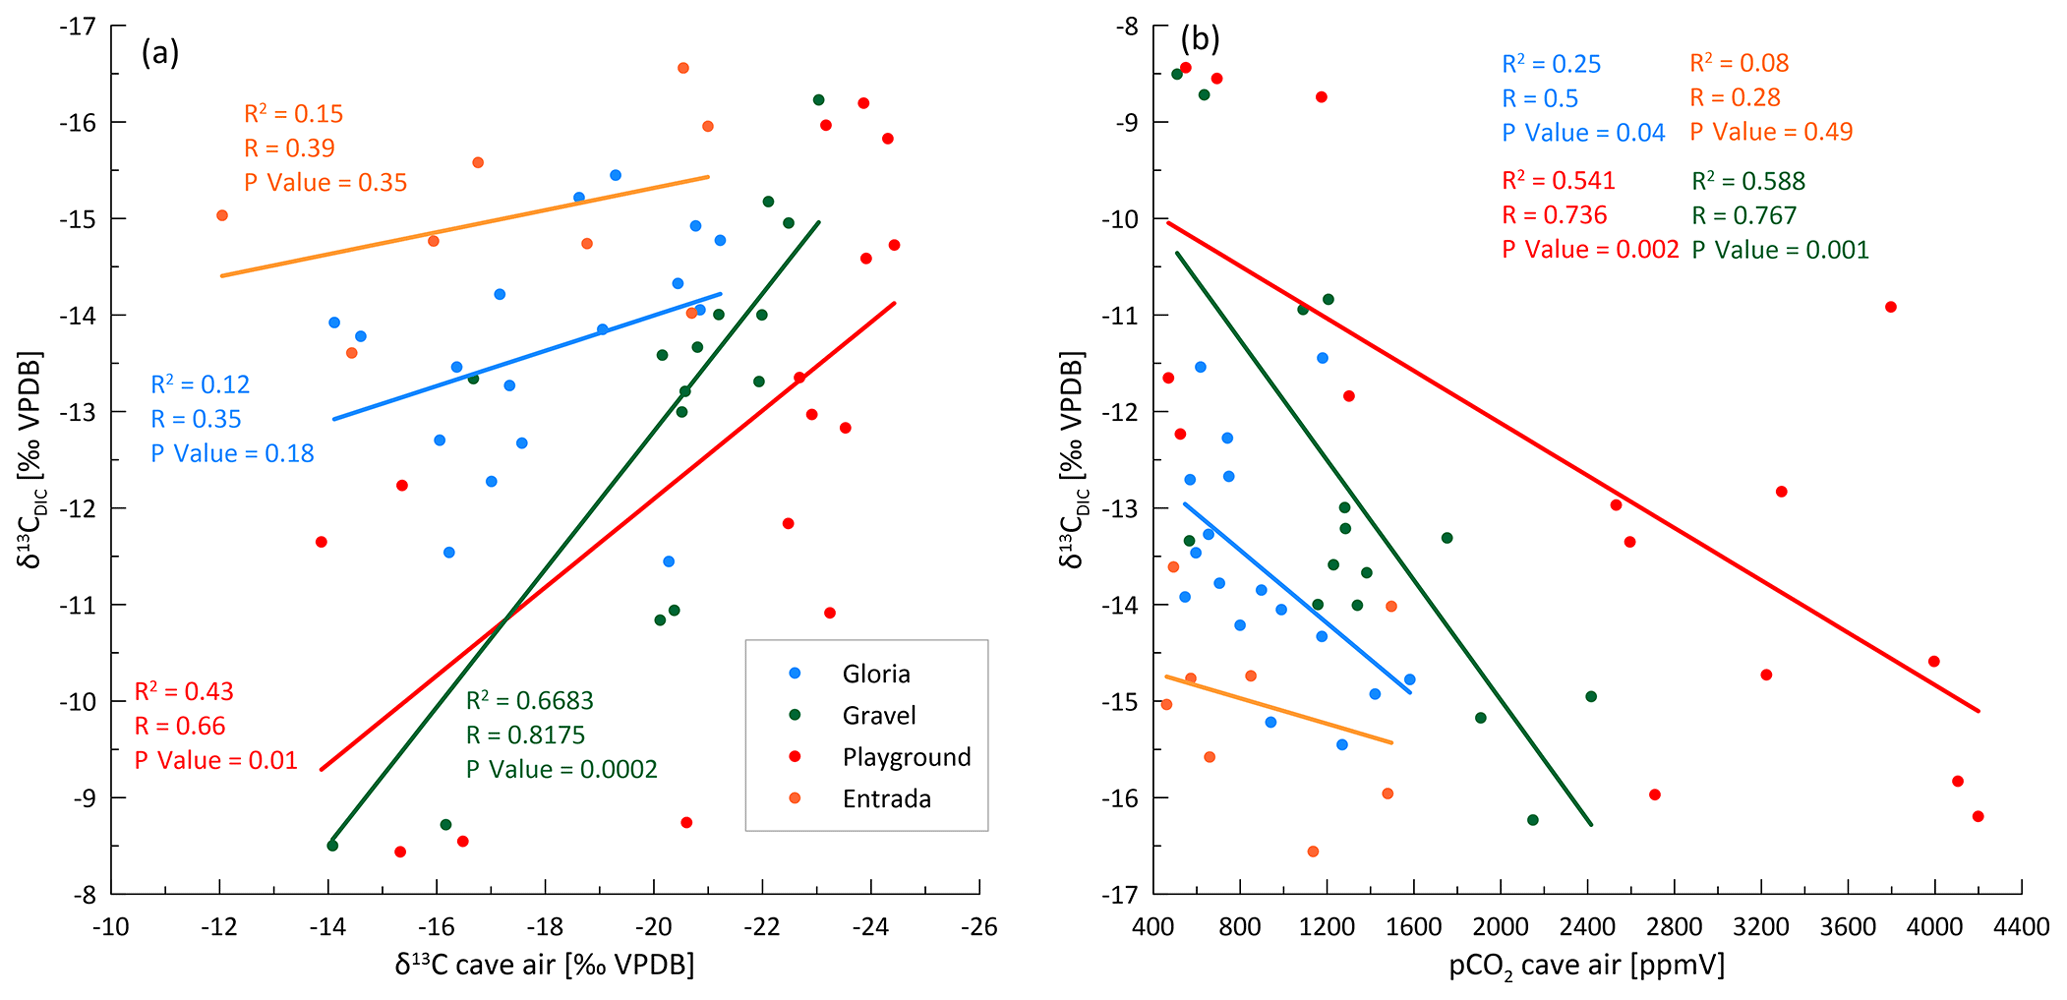
Figure A5(a) Correlation of drip water δ13CDIC and cave air δ13Cair to test potential gas exchange with cave air. The Pearson correlation coefficient (R), R2, and p value suggest reasonable correlations for Playground and Gravel but not for Entrada and Gloria. (b) A modest inverse correlation of pCO2 and δ13CDIC suggests degassing during periods of low cave air pCO2. Significant correlations are found for Playground and Gravel.
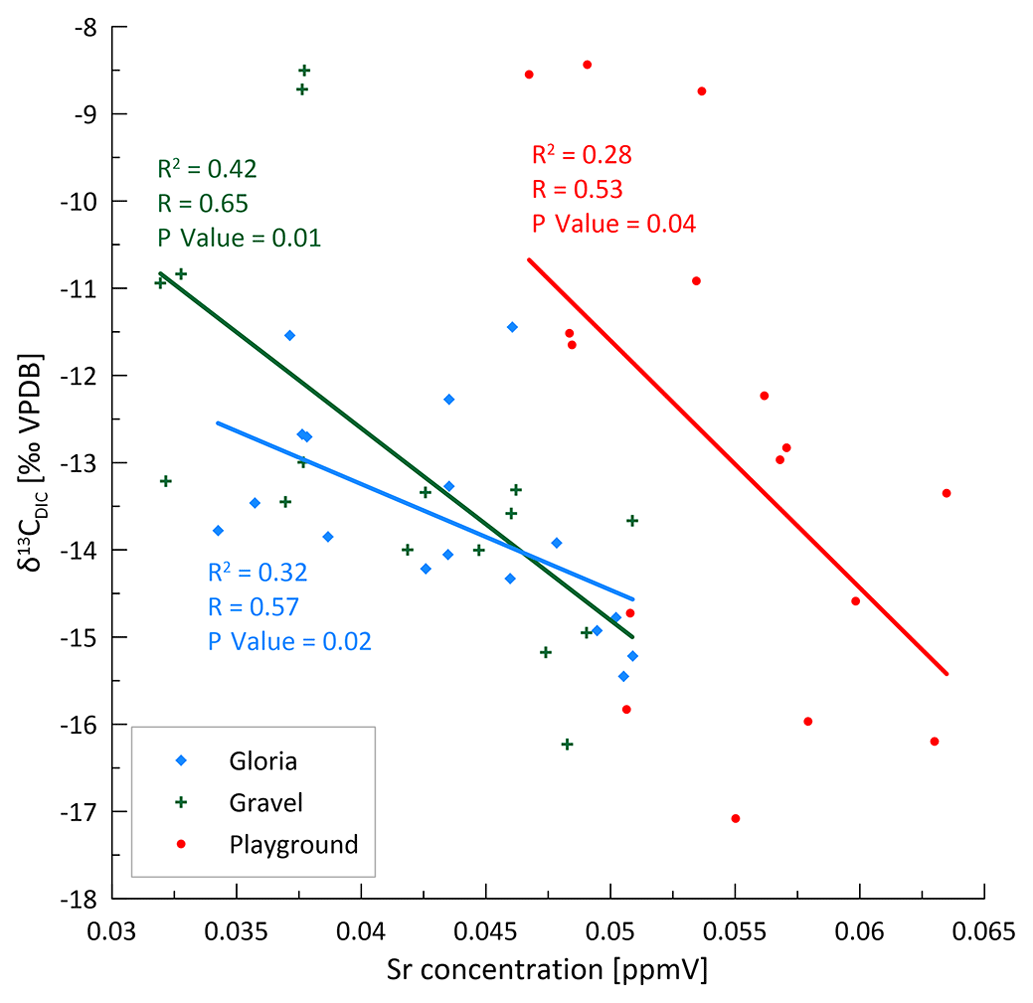
Figure A6Sr concentration is inversely correlated with δ13CDIC. This is interpreted as a bedrock dissolution signal, since a higher soil pCO2 with a microbial (negative) imprint driven by temperature results in stronger dissolution.
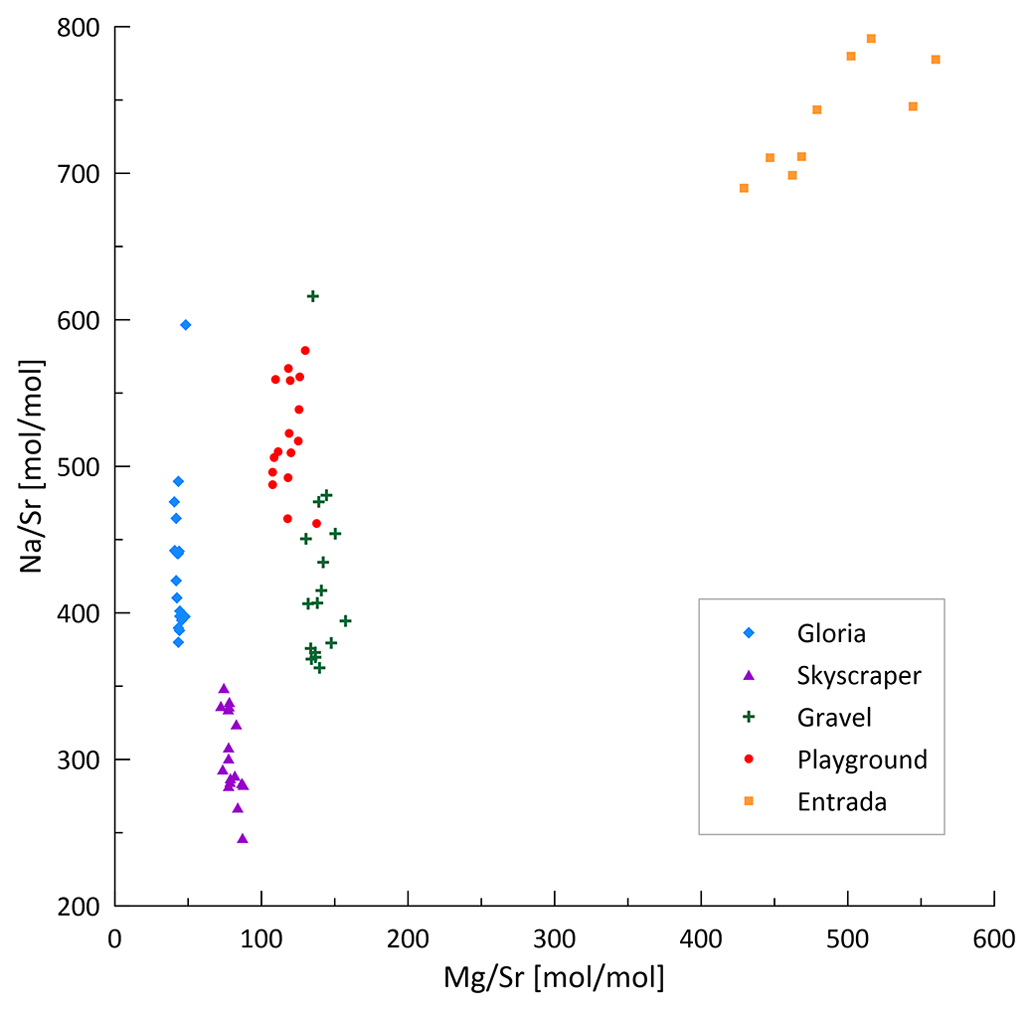
Figure A7 vs. scatterplot highlighting the likely marine aerosol contribution at Entrada as a positive correlation emerges. Drip sites deeper in the cave do not indicate a relationship between Na and Mg and thus are not affected by marine aerosols.
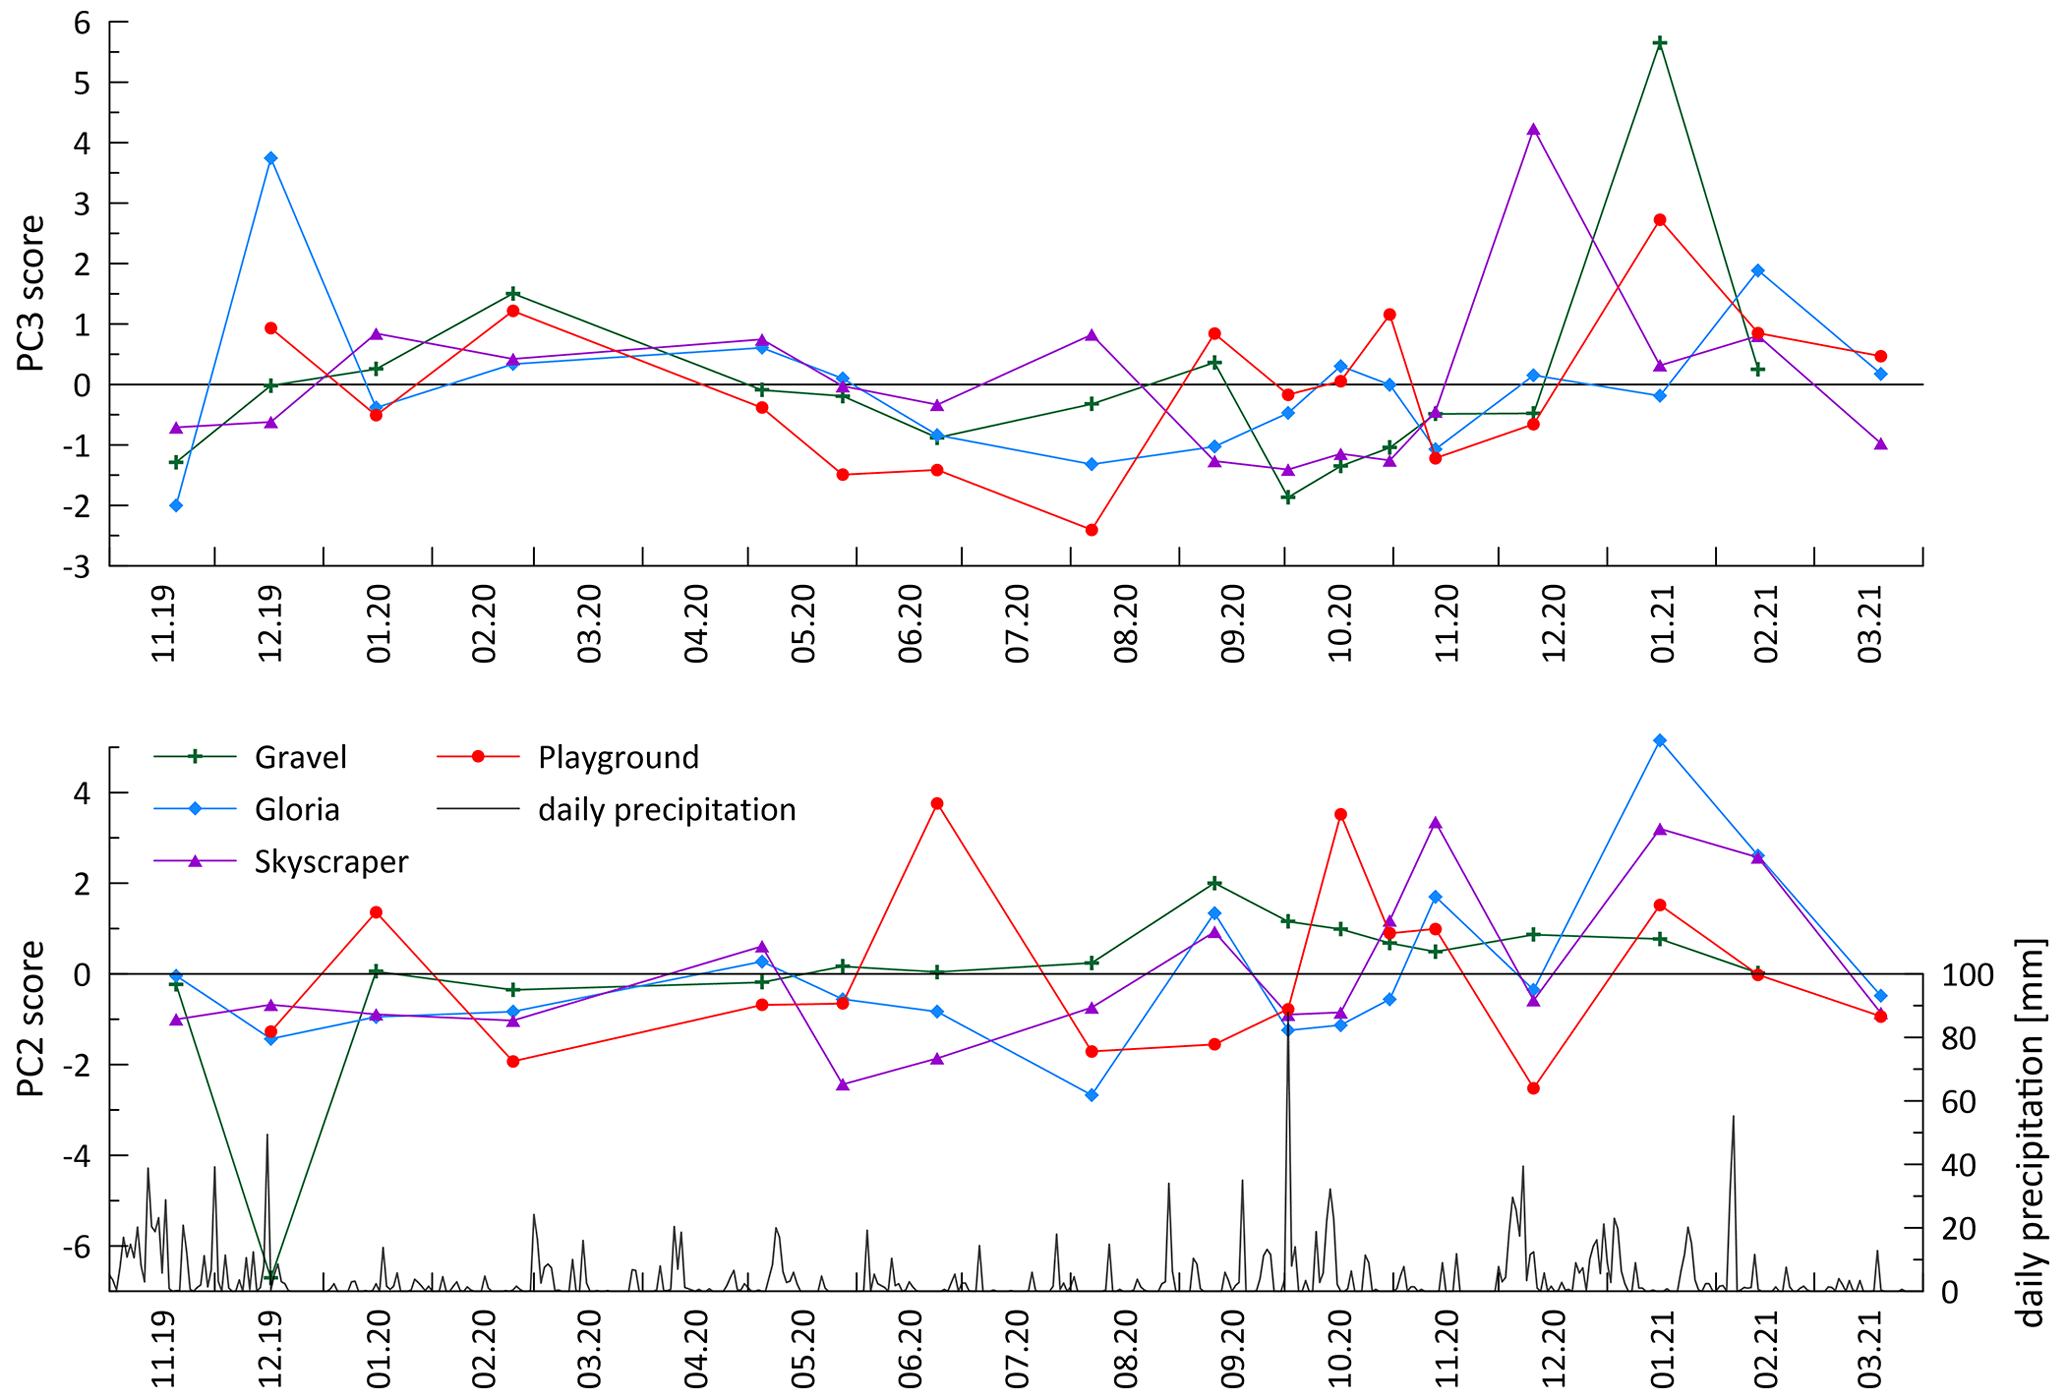
Figure A8Temporal evolution of PC 2 and PC 3 scores. PC 2 might be related to wash-in events (plotted with daily precipitation), since PC 2 elements are mostly spiky on event timescales (Fig. 6).
Table A3Correlation table of typical colloidal elements with Y (another colloidal element) to show that no clear correlation emerges. Pearson coefficients are statistically insignificant for numbers in italics (p value > 0.05), whereas normal numbers are statistically significant (p value < 0.05). However, in drip water, correlations are weak, and no trends are observed that contradict the findings in stalagmites with synchronous change and a high correlation.
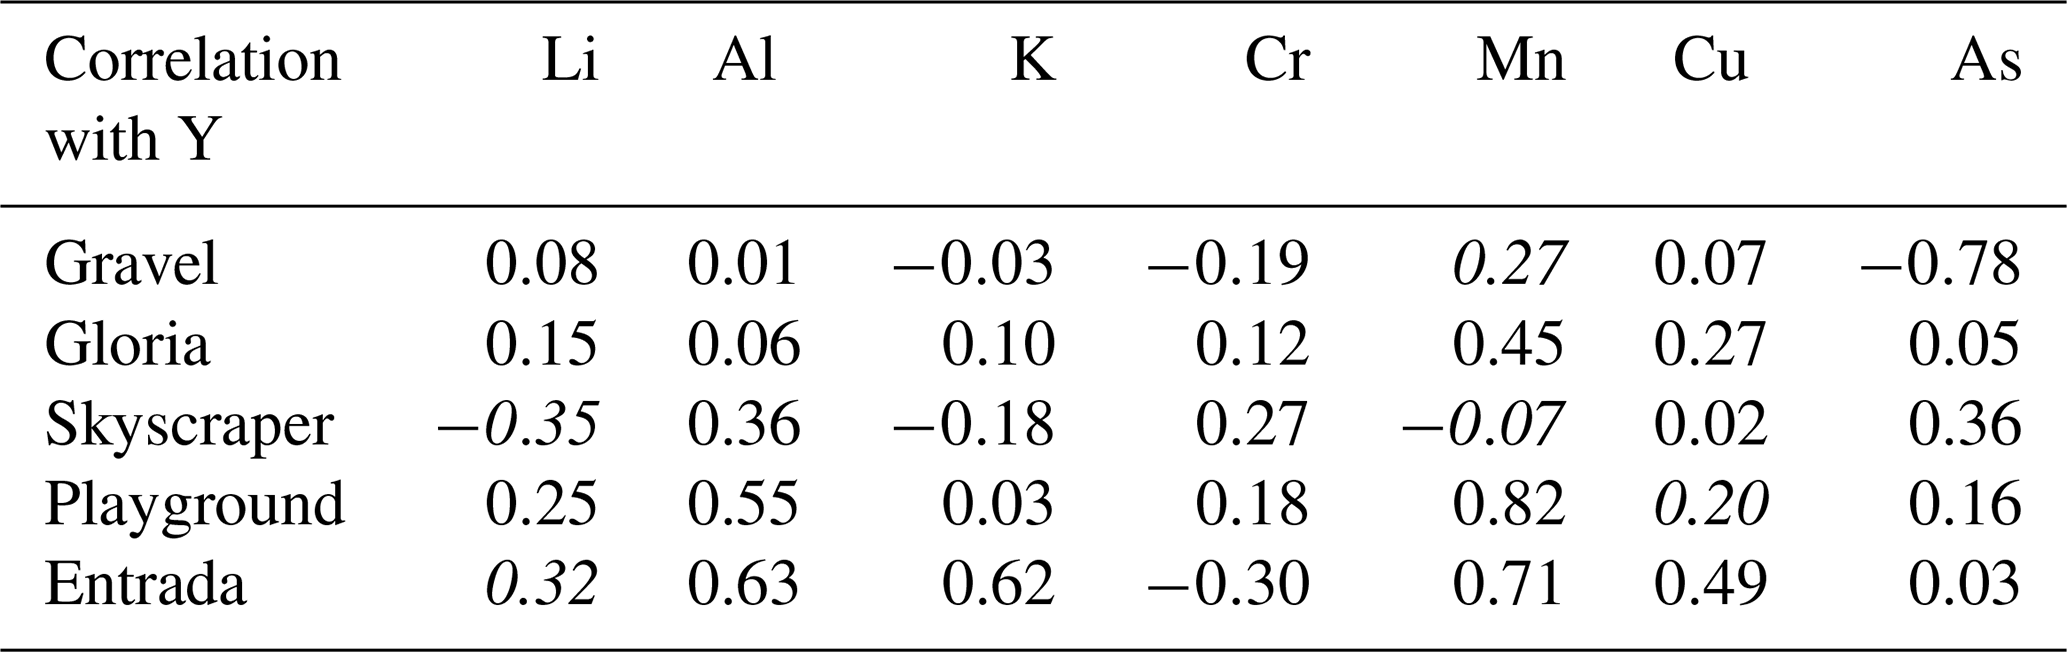
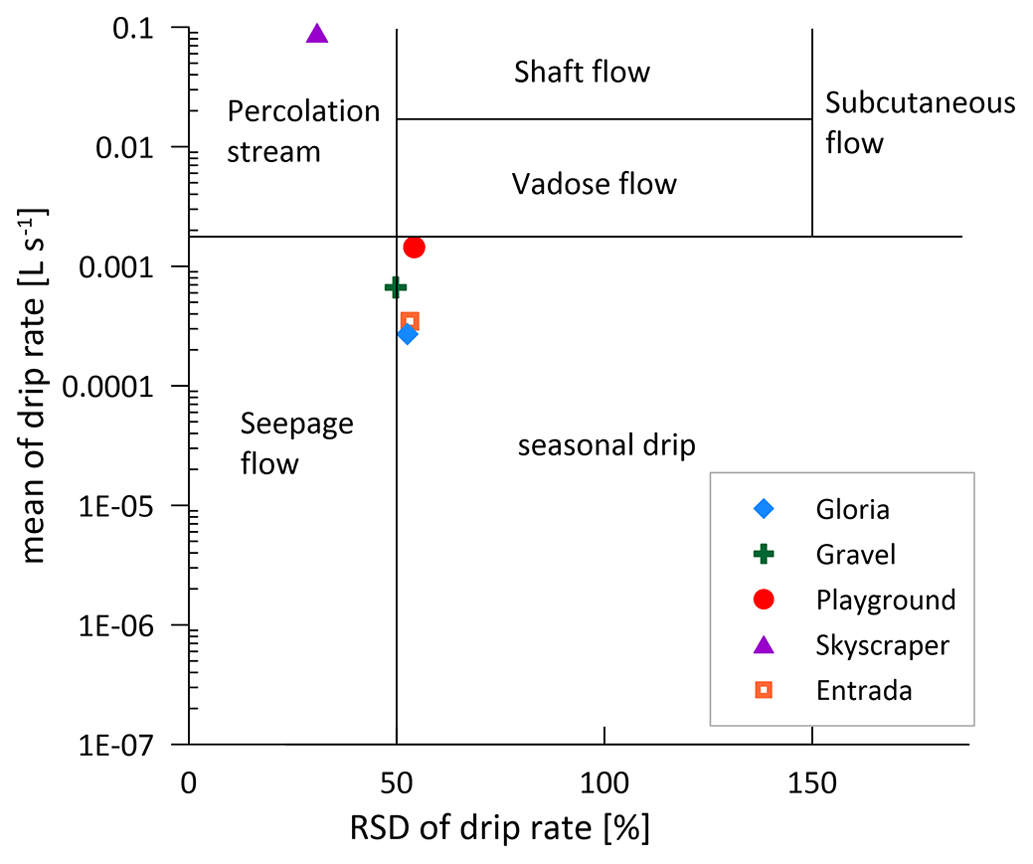
Figure A9Drip classification (after Baker et al., 1997). Most drips are seasonal close to the border with seepage flow. Only Skyscraper (behaving like a shower) behaves like a percolation stream. Since point sampling only allowed us to determine the instantaneous drip rate on the day of sampling, a higher RSD is possible (minimum and maximum might not be recorded).
Additional information is provided in the Appendix of this paper. The observational data were obtained from AEMET using the standard forms available on their website: https://opendata.aemet.es/centrodedescargas/inicio (AEMET, 2021).
OK, JS, and HS conceived and designed the research. HS supervised the study. OK, SG, LR, and HS collected the samples. OK, LE, and NH performed the lab analysis. OK, JS, and HS wrote and edited the paper, and all co-authors reviewed the paper.
The contact author has declared that none of the authors has any competing interests.
Publisher's note: Copernicus Publications remains neutral with regard to jurisdictional claims in published maps and institutional affiliations.
We thank Madalina Jaggi for the analytical support of δ13CDIC and δ18Odripwater. We thank Pauline Treble and Jasper Wassenburg for valuable input that improved the paper.
This research has been supported by the Eidgenössische Technische Hochschule Zürich (grant no. ETH-1318-1).
This paper was edited by Natalie Orlowski and reviewed by two anonymous referees.
AEMET: AEMET OpenData, State Meteorological Agency of Spain, https://opendata.aemet.es/centrodedescargas/inicio (last access: 13 September 2021), 2021.
Álvarez, R., Ordóñez, A., Canteli, P., and De Miguel, E.: Unconventional gas resources in the Cantabrian Zone (NW Spain): A comprehensive preliminary assessment, Geol. J., 54, 2608–2620, https://doi.org/10.1002/gj.3314, 2019.
Baker, A., Barnes, W. L., and Smart, P. L.: Variations in the discharge and organic matter content of stalagmite drip waters in Lower Cave, Bristol, Hydrol. Process., 11, 1541–1555, https://doi.org/10.1002/(SICI)1099-1085(199709)11:11<1541::AID-HYP484>3.0.CO;2-Z, 1997.
Baker, A., Hartmann, A., Duan, W., Hankin, S., Comas-Bru, L., Cuthbert, M. O., Treble, P. C., Banner, J., Genty, D., Baldini, L. M., Bartolomé, M., Moreno, A., Pérez-Mejías, C., and Werner, M.: Global analysis reveals climatic controls on the oxygen isotope composition of cave drip water, Nat. Commun., 10, 2984, https://doi.org/10.1038/s41467-019-11027-w, 2019.
Baker, A., Berthelin, R., Cuthbert, M. O., Treble, P. C., Hartmann, A., and Kss Cave Studies Team: Rainfall recharge thresholds in a subtropical climate determined using a regional cave drip water monitoring network, J. Hydrol., 587, 125001, https://doi.org/10.1016/j.jhydrol.2020.125001, 2020.
Baker, A., Scheller, M., Oriani, F., Mariethoz, G., Hartmann, A., Wang, Z., and Cuthbert, M. O.: Quantifying temporal variability and spatial heterogeneity in rainfall recharge thresholds in a montane karst environment, J. Hydrol., 594, 125965, https://doi.org/10.1016/j.jhydrol.2021.125965, 2021.
Baldini, J. U. L., McDermott, F., Baldini, L. M., Ottley, C. J., Linge, K. L., Clipson, N., and Jarvis, K. E.: Identifying short-term and seasonal trends in cave drip water trace element concentrations based on a daily-scale automatically collected drip water dataset, Chem. Geol., 330–331, 1–16, https://doi.org/10.1016/j.chemgeo.2012.08.009, 2012.
Benzaama, M. H., Menhoudj, S., Kontoleon, K. J., Mokhtari, A. M., and Lekhal, M. C.: Investigation of the thermal behavior of a combined geothermal system for cooling with regards to Algeria's climate, Sustain. Cities Soc., 43, 121–133, https://doi.org/10.1016/j.scs.2018.08.016, 2018.
Borsato, A., Frisia, S., Fairchild, I. J., Somogyi, A., and Susini, J.: Trace element distribution in annual stalagmite laminae mapped by micrometer-resolution X-ray fluorescence: Implications for incorporation of environmentally significant species, Geochim. Cosmochim. Ac., 71, 1494–1512, https://doi.org/10.1016/j.gca.2006.12.016, 2007.
Borsato, A., Frisia, S., and Miorandi, R.: Carbon dioxide concentration in temperate climate caves and parent soils over an altitudinal gradient and its influence on speleothem growth and fabrics, Earth Surf. Proc. Land., 40, 1158–1170, https://doi.org/10.1002/esp.3706, 2015.
Bradley, C., Baker, A., Jex, C. N., and Leng, M. J.: Hydrological uncertainties in the modelling of cave drip-water ä18O and the implications for stalagmite palaeoclimate reconstructions, Quaternary Sci. Rev., 29, 2201–2214, https://doi.org/10.1016/j.quascirev.2010.05.017, 2010.
Breitenbach, S. F. M., Lechleitner, F. A., Meyer, H., Diengdoh, G., Mattey, D., and Marwan, N.: Cave ventilation and rainfall signals in dripwater in a monsoonal setting – a monitoring study from NE India, Chem. Geol., 402, 111–124, https://doi.org/10.1016/j.chemgeo.2015.03.011, 2015.
Brooksbank, K., Veneklaas, E. J., White, D. A., and Carter, J. L.: The fate of hydraulically redistributed water in a semi-arid zone eucalyptus species, Tree Physiol., 31, 649–658, https://doi.org/10.1093/treephys/tpr052, 2011.
Craig, H.: Isotopic Variations in Meteoric Waters, Science, 133, 1702–1703, https://doi.org/10.1126/science.133.3465.1702, 1961.
Dasgupta, S., Mohanty, B. P., and Köhne, J. M.: Impacts of Juniper Vegetation and Karst Geology on Subsurface Flow Processes in the Edwards Plateau, Texas, Vadose Zone J., 5, 1076–1085, https://doi.org/10.2136/vzj2005.0073, 2006.
Deininger, M. and Scholz, D.: ISOLUTION 1.0: an ISOtope evoLUTION model describing the stable oxygen (δ18O) and carbon (δ13C) isotope values of speleothems, Int. J. Speleol., 48, 21–32, 2019.
Deininger, M., Hansen, M., Fohlmeister, J., Schröder-Ritzrau, A., Burstyn, Y., and Scholz, D.: Are oxygen isotope fractionation factors between calcite and water derived from speleothems systematically biased due to prior calcite precipitation (PCP)?, Geochim. Cosmochim. Ac., 305, 212–227, https://doi.org/10.1016/j.gca.2021.03.026, 2021.
de Villiers, S., Greaves, M., and Elderfield, H.: An intensity ratio calibration method for the accurate determination of and of marine carbonates by ICP-AES, Geochem. Geophy. Geosy., 3, 1–14, https://doi.org/10.1029/2001GC000169, 2002.
Domínguez-Villar, D., Krklec, K., Boomer, I., and Fairchild, I. J.: ISODRIP, a model to transfer the δ18O signal of precipitation to drip water – Implementation of the model for Eagle Cave (central Spain), Sci. Total Environ., 797, 149188, https://doi.org/10.1016/j.scitotenv.2021.149188, 2021.
Dredge, J., Fairchild, I. J., Harrison, R. M., Fernandez-Cortes, A., Sanchez-Moral, S., Jurado, V., Gunn, J., Smith, A., Spötl, C., Mattey, D., Wynn, P. M., and Grassineau, N.: Cave aerosols: distribution and contribution to speleothem geochemistry, Quaternary Sci. Rev., 63, 23–41, https://doi.org/10.1016/j.quascirev.2012.11.016, 2013.
Dreybrodt, W.: Chemical kinetics, speleothem growth and climate, Boreas, 28, 347–356, https://doi.org/10.1111/j.1502-3885.1999.tb00224.x, 1999.
Eylem, C., Erten, H. N., and Göktürk, H.: Sorption-desorption behaviour of barium on clays, J. Environ. Radioactiv., 11, 183–200, https://doi.org/10.1016/0265-931X(90)90061-Y, 1990.
Fairchild, I. J. and Baker, A.: Speleothem Science: from process to past environments, in: Blackwell Quaternary Geoscience Series, Wiley-Blackwell, ISBN 978-1-4051-9620-8, 2012.
Fairchild, I. J. and Treble, P. C.: Trace elements in speleothems as recorders of environmental change, Quaternary Sci. Rev. 28, 449–468, https://doi.org/10.1016/j.quascirev.2008.11.007, 2009.
Fairchild, I. J., Borsato, A., Tooth, A. F., Frisia, S., Hawkesworth, C. J., Huang, Y., McDermott, F., and Spiro, B.: Controls on trace element (Sr–Mg) compositions of carbonate cave waters: implications for speleothem climatic records, Chem. Geol., 166, 255–269, https://doi.org/10.1016/S0009-2541(99)00216-8, 2000.
Fairchild, I. J., Spötl, C., Frisia, S., Borsato, A., Susini, J., Wynn, P. M., Cauzid, J., EIMF, Pedley, H. M., and Rogerson, M.: Petrology and geochemistry of annually laminated stalagmites from an Alpine cave (Obir, Austria): seasonal cave physiology, in: Tufas and Speleothems: Unravelling the Microbial and Physical Controls, Geological Society of London, https://doi.org/10.1144/sp336.16, 2010.
Faraji, M., Borsato, A., Frisia, S., Hellstrom, J. C., Lorrey, A., Hartland, A., Greig, A., and Mattey, D. P.: Accurate dating of stalagmites from low seasonal contrast tropical Pacific climate using Sr 2D maps, fabrics and annual hydrological cycles, Sci. Rep., 11, 2178, https://doi.org/10.1038/s41598-021-81941-x, 2021.
Feng, W., Casteel, R. C., Banner, J. L., and Heinze-Fry, A.: Oxygen isotope variations in rainfall, drip-water and speleothem calcite from a well-ventilated cave in Texas, USA: Assessing a new speleothem temperature proxy, Geochim. Cosmochim. Ac., 127, 233–250, https://doi.org/10.1016/j.gca.2013.11.039, 2014.
Fohlmeister, J., Voarintsoa, N. R., Lechleitner, F., Boyd, M., Brandstätter, S., Jacobson, M., and Oster, J.: Main Controls on the Stable Carbon Isotope Composition of Speleothems, Geochim. Cosmochim. Ac., 279, 67–87, https://doi.org/10.1016/j.gca.2020.03.042, 2020.
Frisia, S., Fairchild, I. J., Fohlmeister, J., Miorandi, R., Spötl, C., and Borsato, A.: Carbon mass-balance modelling and carbon isotope exchange processes in dynamic caves, Geochim. Cosmochim. Ac., 75, 380–400, 2011.
Genty, D., Blamart, D., Ghaleb, B., Plagnes, V., Causse, C., Bakalowicz, M., Zouari, K., Chkir, N., Hellstrom, J., Wainer, K., and Bourges, F.: Timing and dynamics of the last deglaciation from European and North African ä13C stalagmite profiles – comparison with Chinese and South Hemisphere stalagmites, Quaternary Sci. Rev., 25, 2118–2142, https://doi.org/10.1016/j.quascirev.2006.01.030, 2006.
Gibbons, W. and Moreno, T.: The geology of Spain, The Geological Society, London, 649 pp., ISBN 1-86239-110-6, 2002.
Hamamoto, T. and Uchida, Y.: Sodium Contents in Dairy Cow Urine and Soil Aggregate Sizes Influence the Amount of Nitrogen Lost from Soil, Appl. Environ. Soil Sci., 2015, 275985, https://doi.org/10.1155/2015/275985, 2015.
Hartland, A., Fairchild, I. J., Lead, J. R., Borsato, A., Baker, A., Frisia, S., and Baalousha, M.: From soil to cave: Transport of trace metals by natural organic matter in karst dripwaters, Chem. Geol., 304–305, 68–82, https://doi.org/10.1016/j.chemgeo.2012.01.032, 2012.
Hartland, A., Fairchild, I. J., Müller, W., and Dominguez-Villar, D.: Preservation of NOM-metal complexes in a modern hyperalkaline stalagmite: Implications for speleothem trace element geochemistry, Geochim. Cosmochim. Ac., 128, 29–43, https://doi.org/10.1016/j.gca.2013.12.005, 2014.
Hasenmueller, E. A., Jin, L., Stinchcomb, G. E., Lin, H., Brantley, S. L., and Kaye, J. P.: Topographic controls on the depth distribution of soil CO2 in a small temperate watershed, Appl. Geochem., 63, 58–69, https://doi.org/10.1016/j.apgeochem.2015.07.005, 2015.
Hodges, C., Kim, H., Brantley, S. L., and Kaye, J.: Soil CO2 and O2 Concentrations Illuminate the Relative Importance of Weathering and Respiration to Seasonal Soil Gas Fluctuations, Soil Sci. Soc. Am. J., 83, 1167–1180, https://doi.org/10.2136/sssaj2019.02.0049, 2019.
IAEA/WMO: Global Network of Isotopes in Precipitation., The GNIP Database, https://www.gtn-h.info/gtnh_networks/gnip-gnir/ (last access: 10 January 2022), 2022.
Instituto Geográfico Nacional: Plan Nacional Ortofotografía Aérea – PNOA of Spanish IGN, https://centrodedescargas.cnig.es/CentroDescargas/index.jsp (last access: 24 November 2022), 2022.
James, E. W., Banner, J. L., and Hardt, B.: A global model for cave ventilation and seasonal bias in speleothem paleoclimate records, Geochem. Geophy. Geosy., 16, 1044–1051, https://doi.org/10.1002/2014GC005658, 2015.
Johnson, K. R., Hu, C., Belshaw, N. S., and Henderson, G. M.: Seasonal trace-element and stable-isotope variations in a Chinese speleothem: The potential for high-resolution paleomonsoon reconstruction, Earth Planet. Sc. Lett., 244, 394–407, https://doi.org/10.1016/j.epsl.2006.01.064, 2006.
Kabata-Pendias, A. and Pendias, H.: Trace elements in soils and plants, in: 3rd Edn., CRC Press LLC, Boca Raton, Florida, 331 pp., ISBN 0-8493-1575-1, 2000.
Krishna, M. P. and Mohan, M.: Litter decomposition in forest ecosystems: a review, Energ. Ecol. Environ., 2, 236–249, https://doi.org/10.1007/s40974-017-0064-9, 2017.
Lechleitner, F. A., Day, C. C., Kost, O., Wilhelm, M., Haghipour, N., Henderson, G. M., and Stoll, H. M.: Stalagmite carbon isotopes suggest deglacial increase in soil respiration in western Europe driven by temperature change, Clim. Past, 17, 1903–1918, https://doi.org/10.5194/cp-17-1903-2021, 2021.
Lyu, Y., Luo, W., Wang, Y., Zeng, G., Wang, Y., Cheng, A., Zhang, L., Chen, J., Cai, X., Zhang, R., and Wang, S.: Impacts of cave ventilation on drip water δ13CDIC and its paleoclimate implication, Quatern. Int., 547, 7–21, https://doi.org/10.1016/j.quaint.2020.03.050, 2020.
Markowska, M., Baker, A., Andersen, M. S., Jex, C. N., Cuthbert, M. O., Rau, G. C., Graham, P. W., Rutlidge, H., Mariethoz, G., Marjo, C. E., Treble, P. C., and Edwards, N.: Semi-arid zone caves: Evaporation and hydrological controls on δ18O drip water composition and implications for speleothem paleoclimate reconstructions, Quaternary Sci. Rev., 131, 285–301, https://doi.org/10.1016/j.quascirev.2015.10.024, 2016.
Mattey, D. P., Fairchild, I. J., Atkinson, T. C., Latin, J.-P., Ainsworth, M., and Durell, R.: Seasonal microclimate control of calcite fabrics, stable isotopes and trace elements in modern speleothem from St Michaels Cave, Gibraltar, Geol. Soc. Lond. Spec. Publ., 336, 323–344, 2010.
Mattey, D. P., Atkinson, T. C., Barker, J. A., Fisher, R., Latin, J. P., Durrell, R., and Ainsworth, M.: Carbon dioxide, ground air and carbon cycling in Gibraltar karst, Geochim. Cosmochim. Ac., 184, 88–113, https://doi.org/10.1016/j.gca.2016.01.041, 2016.
Mishra, S. P. and Tiwary, D.: Ion exchangers in radioactive waste management. Part XI. Removal of barium and strontium ions from aqueous solutions by hydrous ferric oxide, Appl. Radiat. Isotop., 51, 359–366, https://doi.org/10.1016/S0969-8043(99)00065-2, 1999.
Moreno, A., Stoll, H., Jiménez-Sánchez, M., Cacho, I., Valero-Garcés, B., Ito, E., and Edwards, R. L.: A speleothem record of glacial (25–11.6 kyr BP) rapid climatic changes from northern Iberian Peninsula, Global Planet. Change, 71, 218–231, https://doi.org/10.1016/j.gloplacha.2009.10.002, 2010.
Moreno, A., Sancho, C., Bartolomé, M., Oliva-Urcia, B., Delgado-Huertas, A., Estrela, M. J., Corell, D., López-Moreno, J. I., and Cacho, I.: Climate controls on rainfall isotopes and their effects on cave drip water and speleothem growth: the case of Molinos cave (Teruel, NE Spain), Clim. Dynam., 43, 221–241, https://doi.org/10.1007/s00382-014-2140-6, 2014.
Moreno, A., Iglesias, M., Azorin-Molina, C., Pérez-Mejías, C., Bartolomé, M., Sancho, C., Stoll, H., Cacho, I., Frigola, J., Osácar, C., Muñoz, A., Delgado-Huertas, A., Bladé, I., and Vimeux, F.: Measurement report: Spatial variability of northern Iberian rainfall stable isotope values – investigating atmospheric controls on daily and monthly timescales, Atmos. Chem. Phys., 21, 10159–10177, https://doi.org/10.5194/acp-21-10159-2021, 2021.
Noronha, A. L., Johnson, K. R., Hu, C., Ruan, J., Southon, J. R., and Ferguson, J. E.: Assessing influences on speleothem dead carbon variability over the Holocene: Implications for speleothem-based radiocarbon calibration, Earth Planet. Sc. Lett., 394, 20–29, https://doi.org/10.1016/j.epsl.2014.03.015, 2014.
O'Leary, M. H.: Carbon Isotopes in Photosynthesis: Fractionation techniques may reveal new aspects of carbon dynamics in plants, BioScience, 38, 328–336, https://doi.org/10.2307/1310735, 1988.
Owen, R., Day, C. C., and Henderson, G. M.: CaveCalc: A new model for speleothem chemistry & isotopes, Comput. Geosci., 119, 115–122, https://doi.org/10.1016/j.cageo.2018.06.011, 2018.
Parkhurst, D. L. and Appelo, C. A. J.: Description of input and examples for PHREEQC version 3 – A computer program for speciation, batch-reaction, one-dimensional transport, and inverse geochemical calculations, in: US Geological Survey Techniques and Methods, book 6, chap. A43, US Geological Survey, p. 497, https://pubs.usgs.gov/tm/06/a43/pdf/tm6-A43.pdf (last access: 10 January 2022), 2013.
Pataki, D. E., Bowling, D. R., and Ehleringer, J. R.: Seasonal cycle of carbon dioxide and its isotopic composition in an urban atmosphere: Anthropogenic and biogenic effects, J. Geophys. Res.-Atmos., 108, 4735, https://doi.org/10.1029/2003JD003865, 2003.
Peel, M. C., Finlayson, B. L., and McMahon, T. A.: Updated world map of the Köppen–Geiger climate classification, Hydrol. Earth Syst. Sci., 11, 1633–1644, https://doi.org/10.5194/hess-11-1633-2007, 2007.
Riechelmann, D. F. C., Schröder-Ritzrau, A., Scholz, D., Fohlmeister, J., Spötl, C., Richter, D. K., and Mangini, A.: Monitoring Bunker Cave (NW Germany): A prerequisite to interpret geochemical proxy data of speleothems from this site, J. Hydrol., 409, 682–695, https://doi.org/10.1016/j.jhydrol.2011.08.068, 2011.
Ruff, M., Wacker, L., Gäggeler, H. W., Suter, M., Synal, H. A., and Szidat, S.: A Gas Ion Source for Radiocarbon Measurements at 200 kV, Radiocarbon, 49, 307–314, https://doi.org/10.1017/S0033822200042235, 2007.
Sinclair, D. J., Banner, J. L., Taylor, F. W., Partin, J., Jenson, J., Mylroie, J., Goddard, E., Quinn, T., Jocson, J., and Miklaviè, B.: Magnesium and strontium systematics in tropical speleothems from the Western Pacific, Chem. Geol., 294–295, 1–17, https://doi.org/10.1016/j.chemgeo.2011.10.008, 2012.
Sliwinski, J., Kost, O., Endres, L., Iglesias, M., Haghipour, N., González-Lemos, S., and Stoll, H.: Exploring soluble and colloidally transported trace elements in stalagmites: The strontium-yttrium connection, Geochim. Cosmochim. Ac., 343, 64–83, 2023.
Sliwinski, J. T. and Stoll, H. M.: Combined fluorescence imaging and LA-ICP-MS trace element mapping of stalagmites: Microfabric identification and interpretation, Chem. Geol., 581, 120397, https://doi.org/10.1016/j.chemgeo.2021.120397, 2021.
Spötl, C., Fairchild, I. J., and Tooth, A. F.: Cave air control on dripwater geochemistry, Obir Caves (Austria): Implications for speleothem deposition in dynamically ventilated caves, Geochim. Cosmochim. Ac., 69, 2451–2468, https://doi.org/10.1016/j.gca.2004.12.009, 2005.
Stoll, H., Mendez-Vicente, A., Gonzalez-Lemos, S., Moreno, A., Cacho, I., Cheng, H., and Edwards, R. L.: Interpretation of orbital scale variability in mid-latitude speleothem δ18O: Significance of growth rate controlled kinetic fractionation effects, Quaternary Sci. Rev., 127, 215–228, https://doi.org/10.1016/j.quascirev.2015.08.025, 2015.
Stoll, H. M., Müller, W., and Prieto, M.: I-STAL, a model for interpretation of , and Ba/Ca variations in speleothems and its forward and inverse application on seasonal to millennial scales, Geochem. Geophy. Geosy., 13, Q09004, https://doi.org/10.1029/2012GC004183, 2012.
Stoll, H. M., Moreno, A., Mendez-Vicente, A., Gonzalez-Lemos, S., Jimenez-Sanchez, M., Dominguez-Cuesta, M. J., Edwards, R. L., Cheng, H., and Wang, X.: Paleoclimate and growth rates of speleothems in the northwestern Iberian Peninsula over the last two glacial cycles, Quatern. Res., 80, 284–290, https://doi.org/10.1016/j.yqres.2013.05.002, 2013.
Tadros, C. V., Treble, P. C., Baker, A., Fairchild, I., Hankin, S., Roach, R., Markowska, M., and McDonald, J.: ENSO – cave drip water hydrochemical relationship: a 7-year dataset from south-eastern Australia, Hydrol. Earth Syst. Sci., 20, 4625–4640, https://doi.org/10.5194/hess-20-4625-2016, 2016.
Tadros, C. V., Treble, P. C., Baker, A., Hankin, S., and Roach, R.: Cave drip water solutes in south-eastern Australia: Constraining sources, sinks and processes, Sci. Total Environ., 651, 2175–2186, https://doi.org/10.1016/j.scitotenv.2018.10.035, 2019.
Treble, P. C., Fairchild, I. J., Baker, A., Meredith, K. T., Andersen, M. S., Salmon, S. U., Bradley, C., Wynn, P. M., Hankin, S. I., Wood, A., and McGuire, E.: Roles of forest bioproductivity, transpiration and fire in a nine-year record of cave dripwater chemistry from southwest Australia, Geochim. Cosmochim. Ac., 184, 132-150, https://doi.org/10.1016/j.gca.2016.04.017, 2016.
Treble, P. C., Baker, A., Abram, N. J., Hellstrom, J. C., Crawford, J., Gagan, M. K., Borsato, A., Griffiths, A. D., Bajo, P., Markowska, M., Priestley, S. C., Hankin, S., and Paterson, D.: Ubiquitous karst hydrological control on speleothem oxygen isotope variability in a global study, Commun. Earth Environ., 3, 29, https://doi.org/10.1038/s43247-022-00347-3, 2022.
Tremaine, D. M. and Froelich, P. N.: Speleothem trace element signatures: A hydrologic geochemical study of modern cave dripwaters and farmed calcite, Geochim.t Cosmochim. Ac., 121, 522–545, https://doi.org/10.1016/j.gca.2013.07.026, 2013.
Tremaine, D. M., Sinclair, D. J., Stoll, H. M., Lagerström, M., Carvajal, C. P., and Sherrell, R. M.: A two-year automated dripwater chemistry study in a remote cave in the tropical south Pacific: Using [Cl−] as a conservative tracer for seasalt contribution of major cations, Geochim. Cosmochim. Ac., 184, 289–310, https://doi.org/10.1016/j.gca.2016.03.029, 2016.
UNEP: World atlas of desertification 2ED, https://wedocs.unep.org/handle/20.500.11822/30300;jsessionid=D481099AA75A2ACCAD3C4831B7C68FD6 (last access: 10 January 2022), 1997.
Waring, C. L., Hankin, S. I., Griffith, D. W. T., Kertesz, M. A., Kobylski, V., Wilson, N. L., Coleman, N. V., Kettlewell, G., Zlot, R., Bosse, M., and Bell, G.: Seasonal total methane depletion in limestone caves, Sci. Rep., 7, 8314, https://doi.org/10.1038/s41598-017-07769-6, 2017.
Wassenburg, J. A., Riechelmann, S., Schröder-Ritzrau, A., Riechelmann, D. F. C., Richter, D. K., Immenhauser, A., Terente, M., Constantin, S., Hachenberg, A., Hansen, M., and Scholz, D.: Calcite Mg and Sr partition coefficients in cave environments: Implications for interpreting prior calcite precipitation in speleothems, Geochim. Cosmochim. Ac., 269, 581–596, https://doi.org/10.1016/j.gca.2019.11.011, 2020.
Weremeichik, J. M., Gabitov, R. I., Thien, B. M. J., and Sadekov, A.: The effect of growth rate on uranium partitioning between individual calcite crystals and fluid, Chem. Geol., 450, 145–153, https://doi.org/10.1016/j.chemgeo.2016.12.026, 2017.