the Creative Commons Attribution 4.0 License.
the Creative Commons Attribution 4.0 License.
 | 09 Jun 2023
Hydrological, meteorological, and watershed controls on the water balance of thermokarst lakes between Inuvik and Tuktoyaktuk, Northwest Territories, Canada
Brent B. Wolfe
Philip Marsh
Thermokarst lake water balances are becoming increasingly vulnerable to change in the Arctic as air temperature increases and precipitation patterns shift. In the tundra uplands east of the Mackenzie Delta in the Northwest Territories, Canada, previous research has found that lakes responded non-uniformly to year-to-year changes in precipitation, suggesting that lake and watershed properties mediate the response of lakes to climate change. To investigate how lake and watershed properties and meteorological conditions influence the water balance of thermokarst lakes in this region, we sampled 25 lakes for isotope analysis five times in 2018, beginning before snowmelt on 1 May and sampling throughout the remainder of the ice-free season. Water isotope data were used to calculate the average isotope composition of lake source water (δI) and the ratio of evaporation to inflow (). We identified four distinct water balance phases as lakes responded to seasonal shifts in meteorological conditions and hydrological processes. During the freshet phase from 1 May to 15 June, the median ratio of lakes decreased from 0.20 to 0.13 in response to freshet runoff and limited evaporation due to lake ice presence that persisted for the duration of this phase. During the following warm, dry, and ice-free period from 15 June to 26 July, designated the evaporation phase, the median ratio increased to 0.19. During the brief soil wetting phase, ratios did not respond to rainfall between 26 July and 2 August, likely because watershed soils absorbed most of the precipitation which resulted in minimal runoff to lakes. The median ratio decreased to 0.11 after a cool and rainy August, identified as the recharge phase. Throughout the sampling period, δI remained relatively stable and most lakes contained a greater amount of rainfall-sourced water than snow-sourced water, even after the freshet phase, due to snowmelt bypass. The range of average ratios that we observed at lakes (0.00–0.43) was relatively narrow and low compared with thermokarst lakes in other regions, likely owing to the large ratio of watershed area to lake area (), efficient preferential flow pathways for runoff, and a shorter ice-free season. Lakes with smaller tended to have higher ratios (R2 = 0.74). An empirical relationship between and was derived and used to predict the average ratio of 7340 lakes in the region, which identified that these lakes are not vulnerable to desiccation, given that ratios were < 0.33. If future permafrost thaw and warming cause less runoff to flow into lakes, we expect that lakes with a smaller will be more influenced by increasing evaporation, while lakes with a larger will be more resistant to lake-level drawdown. However under wetter conditions, lakes with a larger will likely experience a greater increases in lake level and could be more susceptible to rapid drainage.
- Article
(4297 KB) - Full-text XML
- BibTeX
- EndNote


Thermokarst lakes are common features in ice-rich permafrost terrain, occupying up to 25 % of the land area (Woo, 2012). The water balance of thermokarst lakes is changing as Arctic warming causes precipitation to shift from snowfall to rainfall (Bintanja and Andry, 2017; MacDonald et al., 2021) and permafrost thaw alters the hydrological connectivity of lake watersheds (Wolfe et al., 2011; Walvoord and Kurylyk, 2016; Tananaev and Lotsari, 2022; Koch et al., 2022). Additionally, longer ice-free periods are increasing evaporation (Prowse et al., 2011; Arp et al., 2015), and enhanced vegetation growth is altering snow redistribution and snowmelt timing (Sturm et al., 2001; Essery and Pomeroy, 2004; Pomeroy et al., 2006). In many regions, expansion and contraction of thermokarst lakes has been observed, demonstrating that lake water balances are not responding uniformly to climate change (Smith et al., 2005; Plug et al., 2008; Marsh et al., 2009; Arp et al., 2011; Jones et al., 2011; Andresen and Lougheed, 2015; Travers-Smith et al., 2021).
Previous studies have demonstrated that knowledge of meteorological conditions and lake and watershed attributes, as well as their influence on lake water balance, can explain why thermokarst lakes react non-uniformly to climate change (Wolfe et al., 2011; Turner et al., 2014; Nitze et al., 2017; Wan et al., 2020). Key drivers of lake water balances include the relative size of a lake within its watershed (ratio of watershed area to lake area, ), rainfall and snowfall patterns, permafrost dynamics, wildfire, vegetation cover, and ice-free season length (Turner et al., 2014; Arp et al., 2015; MacDonald et al., 2017; Wan et al., 2020). For example, Turner et al. (2014) found that thermokarst lakes in Old Crow Flats, Yukon, with higher evaporation-to-inflow ratios () tended to have smaller ratios, reflecting the control of watershed area on the amount of inflow a lake receives. Arp et al. (2015) found that lakes in the Alaskan Coastal Plain with bedfast ice became ice-free sooner than lakes with floating ice, causing bedfast lakes to lose more water to evaporation as a result of a longer ice-free season.
In several studies, water isotope (δ18O and δ2H) analysis has been the primary method used to efficiently characterize the water balance of a large number of thermokarst lakes, as the isotope composition provides an integrated measure of influential hydrological processes (Gibson, 2002; Edwards et al., 2004; Turner et al., 2014; Narancic et al., 2017). Two key metrics of lake water balance modelled using water isotope data include the average isotope composition of lake source waters (δI), which can be related to the measured isotope composition of different water sources (Yi et al., 2008), and the ratio of evaporation to inflow () (Gibson et al., 1993). Sampling lake water for isotope analysis multiple times throughout the year provides data to assess the response of lake water balances to different hydrological processes, which can be related to meteorological conditions and compared to lake and watershed attributes. Recently, MacDonald et al. (2017) compared the and δI of thermokarst lakes from six regions in northern North America and found a wide range of water balances that were influenced by local meteorological conditions, permafrost extent, and vegetation characteristics. In some locations, such as the Alaskan Coastal Plain, ratios were mostly < 0.2, whereas lakes in the Hudson Bay Lowlands of northeastern Manitoba typically possessed ratios > 0.5, with some lakes trending towards desiccation.
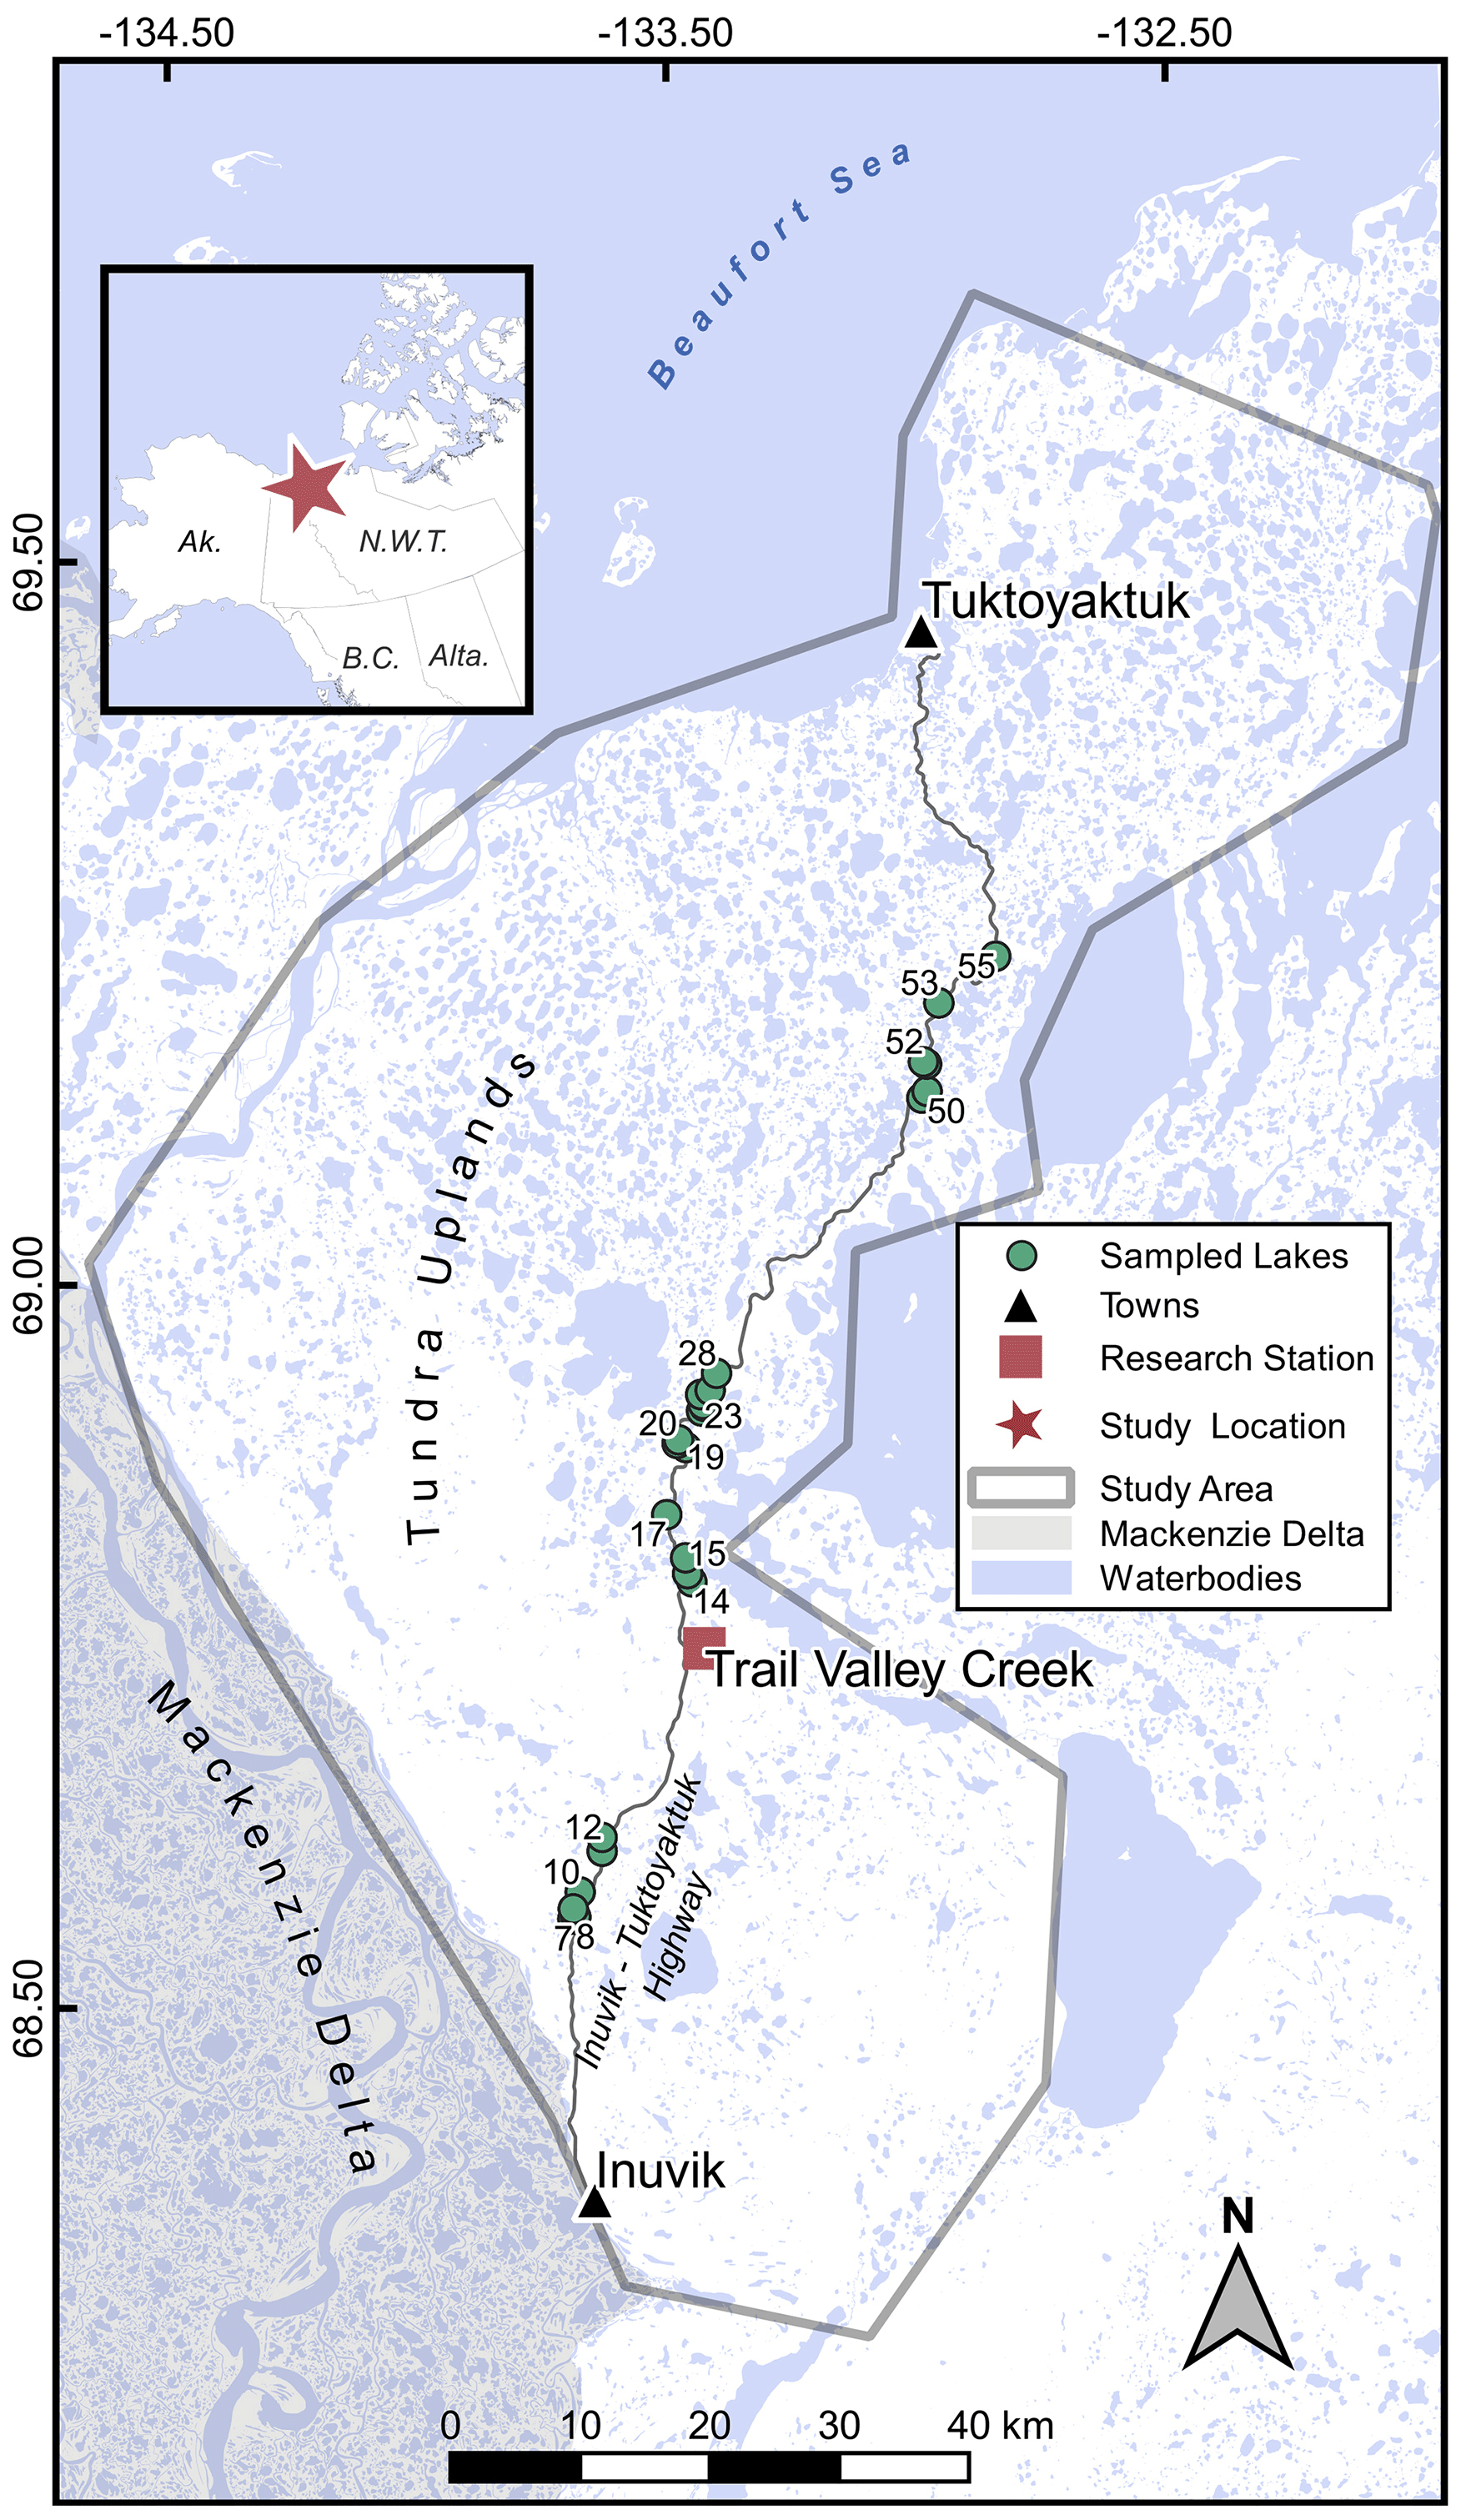
Figure 1Study area showing the locations of the thermokarst lakes where water samples for isotope analysis were obtained. The study location relative to northwestern North America is shown in the inset map. Not all lakes are labelled on the map, but lakes are numbered sequentially from south to north.
This study aims to evaluate how meteorological conditions, hydrological processes, and lake and watershed attributes influence the δI and of lakes located in the tundra uplands east of the Mackenzie Delta in the Northwest Territories, Canada (Fig. 1). A previous study in this region showed that only 5 %–53 % of pre-snowmelt lake water is replaced by freshet on average, because snowmelt bypass leads to minimal mixing between freshet and pre-snowmelt lake water (Wilcox et al., 2022a). Snowmelt bypass occurs when less dense (∼ 0 ∘C) freshet runoff flows underneath lake ice and passes through a lake without mixing with and replacing the deeper and denser (< 4 ∘C) lake water (Bergmann and Welch, 1985). With this study, we explore whether snowmelt bypass influences summertime lake water balances, given that thermokarst lakes in other regions are prone to desiccation when they retain little snowmelt (Bouchard et al., 2013). We also investigate how watershed characteristics that have been identified to influence lake water balance in other regions, such as the , influence lake water balances in our study area. We then use the relationship found between the average and watershed characteristics to predict the average for lakes in the region and assess their vulnerability to climate change.
The thermokarst lakes in this study are located in the tundra uplands east of the Mackenzie Delta in the northwest region of the Northwest Territories, Canada (Fig. 1). The landscape is comprised of rolling hills and has been shaped by the thaw of ice-rich permafrost, evidenced by the thousands of thermokarst lakes in the region (Rampton, 1988; Burn and Kokelj, 2009). Hillslopes are well drained by the network of peat channels that facilitate subsurface flow between mineral earth hummocks (Quinton and Marsh, 1998), whereas flatter areas are typically drained by high-centred ice-wedge polygons (Burn and Kokelj, 2009). Vegetation consists of tall-shrub (> 1 m), low-shrub (∼ 0.5 m), and shrub-free land cover types containing lichen, moss, and tussocks (Lantz et al., 2010; Grünberg et al., 2020).
Table 1Lake and watershed attributes and isotope-derived hydrological indicators for all lakes.
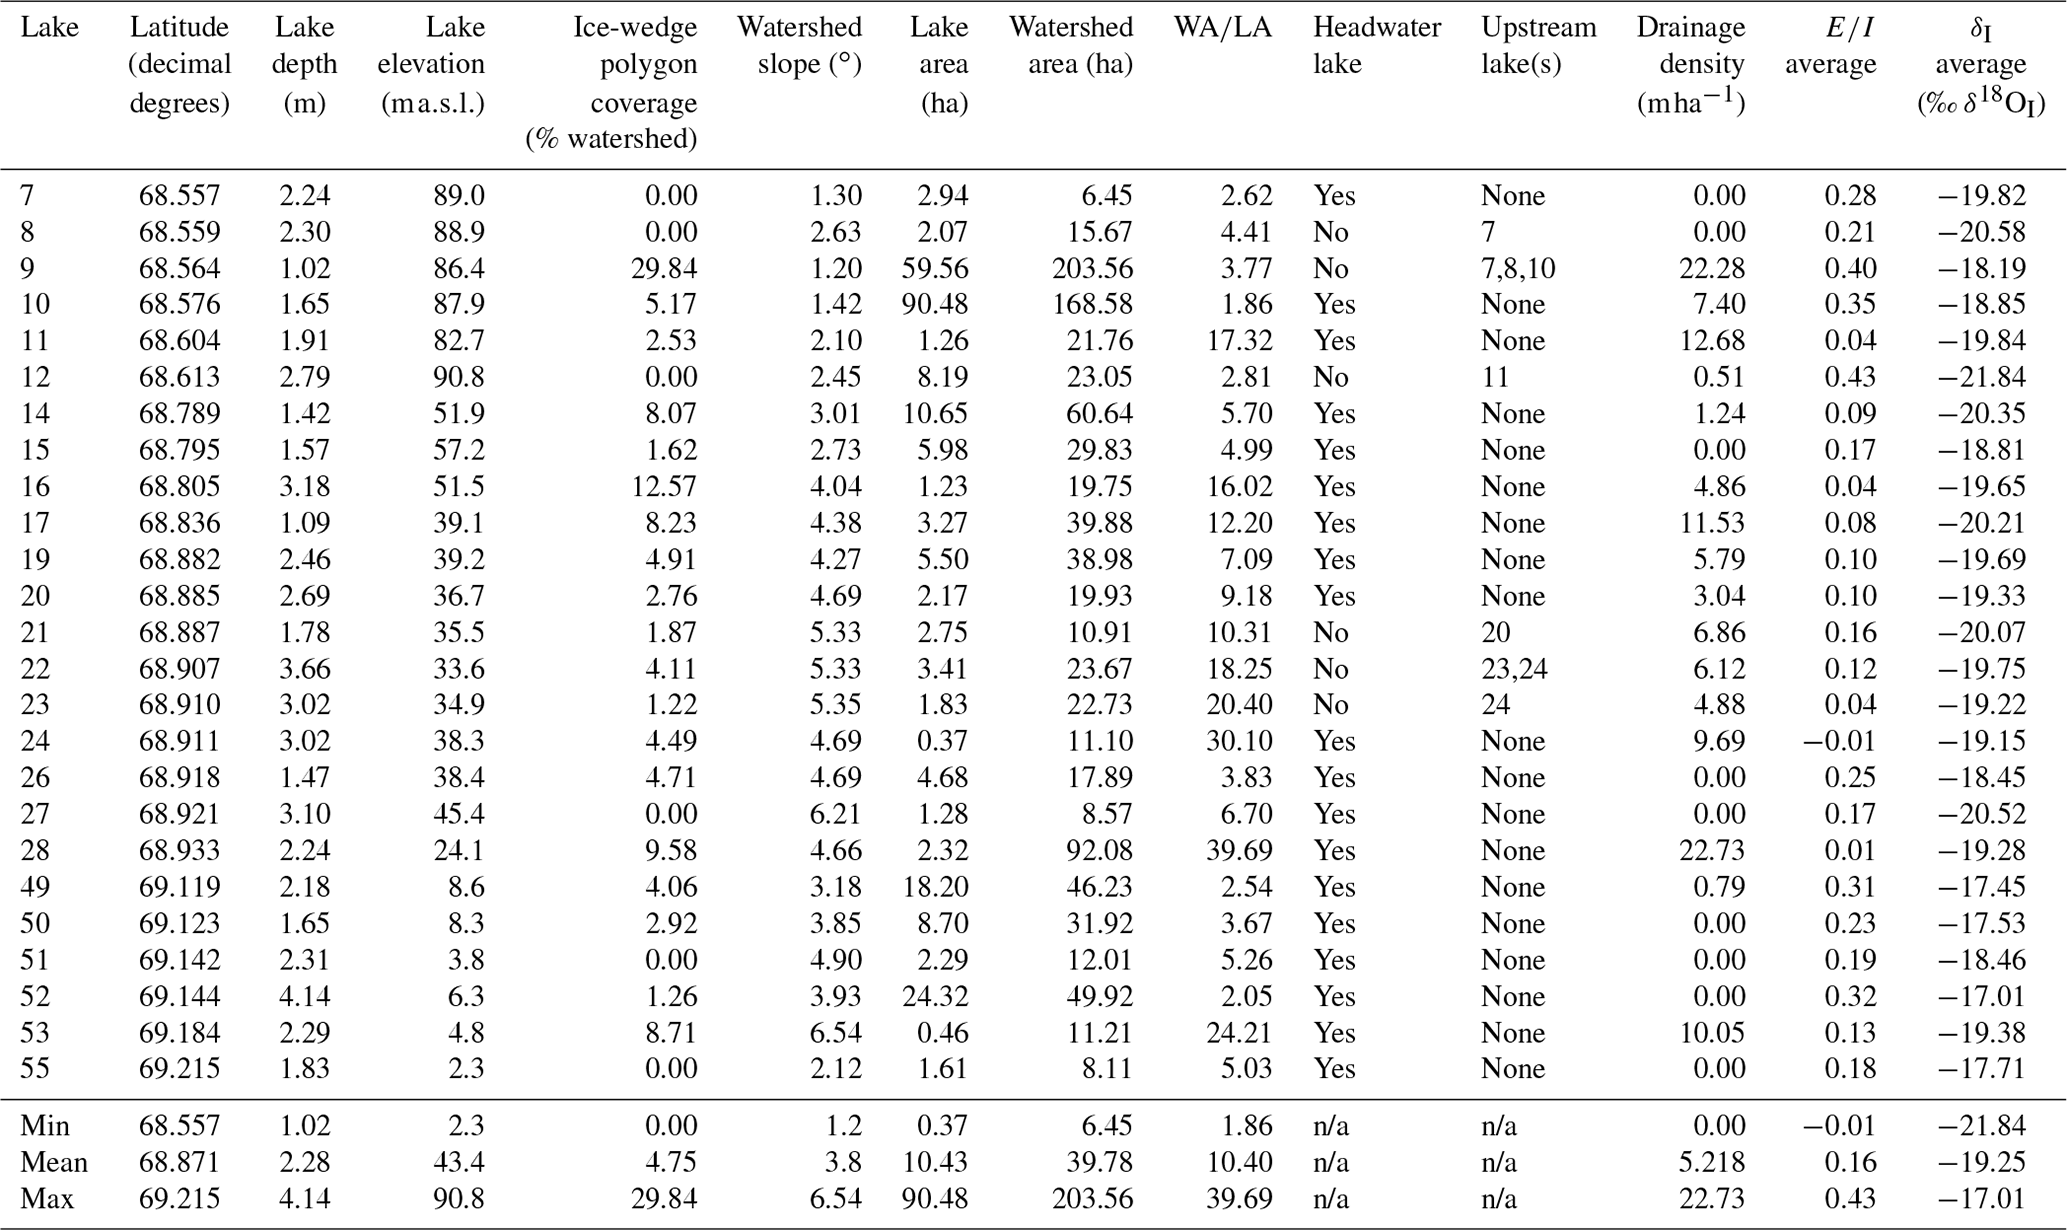
n/a stands for not applicable.
We selected 25 lakes that span a range of watershed sizes (6.45–203.56 ha) and lake surface areas (0.37–90.48 ha), among other characteristics, along a ∼ 70 km stretch of the Inuvik–Tuktoyaktuk Highway (Fig. 1, Table 1). Nineteen of the lakes are headwater lakes and the other six lakes are downstream of other sampled lakes (Table 1). All lakes have a defined outlet channel, and many lakes have defined channelized inflows from their watersheds in the form of small ephemeral streams or ice-wedge polygon troughs.
3.1 Lake water and precipitation sampling and analysis of isotope data
Water samples from the 25 thermokarst lakes were collected on 5 d (1 May, 15 June, 26 July, 2 August, and 3 September) during 2018 for water isotope analysis. Samples were collected on 1 May via a hole augured through the ice in the centre of each lake to capture the pre-snowmelt lake water balance conditions. The 1 May samples also represent the hydrological status of lakes during the freeze-up period of 2017, as virtually no hydrological activity occurs during the winter months due to the complete freezing of the soil and lake surface. Because 1 May water samples were influenced by fractionation that occurred during lake ice formation, the isotope compositions were corrected to represent the isotope composition of the lake before lake ice formation took place (Wilcox et al., 2022a). Lake water samples were corrected for ice fractionation by estimating the fraction of lake water that had been frozen and the corresponding amount of isotopic depletion of lake water that would have occurred assuming the lake was a closed system, following Ferrick et al. (2002). The 15 June was chosen as it marked the first day of the ice-free season for most lakes and was intended to capture the influence of snowmelt bypass; however, the southernmost lakes (lakes 7–12) became ice-free on 7 June, and some of the northernmost lakes (lakes 49–55) became ice-free on 17 June or 18 June. More information about ice correction and the response of lakes to snowmelt bypass is provided by Wilcox et al. (2022a). Next, samples were obtained on 26 July to capture the effects of evaporation and rainfall in the early ice-free season as well as before a large, forecasted rainfall event. Samples were then collected on 2 August to capture the influence of a weeklong rainy period following the sampling date on 26 July. Samples were lastly taken on 3 September to assess the lake water balance response to the relatively rainy and cool August weather prior to freeze-up. The four respective time periods between the five sampling dates are identified as “P1” (1 May to 15 June), “P2” (15 June to 26 July), “P3” (26 July to 2 August), and “P4” (2 August to 3 September).
From 15 June onward, water samples were collected at the shoreline of each lake where water was freely circulating. Samples of end-of-winter snow and ice-free season rainfall were obtained to determine the average isotope composition of rain (δR) and snow (δS). Snow samples (n = 11) were collected from the region in late April by taking a vertical core of the end-of-winter snowpack using a tube, completely melting the snow in a sealed plastic bag, and then filling a sampling bottle with the melted snow. Rainfall (n = 13) was collected between May and September in Inuvik using a clean high-density polyethylene container, which was then transferred into a sample bottle shortly after precipitation ceased. All samples were stored in 30 mL high-density polyethylene bottles. A Los Gatos Research (LGR) liquid water isotope analyser (model T-LWIA-45-EP) was used to measure the ratio of and in each sample at the Environmental Isotope Laboratory at the University of Waterloo (UW-EIL). Each isotope measurement consisted of eight injections of roughly 1000 nL sample volume, with the first two injections being discarded and the remaining six injections averaged to produce the measurement value. All samples were pre-filtered to 0.45 µm into 12 mm × 32 mm septum vials. Every fifth sample was measured a second time to determine the analytical uncertainties, which were ± 0.1 ‰ for δ18O and ± 0.6 ‰ for δ2H, calculated as 2 standard deviations from the difference between the duplicate samples. Isotope compositions are expressed in standard δ-notation:
where R represents the ratio of or , and VSMOW represents Vienna Mean Standard Ocean Water. Isotope values are normalized for Standard Light Antarctic Precipitation to δ18O = −55.5 ‰ and δ2H = −428 ‰ (Coplen, 1996). VSMOW and Vienna Standard Light Antarctic Precipitation (VSLAP) standards provided by LGR (which are calibrated using International Atomic Energy Agency, IAEA, standards) were employed to calibrate the instrument initially, and VSMOW and VSLAP standards were analyzed intermittently throughout the sample run to confirm the accuracy of the instrument.
3.2 Isotope framework, δI and
The isotope data were initially described and interpreted with respect to an “isotope framework” that consists of two fundamental linear relationships that form when isotope data are plotted with δ18O on the x axis and δ2H on the y axis (“δ18O–δ2H space”). Globally, there is a strong linear correlation between δ18O and δ2H in meteoric water, with isotope compositions of precipitation plotting close to the Global Meteoric Water Line (GMWL, δ2H = 8.0 ⋅ δ18O + 10; Craig, 1961). However, the slope and intercept of a meteoric water line can vary for precipitation collected locally. The local meteoric water line (LMWL) represents the expected isotope composition of precipitation in a region. We estimated the LMWL for Inuvik using a linear regression through rainfall and snowfall isotope compositions. The average isotope compositions of rainfall (δR) and snowfall (δS) were calculated by averaging the isotope composition of all the rainfall and snowfall samples that we collected, respectively, with δP representing the average of δS and δR. The LMWL equation that we derived was δ2H = 7.1 ⋅ δ18O − 10, which is similar to the LMWL derived by Fritz et al. (2022), who used precipitation samples collected between 2015 and 2018 in Inuvik and estimated the Inuvik LMWL to be δ2H = 7.4 ⋅ δ18O − 6.7. Both of these LMWLs compare closely with the LMWL derived from the Global Network of Isotopes in Precipitation (GNIP) data set, which is comprised of precipitation samples in Inuvik between 1986 and 1989 and gives an LMWL of δ2H = 7.3 ⋅ δ18O − 3.6 (IAEA/WMO, 2023). We considered using the LMWL, δS, δP, and δR values produced by Fritz et al. (2022); however, we decided to use the LMWL that we developed because it more closely represented the input waters during the study period, and the δS, δP and δR values derived by Fritz et al. (2022) were close to the values that we obtained.
Evaporated waterbodies tend to plot along a local evaporation line (LEL), which can be defined independent of measured lake water isotope compositions. Using this approach and for the case of a lake fed by waters of mean annual isotope composition of precipitation, the LEL was anchored at δP and at the maximum isotopic enrichment that can be achieved for a given set of environmental conditions (δ∗), which is dependent on air temperature, relative humidity, and the isotope composition of atmospheric moisture in the region (Gonfiantini, 1986). Along the LEL, a useful reference point exists at which the amount of evaporation that a waterbody is experiencing is equal to the amount of water input, defined as δSSL (steady-state lake water isotope composition of a terminal basin; Yi et al., 2008). When lake water isotope compositions are plotted in δ18O–δ2H space, they typically plot near the LEL, with more evaporated lakes plotting closer to δ∗ and less evaporated lakes plotting closer to δP. Lakes preferentially sourced by rainfall will tend to plot above the LEL, whereas lakes preferentially influenced by snowmelt will tend to plot below the LEL, owing to the normally distinctive isotope composition of rainfall and snowmelt (Tondu et al., 2013).
Isotope compositions of the lakes were used to estimate the average isotope composition of source water (δI, or δ18OI when referring to just δ18O). We followed the coupled isotope tracer method introduced by Yi et al. (2008) which has been applied in a variety of northern locations (Turner et al., 2014; MacDonald et al., 2017; Remmer et al., 2020). Calculating δI using the approach of Yi et al. (2008) involves generating a lake-specific evaporation line for each lake water isotope composition. This approach assumes that all lakes tend towards δ∗ as they evaporate, and the lake-specific evaporation line is defined as the line that intersects the lake water isotope composition and δ∗ in δ18O–δ2H space. δI is then calculated as the point of intersection between a lake-specific evaporation line and the LMWL.
We used these δI values to calculate the ratio of evaporation to inflow ():
where δL is the isotope composition of the lake water and where δE is the isotope composition of evaporated vapour from the lake (Gonfiantini, 1986). More detailed information about the calculation of the isotope framework components, δI, and is provided in Appendix A.
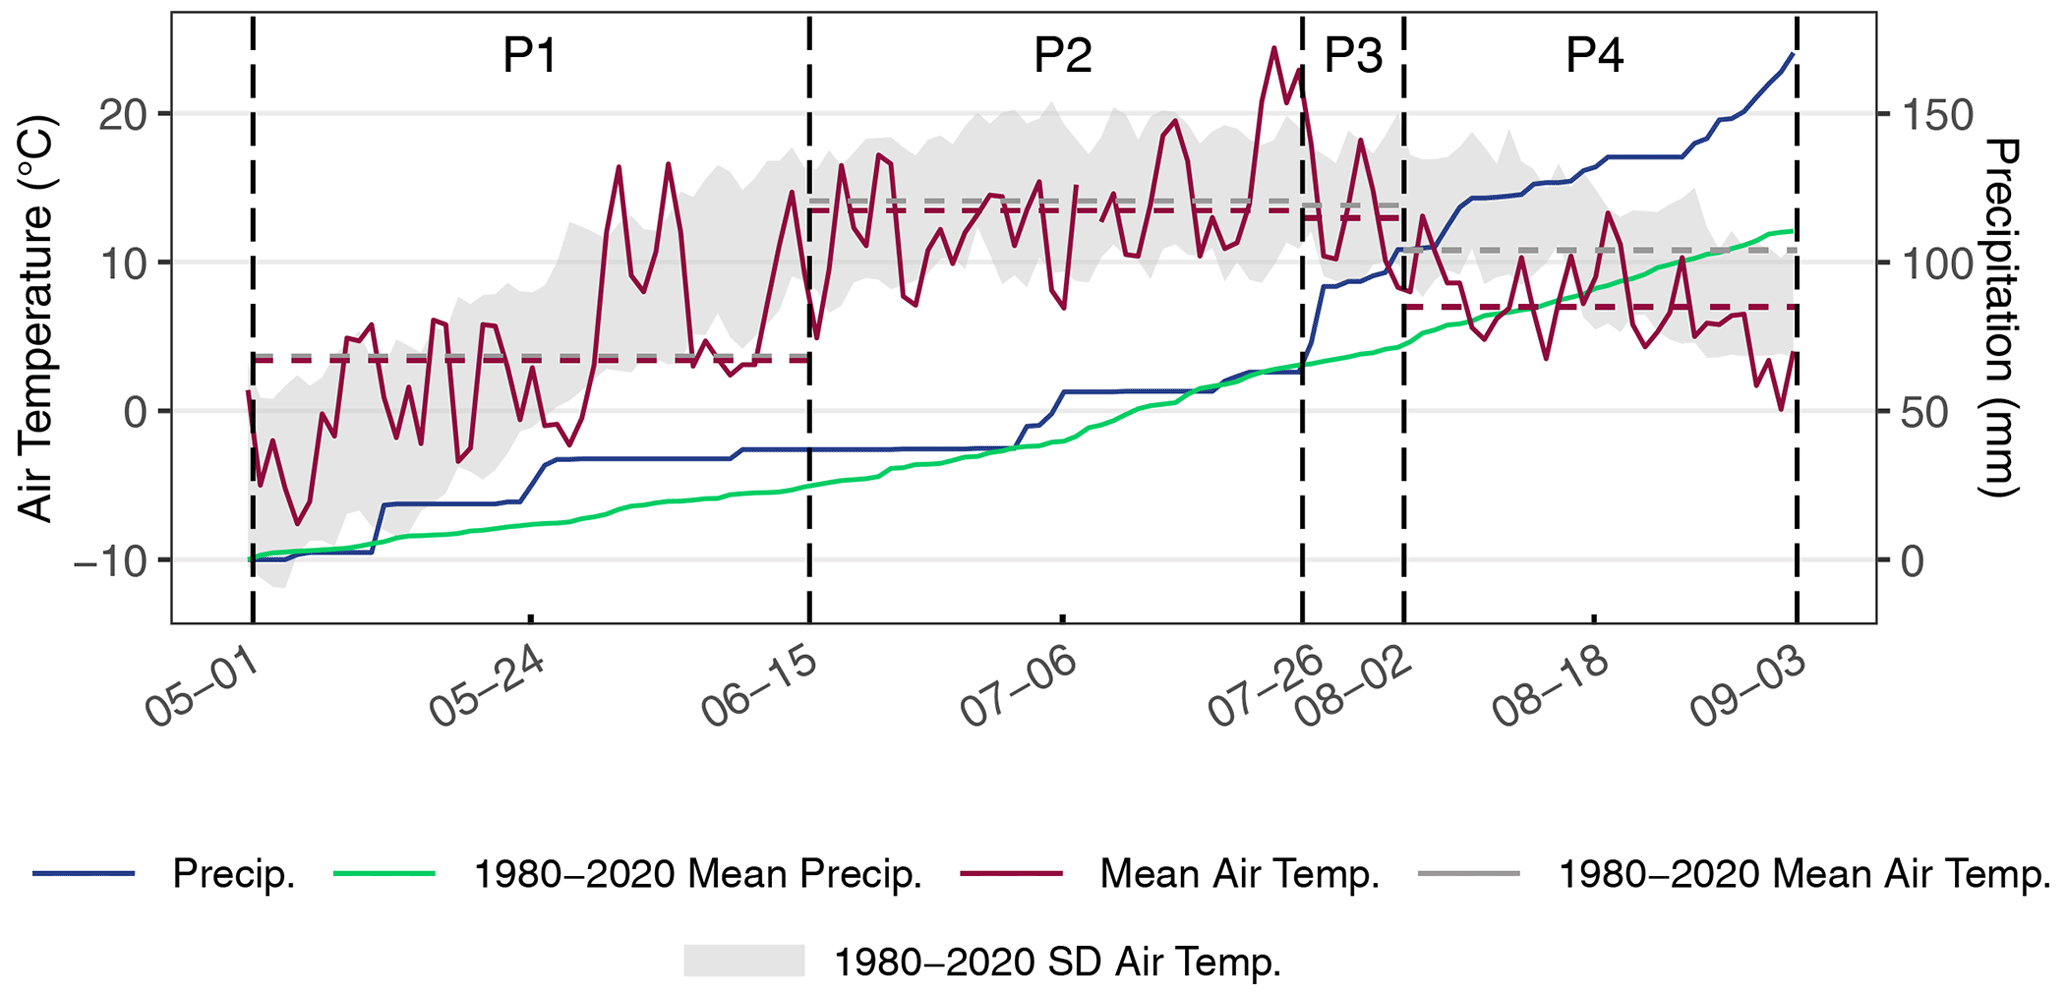
Figure 2Air temperature and cumulative precipitation during the sampling period and the 1980–2020 mean, as recorded at Inuvik (WMO ID: 71364) (Fig. 1). Meteorological data were retrieved from Environment and Climate Change Canada (2019). The 5 respective days on which water samples were taken from lakes are shown by the vertical dashed lines. The respective periods between the sampling dates are labelled P1, P2, P3, and P4. Mean daily air temperature for 2018 and 1980–2020 for each period is indicated by the horizontal dashed lines.
3.3 Meteorological conditions and lake and watershed attributes
The end-of-winter snowpack at Trail Valley Creek contained 141 mm of snow water equivalent, similar to the 1991–2019 mean of 147 mm (Marsh et al., 2019). Air temperature at Inuvik was within 1 ∘C of the long-term mean during P1, P2, and P3, but P4 was 3.8 ∘C cooler than the long-term mean (Fig. 2). P1 and P2 experienced a total rainfall amount of 72.9 mm, close to the long-term mean of 66.0 mm for this period, while P3 and P4 experienced 107.3 mm of rainfall, more than double the long-term mean of 45.0 mm for this period (Fig. 2).
Multiple lake and watershed attributes for each lake were quantified for comparison with δI and . Lake-specific properties included lake surface area, depth, latitude, and elevation, while watershed-specific properties included watershed surface area, mean hillslope angle, drainage density, vegetation cover, and ice-wedge polygon coverage (Table 1). Within each watershed, the areas of ice-wedge polygons were identified visually from satellite imagery and digitized manually. Drainage density was calculated as the length of all flow paths with a contributing area greater than 5000 m2 and then divided by the total area of the watershed. A threshold of 5000 m2 was chosen as this was roughly the threshold when water tracks became visible in optical satellite images. Vegetation height in each watershed was quantified using the remote sensing vegetation height product produced by Bartsch et al. (2020), which provides vegetation height at a 20 m spatial resolution with a root-mean-square error (RMSE) of 45 cm in vegetation height. All spatial analysis was carried out using ArcMap 10.7.1 (Esri, 2019).
To evaluate whether lake and watershed properties were correlated with lake water balance metrics derived from water isotope data, linear regressions between lake and watershed properties and and δI were tested. Only correlations where p < 0.01 were considered significant. The distribution of each variable was plotted on a histogram, and data were mathematically transformed if the distribution was non-uniform. Statistical analysis was performed using R 4.1.0 (R Core Team, 2021).
A correlation was identified between the and average (R2 = 0.82), and we used this relationship to predict the average for lakes in the region with areas > 0.25 ha (n = 7454; Fig. 1). Watershed area was estimated, including the 25 lakes sampled for isotope composition, by applying the D8 water routing algorithm (O'Callaghan and Mark, 1984) to the 2 m resolution digital elevation model ArcticDEM (PGC, 2018). The ratio was calculated for each lake by dividing the total watershed area by the total area of the lake(s) in the watershed. In rare cases, watersheds were not delineated accurately and part of the watershed was clipped to the lake boundary due to slight offsets between the lake layer and ArcticDEM. We rejected all watersheds where < 1.5, as all watersheds that we inspected which met this criteria were improperly delineated due to the offset error described. After rejecting all watersheds where < 1.5, a total of 7340 watersheds remained.
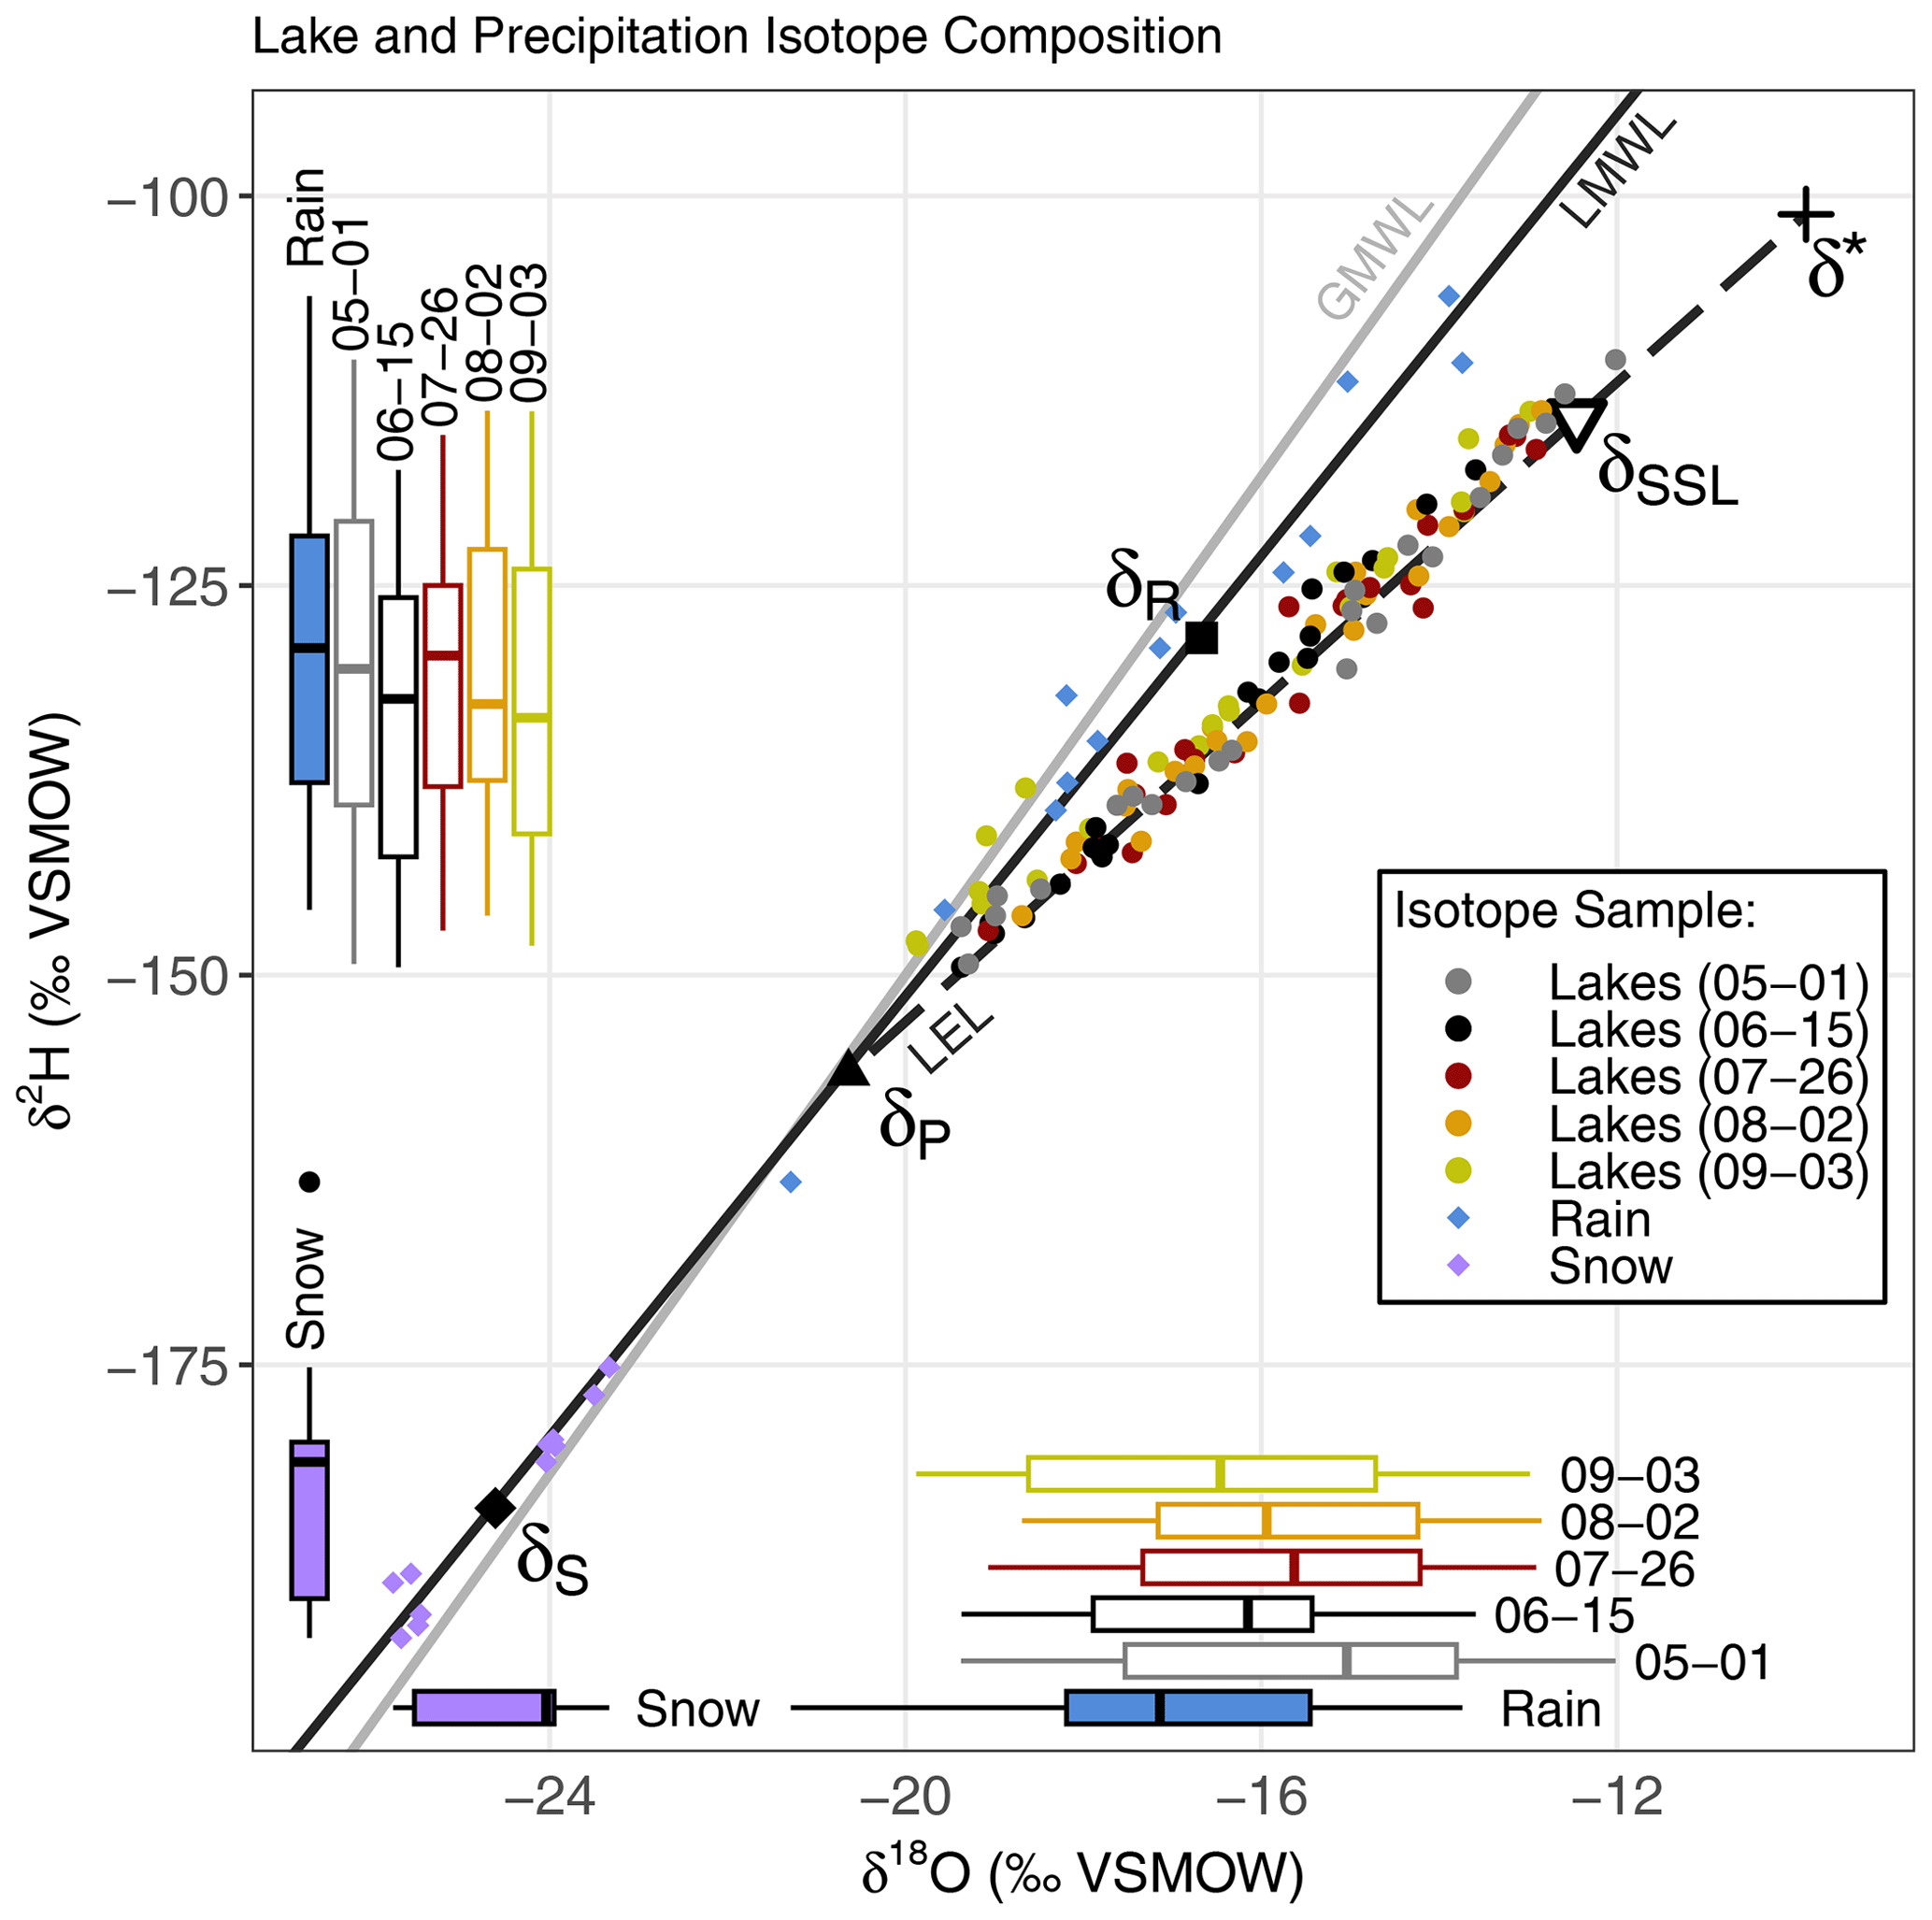
Figure 3Isotope values for all lake and precipitation samples, with their respective ranges along each axis illustrated by box plots, plotted in δ18O–δ2H space, as deviations (in ‰) from Vienna Standard Mean Ocean Water (VSMOW). The local meteoric water line (LMWL, solid black line, δ2H = 7.1 ⋅ δ18O − 10.0) is calculated as a regression through snow samples collected throughout the study region and rain samples collected from Inuvik in 2018 (n=24). The average isotope composition of end-of-winter snow samples (δS), rainfall samples (δR), and the average of δS and δR (δP) are labelled along the LMWL. The local evaporation line (LEL, dashed dark grey line), the global meteoric water line (GMWL, solid light grey line), the maximum isotopic enrichment possible for a waterbody (δ∗), and the point at which evaporation is equal to inflow ( = 1, δSSL) are added for reference.
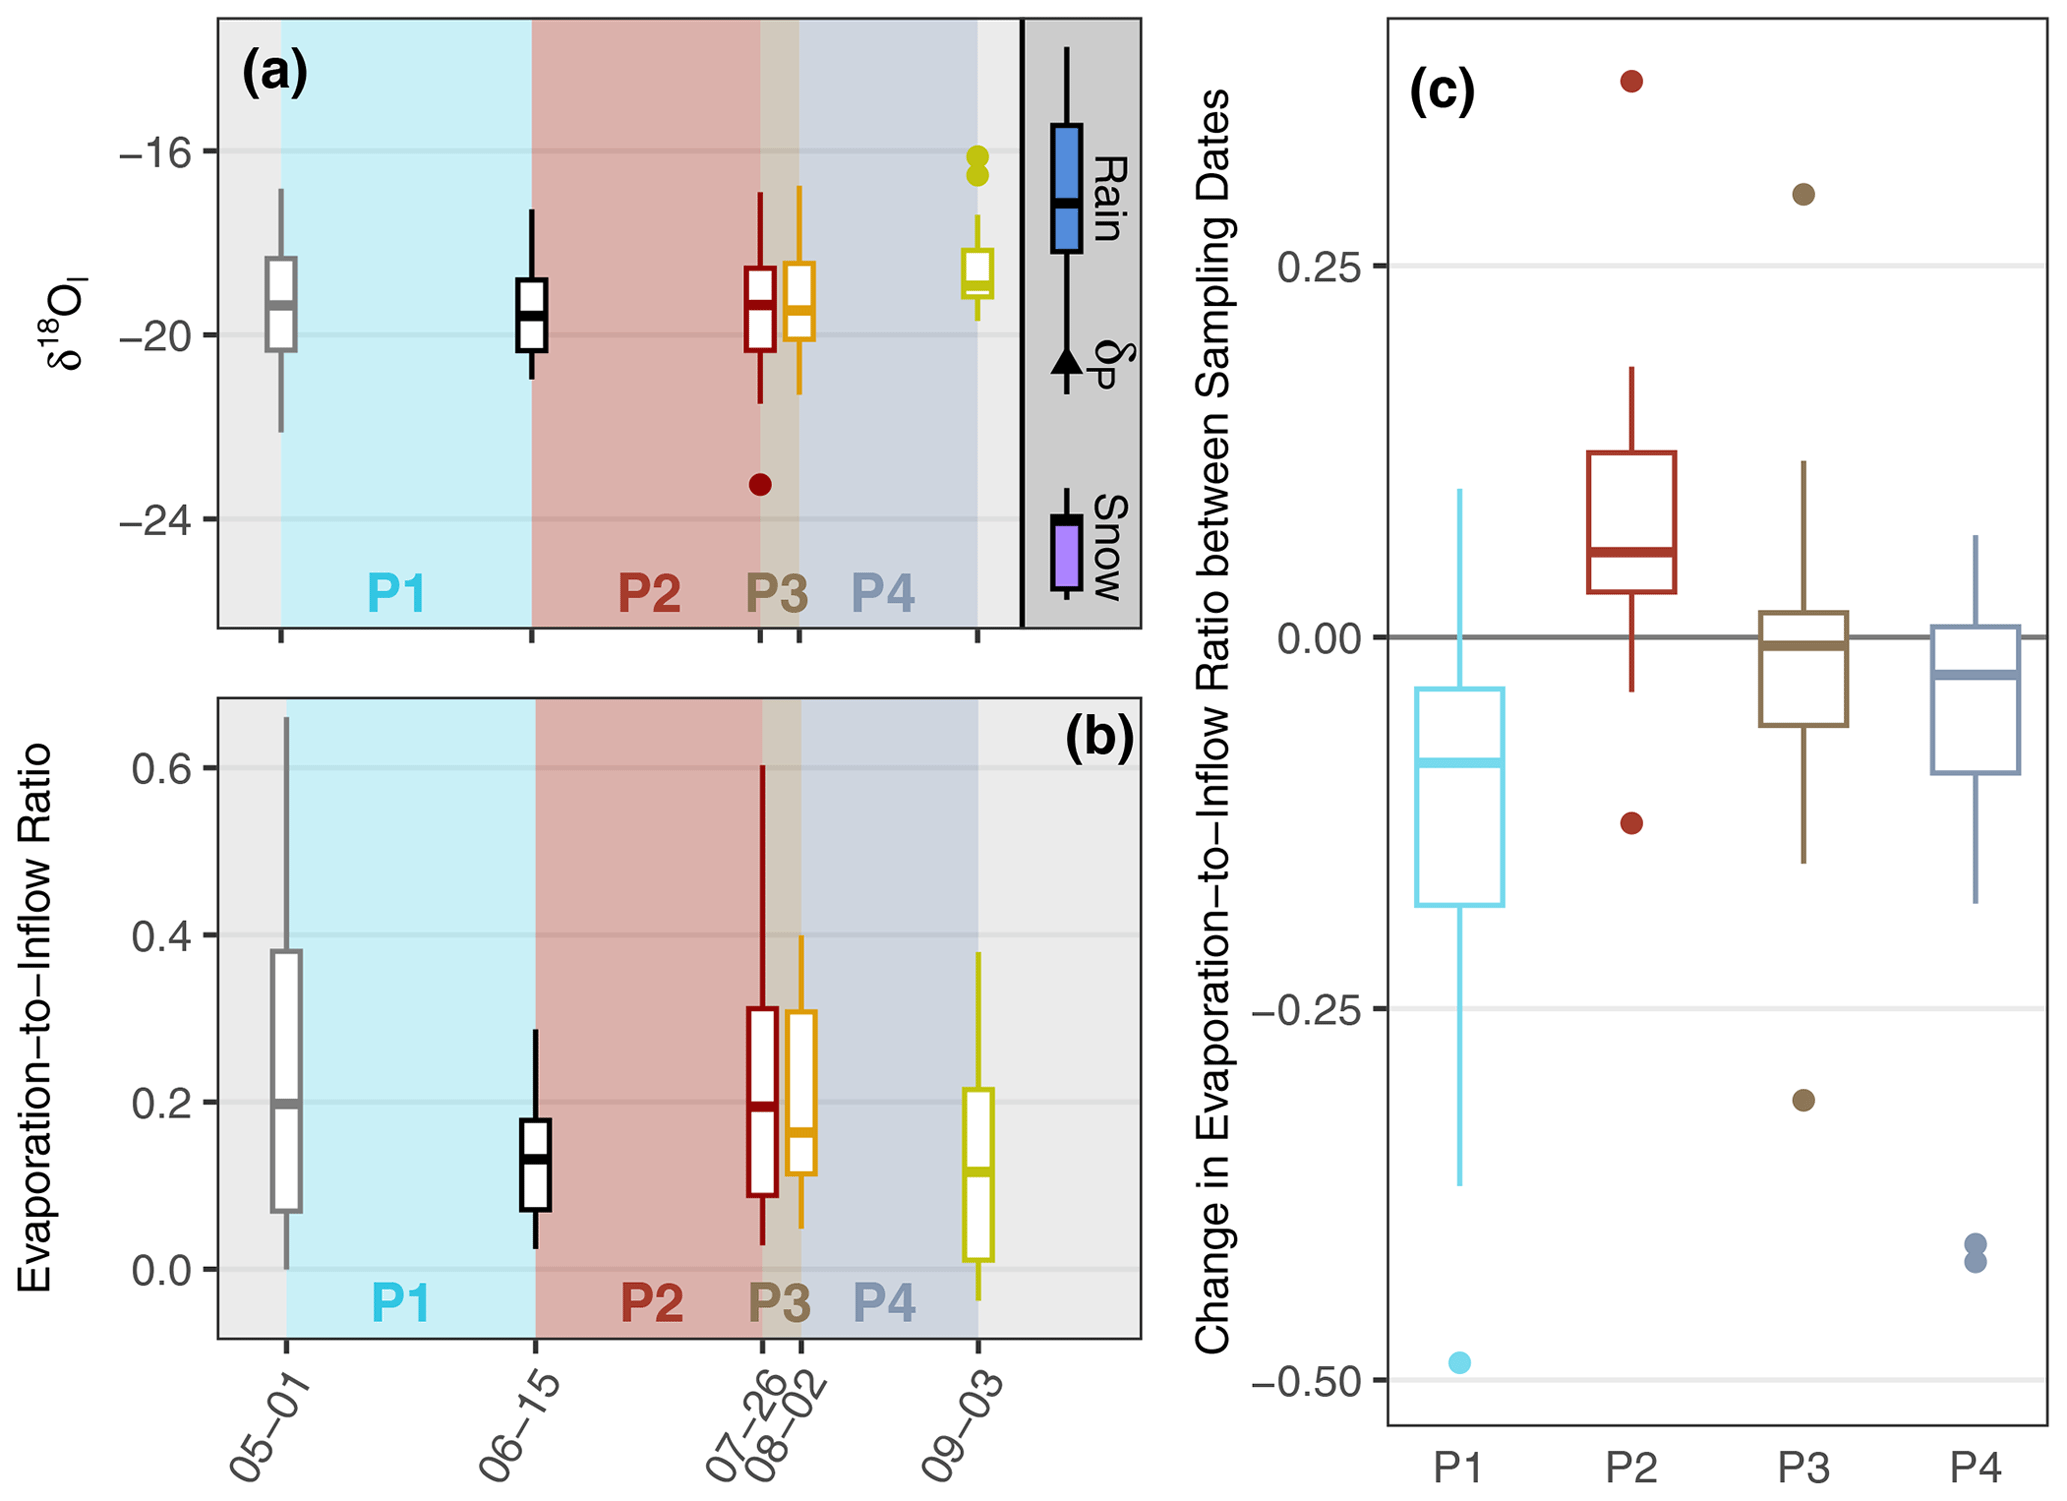
Figure 4(a) The distribution of δ18OI for each sampling date (in month–day format on the x axis) with the rain and snow isotope compositions for reference. (b) The distribution of values at all lakes across the five sampling dates. (c) The lake-specific change in the between the sampling dates was calculated as = , where Ln represents a specific lake and t represents a sampling date.
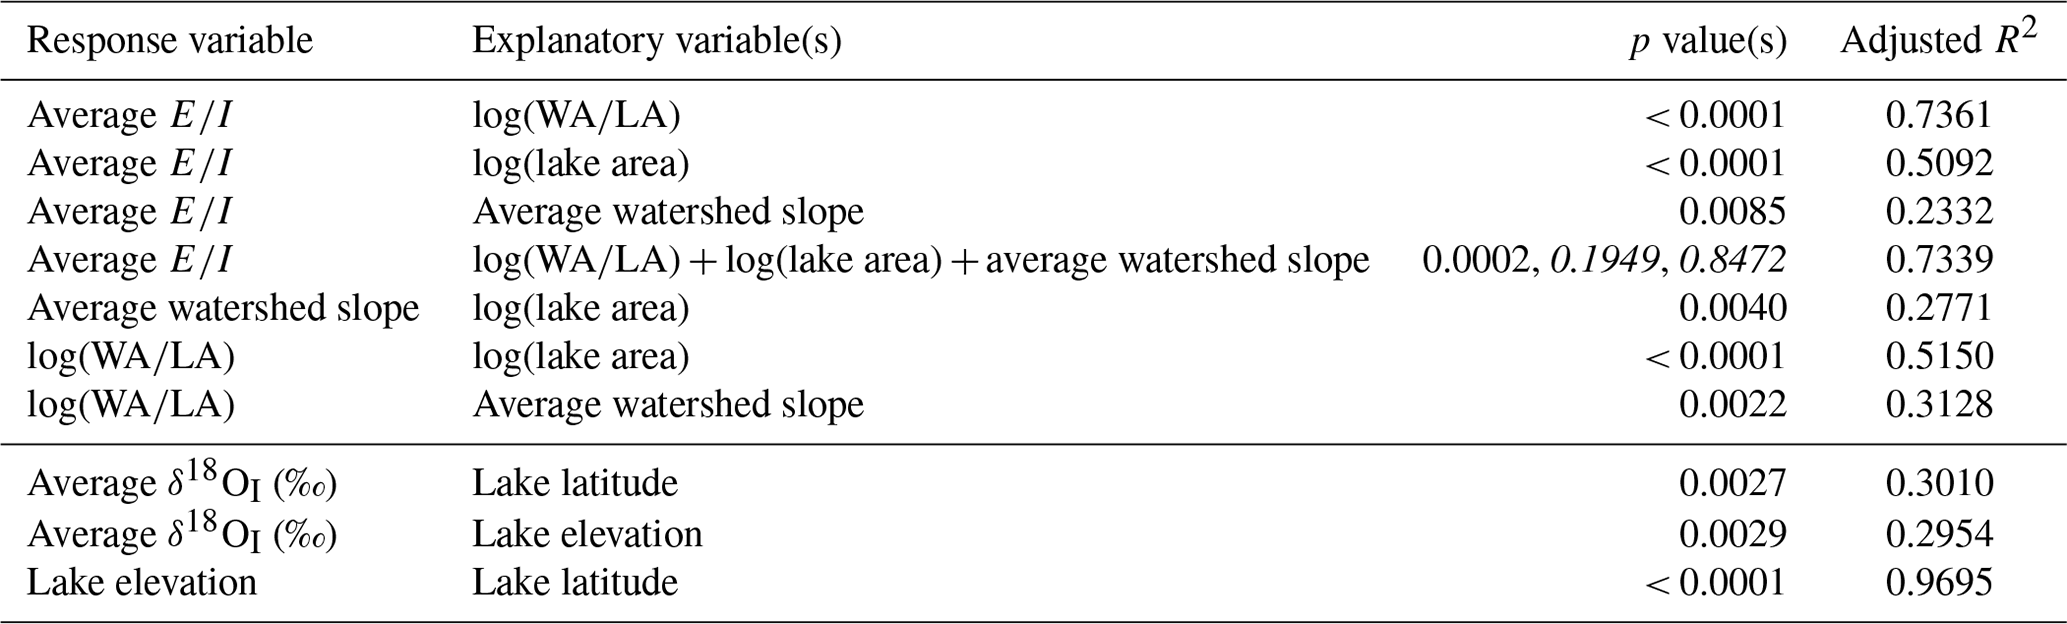
Table 2Significant correlations between δ18OI, , and explanatory variables. In cases where there are multiple explanatory variables, the p values for each respective explanatory variable are listed. The adjusted R2 was used in order to control for the tendency of R2 to increase as explanatory variables are added to a model (Yin and Fan, 2001). The adjusted R2 was calculated as = , where n is the sample size and m is the number of explanatory variables. p values > 0.05 are italicized.
4.1 Seasonal evolution of lake water balances
In general, we observed distinct shifts in lake water isotope composition, δ18OI, and between sampling dates. Shifts in the between sampling dates were often more pronounced than shifts in δ18OI. During P1 (1 May to 15 June), δ18O decreased from a median of −15.04 ‰ (−17.53 ‰ to −13.81 ‰ interquartile range, IQR) to −16.15 ‰ (−17.89 ‰ to −15.43 ‰ IQR) and δ2H values decreased from −130.35 ‰ (−139.08 ‰ to −120.88 ‰ IQR) to −132.27 ‰ (−142.41 ‰ to −125.77 ‰ IQR) (Fig. 3). At the same time, the range of δ18OI values decreased and the median decreased slightly from −19.36 ‰ (−20.33 ‰ to −18.34 ‰ IQR) to −19.59 ‰ (−20.34 ‰ to −18.81 ‰ IQR) (Fig. 4a). The median (and range) of values also decreased during P1 from 0.20 (0.07 to 0.38 IQR) to 0.13 (0.07 to 0.18 IQR) (Fig. 4b). The median change in the was −0.08 (Fig. 4c). The reduction in values that occurred during P1 was larger than in any other period (Fig. 4c).
During P2 (15 June to 26 July), lake water isotope values increased slightly. The median δ18O increased from −16.15 ‰ (−17.89 ‰ to −15.43 ‰ IQR) to −15.63 ‰ (−17.33 ‰ to −14.22 ‰ IQR) and the median δ2H increased from −132.27 ‰ (−142.41 ‰ to −125.77 ‰ IQR) to −129.50 ‰ (−137.90 ‰ to −124.99 ‰ IQR) (Fig. 3). During P2, δ18OI increased slightly from −19.59 ‰ (−20.34 ‰ to −18.81 ‰ IQR) to −19.35 ‰ (−20.34 ‰ to −18.55 ‰ IQR) (Fig. 4a). The median ratio increased from 0.13 (0.07 to 0.18 IQR) to 0.19 (0.09 to 0.31 IQR) (Fig. 4b). The median increase in the was 0.06 (0.03 to 0.12 IQR), although three lakes experienced a decrease in the (Fig. 4c).
Lake water isotope values decreased marginally during P3 (26 July to 2 August). Median δ18O decreased from −15.63 ‰ (−17.33 ‰ to −14.22 ‰ IQR) to −15.94 ‰ (−17.16 ‰ to −14.24 ‰ IQR) and median δ2H decreased from −129.50 ‰ (−137.90 ‰ to −124.99 ‰ IQR) to −132.60 ‰ (−137.51 ‰ to −122.68 ‰ IQR) (Fig. 3). The and δ18OI values also shifted minimally during P3. Median δ18OI decreased from −19.35 ‰ (−20.33 ‰ to −18.55 ‰ IQR) to −19.47 ‰ (−20.10 ‰ to −18.45 ‰ IQR) (Fig. 4b). The median change in the was −0.01 (−0.06 to 0.02 IQR), with a near-equal number of lakes experiencing an increase or decrease in the (Fig. 4c).
During P4 (2 August to 3 September), median δ18O values decreased from −15.94 ‰ (−17.16 ‰ to −14.24 ‰ IQR) to −16.55 ‰ (−18.65 ‰ to −15.00 ‰ IQR) and δ2H values decreased from −132.60 ‰ (−137.51 ‰ to −122.68 ‰ IQR) to −133.49 ‰ (−140.94 ‰ to −123.94 ‰ IQR) (Fig. 3). On 3 September, some lakes plotted close to the LMWL, indicating that their waters had experienced negligible amounts of evaporation (Fig. 3). The median δ18OI values increased from −19.47 ‰ (−20.10 ‰ to −18.45 ‰ IQR) to −18.94 ‰ (−19.18 ‰ to −18.14 ‰ IQR) and the range of values narrowed and became more similar to rain (Fig. 4a). Median values returned to values similar to those on 15 June by the end of P4, decreasing to a median of 0.11 (0.00 to 0.21 IQR) (Fig. 4b). Two-thirds of the lakes experienced a decrease in the , and the median change in the was −0.03 (−0.09 to 0.01 IQR) (Fig. 4c).
4.2 Correlation analysis between lake and watershed attributes and lake water balance metrics
Variability among lakes with respect to the average and δ18OI was partially explained by statistically significant relationships with lake and watershed properties. The average was negatively correlated with the (p < 0.0001; Table 2, Fig. 5a) and average watershed slope (p = 0.0085; Table 2) and was positively correlated with the log of lake surface area (p < 0.0001; Table 2). Thus, lakes that had higher values tended to have a relatively smaller watershed size, a flatter watershed, and be larger in surface area. When these three variables are combined into a linear model, only the remained a significant predictor of the average (p = 0.0002), whereas lake area (p = 0.1949) and average watershed slope (p = 0.8472) became insignificant effects (Table 2). Both lake surface area and average watershed slope were correlated with the (Table 2). For the relationship between the average and , the majority of downstream lakes were outliers, having higher than typical ratios for a given as they inherited evaporated waters from upstream waterbodies (Fig. 5a).
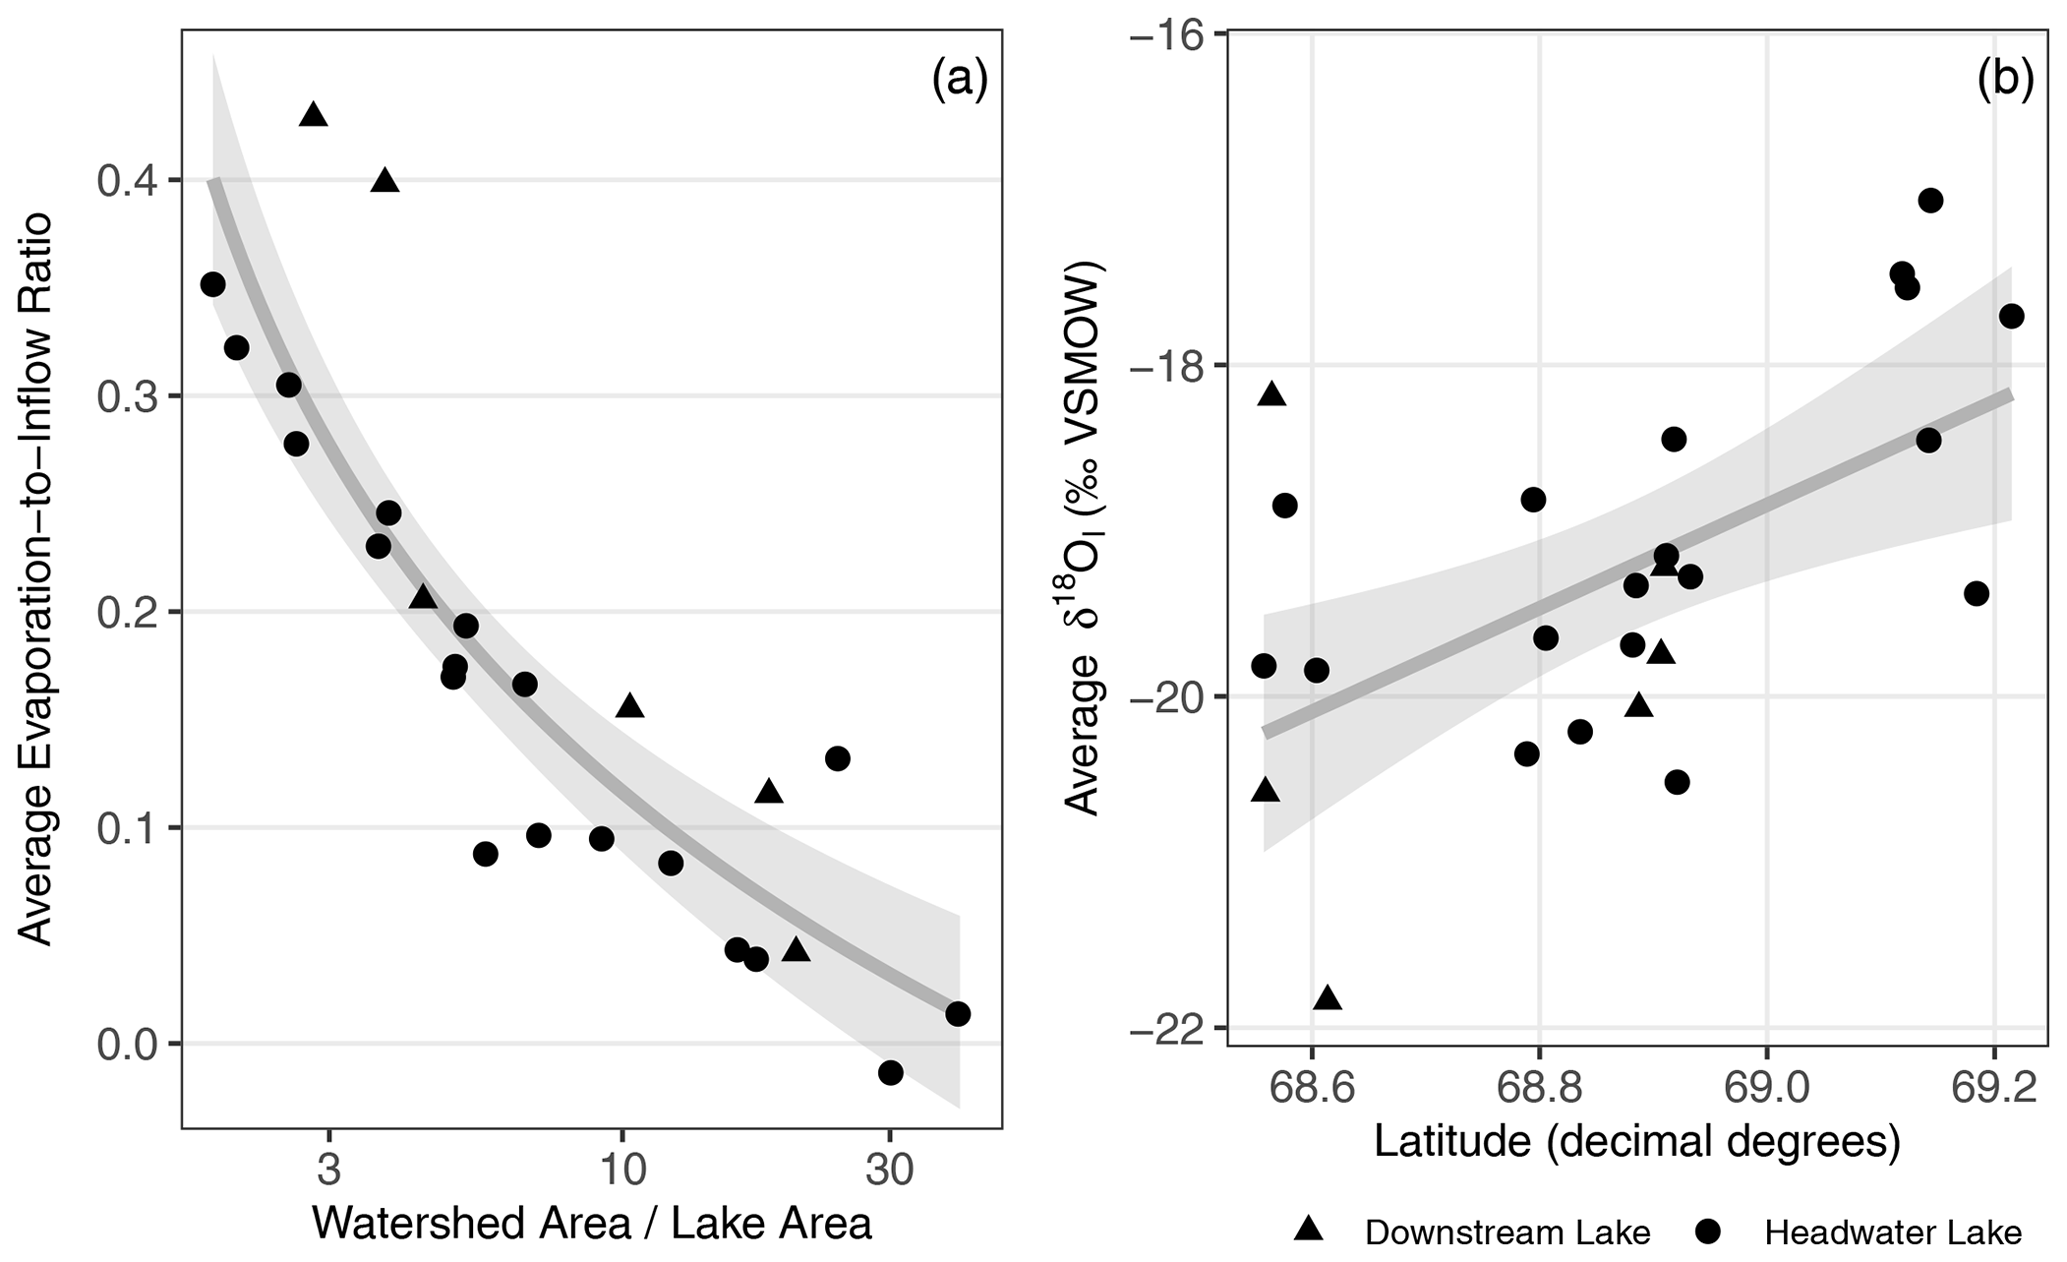
Figure 5(a) Relationship between the average evaporation-to-inflow ratio () and ratio of watershed area to lake area () for sampled lakes. The grey line represents a line of best fit between the and the average ratio, such that y=log(x), with the 95 % confidence interval shown in grey shading (R2 = 0.74, p < 0.0001). Note the logarithmic x axis. (b) The relationship between latitude and δI. The grey line represents a linear line of best fit between δI and latitude, with the 95 % confidence interval shown in grey shading (R2 = 0.30, p = 0.0027).
Average δ18OI was only correlated with two attributes: lake elevation (p = 0.0029) and latitude (p = 0.0027) (Table 2). Lakes at lower elevations and higher latitudes tended to have higher δ18OI values (Fig. 5b). Lake elevation and latitude are also nearly perfectly correlated (R2 = 0.97; Table 2), with lake elevation decreasing as latitude increases.
5.1 Influence of meteorological conditions on lake water balances
Water isotope measurements from five discrete time points provide context for characterizing the seasonal evolution of thermokarst lake water balances as a series of phases in relation to meteorological conditions and influential hydrological processes (Fig. 6). A previous study at many of the same lakes by Wilcox et al. (2022a) observed the presence of snowmelt bypass (Henriksen and Wright, 1977; Hendrey et al., 1980; Bergmann and Welch, 1985) during the freshet phase (P1; Fig. 6). Initial snowmelt runoff flowing into lakes did not mix with water underneath lake ice because the ∼ 0 ∘C snowmelt runoff was less dense than the deeper, warmer waters beneath the lake ice, causing it to flow into and out of lakes without mixing with lake water. This resulted in a much smaller reduction in the than would have occurred if freshet runoff was able to mix with the entire lake water column. While snowmelt bypass does limit the recharge of lake waters during the freshet phase, the sheer volume of snowmelt runoff and the lack of evaporation due to lake ice cover appear to compensate for the impact of snowmelt bypass and result in a greater reduction in the than any other phase (Fig. 4c).
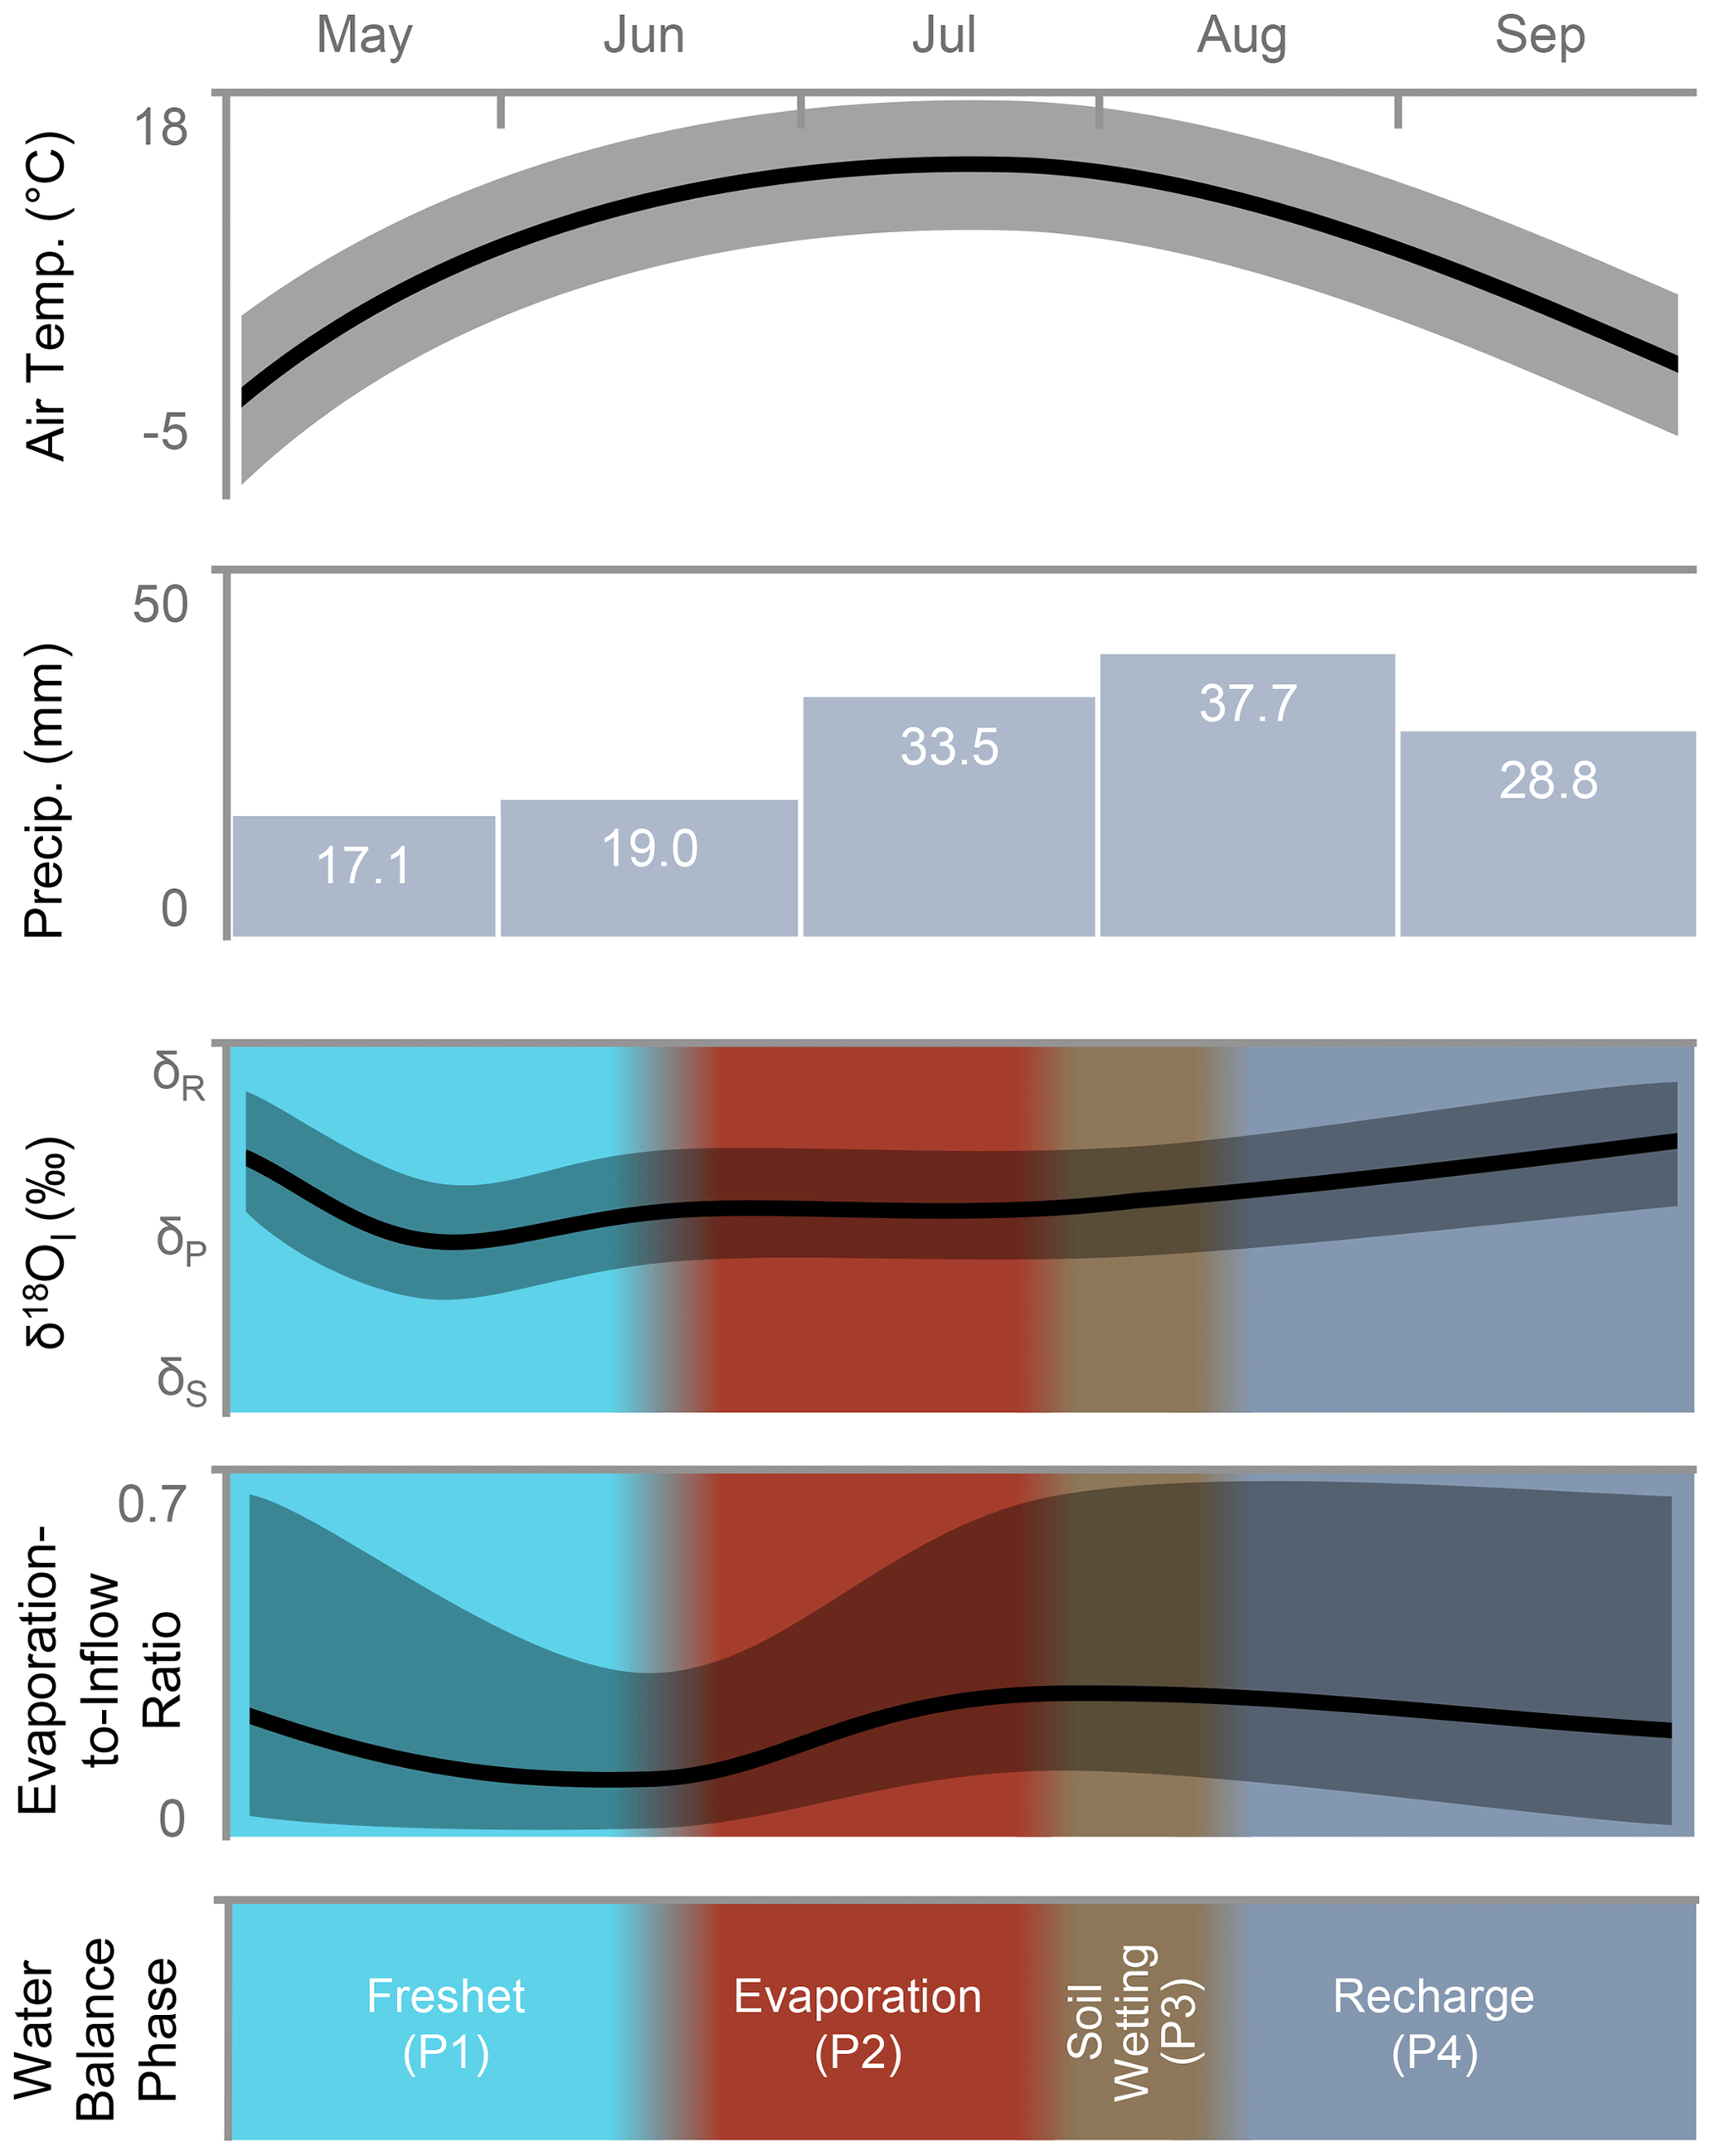
Figure 6A simplified conceptual diagram comparing meteorological conditions and the response of the δ18OI and used to designate water balance phases. Air temperature and precipitation data represent average values from 1980 to 2020 (Environment and Climate Change Canada, 2019). Shaded areas around the δ18OI and lines represent the potential variability caused by lake and watershed attributes or meteorological conditions.
During the freshet phase, δ18OI shifted towards the value of δP and not towards δS, even though minimal rainfall fell during the period (Fig. 2) and snowmelt runoff was flowing into lakes. Wilcox et al. (2022a) determined that the soil had begun to thaw by the time snowmelt runoff could mix with lake waters and, thus, allowed snowmelt runoff to mix with soil water from the previous year before flowing into lakes. This resulted in a post-snowmelt δ18OI that was a mixture of snow-sourced and rain-sourced water (Fig. 4a). As only a small amount of snow-sourced water was incorporated into lakes during the freshet phase, the δ18OI of lakes remained primarily rain-sourced throughout the entire study period (Fig. 4a).
The evaporation phase (P2; Fig. 6) was characterized by minimal change in δ18OI (Fig. 4a) and rising ratios at nearly all lakes (Fig. 4c), caused by the relatively dry and warm conditions that are typical of this region. Previous water balance studies conducted in this region also found that lake evaporation rates were higher as a result of substantial incoming solar radiation in June and July, compared with August and September, and when inflow is minimal due to low precipitation (Marsh and Bigras, 1988; Pohl et al., 2009).
During the brief soil wetting phase (P3; Fig. 6), there was minimal change in the δ18OI (Fig. 4a) and (Fig. 4b) despite the 41.2 mm of rainfall, which represented 25 % of the rainfall during the study period. This evidence suggests that little runoff was generated by this event and that rainfall which fell directly on lakes had only a minor effect on lake water balances. We hypothesize that dry conditions preceding the rainfall event allowed soils to absorb the rainfall without becoming saturated enough to generate much lateral flow. The lack of runoff in response to this rainfall event is expected given that antecedent soil moisture conditions have been observed to greatly influence the efficiency of runoff generation from rainfall events in areas underlain by continuous permafrost (Roulet and Woo, 1988; Kane et al., 1998; Favaro and Lamoureux, 2014; Stuefer et al., 2017). As the first half of the summer is typically drier than the second half (Fig. 6), soils generally experience drying throughout the first half of the summer before becoming rewetted.
The recharge phase (P4; Fig. 6) was defined by the δ18OI of lakes becoming more similar to rainfall (Fig. 4a) and the ratios decreasing to values similar to the beginning of the freshet phase (Fig. 4b). The recharge phase of 2018 experienced temperatures that were 3.8 ∘C lower than average and 66.1 mm of precipitation, exceeding the long-term mean of 37.2 mm (Fig. 2). Given the lower air temperatures, it is likely that evaporation rates also decreased and contributed to the decrease in . As the meteorological conditions were wetter and cooler than the long-term means, we expect the water balance conditions of the recharge phase captured in 2018 to be more representative of a later sampling date during a more normal climate year (e.g., late September). The ratios on 1 May were greater than 3 September, suggesting that lakes received less inflow during the recharge phase in 2017 than in 2018 (Fig. 4b).
Findings from previous studies of thermokarst lakes in this region imply that the four phases of lake water balance that we observed are typical of this region. The four phases of seasonal water balance evolution that we identified (freshet, evaporation, soil wetting, and recharge) roughly follow the pattern of seasonal changes in lake surface area observed by Cooley et al. (2019), who analyzed near-weekly satellite imagery of a large region which encompassed the lakes that we studied. Cooley et al. (2019) observed initial decreases in total lake surface area during the evaporation phase, followed by stabilizing or increasing trends in lake surface area by the end of August. Additionally, Pohl et al. (2009) modelled the water balance for a single lake in our study region across a 30-year period and identified that the maximum lake level was most likely to occur in early June or late August–early September, corresponding to the start of the evaporation phase and the end of the recharge phase.
In comparison to the five thermokarst lake regions examined in a synthesis of isotope data by MacDonald et al. (2017), the relatively low ratios and rainfall-like δ18OI values found at our study lakes compare most closely to lakes in the Alaskan Coastal Plain (ACP), where the majority of lakes also have an < 0.25 and a δ18OI similar to rain. This region is cooler during the summer and has a shorter ice-free season (Arp et al., 2015) than our study region, but it receives less precipitation and is more lake-rich (MacDonald et al., 2017), suggesting lakes likely have smaller watersheds than in our study region. The cooler and shorter summers in the ACP, which decrease evaporation, may be offset by smaller watersheds and less precipitation, which decrease inflow, leading to similar values to those for our study region. Our lakes differed from the more nearby Old Crow Flats (OCF), where most lakes have an between 0.25 and 0.75 but have a smaller of ∼ 3, whereas the average of lakes that we sampled was 9.5 (Table 1). The OCF differs from our study region in that it is situated in a post-glacial lake bed underlain by fine-grained glaciolacustrine sediments (Hughes, 1972), resulting in a relatively flat landscape with a poorer ability to convey runoff in comparison with our study region, where rolling hills are well drained by networks of peat channels with high hydraulic conductivity (Quinton and Marsh, 1998). These differences between the OCF and our study region may explain the greater values at the former; however, our study year was cooler and wetter than average, which may also have contributed to the comparatively low ratios.
5.2 Effects of lake and watershed attributes on
While shifts in the over time can be attributed to changing meteorological conditions and hydrological processes, differences in the among lakes can be further explained by lake and watershed attributes. Most of the variability in the average among lakes can be explained by the (R2 = 0.74; Fig. 5a), as lakes with a smaller likely receive less inflow and have greater ratios as a result. A similar inverse relationship between the ratios and has also been observed in OCF (Turner et al., 2014) and the taiga-shield of the Northwest Territories (Gibson and Edwards, 2002). Four of the six downstream lakes that we sampled had anomalously high ratios compared with their (Fig. 5a). Downstream lakes receive evaporated inflow from their upstream lakes, which is then evaporated further in the downstream lake, producing an enhanced ratio. When downstream lakes are removed from the regression between and , the R2 improves from 0.74 to 0.82.
We estimated the for lakes in the study area using the strong relationship between the average and . This was done by delineating the watersheds of lakes larger than 0.25 ha in the study area (Fig. 1) and applying the fitted regression between and the average for the headwater lakes that we sampled:
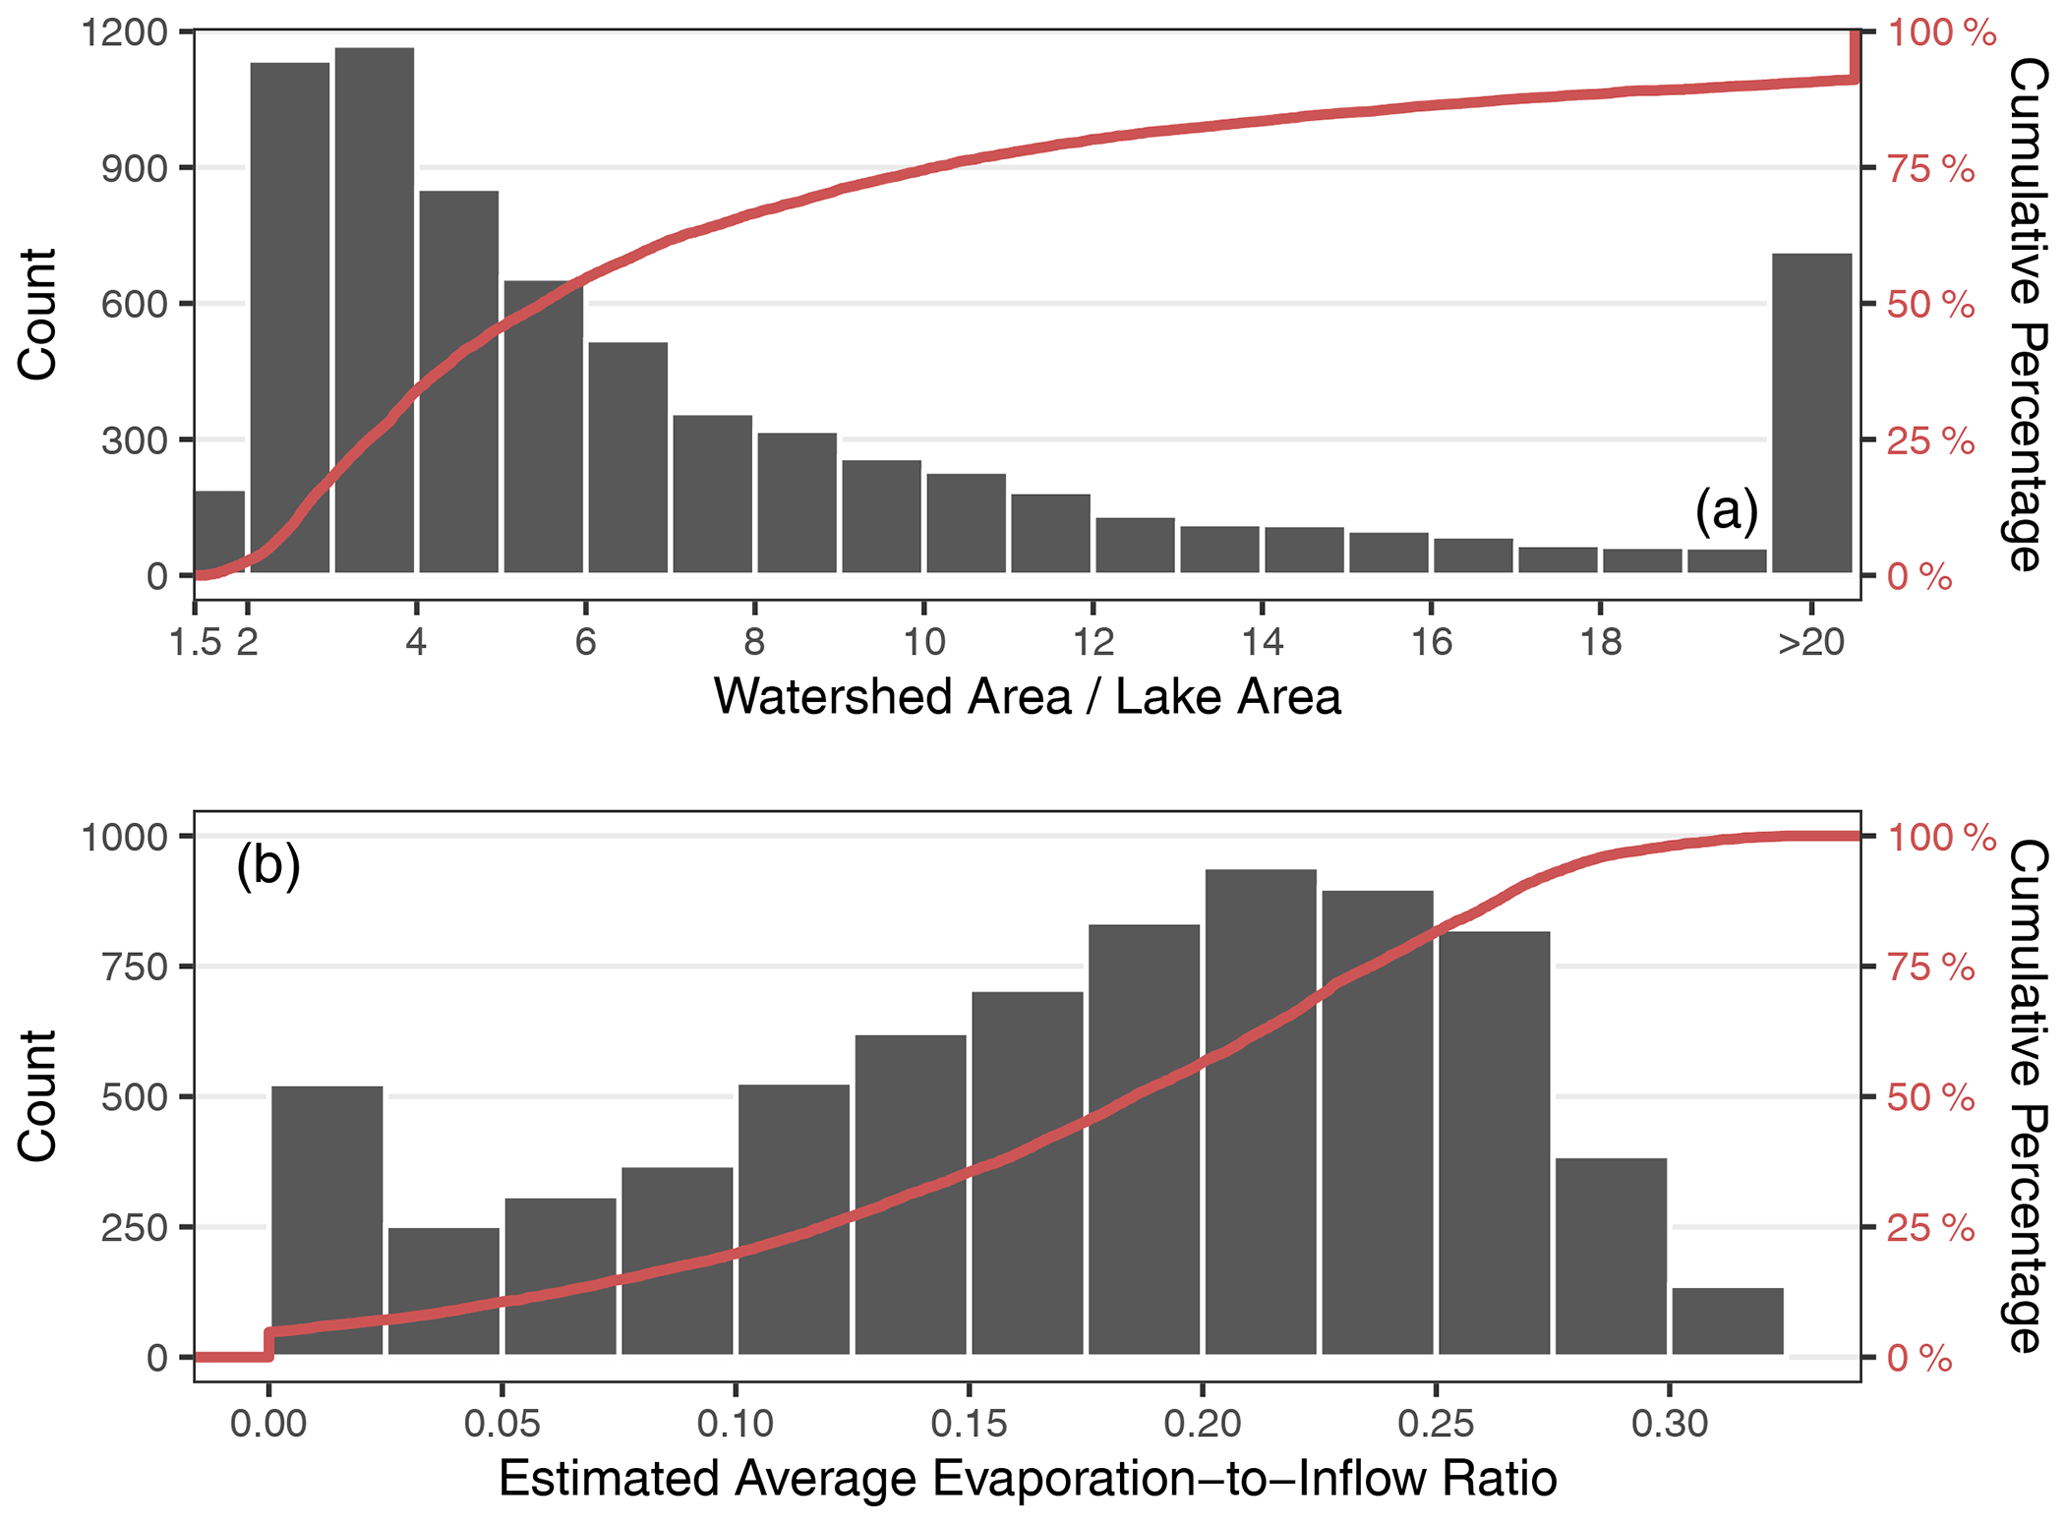
Figure 7Distribution of (a) the ratio of watershed area to lake area () and (b) evaporation to inflow () for 7340 lakes and their watersheds in the study area. Average is estimated using the relationship with the of headwater lakes. Note that the leftmost bin in panel (a) is only half the width of other bins, reflecting the rejection of all < 1.5 that we applied when filtering the data.
The resulting histogram of the average (Fig. 7b) is primarily skewed towards larger values, because the is skewed towards smaller values (Fig. 7a). An average between 0.2 and 0.225 is most common for lakes, indicating that the lakes are dominated by inflow. At > 30, the estimated becomes 0; as a result, 7 % of lakes are predicted to have an average of 0 (Fig. 7b). None of the lakes appear to be approaching desiccation.
We note that this distribution of values is dependent on the timing of our water sampling, the meteorological conditions during the study period, and the properties of the lakes that we selected. For example, the median lake depth of 34 lakes sampled in this region by Pienitz et al. (1997) was 3.0 m, similar to the lakes that we measured (Table 1); however, some lakes sampled by Pienitz et al. (1997) were up to 18.5 m in depth. The relationship that we derived between and is likely weaker for deeper lakes than sampled in our study, as lake surface area becomes less representative of lake volume when a wider range of lake depths are included. In that case, calculating the ratio of lake volume to watershed area could be a better predictor of ratios.
We hypothesize that the hydrological response of lakes in this region to climate change will be strongly influenced by their . Recent predictions of future Arctic precipitation indicate greater rainfall, greater snowfall, and more annual precipitation overall (Brown and Mote, 2009; Bintanja and Andry, 2017; Bintanja et al., 2020); in the OCF, increased rainfall is already reducing lake ratios (MacDonald et al., 2021). Under wetter conditions, we would expect that ratios would decrease for all lakes and that the threshold where average = 0 would also decrease. The logarithmic nature of the relationship between the and indicates that the average is more sensitive to changes in inflow as the decreases. Therefore, we expect that lakes with a smaller would experience greater reductions in the average under a wetter future climate. We also hypothesize that lakes with a larger could be more vulnerable to rapid lake drainage because they receive more inflow and likely experience greater fluctuations in lake level as a result; rapid drainage is typically triggered when extremely high water levels lead to the rapid thermomechanical erosion of a new lake outlet (Mackay, 1988; Brewer et al., 1993; Turner et al., 2010).
Alternatively, climate change may lead to a drier future for lakes, as ice-free periods lengthen, higher air temperatures increase evaporation, and permafrost thaw leads to landscape drying (Walvoord and Kurylyk, 2016; Koch et al., 2022; Webb and Liljedahl, 2023). A combination of such conditions has already caused lake contraction in western Greenland (Finger Higgens et al., 2019). If drier conditions prevail, given the logarithmic nature of the relationship between the and average , we expect that lakes with a smaller will experience greater increases in the average . If future climate change causes sufficiently dry conditions to bring about lake desiccation, a large number of lakes in the study area could potentially be affected, given that the distribution of the in the region is skewed towards smaller values, with many lakes possessing a < 4 (Fig. 7a). The “drier future” scenario may not necessarily lead to lake desiccation, given that all ratios that we estimated were < 1; however, the portion of precipitation converted into runoff can be halved during dry periods when compared with wetter periods (Stuefer et al., 2017), further reducing runoff to lakes.
Future studies could build on our hypothesis that the will mediate the response of lakes to climate change by comparing past changes in lake surface area, via remote sensing and paleohydrological analyses, with the . During drier periods, we would expect that lakes with a smaller would experience greater reductions in lake surface area than lakes with a larger . Previous studies from this region have already found that lakes' surface area changes in response to seasonal (Cooley et al., 2019) and multi-year (Plug et al., 2008) shifts in precipitation, indicating that changes to lake water balances can be observed by tracking changes in water surface area.
Water isotope-derived metrics were used to derive distinct seasonal phases of lake water balances for 25 thermokarst lakes in the tundra uplands east of the Mackenzie Delta (Northwest Territories, Canada). The freshet phase saw lakes experience a reduction in the and a shift in δI values towards δP, as a mixture of soil water and snowmelt-sourced freshet entered lakes and evaporation was minimal due to lake ice cover. Following this period was the evaporation phase, during which minimal precipitation and warm and sunny conditions led to increasing ratios and no change in δI. Then, a brief and intense period of rainfall led to minimal response in the and δI at lakes, as dry soils absorbed most of the precipitation during the soil wetting phase. In the final stages of summer during the recharge phase, air temperatures declined and precipitation was unseasonably high, causing reductions in the and a shift in δI towards δR as lakes received increased runoff from their watersheds and evaporation rates were reduced.
Comparison of water isotope-derived lake water balance components with lake and watershed attributes shows that the explains the majority of variability in the among lakes. The strong relationship between the average and allowed us to predict the average for 7340 lakes in the study region. The predicted average values were low compared with other regions of thermokarst lakes, only reaching 0.33, indicating that lakes are not currently close to being at risk of desiccation. We hypothesize that lakes with a larger will be more prone to rapid drainage if future conditions are wetter.
Few studies have directly investigated the influence of the on (Gibson and Edwards, 2002; Turner et al., 2014); however, given the strong relationship that we found, the could serve as a useful metric in other permafrost environments for characterizing thermokarst lake water balances and predicting the vulnerability of lakes to climate change. The non-uniform response of lake surface area to past climate change (Smith et al., 2005; Plug et al., 2008; Arp et al., 2011; Jones et al., 2011; Andresen and Lougheed, 2015) may also be explained by the ; future studies could investigate whether lakes with a smaller are more likely to decrease in surface area than lakes with a larger . Further associations between the and biogeochemical properties of lakes may also exist, as the has been linked to the biogeochemistry of a wide range of lakes, from tropical to tundra environments (Kosten et al., 2009).
The calculation of the point of maximum evaporative isotopic enrichment, or the isotope composition of lake at the point of desiccation (δ∗), was carried out as follows (Gonfiantini, 1986):
Here, α∗ is the fractionation factor between the liquid and vapour phase of water, and ε∗ and εk are the respective equilibrium and kinetic separation terms, with ε∗ serving as a convenient expression of α∗, where . The term h represents the relative humidity for the ice-free season (see below). Equilibrium fractionation (α∗) was calculated following equations from Horita and Wesolowski (1994):
for δ18O, and
for δ2H. Here, T represents the temperature of the interface (K) (see below). The kinetic separation term εk was calculated as follows:
where x=0.0142 for δ18O and x=0.0125 for δ2H (Gonfiantini, 1986). δAs represents the isotope composition of atmospheric vapour, which we assume is in equilibrium with the isotope composition of summertime precipitation (δPs; Gibson and Edwards, 2002). We can therefore estimate δAs as follows:
The reference point of when = 1 (δSSL) was calculated using
where δP represents average precipitation (Gonfiantini, 1986).
Data for air temperature and relative humidity were collected at Trail Valley Creek (TVC) near the centre of the study area. The time period used for the average air temperature and relative humidity spans from when lakes became ice-free (15 June 2018) until the last day of sampling (3 September 2018) to match the time span between the first and last sampling dates. For a few dates, air temperature was not recorded by the TVC meteorological station maintained by the Meteorological Service of Canada, and air temperature from another meteorological station at TVC was used instead.
The isotope composition of the lake-specific input water (δI) was calculated following Yi et al. (2008), where δI is estimated as the intersection of the LMWL and the lake-specific LEL, defined as the line between the measured isotope composition of the lake (δL) and δE, which is the isotope composition of vapour evaporating from the lake. δE was calculated following Gonfiantini (1986):
δI, δE, and δL were then used to calculate the ratio of evaporation to inflow () as described by Yi et al. (2008) and others as
assuming that lakes are well mixed and in hydrological and isotopic steady state.
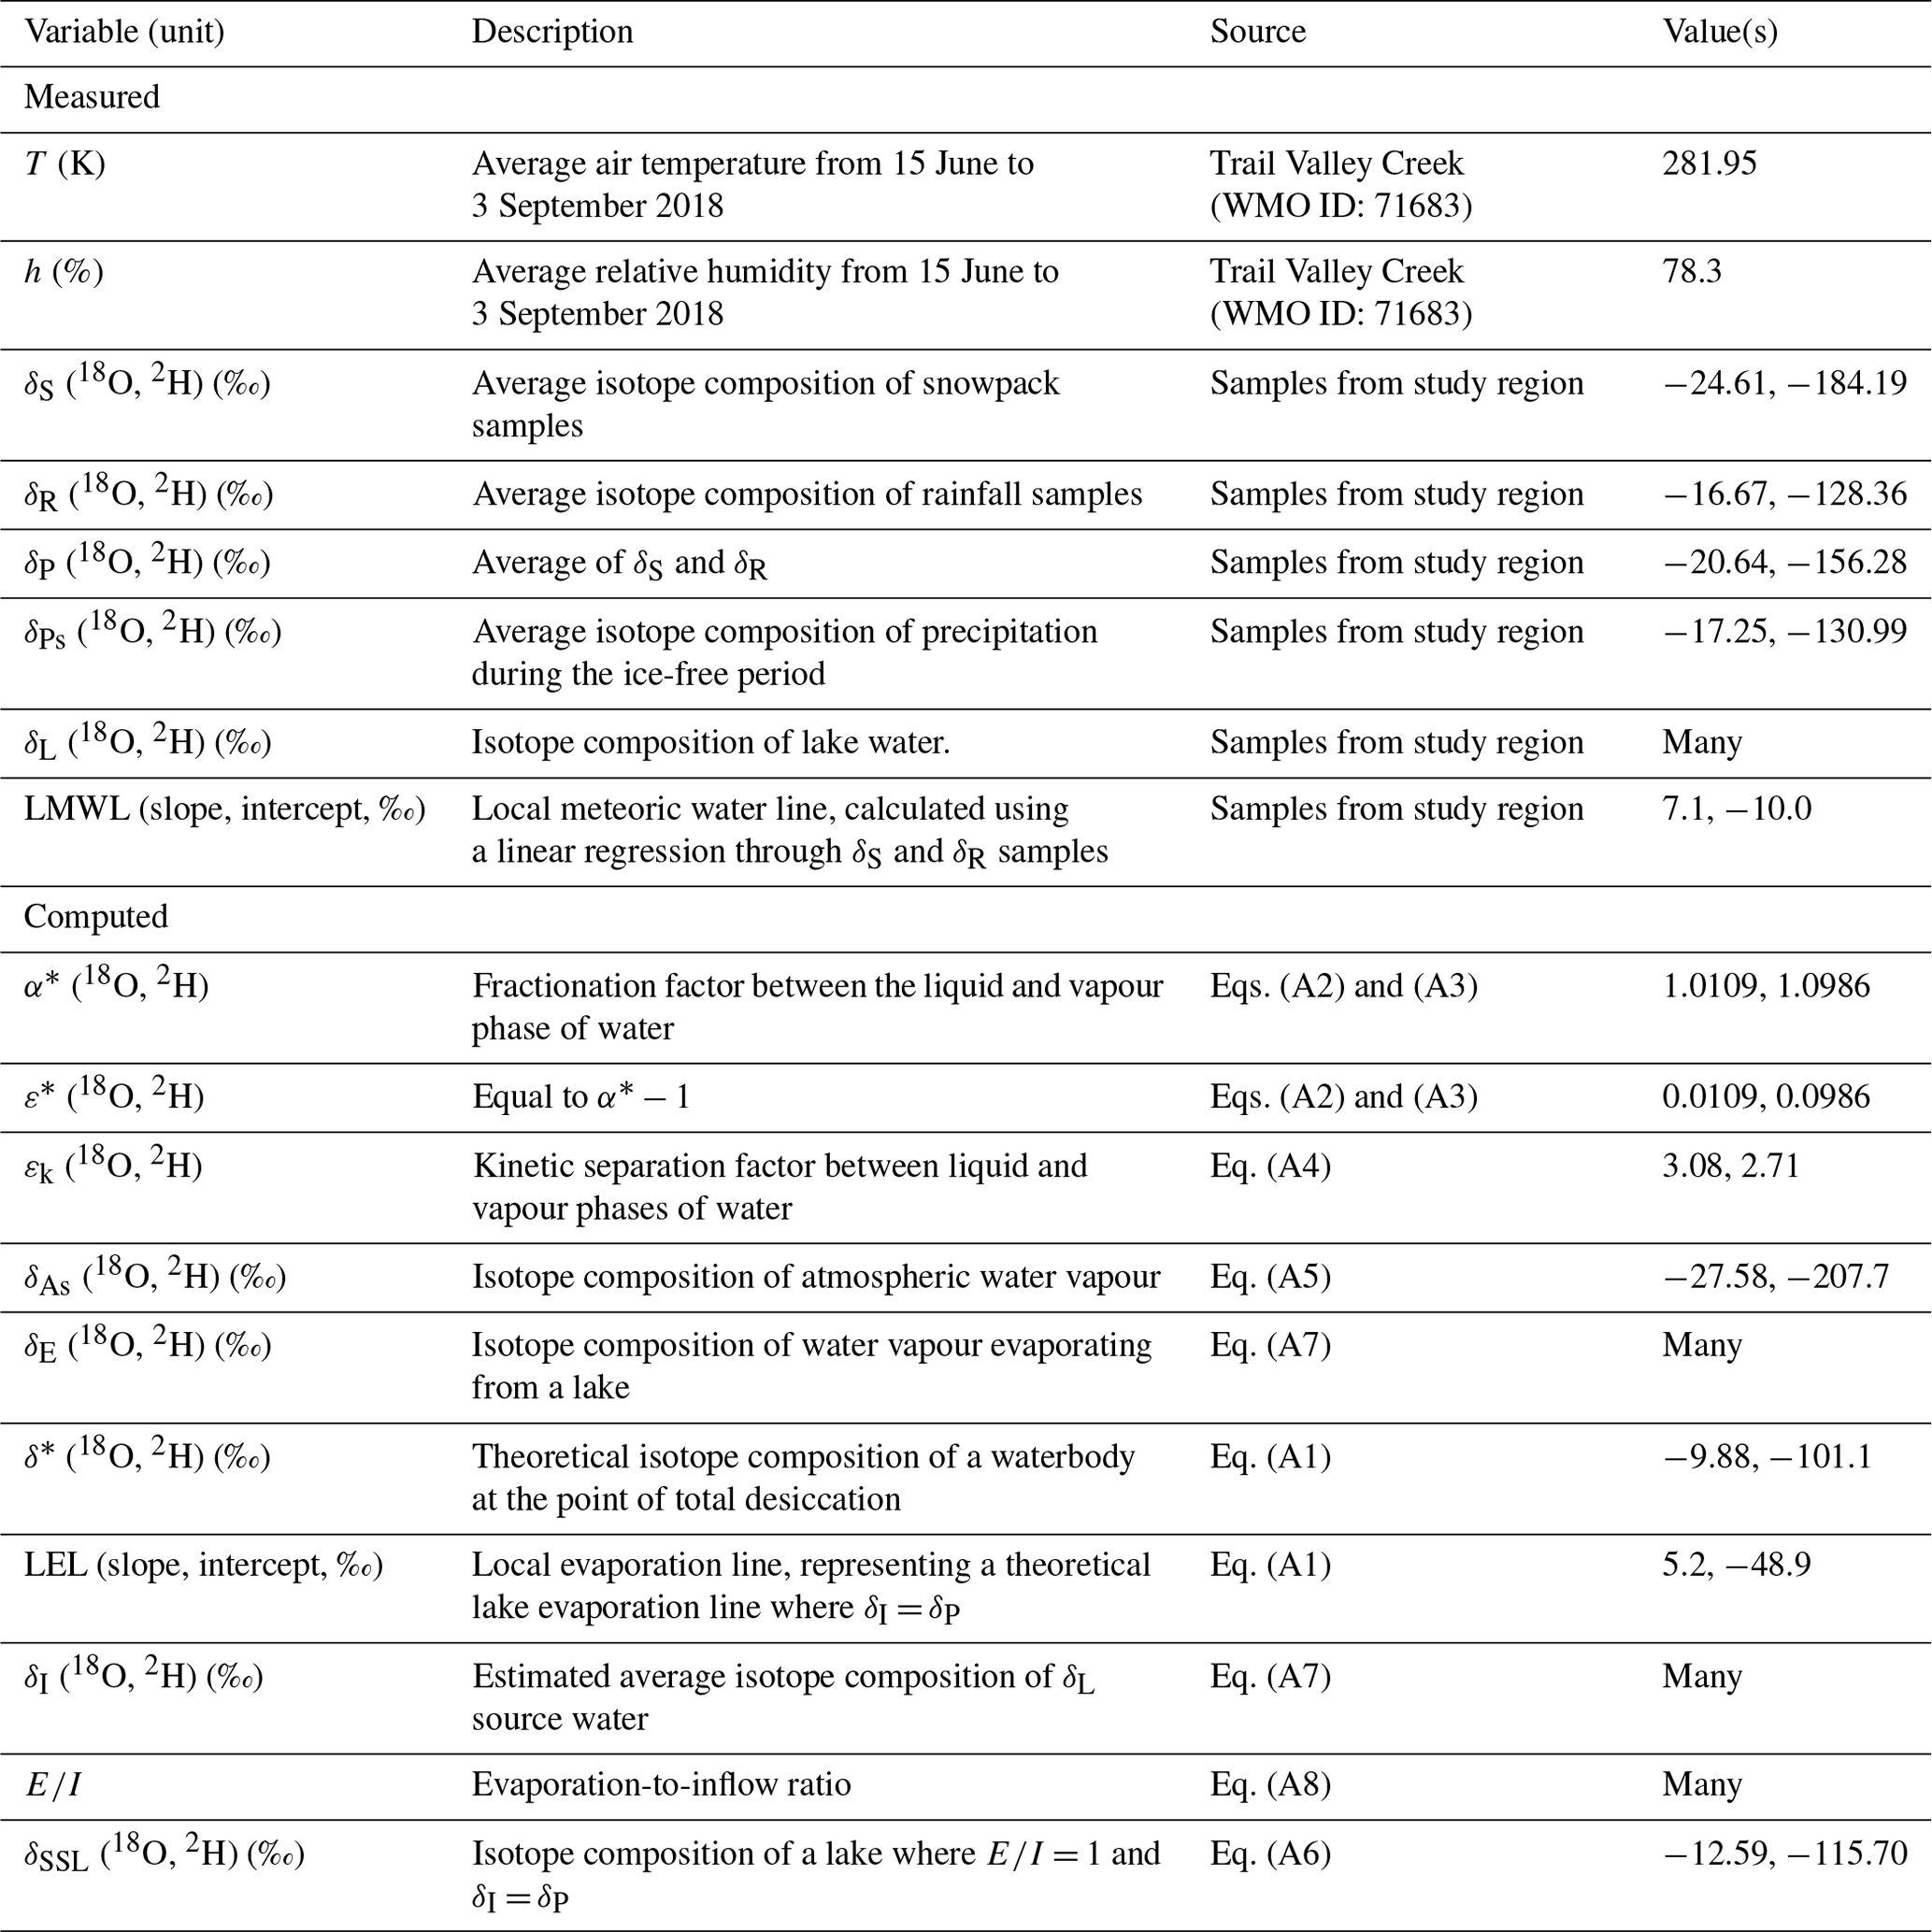
Table A1List of variables used in isotope framework and their values.
Data used in the paper are presented in Tables 1 and 2 and in the Appendix. Lake isotope and attribute data can be downloaded from the Trail Valley Creek Research Station Dataverse at https://doi.org/10.5683/SP3/AZE4ER (Wilcox et al., 2022b). Meteorological data were retrieved from Environment and Climate Change Canada at https://climate.weather.gc.ca/historical_data/search_historic_data_stations_e.html?searchType=stnName&timeframe=1&txtStationName=trail+valley&searchMethod=contains&optLimit=yearRange&StartYear=1840&EndYear=2022&Year=2022&Month=12&Day=2&selRowPerPage=25 (Environment and Climate Change Canada, 2019).
The study design and sampling plan were developed by EJW with input from BBW and PM. The field data collection and sample preparation for lab analysis were carried out by EJW. Analysis of the data was completed by EJW with input from BBW. The manuscript was primarily written by EJW with input from BBW and PM.
The contact author has declared that none of the authors has any competing interests.
Publisher's note: Copernicus Publications remains neutral with regard to jurisdictional claims in published maps and institutional affiliations.
The research license (no. 16237) was administered by the Aurora Research Institute in Inuvik, Northwest Territories, Canada, and can be found at http://data.nwtresearch.com/Scientific/16237 (last access: 7 June 2023). The authors are grateful for the assistance of the Arctic Hydrology Research Group members with respect to completing the fieldwork. The authors also thank the staff of the UW-EIL for completing the isotope analyses and Rhys Gwynne for providing details about the isotope analysis protocol. The authors are grateful for the thoughtful reviews from Sofia E. Kjellman, Seifu Kebede Gurmessa, and an anonymous referee.
This research has been supported by the Natural Sciences and Engineering Research Council of Canada (grant no. RGPIN-2016-06251), a W. Garfield Weston Award for Northern Research (grant no. 201836739503), the Ontario Graduate Scholarship program, ArcticNet, Northern Water Futures, the Northern Scientific Training Program (grant no. 90884513), the Polar Continental Shelf Program, the Canada Research Chairs program, and the Natural Sciences and Engineering Research Council of Canada.
This paper was edited by Damien Bouffard and reviewed by Sofia E. Kjellman, Seifu Kebede Gurmessa, and one anonymous referee.
Andresen, C. G. and Lougheed, V. L.: Disappearing Arctic tundra ponds: Fine-scale analysis of surface hydrology in drained thaw lake basins over a 65 year period (1948–2013), J. Geophys. Res.-Biogeo., 120, 466–479, https://doi.org/10.1002/2014JG002778, 2015. a, b
Arp, C. D., Jones, B. M., Urban, F. E., and Grosse, G.: Hydrogeomorphic processes of thermokarst lakes with grounded-ice and floating-ice regimes on the Arctic coastal plain, Alaska, Hydrol. Process., 25, 2422–2438, https://doi.org/10.1002/hyp.8019, 2011. a, b
Arp, C. D., Jones, B. M., Liljedahl, A. K., Hinkel, K. M., and Welker, J. A.: Depth, ice thickness, and ice-out timing cause divergent hydrologic responses among Arctic lakes, Water Resour. Res., 51, 9379–9401, https://doi.org/10.1016/0022-1694(68)90080-2, 2015. a, b, c, d
Bartsch, A., Widhalm, B., Leibman, M., Ermokhina, K., Kumpula, T., Skarin, A., Wilcox, E. J., Jones, B. M., Frost, G. V., Höfler, A., and Pointner, G.: Feasibility of tundra vegetation height retrieval from Sentinel-1 and Sentinel-2 data, Remote Sens. Environ., 237, 111515, https://doi.org/10.1016/j.rse.2019.111515, 2020. a
Bergmann, M. A. and Welch, H. E.: Spring Meltwater Mixing in Small Arctic Lakes, Can. J. Fish. Aquat. Sci., 42, 1789–1798, https://doi.org/10.1139/f85-224, 1985. a, b
Bintanja, R. and Andry, O.: Towards a rain-dominated Arctic, Nat. Clim. Change, 7, 263–267, https://doi.org/10.1038/nclimate3240, 2017. a, b
Bintanja, R., van der Wiel, K., van der Linden, E. C., Reusen, J., Bogerd, L., Krikken, F., and Selten, F. M.: Strong future increases in Arctic precipitation variability linked to poleward moisture transport, Science Advances, 6, eaax6869, https://doi.org/10.1126/sciadv.aax6869, 2020. a
Bouchard, F., Turner, K. W., MacDonald, L. A., Deakin, C., White, H., Farquharson, N., Medeiros, A. S., Wolfe, B. B., Hall, R. I., Pienitz, R., and Edwards, T. W. D.: Vulnerability of shallow subarctic lakes to evaporate and desiccate when snowmelt runoff is low, Geophys. Res. Lett., 40, 6112–6117, https://doi.org/10.1002/2013GL058635, 2013. a
Brewer, M. C., Carter, L., Glenn, R., and Murray, R.: Sudden drainage of a thaw lake on the Alaskan Arctic coastal plain, in: Proceedings of the Sixth International Conference on Permafrost, South China University of Technology Press, Wushan Guangzhou, 48–53, https://www.permafrost.org/wp-content/uploads/ConferenceMaterials/06th-International-Conference-on-Permafrost-1-Volume (last access: 7 June 2023), 1993. a
Brown, R. D. and Mote, P. W.: The response of Northern Hemisphere snow cover to a changing climate, J. Climate, 22, 2124–2145, https://doi.org/10.1175/2008JCLI2665.1, 2009. a
Burn, C. and Kokelj, S.: The Environment and Permafrost of the Mackenzie Delta Area, Permafrost Periglac., 20, 83–105, https://doi.org/10.1002/ppp.655, 2009. a, b
Cooley, S. W., Smith, L. C., Ryan, J. C., Pitcher, L. H., and Pavelsky, T. M.: Arctic-Boreal Lake Dynamics Revealed Using CubeSat Imagery, Geophys. Res. Lett., 46, 2111–2120, https://doi.org/10.1029/2018GL081584, 2019. a, b, c
Coplen, T. B.: New guidelines for reporting stable hydrogen, carbon, and oxygen isotope-ratio data, Geochim. Cosmochim. Ac., 60, 3359–3360, 1996. a
Craig, H.: Isotopic Variations in Meteoric Waters, Science, 133, 1702–1703, https://doi.org/10.1126/science.133.3465.1702, 1961. a
Edwards, T. W. D., Wolfe, B. B., Gibson, J. J., and Hammarlund, D.: Use of water isotope tracers in high latitude hydrology and paleohydrology, in: Long-term Environmental Change in Arctic and Antarctic Lakes, vol. 8 of Developments in Paleoenvironmental Research, edited by: Smol, J. P., Pienitz, R., and Douglas, M. S. V., Springer Netherlands, Dordrecht, 187–207, https://doi.org/10.1007/978-1-4020-2126-8_7, 2004. a
Environment and Climate Change Canada: Past weather and climate: Historical Data, Canada.ca [data set], https://climate.weather.gc.ca/historical_data/search_historic_data_stations_e.html?searchType=stnName&timeframe=1&txtStationName=trail+valley&searchMethod=contains&optLimit=yearRange&StartYear=1840&EndYear=2022&Year=2022&Month=12&Day=2&selRowPerPage=25 (last access: 16 May 2022), 2019. a, b, c
Esri: ArcGIS 10.7.1, https://desktop.arcgis.com/en/arcmap/10.7/get-started/installation-guide/introduction.htm (last access: 7 June 2023), 2019. a
Essery, R. and Pomeroy, J.: Vegetation and Topographic Control of Wind-Blown Snow Distributions in Distributed and Aggregated Simulations for an Arctic Tundra Basin, J. Hydrometeorol., 5, 735–744, https://doi.org/10.1175/1525-7541(2004)005<0735:VATCOW>2.0.CO;2, 2004. a
Favaro, E. A. and Lamoureux, S. F.: Antecedent Controls on Rainfall Runoff Response and Sediment Transport in a High Arctic Catchment, Geogr. Ann. A, 96, 433–446, https://doi.org/10.1111/geoa.12063, 2014. a
Ferrick, M. G., Calkins, D. J., Perron, N. M., Cragin, J. H., and Kendall, C.: Diffusion model validation and interpretation of stable isotopes in river and lake ice, Hydrol. Process., 16, 851–872, https://doi.org/10.1002/hyp.374, 2002. a
Finger Higgens, R. A., Chipman, J. W., Lutz, D. A., Culler, L. E., Virginia, R. A., and Ogden, L. A.: Changing Lake Dynamics Indicate a Drier Arctic in Western Greenland, J. Geophys. Res.-Biogeo., 124, 870–883, https://doi.org/10.1029/2018JG004879, 2019. a
Fritz, M., Wetterich, S., McAlister, J., and Meyer, H.: A new local meteoric water line for Inuvik (NT, Canada), Earth Syst. Sci. Data, 14, 57–63, https://doi.org/10.5194/essd-14-57-2022, 2022. a, b, c
Gibson, J.: Short-term evaporation and water budget comparisons in shallow Arctic lakes using non-steady isotope mass balance, J. Hydrol., 264, 242–261, https://doi.org/10.1016/S0022-1694(02)00091-4, 2002. a
Gibson, J. J. and Edwards, T. W. D.: Regional water balance trends and evaporation-transpiration partitioning from a stable isotope survey of lakes in northern Canada, Global Biogeochem. Cy., 16, 10–11, https://doi.org/10.1029/2001GB001839, 2002. a, b, c
Gibson, J. J., Edwards, T. W. D., and Bursey, G. G.: Estimating Evaporation Using Stable Isotopes : Quantitative Results and Sensitivity Analysis for Two Catchments in Northern Canada, Nord. Hydrol., 24, 79–94, https://doi.org/10.2166/nh.1993.0015, 1993. a
Gonfiantini, R.: Environmental Isotopes in Lake Studies, in: The Terrestrial Environment, B, Elsevier, 113–168, https://doi.org/10.1016/B978-0-444-42225-5.50008-5, 1986. a, b, c, d, e, f
Grünberg, I., Wilcox, E. J., Zwieback, S., Marsh, P., and Boike, J.: Linking tundra vegetation, snow, soil temperature, and permafrost, Biogeosciences, 17, 4261–4279, https://doi.org/10.5194/bg-17-4261-2020, 2020. a
Hendrey, G. R., Galloway, J. N., and Schofield, C. L.: Temporal and spatial trends in the chemistry of acidified lakes under ice cover, in: International Conference on the Ecological Impact of Acid Precipitation, Brookhaven National Lab, https://www.osti.gov/servlets/purl/5267289 (last access: 7 June 2023), 1980. a
Henriksen, A. and Wright, R. F.: Effects of Acid Precipitation on a Small Acid Lake in Southern Norway, Nord. Hydrol., 8, 1–10, https://doi.org/10.2166/nh.1977.0001, 1977. a
Horita, J. and Wesolowski, D. J.: Liquid-vapor fractionation of oxygen and hydrogen isotopes of water from the freezing to the critical temperature, Geochim. Cosmochim. Ac., 58, 3425–3437, https://doi.org/10.1016/0016-7037(94)90096-5, 1994. a
Hughes, O. L.: Surficial Geology of northern Yukon Territory and northwestern District of Mackenzie, Northwest Territories, Tech. rep., Geological Survey of Canada, https://doi.org/10.4095/102354, 1972. a
IAEA/WMO: Global Network of Isotopes in Precipitation, The GNIP Database [data set], https://nucleus.iaea.org/wiser (last access: 7 June 2023), 2023. a
Jones, B. M., Grosse, G., Arp, C. D., Jones, M. C., Walter Anthony, K. M., and Romanovsky, V. E.: Modern thermokarst lake dynamics in the continuous permafrost zone, northern Seward Peninsula, Alaska, J. Geophys. Res., 116, G00M03, https://doi.org/10.1029/2011JG001666, 2011. a, b
Kane, D. L., Soden, D. J., Hinzman, L. D., and Gieck, R. E.: Rainfall runoff of a nested watershed in the alaskan arctic, in: Seventh International Conference on Permafrost, 55, 23–27 June 1998, Nordicana, Yellowknife, 539–544, https://www.uspermafrost.org/assets/docs/Publications/Proceedings/07th International Conference on Permafrost - Program, Abstracts, Reports of Perm Assoc June 23-27 1998.pdf (last access: 7 June 2023), 1998. a
Koch, J. C., Sjoberg, Y., O'Donnell, J., Carey, M., Sullivan, P. F., and Terskaia, A.: Sensitivity of headwater streamflow to thawing permafrost and vegetation change in a warming Arctic, Environ. Res. Lett., 2, 0–31, https://doi.org/10.1088/1748-9326/ac5f2d, 2022. a, b
Kosten, S., Huszar, V. L., Mazzeo, N., Scheffer, M., Sternberg, L. d. S., and Jeppesen, E.: Lake and watershed characteristics rather than climate influence nutrient limitation in shallow lakes, Ecol. Appl., 19, 1791–1804, 2009. a
Lantz, T. C., Gergel, S. E., and Kokelj, S. V.: Spatial heterogeneity in the shrub tundra ecotone in the Mackenzie Delta region, Northwest territories: Implications for Arctic environmental change, Ecosystems, 13, 194–204, https://doi.org/10.1007/s10021-009-9310-0, 2010. a
MacDonald, L. A., Wolfe, B. B., Turner, K. W., Anderson, L., Arp, C. D., Birks, S. J., Bouchard, F., Edwards, T. W., Farquharson, N., Hall, R. I., McDonald, I., Narancic, B., Ouimet, C., Pienitz, R., Tondu, J., and White, H.: A synthesis of thermokarst lake water balance in high-latitude regions of North America from isotope tracers, Arctic Science, 3, 118–149, https://doi.org/10.1139/as-2016-0019, 2017. a, b, c, d, e
MacDonald, L. A., Turner, K. W., McDonald, I., Kay, M. L., Hall, R. I., and Wolfe, B. B.: Isotopic evidence of increasing water abundance and lake hydrological change in Old Crow Flats, Yukon, Canada, Environ. Res. Lett., 16, 124024, https://doi.org/10.1088/1748-9326/ac3533, 2021. a, b
Mackay, J. R.: Catastrophic lake drainage, Tuktoyaktuk Peninsula area, District of Mackenzie, in: Current research part D: interior plains and Arctic Canada, Geological Survey of Canada, 83–90, https://doi.org/10.4095/122651, 1988. a
Marsh, P. and Bigras, S. C.: Evaporation from Mackenzie Delta Lakes, N. W. T., Canada, Arctic Alpine Res., 20, 220, https://doi.org/10.2307/1551500, 1988. a
Marsh, P., Russell, M., Pohl, S., Haywood, H., and Onclin, C.: Changes in thaw lake drainage in the Western Canadian Arctic from 1950 to 2000, Hydrol. Process., 23, 145–158, https://doi.org/10.1002/hyp.7179, 2009. a
Marsh, P., Mann, P., and Walker, B.: Changing snowfall and snow cover in the western Canadian Arctic, in: 22nd Northern Research Basins Symposium and Workshop, 18–23 August 2019, Yellowknife, 1–10, https://conferences.wlu.ca/22ndnrb/wp-content/uploads/sites/19/2022/03/222nd-Northern-Research-Basins-Symposium-Proceedings-sm.pdf (last access: 7 June 2023), 2019. a
Narancic, B., Wolfe, B. B., Pienitz, R., Meyer, H., and Lamhonwah, D.: Landscape-gradient assessment of thermokarst lake hydrology using water isotope tracers, J. Hydrol., 545, 327–338, https://doi.org/10.1016/j.jhydrol.2016.11.028, 2017. a
Nitze, I., Grosse, G., Jones, B. M., Arp, C. D., Ulrich, M., Fedorov, A., and Veremeeva, A.: Landsat-based trend analysis of lake dynamics across Northern Permafrost Regions, Remote Sens.-Basel, 9, 1–28, https://doi.org/10.3390/rs9070640, 2017. a
O'Callaghan, J. F. and Mark, D. M.: The extraction of drainage networks from digital elevation data, Comput. Vision Graph., 28, 323–344, 1984. a
PGC: ArcticDEM, https://www.pgc.umn.edu/data/ (last access: 7 June 2023), 2018. a
Pienitz, R., Smol, J. P., and Lean, D. R.: Physical and chemical limnology of 59 lakes located between the southern Yukon and the Tuktoyaktuk Peninsula, Northwest Territories (Canada), Can. J. Fish. Aquat. Sci., 54, 330–346, https://doi.org/10.1139/f96-274, 1997. a, b
Plug, L. J., Walls, C., and Scott, B. M.: Tundra lake changes from 1978 to 2001 on the Tuktoyaktuk Peninsula, western Canadian Arctic, Geophys. Res. Lett., 35, 1–5, https://doi.org/10.1029/2007GL032303, 2008. a, b, c
Pohl, S., Marsh, P., Onclin, C., and Russell, M.: The summer hydrology of a small upland tundra thaw lake: implications to lake drainage, Hydrol. Process., 23, 2536–2546, https://doi.org/10.1002/hyp.7238, 2009. a, b
Pomeroy, J. W., Bewley, D. S., Essery, R. L. H., Hedstrom, N. R., Link, T., Granger, R. J., Sicart, J. E., Ellis, C. R., and Janowicz, J. R.: Shrub tundra snowmelt, Hydrol. Process., 20, 923–941, https://doi.org/10.1002/hyp.6124, 2006. a
Prowse, T., Alfredsen, K., Beltaos, S., Bonsal, B., Duguay, C., Korhola, A., McNamara, J., Pienitz, R., Vincent, W. F., Vuglinsky, V., and Weyhenmeyer, G. A.: Past and future changes in arctic lake and river ice, Ambio, 40, 53–62, https://doi.org/10.1007/s13280-011-0216-7, 2011. a
Quinton, W. L. and Marsh, P.: The influence of mineral earth hummocks on subsurface drainage in the continuous permafrost zone, Permafrost Periglac., 9, 213–228, https://doi.org/10.1002/(SICI)1099-1530(199807/09)9:3<213::AID-PPP285>3.0.CO;2-E, 1998. a, b
Rampton, V. N.: Quaternary geology of the Tuktoyaktuk coastlands, Northwest Territories, Geological Survey of Canada, https://doi.org/10.4095/126937, 1988. a
R Core Team: R: A Language and Environment for Statistical Computing, https://www.r-project.org/ (last access: 7 June 2023), 2021. a
Remmer, C. R., Owca, T., Neary, L., Wiklund, J. A., Kay, M., Wolfe, B. B., and Hall, R. I.: Delineating extent and magnitude of river flooding to lakes across a northern delta using water isotope tracers, Hydrol. Process., 34, 303–320, https://doi.org/10.1002/hyp.13585, 2020. a
Roulet, N. T. and Woo, M. K.: Runoff generation in a low Arctic drainage basin, J. Hydrol., 101, 213–226, https://doi.org/10.1016/0022-1694(88)90036-4, 1988. a
Smith, L. C., Sheng, Y., MacDonald, G. M., and Hinzman, L. D.: Disappearing Arctic Lakes, Science, 308, 1429–1429, https://doi.org/10.1126/science.1108142, 2005. a, b
Stuefer, S. L., Arp, C. D., Kane, D. L., and Liljedahl, A. K.: Recent Extreme Runoff Observations From Coastal Arctic Watersheds in Alaska, Water Resour. Res., 53, 9145–9163, https://doi.org/10.1002/2017WR020567, 2017. a, b
Sturm, M., Racine, C., and Tape, K.: Increasing shrub abundance in the Arctic., Nature, 411, 546–547, https://doi.org/10.1038/35079180, 2001. a
Tananaev, N. and Lotsari, E.: Defrosting northern catchments: Fluvial effects of permafrost degradation, Earth-Sci. Rev., 228, 103996, https://doi.org/10.1016/j.earscirev.2022.103996, 2022. a
Tondu, J. M. E., Turner, K. W., Wolfe, B. B., Hall, R. I., Edwards, T. W. D., and McDonald, I.: Using Water Isotope Tracers to Develop the Hydrological Component of a Long-Term Aquatic Ecosystem Monitoring Program for a Northern Lake-Rich Landscape, Arct. Antarct. Alp. Res., 45, 594–614, https://doi.org/10.1657/1938-4246-45.4.594, 2013. a
Travers-Smith, H. Z., Lantz, T. C., and Fraser, R. H.: Surface Water Dynamics and Rapid Lake Drainage in the Western Canadian Subarctic (1985–2020), J. Geophys. Res.-Biogeo., 126, e2021JG006445, https://doi.org/10.1029/2021JG006445, 2021. a
Turner, K. W., Wolfe, B. B., and Edwards, T. W.: Characterizing the role of hydrological processes on lake water balances in the Old Crow Flats, Yukon Territory, Canada, using water isotope tracers, J. Hydrol., 386, 103–117, https://doi.org/10.1016/j.jhydrol.2010.03.012, 2010. a
Turner, K. W., Wolfe, B. B., Edwards, T. W. D., Lantz, T. C., Hall, R. I., and Larocque, G.: Controls on water balance of shallow thermokarst lakes and their relations with catchment characteristics: a multi-year, landscape-scale assessment based on water isotope tracers and remote sensing in Old Crow Flats, Yukon (Canada), Global Change Biology, 20, 1585–1603, https://doi.org/10.1111/gcb.12465, 2014. a, b, c, d, e, f, g
Walvoord, M. A. and Kurylyk, B. L.: Hydrologic Impacts of Thawing Permafrost—A Review, Vadose Zone J., 15, 2–20, https://doi.org/10.2136/vzj2016.01.0010, 2016. a, b
Wan, C., Gibson, J. J., and Peters, D. L.: Isotopic constraints on water balance of tundra lakes and watersheds affected by permafrost degradation, Mackenzie Delta region, Northwest Territories, Canada, Sci. Total Environ., 731, 139176, https://doi.org/10.1016/j.scitotenv.2020.139176, 2020. a, b
Webb, E. E. and Liljedahl, A. K.: Diminishing lake area across the northern permafrost zone, Nat. Geosci., 16, 202–209, 2023. a
Wilcox, E. J., Wolfe, B. B., and Marsh, P.: Assessing the influence of lake and watershed attributes on snowmelt bypass at thermokarst lakes, Hydrol. Earth Syst. Sci., 26, 6185–6205, https://doi.org/10.5194/hess-26-6185-2022, 2022a. a, b, c, d, e
Wilcox, E. J., Wolfe, B., and Marsh, P.: Isotope data and associated attributes for 25 thermokarst lakes along the Inuvik – Tuktoyaktuk Highway, 2018, Version V1, Borealis [data set], https://doi.org/10.5683/SP3/AZE4ER, 2022b. a
Wolfe, B. B., Light, E. M., Macrae, M. L., Hall, R. I., Eichel, K., Jasechko, S., White, J., Fishback, L., and Edwards, T. W.: Divergent hydrological responses to 20th century climate change in shallow tundra ponds, western Hudson Bay Lowlands, Geophys. Res. Lett., 38, 1–6, https://doi.org/10.1029/2011GL049766, 2011. a, b
Woo, M.-k.: Permafrost Hydrology, Springer Berlin Heidelberg, Berlin, Heidelberg, https://doi.org/10.1007/978-3-642-23462-0, 2012. a
Yi, Y., Brock, B. E., Falcone, M. D., Wolfe, B. B., and Edwards, T. W. D.: A coupled isotope tracer method to characterize input water to lakes, J. Hydrol., 350, 1–13, https://doi.org/10.1016/j.jhydrol.2007.11.008, 2008. a, b, c, d, e, f
Yin, P. and Fan, X.: Estimating R2 Shrinkage in Multiple Regression: A Comparison of Different Analytical Methods, J. Exp. Educ., 69, 203–224, https://doi.org/10.1080/00220970109600656, 2001. a