the Creative Commons Attribution 4.0 License.
the Creative Commons Attribution 4.0 License.
 | 10 Jan 2023
SMPD: a soil moisture-based precipitation downscaling method for high-resolution daily satellite precipitation estimation
Kunlong He
Luca Brocca
Pere Quintana-Seguí
As a key component in the water and energy cycle, estimates of precipitation with high resolution and accuracy is of great significance for hydrological, meteorological, and ecological studies. However, current satellite-based precipitation products have a coarse spatial resolution (from 10 to 50 km) not meeting the needs of several applications (e.g., flash floods and landslides). The implementation of spatial downscaling methods can be a suitable approach to overcome this shortcoming. In this study, we developed a soil moisture-based precipitation downscaling (SMPD) method for spatially downscaling the integrated multisatellite retrievals for global precipitation measurement (IMERG) V06B daily precipitation product over a complex topographic and climatic area in southwestern Europe (Iberian Peninsula) in the period 2016–2018. By exploiting the soil-water balance equation, high-resolution surface soil moisture (SSM) and normalized difference vegetation index (NDVI) products were used as auxiliary variables. The spatial resolution of the IMERG daily precipitation product was downscaled from 10 to 1 km. An evaluation using 1027 rain gauge stations highlighted the good performance of the downscaled 1 km IMERG product compared to the original 10 km product, with a correlation coefficient of 0.61, root mean square error (RMSE) of 4.83 mm and a relative bias of 5 %. Meanwhile, the 1 km downscaled results can also capture the typical temporal and spatial variation behaviors of precipitation in the study area during dry and wet seasons. Overall, the SMPD method greatly improves the spatial details of the original 10 km IMERG product also with a slight enhancement of accuracy. It shows good potential to be applied for the development of high-quality and high-resolution precipitation products in any region of interest.
- Article
(8329 KB) - Full-text XML
- BibTeX
- EndNote


Precipitation, as a key driving force of the global water cycle under climate change conditions, changes greatly in space and time and is among the key factors affecting the hydrology, water resources and ecosystem of a watershed (Salzmann, 2016; Spötl et al., 2021). Hence, accurate and reliable spatiotemporal precipitation estimates are critical for the assessment and understanding of climate change, hydrology, climatology, and its impacts on the environment, ecosystem, and human society (Xia et al., 2015; Wehbe et al., 2020; Wei et al., 2020; Bezak et al., 2022; Ma et al., 2021; Yang and Huang, 2021).
The most commonly used ground-based method for precipitation measurement relies on rain gauge observations. Although rain gauges can provide accurate observations and capture the temporal variability in precipitation within a certain radius, these measurements are known to be prone to spatial representativeness issues due to the high spatiotemporal heterogeneity of precipitation (Wehbe et al., 2017; Tang et al., 2018). With the development of meteorological satellites, remote sensing has become the main tool for estimating regional to global precipitation because of its wide spatial coverage and continuous observation periods. These series of satellites include the Global Precipitation Climatology Project (GPCP) (Huffman et al., 1997), the Tropical Rainfall Measuring Mission (TRMM), multisatellite precipitation analysis (TMPA) (Huffman et al., 2007), the NOAA Climate Prediction Center (CPC) morphing technique (CMORPH) (Joyce et al., 2004), precipitation estimation from remotely sensed information using artificial neural networks (PERSIANN) (Sorooshian et al., 2000), global satellite mapping of precipitation (GSMaP) (Kubota et al., 2007), and integrated multisatellite retrievals for global precipitation measurement (IMERG) (Hou et al., 2014). Although each product has its strengths in the capture of precipitation spatial patterns, there is a common issue, induced by its coarse spatial resolution (e.g., 0.1–0.5∘), greatly blocking the application of these products in hydrological and meteorological research at the local scale (Lin and Wang, 2011; Prakash et al., 2016; Chen et al., 2018).
To enhance the applications of current coarse-resolution precipitation products, a procedure that involves spatially downscaling these products to fine scales has become an important solution. In recent decades, many downscaling methods have been proposed with the use of different satellite precipitation products. There are two major categories of downscaling methods: statistical downscaling and dynamical downscaling (Maraun et al., 2010; Tang et al., 2016). Statistical downscaling methods are mainly conducted by building the explanatory ability of the precipitation spatial distribution with fine-scale predictors, including topographic, geographic, atmospheric and vegetation variables, with the use of traditional regression methods (Xu et al., 2015; Ma et al., 2019b; Mei et al., 2020), optimal interpolation techniques (Shen et al., 2014; Chao et al., 2018), multidata fusion (Rozante et al., 2020; Ma et al., 2021), spatial data mining algorithm (called cubist) (Ma et al., 2017a, b), geographical ratio analysis (Duan and Bastiaanssen, 2013; Ma et al., 2019a) and machine learning algorithms (He et al., 2016; Baez-Villanueva et al., 2020; Min et al., 2020). Due to their convenience and efficiency, these approaches are dominant in precipitation spatial downscaling research (Abdollahipour et al., 2021). Comparatively, dynamical downscaling refers to the use of regional climate models driven by global climate model output or reanalysis data to generate regional precipitation information (Rockel, 2015), which requires more information on internal mechanisms related to complex physical processes of precipitation, such as atmospheric, oceanic and surface information (Tang et al., 2016). Hence, spatial downscaling is achieved by modeling the conditional distribution of precipitation at a fine scale to characterize the spatial structure of precipitation (Haylock et al., 2006; Munsi et al., 2021).
Among the existing methods, due to the computational efficiency and the consideration of orography and vegetation in precipitation distribution, the statistical downscaling methods have been widely used in recent years. Most of them were conducted with the use of predictors, such as topographic and vegetation factors (Immerzeel et al., 2009; Jia et al., 2011; Jing et al., 2016a; Zeng et al., 2021). However, these predictors do not have physical connections with precipitation but they act as important environmental variables influencing precipitation distribution. Consequently, the lack of the physical background of this type of method may introduce high uncertainty into the downscaled results. Comparatively, surface soil moisture (SSM) presents an obvious and strong physical connection with precipitation via the coupling and feedback processes (Seneviratne et al., 2010). As indicated by Brocca et al. (2014). Because precipitation is the main driver of SSM temporal variability, a sudden increase usually occurs in SSM after a rainfall pulse over a period of time, followed by a smooth recession limb driven by evapotranspiration and drainage. This relationship can be well-reflected by an example of the time series of precipitation and SSM from 20 December 2017 to 15 January 2018 at station BRAGANCA, Portugal (Fig. 1). A rapid increase in SSM occurs after these rainfall events and then the moisture conditions gradually become drier when there is no further rainfall.
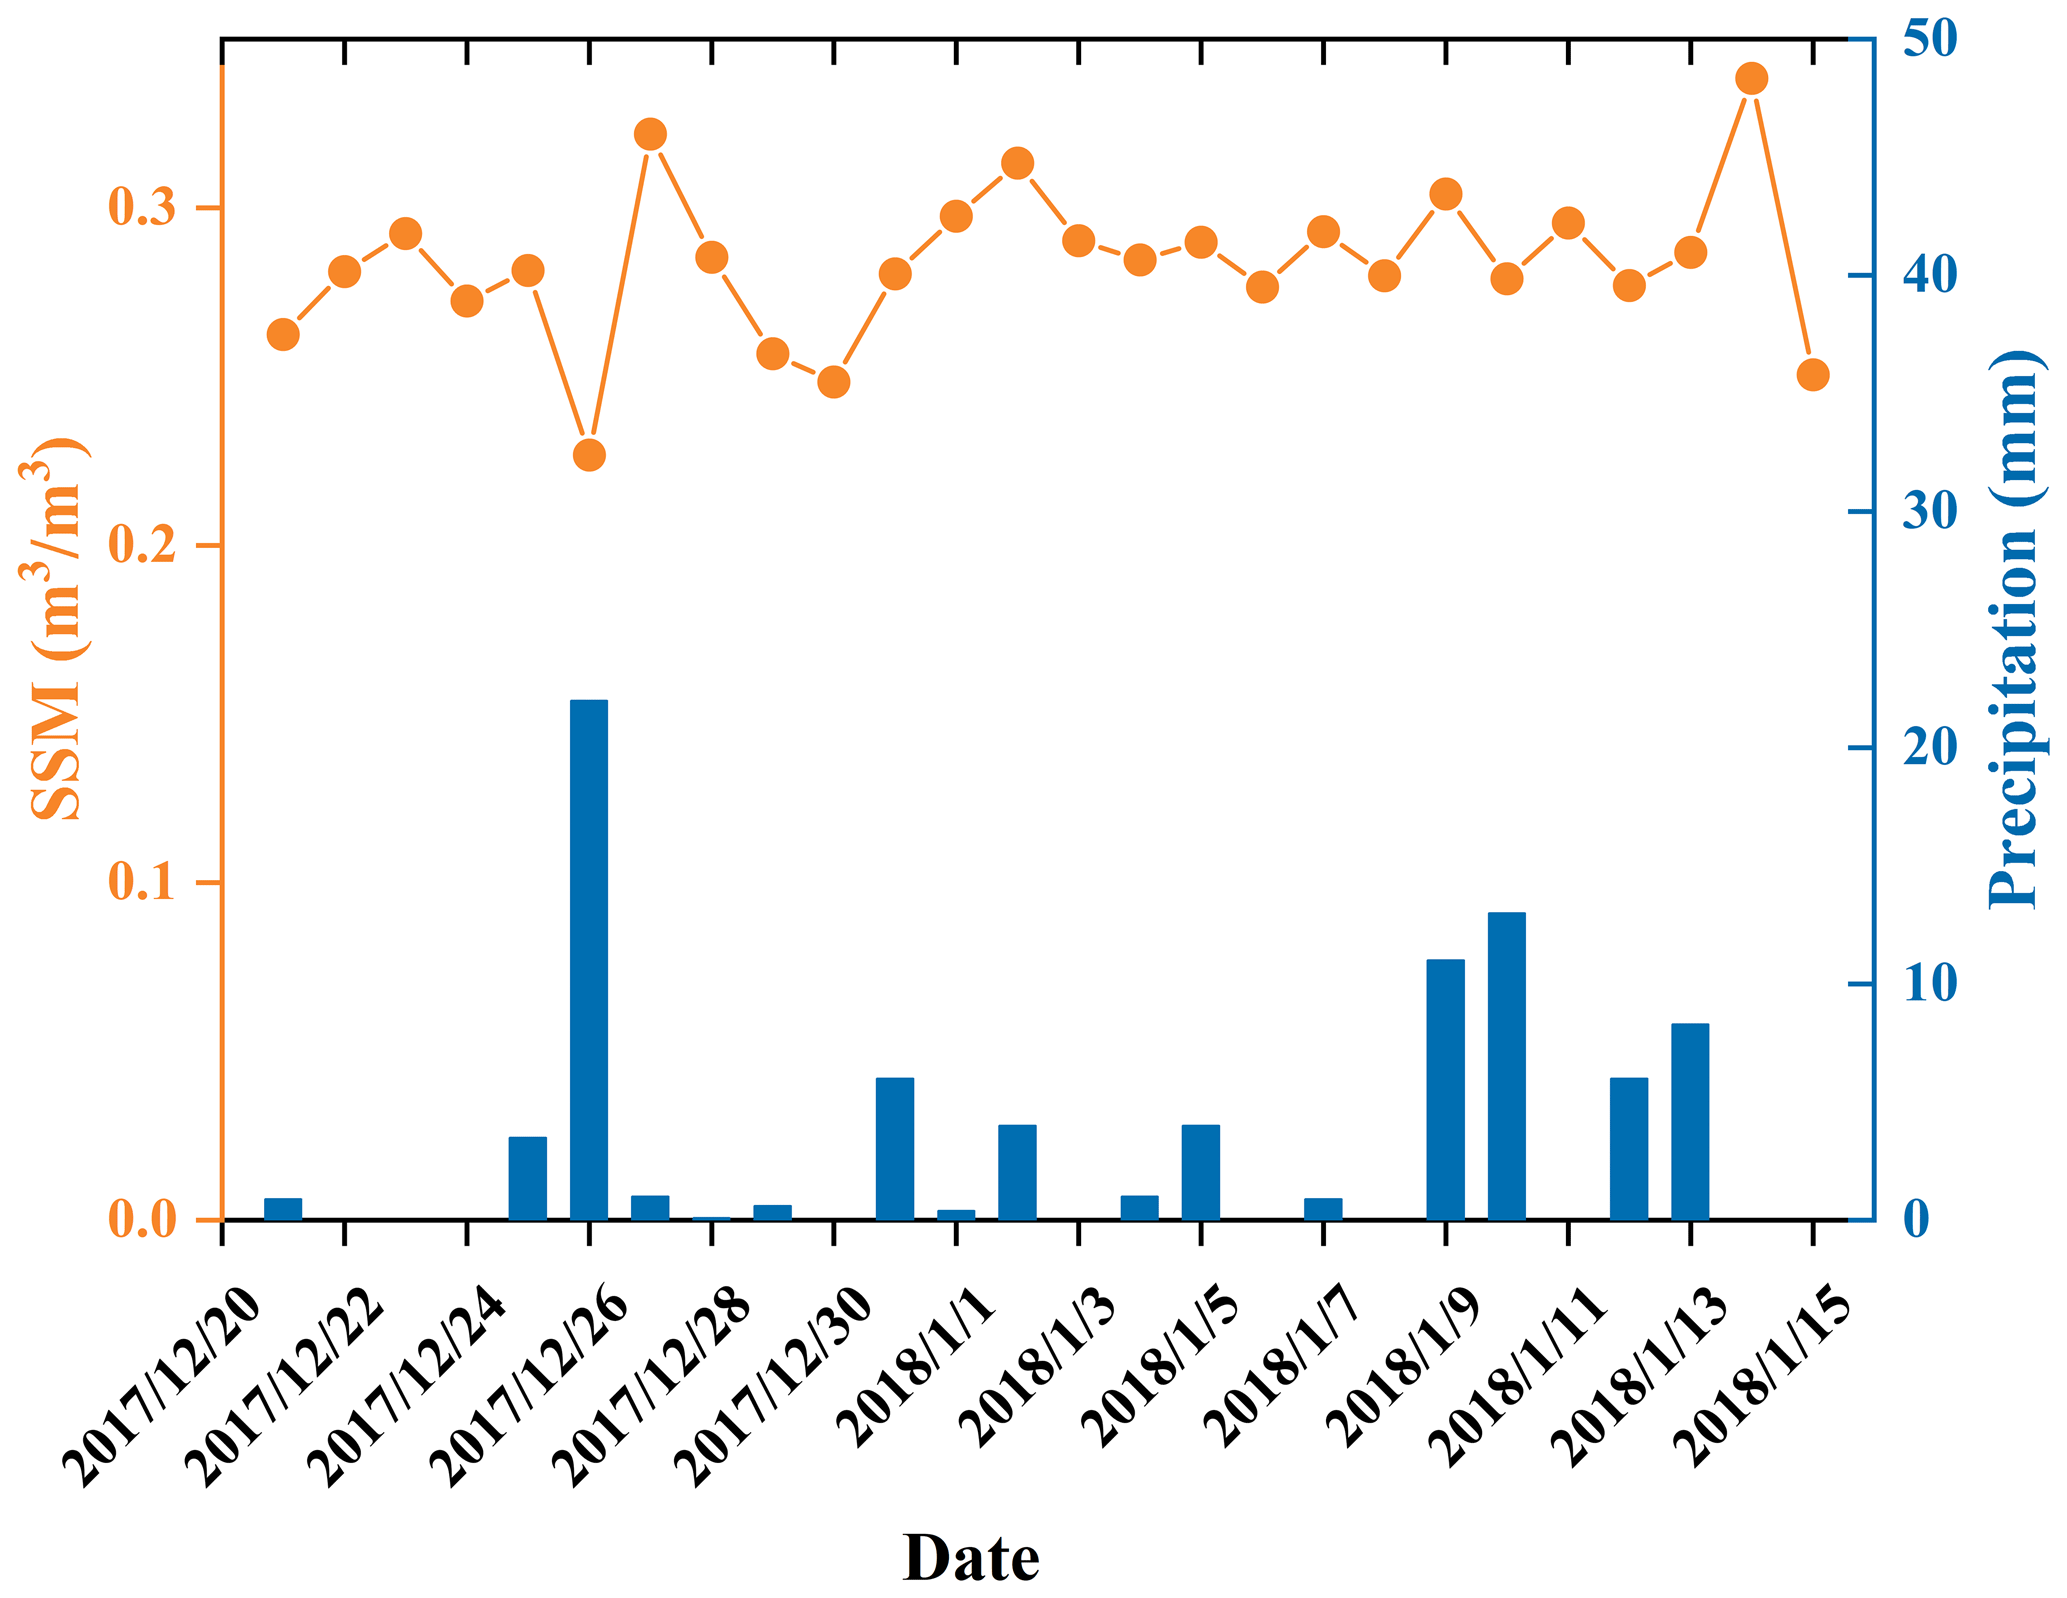
Figure 1Time series of observed precipitation and satellite observed SSM at station BRAGANCA, Portugal from 20 December 2017 to 15 January 2018.
According to this feature, SSM shows a big advantage in estimating precipitation, and this connection was confirmed by the SM2RAIN method proposed by Brocca et al. (2013). Fan et al. (2021) also demonstrated the good performance of the SM2RAIN products over the Tibetan Plateau (TP) where the terrain is complex and the surface cover is heterogeneous. Additionally, the Soil Moisture Analysis Rainfall Tool (SMART) proposed by Chen et al. (2012) also improved the sub-monthly scale accuracy of a multidecadal global daily rainfall product with a lower RMSE (−13 %) and a higher probability of detection (+5 %). Recent applications of this bottom-up approach further demonstrate the success of using SSM in precipitation estimation at coarse-resolution scales (Brocca et al., 2016, 2019; Ciabatta et al., 2017, 2018; Wehbe et al., 2020). Although there is a lag effect of the changes in soil moisture to precipitation, the rainfall-runoff experiment conducted by Song et al. (2020) further confirmed that this effect becomes small with the increase of the temporal aggregation interval and its impact is relatively small at the daily time scale (Brocca et al., 2016). Thus, it should be a very promising solution to improve the accuracy of daily precipitation downscaling by introducing daily SSM into current downscaling schemes. However, the availability of high-resolution SSM data is very limited and most of the current SSM products have a spatial resolution of more than 10 km (Peng et al., 2021), placing significant restrictions on these applications. Furthermore, affected by the indirect physical connection between topographic and vegetation factors and precipitation at a coarse temporal scale, a large amount of downscaling works have been conducted at monthly or annual scales (Abdollahipour et al., 2021). In addition, although daily high-resolution precipitation data have been produced by different methods (Brocca et al., 2019; Hong et al., 2021), the use of high-resolution SSM data to improve the spatial resolution of satellite precipitation products for generating daily-scale high-resolution precipitation data based on physical mechanisms is less studied.
In recent decades there has been substantial progress in soil moisture downscaling studies (Merlin et al., 2008; Piles et al., 2014; Peng et al., 2016; Tagesson et al., 2018; Long et al., 2019; Sabaghy et al., 2020; Wen et al., 2020; Zhao et al., 2021), which makes the availability of high-resolution soil moisture data possible at a daily scale. Thus, the main objective of this study is to establish a soil moisture-based precipitation downscaling (SMPD) scheme as a novel way of obtaining fine-scale precipitation by fragmenting the coarse-pixel rainfall into fine-scale pixels. For this purpose, the 25 km European Space Agency (ESA) Climate Change Initiative (CCI) SSM product is used to derive 1 km SSM data based on the seamless downscaling method proposed by Zhao et al. (2021). Based on the inversion of the soil-water balance equation, a simplified model for estimating precipitation is constructed with the use of the downscaled 1 km seamless soil moisture data and the vegetation index derived from the moderate resolution imaging spectroradiometer (MODIS) observations and then applied to daily GPM precipitation products to obtain the daily downscaled precipitation estimates.
2.1 Study area
The central part of the Iberian Peninsula was selected as the study area (Fig. 2). It is located in southwestern Europe between 37.66–42.99∘ N and 8.30∘ W–1.63∘ E. The region has a distinctly seasonal mild climate, with hot and dry summers inland, cooler summers along the coast, and cold and wet winters. Precipitation presents a double peak pattern, typical from the Mediterranean, with increased precipitation in autumn and spring. The central part of the study area has a temperate continental climate, while the southern part has a Mediterranean climate, with warm and humid winters and hot and dry summers. Generally, the south is dry and warm, while the north is relatively wet and cool. Enhanced by the complex topographic pattern and diverse land cover conditions, this region has a highly heterogeneous spatial environment, which makes this region a satisfactory candidate for precipitation downscaling. In addition, there are many meteorological stations with long-term precipitation measurements in this area, which is an important prerequisite for this study.
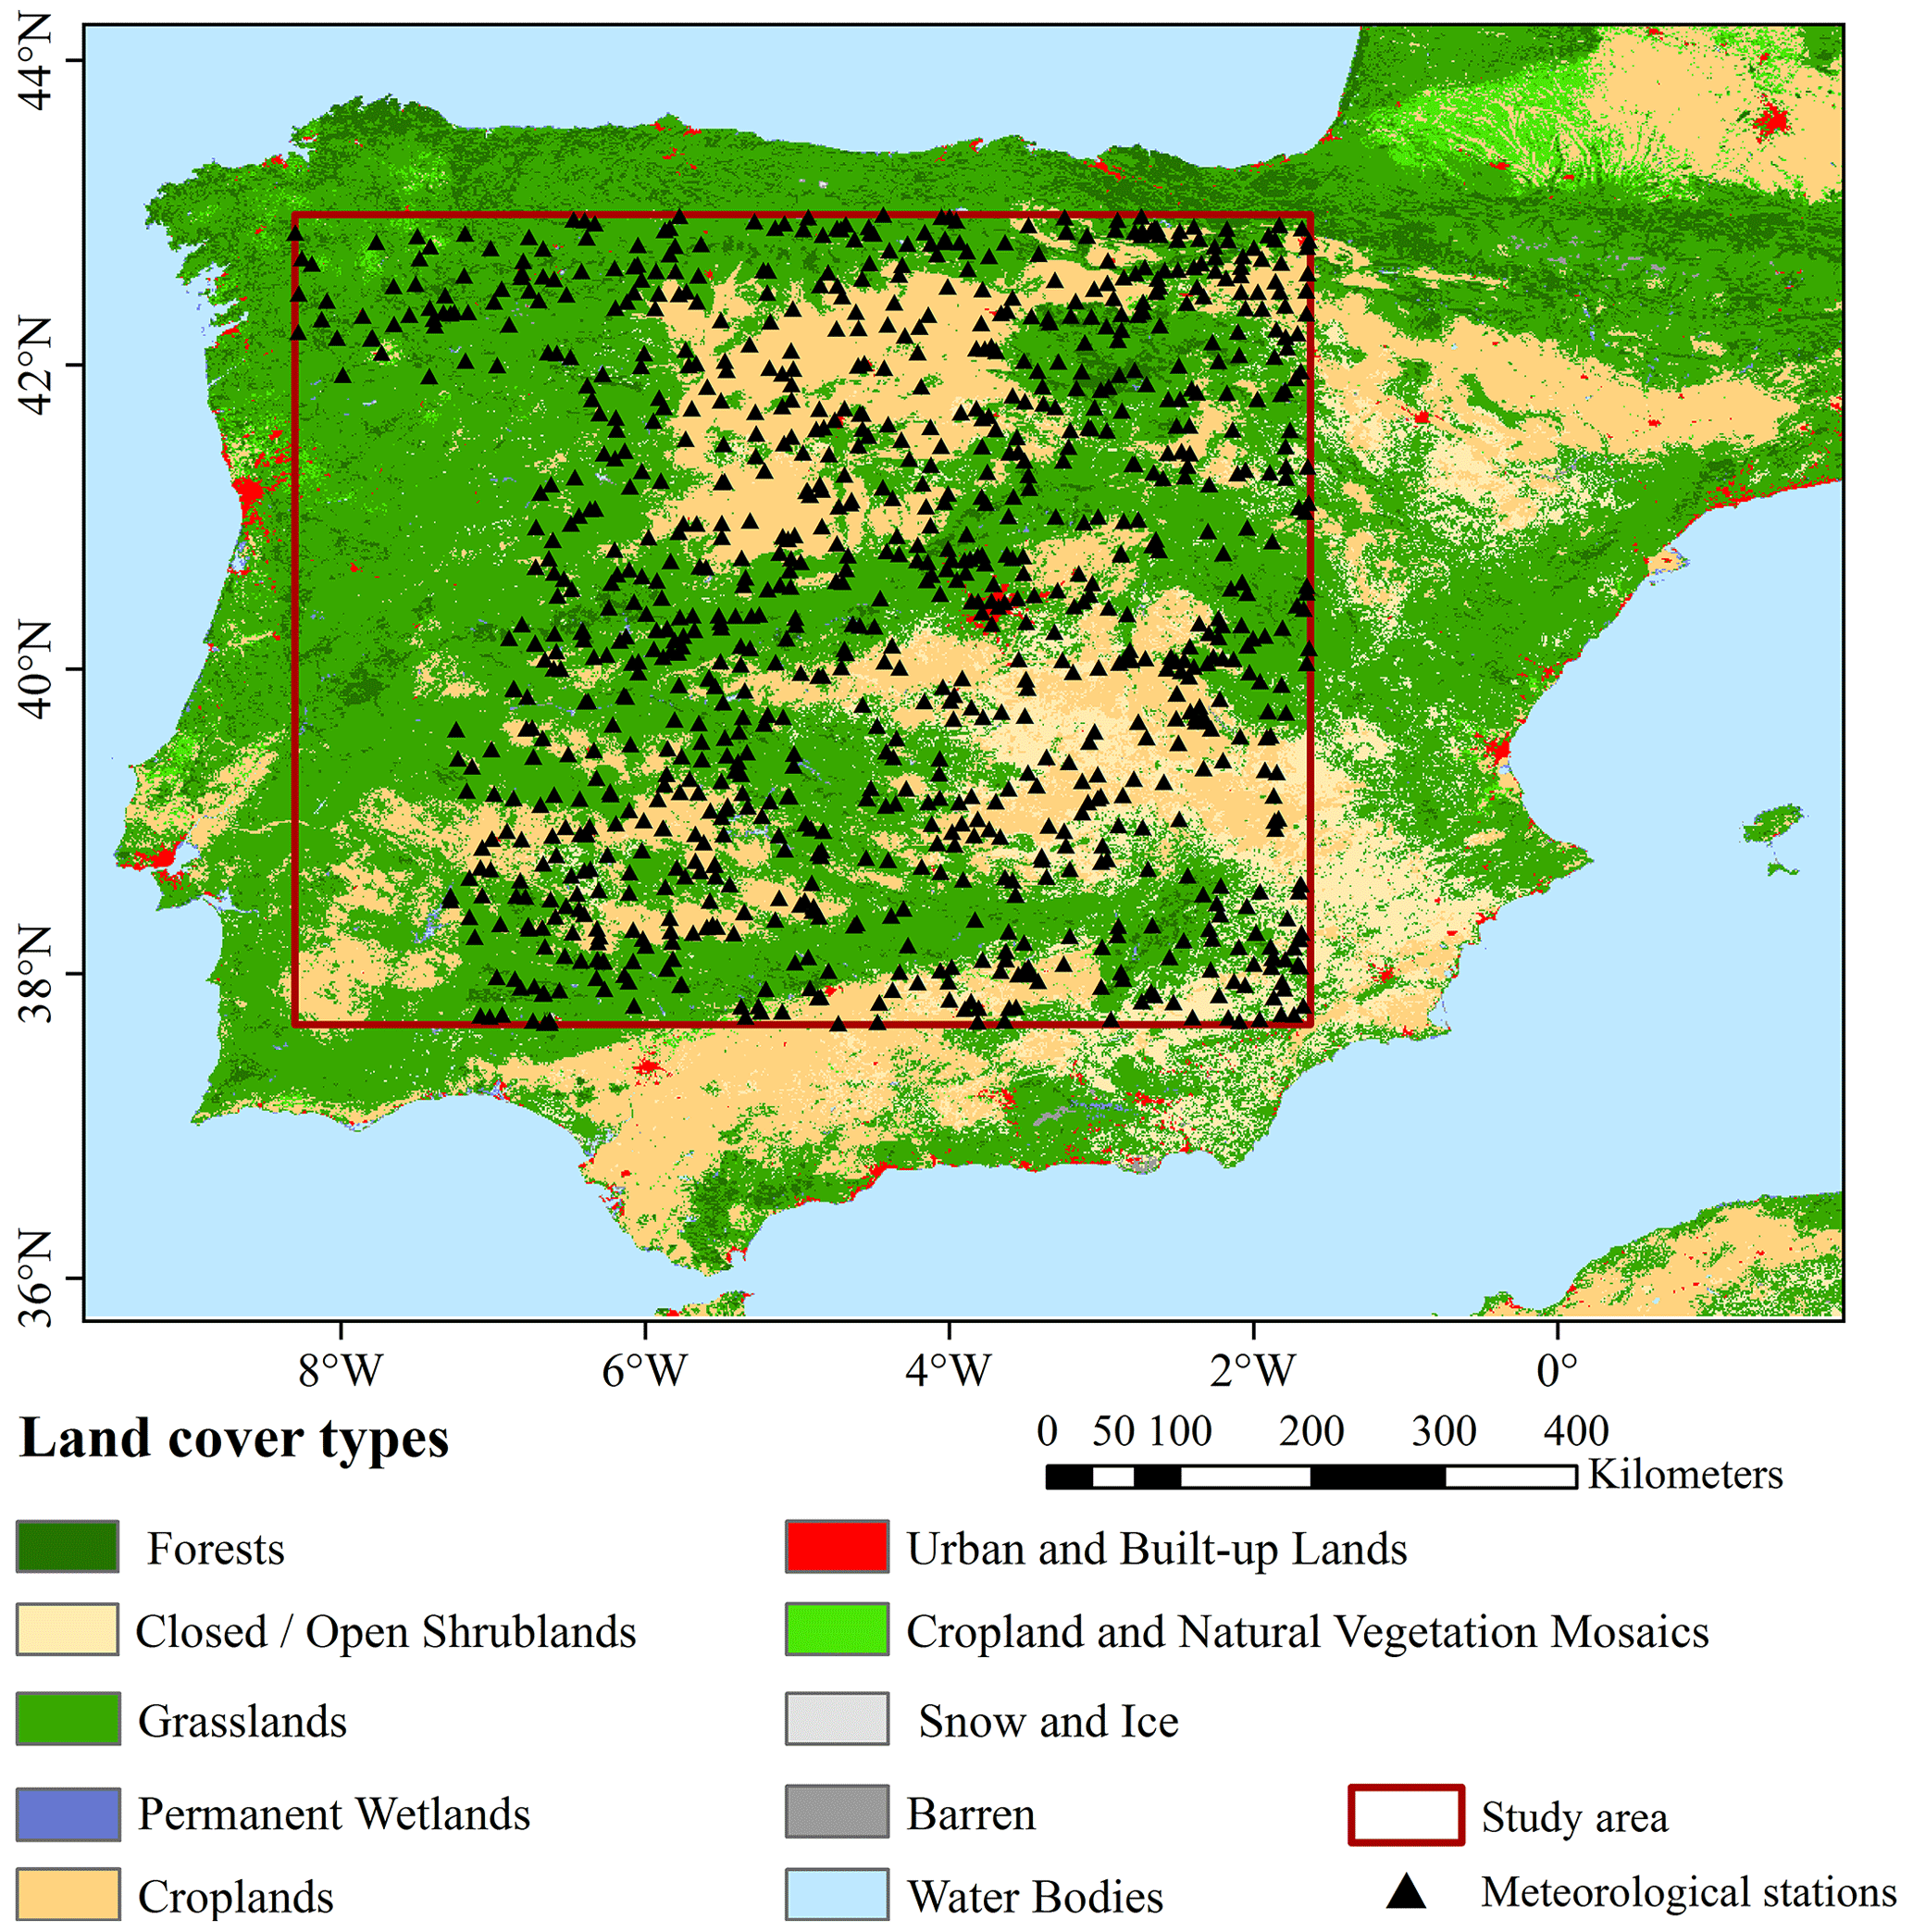
Figure 2Geolocation and land cover map of the study area. The black triangles denote the meteorological stations included in this study.
2.2 Datasets
2.2.1 GPM IMERG satellite precipitation data
As the successor of the successful Tropical Rainfall Measuring Mission (TRMM), the global precipitation measurement (GPM) not only expands the measurement range and temporal and spatial resolution of the TRMM, but also estimates the instantaneous precipitation more accurately, especially light intensity precipitation (i.e., <0.5 mm h−1) and falling snow (Hou et al., 2014; Huffman et al., 2020a). Integrated multisatellite retrievals for GPM (GPM-IMERG) is the level 3 multisatellite precipitation algorithm of the GPM, which combines precipitation information measured from the microwave sensor and infrared sensors onboard GPM constellations and monthly gauge precipitation data, and IMERG employs the 2014 version of the Goddard profiling algorithm (GPROF2014) to compute precipitation estimates from all passive microwave (PMW) sensors onboard GPM satellites, which is a significant improvement compared with TMPA (GPROF2010) (Huffman et al., 2020a, b). Hence, it has attracted much attention in the satellite remote sensing of precipitation.
Currently, the GPM product provides near-real-time products (early and late run) and post-real-time products (final run) from sub-hourly to monthly resolution at a spatial scale. Owing to the infusion of multiple data, such as microwave, infrared, radar, and Global Precipitation Climatology Centre (GPCC) rain gauge data (Hou et al., 2014), the GPM-IMERG final run product provides more accurate estimates over the globe with a relatively long time series (June 2000–present) with a minimum latency of 3.5 months. In this study, the GPM-IMERG final run daily precipitation product (downloaded from https://pmm.nasa.gov/data-access/downloads/gpm, last access: 6 January 2023) was adopted as the downscaling object. A 3-year period from 2016 to 2018 was selected to verify the performance of the downscaling method based on the availability of rain gauge data.
2.2.2 ESA CCI surface soil moisture data
The Soil Moisture CCI project is a part of ESA's Program on the Global Monitoring of Essential Climate Variables (ECV), which was initiated in 2010 and has produced an updated SSM product annually since 1978 (Colliander et al., 2017). The ESA CCI SSM series contains three separate SSM datasets, which are derived from active and passive microwave remote missions as well as a combination of both, and the combined ESA CCI SSM product (version 04.7) provides a spatial resolution of 0.25∘ and a temporal resolution of 1 d on a global scale (http://www.esa-soilmoisture-cci.org/, last access: 6 January 2023).
The combined ESA CCI SSM product provides the amount of water in the surface soil (approximately the top 5 cm), which integrates observations derived from 11 microwave sensors including active sensors such as the advanced scatterometer-A/B (ASCAT-A/B) and the European remote-sensing satellite-1/2 (ERS-1/2), and passive sensors such as the special sensor microwave imager (SSM/I), the scanning multichannel microwave radiometer (SMMR), the TRMM microwave imager (TMI), AMSR-E, WindSAT, AMSR2 and SMOS (Gruber et al., 2019). Previous evaluation studies have demonstrated that ESA CCI SSM generally agrees well with the spatial and temporal patterns estimated by land surface models and in situ observations (McNally et al., 2016; Dorigo et al., 2017). Therefore, this combined product was used in this study for the study period from 1 January 2016 to 31 December 2018, to obtain fine-resolution soil moisture to assist in precipitation downscaling.
2.2.3 Normalized difference vegetation index (NDVI)
The NDVI is an important indicator of vegetation activity (Neinavaz et al., 2020; H. Zhang et al., 2020; Pan et al., 2021), especially for surface evapotranspiration (Joiner et al., 2018; Maselli et al., 2020). Therefore, it also represents a positive correlation with precipitation (Quiroz et al., 2011; Birtwistle et al., 2016). The intuitive correlation between rainfall and plant biomass represented by NDVI would enhance the downscaling study with high-resolution NDVI data. In this study, the NDVI data were obtained from the MODIS/Terra 16 d vegetation index product (https://lpdaac.usgs.gov/products/mod13a2v006/, last access: 6 January 2023). It is a 16 d composite product obtained by choosing the best available pixel value from all the acquisitions over 16 d with the spatial resolution of 1 km.
2.2.4 Rain gauge data
Daily precipitation data collected from 1027 rain gauge stations from 2016 to 2018 with different land cover properties were used as the independent validation of the downscaled results in this study. These data were provided by the Spanish State Meteorological Agency (AEMET). The distribution of the selected stations is mapped in Fig. 2.
3.1 Soil moisture-based precipitation estimation model
The soil water balance equation for a layer depth Z can be described by the following expression:
where s(t) [–] is the relative saturation of the soil or relative SSM, t is the time and p(t), r(t), e(t) and g(t) are the precipitation, runoff, evapotranspiration, and drainage rates, respectively. By rearranging Eq. (1), precipitation can be depicted as a function of SSM, runoff, evapotranspiration, and drainage rates. Based on this rule, Brocca et al. (2013) proposed a bottom-up approach (SM2RAIN) by doing “hydrology backward” to infer precipitation with the use of variations in SSM sensed by microwave satellite sensors. To perform this estimation, the model is simplified in different ways by neglecting different components in Eq. (1) (Brocca et al., 2014; Massari et al., 2014) and the comparison study indicated that the average contribution of surface runoff and evapotranspiration components amounted to less than 4 % of the total rainfall, while the soil moisture variation (63 %) and subsurface drainage (30 %) terms provided a much greater contribution (Brocca et al., 2015). Although the contribution of evapotranspiration is relatively small, the dry Mediterranean climate in most of this region emphasizes its importance. Therefore, the precipitation estimation model was reorganized by only neglecting the runoff component:
In Eq. (2), the drainage rate is approximated by considering the relation in Famiglietti and Wood (1994) to include the contribution of both deep percolation and subsurface runoff (interflow plus baseflow):
where a and b are two parameters expressing the nonlinearity between drainage rate and soil saturation. Regarding the evapotranspiration (ET) component, many methods have been developed to estimate ET in natural ecosystems (Mu et al., 2009; Sheffield et al., 2009; Carpintero et al., 2020). For instance, the daily ET can be derived as a function of the vegetation index (VI) and air temperature (Ta) (Nagler et al., 2005a, b):
where the coefficients (a, b, m, d, p, and f) were determined by conducting regression between ET and the independent variables. Although there is a variable representing air temperature in Eq. (4) to specify the impact of air temperature difference within a wide range, this variable can be assumed to be invariant when considering the pixels to a small extent. Therefore, the term with the second brackets of Eq. (4) is simplified to the coefficient c, and Eq. (4) is further rewritten as follows by introducing NDVI to present the VI variable:
Based on the above approximation, the soil moisture-based precipitation estimation model was finally expressed by the following equation:
where can be calculated as the difference between the SSM estimates on nearby time steps.
3.2 Soil moisture-based precipitation downscaling (SMPD) method
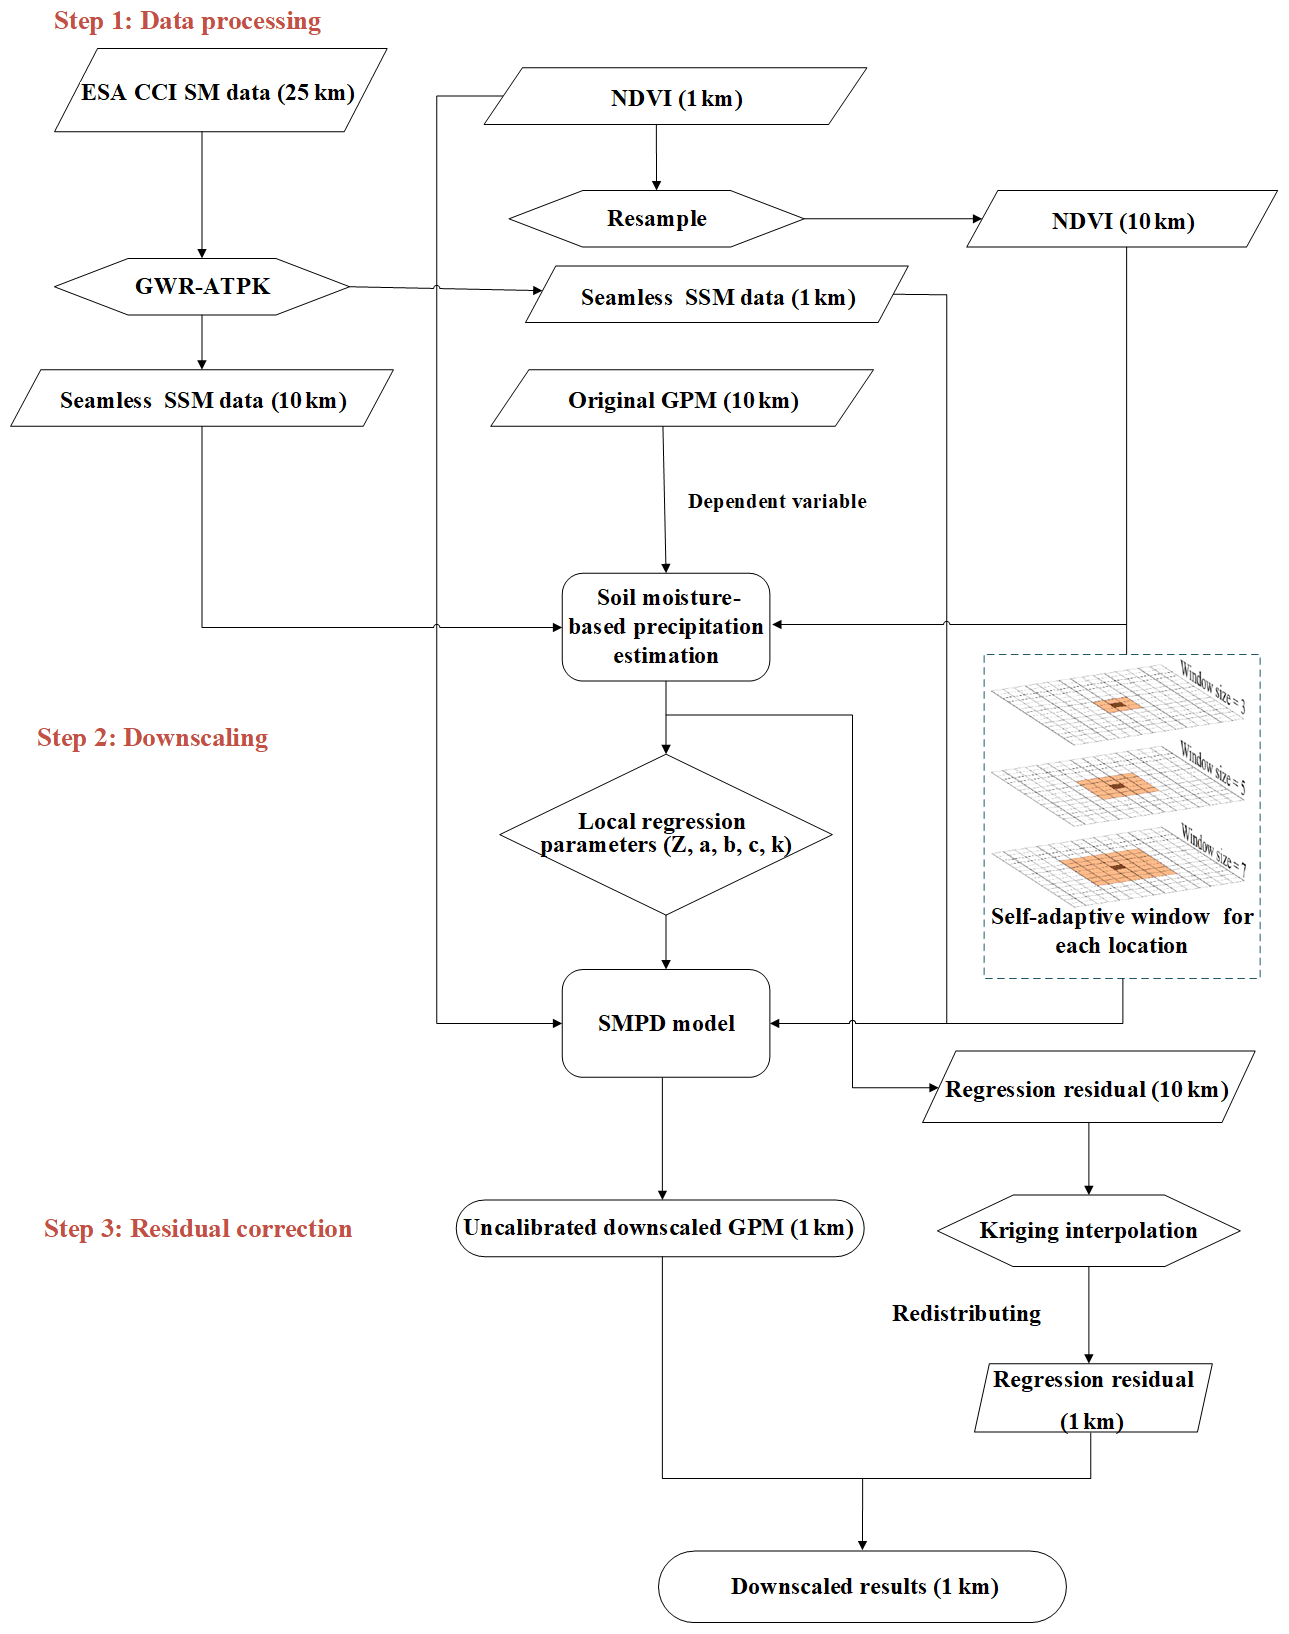
To perform precipitation downscaling, an important prerequisite is an assumption of spatial invariancy in the precipitation estimation model described in Eq. (6) at coarse and fine scales, which is also the basis of many related downscaling studies aiming at other surface parameters, such as soil moisture and temperature (Hutengs and Vohland, 2016; Mishra et al., 2018; Zhao et al., 2018; Ebrahimy and Azadbakht, 2019). Therefore, the estimation model established at the 10 km level is thought to be applicable at the 1 km level. The estimated parameters Z, a, b, c and k at 10 km resolution scale resolution are not scale-independent, which can be used for the corresponding subpixel units (1 km). Moreover, because the downscaled model was constructed by using self-adaptive windows in different local regions on the daily scale, these parameters vary in time and space. Thus, they are also temporally independent. The fitted estimation model at the 10 km scale was applied to the SSM and NDVI data at the 1 km scale to obtain the estimated high-resolution precipitation. Then, to preserve the mean rain rate over each coarse-scale pixel, the bias was corrected by redistributing the residual to each fine-scale pixel based on the kriging interpolation method. Finally, the downscaled daily GPM precipitation products were obtained with the integration of the estimated precipitation and the interpolated residual. According to the above principle, the downscaling method consists of the following parts and the main procedures in the downscaling processes are shown in Fig. 3.
3.2.1 Generation of daily SSM at a fine resolution
As shown in Eq. (6), SSM is an important variable in the estimation model. The ESA CCI SSM product can only provide coarse-resolution SSM data with unexpected gaps. To obtain daily SSM at a 1 km resolution, the seamless SSM downscaling method proposed by Zhao et al. (2021) is a good choice to achieve this goal. In comparison to the REMEDHUS (REd de MEDición de la HUmedad del Suelo) soil moisture network, the downscaled SSM performs better in terms of spatiotemporal coverage and evaluation metrics, which indicated that this method could be successfully used to produce high-resolution SSM data with no spatiotemporal gaps. This downscaling method mainly includes three steps: (1) filling gaps in the 25 km ESA CCI SSM maps with neighborhood information based on a local linear regression method, (2) estimating the 1 km regression SSM and coarse-resolution residual with a geographically weighted regression (GWR) method, and (3) downscaling the coarse-resolution residual to 1 km spatial resolution with the area-to-point kriging (ATPK) method and obtaining the fine-resolution SSM. For details about the downscaling method, please refer to Zhao et al. (2021).
3.2.2 Calibration of the precipitation estimation model with an adaptive window method
Before model calibration, the 1 km downscaled SSM data and the NDVI data were first aggregated into a 10 km scale to spatially match the spatial resolution of the GPM-IMERG product. Then, these data were applied to calibrate the coefficients of the precipitation estimation model. As introduced in Sect. 3.1, the application of this model requires a prerequisite to work at a local extent because of the simplification of the evapotranspiration estimation. Therefore, a local window with a radius from 3 to 7 cells was adopted in the fitting process. Initialized from the size of 3 cells, the optimal window size was adaptively selected when the correlation coefficient (CC) of the fitting result reached the maximum value. This adaptive method was applied to each coarse-resolution pixel with a sliding window, and the model coefficients of this pixel were derived. During the model calibration, coarse pixels with zero precipitation were excluded.
3.2.3 Residual correction and fine-scale precipitation estimation
Based on the calibrated estimation model coefficients in Eq. (7), the precipitation estimates determined with this model can be calculated for each high-resolution pixel within the corresponding coarse pixel:
However, there is a residual between the original precipitation value of each coarse-resolution cell pixel and the mean value of the estimated precipitation of all fine-resolution pixels within this cell. For each coarse-resolution cell, the residual is expressed as follows:
The kriging interpolation method was used here to interpolate residuals R10 km at coarse-resolution cells to obtain kriging residuals fine-resolution scale (Wackernagel, 2003). The high-resolution residual was expressed as a weighted integration of the residuals of the neighboring coarse-resolution cells.
To meet the requirement of value preservation in the downscaling process, the kriging residuals should be corrected by redistributing it to each fine-resolution pixel i, i.e., the ratio of the ith high-resolution residual pixel in the jth coarse-resolution cell to the sum of the precipitation in the jth coarse pixel is used as the weight λij, and the residual R10 km is multiplied by the weight λij to get the residual of each fine resolution pixel i (R1 km,ij). Based on the above process, the kriging residuals were redistributed to each fine resolution to achieve value preservation. This process can be expressed as follows:
where R1 km,ij represents the estimated precipitation of the ith high-resolution residual pixel in the coarse-resolution cell j, R10 km,ij represents the jth coarse-resolution cell residual in the self-adaptive window, n is the number of high-resolution residual pixels in the coarse-resolution cell, and λij is the weight coefficient of the ith high-resolution residual pixel in the jth coarse-resolution cell. is the kriging interpolated residual at the fine-scale pixel i in the jth coarse-resolution cell.
Finally, the high-resolution precipitation was obtained by integrating the fine-resolution estimates via Eq. (8) and the residual term in Eq. (10):
3.3 Validation
To better assess the performance of the proposed downscaling method, the downscaled GPM results were validated by observations from the collected stations in the study area at both daily and monthly scales. The evaluation metrics include the CC, RMSE, and the relative bias (BIAS). They are defined as follows:
where Pi and Si are the precipitation measured by the rain gauge and satellite precipitation, respectively, i is the index of the precipitation series, is the mean value of all rain gauge observations, represents the mean value of the satellite precipitation, and n represents the sample number of precipitation pairs.
Additionally, three metrics reflecting the capability of capturing precipitation events were introduced in the assessment: the probability of detection (POD), the false alarm ratio (FAR) and the critical success index (CSI). The POD refers to the ratio of rain occurrences correctly detected to the total number of observed events and the optimum score is 1. The FAR refers to the proportion of the precipitation events that the satellite falsely detects and the rain gauges do not recognize and the optimum score is 0. The CSI represents the fraction of precipitation events correctly detected by satellites to the total number of observed or detected rainfall events and the optimum score is 1. The definition of a rainfall accumulation event is 1 d rainfall accumulation in excess of a given threshold of 0.1 mm. These three terms are depicted as
where H indicates the precipitation events concurrently detected by rain gauges and satellites, M indicates the precipitation events detected by rain gauges but not detected by satellites, and F indicates the precipitation events detected by satellites but not detected by rain gauges.
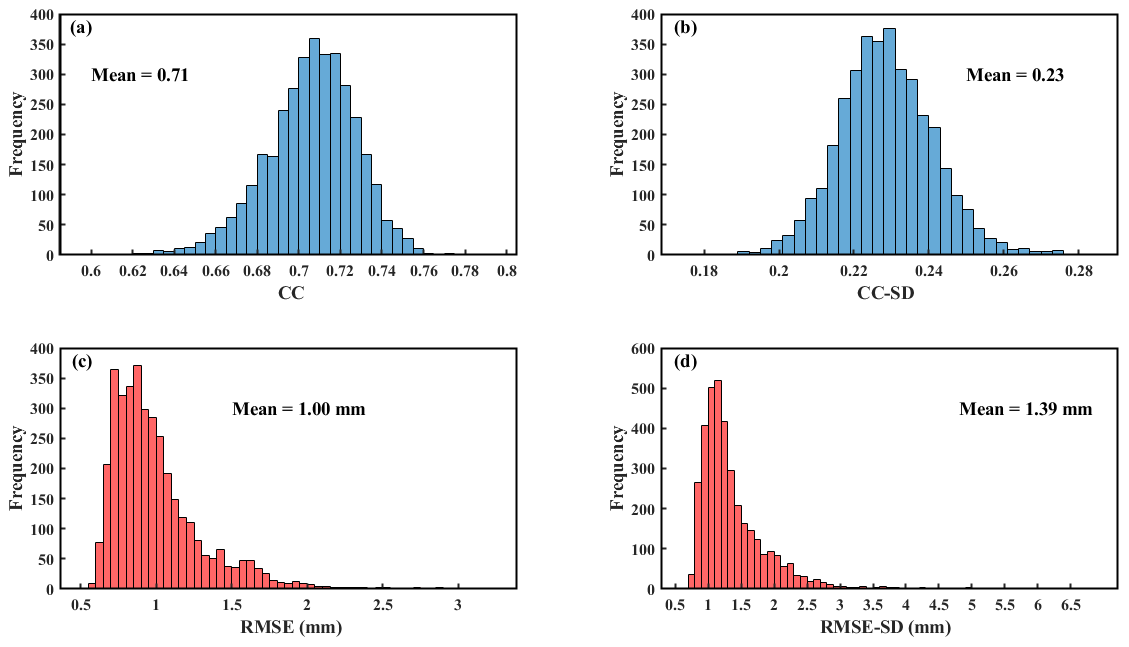
Figure 4(a) Maps of the mean value of the correlation coefficient (CC), (b) mean standard deviation of the CC (CC-SD), (c) mean root mean square error (RMSE), and (d) mean standard deviation of the RMSE (RMSE-SD) between the precipitation estimated with the soil moisture-based estimation model and the original GPM product during the period of 2016–2018. The y-axes represent the pixel number.
4.1 Accuracy of the soil moisture-based precipitation estimation model
Before the downscaling process, the performance of the soil moisture-based precipitation estimation model was evaluated first based on the calibrated estimation model in Eq. (7). Figure 4 shows the maps of the mean value of the daily CCs and RMSEs during the period of 2016–2018 and their standard deviation (SD) by comparing the precipitation estimated with the proposed estimation model and the GPM precipitation product at 10 km scale. Most of the CC values are above 0.70 with an average value of 0.71, and most of the RMSE values are within the range from 0.50 to 1.00 mm, with an average value of 1.00 mm. These results indicate the good consistency and small error between the estimated precipitation and the original precipitation product. Furthermore, in view of the SD maps it represents the variability in CC and RMSE during the period. The CC-SD values are within the range from 0.18 to 0.28 with an average value of 0.23, most of the RMSE-SD values are concentrated in the range of 0.50 to 1.50 mm, and only a few are in the range of more than 3 mm, with an overall mean of 1.39 mm. Combined with the frequency distributions of CC and CC-SD, RMSE, and RMSE-SD, the proposed estimation model can generally capture the precipitation with soil moisture variations and it has relatively stable performance. According to the fitting performance assessment with the original GPM product, the soil moisture-based precipitation estimation model has been confirmed to be able to capture the variation of precipitation with acceptable accuracy.
4.2 Overall performance of the downscaled precipitation
4.2.1 Spatial distribution
To demonstrate the advantages of the downscaling results, 2 separate days (7 July 2017 and 25 November 2017) in the dry season and the wet season were selected to compare the original coarse-resolution precipitation data and the downscaled high-resolution precipitation data (Fig. 5). From the visual inspection the spatial distributions of the downscaled precipitation are highly consistent with those of the original ones in both seasons, especially for the distribution of the precipitation centers (>50 mm d−1). The downscaled results maintained the original precipitation pattern in the GPM product, which is reflected well by the very similar histograms of the original and downscaled precipitation on these 2 days, as shown in Fig. 4c and f. In addition to their consistency, the downscaled results present higher spatial heterogeneity than the coarse-resolution product, which provides much more detailed information on the precipitation distribution within each coarse-resolution cell. More importantly, the downscaled results remove the blocky appearance at the edges of the coarse-scale pixels.
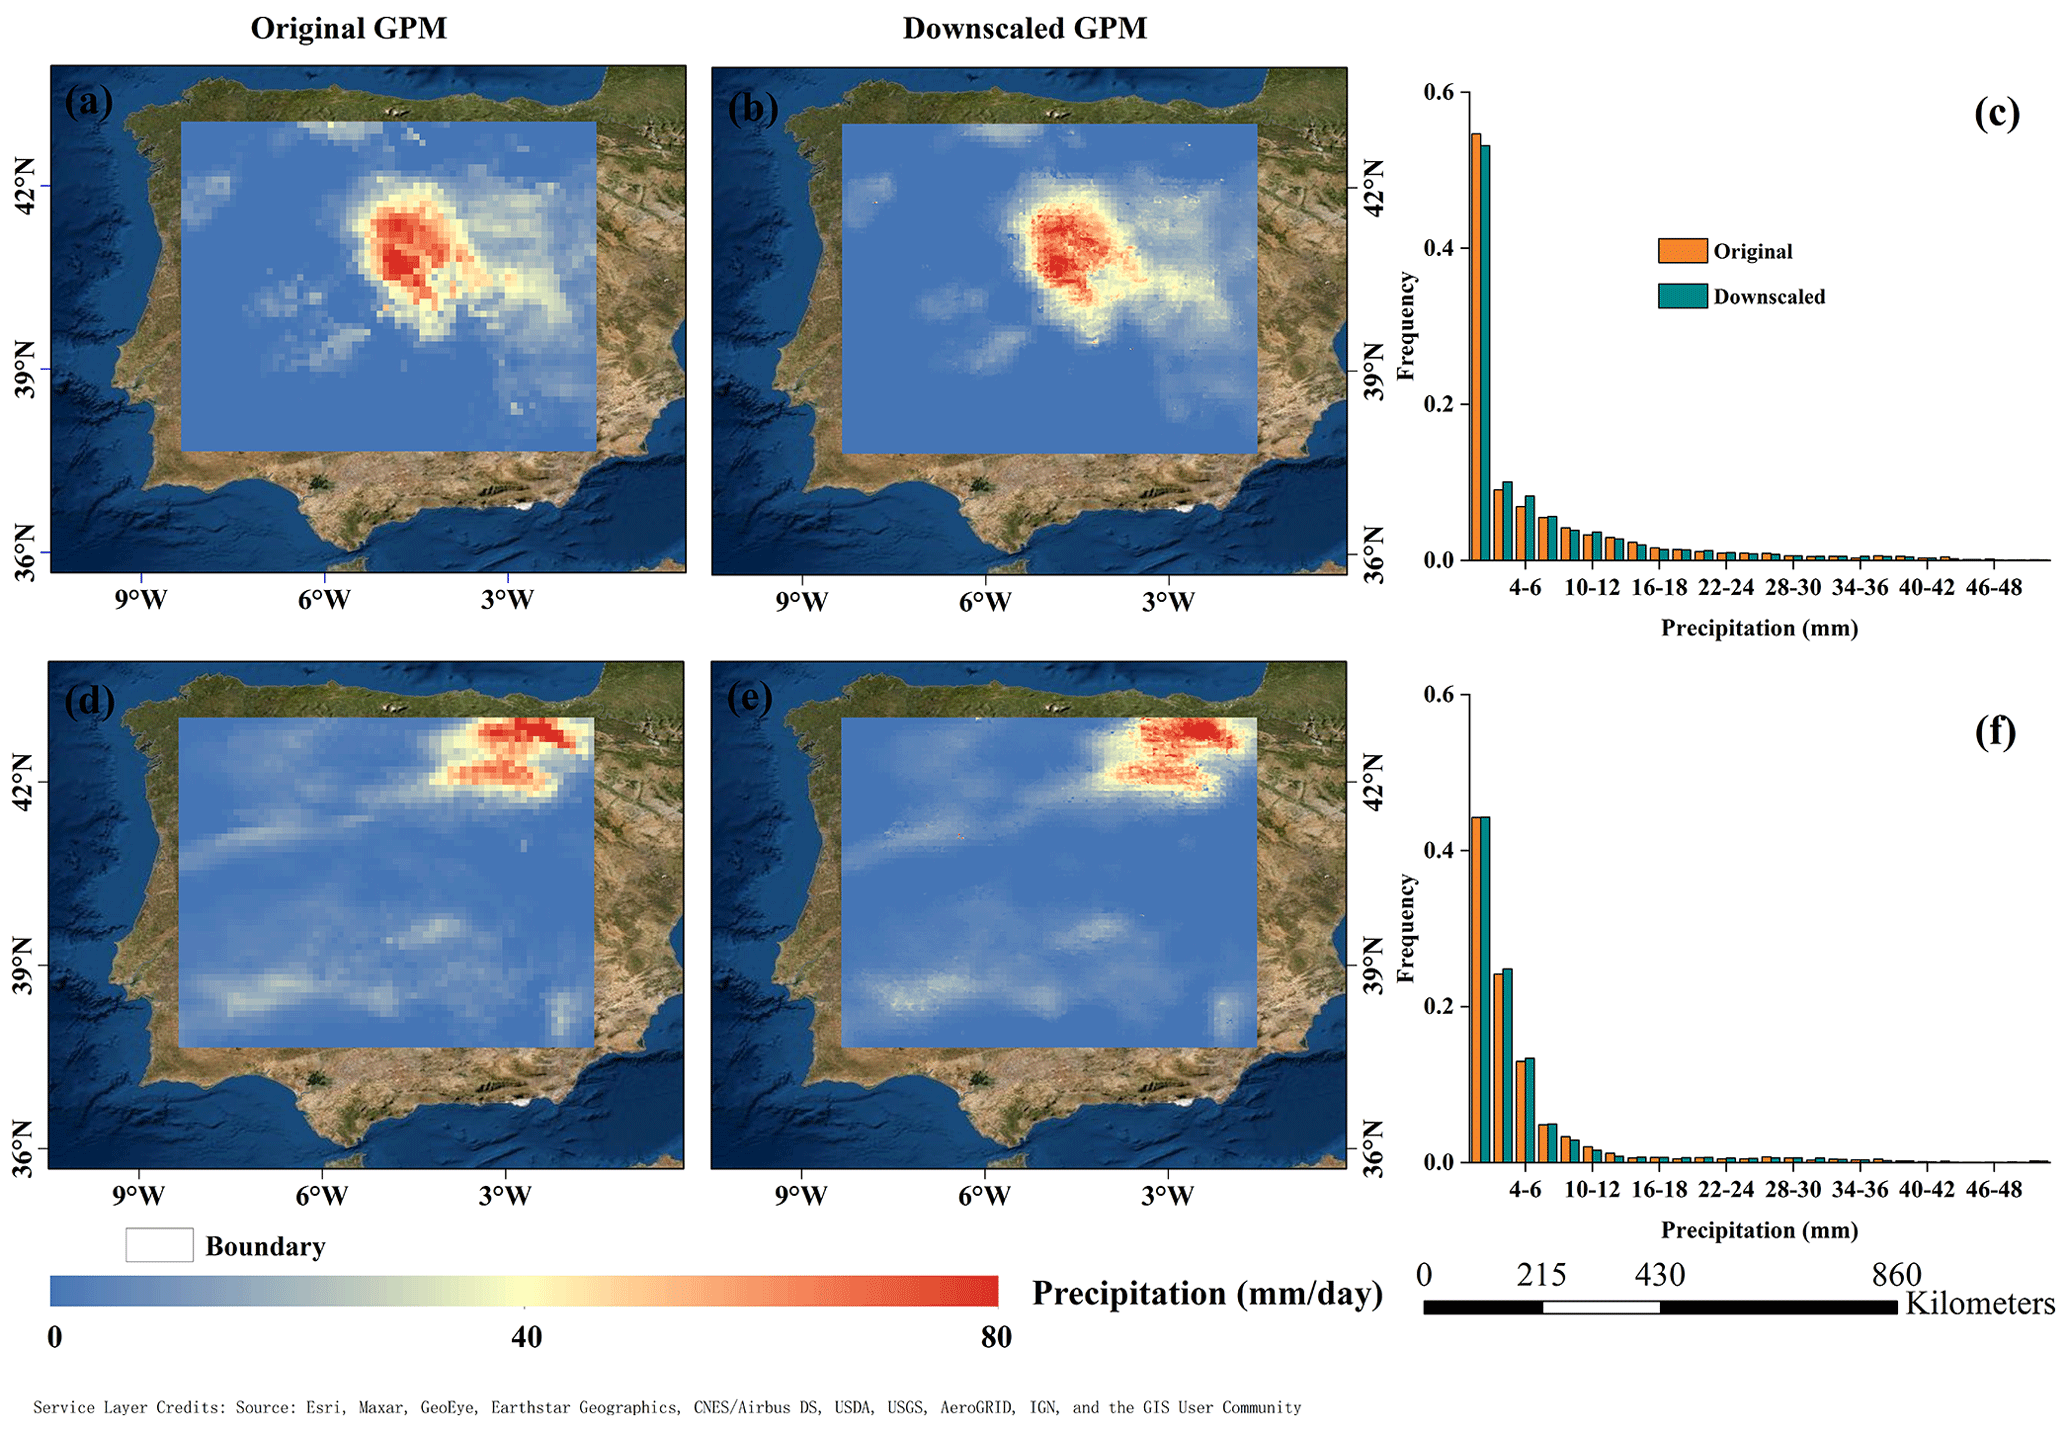
Figure 5Original daily GPM precipitation products, downscaled results, and their frequency histograms on 7 July 2017 (a–c) and 25 November 2017 (d–f).
4.2.2 Temporal variability
In addition to the spatial distribution analysis, the temporal variation in the downscaled precipitation was further evaluated by introducing the downscaled results from 8 to 11 December 2017. Figure 6 shows the daily maps of the original precipitation and downscaled precipitation. For the spatial distribution, both the original GPM precipitation product and the downscaled result have almost the same patterns on different days. Not only heavy rainfall but also light rainfall and no rain can also be captured by the proposed downscaling method in most circumstances. Moreover, the temporal variability in the daily precipitation was also preserved after the downscaling, and some outliers in the coarse-resolution GPM product were effectively filled with valid values, as shown by the downscaling results on 11 December in Fig. 6.
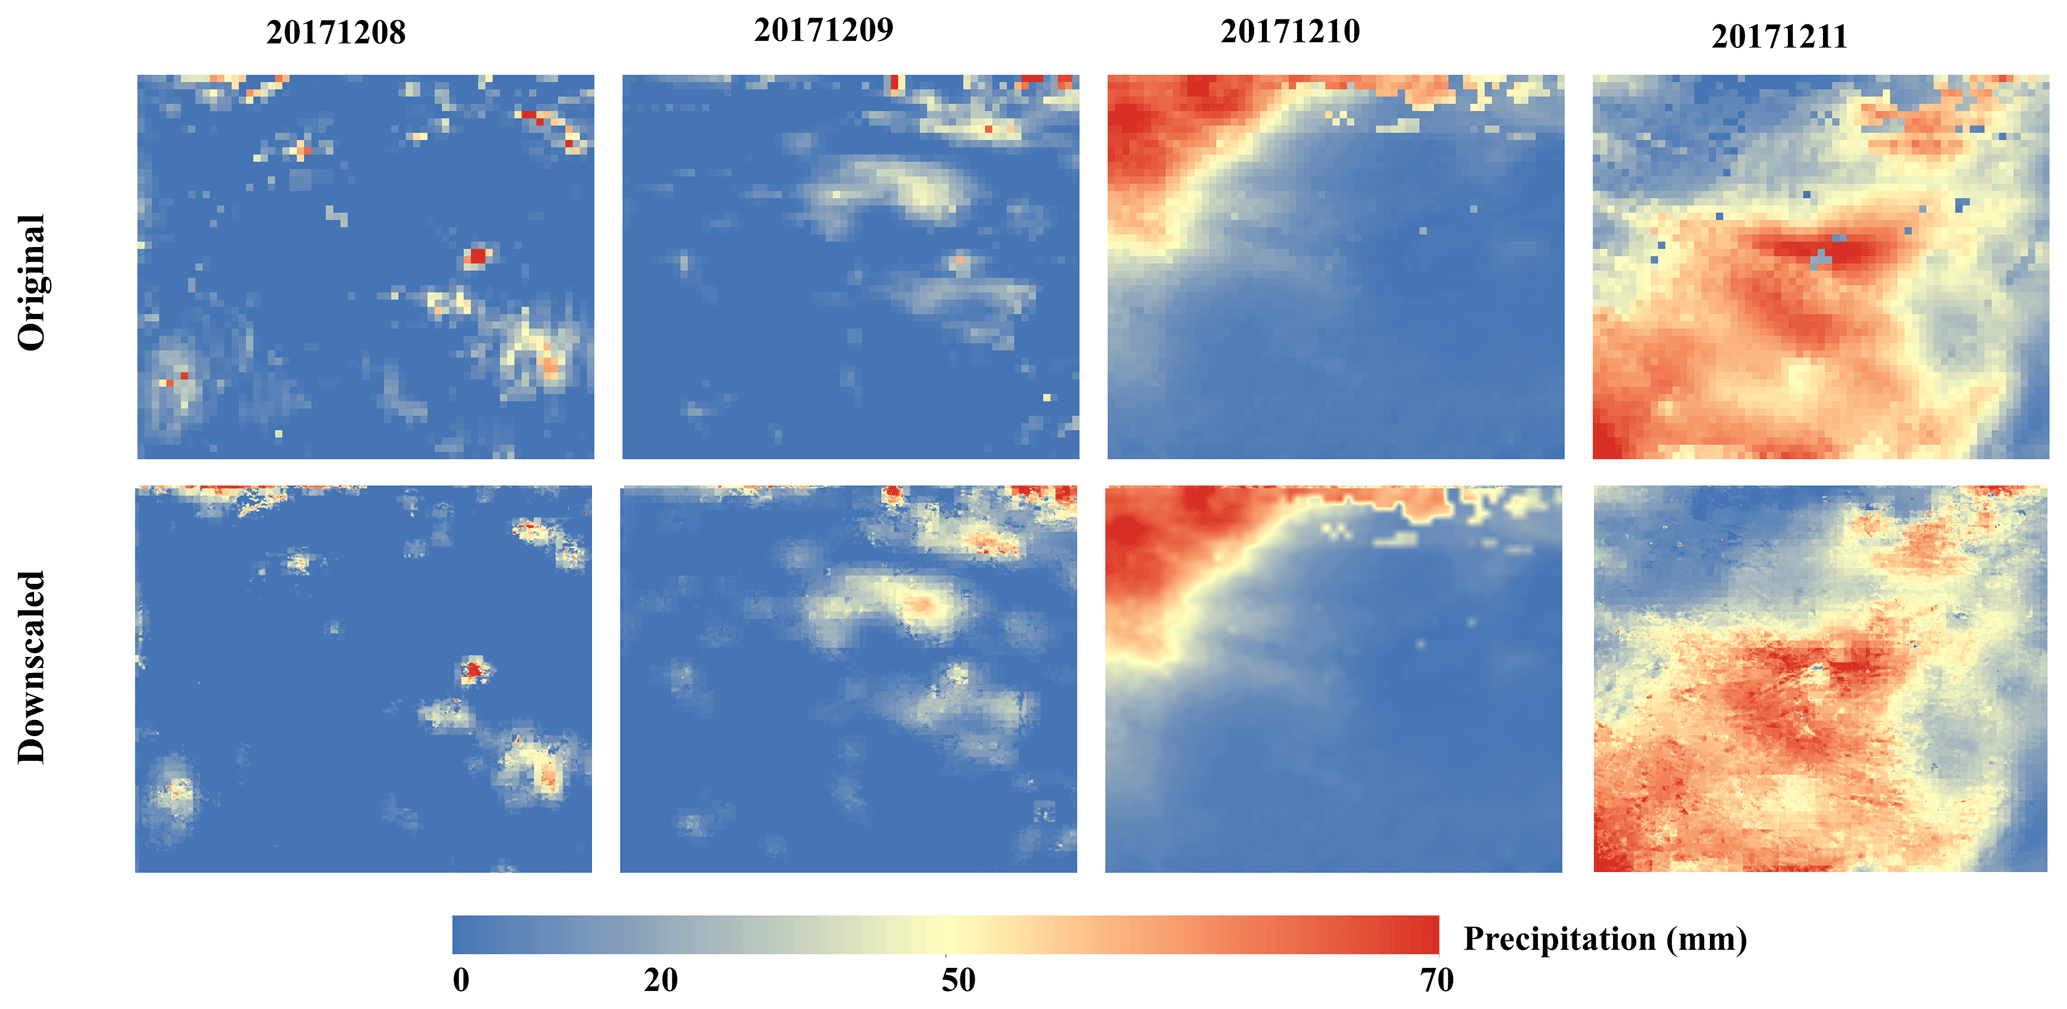
Figure 6Original daily GPM precipitation product and corresponding downscaled results from 8 to 11 December 2017.

Figure 7Scatterplots of the original GPM precipitation product (a) and the downscaled results (b) plotted against daily precipitation recorded by available meteorological stations over the study period. The red dotted line represents the 1:1 line and the blue solid line represents the fitting line.
4.3 Validation with rain gauge measurements
4.3.1 Validation on a daily scale
To quantitatively evaluate the performances of the downscaling results, the daily original scale GPM precipitation data and the downscaled results were compared separately with the precipitation measurements from all 1027 meteorological stations in the period of 2016–2018. The three metrics (POD, FAR, and CSI) for rainfall events, CC, RMSE and BIAS for precipitation volumes, were used to make a comparison between the performances of both datasets. As shown by the density plots in Fig. 7a, there is relatively high uncertainty in the original GPM precipitation product compared with the in situ observation with a CC of 0.60, an RMSE of 4.99 mm and a BIAS of 9 %, which shows that the GPM product generally overestimated observed precipitation on a daily scale. These differences may be attributed to the differences in the spatial representativeness of both observations (one for the average value over a grid cell and one for a single point). Because of the value preservation during the downscaling process, the downscaled results also have a validation effect similar to that of the original GPM precipitation product (Fig. 7b). However, compared with the original GPM product the downscaled results show an overall improvement in terms of CC, RMSE, and BIAS. There is a slight increase in CC, with its value increasing from 0.60 to 0.61. In contrast, both the RMSE and BIAS have a moderate reduction, with decreases of 0.16 mm and 4 %, respectively. For rainfall event assessment the downscaled results remarkably enhanced the ability to identify rainfall events at every station when compared with the original GPM product. Both the POD, FAR and CSI were moderately enhanced relative to those of the original GPM data, with an increase in POD from 0.84 to 0.88, a decrease in FAR from 0.52 to 0.47 and an increase in CSI from 0.44 to 0.48. The comparison showed that the downscaled results could detect precipitation occurrence better than the original GPM product. The increase in spatial heterogeneity in the downscaled results assists detection of rainfall events.
Table 1Validation of the downscaled precipitation data and original GPM precipitation data with the daily precipitation measured from all 1027 stations in each month from 2016 to 2018. The values represent the average values of the validation metrics.
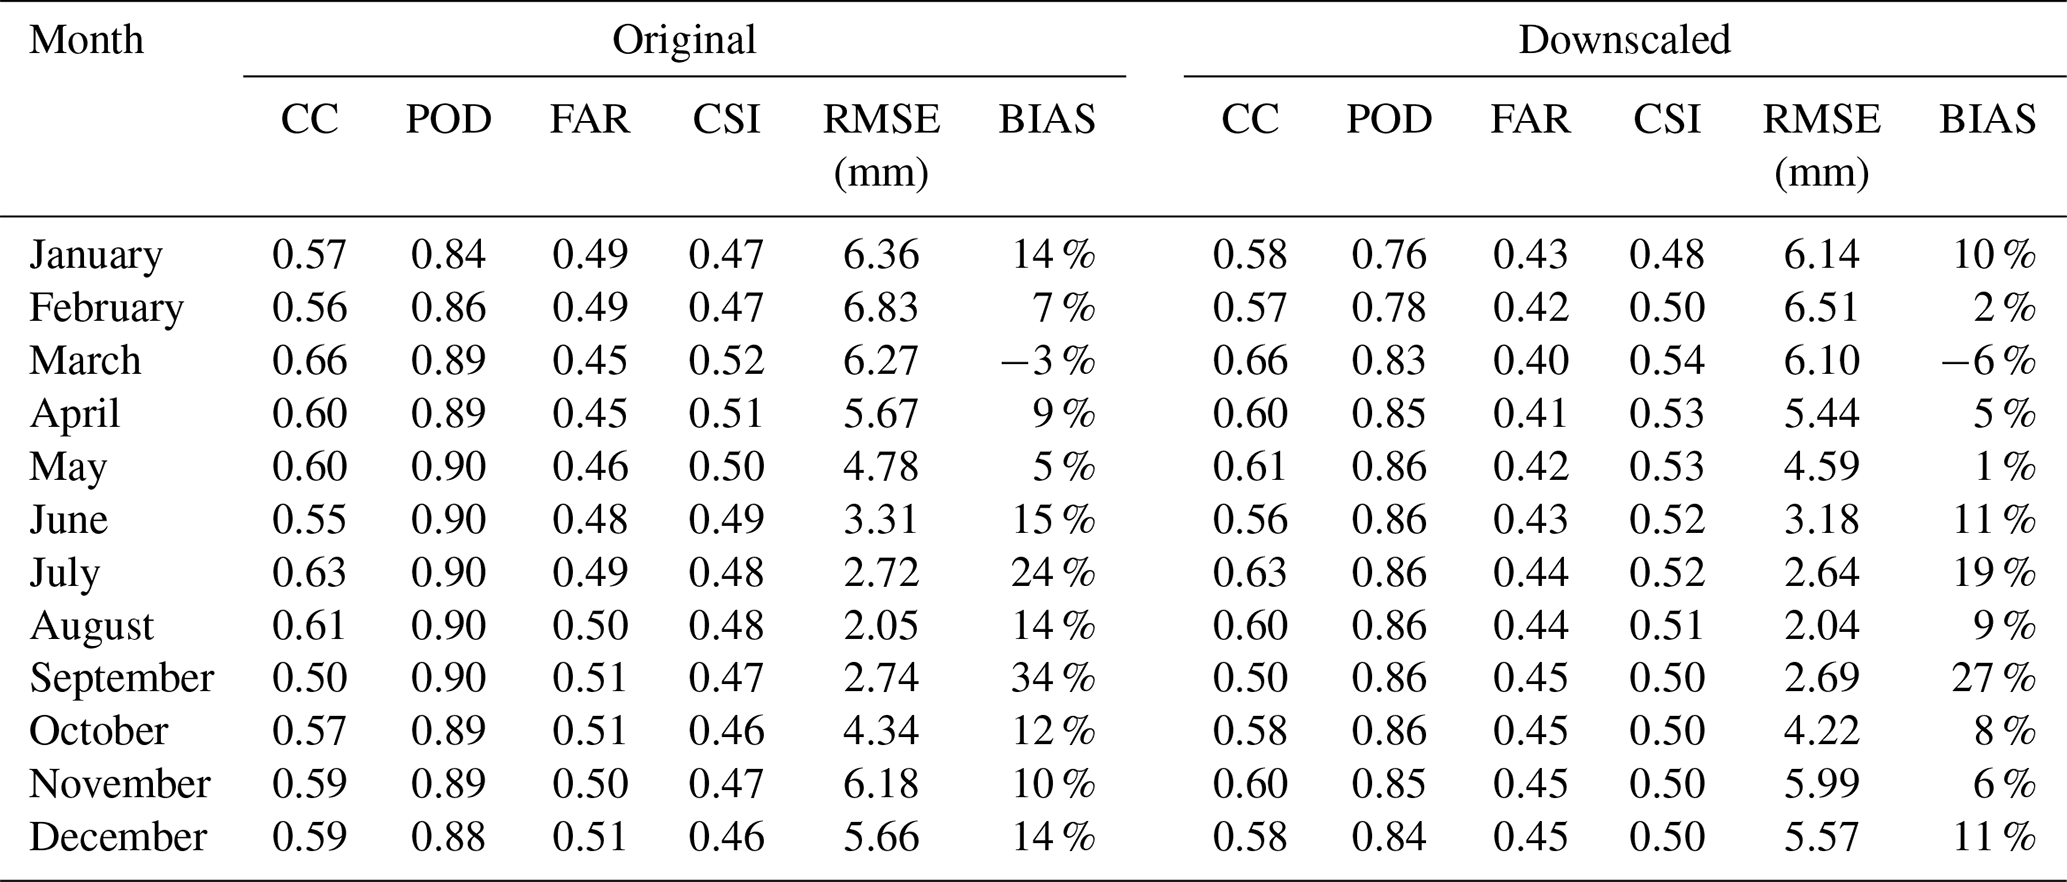
In addition to the validation during the period 2016–2018, further investigation was performed for the downscaled results of individual months. Table 1 lists the evaluation metrics of the downscaled and original precipitation against rain gauge observations at 1027 stations from 2016 to 2018. In general, the downscaled results show similar accuracy performance among different months to the detection accuracy of precipitation events reflected by FAR and CSI. It is worth noting that the POD decreased compared to the original precipitation product, which may be because compared with the coarse pixel precipitation on the daily scale, the downscaled products of the sub-pixels at the same station do not necessarily have precipitation, resulting in fewer precipitation events detected by the downscaled products. From the RMSE values, seasonal differences can be detected. The dry season months from June to September have relatively smaller RMSE values than other months. This is not because of the better performance of the proposed method in these months but the inherent small precipitation of these months results in the low values for RMSE. This feature can also be detected from the evaluation of the original data. Regarding the downscaled results performance, the downscaled data have better accuracy in detecting precipitation events according to the improvement in FAR and CSI in each month. Comparatively, the correlation feature of the downscaled results shows smaller improvements than the original data, represented by the CC values every month. There were decreasing trends in terms of all RMSE values and the improvements in the wet seasons from October to May are relatively larger than in the dry season months. For the BIAS values, the improvements are also very clear with the increase from 3 % to 7 %. The monthly comparison further indicated the improvement of the downscaled results, which not only maintain the temporal correlation characteristics of the original data with the gauge-based observations but also improve the absolute accuracy according to the refinement of CC, POD, CSI, FAR, RMSE, and BIAS via introducing more detailed information in the downscaling scheme.
4.3.2 Spatial distribution of the daily validation with in situ measurements
In addition to the general evaluation with the measurements from all stations, the downscaled results are separately validated by the observations from each station, and the results are illustrated in Fig. 8. In general, the downscaled precipitation estimates produce less error than the original GPM precipitation products with respect to the overall error statistics from 2016 to 2018, with an increase of CC values from 0.62 to 0.63, a decrease of RMSE values from 4.80 to 4.63 mm, a decrease of BIAS values from 17 % to 13 %, a decrease of FAR values from 0.50 to 0.45, an increase of POD values from 0.83 to 0.87 and an increase of CSI values from 0.47 to 0.50, which show moderate improvement compared to that of the original GPM products. Moreover, from the frequency histogram of the validation indicators at 1027 stations, the downscaled results present a better correlation with rain gauge observations with most of the CC values being above 0.71 in the central and northwestern regions. Regarding RMSE values of the downscaled results the validation at 728 shows a lower RMSE than the original product. This improvement can be reflected by the skew of the histogram to the low value region as shown in Fig. 8f. These stations are mainly located in the central and southeastern regions. In comparison, the validation with high RMSE mostly occurred in the northwest regions due to the originally greater annual mean precipitation. For BIAS, there is a relatively wide range from −72 % to 99 % in the whole region, systematic overestimation was observed at 685 stations, and underestimation was also observed at 342 stations. After downscaling, the overestimation was reduced. About the rainfall event assessment, most of the CSI values are higher than 0.48 at these stations and the FAR values are generally lower than 0.46, the POD values are generally higher than 0.81, as shown in Fig. 8j–r. It can also be seen that the detection accuracy of precipitation events in the humid northern region is better than that in the southern region with less precipitation. These results indicate that the fitting relationship between observed precipitation and downscaled GPM products is good in the northwest region, while the errors in precipitation volumes are also large in this region due to rich precipitation, which is consistent with the performance of the original GPM precipitation product, while the accuracy was slightly better than that of the original precipitation product in the central and southeast regions. This proves that the improvement in rainfall events introduced by the downscaling method is not limited to specific locations and covers the whole area and the downscaled results are more accurate in describing spatial precipitation details.
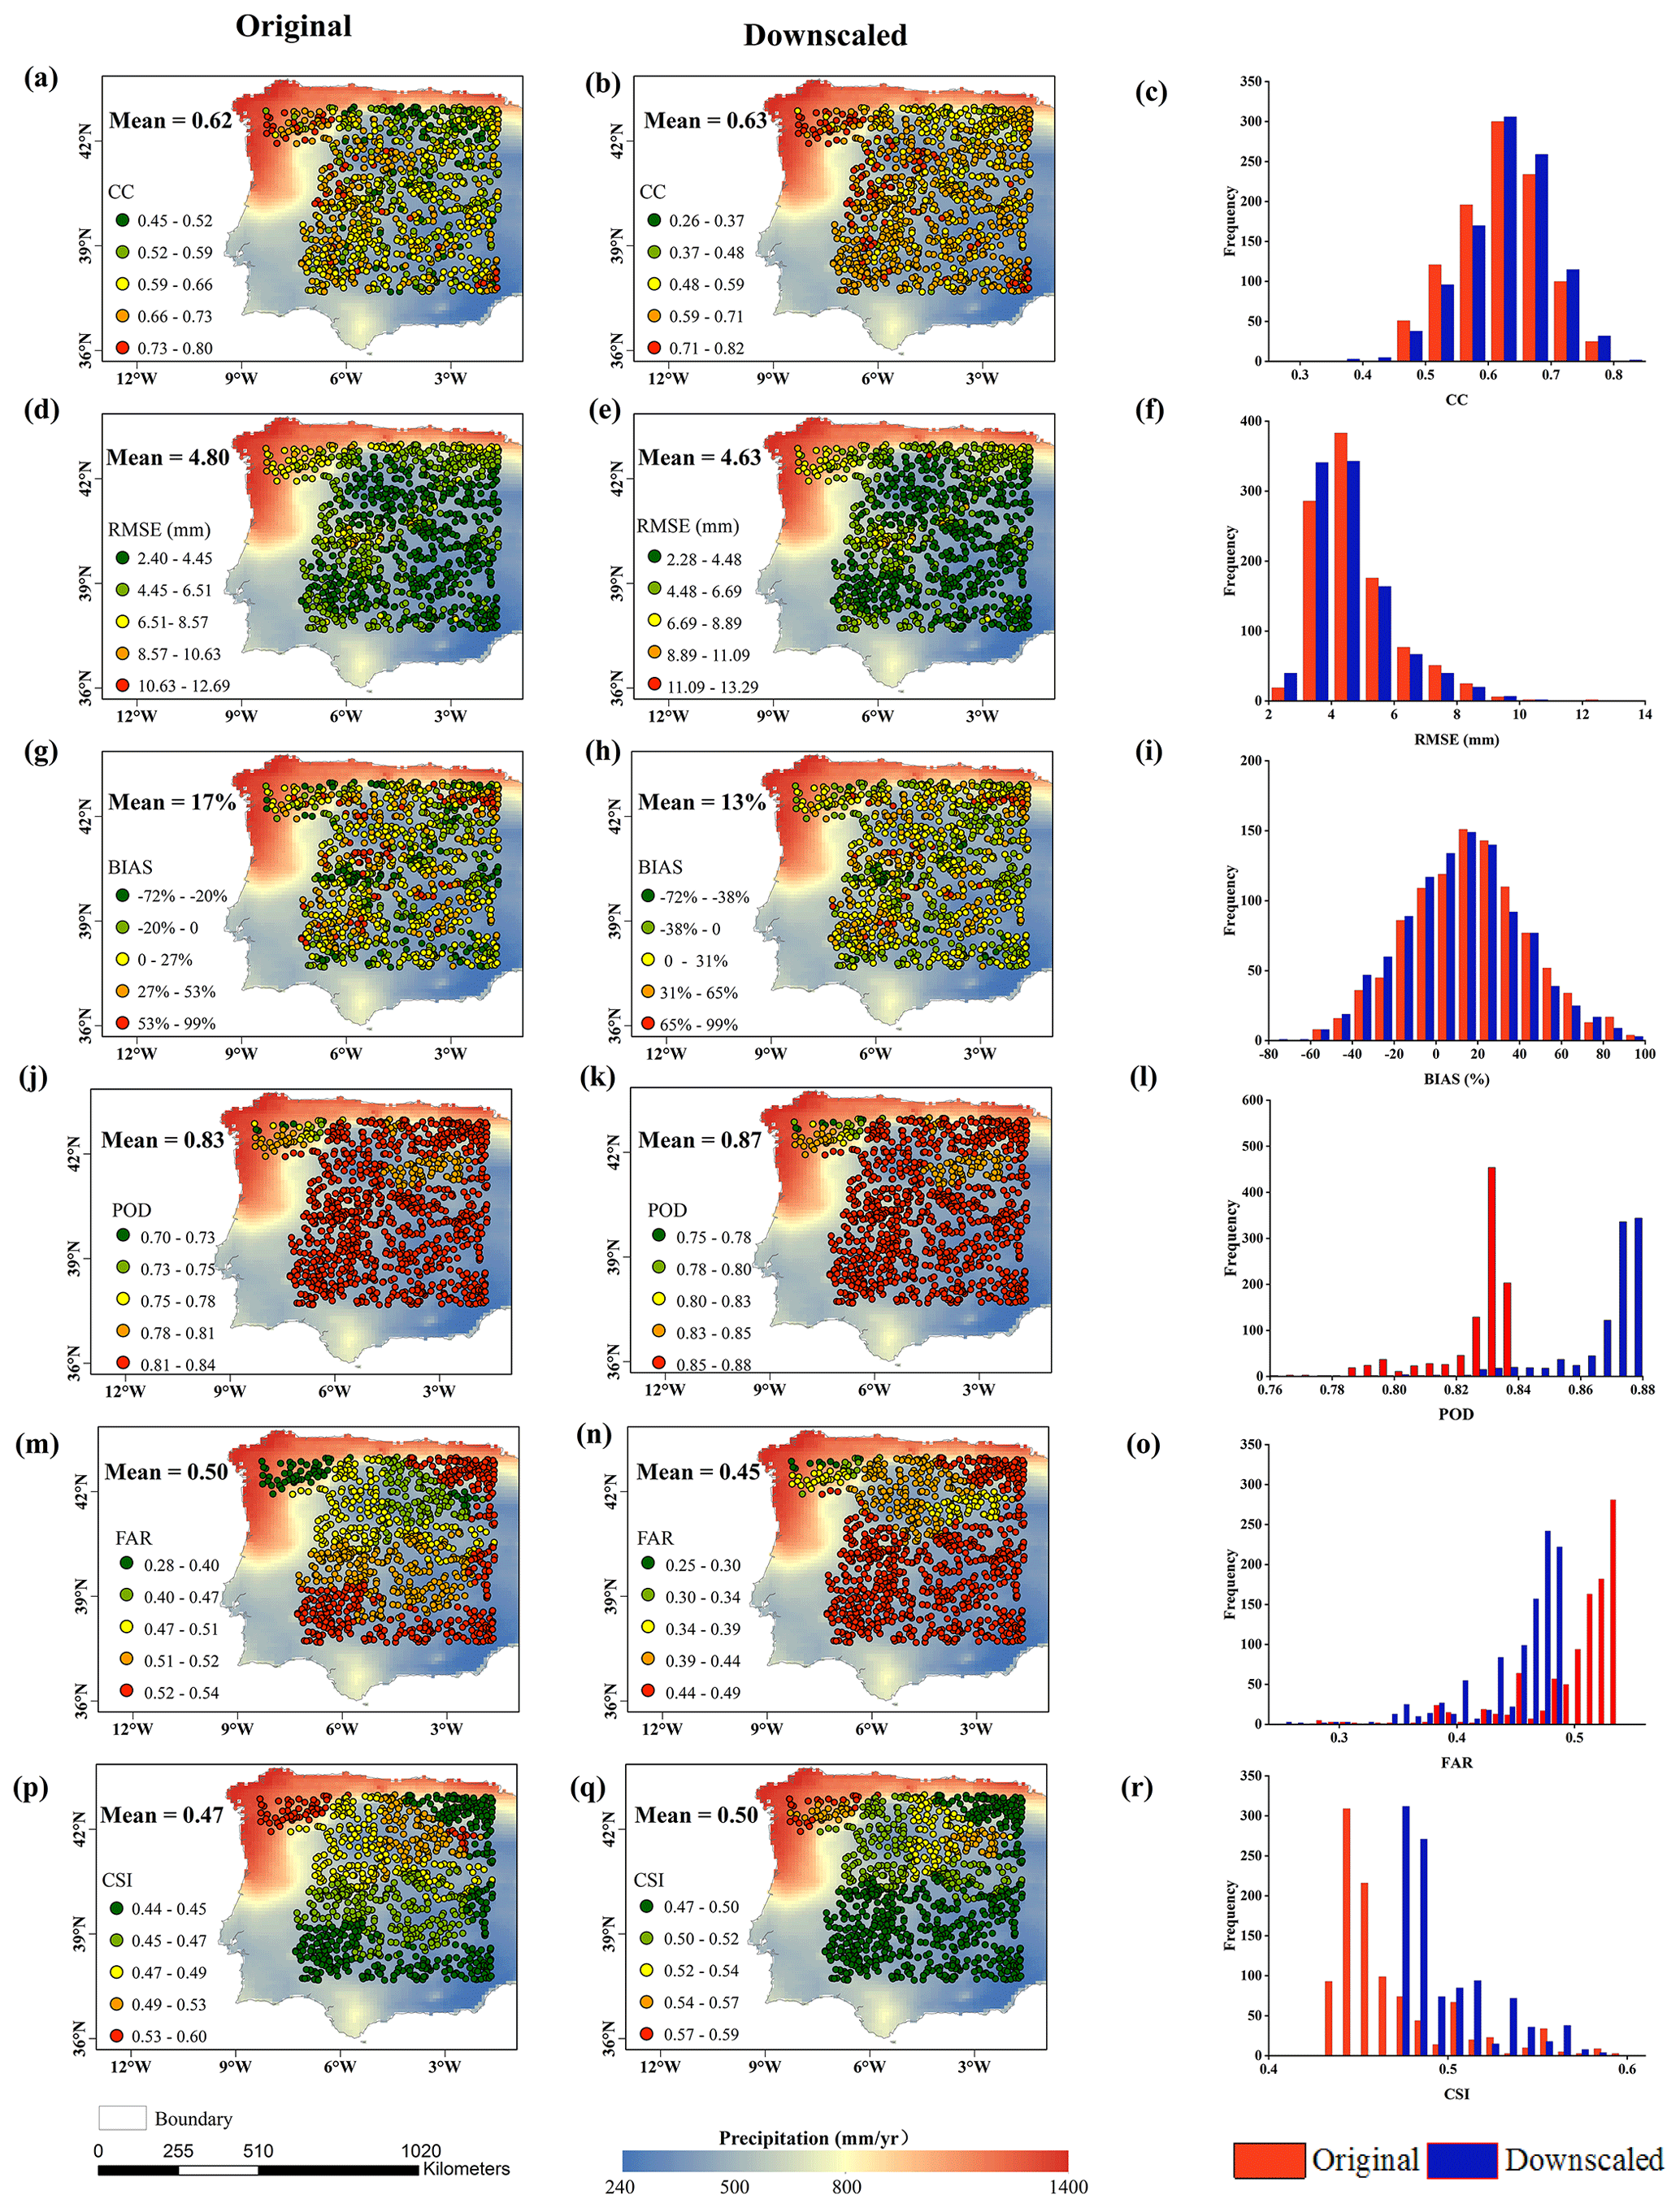
Figure 8CC (a, b), RMSE (d, e), BIAS (g, h), POD (j, k), FAR (m, n), CSI (p, q) and corresponding frequency distributions for daily precipitation of original and downscaled GPM precipitation estimates at 1027 stations during 2016–2018. The background value represents the original GPM annual average precipitation value from 2016 to 2018.
Table 2CC, RMSE, BIAS, POD, FAR and CSI values for the different precipitation intensities for original and downscaled GPM products from 2016 to 2018 for 1027 rain gauge stations.

Generally, the improvement of the overall performance for the downscaled results in Fig. 8 is attributed to the number of improvements in the validation site indicators that occur between the original GPM product, the downscaled results and the observation stations on the daily scale. The downscaled results outperformed the original product in the detection accuracy of rainfall events and precipitation volumes, and the improvements in CSI and FAR were found at 1008 and 1026 stations, respectively. Similarly, the number of improvements of CC, RMSE, and BIAS were 765, 886, and 884, respectively. The downscaled results were more accurate than the original product when they were validated by field measurements at most stations. In summary, the improvement in the precipitation downscaled by the SMPD method occurred at most rain gauge stations. The evaluation demonstrates the ability of this method to increase spatial heterogeneity to enhance the correlation with field measurements while also retaining the original GPM spatial distribution pattern. All these results clearly prove the effectiveness of the downscaling method, which enhances daily GPM precipitation in both spatial information and accuracy.
4.3.3 Evaluation of precipitation intensities
To assess the performance of downscaled GPM products at different precipitation intensity intervals the daily precipitation intensity is classified into 5 categories based on the rainfall thresholds (0, 10, 20, and 40 mm) Zambrano-Bigiarini et al. (2017). The performance metrics for the 5 daily precipitation intensity classes from 2016 to 2018 are listed in Table 2. In summary, original and downscaled GPM products performed the best in terms of all performance metrics for the no rain events, while performing the worst for the violent rain events (>40 mm d−1). All precipitation products indicated that FAR values continuously performed the worst for the violent rain intensities, which showed that the products are still unable to accurately capture high precipitation values. Due to the reduced FAR values, the CSI values performed the best for no rain events, followed by the light rain (0–10 mm d−1), moderate rain (10–20 mm d−1), heavy rain (20–40 mm d−1) and violent rain events (>40 mm d−1), respectively. Additionally, the BIAS values showed that all precipitation products overestimated the number of light rain and underestimated moderate rain, heavy rain, and violent rain events. Most importantly, the performance of the downscaled precipitation product was slightly better than the original precipitation product for different rainfall intensity events in terms of CC, RMSE, POD, FAR and CSI values, indicating the improved reliability and accuracy of the downscaled products in capturing different rainfall intensity events compared to the original precipitation products.
4.3.4 Validation on the monthly scale
In addition to the validation on the daily scale, the downscaling results were further evaluated on the monthly scale by integrating the daily results into the monthly amount. Figure 8 shows the multiannual average maps of the monthly precipitation from 2016 to 2018, including the original GPM product and the downscaled results. Similar to the daily comparison, the monthly distributions of both datasets have similar patterns over different months. The northern part of the study area has more precipitation than the southern part. The downscaled results maintain the precipitation centers in each month and provide a good depiction of the distributions around the centers. The downscaled results can provide more detailed information regarding spatial distribution.
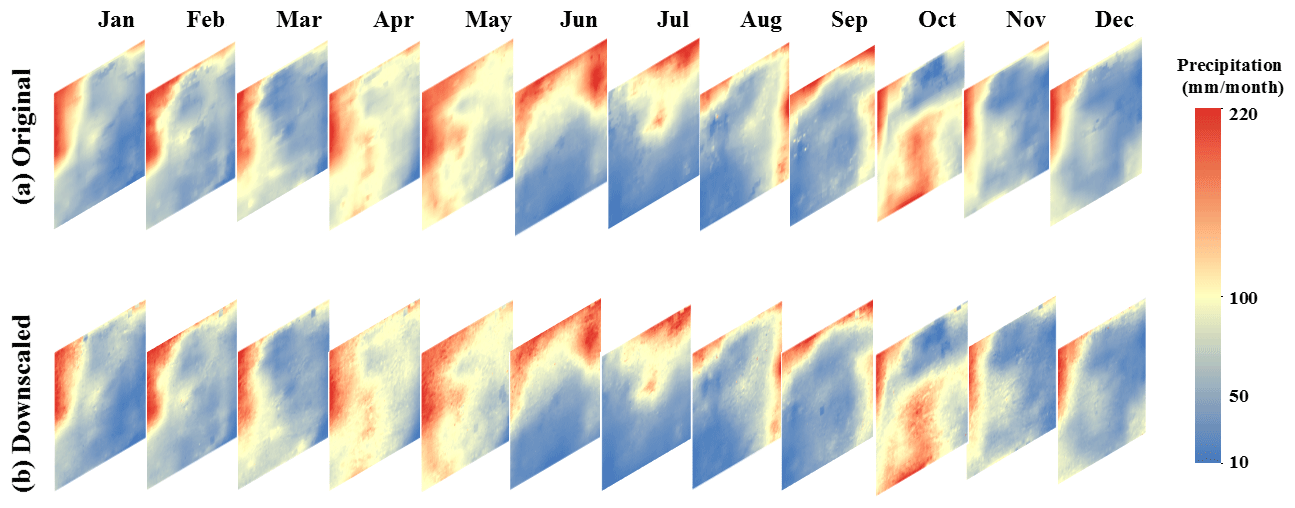
Figure 9Spatial distribution of the multiannual mean value of monthly precipitation for the original GPM product (first panel) and the downscaled results (second panel) from 2016 to 2018.

Figure 10Scatterplots of the original GPM precipitation product (a) and the downscaled precipitation data (b) plotted against the monthly precipitation measured by the meteorological stations during the period from 2016 to 2018.
By collecting the monthly precipitation of 1027 stations from 2016 to 2018, the accuracy of the monthly precipitation from the original and downscaled data was further quantitatively assessed. As shown in Fig. 10a, after temporal integration, the uncertainty in the daily observation was greatly reduced in the monthly precipitation of the original GPM product. There is a significant increase in CC from 0.60 in Fig. 6a to 0.83 in Fig. 10a. However, systematic overestimation still occurs. After spatial downscaling, although there is no big change in terms of CC, both the RMSE and BIAS are clearly improved based on a comparison of the density plots in Fig. 9a and b. For the analysis of the improvement ratio, only the performances of CC, RMSE, and BIAS are analyzed because the POD, FAR and CSI mainly reflect the rainfall events on the daily scale. Among the 1027 stations, the numbers of stations with improvements during the validation in terms of CC, RMSE, and BIAS were 734, 587, and 912, respectively. Combined with the overall validation and individual validation, the downscaled results on the monthly scale outperformed the original GPM product. The evaluation shows that the downscaling method also presents good accuracy in the downscaling results and high robustness at the monthly scale.
Table 3List of the performance of downscaling procedures to improve the spatial resolution of satellite precipitation products at different temporal scales. The italic letters represent the proposed method in this study.

In this study a spatial downscaling method for coarse-resolution precipitation products was proposed to produce high spatial resolution precipitation data at a 1 km scale with the use of 1 km SSM data downscaled from microwave remote sensing estimations. To establish the connection between SSM and precipitation, a simplified precipitation estimation model based on the surface water balance equation was developed with inspiration from the SM2RAIN model proposed by Brocca et al. (2014). By calibrating the model coefficients with a self-adaptive window at the coarse-resolution scale, the precipitation model was applied to high-resolution variables to obtain the high-resolution estimates. Compared with previous downscaling methods that mainly established empirical relationships with surface variables, such as NDVI and topographic factors, this method introduces the physical relationship between SSM and precipitation via the water balance equation and has a solid physical basis. Therefore, the validation analysis conducted at both daily and monthly scales indicated that the downscaled precipitation data outperformed the original precipitation product in most circumstances and presented high robustness over 3 years with different rainfall intensities.
5.1 Advantages of the downscaling method
In general, the SMPD method adopted the bottom-up approach in precipitation estimation, in which the variations in SSM sensed by microwave satellite sensors have a strong connection with rainfall amounts according to the principle of water balance (Brocca et al., 2014, 2016; Mao et al., 2019). After a sudden increase in soil moisture induced by rainfall events, the moisture condition gradually becomes drier when there is no further rainfall. Therefore, this method has a clear physical mechanism and is the only downscaling method using SSM as the key driving factor. Comparatively, the traditional statistical downscaling methods were established based on the statistical relationship between environmental factors and precipitation. Taking the spatial interpolation method as an example, although the application of this method is convenient the accuracy of the interpolated precipitation data is limited by the rainfall gauge density, especially in mountainous watersheds with complex topography (L. Zhang et al., 2020; Guo et al., 2021). The high dependency on in situ measurements constrains its applications in areas with few observations. In contrast, the SMPD method removes the limitation caused by the rainfall gauge density and has a broader prospective range of applications.
To further demonstrate the advantage of the SMPD method, it is beneficial to compare the validation accuracy of this method with the validation accuracies of existing downscaled approaches, as shown in Table 3. In current existing downscaling studies, the involvement of daily SSM ensures that downscaling at a daily scale is rarely considered. However, the relationship between SSM and precipitation ensures the daily downscaling in the proposed SMPD method. Comparatively, although Yan et al. (2021) conducted daily precipitation downscaling with the use of the random forest (RF) method, the RMSE value was considerably lower than that of the SMPD method. Moreover, this machine learning method is highly dependent on the available training dataset. Comparatively, the daily or sub-daily downscaling studies conducted by Long et al. (2016) and Chao et al. (2018) have relatively better performances in terms of RMSE and CC, respectively. However, the incorporation of gauge precipitation data in the downscaling process partly enhances the estimation accuracy. These methods greatly rely on in situ measurements without the independence of rain gauge measurements. In a recent hour scale downscaling study conducted by Ma et al. (2020a), a geographically moving window weight disaggregation analysis (GMWWDA) method was developed by introducing cloud properties as covariates to downscale GPM precipitation products. Although it provided estimates at a very high temporal frequency, the limited rainfall-related environmental variables at the 0.01∘ per hourly scale constrained its application.
For the intercomparison of the monthly accuracy, the daily downscaled results of the proposed method outperformed most of the previous monthly downscaling studies using either RF or GWR algorithms (Jia et al., 2011; Xu et al., 2015; Jing et al., 2016b; Chen et al., 2018; Zhan et al., 2018). As shown in Fig. 10b, the CC value was higher than most of them in the abovementioned studies. Although the RF-based downscaling method in Jing et al. (2016b) has a relatively low RMSE, the measurements from in situ stations were used to train the downscaling model which greatly reduced the dependence of the downscaling process on field observations. A similar requirement was also presented in Lu et al. (2019) and Long et al. (2016), and the GWR and multivariate regression models were largely dependent on the number of available training stations and variables related to the geophysical mechanisms of precipitation. The independence of field observations in the SMPD method shows a large advantage, especially for regions with sparse meteorological stations. Zeng et al. (2021) also proposed an independent downscaling approach considering temporal lag from vegetation changes to precipitation. However, the relationship shows high variability which may result in a negative correlation within a short time. Therefore, both the CC and RMSE of this method have worse performances than those of the proposed method. In general, according to the methodology comparison, the proposed SMPD method exhibits good performance in terms of both CC and RMSE. Unlike using the empirical regression method to build the relationship between precipitation and other surface variables, the SMPD method demonstrated high effectiveness, independence, and robustness.
5.2 Limitations and prospects
Despite the superior performance of the SMPD method, some issues still need to be considered in practical applications. The first issue should relate to the accuracy of the original GPM precipitation data. Due to the limitation of the inherent accuracy of original GPM precipitation data, which are mainly manifested in two aspects, firstly the IMERG final products are corrected on a monthly scale using the interpolated precipitation product of the Global Precipitation Climatology Centre (GPCC, 1.0∘ per month) based on ground observations. However, there is no mature calibration algorithm for calibrating the daily satellite-based precipitation estimates (Ma et al., 2020b). Second, the prior databases of cloud cover and precipitation profiles for retrieving passive microwave-based satellite precipitation estimates are not sufficiently robust due to the lack of ground-based radar observations. In addition, as passive microwave remote sensing-based precipitation retrieval is the primary input to the IMERG final products, it may lead to poor performance of the satellite-based product in winter and high-latitude regions (Xu et al., 2022). Therefore, the improvement in the accuracy of downscaling results is limited because of the value preservation during the downscaling process. The downscaling performance is highly dependent on the accuracy of the original GPM products. The multisource data fusion model based on observed rain gauge stations and reanalysis data proposed by Ma et al. (2021) and Li and Long (2020) could increase its ability to describe the daily precipitation fluctuations and would help to provide more accurate downscaling precipitation values. Given the spatial inconsistency of the point measurement and grid-scale estimation, this may lead to some uncertainty in the evaluation results. Thus, more attention should be paid to the difference in spatial scale between satellite and gauge-based precipitation measurements in future comparisons based on reanalysis-based precipitation with high spatial resolution.
In addition, the uncertainty of SSM and the sensitivity relationship between SSM and precipitation under continuous rainfall conditions may introduce uncertainty in the downscaling precipitation results. First, the responses of SSM with different land cover conditions and vegetation coverage to precipitation are relatively different (Fan et al., 2021), and topographic factors such as depressions and slopes also affect the uncertainty of SSM. Therefore, it is necessary to establish the relationship between SSM and precipitation for different land cover types or different terrain types. The establishment of a more reliable fitting relationship based on precipitation data with different land cover properties or topographic factors would be helpful to enhance the accuracy of the downscaling results (Chen et al., 2020; Senanayake et al., 2021; Zhao et al., 2021). Second, although the relationship between SSM and precipitation has been well demonstrated in many previous studies, the sensitivity of SSM to precipitation may decrease when soil water storage becomes saturated after repeated precipitation (Song et al., 2020). Therefore, it is necessary to further improve the relationship by considering the soil water threshold saturation in future studies. Moreover, this downscaling method was based on the surface water balance principle, and the runoff factor under heavy precipitation conditions at a certain time was not considered because of the inherent scarcity of high-resolution runoff datasets from in situ measurements. Some studies have provided good alternatives to obtain runoff data with high spatiotemporal resolution (Jadidoleslam et al., 2019; Muelchi et al., 2022). Hence, the use of this runoff factor in the water balance equation for heavy precipitation will assist in improving downscaling accuracy.
Most importantly, many previous studies have successfully generated fine precipitation data at hourly or half hourly scales (Ma et al., 2020a, b, 2022; Lu et al., 2022). Nevertheless, these studies lacked physical mechanisms in the downscaling process and did not use surface soil moisture covariates that respond in real-time to precipitation. In the proposed method, the key inputs of the downscaling process are surface soil moisture and precipitation data. Even on hourly or half hourly scales, the soil moisture exhibits an instantaneous response to collocated precipitation. Then, the soil moisture estimation method achieved seamless downscaling for high-resolution soil moisture generation under cloudy conditions. Therefore, it would be able to obtain real-time soil moisture from microwave satellite observations combined with surface temperature and vegetation index derived from optical and thermal infrared remote sensing. Therefore, this approach has the potential for generating high spatial resolution precipitation data on an hourly or half hourly scale.
In this paper, by introducing high-resolution SSM data and the NDVI as independent variables, a novel physical downscaling approach based on the principle of surface water balance is developed to obtain high-resolution (1 km × 1 km) daily precipitation estimations. On both daily and monthly scales, the downscaled precipitation presents a similar spatial and temporal distribution pattern as the original GPM product. Furthermore, a systematic evaluation of the downscaled GPM data was conducted on multiple time scales at the station level. The downscaled precipitation showed a good correlation with the observed measurements at each station on the daily scale, with POD, FAR, CSI, CC, RMSE, and BIAS values of 0.88, 0.47, 0.48, 0.61, 4.83 mm, and 5 %, respectively, and the evaluation results outperformed the original GPM product. For monthly scale comparisons, the downscaled data also presented a strong correlation with the observed precipitation, with CC, RMSE, and BIAS values of 0.84, 30.88 mm, and 5 %, respectively. With the increase in spatial heterogeneity in the downscaled results there is also an increasing trend in the improvements in the precipitation accuracy through the comparison at most stations.
In summary, the proposed method with the use of the surface water balance principle has a more solid physical basis than previous downscaling methods. By introducing SSM as an auxiliary variable, the impact of inherent bias in satellite estimates on the downscaled results can be moderately reduced compared to the conventional statistical method. The validation with rain gauge data highlights the importance of SSM as a fully independent source of information that can be effectively used for downscaling coarse-resolution precipitation on a daily scale, which was rarely conducted in current related studies. Therefore, this method is a promising way to derive high-resolution precipitation data and shows good potential for real-time precipitation data downscaling with the provision of SSM data, which will assist further applications in related fields, such as hydrology, agriculture, natural hazards, water resources, and climate change.
The high-resolution SSM data used in this study are available at the Zenodo data survey portal (https://doi.org/10.5281/zenodo.7451422; He, 2022). A part of the field observation data is collected from the website (https://www.ncei.noaa.gov/access/search/data-search/global-summary-of-the-day; NOAA, 2023). The Matlab codes can be obtained on request from the corresponding author.
KH led the investigation, conceptualized the study, designed the formal analysis, and wrote the initial draft. WZ was responsible for conceptualizing the study, investigating methods, obtaining the funding, supervising the study process, and reviewing and editing the paper. LB conceptualized the research, reviewed the manuscript and provided the in situ measurements. PQS helped with the investigation, provided the datasets, and reviewed the paper.
The contact author has declared that none of the authors has any competing interests.
This research was partially funded as part of the National Natural Science Foundation of China (grant nos. 42071349 and 42222109), Sichuan Science and Technology Program (Grant No. 2020JDJQ0003), the West Light Foundation of the Chinese Academy of Sciences, and the project PRIMA PCI2020-112043 funded by MCIN/AEI/10.13039/501100011033. We thank the Spanish State Meteorological Agency (AEMET) for sharing daily precipitation data with this project.
Publisher’s note: Copernicus Publications remains neutral with regard to jurisdictional claims in published maps and institutional affiliations.
This research has been supported by the National Natural Science Foundation of China (grant nos. 42071349 and 42222109), and the Sichuan Province Science and Technology Support Program (grant no. 2020JDJQ0003).
This paper was edited by Shraddhanand Shukla and reviewed by three anonymous referees.
Abdollahipour, A., Ahmadi, H., and Aminnejad, B.: A review of downscaling methods of satellite-based precipitation estimates, Earth. Sci. Inform., 15, 1–20, https://doi.org/10.1007/s12145-021-00669-4, 2021.
Baez-Villanueva, O. M., Zambrano-Bigiarini, M., Beck, H. E., McNamara, I., Ribbe, L., Nauditt, A., Birkel, C., Verbist, K., Giraldo-Osorio, J. D., and Thinh, N. X.: RF-MEP: A novel Random Forest method for merging gridded precipitation products and ground-based measurements, Remote Sens. Environ., 239, 111606, https://doi.org/10.1016/j.rse.2019.111606, 2020.
Bezak, N., Borrelli, P., and Panagos, P.: Exploring the possible role of satellite-based rainfall data in estimating inter- and intra-annual global rainfall erosivity, Hydrol. Earth Syst. Sci., 26, 1907–1924, https://doi.org/10.5194/hess-26-1907-2022, 2022.
Birtwistle, A. N., Laituri, M., Bledsoe, B., and Friedman, J. M.: Using NDVI to measure precipitation in semi-arid landscapes, J. Arid Environ., 131, 15–24, https://doi.org/10.1016/j.jaridenv.2016.04.004, 2016.
Brocca, L., Moramarco, T., Melone, F., and Wagner, W.: A new method for rainfall estimation through soil moisture observations, Geophys. Res. Lett., 40, 853–858, https://doi.org/10.1002/grl.50173, 2013.
Brocca, L., Ciabatta, L., Massari, C., Moramarco, T., Hahn, S., Hasenauer, S., Kidd, R., Dorigo, W., Wagner, W., and Levizzani, V.: Soil as a natural rain gauge: Estimating global rainfall from satellite soil moisture data, J. Geophys. Res.-Atmos., 119, 5128–5141, https://doi.org/10.1002/2014JD021489, 2014.
Brocca, L., Massari, C., Ciabatta, L., Moramarco, T., Penna, D., Zuecco, G., Pianezzola, L., Borga, M., Matgen, P., and Martínez-Fernández, J.: Rainfall estimation from in situ soil moisture observations at several sites in Europe: an evaluation of the SM2RAIN algorithm, J. Hydrol. Hydromech., 63, 201–209, https://doi.org/10.1515/johh-2015-0016, 2015.
Brocca, L., Pellarin, T., Crow, W. T., Ciabatta, L., Massari, C., Ryu, D., Su, C. H., Rüdiger, C., and Kerr, Y.: Rainfall estimation by inverting SMOS soil moisture estimates: A comparison of different methods over Australia, J. Geophys. Res.-Atmos., 121, 12062–12079, https://doi.org/10.1002/2016JD025382, 2016.
Brocca, L., Filippucci, P., Hahn, S., Ciabatta, L., Massari, C., Camici, S., Schüller, L., Bojkov, B., and Wagner, W.: SM2RAIN–ASCAT (2007–2018): global daily satellite rainfall data from ASCAT soil moisture observations, Earth Syst. Sci. Data., 11, 1583–1601, https://doi.org/10.5194/essd-11-1583-2019, 2019.
Carpintero, E., Mateos, L., Andreu, A., and González-Dugo, M. P.: Effect of the differences in spectral response of Mediterranean tree canopies on the estimation of evapotranspiration using vegetation index-based crop coefficients, Agr. Water Manage., 238, 106201, https://doi.org/10.1016/j.agwat.2020.106201, 2020.
Chao, L., Zhang, K., Li, Z., Zhu, Y., Wang, J., and Yu, Z.: Geographically weighted regression based methods for merging satellite and gauge precipitation, J. Hydrol., 558, 275–289, https://doi.org/10.1016/j.jhydrol.2018.01.042, 2018.
Chen, F., Crow, W., and Holmes, T. R.: Improving long-term, retrospective precipitation datasets using satellite-based surface soil moisture retrievals and the soil moisture analysis rainfall tool, J. Appl. Remote Sens., 6, 063604, https://doi.org/10.1117/1.JRS.6.063604, 2012.
Chen, S., Xiong, L., Ma, Q., Kim, J.-S., Chen, J., and Xu, C.-Y.: Improving daily spatial precipitation estimates by merging gauge observation with multiple satellite-based precipitation products based on the geographically weighted ridge regression method, J. Hydrol., 589, 125156, https://doi.org/10.1016/j.jhydrol.2020.125156, 2020.
Chen, Y., Huang, J., Sheng, S., Mansaray, L. R., Liu, Z., Wu, H., and Wang, X.: A new downscaling-integration framework for high-resolution monthly precipitation estimates: Combining rain gauge observations, satellite-derived precipitation data and geographical ancillary data, Remote Sens. Environ., 214, 154–172, https://doi.org/10.1016/j.rse.2018.05.021, 2018.
Ciabatta, L., Marra, A. C., Panegrossi, G., Casella, D., Sanò, P., Dietrich, S., Massari, C., and Brocca, L.: Daily precipitation estimation through different microwave sensors: Verification study over Italy, J. Hydrol., 545, 436–450, https://doi.org/10.1016/j.jhydrol.2016.12.057, 2017.
Ciabatta, L., Massari, C., Brocca, L., Gruber, A., Reimer, C., Hahn, S., Paulik, C., Dorigo, W., Kidd, R., and Wagner, W.: SM2RAIN-CCI: a new global long-term rainfall data set derived from ESA CCI soil moisture, Earth Syst. Sci. Data., 10, 267–280, https://doi.org/10.5194/essd-10-267-2018, 2018.
Colliander, A., Jackson, T. J., Bindlish, R., Chan, S., Das, N., Kim, S., Cosh, M., Dunbar, R., Dang, L., and Pashaian, L.: Validation of SMAP surface soil moisture products with core validation sites, Remote Sens. Environ., 191, 215–231, https://doi.org/10.1016/j.rse.2017.01.021, 2017.
Dorigo, W., Wagner, W., Albergel, C., Albrecht, F., Balsamo, G., Brocca, L., Chung, D., Ertl, M., Forkel, M., Gruber, A., Haas, E., Hamer, P. D., Hirschi, M., Ikonen, J., de Jeu, R., Kidd, R., Lahoz, W., Liu, Y. Y., Miralles, D., Mistelbauer, T., Nicolai-Shaw, N., Parinussa, R., Pratola, C., Reimer, C., van der Schalie, R., Seneviratne, S. I., Smolander, T., and Lecomte, P.: ESA CCI Soil Moisture for improved Earth system understanding: State-of-the art and future directions, Remote Sens. Environ., 203, 185–215, https://doi.org/10.1016/j.rse.2017.07.001, 2017.
Duan, Z. and Bastiaanssen, W.: First results from Version 7 TRMM 3B43 precipitation product in combination with a new downscaling–calibration procedure, Remote Sens. Environ., 131, 1–13, https://doi.org/10.1016/j.rse.2012.12.002, 2013.
Ebrahimy, H. and Azadbakht, M.: Downscaling MODIS land surface temperature over a heterogeneous area: An investigation of machine learning techniques, feature selection, and impacts of mixed pixels, Comput. Geosci.-UK, 124, 93–102, https://doi.org/10.1016/j.cageo.2019.01.004, 2019.
Famiglietti, J. S. and Wood, E. F.: Multiscale modeling of spatially variable water and energy balance processes, Water Resour. Res., 30, 3061–3078, https://doi.org/10.1029/94WR01498, 1994.
Fan, Y., Ma, Z., Ma, Y., Ma, W., Xie, Z., Ding, L., Han, Y., Hu, W., and Su, R.: Respective Advantages of “Top-Down” Based GPM IMERG and “Bottom-Up” Based SM2RAIN-ASCAT Precipitation Products Over the Tibetan Plateau, J. Geophys. Res.-Atmos., 126, e2020JD033946, https://doi.org/10.1029/2020JD033946, 2021.
Gruber, A., Scanlon, T., van der Schalie, R., Wagner, W., and Dorigo, W.: Evolution of the ESA CCI Soil Moisture climate data records and their underlying merging methodology, Earth Syst. Sci. Data, 11, 717–739, https://doi.org/10.5194/essd-11-717-2019, 2019.
Guo, X., Guo, Cui, P., Chen, X., Li, Y., Zhang, J., and Sun, Y.: Spatial uncertainty of rainfall and its impact on hydrological hazard forecasting in a small semiarid mountainous watershed, J. Hydrol., 595, 126049, https://doi.org/10.1016/j.jhydrol.2021.126049, 2021.
Haylock, M. R., Cawley, G. C., Harpham, C., Wilby, R. L., and Goodess, C. M.: Downscaling heavy precipitation over the United Kingdom: a comparison of dynamical and statistical methods and their future scenarios, Int. J. Climatol., 26, 1397–1415, https://doi.org/10.1002/joc.1318, 2006.
He, K.: High-resolution soil moisture data (1 km) [Data set]. In Hydrology and Earth System Sciences (Version 1), Zenodo [data set], https://doi.org/10.5281/zenodo.7451422, 2022.
He, X., Chaney, N. W., Schleiss, M., and Sheffield, J.: Spatial downscaling of precipitation using adaptable random forests, Water Resour. Res., 52, 8217–8237, https://doi.org/10.1002/2016WR019034, 2016.
Hong, Z., Han, Z., Li, X., Long, D., Tang, G., and Wang, J.: Generation of an improved precipitation dataset from multisource information over the Tibetan Plateau, J. Hydrometeorol., 22, 1275–1295, https://doi.org/10.1175/JHM-D-20-0252.1, 2021.
Hou, A. Y., Kakar, R. K., Neeck, S., Azarbarzin, A. A., Kummerow, C. D., Kojima, M., Oki, R., Nakamura, K., and Iguchi, T.: The Global Precipitation Measurement Mission, B. Am. Meteorol. Soc., 95, 701–722, https://doi.org/10.1175/BAMS-D-13-00164.1, 2014.
Huffman, G. J., Adler, R. F., Arkin, P., Chang, A., Ferraro, R., Gruber, A., Janowiak, J., McNab, A., Rudolf, B., and Schneider, U.: The global precipitation climatology project (GPCP) combined precipitation dataset, B. Am. Meteorol. Soc., 78, 5–20, https://doi.org/10.1175/1520-0477(1997)078<0005:TGPCPG>2.0.CO;2, 1997.
Huffman, G. J., Bolvin, D. T., Nelkin, E. J., Wolff, D. B., Adler, R. F., Gu, G., Hong, Y., Bowman, K. P., and Stocker, E. F.: The TRMM Multisatellite Precipitation Analysis (TMPA): Quasi-global, multiyear, combined-sensor precipitation estimates at fine scales, J. Hydrometeorol., 8, 38–55, https://doi.org/10.1175/JHM560.1, 2007.
Huffman, G. J., Bolvin, D. T., Braithwaite, D., Hsu, K., Joyce, R., Xie, P., and Yoo, S.-H.: NASA global precipitation measurement (GPM) integrated multi-satellite retrievals for GPM (IMERG), Algorithm Theoretical Basis Document (ATBD) Version 4, National Aeronautics and Space Administration, 26 pp., https://gpm.nasa.gov/resources/documents/algorithm-information/IMERG-V06-ATBD (last access: 9 January 2023), 2020a.
Huffman, G. J., Bolvin, D. T., Braithwaite, D., Hsu, K.-L., Joyce, R. J., Kidd, C., Nelkin, E. J., Sorooshian, S., Stocker, E. F., and Tan, J.: Integrated multi-satellite retrievals for the Global Precipitation Measurement (GPM) mission (IMERG), in: Satellite precipitation measurement, Springer, Cham, 343–353, https://doi.org/10.1007/978-3-030-24568-9_19, 2020b.
Hutengs, C. and Vohland, M.: Downscaling land surface temperatures at regional scales with random forest regression, Remote Sens. Environ., 178, 127–141, https://doi.org/10.1016/j.rse.2016.03.006, 2016.
Immerzeel, W. W., Rutten, M. M., and Droogers, P.: Spatial downscaling of TRMM precipitation using vegetative response on the Iberian Peninsula, Remote Sens. Environ., 113, 362–370, https://doi.org/10.1016/j.rse.2008.10.004, 2009.
Jadidoleslam, N., Mantilla, R., Krajewski, W. F., and Goska, R.: Investigating the role of antecedent SMAP satellite soil moisture, radar rainfall and MODIS vegetation on runoff production in an agricultural region, J. Hydrol., 579, 124210, https://doi.org/10.1016/j.jhydrol.2019.124210, 2019.
Jia, S., Zhu, W., Lű, A., and Yan, T.: A statistical spatial downscaling algorithm of TRMM precipitation based on NDVI and DEM in the Qaidam Basin of China, Remote Sens. Environ., 115, 3069–3079, https://doi.org/10.1016/j.rse.2011.06.009, 2011.
Jing, W., Yang, Y., Yue, X., and Zhao, X.: A Spatial Downscaling Algorithm for Satellite-Based Precipitation over the Tibetan Plateau Based on NDVI, DEM, and Land Surface Temperature, Remote Sens., 8, 655, https://doi.org/10.3390/rs8080655, 2016a.
Jing, W., Yang, Y., Yue, X., and Zhao, X.: A Comparison of Different Regression Algorithms for Downscaling Monthly Satellite-Based Precipitation over North China, Remote Sens., 8, 1–17, https://doi.org/10.3390/rs8100835, 2016b.
Jing, Y., Lin, L., Li, X., Li, T., and Shen, H.: An attention mechanism based convolutional network for satellite precipitation downscaling over China, J. Hydrol., 613, 128388, https://doi.org/10.1016/j.jhydrol.2022.128388, 2022.
Joiner, J., Yoshida, Y., Anderson, M., Holmes, T., Hain, C., Reichle, R., Koster, R., Middleton, E., and Zeng, F.-W.: Global relationships among traditional reflectance vegetation indices (NDVI and NDII), evapotranspiration (ET), and soil moisture variability on weekly timescales, Remote Sens. Environ., 219, 339–352, https://doi.org/10.1016/j.rse.2018.10.020, 2018.
Joyce, R. J., Janowiak, J. E., Arkin, P. A., and Xie, P.: CMORPH: A method that produces global precipitation estimates from passive microwave and infrared data at high spatial and temporal resolution, J. Hydrometeorol., 5, 487–503, https://doi.org/10.1175/1525-7541(2004)005<0487:CAMTPG>2.0.CO;2, 2004.
Kubota, T., Shige, S., Hashizume, H., Aonashi, K., Takahashi, N., Seto, S., Hirose, M., Takayabu, Y. N., Ushio, T., and Nakagawa, K.: Global precipitation map using satellite-borne microwave radiometers by the GSMaP project: Production and validation, IEEE T. Geosci. Remote, 45, 2259–2275, https://doi.org/10.1109/TGRS.2007.895337, 2007.
Li, X. and Long, D.: An improvement in accuracy and spatiotemporal continuity of the MODIS precipitable water vapor product based on a data fusion approach, Remote Sens. Environ., 248, 111966, https://doi.org/10.1016/j.rse.2020.111966, 2020.
Lin, A. and Wang, X. L.: An algorithm for blending multiple satellite precipitation estimates with in situ precipitation measurements in Canada, J. Geophys. Res.-Atmos., 116, D21111, https://doi.org/10.1029/2011JD016359, 2011.
Long, D., Bai, L., Yan, L., Zhang, C., Yang, W., Lei, H., Quan, J., Meng, X., and Shi, C.: Generation of spatially complete and daily continuous surface soil moisture of high spatial resolution, Remote Sens. Environ., 233, 111364, https://doi.org/10.1016/j.rse.2019.111364, 2019.
Long, Y., Zhang, Y., and Ma, Q.: A Merging Framework for Rainfall Estimation at High Spatiotemporal Resolution for Distributed Hydrological Modeling in a Data-Scarce Area, Remote Sens., 8, 599, https://doi.org/10.3390/rs8070599, 2016.
Lu, X., Tang, G., Wang, X., Liu, Y., Jia, L., Xie, G., Li, S., and Zhang, Y.: Correcting GPM IMERG precipitation data over the Tianshan Mountains in China, J. Hydrol., 575, 1239–1252, https://doi.org/10.1016/j.jhydrol.2019.06.019, 2019.
Lu, X., Chen, Y., Tang, G., Wang, X., Liu, Y., and Wei, M.: Quantitative estimation of hourly precipitation in the Tianshan Mountains based on area-to-point kriging downscaling and satellite-gauge data merging, J. Mt. Sci., 19, 58–72, https://doi.org/10.1007/s11629-021-6901-5, 2022.
Ma, Y., Sun, X., Chen, H., Hong, Y., and Zhang, Y.: A two-stage blending approach for merging multiple satellite precipitation estimates and rain gauge observations: an experiment in the northeastern Tibetan Plateau, Hydrol. Earth Syst. Sci., 25, 359–374, https://doi.org/10.5194/hess-25-359-2021, 2021.
Ma, Z., Zhou, Y., Hu, B., Liang, Z., and Shi, Z.: Downscaling annual precipitation with TMPA and land surface characteristics in China, Int. J. Climatol., 37, 5107–5119, https://doi.org/10.1002/joc.5148, 2017a.
Ma, Z., Shi, Z., Zhou, Y., Xu, J., Yu, W., and Yang, Y.: A spatial data mining algorithm for downscaling TMPA 3B43 V7 data over the Qinghai–Tibet Plateau with the effects of systematic anomalies removed, Remote Sens. Environ., 200, 378–395, https://doi.org/10.1016/j.rse.2017.08.023, 2017b.
Ma, Z., He, K., Tan, X., Liu, Y., Lu, H., and Shi, Z.: A new approach for obtaining precipitation estimates with a finer spatial resolution on a daily scale based on TMPA V7 data over the Tibetan Plateau, Int. J. Remote Sens., 40, 8465–8483, https://doi.org/10.1080/01431161.2019.1612118, 2019a.
Ma, Z., Ghent, D., Tan, X., He, K., Li, H., Han, X., Huang, Q., and Peng, J.: Long-Term Precipitation Estimates Generated by a Downscaling-Calibration Procedure Over the Tibetan Plateau From 1983 to 2015, Earth Space Sci., 6, 2180–2199, https://doi.org/10.1029/2019EA000657, 2019b.
Ma, Z., Xu, J., He, K., Han, X., Ji, Q., Wang, T., Xiong, W., and Hong, Y.: An updated moving window algorithm for hourly-scale satellite precipitation downscaling: A case study in the Southeast Coast of China, J. Hydrol., 581, 124378, https://doi.org/10.1016/j.jhydrol.2019.124378, 2020a.
Ma, Z., Xu, J., Zhu, S., Yang, J., Tang, G., Yang, Y., Shi, Z., and Hong, Y.: AIMERG: a new Asian precipitation dataset (0.1∘/half-hourly, 2000–2015) by calibrating the GPM-era IMERG at a daily scale using APHRODITE, Earth Syst. Sci. Data, 12, 1525–1544, https://doi.org/10.5194/essd-12-1525-2020, 2020b.
Ma, Z., Xu, J., Ma, Y., Zhu, S., He, K., Zhang, S., Ma, W., and Xu, X.: AERA5-Asia: A Long-Term Asian Precipitation Dataset (0.1∘, 1-hourly, 1951–2015, Asia) Anchoring the ERA5-Land under the Total Volume Control by APHRODITE, B. Am. Meteorol. Soc., 103, E1146–E1171, https://doi.org/10.1175/BAMS-D-20-0328.1, 2022.
Mao, Y., Crow, W. T., and Nijssen, B.: A Framework for Diagnosing Factors Degrading the Streamflow Performance of a Soil Moisture Data Assimilation System, J. Hydrometeorol., 20, 79–97, https://doi.org/10.1175/JHM-D-18-0115.1, 2019.
Maraun, D., Wetterhall, F., Ireson, A., Chandler, R., Kendon, E., Widmann, M., Brienen, S., Rust, H., Sauter, T., and Themeßl, M.: Precipitation downscaling under climate change: Recent developments to bridge the gap between dynamical models and the end user, Rev. Geophys., 48, RG3003, https://doi.org/10.1029/2009RG000314, 2010.
Maselli, F., Chiesi, M., Angeli, L., Fibbi, L., Rapi, B., Romani, M., Sabatini, F., and Battista, P.: An improved NDVI-based method to predict actual evapotranspiration of irrigated grasses and crops, Agr. Water Manage., 233, 106077, https://doi.org/10.1016/j.agwat.2020.106077, 2020.
Massari, C., Brocca, L., Moramarco, T., Tramblay, Y., and Didon Lescot, J.-F.: Potential of soil moisture observations in flood modelling: Estimating initial conditions and correcting rainfall, Adv. Water Resour., 74, 44–53, https://doi.org/10.1016/j.advwatres.2014.08.004, 2014.
McNally, A., Shukla, S., Arsenault, K. R., Wang, S., Peters-Lidard, C. D., and Verdin, J. P.: Evaluating ESA CCI soil moisture in East Africa, Int. J. Appl. Earth Obs. Geoinf., 48, 96–109, https://doi.org/10.1016/j.jag.2016.01.001, 2016.
Mei, Y., Maggioni, V., Houser, P., Xue, Y., and Rouf, T.: A nonparametric statistical technique for spatial downscaling of precipitation over High Mountain Asia, Water Resour. Res., 56, e2020WR027472, https://doi.org/10.1029/2020WR027472, 2020.
Merlin, O., Walker, J. P., Chehbouni, A., and Kerr, Y.: Towards deterministic downscaling of SMOS soil moisture using MODIS derived soil evaporative efficiency, Remote Sens. Environ., 112, 3935–3946, https://doi.org/10.1016/j.rse.2008.06.012, 2008.
Min, X., Ma, Z., Xu, J., He, K., Wang, Z., Huang, Q., and Li, J.: Spatially Downscaling IMERG at Daily Scale Using Machine Learning Approaches Over Zhejiang, Southeastern China, Front. Earth Sci., 8, 146, https://doi.org/10.3389/feart.2020.00146, 2020.
Mishra, V., Ellenburg, W. L., Griffin, R. E., Mecikalski, J. R., Cruise, J. F., Hain, C. R., and Anderson, M. C.: An initial assessment of a SMAP soil moisture disaggregation scheme using TIR surface evaporation data over the continental United States, Int. J. Appl. Earth Obs. Geoinf., 68, 92–104, https://doi.org/10.1016/j.jag.2018.02.005, 2018.
Mu, Q., Jones, L. A., Kimball, J. S., McDonald, K. C., and Running, S. W.: Satellite assessment of land surface evapotranspiration for the pan-Arctic domain, Water Resour. Res., 45, W09420, https://doi.org/10.1029/2008WR007189, 2009.
Muelchi, R., Rssler, O., Schwanbeck, J., Weingartner, R., and Martius, O.: An ensemble of daily simulated runoff data (1981–2099) under climate change conditions for 93 catchments in Switzerland (Hydro-CH2018-Runoff ensemble), Geosci. Data. J., 9, 46–57, https://doi.org/10.1002/gdj3.117, 2022.
Munsi, A., Kesarkar, A., Bhate, J., Panchal, A., Singh, K., Kutty, G., and Giri, R.: Rapidly intensified, long duration North Indian Ocean tropical cyclones: Mesoscale downscaling and validation, Atmos. Res., 259, 105678, https://doi.org/10.1016/j.atmosres.2021.105678, 2021.
Nagler, P. L., Cleverly, J., Glenn, E., Lampkin, D., Huete, A., and Wan, Z.: Predicting riparian evapotranspiration from MODIS vegetation indices and meteorological data, Remote Sens. Environ., 94, 17–30, https://doi.org/10.1016/j.rse.2004.08.009, 2005a.
Nagler, P. L., Scott, R. L., Westenburg, C., Cleverly, J. R., Glenn, E. P., and Huete, A. R.: Evapotranspiration on western U.S. rivers estimated using the Enhanced Vegetation Index from MODIS and data from eddy covariance and Bowen ratio flux towers, Remote Sens. Environ., 97, 337–351, https://doi.org/10.1016/j.rse.2005.05.011, 2005b.
Neinavaz, E., Skidmore, A. K., and Darvishzadeh, R.: Effects of prediction accuracy of the proportion of vegetation cover on land surface emissivity and temperature using the NDVI threshold method, Int. J. Appl. Earth Obs. Geoinf., 85, 101984, https://doi.org/10.1016/j.jag.2019.101984, 2020.
NOAA: Global Surface Summary of the Day – GSOD, https://www.ncei.noaa.gov/access/search/data-search/global-summary-of-the-day, last access: 6 January 2023.
Pan, L., Xia, H., Zhao, X., Guo, Y., and Qin, Y.: Mapping Winter Crops Using a Phenology Algorithm, Time-Series Sentinel-2 and Landsat-7/8 Images, and Google Earth Engine, Remote Sens., 13, 2510, https://doi.org/10.3390/rs13132510, 2021.
Peng, J., Loew, A., Zhang, S., Wang, J., and Niesel, J.: Spatial Downscaling of Satellite Soil Moisture Data Using a Vegetation Temperature Condition Index, IEEE T. Geosci. Remote, 54, 558–566, https://doi.org/10.1109/TGRS.2015.2462074, 2016.
Peng, J., Albergel, C., Balenzano, A., Brocca, L., Cartus, O., Cosh, M. H., Crow, W. T., Dabrowska-Zielinska, K., Dadson, S., Davidson, M. W. J., de Rosnay, P., Dorigo, W., Gruber, A., Hagemann, S., Hirschi, M., Kerr, Y. H., Lovergine, F., Mahecha, M. D., Marzahn, P., Mattia, F., Musial, J. P., Preuschmann, S., Reichle, R. H., Satalino, G., Silgram, M., van Bodegom, P. M., Verhoest, N. E. C., Wagner, W., Walker, J. P., Wegmüller, U., and Loew, A.: A roadmap for high-resolution satellite soil moisture applications – confronting product characteristics with user requirements, Remote Sens. Environ., 252, 112162, https://doi.org/10.1016/j.rse.2020.112162, 2021.
Piles, M., Sanchez, N., Vall-llossera, M., Camps, A., Martinez-Fernandez, J., Martinez, J., and Gonzalez-Gambau, V.: A Downscaling Approach for SMOS Land Observations: Evaluation of High-Resolution Soil Moisture Maps Over the Iberian Peninsula, IEEE J. Select. Top. Appl. Earth Obs. Remote Sens., 7, 3845–3857, https://doi.org/10.1109/JSTARS.2014.2325398, 2014.
Prakash, S., Mitra, A. K., Pai, D. S., and AghaKouchak, A.: From TRMM to GPM: How well can heavy rainfall be detected from space?, Adv. Water Resour., 88, 1–7, https://doi.org/10.1016/j.advwatres.2015.11.008, 2016.
Quiroz, R., Yarlequé, C., Posadas, A., Mares, V., and Immerzeel, W. W.: Improving daily rainfall estimation from NDVI using a wavelet transform, Environ. Model. Softw., 26, 201–209, https://doi.org/10.1016/j.envsoft.2010.07.006, 2011.
Rockel, B.: The regional downscaling approach: a brief history and recent advances, Curr. Clim. Change. Rep., 1, 22–29, https://doi.org/10.1007/s40641-014-0001-3, 2015.
Rozante, J. R., Gutierrez, E. R., Fernandes, A. d. A., and Vila, D. A.: Performance of precipitation products obtained from combinations of satellite and surface observations, Int. J. Remote Sens., 41, 7585–7604, https://doi.org/10.1080/01431161.2020.1763504, 2020.
Sabaghy, S., Walker, J. P., Renzullo, L. J., Akbar, R., Chan, S., Chaubell, J., Das, N., Dunbar, R. S., Entekhabi, D., Gevaert, A., Jackson, T. J., Loew, A., Merlin, O., Moghaddam, M., Peng, J., Peng, J., Piepmeier, J., Rüdiger, C., Stefan, V., Wu, X., Ye, N., and Yueh, S.: Comprehensive analysis of alternative downscaled soil moisture products, Remote Sens. Environ., 239, 111586, https://doi.org/10.1016/j.rse.2019.111586, 2020.
Salzmann, M.: Global warming without global mean precipitation increase?, Sci. Adv., 2, e1501572, https://doi.org/10.1126/sciadv.1501572, 2016.
Senanayake, I. P., Yeo, I. Y., Willgoose, G. R., and Hancock, G. R.: Disaggregating satellite soil moisture products based on soil thermal inertia: A comparison of a downscaling model built at two spatial scales, J. Hydrol., 594, 125894, https://doi.org/10.1016/j.jhydrol.2020.125894, 2021.
Seneviratne, S. I., Corti, T., Davin, E. L., Hirschi, M., Jaeger, E. B., Lehner, I., Orlowsky, B., and Teuling, A. J.: Investigating soil moisture–climate interactions in a changing climate: A review, Earth Sci. Rev., 99, 125–161, https://doi.org/10.1016/j.earscirev.2010.02.004, 2010.
Sheffield, J., Ferguson, C. R., Troy, T. J., Wood, E. F., and McCabe, M. F.: Closing the terrestrial water budget from satellite remote sensing, Geophys. Res. Lett., 36, L07403, https://doi.org/10.1029/2009GL037338, 2009.
Shen, Y., Xiong, A., Hong, Y., Yu, J., Pan, Y., Chen, Z., and Saharia, M.: Uncertainty analysis of five satellite-based precipitation products and evaluation of three optimally merged multi-algorithm products over the Tibetan Plateau, Int. J. Climatol., 35, 6843–6858, https://doi.org/10.1080/01431161.2014.960612, 2014.
Song, S., Brocca, L., Wang, W., and Cui, W.: Testing the potential of soil moisture observations to estimate rainfall in a soil tank experiment, J. Hydrol., 581, 124368, https://doi.org/10.1016/j.jhydrol.2019.124368, 2020.
Sorooshian, S., Hsu, K.-L., Gao, X., Gupta, H. V., Imam, B., and Braithwaite, D.: Evaluation of PERSIANN system satellite-based estimates of tropical rainfall, B. Am. Meteorol. Soc., 81, 2035–2046, https://doi.org/10.1175/1520-0477(2000)081<2035:EOPSSE>2.3.CO;2, 2000.
Spötl, C., Koltai, G., Jarosch, A., and Cheng, H.: Increased autumn and winter precipitation during the Last Glacial Maximum in the European Alps, Nat. Commun., 12, 1–9, https://doi.org/10.1038/s41467-021-22090-7, 2021.
Tagesson, T., Horion, S., Nieto, H., Zaldo Fornies, V., Mendiguren González, G., Bulgin, C. E., Ghent, D., and Fensholt, R.: Disaggregation of SMOS soil moisture over West Africa using the Temperature and Vegetation Dryness Index based on SEVIRI land surface parameters, Remote Sens. Environ., 206, 424–441, https://doi.org/10.1016/j.rse.2017.12.036, 2018.
Tang, G., Behrangi, A., Long, D., Li, C., and Hong, Y.: Accounting for spatiotemporal errors of gauges: A critical step to evaluate gridded precipitation products, J. Hydrol., 559, 294–306, https://doi.org/10.1016/j.jhydrol.2018.02.057, 2018.
Tang, J., Niu, X., Wang, S., Gao, H., Wang, X., and Wu, J.: Statistical downscaling and dynamical downscaling of regional climate in China: Present climate evaluations and future climate projections, J. Geophys. Res.-Atmos., 121, 2110–2129, https://doi.org/10.1002/2015JD023977, 2016.
Wackernagel, H.: Ordinary kriging, in: Multivariate geostatistics, Springer, 79–88, https://doi.org/10.1007/978-3-662-03098-1_11, 2003.
Wehbe, Y., Ghebreyesus, D., Temimi, M., Milewski, A., and Al Mandous, A.: Assessment of the consistency among global precipitation products over the United Arab Emirates, Hydrol. Reg. Stud., 12, 122–135, https://doi.org/10.1016/j.ejrh.2017.05.002, 2017.
Wehbe, Y., Temimi, M., and Adler, R. F.: Enhancing precipitation estimates through the fusion of weather radar, satellite retrievals, and surface parameters, Remote Sens., 12, 1342, https://doi.org/10.3390/rs12081342, 2020.
Wei, K., Ouyang, C., Duan, H., Li, Y., Chen, M., Ma, J., An, H., and Zhou, S.: Reflections on the Catastrophic 2020 Yangtze River Basin Flooding in Southern China, Innovation, 1, 100038, https://doi.org/10.1016/j.xinn.2020.100038, 2020.
Wen, F., Zhao, W., Wang, Q., and Sánchez, N.: A Value-Consistent Method for Downscaling SMAP Passive Soil Moisture With MODIS Products Using Self-Adaptive Window, IEEE T. Geosci. Remote, 58, 913–924, https://doi.org/10.1109/TGRS.2019.2941696, 2020.
Xia, T., Wang, Z.-J., and Zheng, H.: Topography and Data Mining Based Methods for Improving Satellite Precipitation in Mountainous Areas of China, Atmosphere, 6, 983–1005, https://doi.org/10.3390/atmos6080983, 2015.
Xu, J., Ma, Z., Yan, S., and Peng, J.: Do ERA5 and ERA5-land precipitation estimates outperform satellite-based precipitation products? A comprehensive comparison between state-of-the-art model-based and satellite-based precipitation products over mainland China, J. Hydrol., 605, 127353, https://doi.org/10.1016/j.jhydrol.2021.127353, 2022.
Xu, S., Wu, C., Wang, L., Gonsamo, A., Shen, Y., and Niu, Z.: A new satellite-based monthly precipitation downscaling algorithm with non-stationary relationship between precipitation and land surface characteristics, Remote Sens. Environ., 162, 119–140, https://doi.org/10.1016/j.rse.2015.02.024, 2015.
Yan, X., Chen, H., Tian, B., Sheng, S., and Kim, J. S.: A Downscaling–Merging Scheme for Improving Daily Spatial Precipitation Estimates Based on Random Forest and Cokriging, Remote Sens., 13, 2040, https://doi.org/10.3390/rs13112040, 2021.
Yang, X. and Huang, P.: Restored relationship between ENSO and Indian summer monsoon rainfall around 1999/2000, Innovation, 2, 100102, https://doi.org/10.1016/j.xinn.2021.100102, 2021.
Zambrano-Bigiarini, M., Nauditt, A., Birkel, C., Verbist, K., and Ribbe, L.: Temporal and spatial evaluation of satellite-based rainfall estimates across the complex topographical and climatic gradients of Chile, Hydrol. Earth Syst. Sci., 21, 1295–1320, https://doi.org/10.5194/hess-21-1295-2017, 2017.
Zeng, Z., Chen, H., Shi, Q., and Li, J.: Spatial Downscaling of IMERG Considering Vegetation Index Based on Adaptive Lag Phase, IEEE T. Geosci. Remote, 60, 4201415, https://doi.org/10.1109/TGRS.2021.3070417, 2021.
Zhan, C., Han, J., Hu, S., Liu, L., and Dong, Y.: Spatial Downscaling of GPM Annual and Monthly Precipitation Using Regression-Based Algorithms in a Mountainous Area, Adv. Meteorol., 2018, 1506017, https://doi.org/10.1155/2018/1506017, 2018.
Zhang, H., Ma, J., Chen, C., and Tian, X.: NDVI-Net: A fusion network for generating high-resolution normalized difference vegetation index in remote sensing, ISPRS J. Photogram. Remote Sens., 168, 182–196, https://doi.org/10.1016/j.isprsjprs.2020.08.010, 2020.
Zhang, L., Ren, D., Nan, Z., Wang, W., Zhao, Y., Zhao, Y., Ma, Q., and Wu, X.: Interpolated or satellite-based precipitation? Implications for hydrological modeling in a meso-scale mountainous watershed on the Qinghai-Tibet Plateau, J. Hydrol., 583, 124629, https://doi.org/10.1016/j.jhydrol.2020.124629, 2020.
Zhao, W., Sánchez, N., Lu, H., and Li, A.: A spatial downscaling approach for the SMAP passive surface soil moisture product using random forest regression, J. Hydrol., 563, 1009–1024, https://doi.org/10.1016/j.jhydrol.2018.06.081, 2018.
Zhao, W., Wen, F., Wang, Q., Sanchez, N., and Piles, M.: Seamless downscaling of the ESA CCI soil moisture data at the daily scale with MODIS land products, J. Hydrol., 603, 126930, https://doi.org/10.1016/j.jhydrol.2021.126930, 2021.