the Creative Commons Attribution 4.0 License.
the Creative Commons Attribution 4.0 License.
 | 05 Apr 2023
Hydrological response to climate change and human activities in the Three-River Source Region
Ting Su
Qingyun Duan
Jiaojiao Gou
Xiaoying Guo
Xi Zhao
The Three-River Source Region (TRSR), which is known as “China's Water Tower” and affects the water resources security of 700 million people living downstream, has experienced significant hydrological changes in the past few decades. In this work, we used an extended variable infiltration capacity (VIC) land surface hydrologic model (VIC-Glacier) coupled with the degree-day factor algorithm to simulate the runoff change in the TRSR during 1984–2018. VIC-Glacier performed well in the TRSR, with Nash–Sutcliffe efficiency (NSE) above 0.68, but it was sensitive to the quality of the limited ground-based precipitation. This was especially marked in the source region of the Yangtze River: when we used Precipitation Estimation from Remotely Sensed Information Using Artificial Neural Networks – Climate Data Record (PERSIANN-CDR), which has better spatial details, instead of ground-based precipitation, the NSE of Tuotuohe station increased from 0.31 to 0.86. Using the well-established VIC-Glacier model, we studied the contribution of each runoff component (rainfall, snowmelt, and glacier runoff) to the total runoff and the causes of changes in runoff. The results indicate that rainfall runoff contributed over 80 % of the total runoff, while snowmelt runoff and glacier runoff both contributed less than 10 % in 1984–2018. Climate change was the main reason for the increase in runoff in the TRSR after 2004, accounting for 75 %–89 %, except in the catchment monitored by Xialaxiu station. Among climate change factors, precipitation had the greatest impact on runoff. Finally, through a series of hypothetical climate change scenario experiments, we found that a future simultaneous increase in precipitation and temperature would increase the total runoff, rainfall runoff, and glacier runoff. The snowmelt runoff might remain unchanged because the increased precipitation, even with seasonal fluctuations, was basically completely compensated for by the decreased solid-to-liquid precipitation ratio. These findings improve our understanding of hydrological processes and provide insights for policy-makers on how to optimally allocate water resources and manage the TRSR in response to global climate change.
- Article
(5729 KB) - Full-text XML
-
Supplement
(9404 KB) - BibTeX
- EndNote


Known as the “Asian Water Tower” (Immerzeel et al., 2010) and the “Third Pole” (Qiu, 2008), the Qinghai–Tibet Plateau (QTP) is the source of many large Asian rivers (e.g., the Yellow, Yangtze, Salween, Mekong, Ganges, Indus, and Yarlung Zangbo rivers) (Cuo et al., 2019), and it supports diverse ecosystems and affects the survival and development of more than one billion people living downstream (Qiu, 2008). The QTP is also the largest repository of glaciers, snow, and frozen soil outside of the Arctic and Antarctic, and it is extremely sensitive to climate change (Yao, 2019; Gao et al., 2019; L. Wang et al., 202). In recent decades, the temperature of the QTP has risen significantly, with the warming rate double the global average level in the same period, and the precipitation has also increased overall (Yao, 2019; Xu et al., 2008). As its climate has become warmer and wetter, the QTP's hydrological cycling has been correspondingly enhanced in terms of glacier retreat (Gao et al., 2019; Zhu et al., 2022), snowpack reduction (Huang et al., 2017), permafrost degradation (Cuo et al., 2015; Liu et al., 2020), and lake expansion (G. Zhang et al., 2017; Liu et al., 2020), and these changes are expected to intensify under future continued warming (Immerzeel et al., 2013). Hydrological models have been widely used to study the runoff response to climate changes in basins of the QTP (Lutz et al., 2014; Su et al., 2016; Zhang et al., 2013). Y. Wang et al. (2021), using the variable infiltration capacity (VIC) land surface hydrologic model linked with the degree-day factor algorithm (VIC-Glacier), reported that the total runoff of the QTP showed an increasing trend during 1984–2015, and the glacier runoff in the south increased rapidly at a rate of 6 mm a−1. Zhang et al. (2013) applied the VIC-Glacier model to quantify the proportion of rainfall, snowmelt, and glacier runoff in six major basins of the QTP during 1961–2009. On the basis of the work of Zhang et al. (2013), Su et al. (2016) applied the same VIC-Glacier model to determine that the total runoff of QTP's six basins in 2041–2070 will increase by 2.7 %–22.4 % relative to 1971–2000 due to increased rainfall runoff in the upstream of the Yellow, Yangtze, Salween, and Mekong rivers and increased glacier meltwater of the upper Indus. However, some studies have shown that the rapid retreat of glaciers caused by climate warming would eventually reduce the water supply in the glaciated regions (Zhao et al., 2019; Barnett et al., 2005). All these changes increase the uncertainty of regional water resources simulation and prediction, thus posing great challenges to the scientific management and rational distribution of water resources.
Located in the hinterland of the QTP (D. Liu et al., 2017), the Three-River Source Region (TRSR) contains the headwaters of the Yellow, Yangtze, and Lancang rivers and is known as “China's Water Tower” (Ji and Yuan, 2018a). Approximately 49 %, 20 %, and 15 % of the total water volume of the Yellow, Yangtze, and Lancang rivers, respectively, is provided by the TRSR (Cao and Pan, 2014). Thus, the TRSR plays an extremely important role in water resources security and ecological and environmental protection in China and even all of Southeast Asia (Zhang et al., 2019). As in the QTP, during the past few decades the climate has changed in the TRSR, with precipitation and temperature, respectively, increasing at rates of 6.653– and (Cai et al., 2022; Meng et al., 2020). These changes, coupled with intensive human activities, especially the ecological restoration and protection projects initiated by the Chinese government in this century (L. Zhang et al., 2017; D. Liu et al., 2017), have led to changes in runoff. These are, mainly, significantly increased runoff in the source regions of the Yangtze and Lancang rivers and a weak downward trend in the source region of the Yellow River in the past few decades (Meng et al., 2020; Zhou and Huang, 2012). Most researchers have attributed the increased runoff in the source regions of the Yangtze and Lancang rivers to climate change, with its contribution exceeding 90 % (Jiang et al., 2016; Ahmed et al., 2021), but why runoff has declined at the source of the Yellow River is a subject of dispute. Zheng et al. (2009) and Feng et al. (2017) found that land use change has played a more important role in reducing runoff in the source region of the Yellow River, while others have reported that 86 % of the runoff reduction could be attributed to climate change, including natural and anthropogenic climate change (Ji and Yuan, 2018b). Most of these studies have focused on the overall impact of climate change and have not examined the possible influence of specific and single climatic variables (e.g., precipitation and temperature) on runoff. And because they only selected one or a few hydrological stations in each source region, the spatial heterogeneity of runoff change in response to multiple factors was not well considered. Therefore, we need to study the causes of changes in runoff across the entire TRSR in more detail.
Meltwater from cryosphere elements such as glaciers and snow is an important source of runoff in the TRSR (Han et al., 2019; Meng et al., 2020). Accurate observation or simulation of snow/glacier meltwater is crucial in understanding the hydrological cycle and managing water resources. However, few distributed hydrologic models have been specifically designed for alpine regions and to consider the complexity of runoff generation (Zhao et al., 2012; Yang et al., 2012), and the existing hydrologic models mostly ignore glacial melting (Zhao et al., 2012; Shangguan et al., 2015; Zhang et al., 2013). In addition, the inclusion of meteorological forcings, especially precipitation, is essential for reliable hydrological simulation (X. Liu et al., 2017; Sun and Su, 2020). Because of the high altitude and complicated terrain and the high cost of establishing and maintaining meteorological stations in the harsh environment, such stations are sparse, and therefore the limited rain-gauge interpolation data they provide may not accurately reflect the distribution of precipitation, which displays great temporal and spatial variability in the TRSR (Sun and Su, 2020; Ji and Yuan, 2018a). Some of these stations also lack long-term flow observation records (L. Wang et al., 2021), making the hydrological modeling of these regions more difficult. Although published studies have provided some insights into the separate components of runoff in the TRSR, no consistent conclusion has been reached. For example, Zhang et al. (2013) estimated that in the source region of the Yangtze River, snowmelt runoff and glacier runoff, respectively, accounted for 22.2 % and 6.5 % of the total runoff during 1961–2009, while Han et al. (2019) found that these two together accounted for only about 12 % in 2003–2014. In the source region of the Yellow River, the total proportion of glacier and snowmelt runoff also varied from 17 % to 23.2 % in different periods (Y. Wang et al., 2021; Zhang et al., 2013, 2022). These discrepancies lead us to conclude that there is still a lack of systematic research on the contributions of specific runoff components over the TRSR. To better understand the impact of future climate change on runoff, hydrologic models driven by hypothetical climate change scenarios or climate model projections have long been commonly used to evaluate the hydrological consequences of climate change (Su et al., 2016). To date, however, insufficient attention has been given to developing a comprehensive understanding of the TRSR.
In this study, we used the VIC land surface hydrologic model linked with the degree-day factor algorithm to simulate the runoff change in the TRSR, aiming to address the following objectives: (1) quantify the runoff components (rainfall runoff, snowmelt runoff, and glacier runoff) in the TRSR. (2) Separate the impacts of climate change and human activities on runoff change. (3) Analyze the responses of total runoff and runoff components under the hypothetical climate change scenarios. We expect the results will help to guide current and future regulation and management of water resources in the TRSR.
2.1 Study area
The TRSR (30–36∘ N, 90–104∘ E) is located in the hinterland of the QTP, with an altitude ranging from 2677 to 6575 m (Fig. 1). It contains the headwaters of the Yangtze, Yellow, and Lancang rivers, covering an area of approximately 36.1×10⁴ km2 (Ji et al., 2020). The TRSR's climate is a typical plateau continental climate, characterized by low temperatures, strong radiation, and no obvious distinction between four seasons (Tong et al., 2010). During 1981–2010, the annual mean precipitation was 593 mm, and the annual mean temperature was 1.9 ∘C on the TRSR (Luo et al., 2017), which both generally decreased from southeast to northwest (Deng and Zhang, 2018). Approximately 75 % of total annual precipitation occurs from June to September, and the temperature is always highest during this period (Fig. S1 in the Supplement). The average annual runoff within the TRSR is about 47.5×10⁹ m3. Glaciers are widely distributed in the TRSR, with about 1700 glaciers covering an area of about 2300 km2 in all.
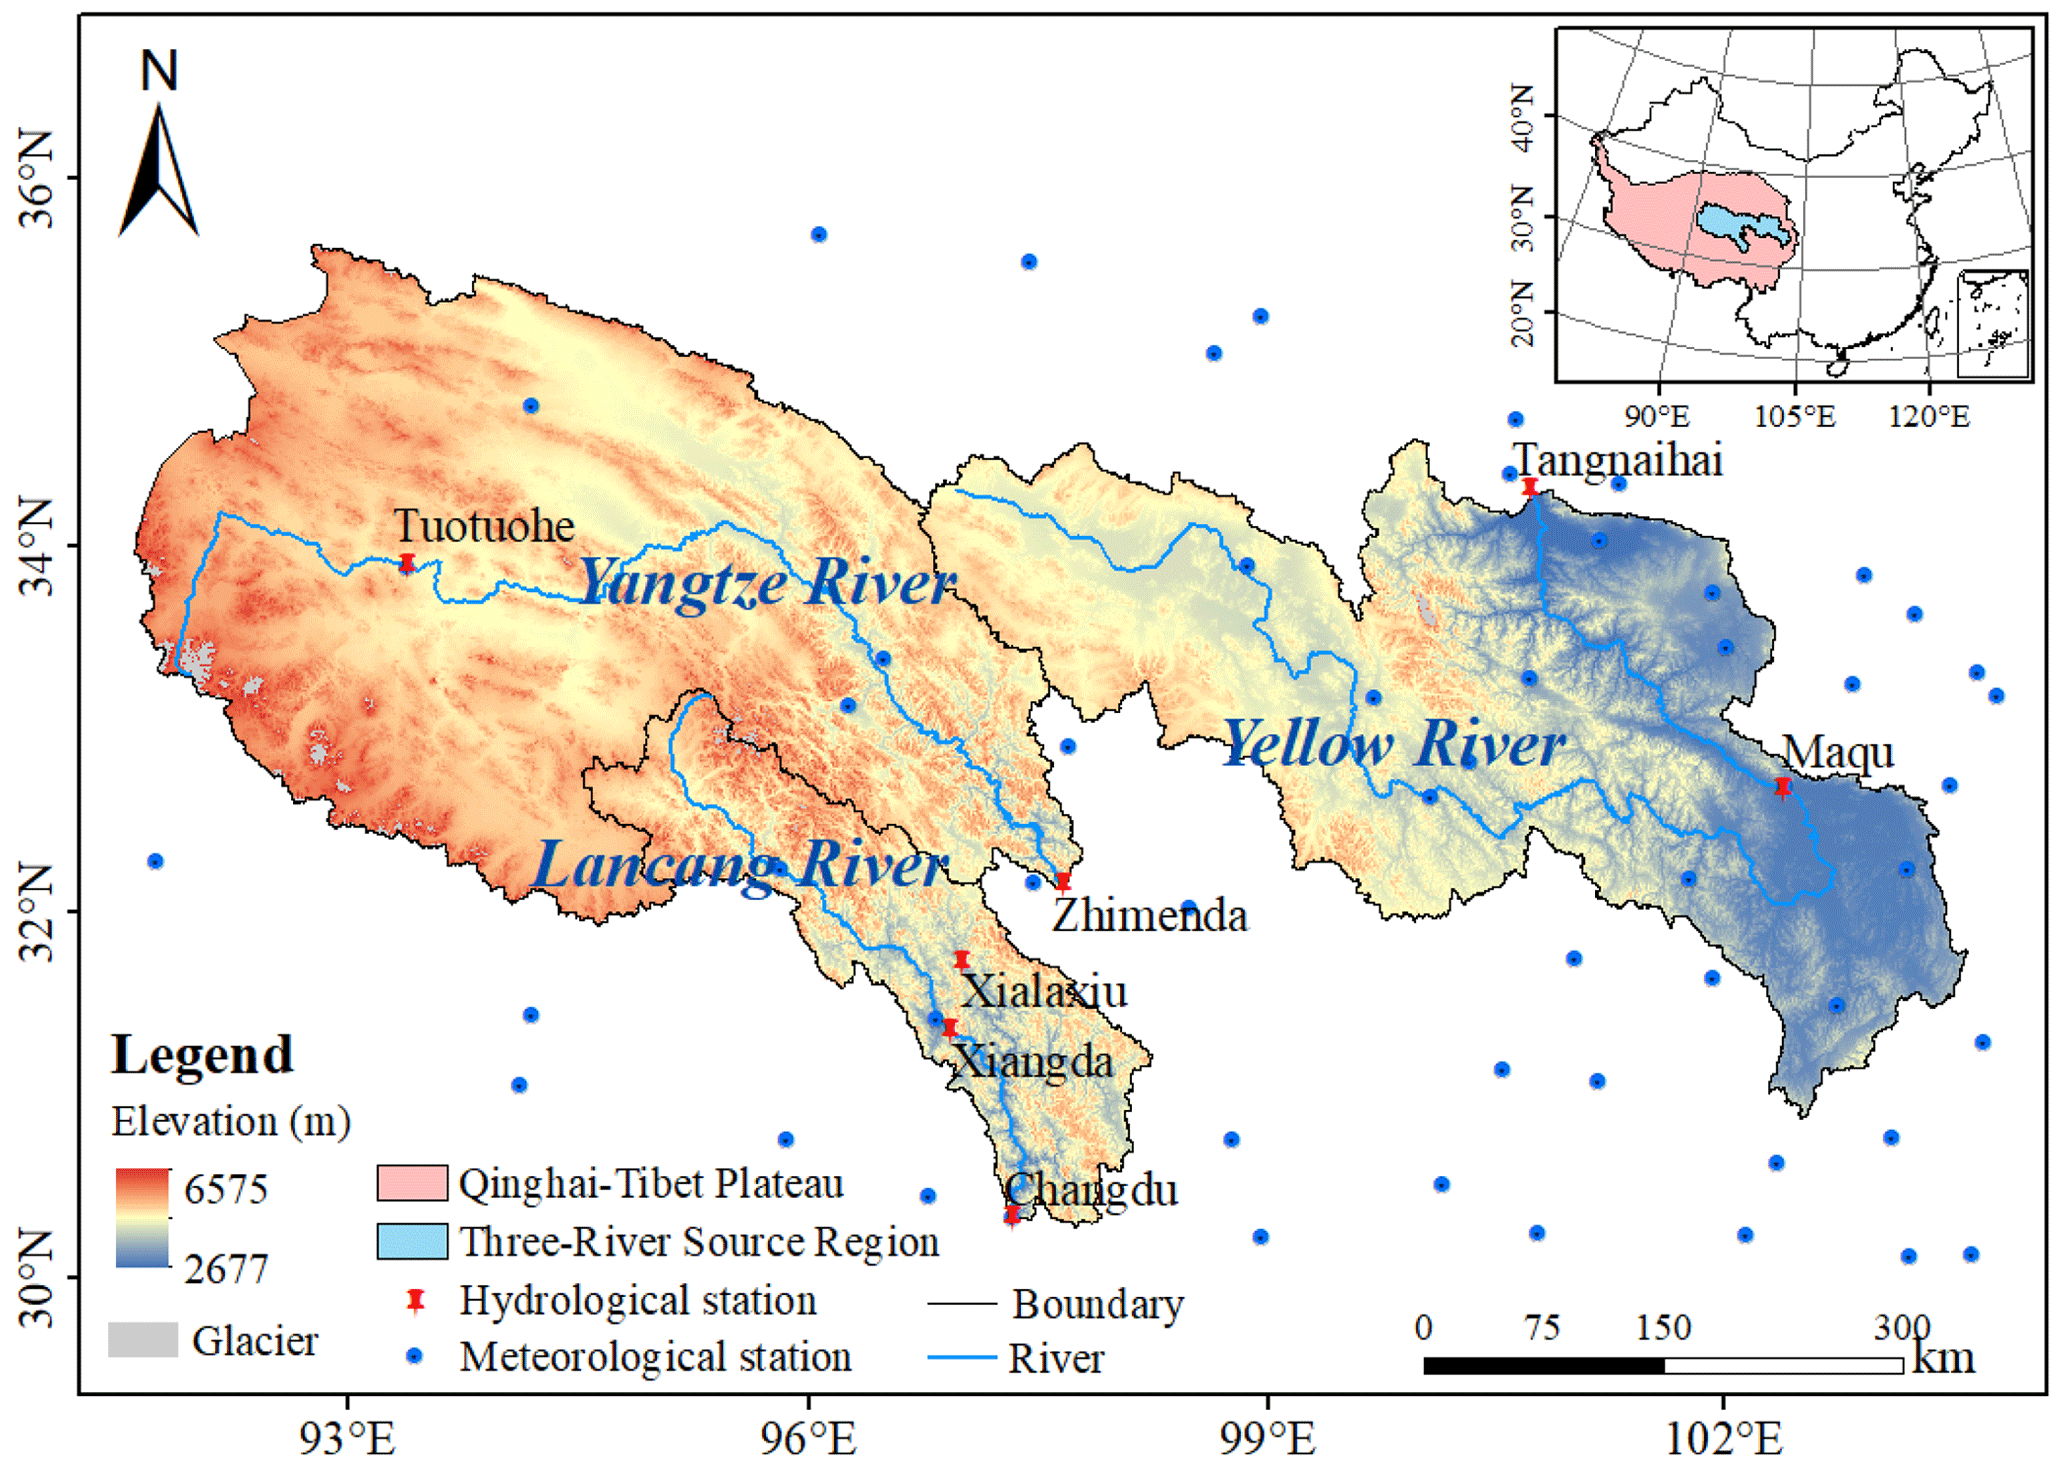
Figure 1Topography of the Three-River Source Region; distribution of glaciers; and the locations of meteorological and hydrological stations, basin boundaries, and river courses of the Yellow, Yangtze, and Lancang.
2.2 Data sources
Three kinds of data were included in this study, namely, meteorological forcing data, land surface characteristic data, and runoff data. The meteorological forcing data – including daily precipitation; wind speed; and maximum, minimum, and mean temperatures from 1983 to 2018 – were obtained from the China Meteorological Administration (CMA) (http://data.cma.cn, last access: 3 April 2023). Most weather stations are located in the south and southeast of the TRSR, with very few in the central and western regions (Fig. 1). For the Yangtze River source region, the interpolated precipitation based on CMA rain gauges (hereinafter called CMA precipitation) cannot capture the spatial details well (X. Liu et al., 2017; Xue et al., 2013). Therefore, in this subregion, we also used Precipitation Estimation from Remotely Sensed Information Using Artificial Neural Networks – Climate Data Record (PERSIANN-CDR) (https://www.ncei.noaa.gov/products/climate-data-records/precipitation-persiann, last access: 3 April 2023), which has the advantages of high spatial () and temporal (daily) resolution, long time span (more than 35 years since 1983, and the data range is constantly updated), and more complete coverage (Ashouri et al., 2015). Previous studies have also confirmed that PERSIANN-CDR is a high-quality precipitation data set applicable to the source region of the Yangtze River (X. Liu et al., 2017; Y. Wang et al., 2021).
The soil texture data came from the global 5 arcmin data set of the Food and Agriculture Organization of the United Nations (FAO), and the vegetation types were provided by the global 1 km land cover classification database produced by the University of Maryland (http://prettymap.mooncoder.com/maps/metadata/data.html, last access: 3 April 2023). The Shuttle Radar Topography Mission (SRTM) digital elevation data set with a resolution of 90 m was obtained from the Geospatial Data Cloud (http://www.gscloud.cn/search, last access: 3 April 2023). Glacier area data were from TPG1976 generated by Ye et al. (2017). This data set was specially compiled for the QTP based on Landsat satellite images from the mid-1970s, among which most images were acquired from 1976, and SRTM digital elevation models (DEM v4.1) and Google Earth imagery. We assumed that the glacier area around the source of the Yellow River was 0 km2 due to its proportion of the whole area and contribution to total runoff being minor (Y. Wang et al., 2021; Zhang et al., 2013).
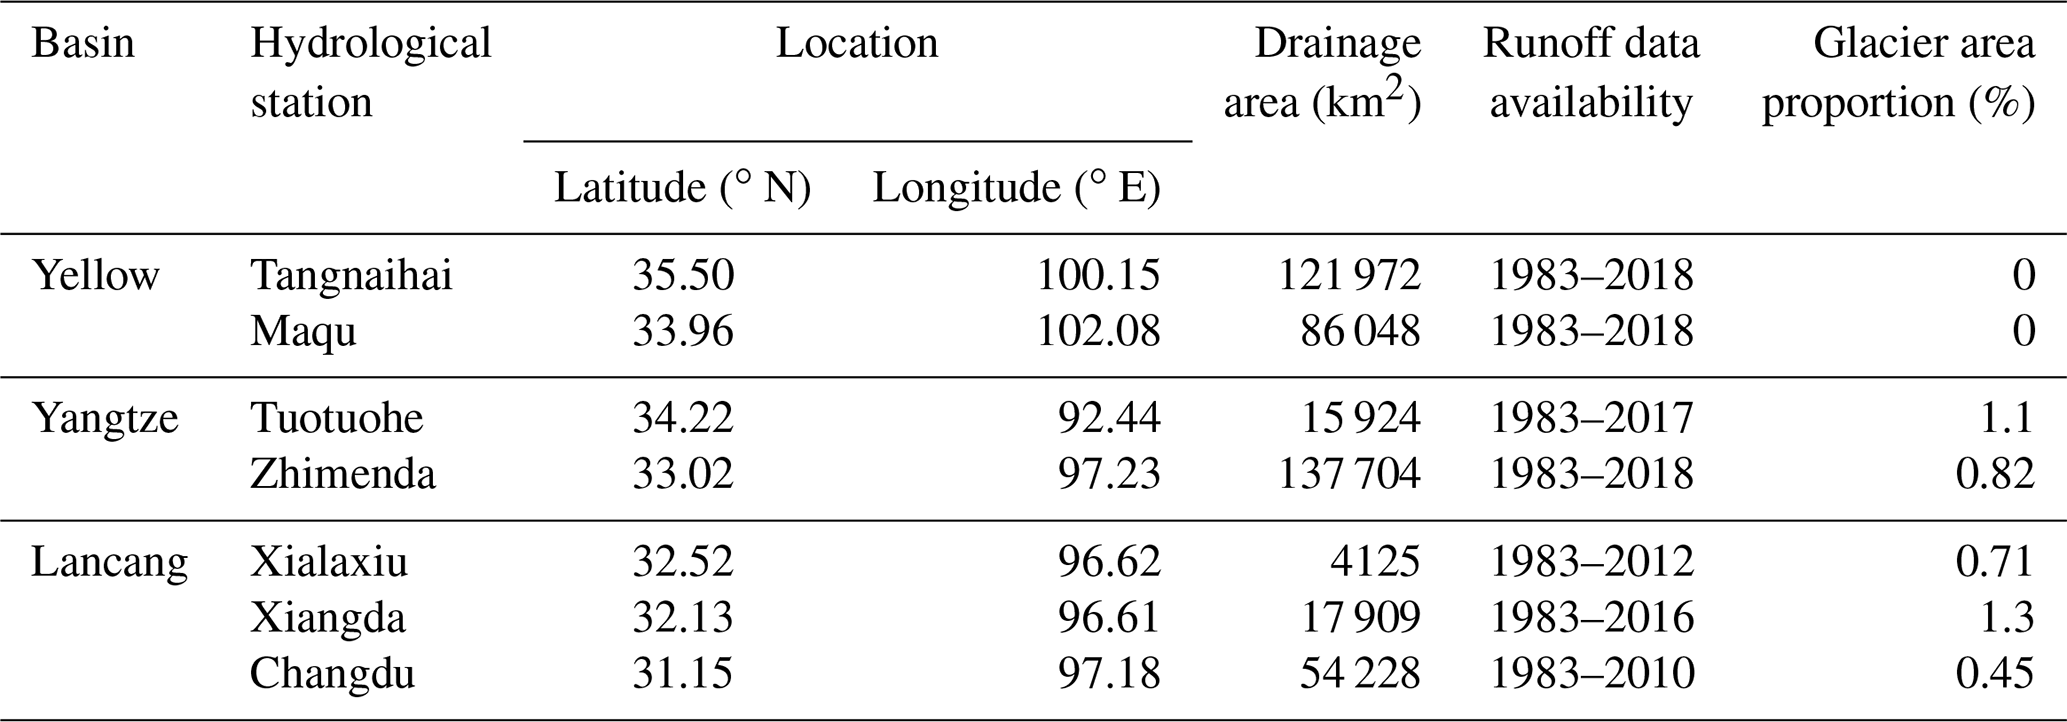
Monthly runoff observation data were from the corresponding hydrological stations. The details of the time ranges of the available data are shown in Table 1. It should be noted that there was no observed runoff from November to April at Tuotuohe station and that, in this study, we treated the runoff in these months as 0 because the runoff was negligible (Ahmed et al., 2020; Luo et al., 2019).
Table 1Characteristics of seven sub-basins in the Three-River Source Region.
2.3 Methods
2.3.1 VIC-Glacier model implementation
The VIC model is a large-scale, distributed land surface hydrologic model (Liang et al., 1994), and it can be used to simulate the balance of surface water and energy within each grid cell at daily or sub-daily time steps (Liang et al., 1996). The critical elements of this model that are particularly relevant to its application in cold regions include (1) a two-layer energy-balance model that simulates accumulation and melt of ground snow and a simplified single-layer model of the ground snowpack energy balance that simulates melt, sublimation, drip, and release of intercepted snow from the canopy (Cherkauer and Lettenmaier, 1999, 2003; Storck and Lettenmaier, 1999), and (2) a frozen soil algorithm that calculates the soil ice contents within each vegetation type and the effects of frozen soil on infiltration and runoff (Cherkauer and Lettenmaier, 1999, 2003). The VIC model divides the soil column of each grid cell into three layers. The surface runoff generated from the upper two soil layers is simulated based on the variable soil moisture capacity curve and the base flow generated from the third layer based on the nonlinear ARNO model (Todini, 1996). Surface runoff and base flow in each grid cell are eventually routed to a specific watershed outlet by the Lohmann routing module (Lohmann et al., 1996). However, the VIC model does not take glacier hydrological processes into account (Zhang et al., 2013). Therefore, in this study, we coupled the degree-day factor algorithm (Hock, 2003) to the VIC model to simulate the contribution of glacier runoff to total runoff; the extended model is called VIC-Glacier. It is very important to define runoff components clearly (He et al., 2021). In this study, the runoff component is defined as the proportion of each component in the streamflow, and the total runoff is divided into three components: glacier, rainfall, and snowmelt runoff. Glacier runoff represents the sum of glacier meltwater and rainfall from glacier area (Y. Wang et al., 2021). Rainfall runoff represents the runoff induced by rainfall, and snowmelt runoff represents the runoff induced by snow melting. We ran the VIC-Glacier model with a 24 h time step at 0.25∘ spatial resolution for a period of 36 years (1983–2018) and set a 1-year warm-up period to get the ideal initial state. The total runoff and runoff components of each grid cell can be calculated as
where Ri is the total runoff (mm) of grid cell i, Rvic,i is the runoff (mm) of grid cell i calculated by the original VIC model, Gi is the glacier runoff (mm), fi is the glacier area fraction (%) of grid cell i, and Rrainfall,i and Rsnowmelt,i are the rainfall runoff (mm) and snowmelt runoff (mm) of grid cell i, respectively. The Gi can be calculated as
where Pi is the rainfall (mm) of grid cell i, Mi is the glacier meltwater (mm) in grid cell i, DDF is the degree-day factor for glaciers () directly taken from Zhang et al. (2006), and Ti is the average daily temperature (∘C) of the glacier surface, and we adjust the temperature of the glacier area in each grid cell using the rate of temperature decrease (0.65 ∘C per 100 m).
Glacier volume affects the amount of melting ice. In this study, we used glacier volume to determine the maximum annual amount of ice melting (Liu et al., 2003), and the glacier volume was derived from the volume–area scaling relation (Bahr et al., 1997; Radic et al., 2008):
where V is the glacier volume (km3), and S is the glacier area (km2). The initial glacier volume of each grid cell was determined using the glacier area from the glacier distribution data set. After that, the volume was updated every year, and the updated glacier area was determined from the updated glacier volume using the inversion equation of Eq. (5). This process was repeated throughout the VIC-Glacier simulation until the glaciers were completely melted.
2.3.2 VIC-Glacier model optimization and calibration
Parameter optimization enables model simulations to be consistent with the corresponding observations (Gupta et al., 1999). In this study, we considered 13 tunable runoff-related parameters (Table S1 in the Supplement) and used an automatic calibration framework that combines sensitivity analysis and an adaptive surrogate modeling-based optimization algorithm (Gou et al., 2020, 2021) to calibrate the parameters during the calibration period (1984–1993). The Nash–Sutcliffe efficiency coefficient (NSE) was used as an objective function to describe the degree of matching between the simulated and observed values, and the model was considered to have performed well when the NSE was greater than 0.65. Next, Pearson's correlation coefficient (R) and relative error (RE) were calculated to evaluate the simulation performance:
where n is the number of monthly runoff series, Robs,i and Rsim,i represent the observed and simulated runoff (mm) of the ith month, and and represent the average of observed and simulated values (mm), respectively. The closer the values of NSE and R are to 1, and the closer the value of RE is to 0, the better the simulation results are.
The optimized parameters were then applied to the validation period (1994–2003) to verify whether the model was suitable for the study area using the above-mentioned three indicators.
2.3.3 Attribution analysis
Ecological restoration is the dominant anthropogenic interference with TRSR in recent decades (Feng et al., 2017). The Chinese government classified TRSR as a national nature reserve in 2003, and in 2005, the government invested CNY 7.5 billion to carry out an ecological protection project (Ma et al., 2021; Zhai et al., 2021). These measures suggest that disturbance by human activities in the TRSR increased notably around 2003. In view of this, we regard 1984–2003 as our reference period, with less human activity, while the period after 2004 is taken as the changed period (2004–), with a greater effect of human activities on runoff. The observed change in runoff between these two periods reflects the joint influence of climate change and human activities. It can be specifically expressed as follows:
where ΔRtotal (mm) indicates the observed change in mean annual runoff between these two periods; Rcobs (mm) and Rrobs (mm) are the average annual observed runoff in the changed period and the reference period, respectively; and ΔRclimate (mm) and ΔRhuman (mm) are the changes in runoff caused by climate change and human activities, respectively.
The difference between the observed and natural runoff in the changed period reflects the impact of human activities. The change in natural runoff between these two periods reflects the response to climate change, which can be further divided into precipitation-induced change, temperature-induced change, and change induced by the interactions of climatic variables:
where Rcsim (mm) and Rrsim (mm) are the simulated average annual runoff in the changed period and the reference period, respectively, and ε is the residual error, which may be related to factors not considered in this study, such as model simulation error and observational error, including climatic forcing data or observed runoff. We assume that the residual errors for these two periods are the same. ΔRP (mm) and ΔRT (mm) represent the changes in runoff caused by precipitation change and temperature change, respectively. Due to the complex interactions of climatic factors in hydrological processes, as well as the fact that the influence of wind speed on runoff change was not discriminated, in this study we recorded the runoff change caused by climatic interactions and wind as ΔRclimate_interactive (mm). ΔRP and ΔRT can be calculated as follows:
where (mm) and (mm) respectively represent the simulated runoff, which changes only precipitation or temperature to match the level in the changed period. Therefore, the percentage contribution of each factor to runoff change can be expressed as follows:
where ωP (%), ωT (%), ωclimate_interactive (%), and ωhuman (%), respectively, represent the percentage contributions of precipitation change, temperature change, interactions of climatic variables, and human activity to runoff change.
2.3.4 Hypothesized climate change scenarios
According to the projected change range of future climatic variables (Hoegh-Guldberg et al., 2019; Zhang et al., 2022), we set four temperature change scenarios (T±0.5 ∘C and T±1 ∘C) and four precipitation change scenarios (P±10 % and P±20 %) relative to the temperature and precipitation during the period 1984–2018 to analyze the responses to climate change of total runoff and runoff components. To study the combined effect of simultaneous changes in precipitation and temperature on runoff, the following four extreme combination scenarios were specifically analyzed: scenario S1 (P−20 %, T−1 ∘C), scenario S2 (P−20 %, T+1 ∘C), scenario S3 (P+20 %, T−1 ∘C), and scenario S4 (P+20 %, T+1 ∘C).
3.1 Runoff simulation
Figure 2 shows the simulated and observed monthly runoff of the seven stations and summarizes the model's performance. In general, the model achieved reasonably satisfactory results, with the NSE exceeding 0.68 at all stations. But there still existed a certain degree of discrepancy between simulations and observations in some years for some stations, such as when the simulation slightly overestimated runoff peaks at Zhimenda station in the validation period, while it underestimated Changdu and Xialaxiu stations' lowest runoff in both the calibration and validation periods. Uncertainty arising from model parameters and inferred runoff may have caused these discrepancies, but the most likely and important reason may be the over-/underestimation of precipitation forcing (Miao et al., 2022; Su et al., 2016).
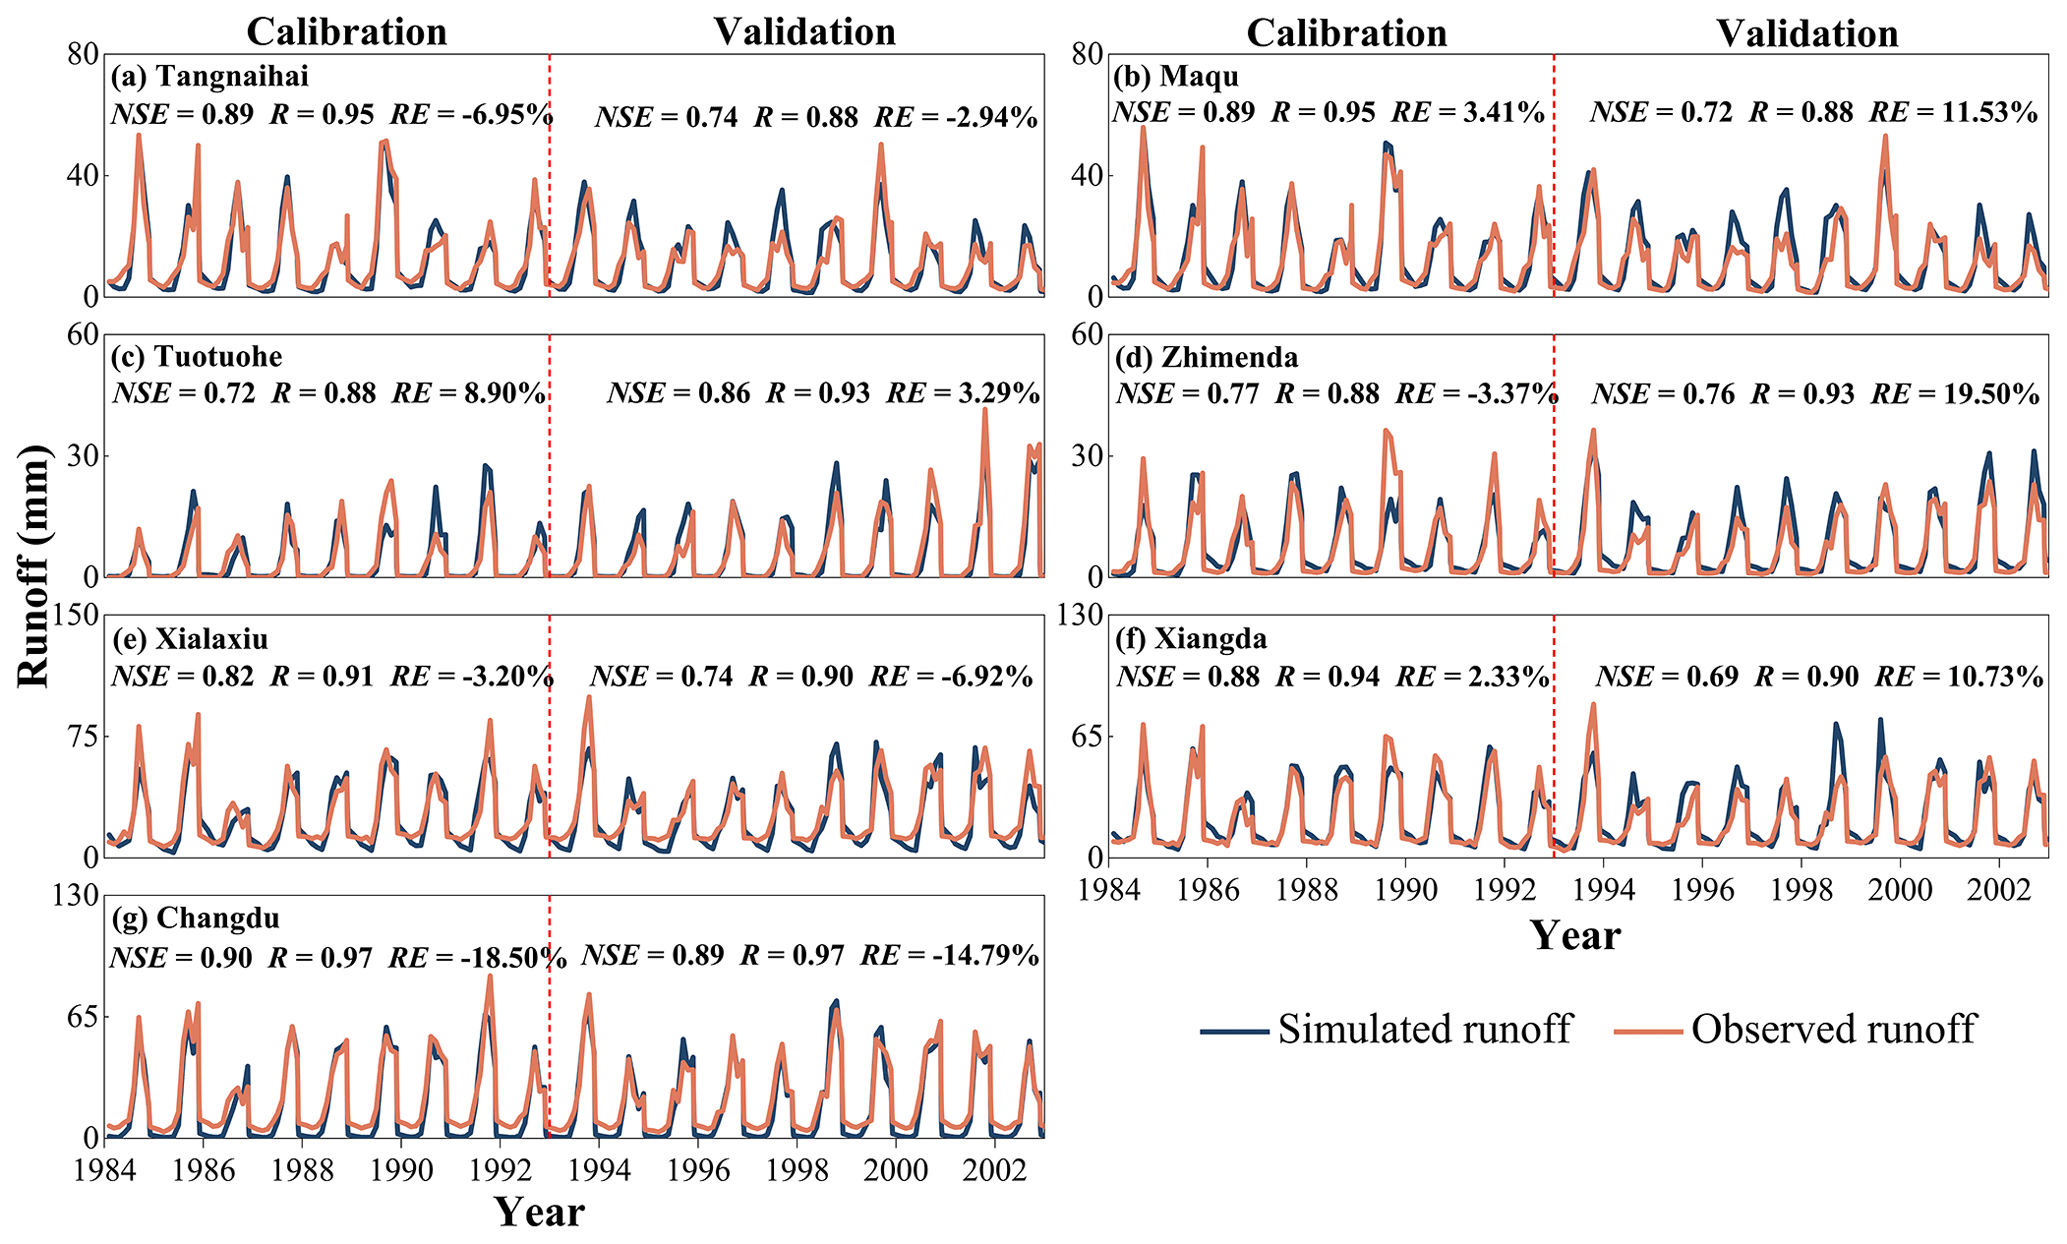
Figure 2Observed and simulated monthly runoff at the seven stations (a–g) during the calibration period (1984–1993) and validation period (1994–2003).
Accurate precipitation input is a prerequisite for obtaining reasonable model parameters and simulation results (Zhang et al., 2013; Chen et al., 2017). Figure 3 compares the simulation results for monthly runoff driven by CMA precipitation and PERSIANN-CDR precipitation at Tuotuohe and Zhimenda stations in the source area of the Yangtze River, where meteorological stations are extremely sparse (Fig. 1). The CMA-precipitation-driven model exhibited poor performance even after parameter optimization, except for at Zhimenda station during the calibration period. In contrast, taking NSE as an example, and in comparison with the result obtained using CMA precipitation, the NSE of Tuotuohe station increased from 0.31 to 0.86 when PERSIANN-CDR precipitation was used during the validation period. Such a large improvement indicates that the PERSIANN-CDR precipitation, which describes the spatial variation of precipitation more accurately than the CMA precipitation obtained through very limited rain-gauge interpolation in the source area of the Yangtze River (X. Liu et al., 2017; Bai and Liu, 2018), can be used as input for the model to generate more accurate runoff. This sheds light on the importance of precipitation to hydrological research and the prospect of using PERSIANN-CDR precipitation products in alpine regions with sparse meteorological stations (X. Liu et al., 2017). Because the model with CMA precipitation as input performed well in the source regions of the Yellow River and the Lancang River, there was no experiment using PERSIANN-CDR precipitation in these two headwater subregions.
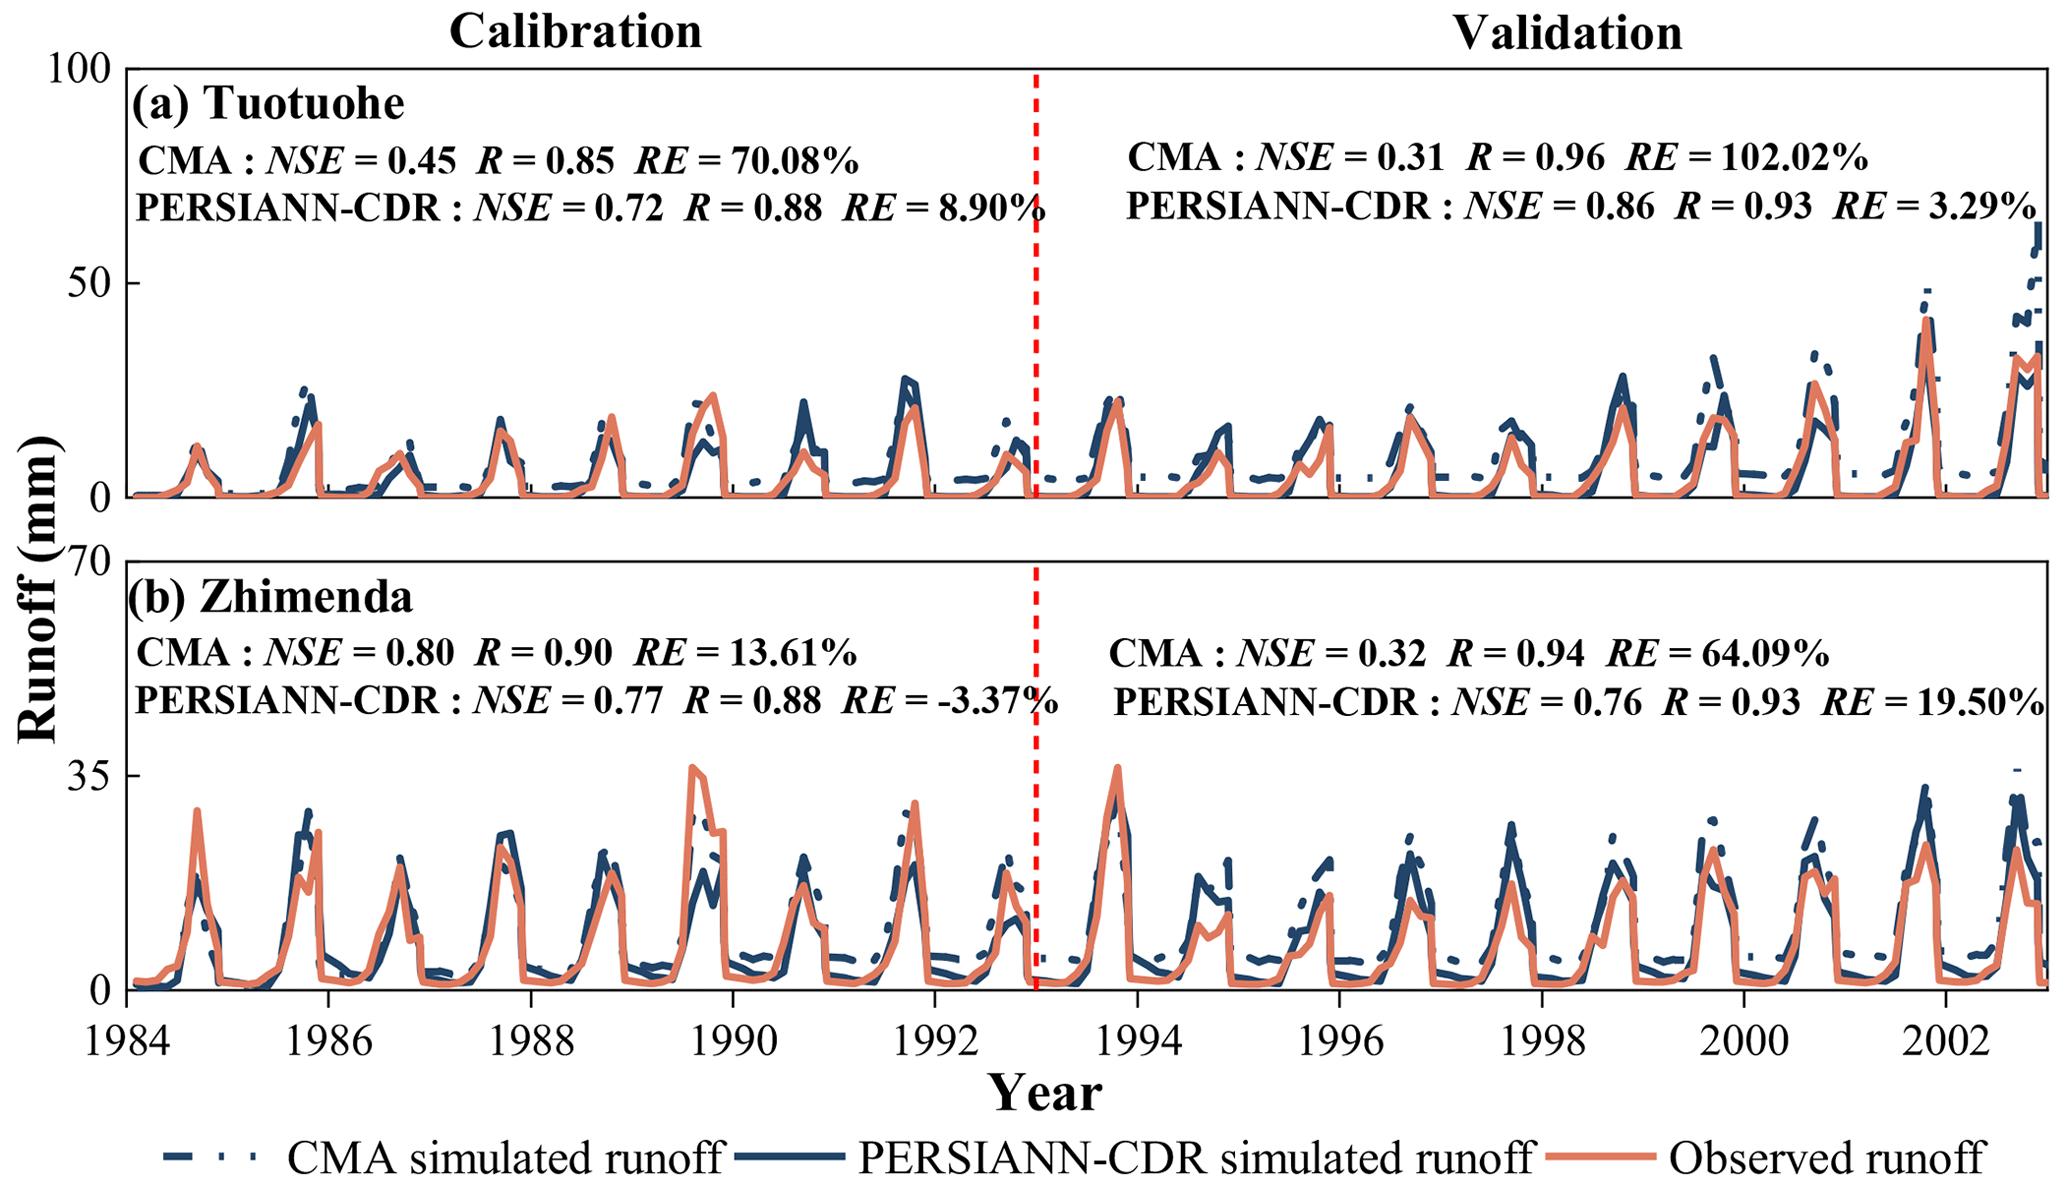
Figure 3Comparison of simulated monthly runoff based on CMA precipitation and PERSIANN-CDR precipitation during the calibration period (1984–1993) and validation period (1994–2003) for (a) Tuotuohe station and (b) Zhimenda station.
3.2 Runoff component decomposition
Figure 4 shows the contributions of rainfall, snowmelt, and glacier runoff to the total annual runoff at the seven stations for 1984–2018. We found that rainfall runoff was the main component of runoff, accounting for 82 %–92 %, whereas snowmelt and glacier runoff both accounted for less than 10 %, due to low temperatures and small glaciers (Table 1). Our current results are similar to the previous finding that snowmelt runoff and glacier runoff both make up a small proportion of the total runoff in the TRSR, but note that the specific values of their contributions to runoff differed among these studies. Y. Wang et al. (2021) found that during 1984–2015, snowmelt runoff contributed 15 % to the total runoff at Zhimenda station. This estimate is higher than the 8.9 % contribution in 1984–2018 estimated by our current work and the 7 % contribution in 2003–2014 estimated by Han et al. (2019). The discrepancies among these results may be attributed to differences specific to the research periods, but various choices of forcing input data, model parameters, and definitions of snowmelt runoff and glacier runoff should be more important factors (Y. Wang et al., 2021; Zhao et al., 2019; Sun and Su, 2020).
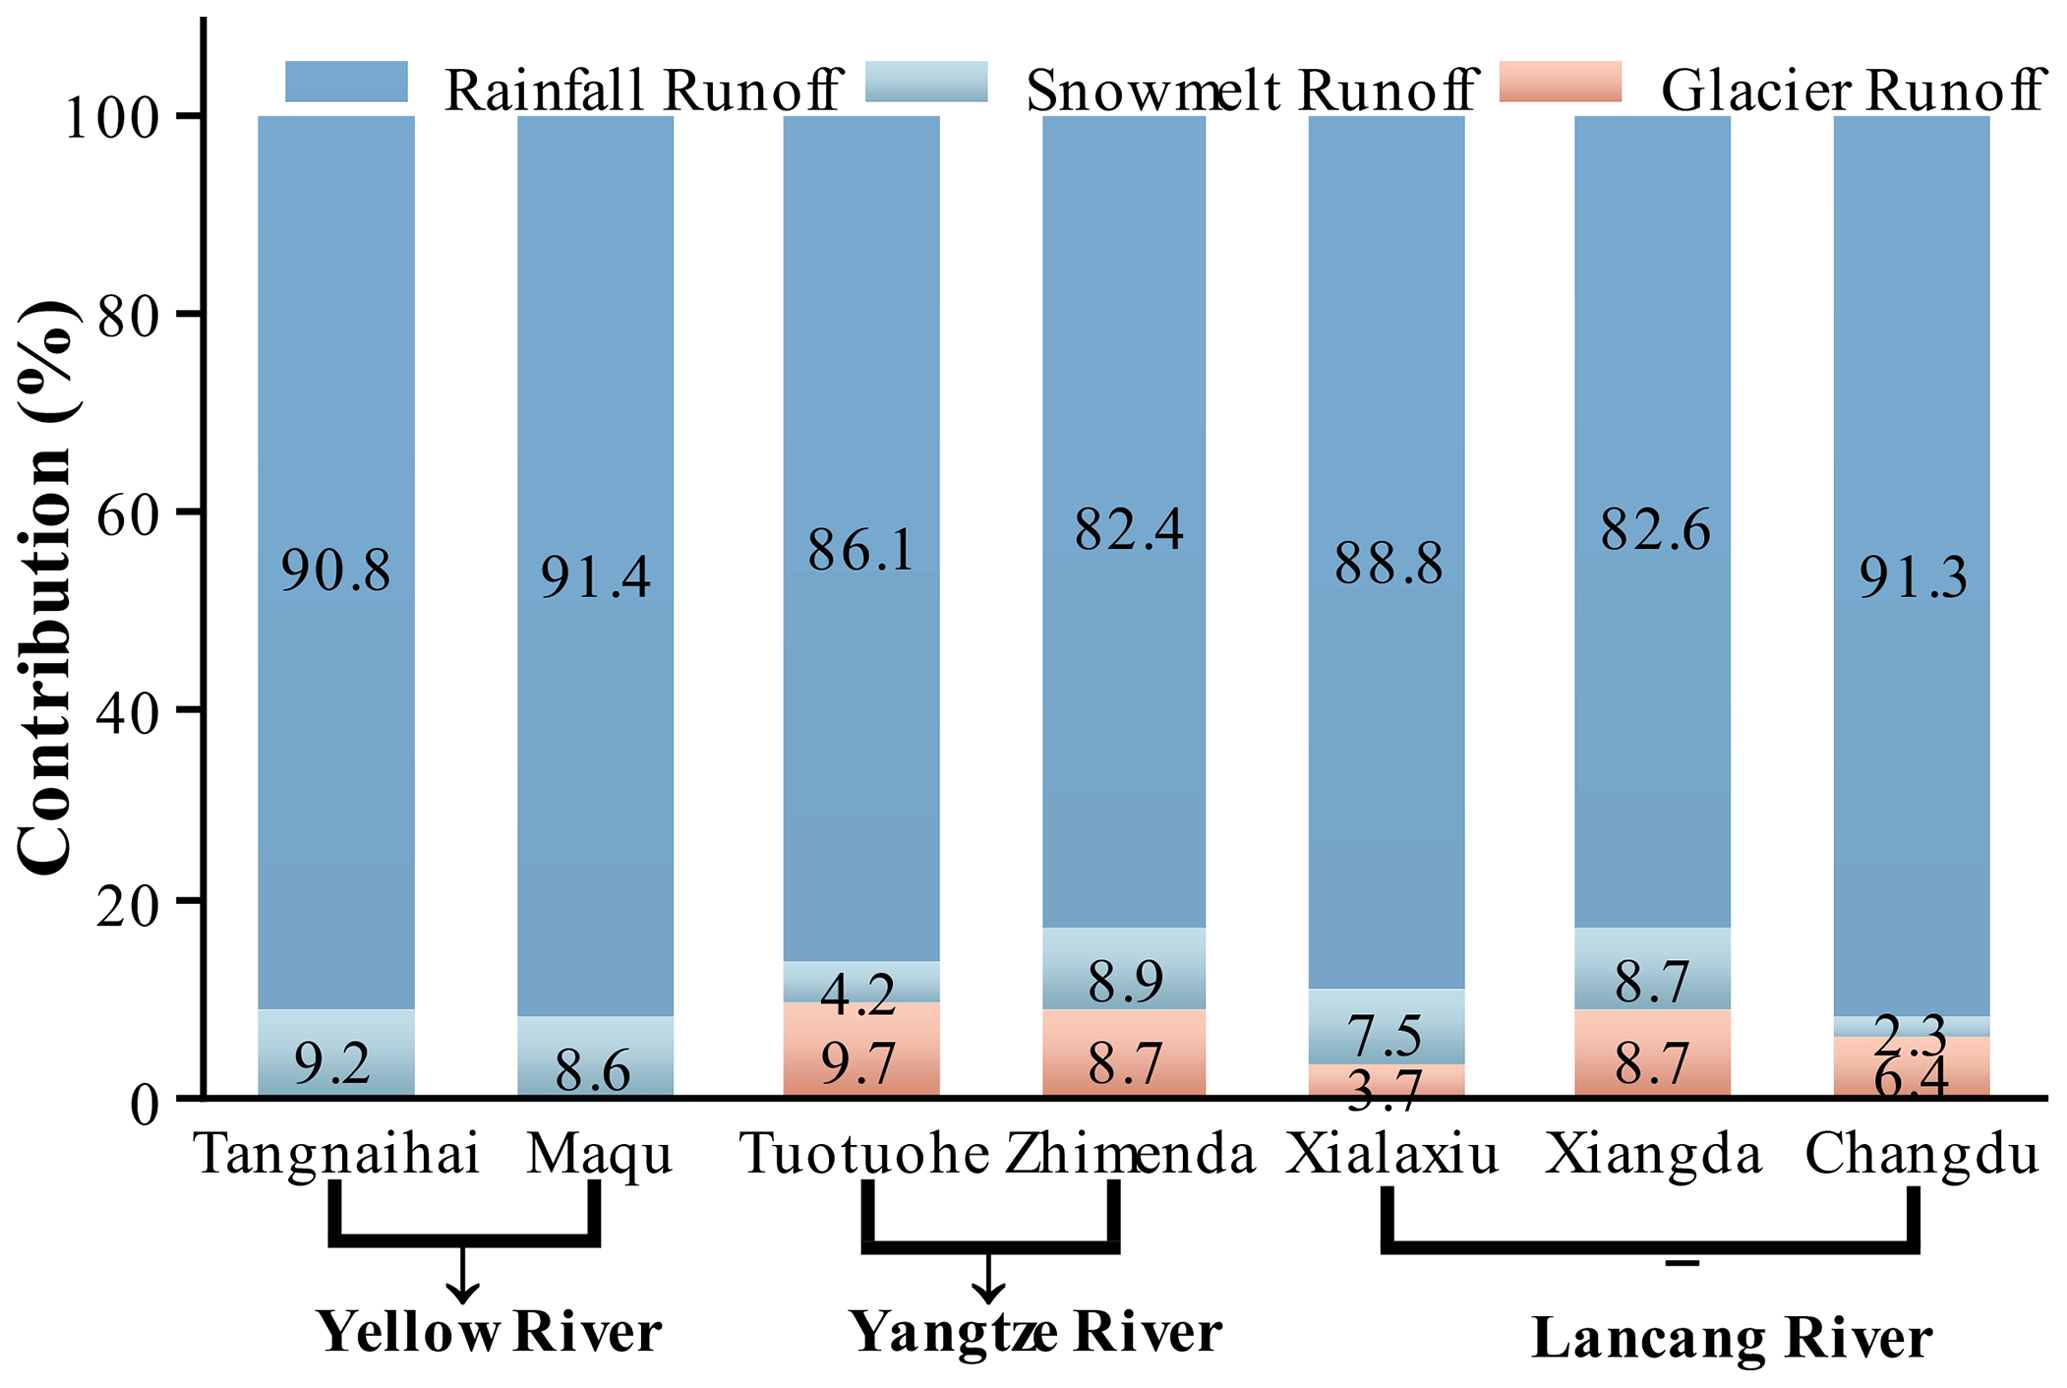
Figure 4Contributions of rainfall, snowmelt, and glacier runoff to the total annual runoff for the seven stations during 1984–2018. Numbers in the figure represent the relative contribution of each component.
Figure 5 shows the monthly variation in each runoff component. The regime of rainfall runoff of all stations was highly consistent with that of total runoff, which once again confirms the leading role of rainfall in total runoff. Snowmelt runoff mainly occurred from April to June due to the melting of winter snowpack and spring snowfall, with contributions ranging from 20 % to 60 % (Fig. S2). As a result of higher altitude (Fig. 1) and lower temperature (Deng and Zhang, 2018), the snowmelt runoff peak at Tuotuohe and Zhimenda stations in the source area of the Yangtze River emerged in June, while this peak occurred at the other stations in May. Glacier runoff was mainly concentrated in July and August, corresponding to the higher temperatures during this period (Fig. S1). However, due to the fact that glaciers made up only a small proportion of the total area (Table 1), the monthly contribution of glacier runoff was below 25 %.
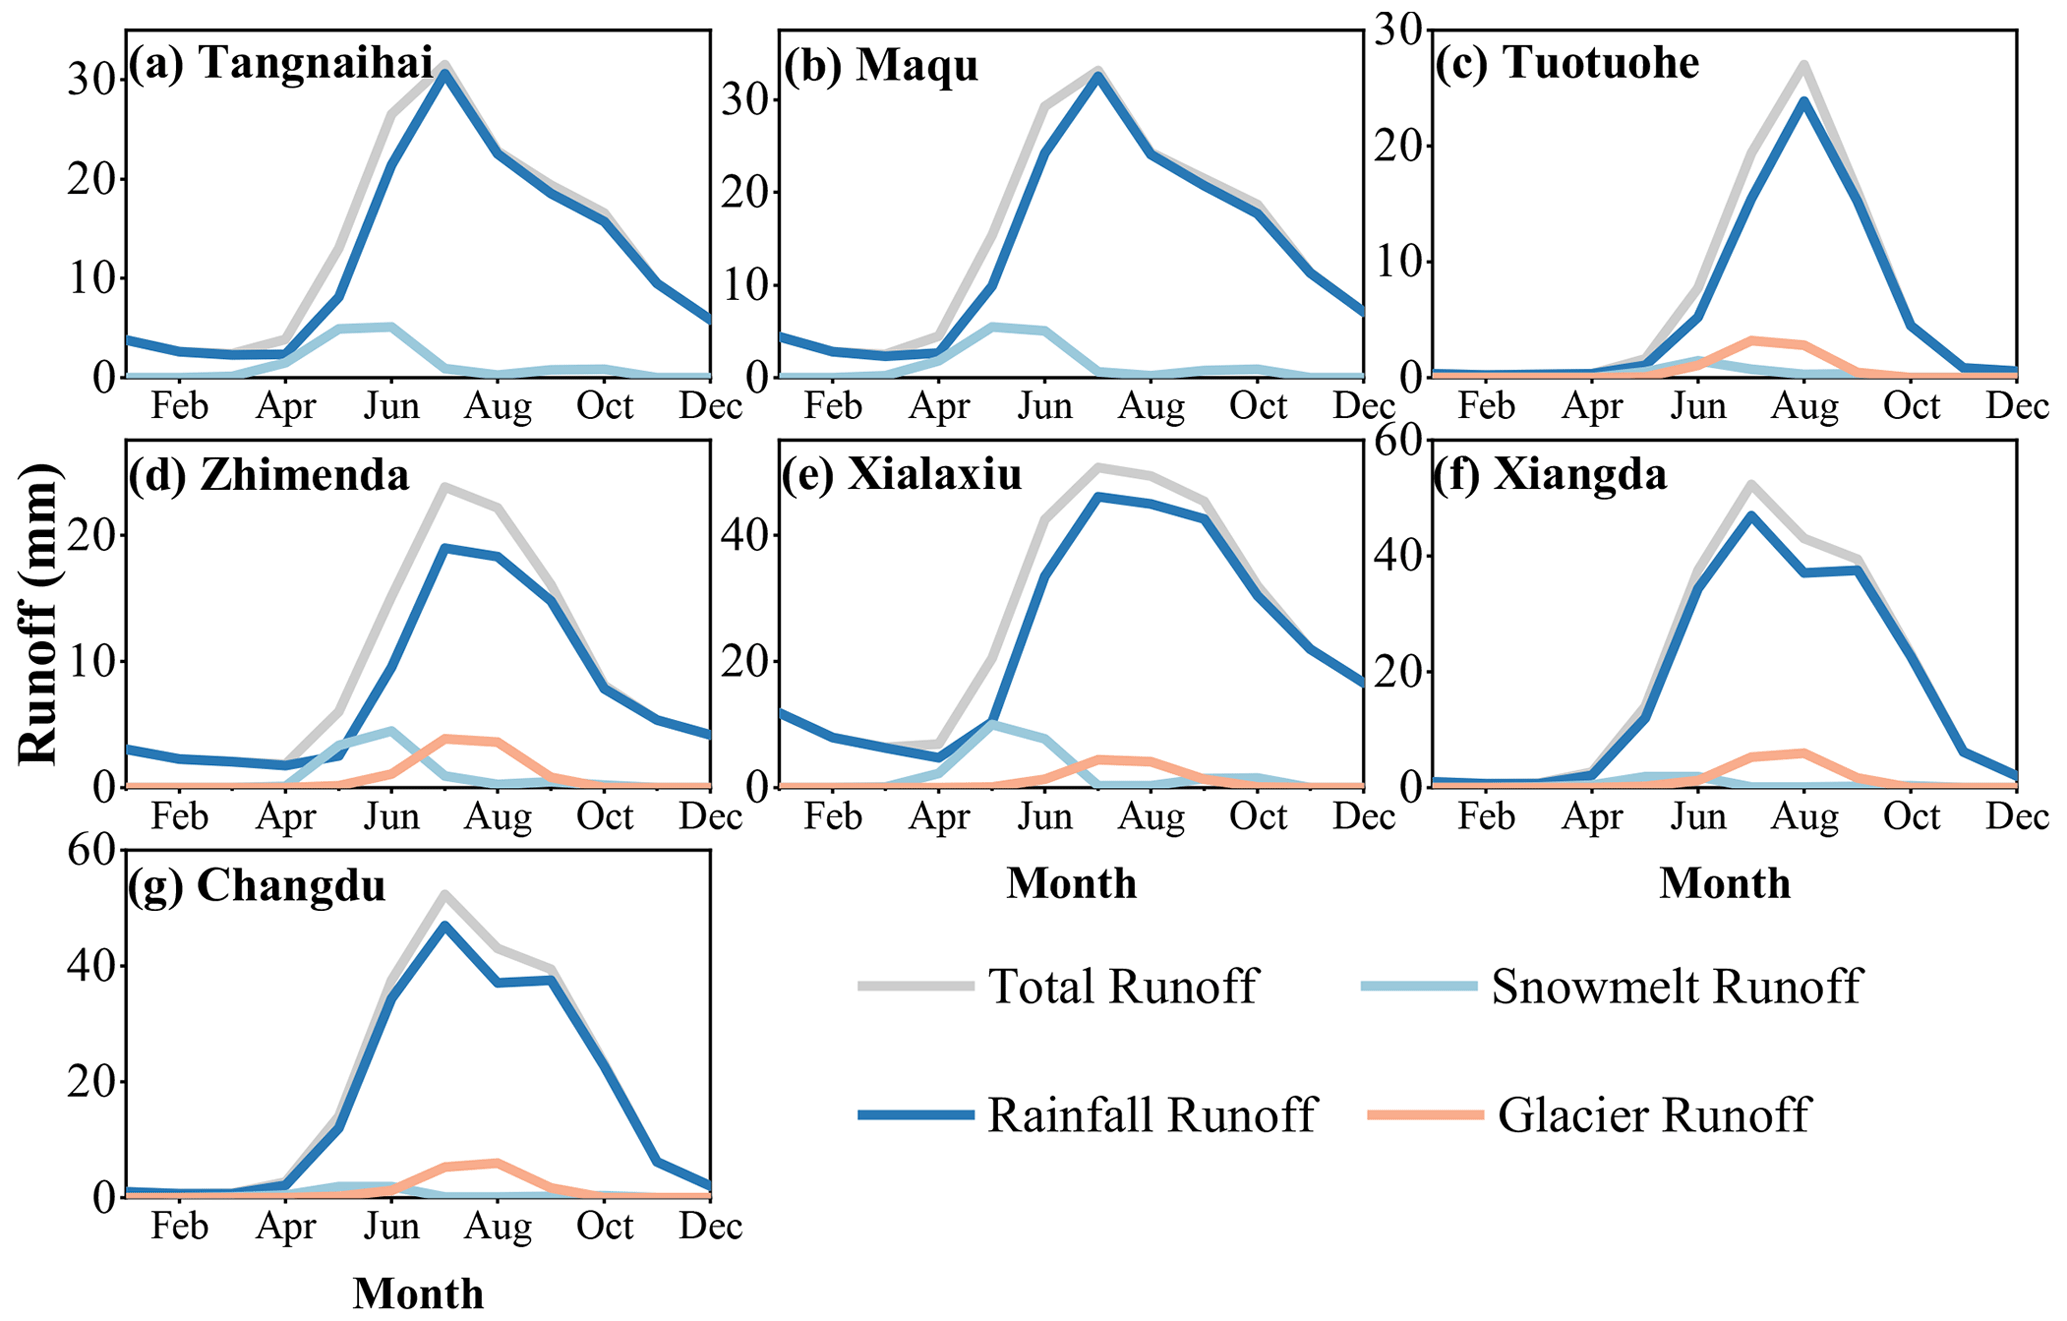
Figure 5Seasonal cycles of simulated total, rainfall, snowmelt, and glacier runoff for the seven stations (a–g) during 1984–2018.
3.3 Runoff variation and attribution
Compared with the reference period (1984–2003), the mean annual runoff in all sub-basins of the TRSR during the changed period (2004–) increased (Fig. 6a), especially in the source area of the Yangtze River, with the catchments monitored by Zhimenda and Tuotuohe stations increasing by 31 % and 51 %, respectively. Figure 7 presents the absolute impacts and relative contributions of four influencing factors (precipitation, temperature, interactions of climatic variables, and human activity) on the annual runoff increase in different sub-basins. It is clear that precipitation was strongly and positively correlated with the runoff, with relative contributions of 38 %–71 %, in agreement with the findings of Wu et al. (2018), who reported that increasing precipitation can directly increase runoff. Because it has increased the most significantly in the source region of the Yangtze River during recent decades (Fig. 6b), precipitation had a greater impact on runoff variation there than it did in the other two headwater subregions.
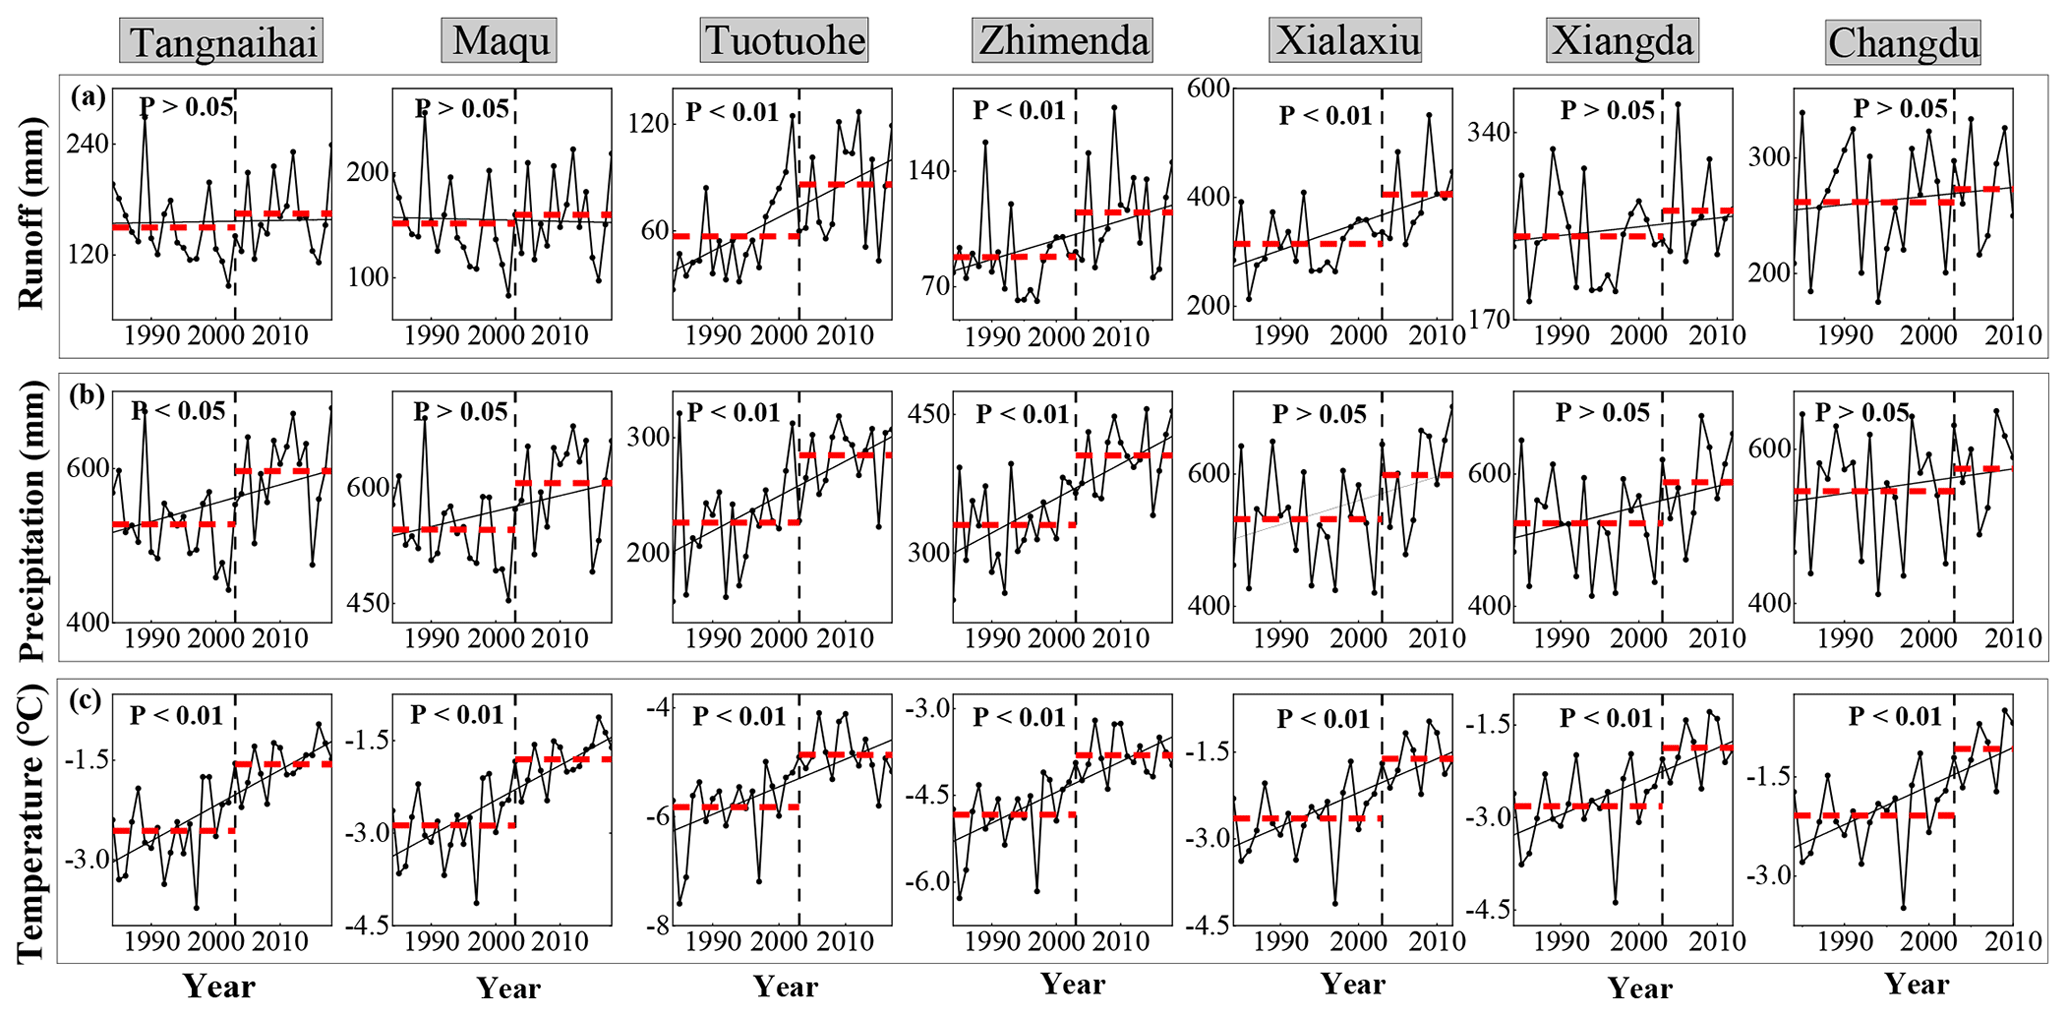
Figure 6Annual runoff (a), precipitation (b), and temperature (c) for the seven sub-basins. The dotted red lines represent the annual average of each variable in the reference period (1984–2003) and the changed period (2004–), respectively. P<0.05 and P<0.01 indicate that the trend is significant at the level of 0.05 and 0.01, respectively, using the Mann–Kendall trend test.
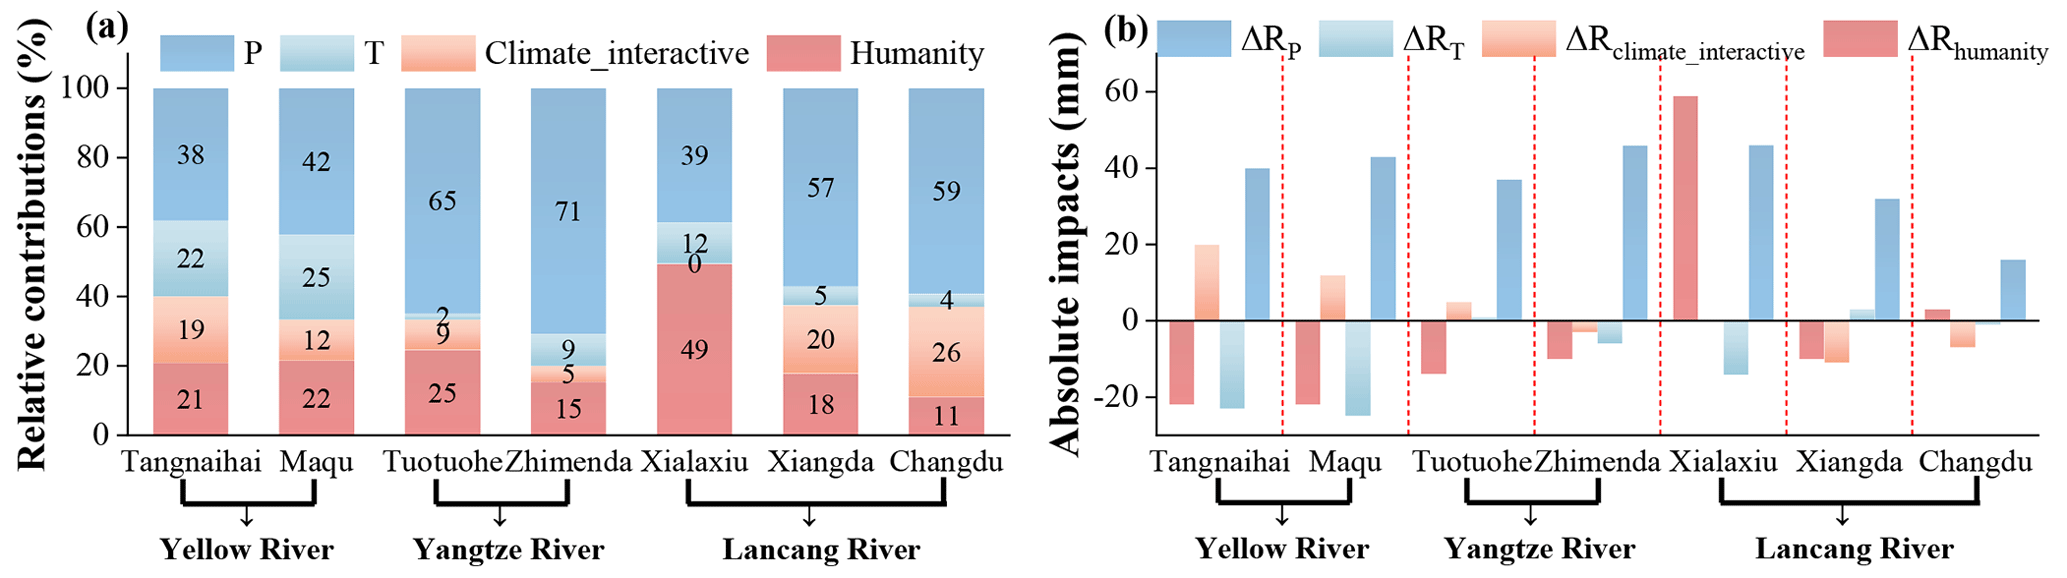
Figure 7Relative contributions (a) and absolute impacts (b) of the different influencing factors on the annual runoff trends at the seven stations. The numbers in (a) represent the relative contributions of the influencing factors as percentages.
Although the runoff in catchments monitored by Tuotuohe and Xiangda stations exhibited a minor increase (≤5 %) when the temperature rose, warming temperature had an overall effect of reducing runoff (by 4 %–25 %) because the limited increase in meltwater was largely offset by the enhancement of evapotranspiration and the degradation of frozen soil (Zhao et al., 2019). Given the spatiotemporal changes in climate variables and their complex interaction, the interactive effects of climate variables on runoff change were spatially non-uniform within the TRSR. Specifically, the absolute impacts of this factor on runoff change varied from −11 to 20 mm a−1, and the relative contribution ranged from 0 % to 26 %. Human activity interference in the catchment monitored by Xialaxiu station far exceeded that in other catchments. It explains the 49 % increase in runoff, which can be attributed to the significant degradation of grassland in this region during the changed period (Zeng et al., 2021; Zhang et al., 2021). In the context of increasing water demand related to agriculture and industry (Zhai et al., 2021) and the ecological protection policy proposed in the 21st century (D. Liu et al., 2017), human activities have consistently reduced runoff in the other catchments, except in the catchment monitored by Changdu station.
Overall, the impacts of precipitation, temperature, the interactions of climatic variables, and human activities on runoff change present differences among different sub-basins. Climate change, which integrates precipitation- and temperature-induced change with that due to the interactions of climatic variables, accounted for over 75 % of the change in runoff for all basins except the catchment monitored by Xialaxiu station, where the contribution of climate change was 51 %. Therefore, in the TRSR, the dominant factor influencing runoff variation was climate change, especially precipitation.
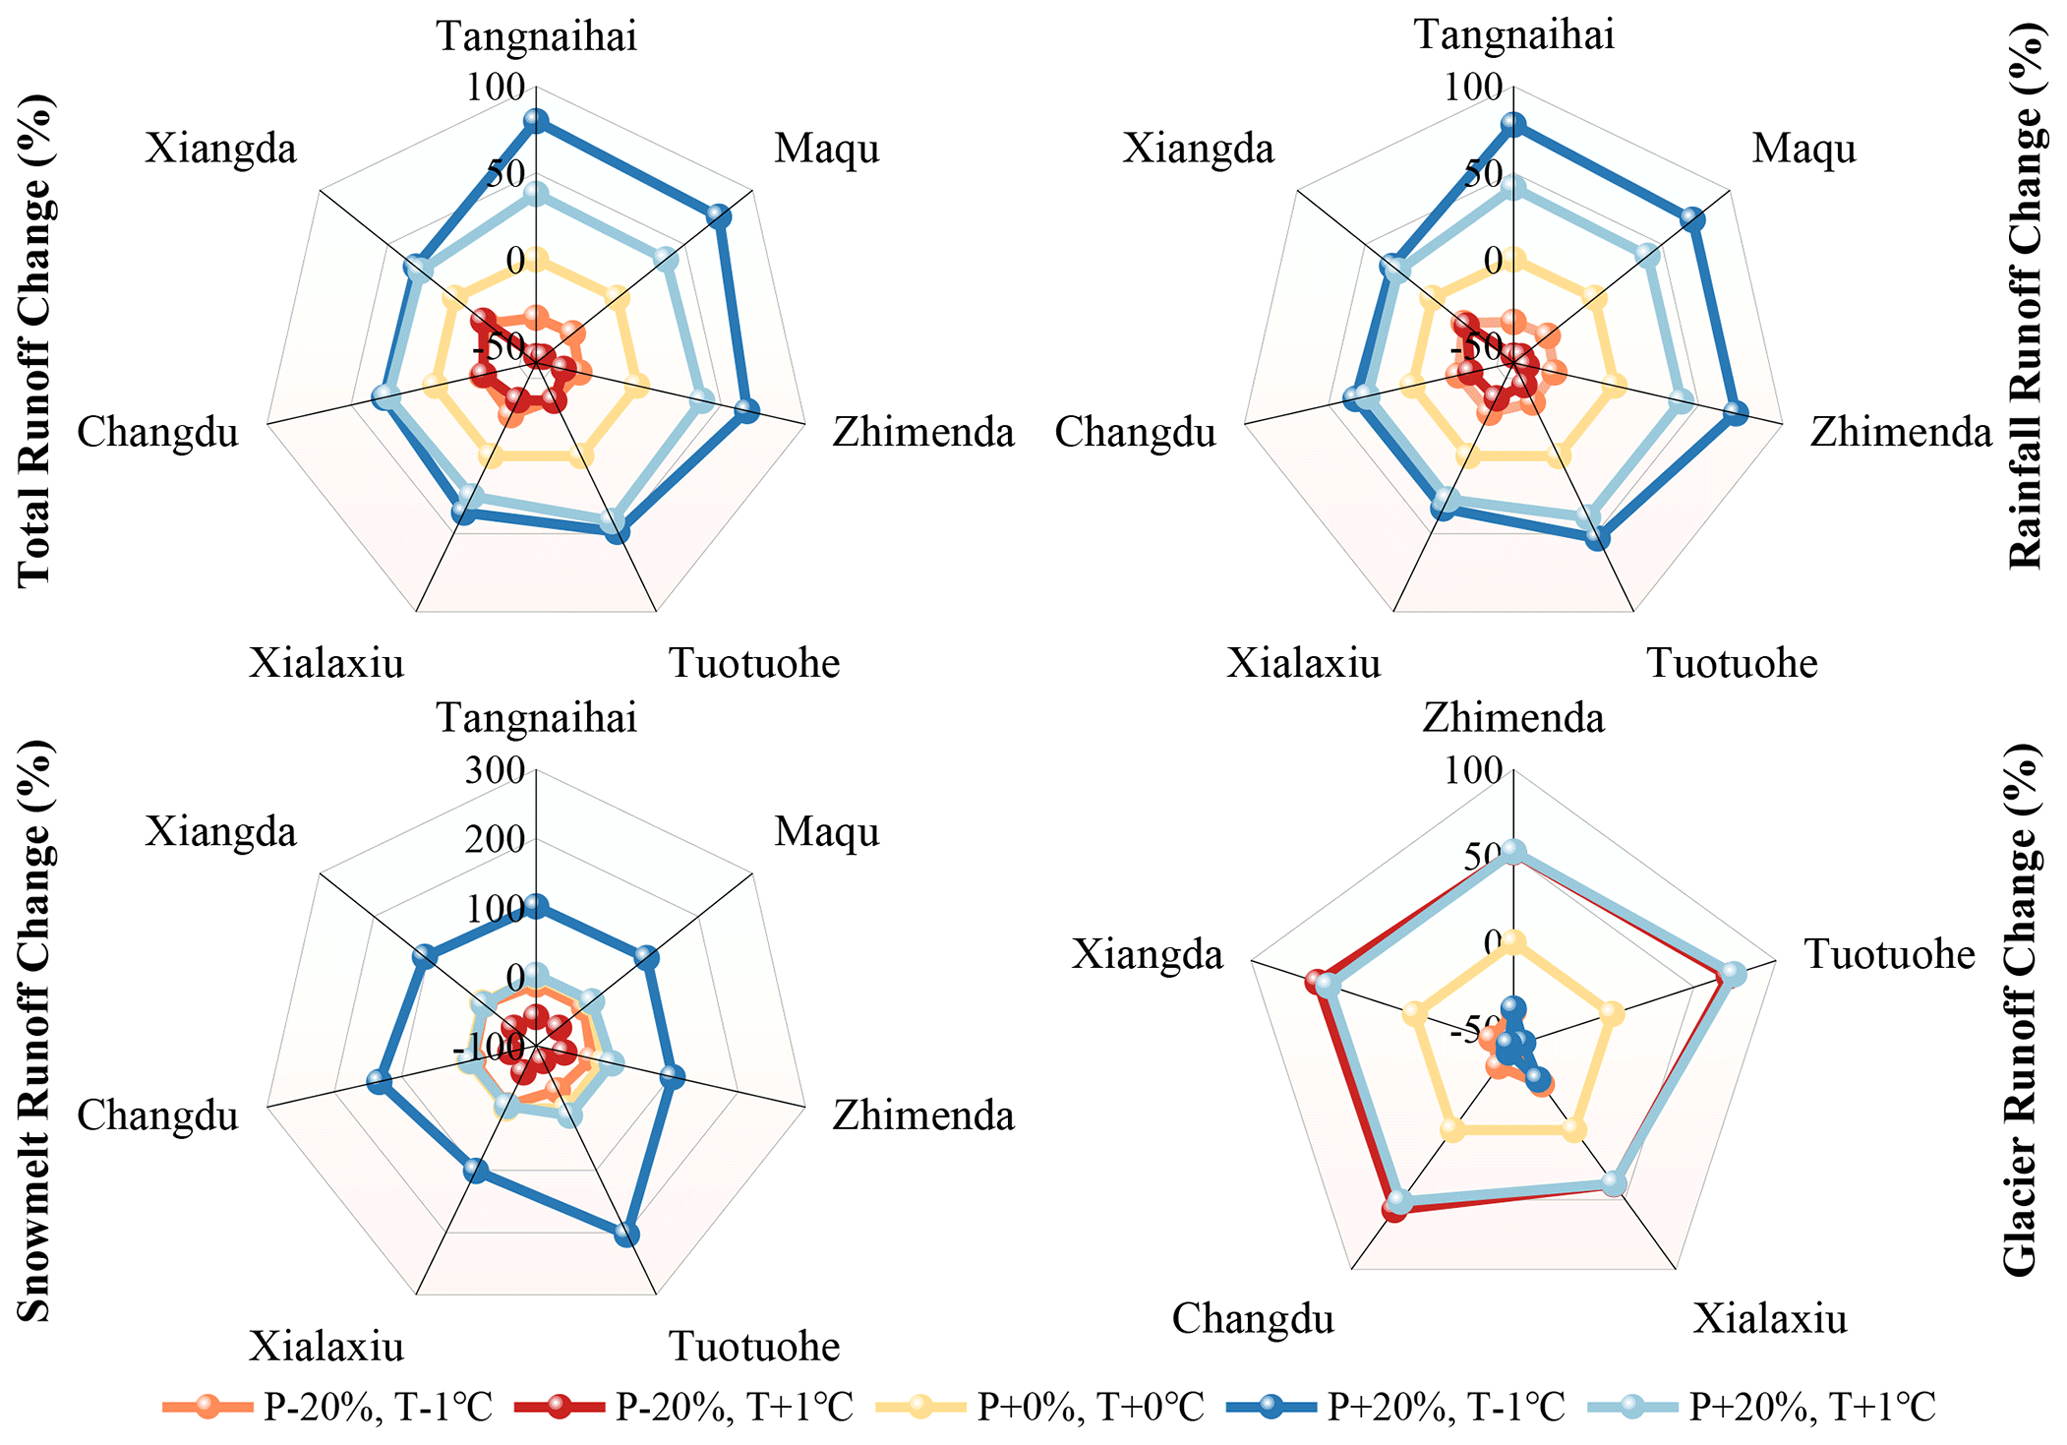
Figure 8Percentage changes in mean annual total, rainfall, snowmelt, and glacier runoff relative to the period 1984–2018 under four climate change combination scenarios for the seven stations.
3.4 Hydrological responses to hypothetical climate change scenarios
Figure 8 shows projected percent changes of total runoff and each runoff component under four climate change combination scenarios with respect to the period from 1984 to 2018. The total runoff at all stations was expected to increase the most under scenario S3 (P+20 %, T−1 ∘C), with an increase of 29 %–80 %, followed by scenario S4 (P+20 %, T+1 ∘C), with an increase of 25 %–41 %, whereas under scenarios S1 (P−20 %, T−1 ∘C) and S2 (P−20 %, T+1 ∘C), respective decreases of 24 %–34 % and 21 %–56 % were predicted. These results indicate that the total runoff was mainly affected by precipitation, but the magnitude of response could strengthen or weaken with changing temperature, which affects not only evapotranspiration but also meltwater (Su et al., 2016). Spatially, as a consequence of neglected glacier runoff, total runoff changes at Tangnaihai and Maqu stations in the source region of the Yellow River were maximal under scenario S3 in comparison with other stations. We further found that the total runoff showed a higher sensitivity to precipitation increase than to precipitation decrease when the temperature remained constant relative to the period of 1984–2018 (Fig. S3). Taking Zhimenda station as an example, the total runoff would increase by 50 % if precipitation increased by 20 % but decrease by about 41 % if precipitation decreased by 20 %. This may be explained by the runoff generation process, just as Spencer et al. (2019) reported that a continuous multi-year pattern of lower- or higher-than-average precipitation can reduce or fill basin storage and affect runoff responses. The different behaviors of total runoff when only temperature changes are shown in Fig. S4. For the catchment monitored by Xiangda station, total runoff was basically unchanged when the temperature changed. This can be explained by the fact that temperature has a similar degree of influence on evapotranspiration and meltwater within this region, while evapotranspiration plays a stronger role in other sub-basins. The pattern of change in rainfall runoff was essentially consistent with that of total runoff, which is closely associated with precipitation although temperature change will affect evapotranspiration.
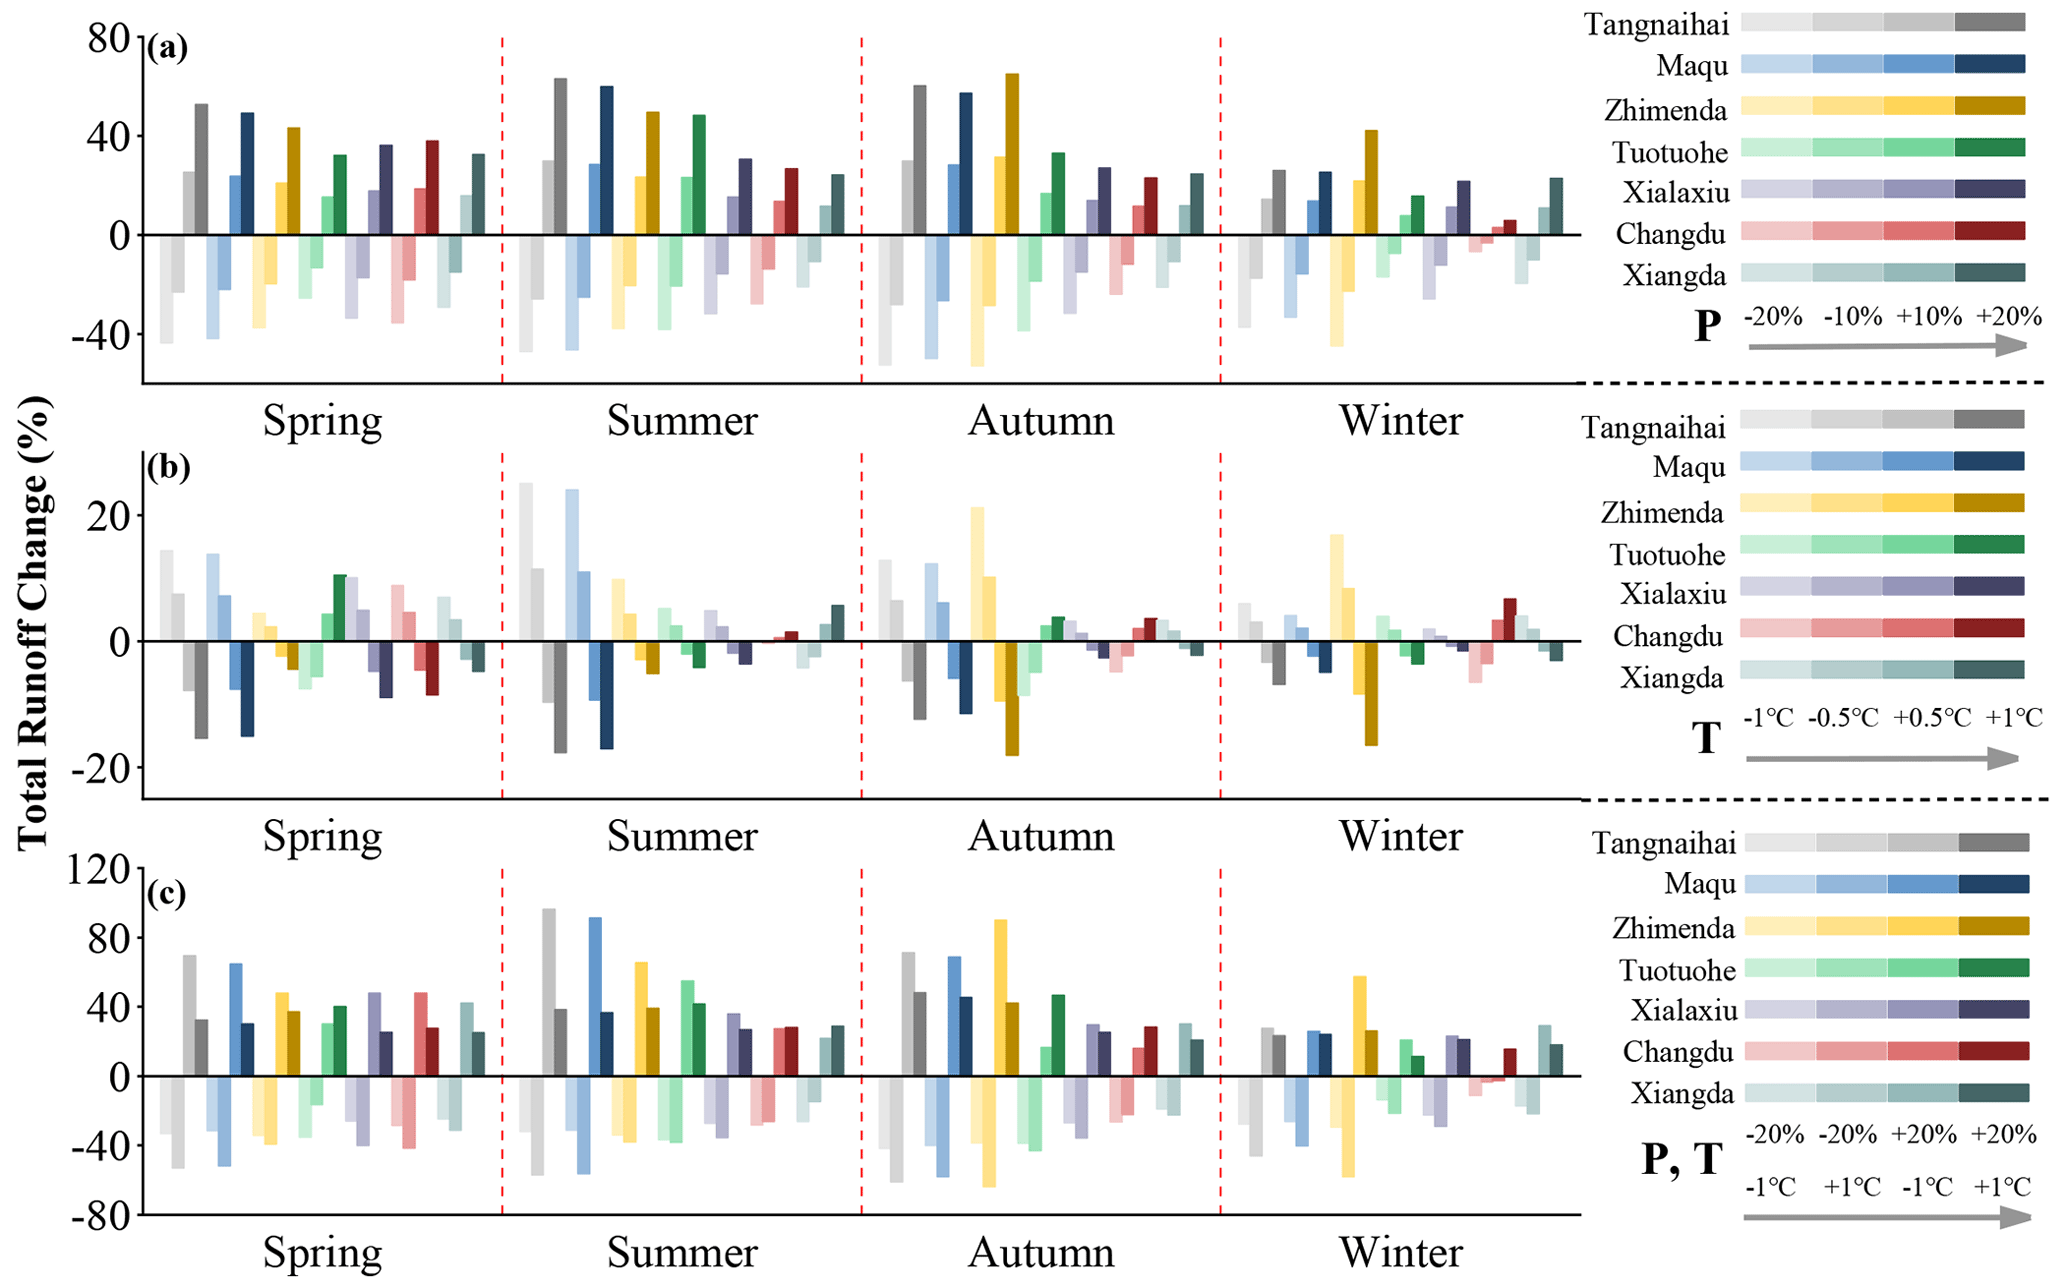
Figure 9Seasonal percentage change in total runoff relative to the period 1984–2018 under various scenarios for the seven stations. (a) Considering precipitation changes only. (b) Considering temperature changes only. (c) Considering precipitation and temperature changes simultaneously.
As climatic variables changed, snowmelt runoff tended to have a larger degree of variation (−76 % to 203 %) than other runoff components did, indicating that it is more susceptible to climate change. Despite its similarity to rainfall runoff and total runoff, snowmelt runoff also increased most obviously in scenario S3 (P+20 %, T−1 ∘C). The major reasons for this were the direct increase in precipitation and the increased proportion of precipitation falling as snow at the lower temperature (Chandel and Ghosh, 2021). Snowmelt runoff varied little in the wetter and warmer scenario (scenario S4) relative to 1984–2018 because increasing precipitation was basically entirely compensated for by the decreased solid-to-liquid precipitation ratio. The most significant change in snowmelt runoff was observed at Tuotuohe station and can be explained by this station's relatively high elevation, which amplifies the importance of snowmelt (Fig. 1). Glacier runoff was highly dependent on temperature change whether precipitation increased or decreased. Consistent with the small area proportion of glaciers in each sub-basin (Table 1), the variation in glacier runoff did not show obvious spatial heterogeneity.
Figure 9 presents the projected seasonal change percentage of total runoff under different scenarios. As shown in Figs. 9 and S5, on the seasonal scale, similar to the annual scale, the change pattern of total runoff was similar to that of rainfall runoff, further confirming the importance of rainfall runoff in the TRSR. Additionally, due to over 80 % of precipitation occurring in summer (July–September) and autumn (October–December) (Fig. S1), more obvious total runoff changes were projected during this period. Although temperature was poorly and negatively correlated with the total runoff for most stations at the seasonal scale, the total runoff at Tuotuohe station increased by 10 % with a temperature increase of 1 ∘C in spring (April–June) as the result of the release of more meltwater, which could possibly advance the peak flow of snowmelt (Shen et al., 2018). Su et al. (2016) have also reported that in the source region of the Yangtze River, an apparent earlier melt may happen in April under a warming climate. Due to the neglected glacier runoff and the more obvious warming trend compared with the other two source areas in the past few decades (Yi et al., 2011; Xie et al., 2004), the total runoff of the Yellow River source displayed a more strongly significant change (−18 % to 25 %) in summer when the temperature changed relative to 1984–2018 (Fig. 9b). Generally speaking, the snowmelt runoff has a second small peak because of the melting of fresh snowfall in autumn (Zhang et al., 2013), as well as the high temporal and spatial variability of precipitation in the source region of the Yangtze River (X. Liu et al., 2017), leading to Tuotuohe station's snowmelt runoff showing the highest sensitivity to climate change in autumn (Fig. S6). The catchment monitored by Xiangda station has more glacier coverage (Table 1), which may be why its glacier runoff had a greater response to temperature in winter in comparison with the glacier runoff in the other basins (Fig. S7).
In general, precipitation plays a greater role in total runoff and rainfall runoff, while glacier runoff is dominated by temperature at annual and seasonal scales. Snowmelt runoff shows a different behavior. Annually, it is affected by both precipitation and temperature. In spring and summer, it is more related to precipitation, in winter it is more related to temperature, and in autumn it is more related to the combined effects of temperature and precipitation.
3.5 Uncertainty
This work provides a systematic understanding of hydrological processes in the TRSR. The results are encouraging, but some uncertainties are still worthy of further analysis in future research. Due to the lack of observed runoff in Tuotuohe station from November to April, we treated the runoff as 0. Although previous studies have shown that the runoff in these months is negligible (Ahmed et al., 2020; Luo et al., 2019), it inevitably introduced some uncertainty because the missing data would affect the model evaluation metrics, thus affecting the optimization results of model parameters. In addition to this, we simulated glacier runoff using a simple degree-day factor algorithm, which is highly sensitive to its DDF parameter (Chen et al., 2017; Zhang et al., 2013; Zhao et al., 2019). Given the lack of observed glacier information, we did not calibrate DDF but directly adopted the constant values at basin scale from existing studies that did not take into account the high spatiotemporal heterogeneities of DDF (Zhang et al., 2006). Although the final simulation result was satisfactory, the practice of treating DDF as a uniform value still introduced a certain degree of bias to the results. In fact, due to the very limited glacier meltwater contribution (Fig. 4), the uncertainty caused by glacier runoff is far less than that stemming from precipitation forcing data (Zhao et al., 2019). Many previous studies have reported that precipitation is the key factor limiting hydrological simulation performance in alpine regions with sparse meteorological stations (X. Liu et al., 2017). Precipitation estimation error will bring significant uncertainty to runoff simulations (Sun and Su, 2020). As shown in Fig. 3, the model's performance was greatly improved by replacing CMA precipitation with PERSIANN-CDR data in the source region of the Yangtze River. This finding inspires us to hope that satellite-based precipitation products may be suitable alternatives for hydrological studies in alpine regions and that we can use several sets of precipitation products to reduce the uncertainty of simulation as much as possible in the future.
Some uncertainties may also exist in assessing the influence of climate change and human activities on changes in runoff. Hydrological model simulation splits the relationship and interaction between climate change and human activity, which inevitably introduces a certain bias due to the complicated feedback and response relationship between them (Ji and Yuan, 2018a; Shi et al., 2022). And our study focused only on the effects of long-term mean annual precipitation and temperature change on runoff without considering the possible impact of the intra-annual fluctuations of these factors. Therefore, additional work should be carried out to examine the causes of runoff change in more detail.
In this work, we evaluated the hydrological changes in the TRSR using the VIC-Glacier land surface hydrologic model. The main results are summarized as follows:
-
The VIC-Glacier model achieved good performance in the TRSR, with an NSE above 0.68, but we must pay attention to the importance of accurate precipitation input for successful simulation. In the source region of the Yangtze River, the NSE of Zhimenda station increased from 0.32 to 0.76 during the validation period by replacing CMA precipitation with PERSIANN-CDR precipitation.
-
The rainfall runoff played a dominant role in maintaining runoff for the TRSR during 1984–2018, accounting for 82 %–92 % of the total, whereas snowmelt and glacier runoff both contributed less than 10 %. Seasonally, snowmelt runoff was mainly concentrated between April and June, and the peak time for snowmelt runoff in the source area of the Yangtze River was about 1 month later than in the other two headwater subregions. Glacier runoff mainly occurred in July and August.
-
Climate change was the main cause of runoff increase after 2004 in the TRSR, with its percentage contribution reaching 75 %–89 %, except for in the catchment monitored by Xialaxiu station. More specifically, precipitation was the main climatic factor leading to runoff change, especially in the source area of the Yangtze River.
-
Through various hypothetical climate change scenario experiments, we found snowmelt runoff was easily affected by the joint change of precipitation and temperature at the annual scale and in autumn, while in spring and summer, it was more subject to precipitation change and to temperature change in winter. Considering the fact that a simultaneous increase of precipitation and temperature is the most likely future climate change scenario, we expect that the total runoff, rainfall runoff, and glacier runoff will increase in the future, while the snowmelt runoff will remain basically unchanged. These insights could help decision-makers allocate water resources more rationally in the future.
Data sets are available upon request to the corresponding author.
The supplement related to this article is available online at: https://doi.org/10.5194/hess-27-1477-2023-supplement.
TS and CM designed and executed the hydrological modeling work. TS led the data analysis and wrote the initial draft of the paper. QD, JG, XG, and XZ contributed scientifically to the modeling and data analysis. All authors contributed to the paper by providing comments, editing, and suggestions.
The contact author has declared that none of the authors has any competing interests.
Publisher's note: Copernicus Publications remains neutral with regard to jurisdictional claims in published maps and institutional affiliations.
This article is part of the special issue “Hydrological response to climatic and cryospheric changes in high-mountain regions”. It is not associated with a conference.
This work was supported by the Second Tibetan Plateau Scientific Expedition and Research Program (STEP) (no. 2019 QZKK0405), the National Natural Science Foundation of China (42041006), and the State Key Laboratory of Earth Surface Processes and Resource Ecology (2022-ZD-03). We are grateful for high-performance computing support from the Center for Geodata and Analysis, Faculty of Geographical Science, Beijing Normal University (https://gda.bnu.edu.cn/, last access: 3 April 2023).
This research has been supported by the Second Tibetan Plateau Scientific Expedition and Research Program (STEP) (grant no. 2019QZKK0405), the National Natural Science Foundation of China (grant no. 42041006), and the State Key Laboratory of Earth Surface Processes and Resource Ecology (grant no. 2022-ZD-03).
This paper was edited by Songjun Han and reviewed by two anonymous referees.
Ahmed, N., Wang, G., Booij, M. J., Oluwafemi, A., Hashmi, M. Z.-u.-R., Ali, S., and Munir, S.: Climatic Variability and Periodicity for Upstream Sub-Basins of the Yangtze River, China, Water, 12, 842, https://doi.org/10.3390/w12030842, 2020.
Ahmed, N., Wang, G., Booij, M. J., Xiangyang, S., Hussain, F., and Nabi, G.: Separation of the Impact of Landuse/Landcover Change and Climate Change on Runoff in the Upstream Area of the Yangtze River, China, Water Resour. Manag., 36, 181–201, https://doi.org/10.1007/s11269-021-03021-z, 2021.
Ashouri, H., Hsu, K.-L., Sorooshian, S., Braithwaite, D. K., Knapp, K. R., Cecil, L. D., Nelson, B. R., and Prat, O. P.: PERSIANN-CDR Daily Precipitation Climate Data Record from Multisatellite Observations for Hydrological and Climate Studies, B. Am. Meteorol. Soc., 96, 69–83, https://doi.org/10.1175/bams-d-13-00068.1, 2015.
Bahr, D. B., Meier, M. F., and Peckham, S. D.: The physical basis of glacier volume-area scaling, J. Geophys. Res., 102, 20355–20362, https://doi.org/10.1029/97JB01696, 1997.
Bai, P. and Liu, X.: Evaluation of Five Satellite-Based Precipitation Products in Two Gauge-Scarce Basins on the Tibetan Plateau, Remote Sens.-Basel, 10, 1316, https://doi.org/10.3390/rs10081316, 2018.
Barnett, T. P., Adam, J. C., and Lettenmaier, D. P.: Potential impacts of a warming climate on water availability in snow-dominated regions, Nature, 438, 303–309, https://doi.org/10.1038/nature04141, 2005.
Cai, Y., Luo, S., Wang, J., Qi, D., and Hu, X.: Spatiotemporal variations in precipitation in the Three-River Headwater region from 1961 to 2019, Pratacultural Science, 39, 10–20, 2022.
Cao, L. and Pan, S.: Changes in precipitation extremes over the “Three-River Headwaters” region, hinterland of the Tibetan Plateau, during 1960–2012, Quatern. Int., 321, 105–115, https://doi.org/10.1016/j.quaint.2013.12.041, 2014.
Chandel, V. S. and Ghosh, S.: Components of Himalayan River Flows in a Changing Climate, Water Resour. Res., 57, e2020WR027589, https://doi.org/10.1029/2020wr027589, 2021.
Chen, X., Long, D., Hong, Y., Zeng, C., and Yan, D.: Improved modeling of snow and glacier melting by a progressive two-stage calibration strategy with GRACE and multisource data: How snow and glacier meltwater contributes to the runoff of the Upper Brahmaputra River basin?, Water Resour. Res., 53, 2431–2466, https://doi.org/10.1002/2016wr019656, 2017.
Cherkauer, K. A. and Lettenmaier, D. P.: Hydrologic effects of frozen soils in the upper Mississippi River basin, J. Geophys. Res.-Atmos., 104, 19599–19610, https://doi.org/10.1029/1999jd900337, 1999.
Cherkauer, K. A. and Lettenmaier, D. P.: Simulation of spatial variability in snow and frozen soil, J. Geophys. Res.-Atmos., 108, 8858, https://doi.org/10.1029/2003jd003575, 2003.
Cuo, L., Zhang, Y., Bohn, T. J., Zhao, L., Li, J., Liu, Q., and Zhou, B.: Frozen soil degradation and its effects on surface hydrology in the northern Tibetan Plateau, J. Geophys. Res.-Atmos., 120, 8276–8298, https://doi.org/10.1002/2015jd023193, 2015.
Cuo, L., Li, N., Liu, Z., Ding, J., Liang, L., Zhang, Y., and Gong, T.: Warming and human activities induced changes in the Yarlung Tsangpo basin of the Tibetan plateau and their influences on streamflow, J. Hydrol.-Reg. Stud., 25, 100625, https://doi.org/10.1016/j.ejrh.2019.100625, 2019.
Deng, C. and Zhang, W.: Spatiotemporal distribution and the characteristics of the air temperature of a river source region of the Qinghai-Tibet Plateau, Environ. Monit. Assess., 190, 368, https://doi.org/10.1007/s10661-018-6739-7, 2018.
Feng, A., Li, Y., Gao, J., Wu, S., and Feng, A.: The determinants of streamflow variability and variation in Three-River Source of China: climate change or ecological restoration?, Environ. Earth Sci., 76, 696, https://doi.org/10.1007/s12665-017-7026-6, 2017.
Gao, J., Yao, T., Masson-Delmotte, V., Steen-Larsen, H. C., and Wang, W.: Collapsing glaciers threaten Asia's water supplies, Nature, 565, 19–21, https://doi.org/10.1038/d41586-018-07838-4, 2019.
Gou, J., Miao, C., Duan, Q., Tang, Q., Di, Z., Liao, W., Wu, J., and Zhou, R.: Sensitivity Analysis-Based Automatic Parameter Calibration of the VIC Model for Streamflow Simulations Over China, Water Resour. Res., 56, e2019WR025968, https://doi.org/10.1029/2019wr025968, 2020.
Gou, J., Miao, C., Samaniego, L., Xiao, M., Wu, J., and Guo, X.: CNRD v1.0: A High-Quality Natural Runoff Dataset for Hydrological and Climate Studies in China, B. Am. Meteorol. Soc., 102, E929–E947, https://doi.org/10.1175/bams-d-20-0094.1, 2021.
Gupta, H. V., Sorooshian, S., and Yapo, P. O.: Status of Automatic Calibration for Hydrologic Models: Comparison with Multilevel Expert Calibration, J. Hydrol. Eng., 4, 135–143, https://doi.org/10.1061/(asce)1084-0699(1999)4:2(135), 1999.
Han, P., Long, D., Han, Z., Du, M., Dai, L., and Hao, X.: Improved understanding of snowmelt runoff from the headwaters of China's Yangtze River using remotely sensed snow products and hydrological modeling, Remote Sens. Environ., 224, 44–59, https://doi.org/10.1016/j.rse.2019.01.041, 2019.
He, Z., Duethmann, D., and Tian, F.: A meta-analysis based review of quantifying the contributions of runoff components to streamflow in glacierized basins, J. Hydrol., 603, 126890, https://doi.org/10.1016/j.jhydrol.2021.126890, 2021.
Hock, R.: Temperature index melt modelling in mountain areas, J. Hydrol., 282, 104–115, https://doi.org/10.1016/s0022-1694(03)00257-9, 2003.
Hoegh-Guldberg, O., Jacob, D., Taylor, M., Bolanos, T. G., Bindi, M., Brown, S., Camilloni, I. A., Diedhiou, A., Djalante, R., Ebi, K., Engelbrecht, F., Guiot, J., Hijioka, Y., Mehrotra, S., Hope, C. W., Payne, A. J., Portner, H. O., Seneviratne, S. I., Thomas, A., Warren, R., and Zhou, G.: The human imperative of stabilizing global climate change at 1.5 ∘C, Science, 365, eaaw6974, https://doi.org/10.1126/science.aaw6974, 2019.
Huang, X., Deng, J., Wang, W., Feng, Q., and Liang, T.: Impact of climate and elevation on snow cover using integrated remote sensing snow products in Tibetan Plateau, Remote Sens. Environ., 190, 274–288, https://doi.org/10.1016/j.rse.2016.12.028, 2017.
Immerzeel, W. W., van Beek, L. P. H., and Bierkens, M. F. P.: Climate Change Will Affect the Asian Water Towers, Science, 328, 1382–1385, https://doi.org/10.1126/science.1183188, 2010.
Immerzeel, W. W., Pellicciotti, F., and Bierkens, M. F. P.: Rising river flows throughout the twenty-first century in two Himalayan glacierized watersheds, Nat. Geosci., 6, 742–745, https://doi.org/10.1038/ngeo1896, 2013.
Ji, P. and Yuan, X.: High-Resolution Land Surface Modeling of Hydrological Changes Over the Sanjiangyuan Region in the Eastern Tibetan Plateau: 1. Model Development and Evaluation, J. Adv. Model. Earth Sy., 10, 2806–2828, https://doi.org/10.1029/2018MS001412, 2018a.
Ji, P. and Yuan, X.: High-Resolution Land Surface Modeling of Hydrological Changes Over the Sanjiangyuan Region in the Eastern Tibetan Plateau: 2. Impact of Climate and Land Cover Change, J. Adv. Model. Earth Sy., 10, 2829–2843, https://doi.org/10.1029/2018ms001413, 2018b.
Ji, P., Yuan, X., Ma, F., and Pan, M.: Accelerated hydrological cycle over the Sanjiangyuan region induces more streamflow extremes at different global warming levels, Hydrol. Earth Syst. Sci., 24, 5439–5451, https://doi.org/10.5194/hess-24-5439-2020, 2020.
Jiang, C., Li, D., Gao, Y., Liu, W., and Zhang, L.: Impact of climate variability and anthropogenic activity on streamflow in the Three Rivers Headwater Region, Tibetan Plateau, China, Theor. Appl. Climatol., 129, 667–681, https://doi.org/10.1007/s00704-016-1833-7, 2016.
Liang, X., Lettenmaier, D. P., Wood, E. F., and Burges, S. J.: A simple hydrologically based model of land surface water and energy fluxes for general circulation models, J. Geophys. Res.-Atmos., 99, 14415–14428, https://doi.org/10.1029/94jd00483, 1994.
Liang, X., Wood, E. F., and Lettenmaier, D. P.: Surface soil moisture parameterization of the VIC-2L model: Evaluation and modification, Global Planet. Change, 13, 195–206, https://doi.org/10.1016/0921-8181(95)00046-1, 1996.
Liu, D., Cao, C., Dubovyk, O., Tian, R., Chen, W., Zhuang, Q., Zhao, Y., and Menz, G.: Using fuzzy analytic hierarchy process for spatio-temporal analysis of eco-environmental vulnerability change during 1990–2010 in Sanjiangyuan region, China, Ecol. Indic., 73, 612–625, https://doi.org/10.1016/j.ecolind.2016.08.031, 2017.
Liu, S. Y., Sun, W. X., Shen, Y. P., and Li, G.: Glacier changes since the Little Ice Age maximum in the western Qilian Shan, northwest China, and consequences of glacier runoff for water supply, J. Glaciol., 49, 117–124, https://doi.org/10.3189/172756503781830926, 2003.
Liu, W., Xie, C., Wang, W., Yang, G., Zhang, Y., Wu, T., Liu, G., Pang, Q., Zou, D., and Liu, H.: The Impact of Permafrost Degradation on Lake Changes in the Endorheic Basin on the Qinghai–Tibet Plateau, Water, 12, 1287, https://doi.org/10.3390/w12051287, 2020.
Liu, X., Yang, T., Hsu, K., Liu, C., and Sorooshian, S.: Evaluating the streamflow simulation capability of PERSIANN-CDR daily rainfall products in two river basins on the Tibetan Plateau, Hydrol. Earth Syst. Sci., 21, 169–181, https://doi.org/10.5194/hess-21-169-2017, 2017.
Lohmann, D., Nolte-Holube, R., and Raschke, E.: A large-scale horizontal routing model to be coupled to land surface parametrization schemes, Tellus A, 48, 708–721, https://doi.org/10.1034/j.1600-0870.1996.t01-3-00009.x, 1996.
Luo, S., Fang, X., Lyu, S., Zhang, Y., and Chen, B.: Improving CLM4.5 Simulations of Land-Atmosphere Exchange during Freeze-Thaw Processes on the Tibetan Plateau, J. Meteorol. Res.-PRC, 31, 916–930, https://doi.org/10.1007/s13351-017-6063-0, 2017.
Luo, Y., Qin, N., Zhou, B., Li, J., Liu, J., Wang, C., and Pang, Y.: Change of Runoff in the Source Regions of the Yangtze River from 1961 to 2016, Res. Soil Water Conserv., 26, 123–128, 2019.
Lutz, A. F., Immerzeel, W. W., Shrestha, A. B., and Bierkens, M. F. P.: Consistent increase in High Asia's runoff due to increasing glacier melt and precipitation, Nat. Clim. Change, 4, 587–592, https://doi.org/10.1038/nclimate2237, 2014.
Ma, L., Liu, Z., Zhao, B., Lyu, J., Zheng, F., Xu, W., and Gan, X.: Variations of runoff and sediment and their response to human activities in the source region of the Yellow River, China, Environ. Earth Sci., 80, 552, https://doi.org/10.1007/s12665-021-09850-w, 2021.
Meng, X., Chen, H., Li, Z., Zhao, L., Zhou, B., Lu, S., Deng, M., Liu, Y., and Li, G.: Review of Climate Change and Its Environmental Influence on the Three-River Regions, Plateau Meteorol., 39, 1133–1143, 2020.
Miao, C., Gou, J., Fu, B., Tang, Q., Duan, Q., Chen, Z., Lei, H., Chen, J., Guo, J., Borthwick, A. G. L., Ding, W., Duan, X., Li, Y., Kong, D., Guo, X., and Wu, J.: High-quality reconstruction of China's natural streamflow, Sci. Bull., 67, 547–556, https://doi.org/10.1016/j.scib.2021.09.022, 2022.
Qiu, J.: The third pole, Nature, 454, 393–396, https://doi.org/10.1038/454393a, 2008.
Radic, V., Hock, R., and Oerlemans, J.: Analysis of scaling methods in deriving future volume evolutions of valley glaciers, J. Glaciol., 54, 601–612, https://doi.org/10.3189/002214308786570809, 2008.
Shangguan, D., Guo, W., Zhao, C., Xu, J., Han, H., Wang, J., Ding, Y. J., Zhang, S., and Zhao, Q.: Modeling Hydrologic Response to Climate Change and Shrinking Glaciers in the Highly Glacierized Kunma Like River Catchment, Central Tian Shan, J. Hydrometeorol., 16, 2383–2402, https://doi.org/10.1175/jhm-d-14-0231.1, 2015.
Shen, Y.-J., Shen, Y., Fink, M., Kralisch, S., Chen, Y., and Brenning, A.: Trends and variability in streamflow and snowmelt runoff timing in the southern Tianshan Mountains, J. Hydrol., 557, 173–181, https://doi.org/10.1016/j.jhydrol.2017.12.035, 2018.
Shi, R., Wang, T., Yang, D., and Yang, Y.: Streamflow decline threatens water security in the upper Yangtze river, J. Hydrol., 606, 127448, https://doi.org/10.1016/j.jhydrol.2022.127448, 2022.
Spencer, S. A., Silins, U., and Anderson, A. E.: Precipitation-Runoff and Storage Dynamics in Watersheds Underlain by Till and Permeable Bedrock in Alberta's Rocky Mountains, Water Resour. Res., 55, 10690–10706, https://doi.org/10.1029/2019wr025313, 2019.
Storck, P., and Lettenmaier D. P.: Predicting the effect of a forest canopy on ground snow accumulation and ablation in maritime climates, in: 67th Annual Western Snow Conference, April 1999, South Lake Tahoe, California, 1–12, https://westernsnowconference.org/node/308 (last access: 5 April 2023), 1999.
Su, F., Zhang, L., Ou, T., Chen, D., Yao, T., Tong, K., and Qi, Y.: Hydrological response to future climate changes for the major upstream river basins in the Tibetan Plateau, Global Planet. Change, 136, 82–95, https://doi.org/10.1016/j.gloplacha.2015.10.012, 2016.
Sun, H. and Su, F.: Precipitation correction and reconstruction for streamflow simulation based on 262 rain gauges in the upper Brahmaputra of southern Tibetan Plateau, J. Hydrol., 590, 125484, https://doi.org/10.1016/j.jhydrol.2020.125484, 2020.
Todini, E.: The ARNO rainfall-runoff model, J. Hydrol., 175, 339–382, https://doi.org/10.1016/s0022-1694(96)80016-3, 1996.
Tong, X., Jun-bang, W., and Zhuo-qi, C.: Vulnerability of Grassland Ecosystems in the Sanjiangyuan Region Based on NPP, Resour. Sci., 32, 323–330, 2010.
Wang, L., Yao, T., Chai, C., Cuo, L., Su, F., Zhang, F., Yao, Z., Zhang, Y., Li, X., Qi, J., Hu, Z., Liu, J., and Wang, Y.: TP-River: Monitoring and Quantifying Total River Runoff from the Third Pole, B. Am. Meteorol. Soc., 102, E948–E965, https://doi.org/10.1175/bams-d-20-0207.1, 2021.
Wang, Y., Xie, X., Shi, J., and Zhu, B.: Ensemble runoff modeling driven by multi-source precipitation products over the Tibetan Plateau, Chinese Sci. Bull., 66, 4169–4186, https://doi.org/10.1360/tb-2020-1557, 2021.
Wu, J., Miao, C., Yang, T., Duan, Q., and Zhang, X.: Modeling streamflow and sediment responses to climate change and human activities in the Yanhe River, China, Hydrol. Res., 49, 150–162, https://doi.org/10.2166/nh.2017.168, 2018.
Xie, C., Ding, Y., and Liu, S.: Changes of weather and hydrological environment for the last 50 years in the source regions of Yangtze and Yellow Rivers, Ecol. Envir., 13, 520–523, 2004.
Xu, Z. X., Gong, T. L., and Li, J. Y.: Decadal trend of climate in the Tibetan Plateau – regional temperature and precipitation, Hydrol. Process., 22, 3056–3065, https://doi.org/10.1002/hyp.6892, 2008.
Xue, B.-L., Wang, L., Li, X., Yang, K., Chen, D., and Sun, L.: Evaluation of evapotranspiration estimates for two river basins on the Tibetan Plateau by a water balance method, J. Hydrol., 492, 290–297, https://doi.org/10.1016/j.jhydrol.2013.04.005, 2013.
Yang, Y., Xiao, H., Wei, Y., Zhao, L., Zou, S., Yang, Q., and Yin, Z.: Hydrological processes in the different landscape zones of alpine cold regions in the wet season, combining isotopic and hydrochemical tracers, Hydrol. Process., 26, 1457–1466, https://doi.org/10.1002/hyp.8275, 2012.
Yao, T.: Tackling on environmental changes in Tibetan Plateau with focus on water, ecosystem and adaptation, Sci. Bull., 64, 417, https://doi.org/10.1016/j.scib.2019.03.033, 2019.
Ye, Q., Zong, J., Tian, L., Cogley, J. G., Song, C., and Guo, W.: Glacier changes on the Tibetan Plateau derived from Landsat imagery: mid-1970s-2000-13, J. Glaciol., 63, 273–287, https://doi.org/10.1017/jog.2016.137, 2017.
Yi, X., Yin, Y., Li, G., and Peng, J.: Temperature Variation in Recent 50 Years in the Three-River Headwaters Region of Qinghai Province, Acta Geogr. Sin., 66, 1451–1465, 2011.
Zeng, N., Ren, X., He, H., Zhang, L., Li, P., and Niu, Z.: Estimating the grassland aboveground biomass in the Three-River Headwater Region of China using machine learning and Bayesian model averaging, Environ. Res. Lett., 16, 114020, https://doi.org/10.1088/1748-9326/ac2e85, 2021.
Zhai, X., Yan, C., Xing, X., Jia, H., Wei, X., and Feng, K.: Spatial-temporal changes and driving forces of aeolian desertification of grassland in the Sanjiangyuan region from 1975 to 2015 based on the analysis of Landsat images, Environ. Monit. Assess., 193, 2, https://doi.org/10.1007/s10661-020-08763-8, 2021.
Zhang, G., Yao, T., Piao, S., Bolch, T., Xie, H., Chen, D., Gao, Y., O'Reilly, C. M., Shum, C. K., Yang, K., Yi, S., Lei, Y., Wang, W., He, Y., Shang, K., Yang, X., and Zhang, H.: Extensive and drastically different alpine lake changes on Asia's high plateaus during the past four decades, Geophys. Res. Lett., 44, 252–260, https://doi.org/10.1002/2016gl072033, 2017.
Zhang, L., Su, F., Yang, D., Hao, Z., and Tong, K.: Discharge regime and simulation for the upstream of major rivers over Tibetan Plateau, J. Geophys. Res.-Atmos., 118, 8500–8518, https://doi.org/10.1002/jgrd.50665, 2013.
Zhang, L., Fan, J., Zhou, D., and Zhang, H.: Ecological Protection and Restoration Program Reduced Grazing Pressure in the Three-River Headwaters Region, China, Rangeland Ecol. Manag., 70, 540–548, https://doi.org/10.1016/j.rama.2017.05.001, 2017.
Zhang, T., Li, D., and Lu, X.: Response of runoff components to climate change in the source-region of the Yellow River on the Tibetan plateau, Hydrol. Process., 36, e14633, https://doi.org/10.1002/hyp.14633, 2022.
Zhang, W., Jin, H., Shao, H., Li, A., Li, S., and Fan, W.: Temporal and Spatial Variations in the Leaf Area Index and Its Response to Topography in the Three-River Source Region, China from 2000 to 2017, ISPRS Int. J. Geo-Inf., 10, 33, https://doi.org/10.3390/ijgi10010033, 2021.
Zhang, Y., Liu, S. Y., and Ding, Y. J.: Observed degree-day factors and their spatial variation on glaciers in western China, Ann. Glaciol., 43, 301–306, https://doi.org/10.3189/172756406781811952, 2006.
Zhang, Y., Fan, J., Wang, S., Zhang, H., and Guan, H.: An assessment and analysis of constraint factors on ecological carrying capacity and ecological security for the Sanjiangyuan Region, Shou Lei Xue Bao, 39, 360–372, 2019.
Zhao, Q., Ye, B., Ding, Y., Zhang, S., Yi, S., Wang, J., Shangguan, D., Zhao, C., and Han, H.: Coupling a glacier melt model to the Variable Infiltration Capacity (VIC) model for hydrological modeling in north-western China, Environ. Earth Sci., 68, 87–101, https://doi.org/10.1007/s12665-012-1718-8, 2012.
Zhao, Q., Ding, Y., Wang, J., Gao, H., Zhang, S., Zhao, C., Xu, J., Han, H., and Shangguan, D.: Projecting climate change impacts on hydrological processes on the Tibetan Plateau with model calibration against the glacier inventory data and observed streamflow, J. Hydrol., 573, 60–81, https://doi.org/10.1016/j.jhydrol.2019.03.043, 2019.
Zheng, H., Zhang, L., Zhu, R., Liu, C., Sato, Y., and Fukushima, Y.: Responses of streamflow to climate and land surface change in the headwaters of the Yellow River Basin, Water Resour. Res., 45, W00A19, https://doi.org/10.1029/2007wr006665, 2009.
Zhou, D. and Huang, R.: Response of water budget to recent climatic changes in the source region of the Yellow River, Chinese Sci. Bull., 57, 2155–2162, https://doi.org/10.1007/s11434-012-5041-2, 2012.
Zhu, M., Yao, T., Yang, W., Wu, G., Li, S., Zhao, H., and Thompson, L. G.: Possible Causes of Anomalous Glacier Mass Balance in the Western Kunlun Mountains, J. Geophys. Res.-Atmos., 127, e2021JD035705, https://doi.org/10.1029/2021jd035705, 2022.