the Creative Commons Attribution 4.0 License.
the Creative Commons Attribution 4.0 License.
 | 24 Mar 2023
Semi-continuum modeling of unsaturated porous media flow to explain Bauters' paradox
Miloslav Šír
Tomáš Fürst
Rostislav Vodák
In the gravity-driven free infiltration of a wetting liquid into a homogeneous unsaturated porous medium, the flow pattern is known to depend significantly on the initial saturation. Point source infiltration of a liquid into an initially dry porous medium produces a single finger with an oversaturated tip and an undersaturated tail. In an initially wet medium, a diffusion-like plume is produced with a monotonic saturation profile. We present a semi-continuum model, based on a proper scaling of the retention curve, which is discrete in space and continuous in time. We show that the semi-continuum model is able to describe this transition and to capture the experimentally observed dependence of the saturation overshoot and the finger velocity on the initial saturation.
- Article
(6212 KB) - Full-text XML
- BibTeX
- EndNote


The infiltration of rainwater into soil forms an essential part of the hydrological cycle. Therefore, research on the movement of water in soil has long been a focus of attention. The origins of infiltration research were substantially influenced by the idea to describe the movement of water in soil by diffusion-like models (Richards, 1931). Later, it was discovered that – even in homogeneous porous materials – flow may become spatially very inhomogeneous. Most of the infiltrating water flows through preferential pathways, leaving islands of dry material behind (Glass et al., 1988). This type of flow is well described by a semi-continuum model introduced in Vodák et al. (2022). In this paper, we demonstrate that this semi-continuum model captures infiltration into an unsaturated homogeneous porous medium comprehensively, in the sense that it correctly describes the experimentally observed complicated transition between the preferential and diffusion-like flow regimes.
There are three types of preferential flow (Nimmo, 2021), namely macropore flow, funnel flow, and finger flow. Macropore flow proceeds through individual large pores that are highly conductive. The funnel flow is the result of heterogeneity of soil or rock hydraulic properties. Both macropore flow and funnel flow are features of non-homogeneous porous media. However, preferential flow (also known as finger flow) also occurs in a homogeneous medium and is believed to be caused by the wetting front instability (Glass et al., 1989a; Bauters et al., 2000; Sililo and Tellam, 2005; Aminzadeh and DiCarlo, 2010; DiCarlo, 2013; Wei et al., 2014; Cremer et al., 2017; Pales et al., 2018). A finger consists of two parts, namely an oversaturated finger tip followed by a less saturated finger tail. It is widely accepted that this non-monotonicity of the saturation profile (i.e., saturation overshoot) is a necessary and sufficient condition of finger flow (DiCarlo, 2004; Rezanezhad et al., 2006).
It was experimentally observed that the magnitude of the saturation overshoot (i.e., the saturation difference between the finger tip and tail) depends on the infiltration rate (DiCarlo, 2004). For low influx, a stable wetting front forms without a saturation overshoot. For a larger flux, the saturation overshoot appears, and its magnitude increases with increasing flux up to a certain point, beyond which the magnitude of the overshoot decreases again. For high flow rates, the saturation overshoot disappears completely. There is also a strong dependence of the flow regime on the initial saturation of the porous medium (Bauters et al., 2000). For an initially dry medium, finger flow accompanied by saturation overshoot is observed. However, at a sufficiently high initial saturation (close to the saturated moisture limit), fingers do not form, and a stable front dominates with no saturation overshoot (see Fig. 3 in Bauters et al., 2000). Moreover, a non-monotonic dependence of the wetting front velocity and finger width on the initial saturation was reported. With increasing initial saturation, the fingers first become more narrow and faster, but a further increase in initial saturation makes them slow down, become thicker, and more irregular, before gradually disappearing completely and giving way to diffusion-like plumes with no saturation overshoot. This is counterintuitive because one would expect the finger velocity to increase with increasing initial saturation. We call this complicated transition from a finger-like regime to diffusion-like regime the Bauters' paradox, honoring the first author of the seminal article Bauters et al. (2000). Note that the preferential flow occurs also in a highly saturated porous medium that is super-hydrophilic (Chen et al., 2022b). This complex behavior is not consistent with the standard theory which (1) does not allow for saturation overshoot behavior (Fürst et al., 2009), (2) predicts an increase in wetting front velocity with increasing initial saturation (Bear, 1972), and (3) does not allow for preferential flow in a homogeneous medium.
The standard model for unsaturated porous media flow is the Richards' equation (RE; Richards, 1931). RE is a combination of a mass balance equation and the Darcy–Buckingham law (Bear, 1972). It was shown, by means of a mathematical proof, that in the case of a constant influx into an initially dry homogeneous porous medium, RE is incompatible with saturation overshoot because the RE is unconditionally stable (Fürst et al., 2009). The solution of the RE is stable in this case, regardless of whether the hysteresis of the retention curve is included, because the hysteresis of the retention curve never comes into action. Thus, RE is not able to capture finger flow. There have been many attempts to model the flow in porous media differently; in principle, these attempts can be divided into continuum models (Hassanizadeh et al., 2002; Eliassi and Glass, 2002; Schneider et al., 2017; Brindt and Wallach, 2020; Beljadid et al., 2020; Cueto-Felgueroso et al., 2020; Ommi et al., 2022a, b), and pore-scale (discrete) models (Lenormand et al., 1988; Blunt and Scher, 1995; Primkulov et al., 2018, 2019; Wei et al., 2022). Another approach is to combine the advantages of continuous and discrete modeling (Glass et al., 2001; Glass and Yarrington, 2003; Liu et al., 2005; Liu, 2017). Liu et al. (2005) and Liu (2017) developed an active region model in which fractal flow patterns are incorporated into the continuum approach. Glass et al. (2001); Glass and Yarrington (2003) proposed a unique macro modified invasion percolation (MMIP) model, which is – in a single framework – able to capture finger flow, buoyancy-driven migration of gases through porous media, and rough surface flow. However, saturation is not treated as a continuous quantity in the MMIP model; thus, the model cannot reproduce the saturation overshoot or its dependence on initial saturation or influx rate. For a detailed review of the different types of modeling see, e.g., Rooij (2000), DiCarlo (2010), Xiong (2014), Hunt and Sahimi (2017), and Chen et al. (2022a).
Another attempt is reported in Kmec et al. (2019, 2021), who advocate for the so-called semi-continuum approach. In this approach, the porous medium is divided into a grid of blocks which are not considered infinitesimal – each block retains the nature of a porous medium, and it is characterized by its pressure–saturation relation, hydraulic conductivity, and porosity. Saturation is considered continuous in time but constant throughout each block (i.e., piecewise constant in space). Flow between neighboring blocks proceeds according to the Darcy–Buckingham law. The key feature of the semi-continuum approach is to account for the block size. This is done by an appropriate scaling of the retention curve with the block size (Vodák et al., 2022). As the block size decreases, the retention curve becomes more flat (i.e., its derivative decreases), while keeping the hysteresis effect constant. See Vodák et al. (2022) for more details and a physical justification.
The semi-continuum model was shown to reproduce all experimentally observed features of unsaturated porous medium flow in a long vertical tube well (Kmec et al., 2019). A two-dimensional version of the model was shown to correctly capture the transition between finger flow and diffusion-like flow, with increasing initial saturation (Kmec et al., 2021) for uniform infiltration imposed on the entire top boundary. Vodák et al. (2022) examined the limit of the semi-continuum model as the block sizes go to zero. They report a limit version of the model in the form of a partial differential equation with a Prandtl-type hysteresis operator (Visintin, 1994) under the derivative.
In this paper, we use a previously developed semi-continuum model and demonstrate that this model is able to fully reproduce Bauters' paradox – the transition from finger-like flow in an initially dry medium to diffusion-like flow in an initially wet medium for a point source infiltration. We show that the non-monotonic relation between initial saturation and flow velocity and initial saturation and saturation overshoot magnitude is captured correctly by the semi-continuum model.
Bauters' paradox
The authors of Bauters et al. (2000) used a Hele–Shaw cell ( cm) filled with homogeneous quartz sand, with a particle size between 0.60 and 0.85 mm. The used sand does not change its wettability according to the duration of contact with distilled water. Water was injected at a rate of 2 cm3 min−1 through a hypodermic needle located at the top of the chamber near the sand surface. The initial saturation was gradually increased from zero to the full field capacity. The results of the experiments can be summarized as follows:
-
Wetting front dependence on the initial saturation. As the initial saturation increases, the flow regime changes from an unstable finger-like to a stable diffusion-like flow. Three flow regimes can be distinguished, namely unstable, intermediate, and stable. During unstable flow, the finger width remains almost constant. This is consistent with theoretical analysis (Raats, 1973) and experimental observations (Selker et al., 1992; Rezanezhad et al., 2006). In the intermediate regime, the fingers gradually give way to a stable infiltration front. This type of flow transition has not yet been sufficiently investigated, neither theoretically nor experimentally. In the diffusion-like regime, the saturation and pressure profiles are monotonic, with no overshoot behavior. Moreover, the wetting front is much wider than the finger.
-
The width and velocity of the fingers. With increasing initial saturation, the fingers first become faster and narrower, and then they become slower and wider.
-
Pressure and saturation overshoot magnitude. The magnitude of the saturation overshoot decreases with increasing initial saturation of the medium. Moreover, a hyperbolic relation between initial saturation and saturation overshoot magnitude is observed. The same holds for the pressure overshoot magnitude.
Although the experiments of Bauters et al. (2000) are well known in the soil science community (currently more than 90 citations in the Scopus database), there is no unified explanation for the observed paradox. Moreover, almost none of the citing authors comment on this interesting phenomenon. To our best knowledge, there are only three attempts to model or explain Bauters' paradox. Chapwanya and Stockie (2010) used a dynamic capillary pressure term to model the effect of initial saturation. However, a small artificial perturbation in the influx had to be used to initiate the finger flow, and the influx was imposed over the entire top boundary instead of a point. The finger velocity was independent of the initial saturation of the medium. Moreover, the authors did not focus on the non-monotonic dependence of finger width on initial saturation.
Another attempt was undertaken by Joekar-Niasar and Hassanizadeh (2012) and Masoodi and Pillai (2012). These authors hypothesized that the non-monotonic velocity of the front is due to a tradeoff between conductivity and capillary pressure. With increasing initial saturation, the conductivity increases because there is more trapped air in the medium. Beyond a critical value of initial saturation, the trapping does not change significantly, but the matric potential decreases. As a result, the wetting front slows down. This means that the intrinsic permeability of the medium is not a constant but rather a function of saturation.
Finally, Kmec et al. (2021) used a semi-continuum approach to investigate the effect of the initial saturation on the wetting flow formation. Similar to Chapwanya and Stockie (2010), the influx was imposed on the entire top boundary. The nonlinear dependence of the finger width was reproduced (see Fig. 6 in Kmec et al., 2021). The finger velocity dependence on the initial saturation was not studied due to different choice of the top boundary condition than in Bauters et al. (2000).
This article presents simulations of the point source infiltration used in Bauters et al. (2000) by means of the semi-continuum model. We show that all the experimentally observed features of Bauters' paradox are reproduced well.
2.1 Semi-continuum model
Let us recall the 2D semi-continuum model that was introduced by Kmec et al. (2021). Here, we use the same model with an appropriate scaling of the retention curve with the block size (Vodák et al., 2022). The porous medium is represented as a rectangular grid of N×M square blocks of uniform size Δx×Δx. Each block is denoted by its row and column indices [i,j]. Saturation St(i,j) and pressure Pt(i,j) of the wetting phase (liquid) at time t are assumed constant within each block (i,j), and the pressure of the non-wetting phase (gas) is assumed to be zero everywhere. Each block retains the nature of a porous medium, and it is characterized by a hysteretic pressure–saturation relation (main wetting branch pw(S), main draining branch pd(S)), non-hysteretic hydraulic conductivity (intrinsic permeability κ; relative permeability k(S)), and porosity θ. The invading wetting liquid is characterized by its density ρ and dynamic viscosity μ. Acceleration due to gravity is denoted by g. The semi-continuum model tracks the following three key quantities: the saturation of the wetting phase in each block at time t, the pressure Pt(i,j) (Pa) of the wetting phase in each block at time t, and the fluxes (ms−1) of the wetting phase between neighboring blocks (i1,j1) and (i2,j2) at time t.
At each instant, the saturation in each block is updated according to the discretized mass balance law in the following way:
where θ (−) denotes the porosity of the material, Δt is a time step, and Δx is the block size. A backward scheme can also be used (Kmec et al., 2021), but it slows the numerical algorithm unnecessarily.
The next step is to update the capillary pressure in each block according to the capillary pressure operator P(S). The capillary pressure operator consists of the main wetting and draining branches defined by van Genuchten Eq. (5). To complete the capillary pressure operator, a hysteresis model is included (Parker and Lenhard, 1987). We use a similar approach to the play-type hysteresis used, e.g., in Rätz and Schweizer (2013) and Schweizer (2017). All scanning curves are straight lines with a very large gradient KPS. Once a block (in the wetting mode between the two main branches) reaches the main wetting branch along a scanning curve, it clings to it and continues along it. A similar procedure applies for the block in the draining mode.
Finally, the flux between neighboring blocks is updated according to the Darcy–Buckingham law (Bear, 1972):
where κ (m2) denotes the intrinsic permeability, ρ (kg m−3) the fluid density, g (m s−2) acceleration due to gravity, and μ (Pas) the dynamic viscosity of fluid. P(S) is the capillary pressure operator. The relative permeability function k(S) is modeled by the form derived in Mualem (1976), Mualem and Dagan (1978), and Van Genuchten (1980):
where λ (−) is a free parameter. Let us denote, with γ(S)=κk(S), the effective permeability of the porous medium.
We use the following discrete implementation of the Darcy–Buckingham law (Eq. 2):
Thus, for the hydraulic conductivity between blocks, we use the geometric mean of the conductivity values in the respective blocks. This choice of averaging has the desirable property of being small if the permeability of one of the blocks is small. The force of gravity is included only for the vertical fluxes j1=j2. After setting the fluxes between neighboring blocks, the time is updated to t+Δt, and we proceed back to Eq. (1).
2.2 Scaling of the retention curve
A crucial idea behind the semi-continuum model is the appropriate scaling of the main branches of the retention curve, which was first introduced by Vodák et al. (2022). The scaling of the retention curve is based on the fact that the shape of the retention curve depends on the size (especially the height) of the sample on which the measurement is made (Larson and Morrow, 1981; Hunt et al., 2013; Silva et al., 2018).
The simple scaling mechanism introduced in Vodák et al. (2022) is used here in which the main branches of the retention curve take the form of the standard van Genuchten model (Van Genuchten, 1980). More details about the proposed scaling of the retention curve and its sample size dependency are given in the following section. However, the detailed mathematical and physical justification is already published in Vodák et al. (2022); hence, for a deeper understanding, we refer to this paper.
For the reference block size Δx0, the retention curve is modeled by the following formula:
where S denotes saturation, is the capillary pressure on the wetting branch, is the capillary pressure on the draining branch, and are parameters of the main wetting branch, and and are parameters of the main draining branch.
The idea of the retention curve scaling is the following. For a block size the retention curve becomes more flat, but the distance between the main wetting and draining branches remains the same. Thus, for the main wetting branch,
with cw, such that i.e.,
Clearly, for Δx=Δx0, the relation in Eq. (6) reduces to Eq. (5a), while for Δx→0, we obtain . For the main draining branch pd(S,Δx) the scaling is analogous to Eqs. (6) and (7).
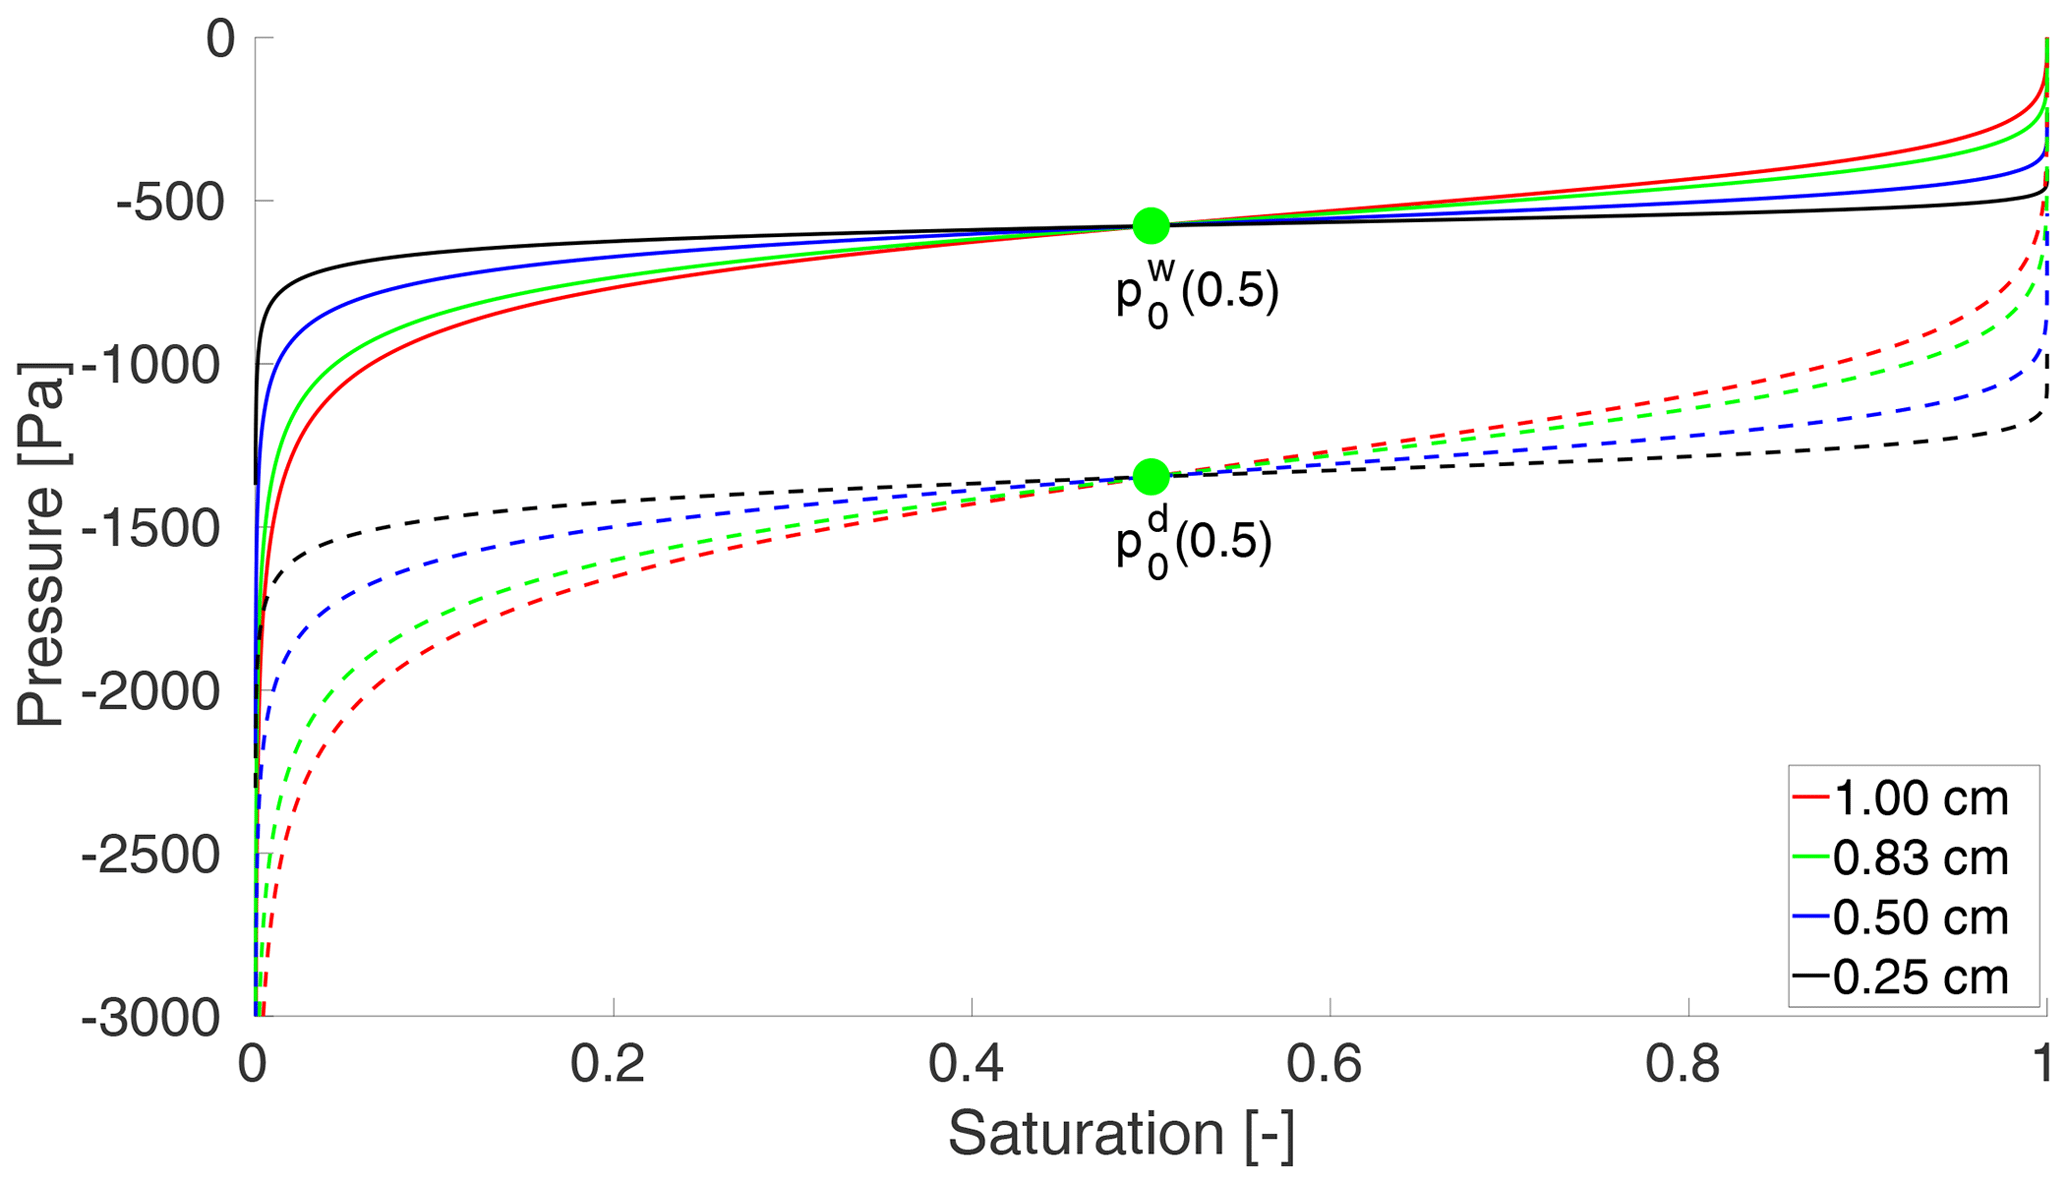
Figure 1The scaling of the retention curve for sand. The solid lines denote the main wetting branches, and the dashed lines denote the main draining branches for the respective value of Δx. The green curve represents the reference sample for cm ≈0.83 cm. As the retention curve becomes more flat, but the distance between the main wetting and draining branches remains the same. The main wetting and draining branches rotate around fixed values and , respectively.
The scaling of the retention curve for sand is shown in Fig. 1 for the reference block size cm ≈0.83 cm. Determining the dimension of Δx0 is not trivial. In Sect. 3 it is explained how this dimension can be determined using the results of Bauters et al. (2000).
2.3 Concept of the semi-continuum model and its limit in the spatial variable
The scaling of the retention curve, i.e., the dependence of the capillary pressure–saturation relation on the block size, is not a common approach in flow modeling. However, the dependence of the experimentally determined retention curve on the porous medium sample size has been observed for a long time (Larson and Morrow, 1981; Mishra and Sharma, 1988; Zhou and Stenby, 1993; Perfect et al., 2004; Hunt et al., 2013; Ghanbarian et al., 2015). Note that this dependence on the sample volume also applies to other hydraulic and physical properties such as porosity or permeability (Mishra and Sharma, 1988; Ewing et al., 2010; Ghanbarian et al., 2017, 2021). In classical continuum mechanics, this scaling problem is defined away by the concept of the representative elementary volume (REV). REV is the smallest volume for which the key physical quantities (e.g., saturation and pressure) can still be considered smooth. However, if the sample of a porous medium is smaller than REV, then key physical quantities, such as the retention curve, are strongly dependent on the sample size, and the continuum assumption is violated (Kouznetsova et al., 2001; White et al., 2006; Al-Raoush and Papadopoulos, 2010; Al-Raoush, 2012). The crucial idea of the semi-continuum model is to include the pressure–saturation dependency in the model, i.e., to scale the retention curve according to the block size. In the semi-continuum model, a block represents a real sample of the porous material. This makes the semi-continuum model fundamentally different from numerical schemes for solving partial differential equations where the block plays only a discretization (i.e., mathematical) role, and regardless of the block size, the retention curve remains the same. In the semi-continuum model, the computational mesh (the blocks) takes into account the dependence of the physical parameters on the size of the blocks. Surprisingly, the idea of taking REV size into account in modeling porous media has been around for a long time. For instance, in White et al. (2006), the authors estimated the size of the REV and used it as a lower limit for the size of the finite elements. They argue that the use of smaller elements would lead to violation of continuum assumptions, and thus the continuum approximation would no longer be appropriate. The same idea is used in the semi-continuum model. For blocks smaller than the REV, the scaling of the retention curve must be included because the continuum approximation is no longer adequate. Because we are interested in the description of flow phenomena below the REV scale, we need to include the dependence of the retention curve on the block size. This scaling of the retention curve must meet a physically justified requirement that the nature of the flow is preserved across all levels of block size. This means that the fluxes between neighboring blocks must not change when Δx changes. Given Eq. (4), if Δx decreases by half, then the fluxes increase by a factor of 2 if the scaling of the retention curve is not included. Therefore, a linear scaling of the retention curve is introduced in Eq. (6), so the fluxes between blocks remain the same as Δx decreases. For more details, see Figs. 4–6 in Vodák et al. (2022), which show the numerical convergence of the semi-continuum model in 1D and 2D.
The natural question is what the limit of the semi-continuum model would be as Δx→0. We tried to answer this question in Vodák et al. (2022) and derived the limit equation in a single spatial dimension as follows:
In this equation, κ denotes the intrinsic permeability, ρ the fluid density, g acceleration due to gravity, μ the dynamic viscosity of fluid, and S the saturation. The values C1 (Pa) and C2 (Pa) denote the constant limits of the main wetting and draining branches, respectively. The limit is a partial differential equation containing a Prandtl-type hysteresis operator PH under the space derivative. If we are located on the main wetting or draining branches, then the limit equation becomes a hyperbolic differential equation. Between the two main branches (i.e., we are located on the scanning curve), the limit represents a parabolic differential equation. It means the limit switches between parabolic and hyperbolic types of equation. The limit equation is a new type of mathematical model – we are not aware of any research that has investigated equations of this type. Note that the RE is a parabolic type equation – that is why it is only able to simulate the diffusion-like flow regime (Fürst et al., 2009).
We want to completely reproduce the experiments reported in Bauters et al. (2000). The authors report that water was injected at a rate of 2 cm3 min−1 through a hypodermic needle located near the sand surface. Thus, a point source infiltration is modeled such that a constant flux is prescribed across 1 cm of the top edge (in the middle). Zero discharge at the bottom boundary is prescribed, for simplicity. This choice of the bottom boundary condition does not affect the studied phenomena. All parameters used for the simulations are given in Table 1. The parameter λ=0.8, which is consistent with experimental measurements (Schaap and Leij, 2000).
Table 1Parameters used to reproduce the experiments of Bauters et al. (2000). Parameters for sand were adopted from Schroth et al. (1996) and DiCarlo (2004).

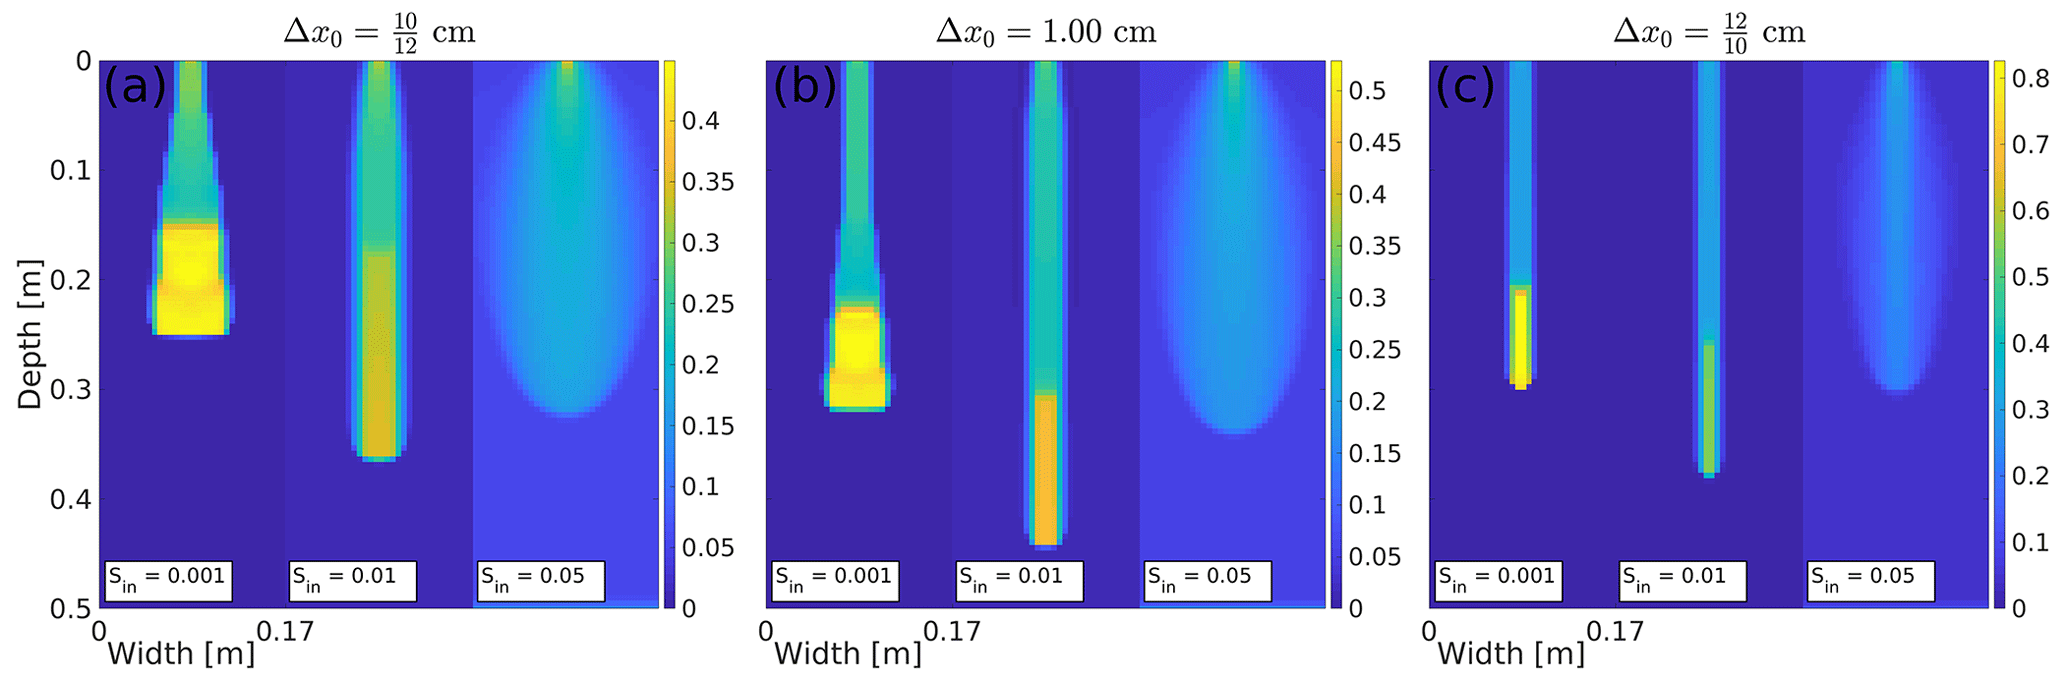
Figure 2Snapshots of the saturation field for various Δx0 for an initially dry (Sin=0.001), a medium dry (Sin=0.01) and a wet (Sin=0.05) porous material. The moisture profiles for (a) cm, (b) Δx0=1.00 cm and (c) cm are shown at (a) 30, (b) 30, and (c) 20 min, respectively. Saturation values are color coded according to the color bar on the right.
3.1 Adjustment of reference block size for sand
First of all, the reference block size Δx0 is unknown. This is a parameter of the semi-continuum model that has to be set. The parameter Δx0 was calibrated by simulating the experiments of Bauters et al. (2000). In the simulation, we use the parameters for sand adopted from Schroth et al. (1996) and DiCarlo (2004) (see Table 1). We ran several simulations of the semi-continuum model with Δx0 equal to , 1.00, and cm. The moisture profile was calculated for three different initial saturation, namely a dry (0.001), a medium dry (0.01) and a wet (0.05) porous medium. The parameters used for simulations are given in Table 1, except for the block size Δx=0.50 cm and A=17 cm (horizontal width of the chamber), which were changed in order for the simulations not to be extremely time-consuming. The moisture profiles for all values of Δx0 are depicted in Fig. 2.
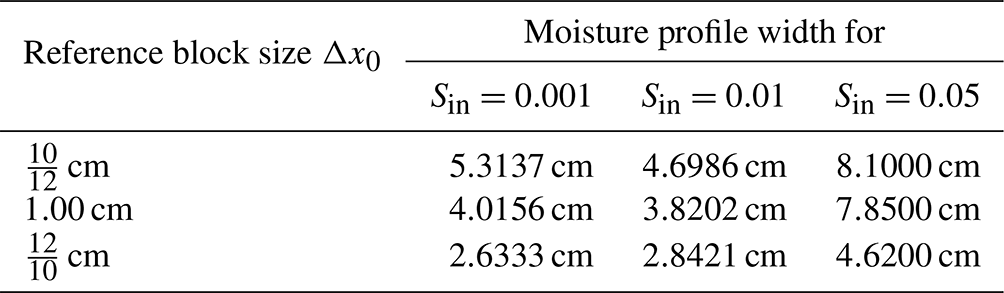
We want to choose the parameter Δx0 for which the non-monotonic behavior of the moisture profiles widths occurs. Table 2 shows the width of the moisture profiles. The width of the moisture profile is calculated in the following way. First, we calculate the width of each row, which equals nrow×Δx, where nrow is a number of blocks in the row for which the saturation exceeds 0.07 during the simulation, and Δx is the size of the block. The width of the moisture profile is then calculated as the average width of all rows with non-zero width. It is clear that the most pronounced non-monotonic behavior of the moisture profiles widths is given for cm (Fig. 2a) and is therefore the most appropriate.
Table 2The width of the moisture profiles for different values of Δx0.
Note that the width of the finger is not constant for an initially dry porous medium, although it has been experimentally observed (Bauters et al., 2000). This artificial behavior is due to the unrealistic homogeneity of porous medium used for the simulation. Although, in reality, the porous medium is homogeneous, this does not mean that all the characteristics are identical in each block of the simulation. If a small distribution of the intrinsic permeability is included, then the finger width will be constant. This is demonstrated in the next section.
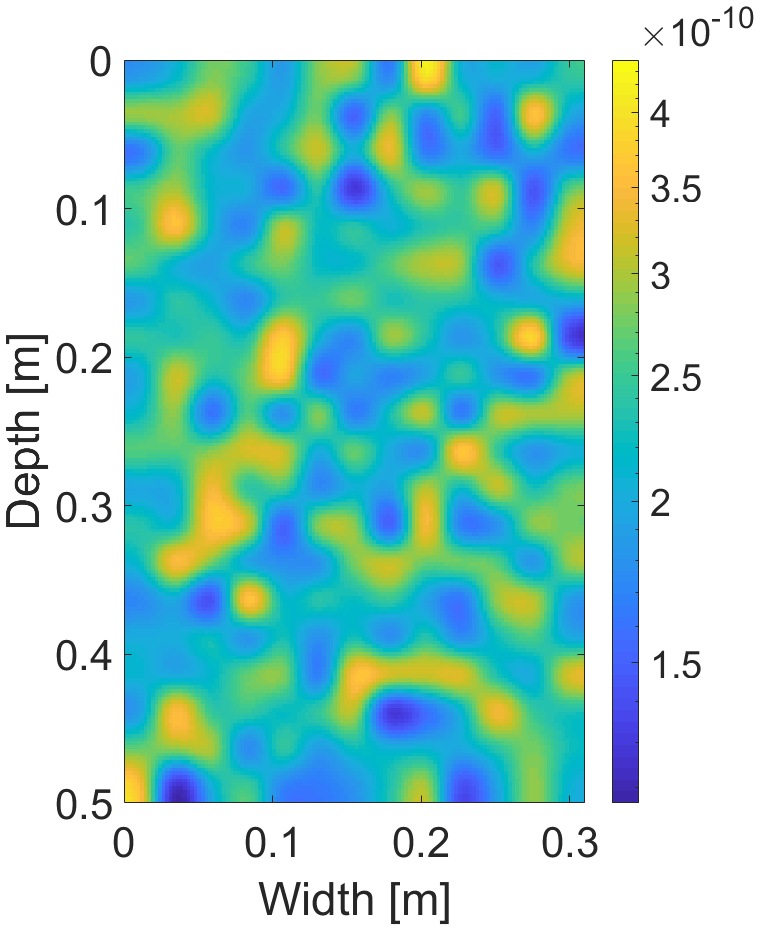
Figure 3The distribution of the intrinsic permeability κ (m2), which satisfies . Intrinsic permeability values are color coded according to the color bar on the right.
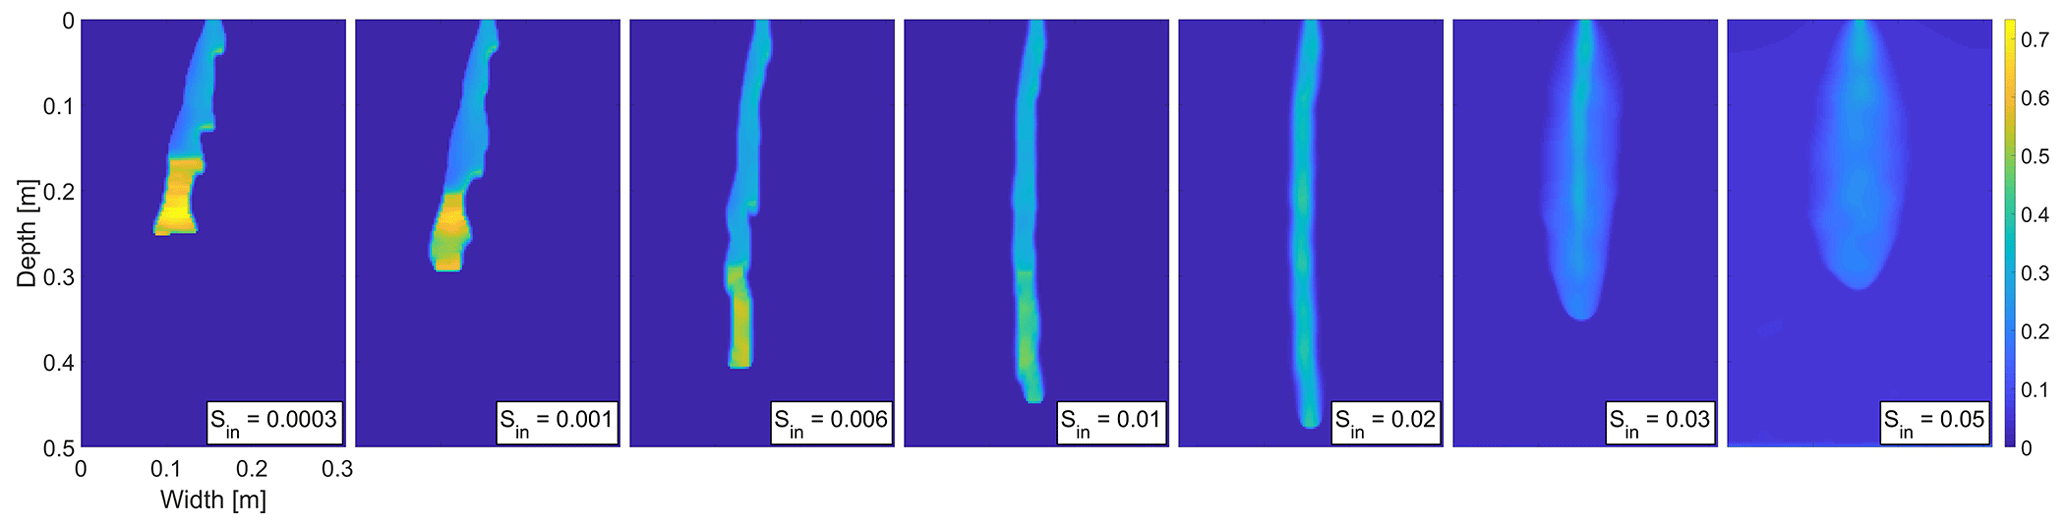
Figure 4Snapshot of the saturation field at 25 min for seven different values of the initial saturation. Saturation values are color coded according to the color bar on the right. Initial saturation of the medium increases from left to right.
3.2 Wetting front dependence on initial saturation
Let us now demonstrate the ability of the semi-continuum model to capture Bauters' paradox. As mentioned above, even in homogeneous porous medium, all characteristics are not identical in each block. Thus, the spatially correlated distribution of the intrinsic permeability is introduced. Such distribution was also used, e.g., in Kmec et al. (2021). The distribution satisfies , and the mean of the intrinsic permeability approximately equals κ. The distribution of the values of intrinsic permeability is shown in Fig. 3. The distribution of the intrinsic permeability is not the cause of Bauters' paradox. However, with such a distribution, more physical-looking fingers evolve. For a simulation of Bauters' paradox without the intrinsic permeability distribution, see Fig. A1 in the Appendix.
Figure 4 shows a snapshot of the saturation field at 25 min for seven different values of the initial saturation. It can be seen that, as the initial saturation increases, the finger first becomes faster and narrower. Then the finger slows down and widens and finally gives way to a diffusion-like plume. The transition between unstable and stable flow is also in agreement with the experimental observation. The non-monotonic behavior of the finger width and velocity is captured correctly, in addition to the shape of the wetting front. Moreover, a stable wetting front appears for the initial saturation that is higher than 0.03, which is also consistent with experiments. Note that the authors of Bauters et al. (2000) only recorded the wetting front patterns 15 cm from the top. Therefore, we are not able to compare the wetting fronts at the upper part of the chamber.
One may wonder if this complex behavior depends on the choice of the intrinsic permeability distribution. We generated seven different distributions (see Fig. A2), and the same simulations as above were performed. Snapshots of the saturation field 25 min from the beginning of the infiltration for seven different values of the initial saturation are shown in Figs. A3–A9. The figures show that the character of the flow remains the same for all types of distributions. Thus, the distribution of the intrinsic permeability does not affect the transition from the finger flow to the diffusion-like flow.
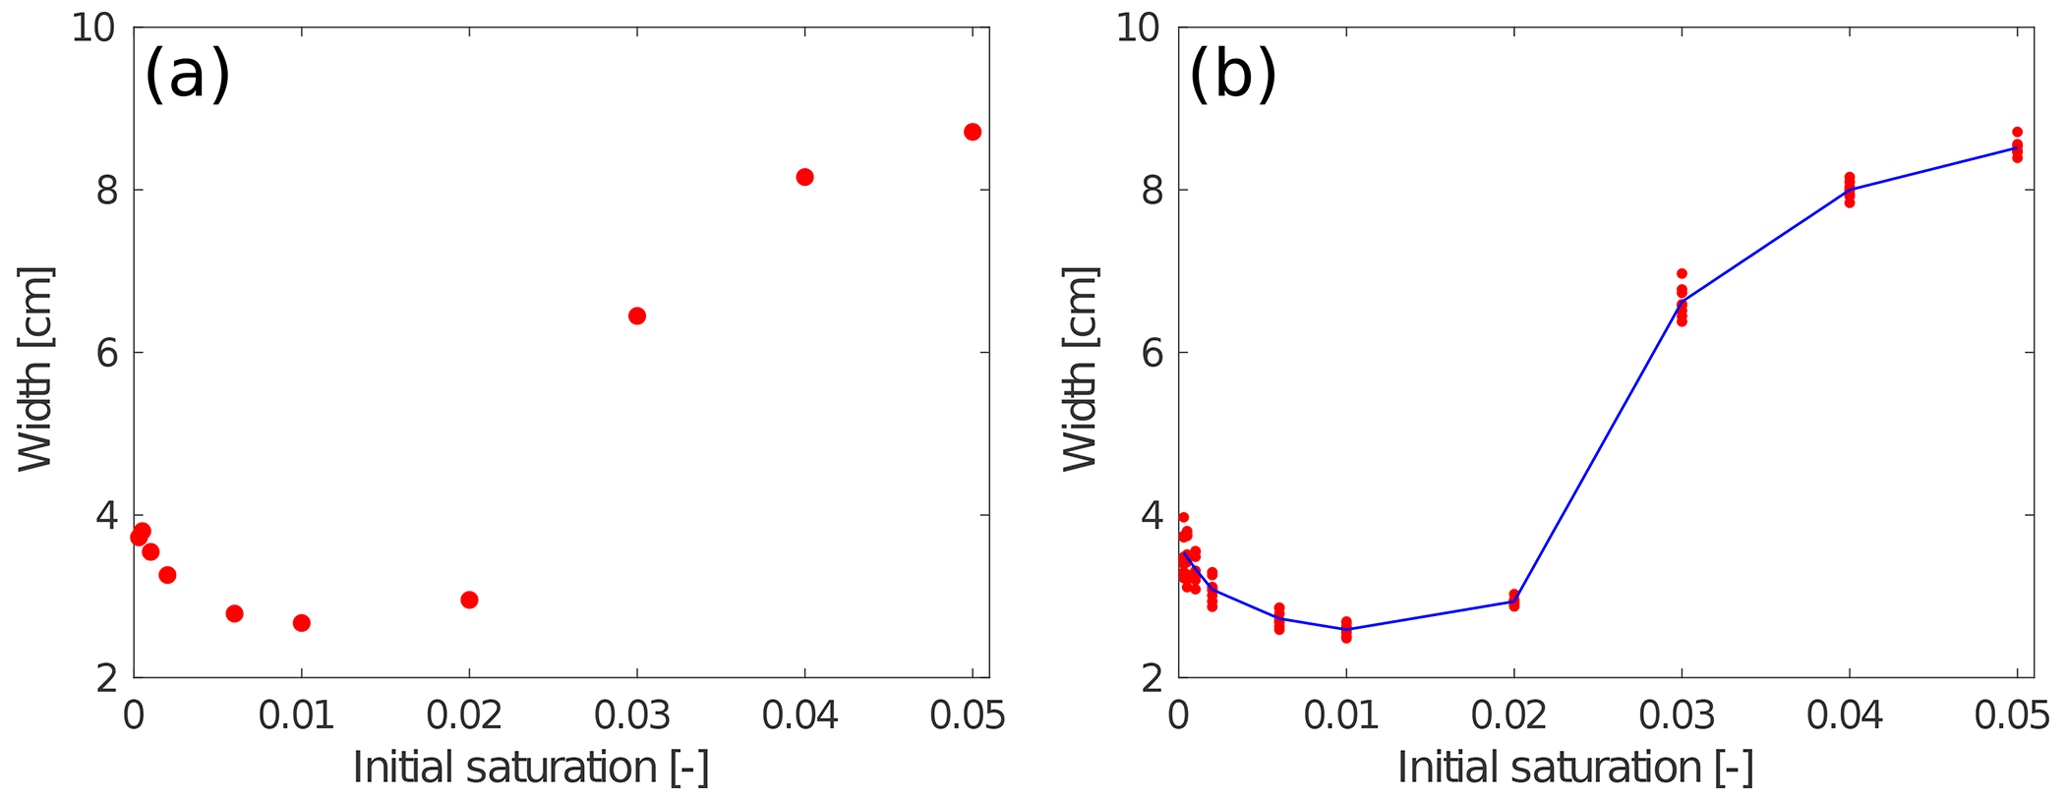
Figure 5The width of the finger (or wetting front) at t=25 min is plotted against the initial saturation. (a) The distribution of the intrinsic permeability given by Fig. 3. (b) All simulations given by eight different distributions of the intrinsic permeability (see Fig. 3 and Fig. A2). The blue line connects the averages.
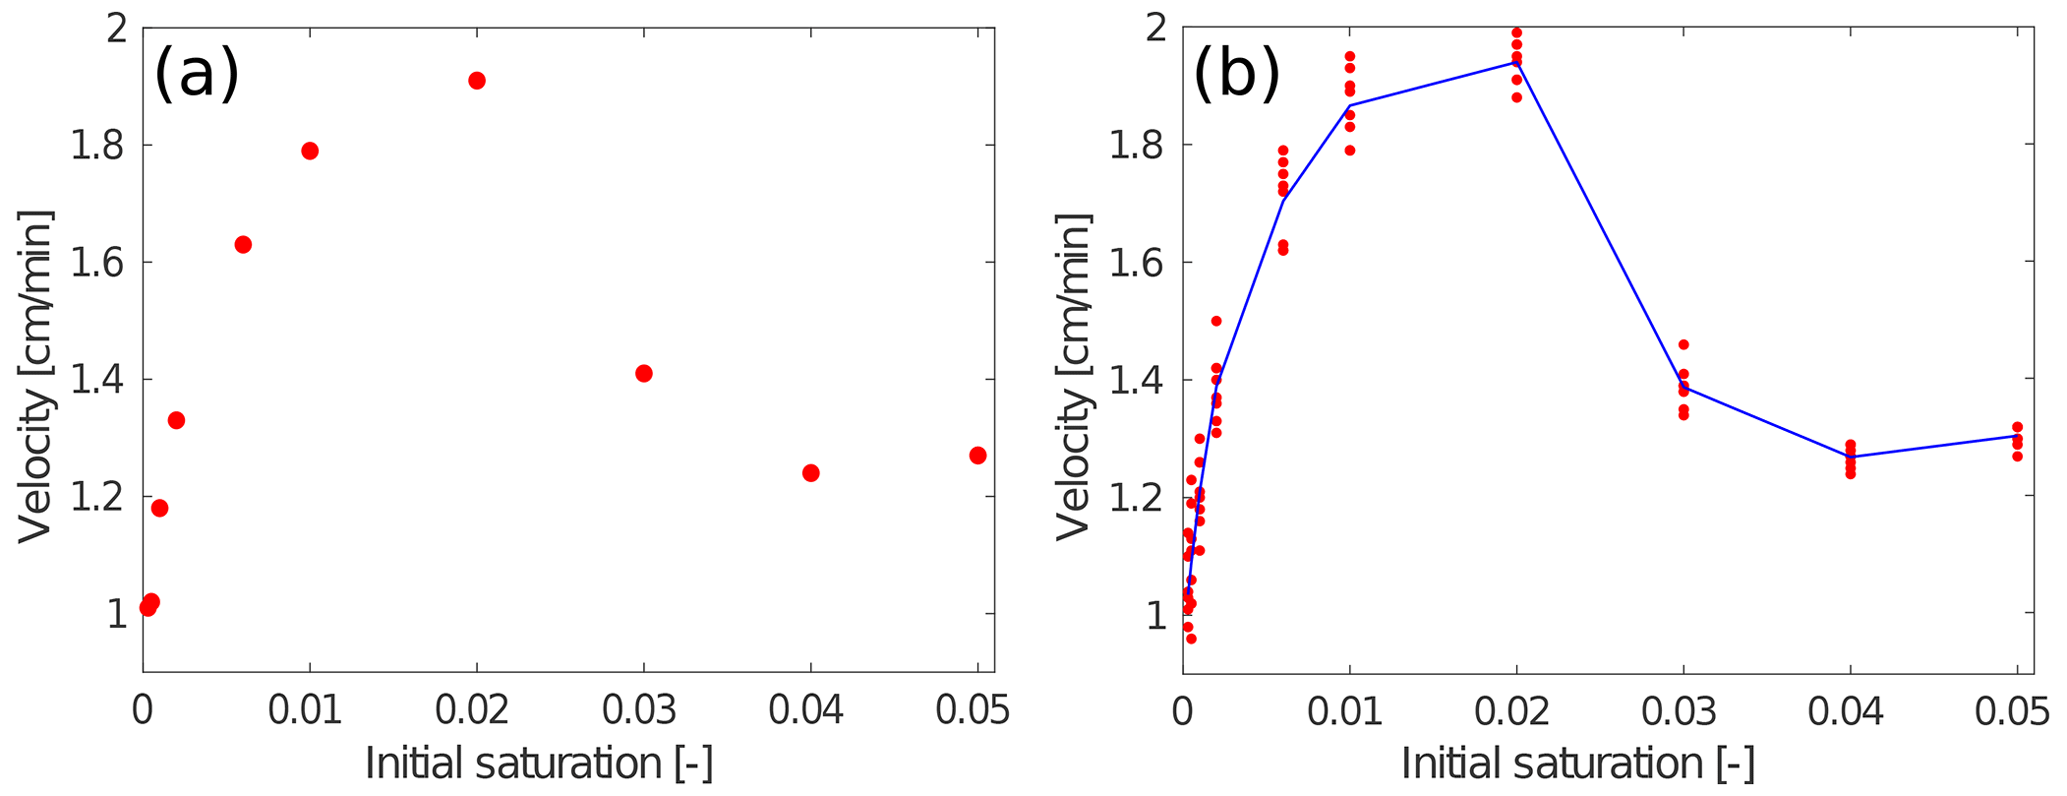
Figure 6The velocity of the wetting front at t=25 min is plotted against the initial saturation. (a) The distribution of the intrinsic permeability given by Fig. 3. (b) All simulations given by eight different distributions of the intrinsic permeability (see Figs. 3 and A2). The blue line connects the averages.
3.3 Width and velocity of the fingers
Figure 5a shows the width of the fingers (moisture profiles) 25 min from the beginning of infiltration for the simulation shown in Fig. 4 (wetting profiles for and 0.04 are not included in Fig. 4 to make the figure more readable). The width of each moisture profile is calculated in the same way as was used in Table 2. We can clearly see that the finger width first slightly decreases and then increases. The narrowest finger is produced for Sin=0.01 (2.70 cm) which is consistent with experiments (see Fig. 5 in Bauters et al., 2000). Let us note that the finger width for Sin=0.0003 (3.74 cm) is slightly smaller than for Sin=0.0005 (3.82 cm). However, this is due to the distribution of the intrinsic permeability. Indeed, the finger width for all simulations given by eight different distributions of the intrinsic permeability (see Figs. 3 and A2) is depicted in Fig. 5b. We observe that – on average – the finger width for the lowest initial saturation used in the simulation is higher than for Sin=0.0005.
For finger velocity, we proceed similarly, i.e., we find the bottom-most block of the finger whose saturation exceeds 0.07. The depth of the bottom-most block defines the current length of the finger. Finger velocity is computed as the rate of change in the finger length in time. The finger (or wetting front) velocity at t=25 min for the simulation given by Fig. 4 is summarized in Fig. 6a. The advance of the wetting front was slower for the diffusion-like behavior compared to finger flow (but higher than for Sin=0.002). This is rather counterintuitive, since the classical theory as the RE predicts an increase in velocity with increasing initial saturation. The highest finger velocity is observed for Sin=0.02, and it is approximately 5 times lower than the highest finger velocity experimentally observed in Bauters et al. (2000) (for Sin=0.01). This is consistent because we used 4 times lower influx in our simulations compared to the experiments. We observed that the character of the dependence remains the same for different distributions of the intrinsic permeability (see Fig. 6b).
3.4 Water content at and behind the wetting front
Let us now examine the change in saturation at and behind the wetting front (a finger tip). The difference between the saturation of the tip and the tail is called the saturation overshoot magnitude. To quantify the saturation overshoot magnitude, the saturation is averaged for each row, which gives the saturation profiles in 1D. Averaging is applied only to those blocks whose saturation exceeds 0.07. Saturation overshoot magnitude is then given as an average saturation at the finger tip minus an average saturation at the finger tail. In the case of diffusion-like flow with no overshoot, we average the bottom 20 cm of the saturation profile and subtract the average of the rest of the profile.

Figure 7Dependence of the saturation overshoot magnitude on initial saturation at 25 min. Saturation overshoot magnitude is computed even for diffusion-like profiles (see the text for the methodology). A hyperbolic relation fitted to the simulated data has a R2 value of 0.990.
The dependence of saturation overshoot magnitude on initial saturation at t=25 min is shown in Fig. 7. We see that there is a hyperbolic decay relationship between the initial saturation and the saturation overshoot magnitude (R2=0.990). This is consistent with the experimental observation (Bauters et al., 2000). There is still a minor saturation overshoot for Sin=0.02. This is again consistent with the experiments, where the authors observed a saturation overshoot for Sin=0.02 but no overshoot for Sin=0.03.
Let us note that the distribution of the intrinsic permeability causes higher variability in the saturation profiles. Without this distribution, the accuracy of the fit is better. This was shown in the 1D semi-continuum model, where the hyperbolic fit was obtained with R2=0.995 (see Fig. 3.6. in Kmec, 2021).
3.5 Sensitivity analysis
The parameters such as infiltration rate and material characteristics are not fitted to obtain the best results. Let us first demonstrate the effect of the boundary flux on the flow regime. Since all the simulations are computationally demanding, a larger block size Δx=0.50 cm is used, while the rest of parameters remained the same (see Table 1).
Five different values of the boundary flux qB were used, ranging from to m s−1. The baseline simulations are given for m s−1. For each value of qB, 28 different simulations are performed, with variable initial saturation (seven different initial saturation simulations) and variable intrinsic permeability distribution (four different distributions; see Fig. B1). Note that 140 different simulations were performed in total. The same scheme was applied to all other sensitivity analysis simulations, i.e., the analysis was always performed for seven different values of initial saturation and four different distributions of intrinsic permeability. Figure 8 shows the width and the velocity of the fingers (moisture profiles) for five different values of boundary flux qB and for seven different values of the initial saturation Sin. For a given value qB and Sin, the average width and velocity of the four different distributions of the intrinsic permeability are calculated and plotted.
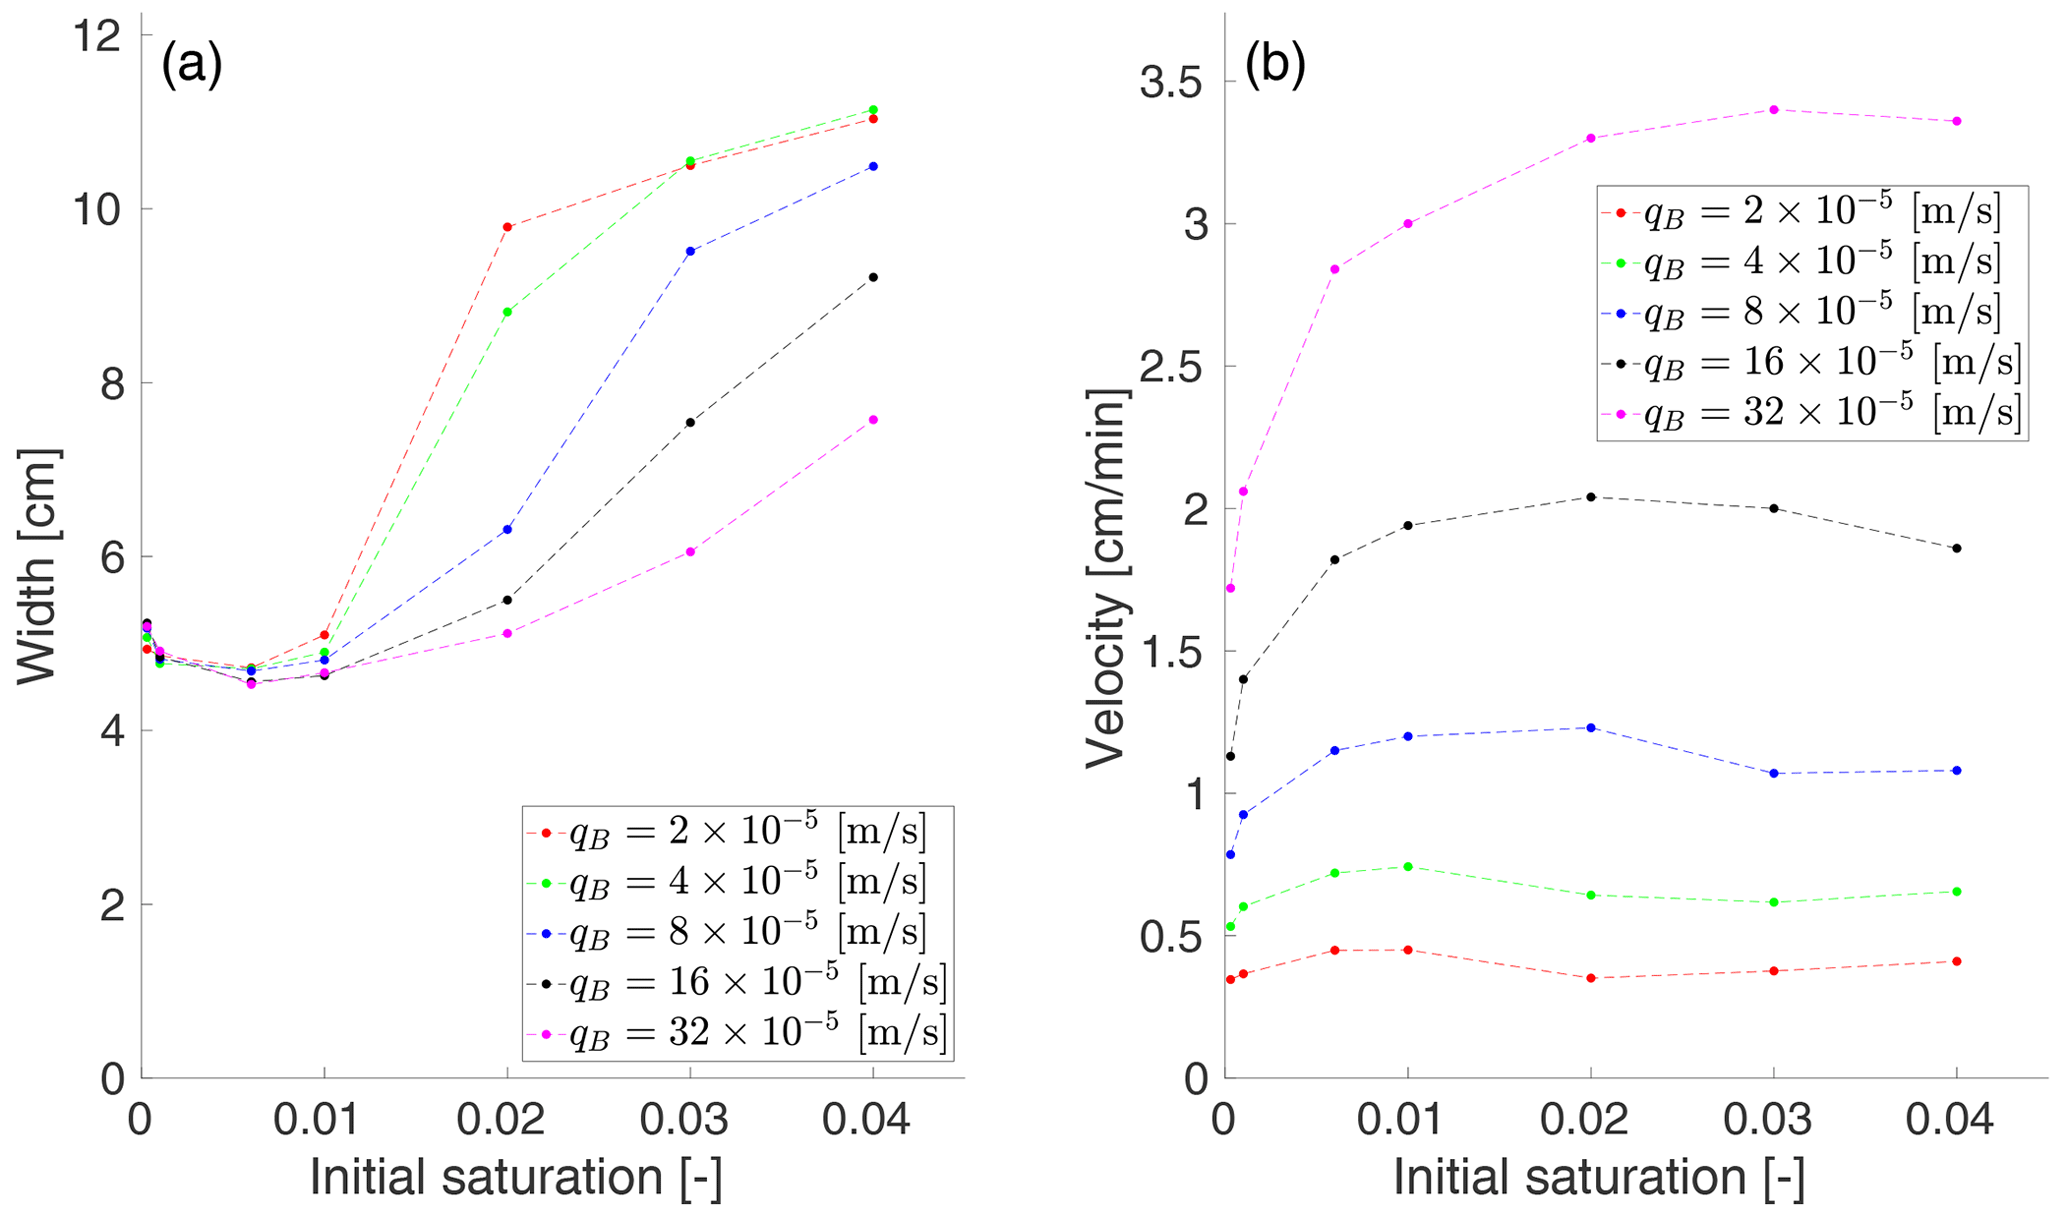
Figure 8The effect of the boundary flux on the flow regime. The width (a) and the velocity (b) of the finger (or wetting front) is plotted against the initial saturation for five different values of boundary flux qB. Times are scaled according to the boundary flux qB, thus the width and velocity of the moisture profiles are calculated at , and 6.25 min for and m s−1, respectively. The averages of four different distributions of the intrinsic permeability are plotted.
Since the used boundary fluxes varied by more than 1 order of magnitude, the times for which the velocity and the width are calculated need to be scaled according to the boundary flux. The time points used are , and 6.25 min for and m s−1, respectively. It can be seen in Fig. 8a that, with decreasing boundary flux, the flow tends to become more diffusive. The transition between the finger-like and diffusion-like regimes is clearly evident for the initial saturation, for which the width of the moisture profiles increases rapidly. For instance, for and m s−1, the rapid increase can be already seen for Sin=0.02. For higher values of qB, diffusion-like behavior is observed for higher values of initial saturation. To make this as clear as possible, a snapshot of the saturation field for the intrinsic permeability distribution defined by Fig. B1a is shown in the left panel of Fig. B5. Note that the dependence on the boundary flux is in good agreement with the experimental observation (DiCarlo, 2004). Moreover, it is not surprising that the velocity of the moisture profiles shown in Fig. 8b decreases with decreasing boundary flux.
It is evident that the non-monotonic behavior of the width and the velocity of the moisture profiles is not dependent on the boundary flux. Hence, Bauters' paradox is observed for all tested values of qB. Since the diffusion-like behavior occurs at lower values of boundary flux, the manifestation of Bauters' paradox is shifted to higher initial saturation values as the boundary flux increases.
In order not to extend the main part of the paper too much, a sensitivity analysis for other parameters such as intrinsic and relative permeability, dynamic viscosity and retention curve is included in Appendix B. It is shown that Bauters' paradox occurs for different values of material parameters. For details, see Figs. B1–B6 and the corresponding text.
To our best knowledge, the presented semi-continuum model is the first model which is able to fully capture Bauters' paradox. This is achieved without introducing any new parameters or material functions. The semi-continuum model is based on well-established physics only – the mass balance equation, the Darcy–Buckingham law, and a proper scaling of the retention curve with the volume of the block. The model may help to explain the precise mechanism of the transition between the finger-like and diffusion-like regimes.
We conjecture that the explanation of Bauters' paradox is rather similar to the non-monotonic dependence of porous medium flow on the magnitude of the influx. For very small values of influx, the flow becomes stable with increasing finger width. The same applies for very large values of influx. Hence, the unstable flow is only observed for fluxes within a certain range (Yao and Hendrickx, 1996; Glass et al., 1989b; DiCarlo, 2013). Yao and Hendrickx (1996) hypothesized that the stable flow occurs when the effect of gravity becomes negligible. This happens in two extreme cases. First, at very low infiltration rates, the capillarity becomes the dominant force compared to the force of gravity. Second, for infiltration rates higher than the saturated hydraulic conductivity, the viscosity dominates and the stable flow without fingers occurs. In our case, the dependence of the flow regime on the initial saturation behaves similarly. For an initially dry porous medium, the capillarity dominates, and the large capillary forces are able to win over gravity in sucking the water sideways into dry areas of the matrix. In a medium which is moderately wet, this becomes more difficult because the capillary forces are generally lower. Thus, in a moderately wet medium, the fingers become thinner and faster. At sufficiently high initial saturation, the large conductivity between neighboring blocks prevents water piling up behind the wetting front and the formation of saturation overshoot. This results in the ability of lateral expansion because the persistence of the fingers is suppressed (Rezanezhad et al., 2006; Kmec et al., 2021). Therefore, a diffusion-like flow regime is observed.
A distribution of intrinsic permeability was used in the model. This was motivated by the following observation. As the blocks become smaller and smaller, the variability in their material characteristics necessarily increases. The characteristic of a block is given by an average over the pores of the block. As the block size decreases, so does the number of pores over which the average is taken. Thus, the variability in the characteristics increases. It is possible to introduce a distribution of other parameters such as porosity and the parameters of the retention curve (White et al., 2006; Ghanbarian et al., 2021). However, to keep the model as simple as possible, this has not been implemented here. It should be stressed that Bauters' paradox appears even if the intrinsic permeability is kept homogeneous. Furthermore, a sensitivity analysis of Bauters' paradox was performed, which showed that Bauters' paradox occurs for different values of material parameters and boundary flux.
DiCarlo (2013) states the following four criteria to evaluate a model for unsaturated porous media flow. Paraphrasing his words, the model should do the following:
-
have a minimum of adjustable parameters, and the parameters should be meaningful,
-
reduce to the RE in non-overshoot and static profiles,
-
produce a good match of the observed 1D profiles, not just the magnitude of the overshoot, and
-
be able to produce predictions of the 2D and 3D preferential flow in terms of finger widths and finger spacing.
Since the RE can simulate only a diffusion-like regime, we understand item 2 in the way that the model should be able to reproduce also diffusion-like regime and not only the finger-like regime. This does not mean that the semi-continuum model behaves in the same way as the RE in non-overshoot profiles. This is of course not possible due to the scaling of the retention curve.
The semi-continuum model formulation uses only the physics of the RE (porosity, permeability, the pressure-saturation relation, mass conservation, and the Darcy–Buckingham law). The block size used in the simulation is not a free parameter – it is tied to the retention curve by the scaling relation and the reference block size Δx0. The value of Δx0 is not arbitrary; it is connected to the REV. Thus, item 1 on the DiCarlo (2013) list is satisfied. In view of Figs. 4, 5, 6, and 7 and the results in Kmec et al. (2019, 2021), we claim that items 2–4 are also satisfied.
However, there are two exceptions. For 2D preferential flow, the dependence of finger width and finger spacing on the influx is still missing. Here, we mention, for example, the experiments of Yao and Hendrickx (1996) for low infiltration rates and Glass et al. (1989b) for higher infiltration rates. We will discuss this complex dependency in a forthcoming paper. Moreover, the semi-continuum model has not yet been extended to 3D.
Note that, for a given Δx and retention curve, the semi-continuum model may look like a numerical scheme for the RE. However, when using different block size Δx, a different retention curve must be used for the RE to retain the character of the flow. Otherwise, only the diffusion-like behavior occurs (Fürst et al., 2009). In contrast, for the semi-continuum model, we define the retention curve for the reference block size Δx0, and the retention curve is then scaled automatically according to the block size. In this case, the retention curve is a measurable material characteristic. The semi-continuum model is thus predictive; we do not need to fit the retention curve for each Δx separately. Therefore, the semi-continuum model is not a numerical scheme to solve RE. The crucial difference between the semi-continuum model and a numerical scheme for the RE is in an appropriate scaling of the retention curve with the block size. As Δx decreases, the semi-continuum model retains the character of the flow between the blocks, and the saturation overshoot does not disappear (Vodák et al., 2022). Let us also stress that it is important to use the geometric mean of the hydraulic conductivity for computing the flux between neighboring blocks. In principle, it is necessary to use a type of averaging that has the desirable property of being small if the permeability of one of the blocks is small. Such an averaging of the hydraulic conductivity creates a pile-up effect, resulting in a finger with saturation overshoot. Thus, the geometric mean is not the only possible averaging choice; for example, the harmonic mean can also be used. In the semi-continuum model, we use the geometric mean because it is shown that using this type of averaging is the most appropriate in the case of random pore networks (Jang et al., 2011).
We can summarize the role of (1) the appropriate average of the hydraulic conductivity (for instance the geometric mean) and (2) the scaling of the retention curve as follows. The geometric mean is essential to create the pile-up effect (saturation overshoot), while the effect of scaling the retention curve is to preserve this saturation overshoot for Δx→0. If (1) and (2) were not utilized in the semi-continuum model, then diffusion-like flow patterns would always be produced with a monotonic saturation profile. This behavior is demonstrated for the initially almost dry medium in Fig. 9. The used distribution of the intrinsic permeability is shown in Fig. 3. A typical finger with saturation overshoot is produced for the semi-continuum model (Fig. 9a), while, without (1) and (2), a monotonic diffusion-like profile is formed (Fig. 9b). In Vodák et al. (2022), we have demonstrated that the overshoot behavior is not lost in the limit dx→0 (for the numerical convergence, see Figs. 4–6 in Vodák et al., 2022). Thus, the semi-continuum model does not converge to the RE, even if the block size goes to zero. It converges to a new type of hysteretic partial differential equation defined by Eq. (8) that – to our knowledge – has not been studied so far. We invite the porous media community to study the semi-continuum model and its limit because, so far, it has been proven to capture all of the complex and counterintuitive features of unsaturated homogeneous porous media flow that have been observed and reported in the literature well.
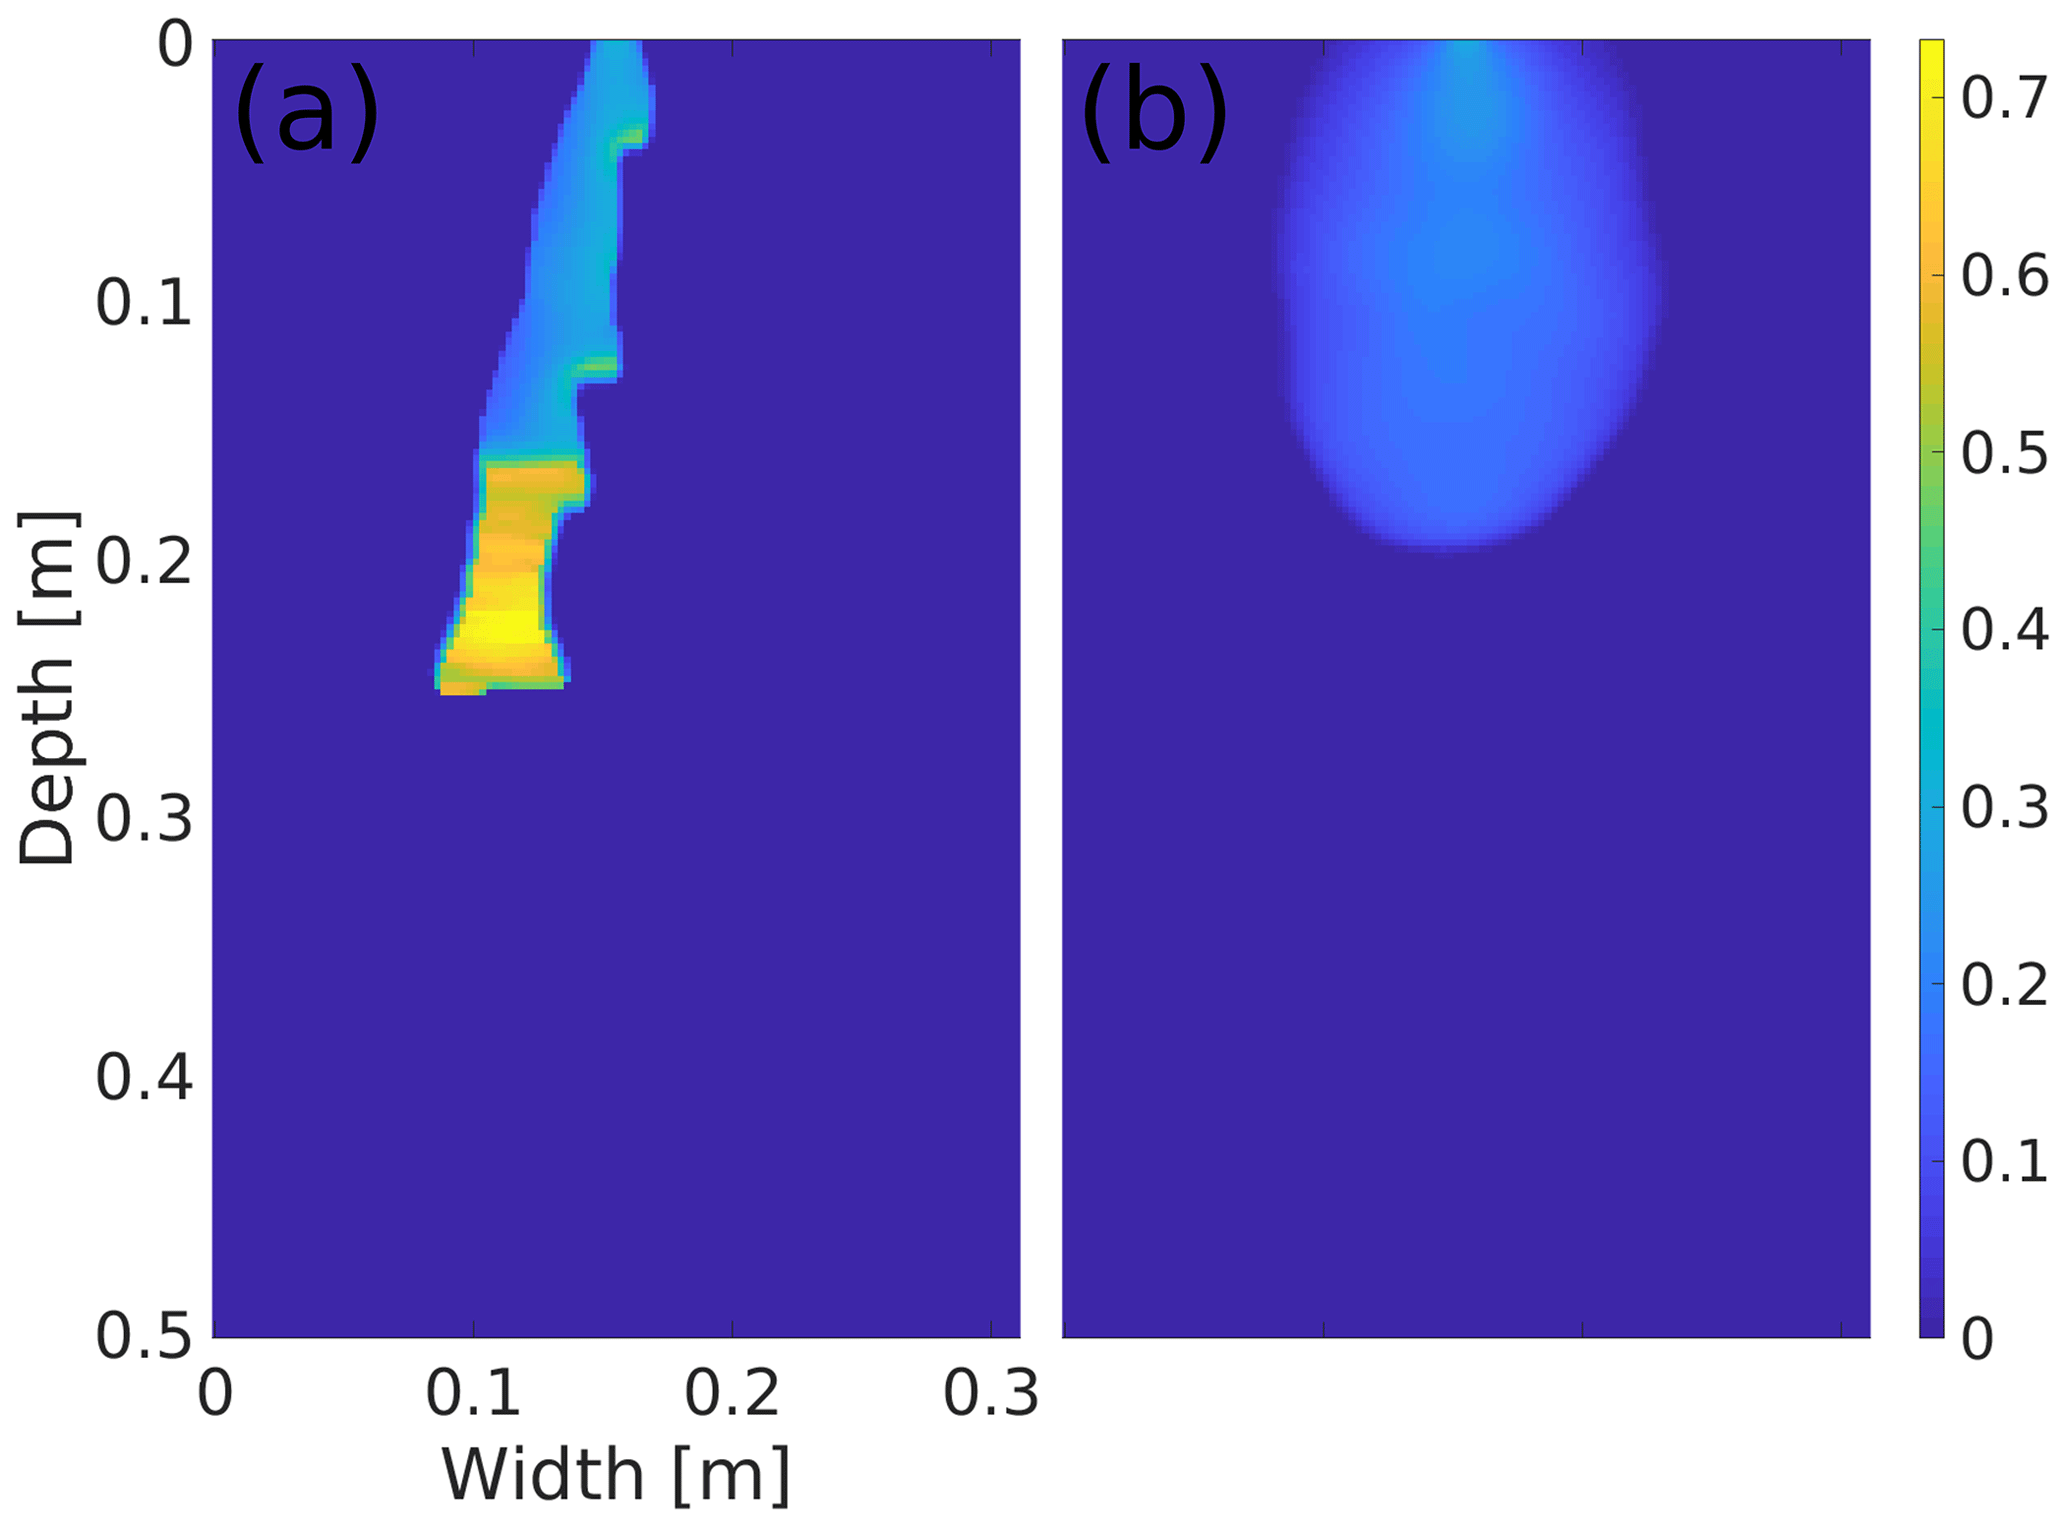
Figure 9The role of the geometric mean of the hydraulic conductivity and the scaling of the retention curve. Snapshot of the saturation field for (a) the semi-continuum model and (b) without utilizing the geometric mean of the hydraulic conductivity and the scaling of the retention curve. Both simulations in panels (a) and (b) are given at t=25 min for Sin=0.0003. The saturation values are color coded according to the color bar on the right.
It is known from infiltration experiments that unsaturated porous media flow patterns depend on the initial saturation of the medium in a complex way. Going from an initially dry medium to an initially wet medium, the flow pattern changes from a finger-like regime with a pronounced saturation overshoot to a diffusion-like regime with no overshoot. During the transition, several finger characteristics (velocity, overshoot magnitude, and finger width) change in a non-monotonic way. This complex behavior is called Bauters' paradox, and the standard continuum mechanics-based theory has been unable to reproduce it.
Here, we introduced a semi-continuum model (discrete in space and continuous in time) which is able to correctly reproduce all the observed features of Bauters' paradox. The semi-continuum model implements a physically relevant scaling of the retention curve – the slope of the retention curve decreases with decreasing block size. This model correctly reproduces the flow patterns both for an initially dry medium and an initially wet porous medium.
Figure A1 shows a snapshot of the saturation field at 25 min for seven different values of the initial saturation. The distribution of the intrinsic permeability is not included; i.e., the medium is perfectly homogeneous. The effect of the intrinsic permeability distribution is pronounced for the initially dry porous medium, while for the initially wet porous medium, this effect is negligible. This is expected because, in the case of diffusion-like regime, small changes in intrinsic permeability do not have a significant effect on the flow. The artificial-looking behavior for the initially dry porous medium is eliminated if a more realistic porous medium is used for the simulations; i.e., if the distribution of the intrinsic permeability is included.
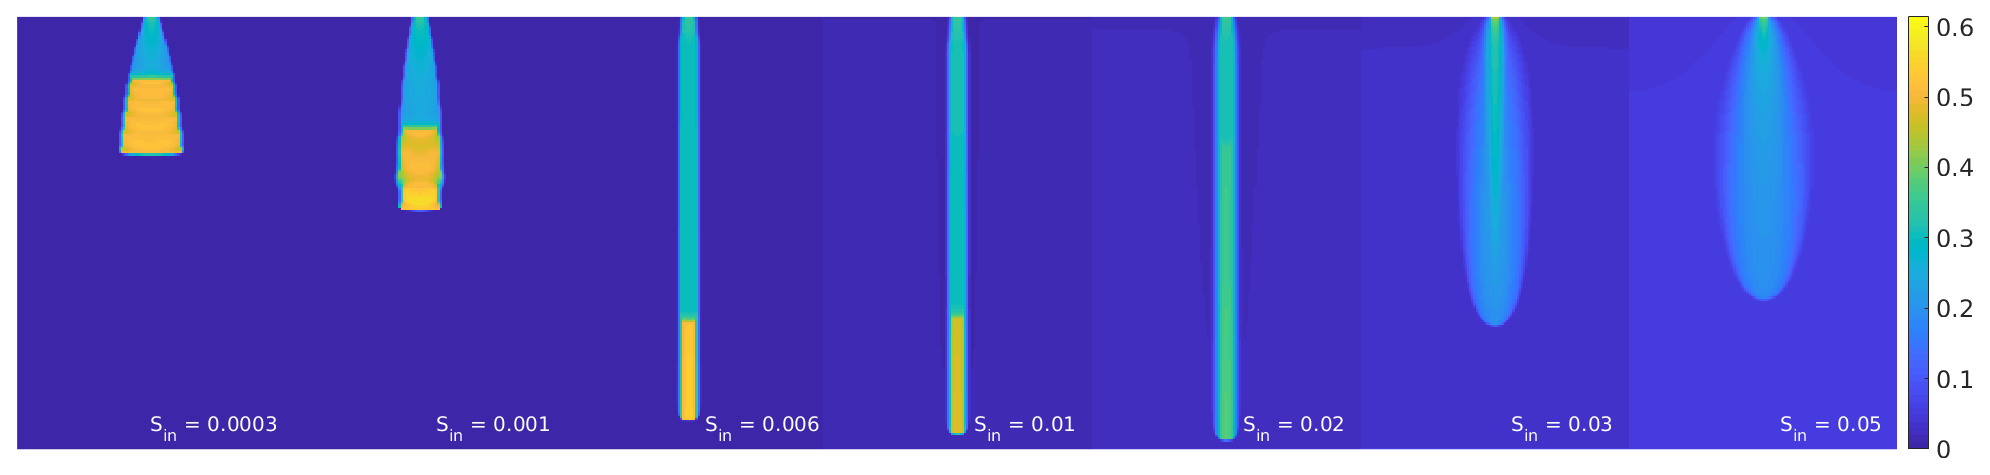
Figure A1Snapshot of the saturation field at 25 min for seven different values of the initial saturation. The distribution of the intrinsic permeability is not included. Saturation values are color coded according to the color bar on the right. Initial saturation of the medium increases from left to right.
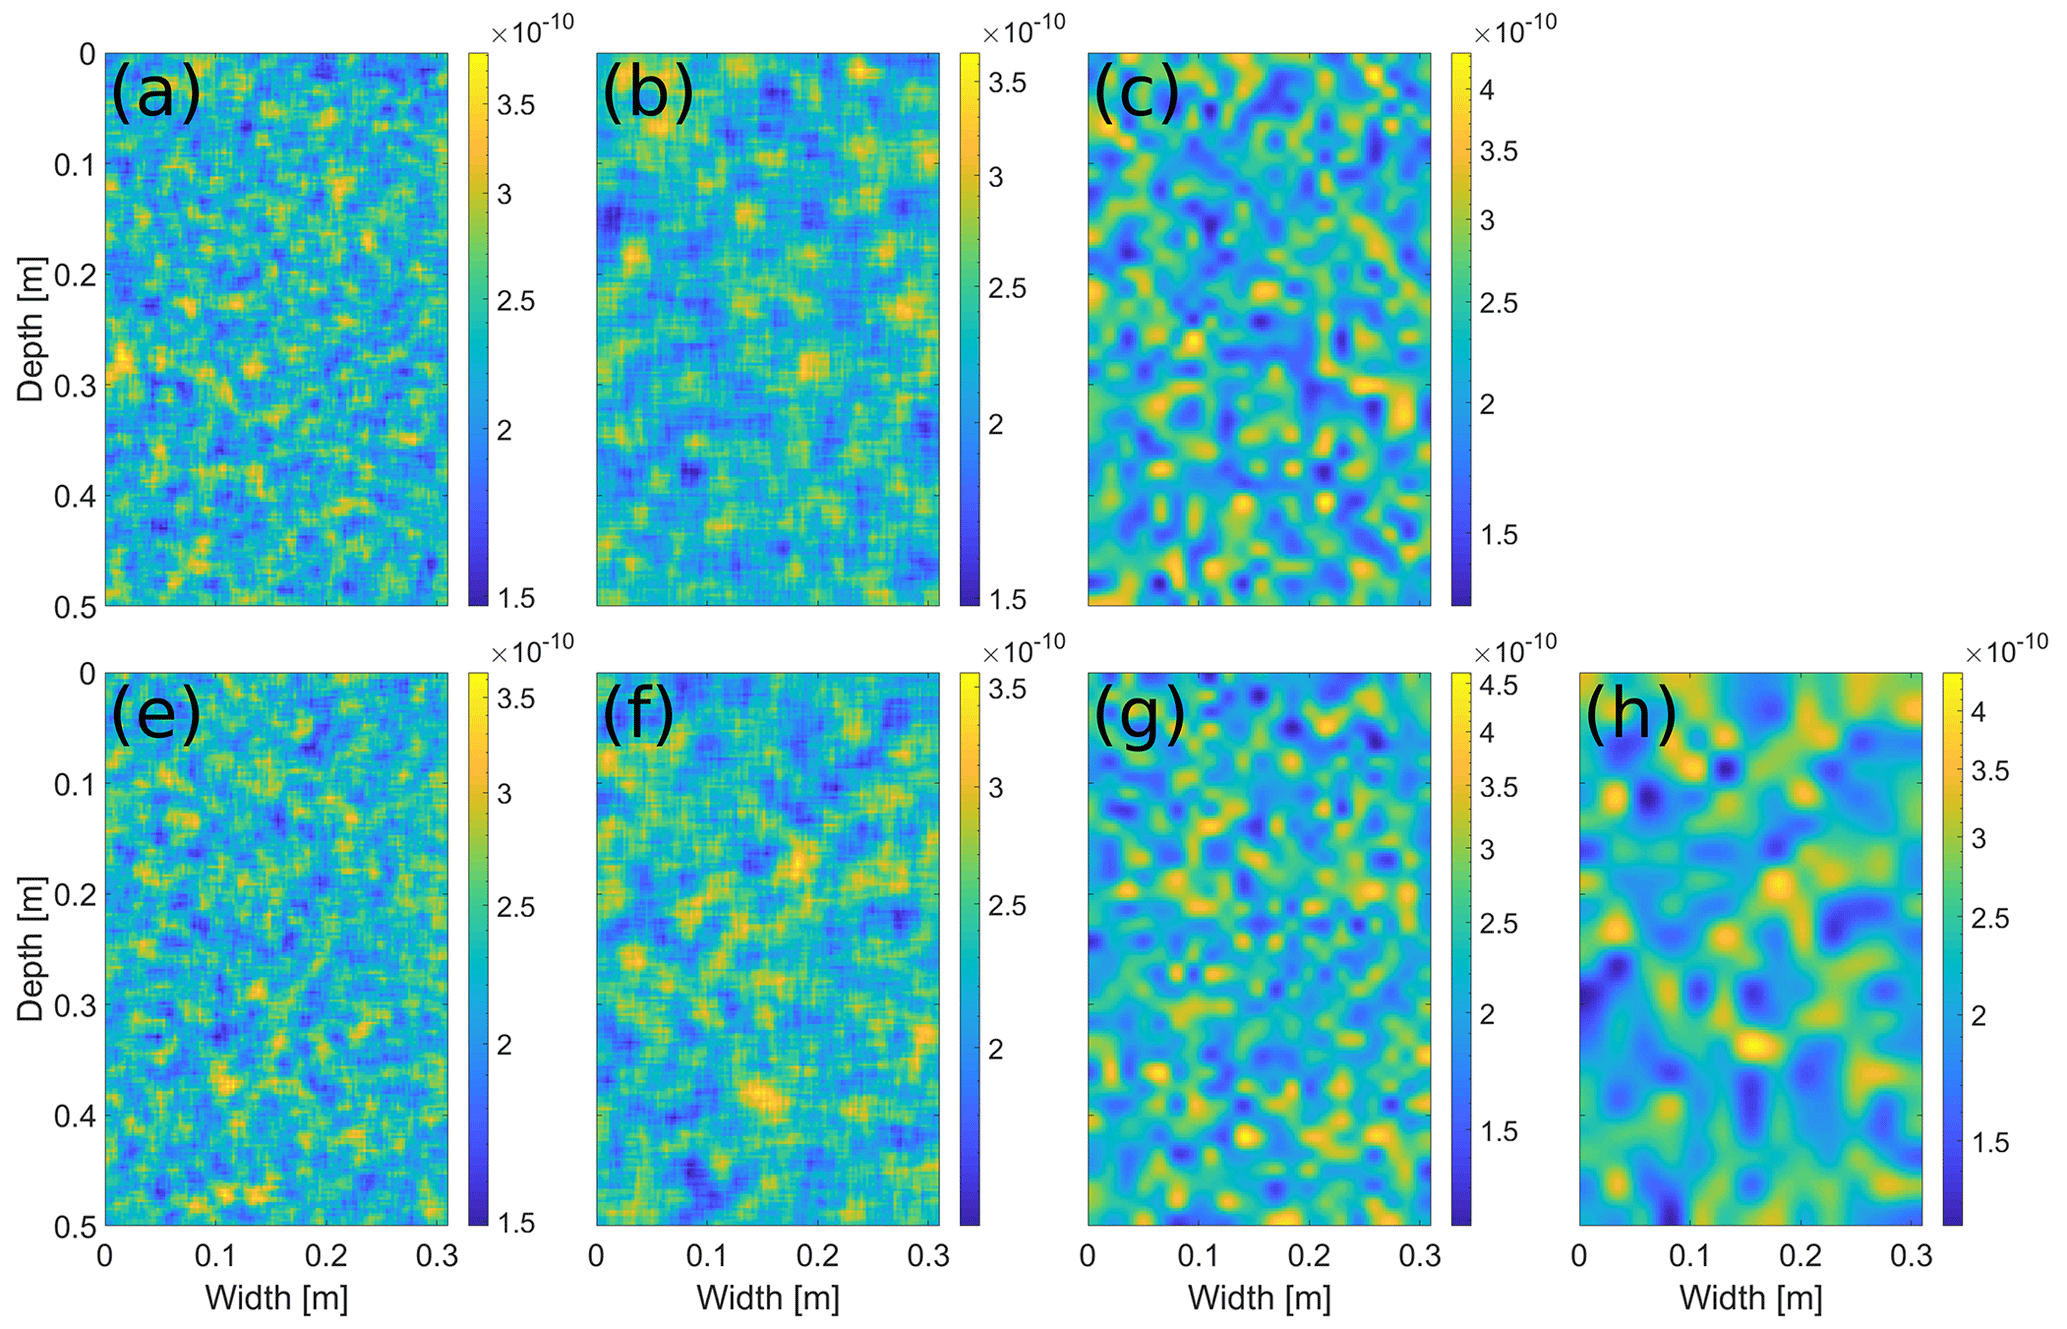
Figure A2The distribution of the intrinsic permeability κ (m2). The distributions satisfy the following: (a) , (b) , (c) , (e) , (f) , (g) , and (h) . Intrinsic permeability values are color coded according to the color bar on the right.
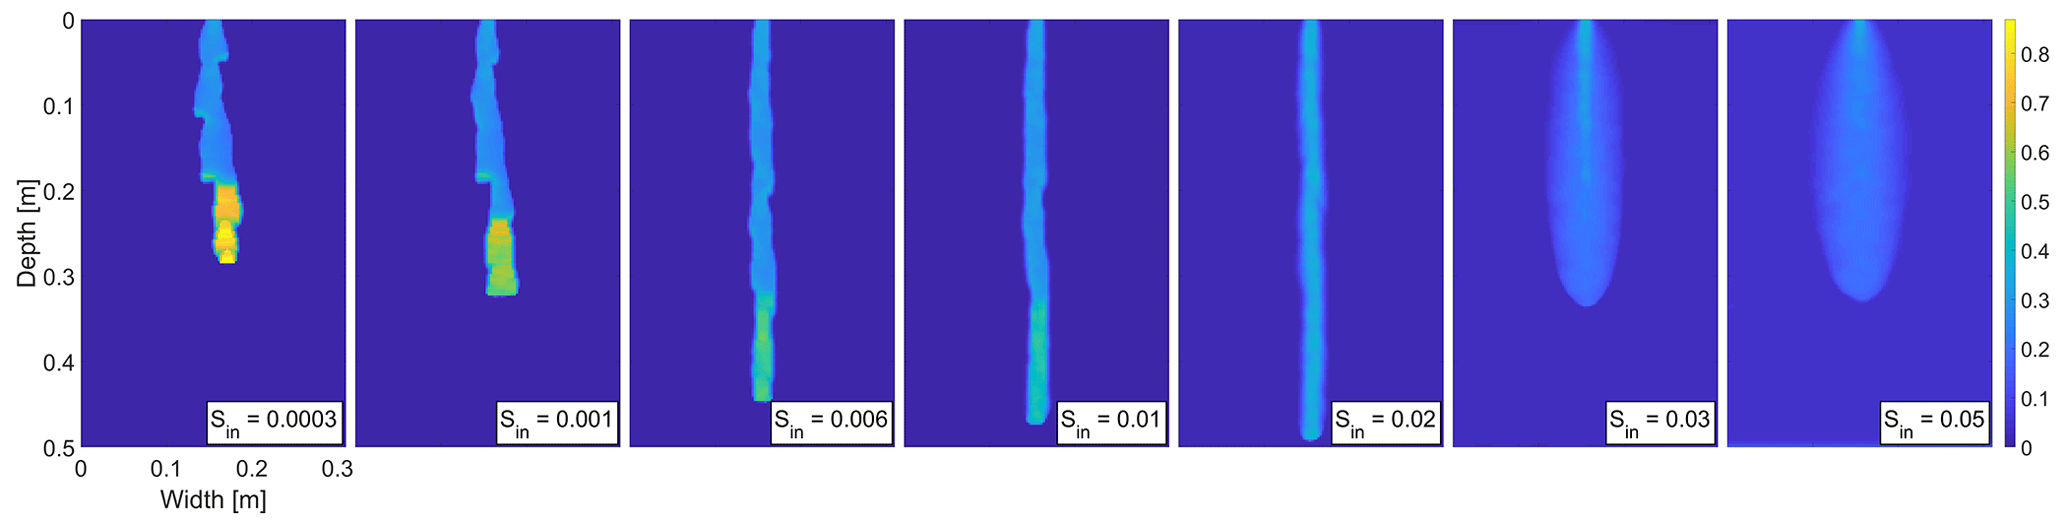
Figure A3Snapshot of the saturation field at 25 min for seven different values of the initial saturation for the distribution which satisfies (the distribution in Fig. A2a). Saturation values are color coded according to the color bar on the right.
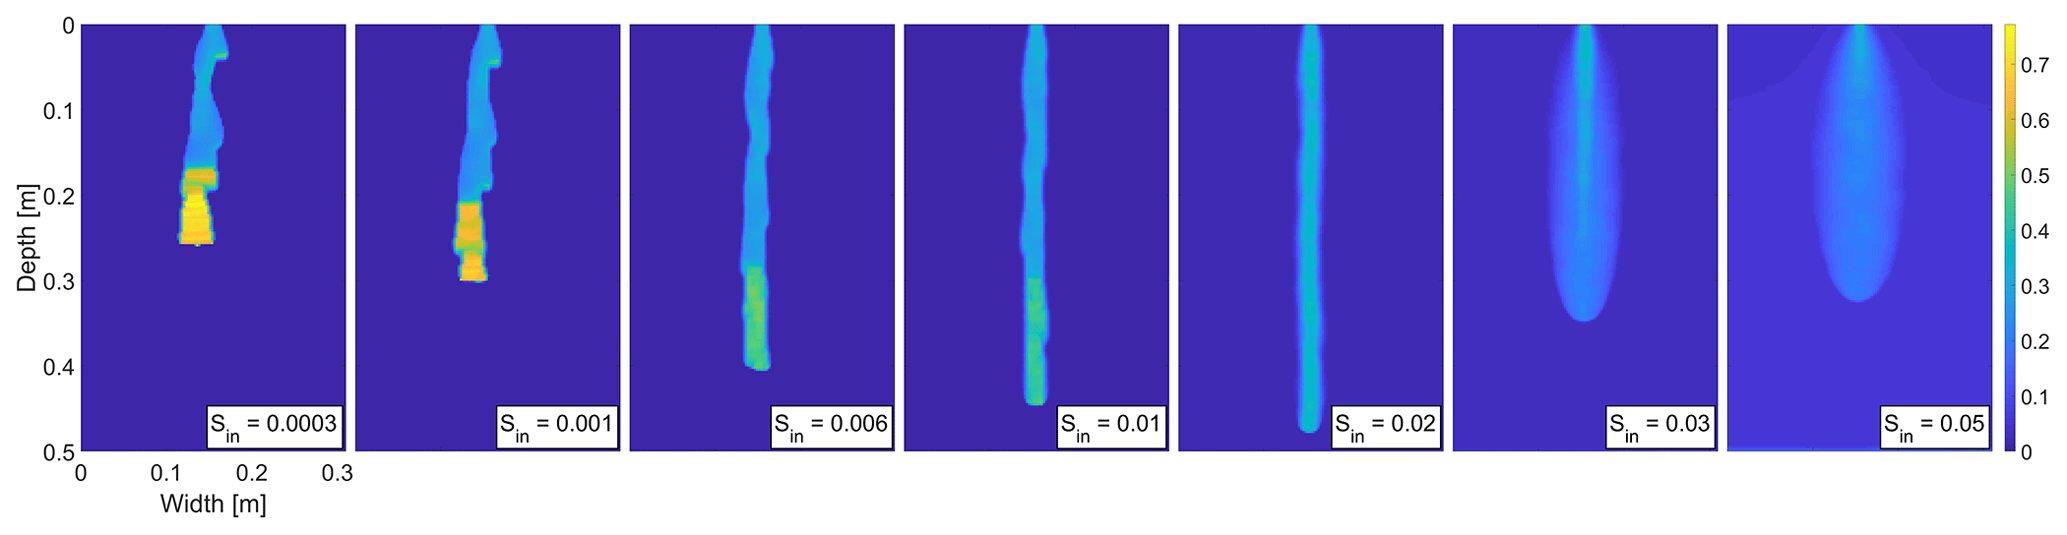
Figure A4Snapshot of the saturation field at 25 min for seven different values of the initial saturation for the distribution which satisfies (the distribution in Fig. A2b). Saturation values are color coded according to the color bar on the right.
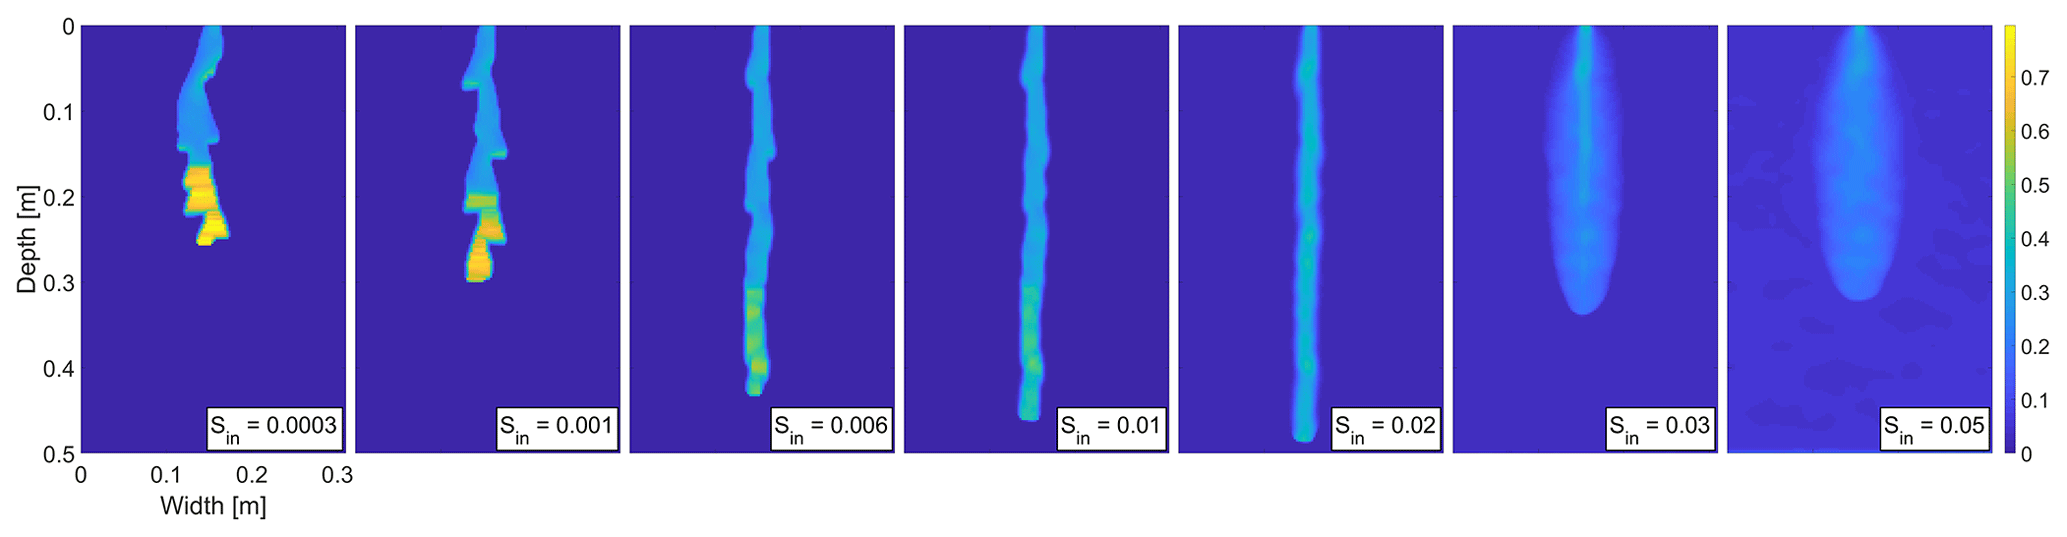
Figure A5Snapshot of the saturation field at 25 min for seven different values of the initial saturation for the distribution which satisfies (the distribution in Fig. A2c). Saturation values are color coded according to the color bar on the right.

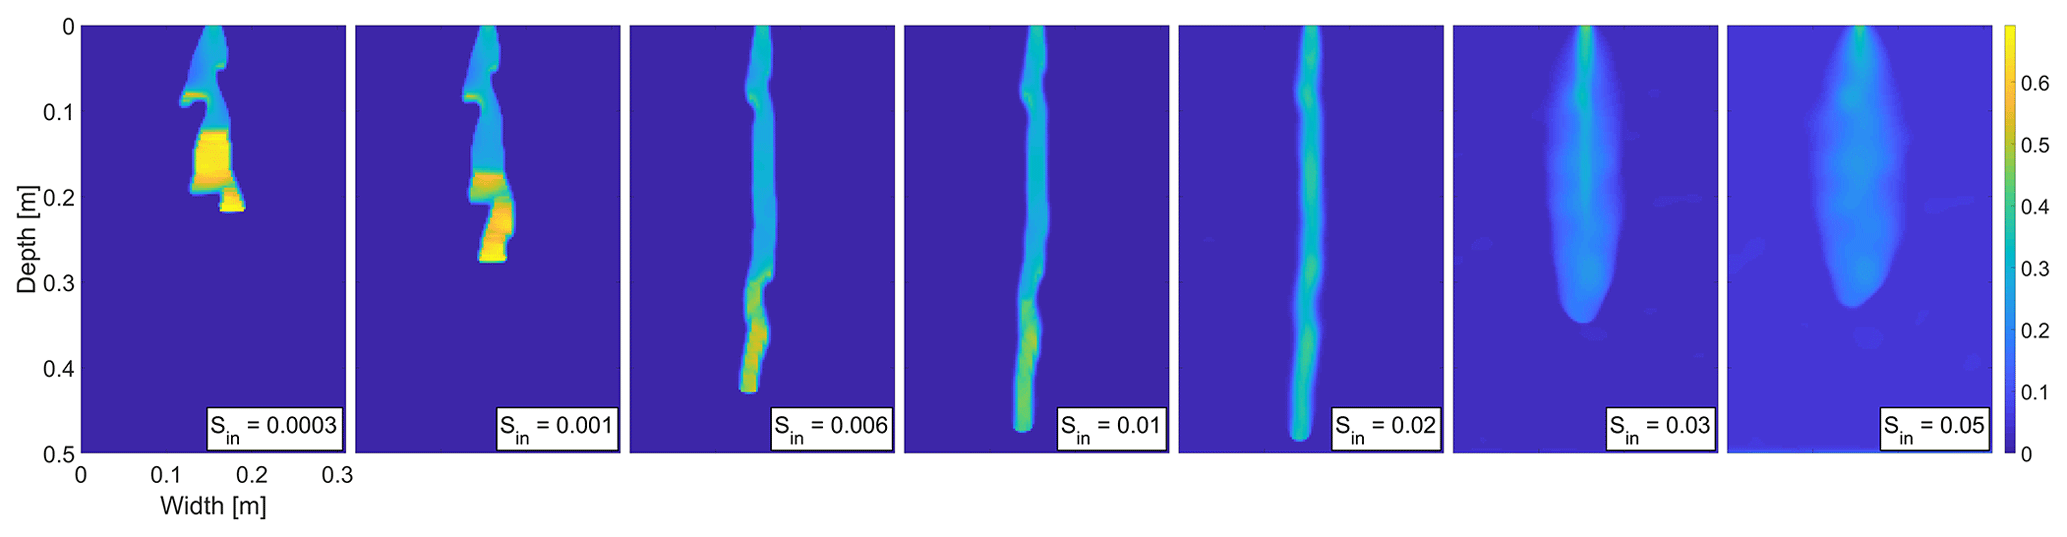
Figure A6Snapshot of the saturation field at 25 min for seven different values of the initial saturation for the distribution which satisfies (the distribution in Fig. A2e). Saturation values are color coded according to the color bar on the right.
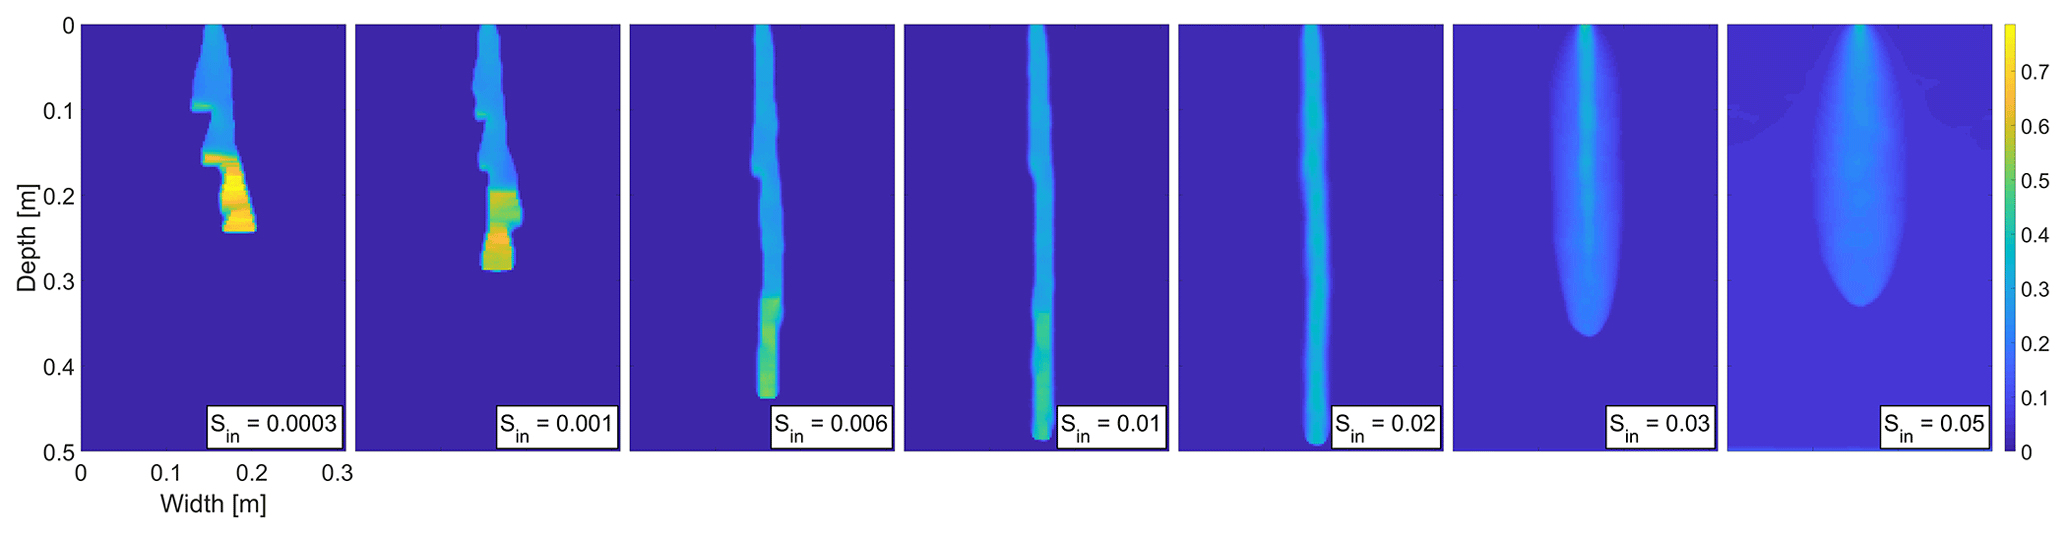
Figure A7Snapshot of the saturation field at 25 min for seven different values of the initial saturation for the distribution which satisfies (the distribution in Fig. A2f). Saturation values are color coded according to the color bar on the right.

Figure A8Snapshot of the saturation field at 25 min for seven different values of the initial saturation for the distribution which satisfies (the distribution in Fig. A2g). Saturation values are color coded according to the color bar on the right.
B1 Effect of the intrinsic permeability and dynamic viscosity on the flow regime
Increasing the intrinsic permeability κ has the same effect as decreasing the parameter μ, and vice versa. Therefore, a fraction is used for the sensitivity analysis of both these parameters. The baseline values of κ and μ are given in Table 1. Five different values were examined, where b=0.50, 0.75, 1.00, 1.50, and 2.00. Obviously, baseline simulations are given for b=1.00. Figure B2 shows the width and the velocity of the fingers (moisture profiles) 25 min from the beginning of infiltration for five different values of b and for seven different values of initial saturation Sin. For a given value b and Sin, the average width and velocity of the moisture profile of four different distributions of the intrinsic permeability were calculated and plotted.
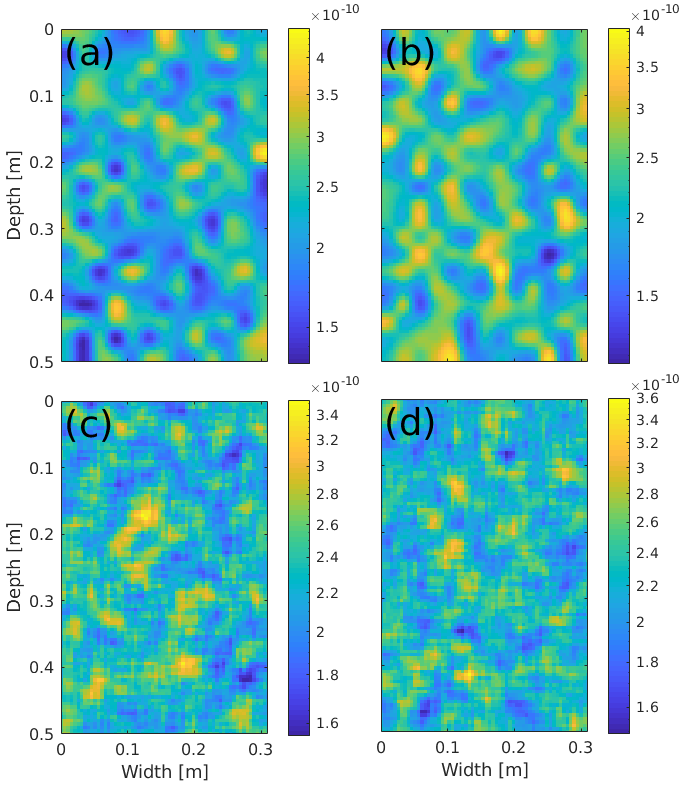
Figure B1The distribution of the intrinsic permeability κ (m2) used for the sensitivity analysis of Bauters' paradox. The distributions satisfy the following: (a) , (b) , (c) , and (d) . Intrinsic permeability values are color coded according to the color bar on the right.
It can be seen in Fig. B2a that, as parameter b increases, the width of the moisture profiles increases for higher initial saturation. For lower initial saturation, the effect of b is negligible. This is because, with increasing parameter b, diffusion-like behavior is observed for lower values of initial saturation. The transition between the finger-like and diffusion-like regimes is clearly evident for the initial saturation, for which the width of the moisture profiles increases rapidly. For instance, for b=2.00 and b=1.50, the rapid increase can be already seen for Sin=0.02. For lower values of b, diffusion-like behavior is observed for higher values of initial saturation. For clarity, a snapshot of the saturation field at 25 min for the intrinsic permeability distribution defined by Fig. B1a is shown in the right panel of Fig. B5. As for the moisture profile width, the velocity of the moisture profiles also increases with increasing b, as can be seen in Fig. B2b. This is expected because the parameter b directly affects the magnitude of the flow.
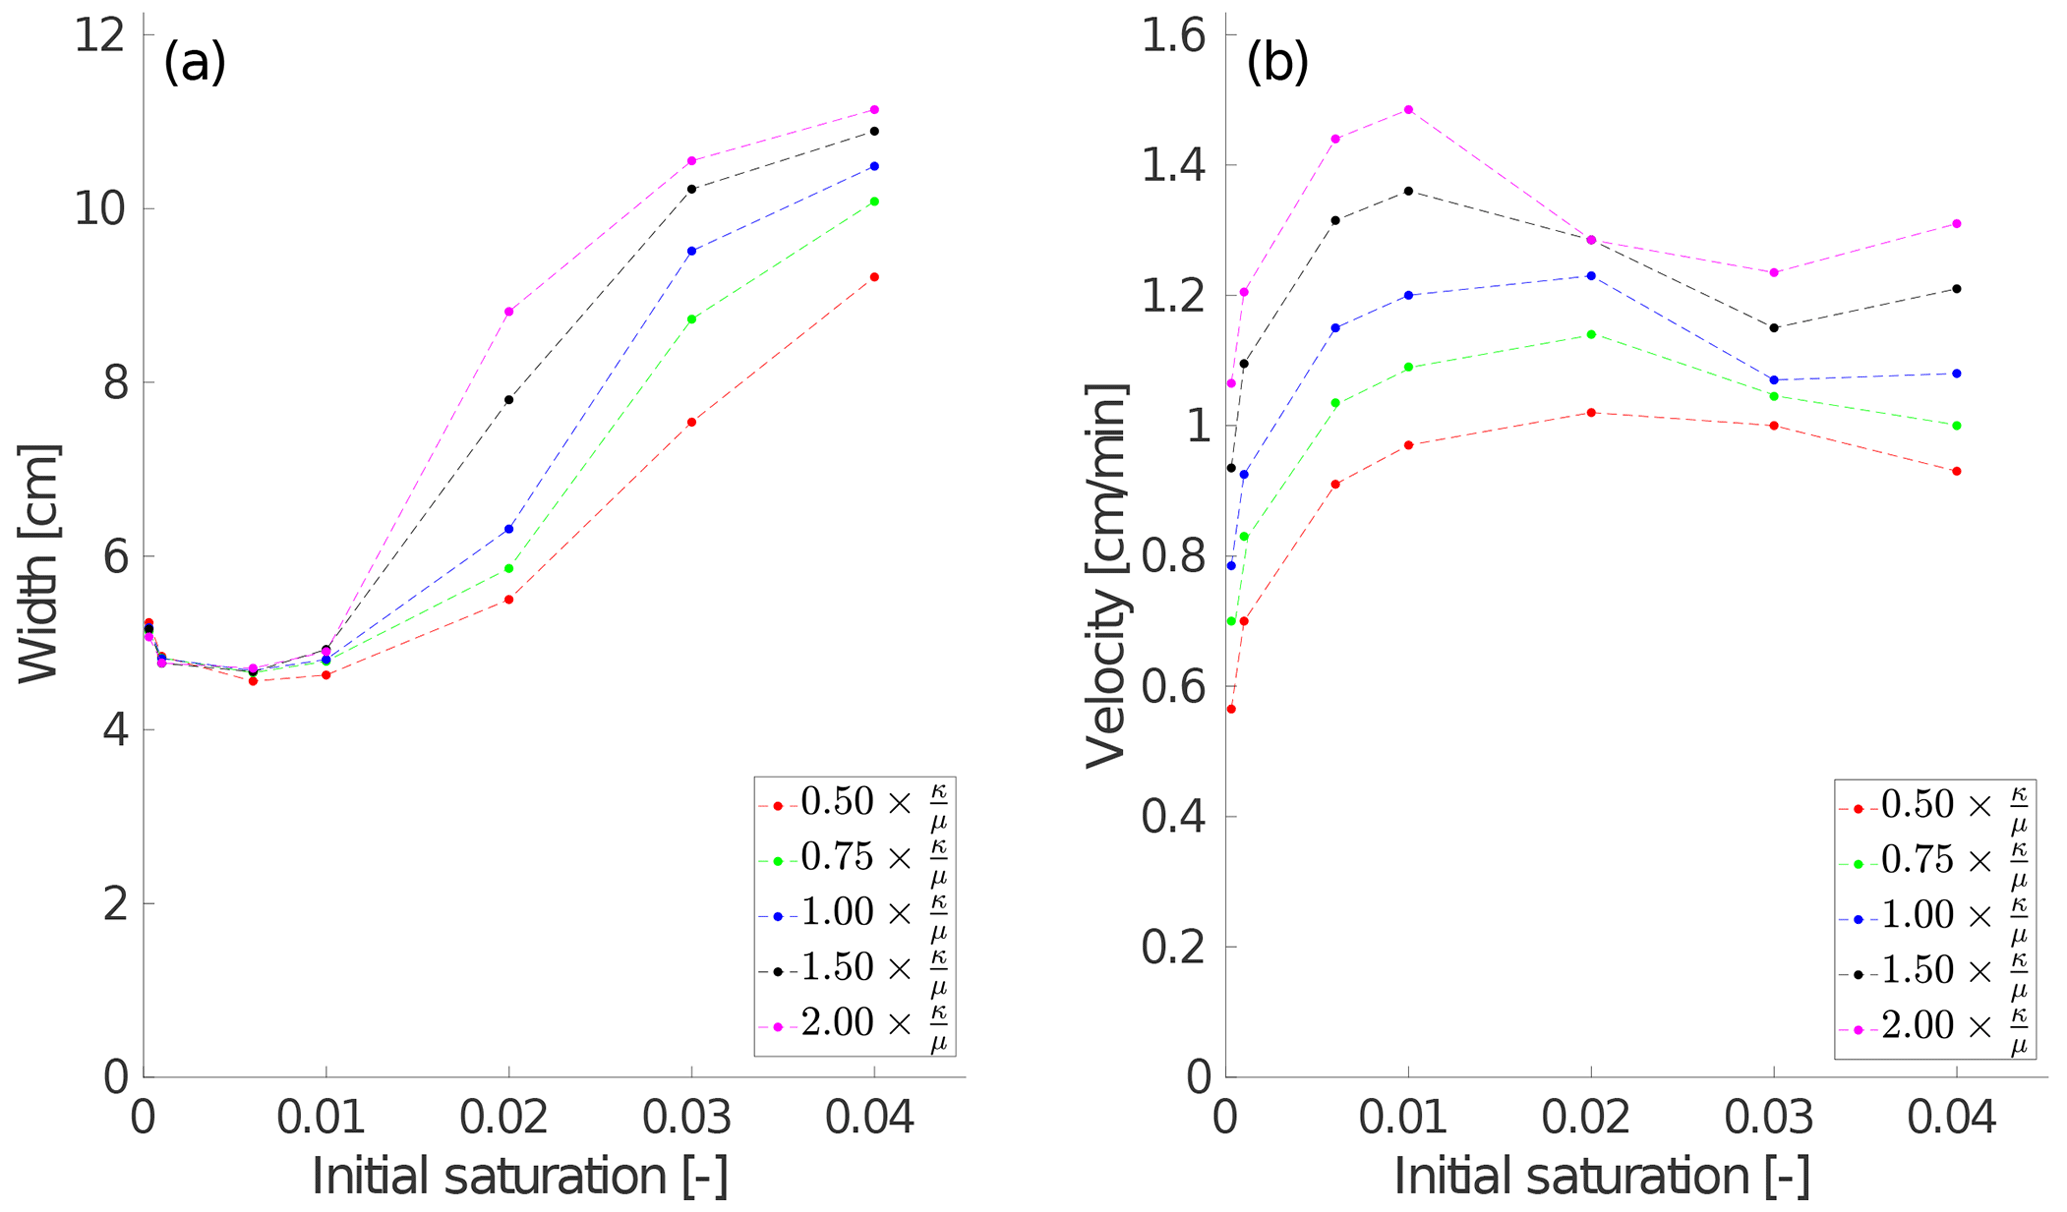
Figure B2 The effect of the intrinsic permeability and dynamic viscosity on the flow regime. The width (a) and the velocity (b) of the finger (or wetting front) at t=25 min is plotted against the initial saturation for five different values of The average of four different distributions of the intrinsic permeability is plotted.
Finally, it can be seen that Bauters' paradox is observed for all values of b. Therefore, the non-monotonic behavior of the width and the velocity of the moisture profiles is not dependent on intrinsic permeability and/or dynamic viscosity.
B2 Effect of relative permeability on the flow regime
The relative permeability function k(S) is given by Eq. (3). The function contains a free parameter λ(−), and therefore, the effect of the relative permeability on the flow regime is tested by using five different values of λ ranging from 0.6 to 1.0. The baseline simulations are given for λ=0.8. Note that the parameter λ affects the value of the relative permeability, especially for an initially dry porous medium. For the lowest initial saturation used for simulations (Sin=0.0003), the relative permeability is more than 25 times larger for λ=0.6 compared to λ=1.0. In contrast, it is approximately 3.6 times larger for Sin=0.04. As mentioned above, 28 different simulations were performed for each λ with variable initial saturation and intrinsic permeability distribution. Again, a snapshot of the saturation field at 25 min for the intrinsic permeability distribution defined by Fig. B1a is shown in the left panel of Fig. B6.
Figure B3 shows the width and the velocity of the fingers (moisture profiles) 25 min from the beginning of infiltration for five different values of λ and for seven different values of initial saturation Sin. For a given value of λ and Sin, the average width and velocity of the four different distributions of the intrinsic permeability is calculated and plotted. With decreasing λ (the relative permeability is increasing), the diffusion-like behavior is observed for lower initial saturation; hence, the width of the moisture profile is increasing.
This is expected because the effect of relative permeability on the flow regime should be similar to the effect of intrinsic permeability and dynamic viscosity (see Fig. B2a). Note that the effect of relative permeability is more pronounced because the relative permeability varies more significantly for different values of λ compared to the sensitivity analysis shown in Fig. B2.
The velocity of the moisture profiles is increasing with decreasing λ for lower initial saturation values. However, this does not apply for initial saturation Sin=0.02 and higher. This is because, for lower λ, a diffusion-like behavior is observed for lower values of initial saturation; hence, the moisture profile slows down significantly.
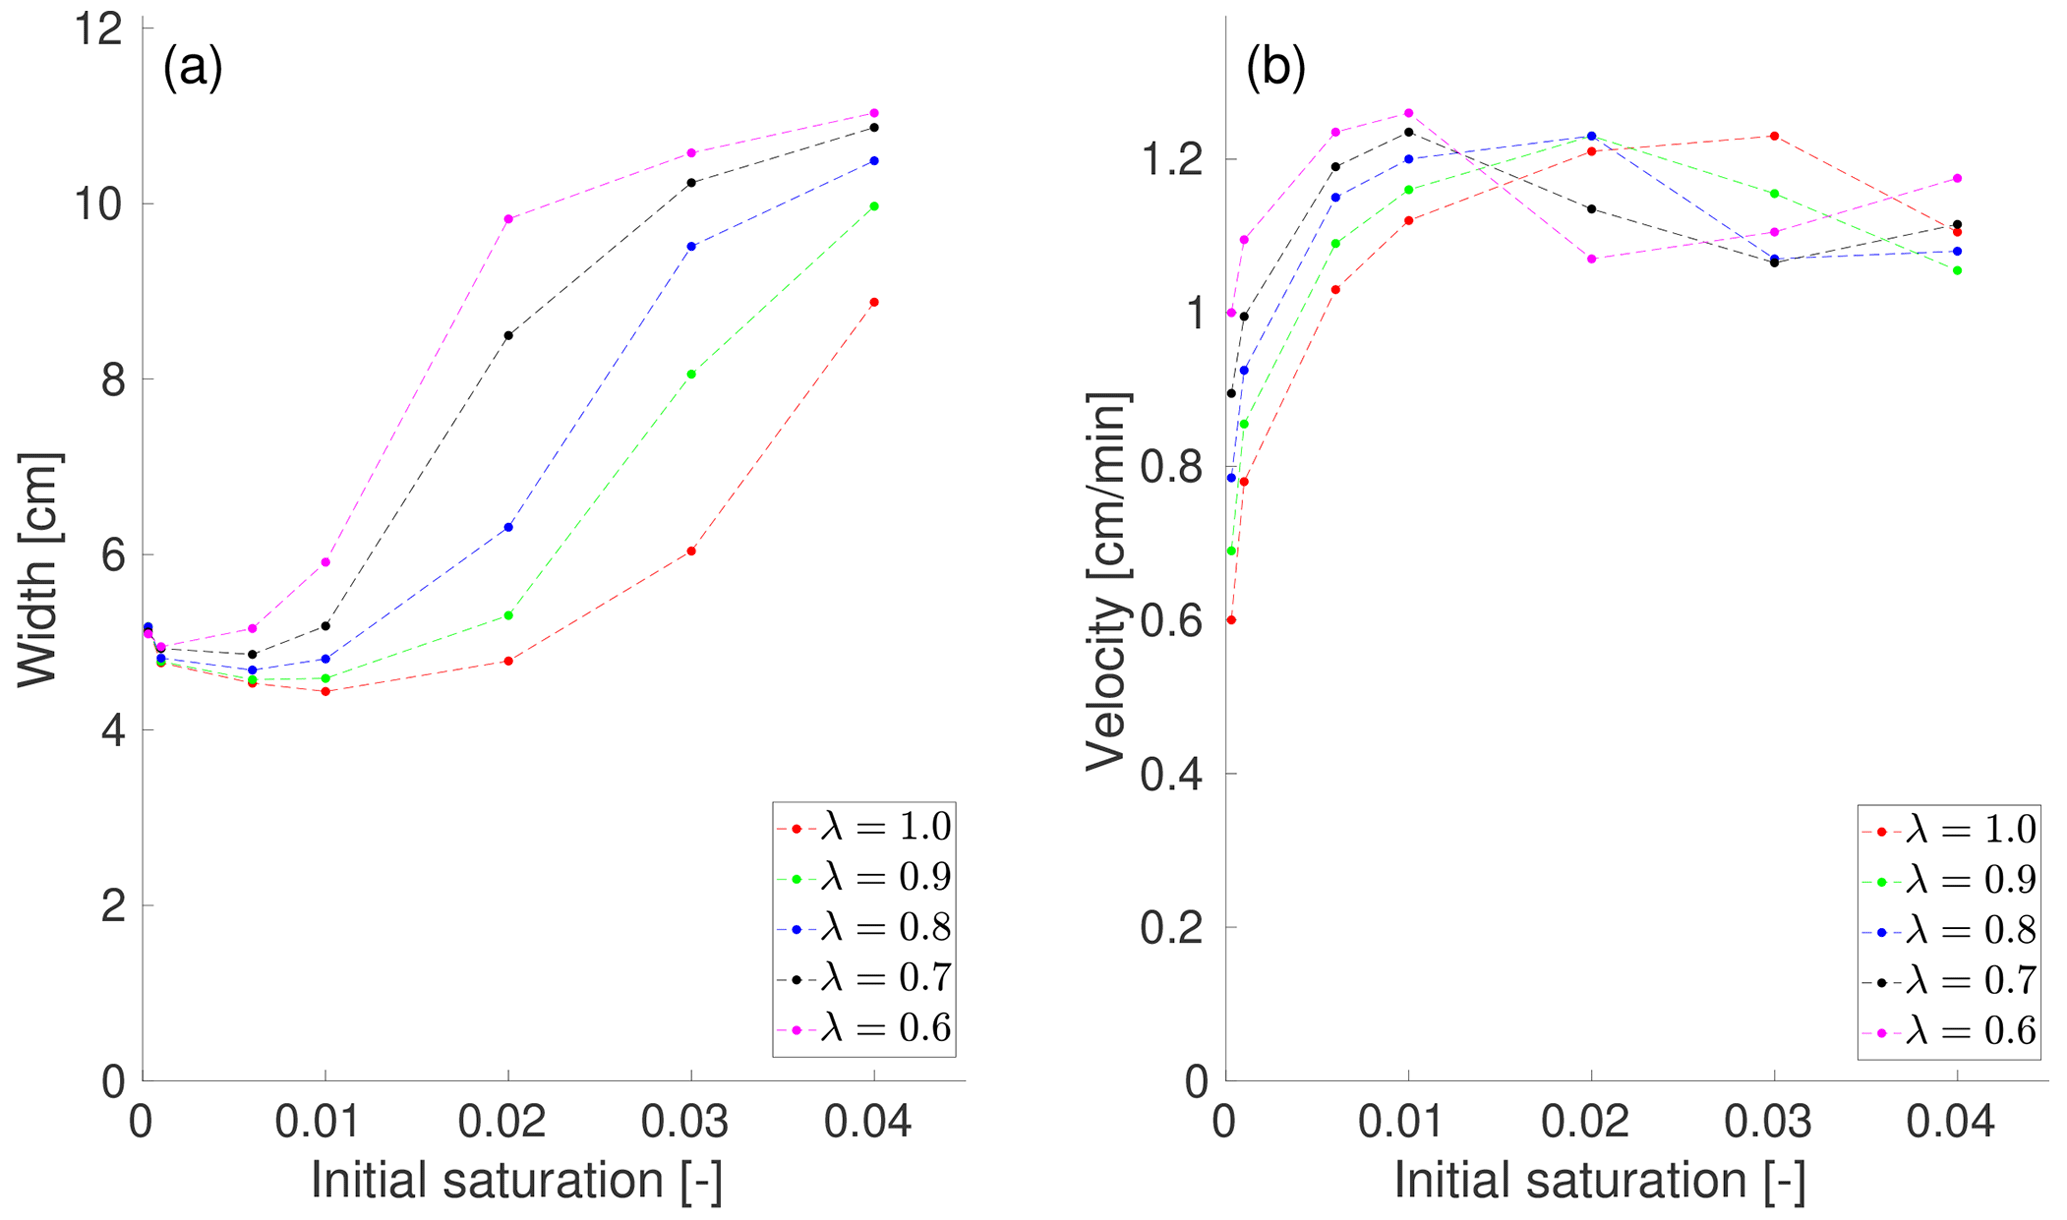
Figure B3The effect of the relative permeability on the flow regime. The width (a) and the velocity (b) of the finger (or wetting front) at t=25 min is plotted against the initial saturation for five different values of parameter λ. The average of four different distributions of the intrinsic permeability is plotted.
Bauters' paradox is again observed for all values of λ. As λ increases, both the minimum width and maximum velocity occur for higher values of initial saturation. This is because the diffusion-like behavior occurs at higher values of initial saturation. The manifestation of Bauters' paradox is thus shifted to higher initial saturation values. This can also be seen in Fig. B2, but the effect is not so pronounced.
B3 Effect of the retention curve on the flow regime
The effect of the retention curve on the flow regime is tested using different parameters αw and αd related to the main wetting and main draining branches, respectively. This is done by multiplying the basic values of the parameters αw and αd (given in Table 1) by the free parameter α. Both values αw and αd are multiplied by the same parameter α ranging from 0.70 to 1.30. Obviously, the baseline simulations are given for α=1.00. The parameters nw and nd are fixed and are given in Table 1.
Note that, with increasing α, the main branches become flatter. This is analogous to using a porous medium with coarser grains. On the other hand, as α decreases, the main branches become steeper, which is analogous to using a porous medium with finer grains. Figure B4 shows the width and the velocity of the fingers (moisture profiles) 25 min from the beginning of infiltration for five different values of α and for seven different values of initial saturation Sin. For a given value α and Sin, the average width and velocity of the four different distributions of the intrinsic permeability is calculated and plotted. Again, a snapshot of the saturation field at 25 min for the intrinsic permeability distribution defined by Fig. B1a is shown in the right panel of Fig. B6. As α decreases, the width of the moisture profiles increases rapidly because the diffusion-like behavior is observed for lower values of initial saturation. This is consistent with experimental observations, as the diffusion-like behavior is more readily observed in porous media with finer grains compared to coarser grains (see, e.g., the experiments in Cremer et al., 2017). Next, the velocity of the moisture profiles decreases as α decreases. This is expected because, at lower values of α, the flow behaves in a much more diffusion-like manner, and therefore, the moisture profiles are slower.
Bauters' paradox occurs for all tested values α. Moreover, similarly to the effect of the relative permeability, the minimum width and maximum velocity occur for higher initial saturation as α increases, so that the manifestation of Bauters' paradox is shifted to higher initial saturation values.
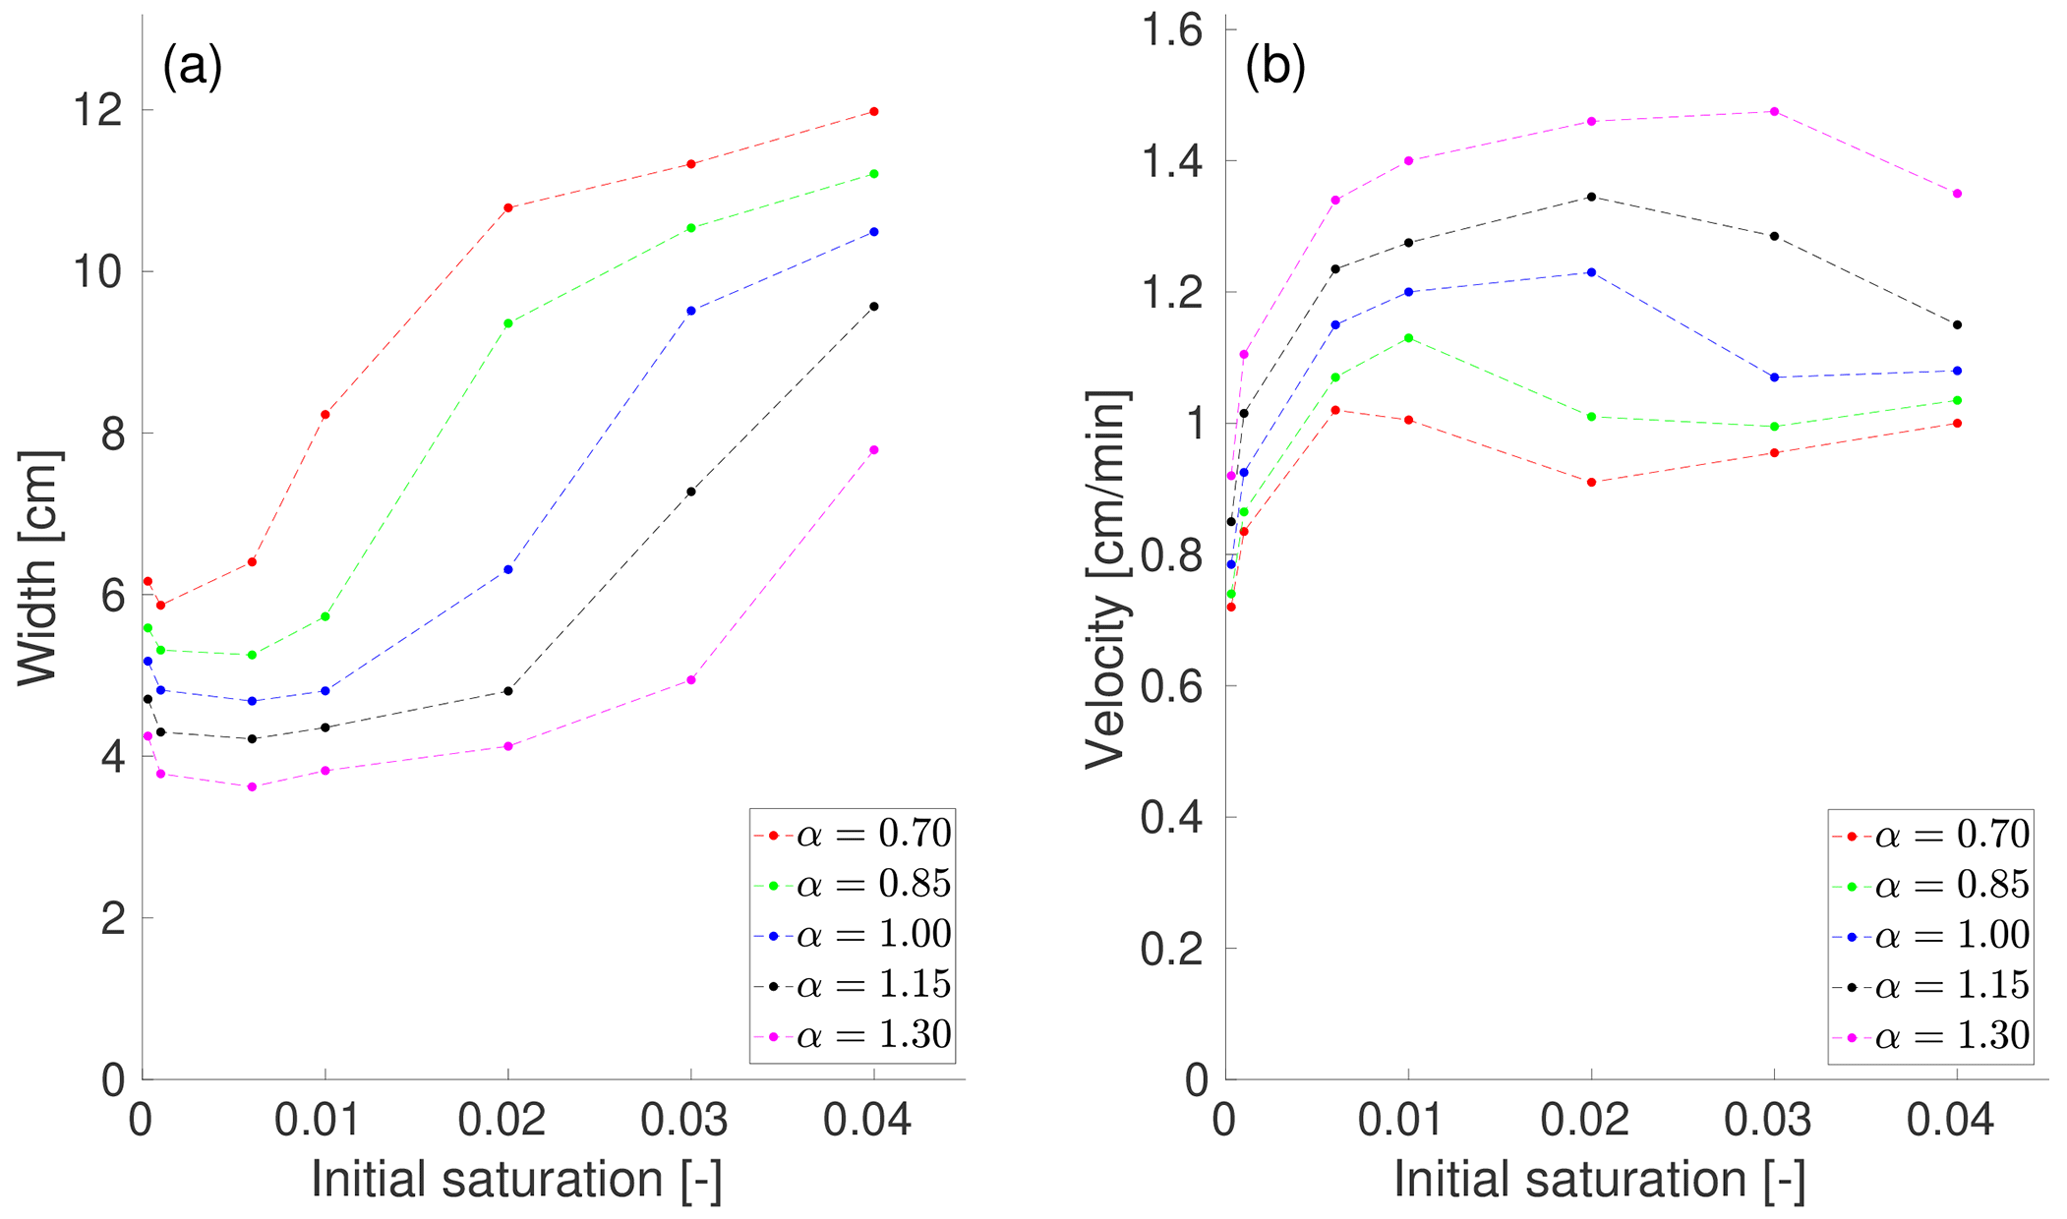
Figure B4The effect of the retention curve on the flow regime. The width (a) and the velocity (b) of the finger (or wetting front) at t=25 min is plotted against the initial saturation for five different values of parameter α. The averages of four different distributions of the intrinsic permeability are plotted.
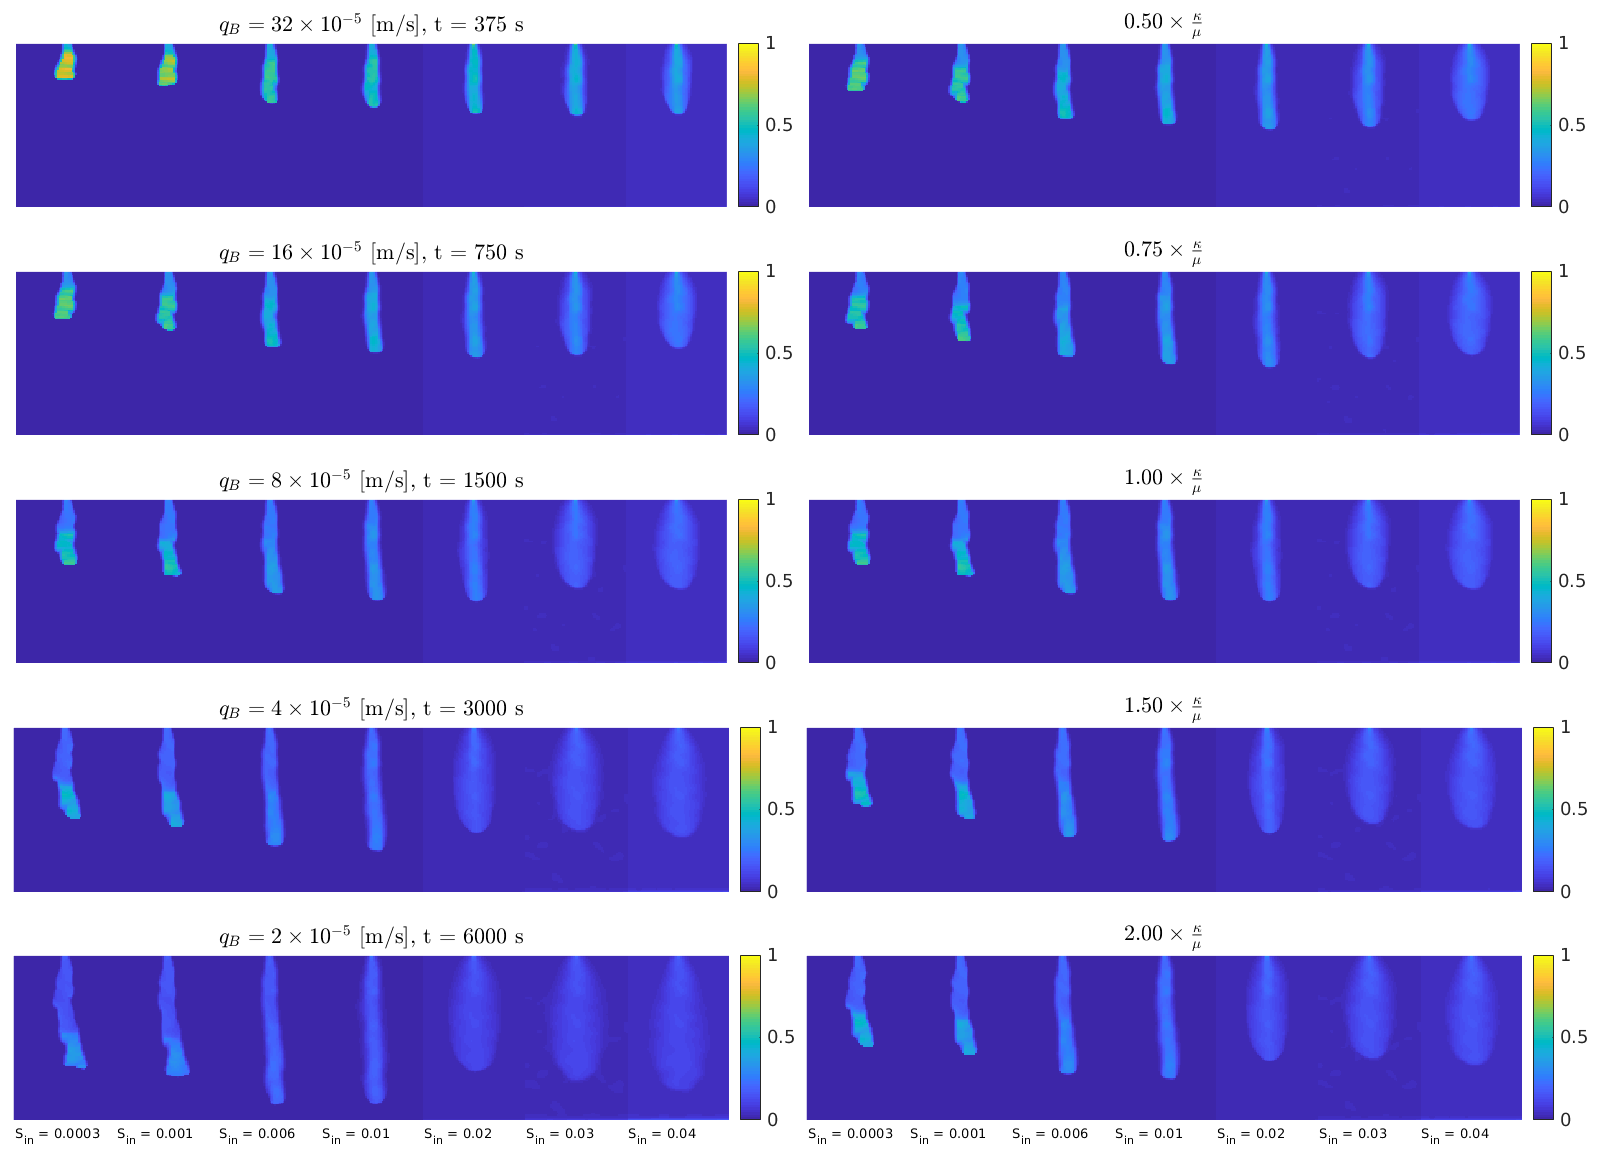
Figure B5A snapshot of the saturation field for the intrinsic permeability distribution shown in Fig. B1a for seven different values of initial saturation Sin and five different values of qB (left column) and for seven different values of initial saturation Sin and five different values of b (right column). For the left column, times are scaled according to the boundary flux qB; thus, a snapshot of the saturation field is shown at , and 6.25 min for , and m s−1, respectively. For the right column, times are given at 25 min.
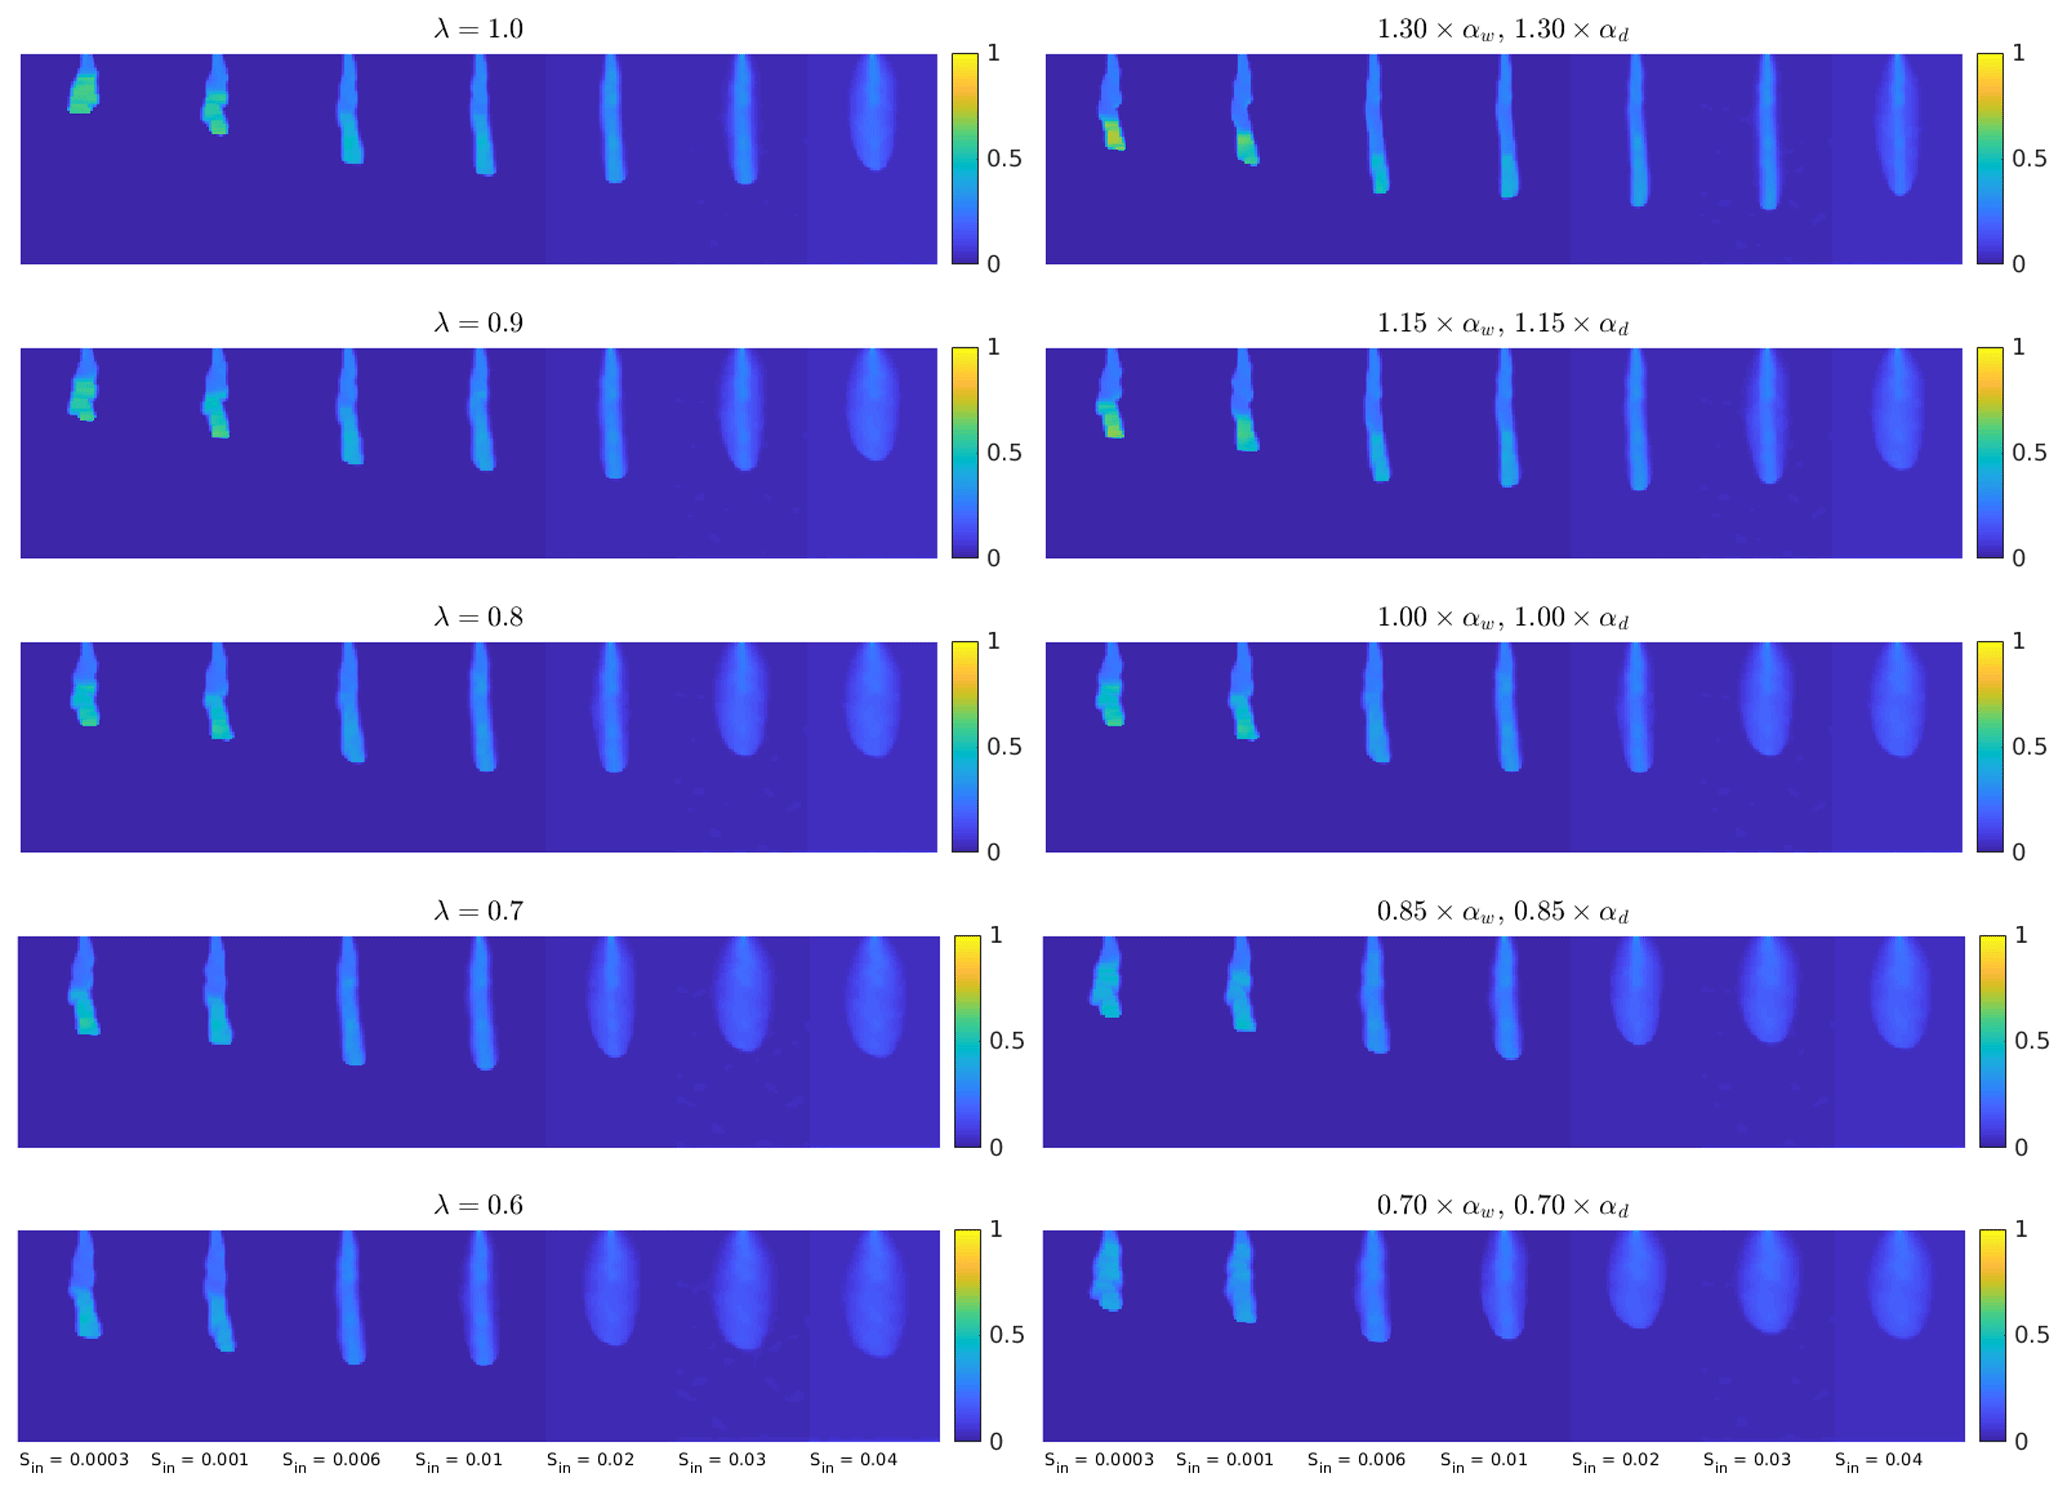
Figure B6A snapshot of the saturation field at 25 min for the intrinsic permeability distribution shown in Fig. B1a for seven different values of initial saturation Sin and five different values of λ (left column) and for seven different values of initial saturation Sin and five different values of α (right column).
The software code that produced the simulations is written in MATLAB and can be downloaded from https://doi.org/10.5281/zenodo.6837742 (Kmec, 2022). Simulation data that are needed to create the plots included in the paper can be downloaded from https://doi.org/10.5281/zenodo.7657002 (Kmec et al., 2022). Please do not hesitate to contact the corresponding author if you encounter any problems when downloading the software code or simulation data.
JK and MS wrote the paper. TF reviewed the work. TF, MS, RV and JK proposed the model. JK implemented the computer code and ran the simulations. RV checked the mathematics.
The contact author has declared that none of the authors has any competing interests.
Publisher’s note: Copernicus Publications remains neutral with regard to jurisdictional claims in published maps and institutional affiliations.
Jakub Kmec, Tomáš Fürst, and Rostislav Vodák gratefully acknowledge the support by the Operational Programme Research, Development and Education, project no. CZ.02.1.01/0.0/0.0/17_049/0008422, of the Ministry of Education, Youth and Sports of the Czech Republic. Rostislav Vodák has been supported by the Ministry of Education, Youth and Sports of the Czech Republic, project no. CZ.02.1.01/0.0/0.0/17_049/0008408, for the Hydrodynamic Design of Pumps. Computational resources were supplied by the project “e-Infrastruktura CZ” (e-INFRA LM2018140) provided within the program projects of Large Research, Development, and Innovations Infrastructures. Tomáš Fürst gratefully acknowledges the generous support of the Fulbright Commission in scope of the Masaryk–Fulbright Scholarship.
This research has been supported by the Ministry of Education, Youth and Sports of the Czech Republic (project nos. CZ.02.1.01/0.0/0.0/17_049/0008422 and CZ.02.1.01/0.0/0.0/17_049/0008408).
This paper was edited by Nadia Ursino and reviewed by three anonymous referees.
Al-Raoush, R.: Change in Microstructure Parameters of Porous Media Over Representative Elementary Volume for Porosity, Particul. Sci. Technol., 30, 1–16, https://doi.org/10.1080/02726351.2010.543262, 2012. a
Al-Raoush, R. and Papadopoulos, A.: Representative elementary volume analysis of porous media using X-ray computed tomography, Powder Technol., 200, 69–77, https://doi.org/10.1016/j.powtec.2010.02.011, 2010. a
Aminzadeh, B. and DiCarlo, D. A.: The Transition between Sharp and Diffusive Wetting Fronts as a Function of Imbibing Fluid Properties, Vadose Zone J., 9, 588–596, https://doi.org/10.2136/vzj2009.0072, 2010. a
Bauters, T. W. J., DiCarlo, D. A., Steenhuis, T., and Parlange, J.-Y.: Soil water content dependent wetting front characteristics in sands, J. Hydrol., 231–232, 244–254, https://doi.org/10.1016/S0022-1694(00)00198-0, 2000. a, b, c, d, e, f, g, h, i, j, k, l, m, n, o, p, q
Bear, J.: Dynamics of Fluids in Porous Media, American Elsevier Publishing Company, ISBN 10 044400114X, ISBN 13 978-0444001146, 1972. a, b, c
Beljadid, A., Cueto-Felgueroso, L., and Juanes, R.: A continuum model of unstable infiltration in porous media endowed with an entropy function, Adv. Water Resour., 144, 103684, https://doi.org/10.1016/j.advwatres.2020.103684, 2020. a
Blunt, M. J. and Scher, H.: Pore-level modelling of wetting, Phys. Rev. E, 52, 6387–6403, https://doi.org/10.1103/PhysRevE.52.6387, 1995. a
Brindt, N. and Wallach, R.: The moving‐boundary approach for modeling 2D gravity‐driven stable and unstable flow in partially wettable soils, Water Resour. Res., 56, e2019WR025772, https://doi.org/10.1029/2019WR025772, 2020. a
Chapwanya, M. and Stockie, J.: Numerical simulations of gravity‐driven fingering in unsaturated porous media using a nonequilibrium model, Water Resour. Res., 46, W09534, https://doi.org/10.1029/2009WR008583, 2010. a, b
Chen, L., He, A., Zhao, J., Kang, Q., Li, Z.-Y., Carmeliet, J., Shikazono, N., and Tao, W.-Q.: Pore-scale modeling of complex transport phenomena in porous media, Prog. Energ. Combust., 88, 100968, https://doi.org/10.1016/j.pecs.2021.100968, 2022a. a
Chen, L., Qiu, Q., Wang, P., Zhang, X., and Zhang, Z.: Visualization study on preferential flow in highly saturated and super hydrophilic porous media by combining dye tracking and infrared imaging, J. Hydrol., 612, 128077, https://doi.org/10.1016/j.jhydrol.2022.128077, 2022b. a
Cremer, C. J. M., Schuetz, C., Neuweiler, I., Lehmann, P., and Lehmann, E. H.: Unstable Infiltration Experiments in Dry Porous Media, Vadose Zone J., 16, 1–13, https://doi.org/10.2136/vzj2016.10.0092, 2017. a, b
Cueto-Felgueroso, L., Suarez-Navarro, M. J., Fu, X., and Juanes, R.: Numerical Simulation of Unstable Preferential Flow during Water Infiltration into Heterogeneous Dry Soil, Water, 12, 909, https://doi.org/10.3390/w12030909, 2020. a
DiCarlo, D. A.: Experimental measurements of saturation overshoot on infiltration, Water Resour. Res., 40, W04215, https://doi.org/10.1029/2003WR002670, 2004. a, b, c, d, e
DiCarlo, D. A.: Can continuum extensions to multiphase flow models describe preferential flow?, Vadose Zone J., 9, 268–277, https://doi.org/10.2136/vzj2009.0099, 2010. a
DiCarlo, D. A.: Stability of gravity-driven multiphase flow in porous media: 40 Years of advancements, Water Resour. Res., 49, 4531–4544, https://doi.org/10.1002/wrcr.20359, 2013. a, b, c, d
Eliassi, M. and Glass, R. J.: On the porous-continuum modeling of gravity-driven fingers in unsaturated materials: Extension of standard theory with a hold-back-pile-up effect, Water Resour. Res., 38, 16-1–16-11, https://doi.org/10.1029/2001WR001131, 2002. a
Ewing, R. P., Hu, Q., and Liu, C.: Scale dependence of intragranular porosity, tortuosity, and diffusivity, Water Resour. Res., 46, W06513, https://doi.org/10.1029/2009WR008183, 2010. a
Fürst, T., Vodák, R., Šír, M., and Bíl, M.: On the incompatibility of Richards' equation and finger-like infiltration in unsaturated homogeneous porous media, Water Resour. Res., 45, W03408, https://doi.org/10.1029/2008WR007062, 2009. a, b, c, d
Ghanbarian, B., Taslimitehrani, V., Dong, G., and Pachepsky, Y. A.: Sample dimensions effect on prediction of soil water retention curve and saturated hydraulic conductivity, J. Hydrol., 528, 127–137, https://doi.org/10.1016/j.jhydrol.2015.06.024, 2015. a
Ghanbarian, B., Taslimitehrani, V., and Pachepsky, Y. A.: Accuracy of sample dimension-dependent pedotransfer functions in estimation of soil saturated hydraulic conductivity, CATENA, 149, 374–380, https://doi.org/10.1016/j.catena.2016.10.015, 2017. a
Ghanbarian, B., Esmaeilpour, M., Ziff, R. M., and Sahimi, M.: Effect of Pore-Scale Heterogeneity on Scale-Dependent Permeability: Pore-Network Simulation and Finite-Size Scaling Analysis, Water Resour. Res., 57, e2021WR030664, https://doi.org/10.1029/2021WR030664, 2021. a, b
Glass, R. J. and Yarrington, L.: Mechanistic modeling of fingering, nonmonotonicity, fragmentation, and pulsation within gravity/buoyant destabilized two-phase/unsaturated flow, Water Resour. Res., 39, 1058, https://doi.org/10.1029/2002WR001542, 2003. a, b
Glass, R. J., Parlange, J.-Y., and Steenhuis, T. S.: Wetting front instability as a rapid and farreaching hydrologic process in the vadose zone P. F. Germann (Ed.), Rapid and farreaching hydrologic processes in the vadose zone, J. Contam. Hydrol., 3, 207–226, https://doi.org/10.1016/0169-7722(88)90032-0, 1988. a
Glass, R. J., Parlange, J.-Y., and Steenhuis, T. S.: Mechanism for finger persistence in homogenous unsaturated, porous media: Theory and verification, Soil Sci., 148, 60–70, https://doi.org/10.1097/00010694-198907000-00007, 1989a. a
Glass, R. J., Parlange, J.-Y., and Steenhuis, T. S.: Wetting front instability. 2. Experimental determination of relationships between system parameters and two-dimensional unstable flow field behavior in initially dry porous media, Water Resour. Res., 25, 1195–1207, https://doi.org/10.1029/WR025i006p01195, 1989b. a, b
Glass, R. J., Conrad, S. H., and Yarrington, L.: Gravity-destabilized nonwetting phase invasion in macroheterogeneous porous media: Near-pore-scale macro modified invasion percolation simulation of experiments, Water Resour. Res., 37, 1197–1207, https://doi.org/10.1029/2000WR900294, 2001. a, b
Hassanizadeh, S. M., Celia, M. A., and Dahle, H. K.: Dynamic effects in the capillary pressure-saturation relationship and its impact on unsaturated flow, Vadose Zone J., 1, 38–57, https://doi.org/10.2136/vzj2002.3800, 2002. a
Hunt, A. G. and Sahimi, M.: Flow, transport, and reaction in porous media: Percolation scaling, critical-path analysis, and effective medium approximation, Rev. Geophys., 55, 993–1078, 2017. a
Hunt, A. G., Ewing, R. P., and Horton, R.: What's wrong with soil physics, Soil Sci. Soc. Am. J., 77, 1877–1887, https://doi.org/10.2136/sssaj2013.01.0020, 2013. a, b
Jang, J., Narsilio, G. A., and Santamarina, J. C.: Hydraulic conductivity in spatially varying media – a pore-scale investigation., Geophys. J. Int., 184, 1167–1179, 2011. a
Joekar-Niasar, V. and Hassanizadeh, S. M.: Effect of Initial Hydraulic Conditions on Capillary Rise in a Porous Medium: Pore-Network Modeling, Vadose Zone J., 11, vzj2011.0128, https://doi.org/10.2136/vzj2011.0128, 2012. a
Kmec, J.: Analysis of the mathematical models for unsaturated porous media flow, PhD thesis, Palacký University in Olomouc, Czech Republic, https://doi.org/10.13140/RG.2.2.31858.22728, 2021. a
Kmec, J.: The semi-continuum model for unsaturated porous media flow, Zenodo [code], https://doi.org/10.5281/zenodo.6837742, 2022. a
Kmec, J., Fürst, T., Vodák, R., and Šír, M.: A semi-continuum model of saturation overshoot in one dimensional unsaturated porous media flow, Scient. Rep., 9, 8390, https://doi.org/10.1038/s41598-019-44831-x, 2019. a, b, c
Kmec, J., Fürst, T., Vodák, R., and Šír, M.: A two dimensional semi-continuum model to explain wetting front instability in porous media, Scient. Rep., 11, 3223, https://doi.org/10.1038/s41598-021-82317-x, 2021. a, b, c, d, e, f, g, h, i
Kmec, J., Šír, M., Fürst, T., and Vodák, R.: Simulation data for: Semi-continuum modelling of unsaturated porous media flow to explain the Bauters' paradox, Zenodo [data set], https://doi.org/10.5281/zenodo.7657002, 2022. a
Kouznetsova, V., Brekelmans, W. A. M., and Baaijens, F. P. T.: An approach to micro-macro modeling of heterogeneous materials, Comput. Mech., 27, 37–48, https://doi.org/10.1007/s004660000212, 2001. a
Larson, R. G. and Morrow, N. R.: Effects of sample size on capillary pressures in porous media, Powder Technol., 30, 123–138, https://doi.org/10.1016/0032-5910(81)80005-8, 1981. a, b
Lenormand, R., Touboul, E., and Zarcone, C.: Numerical models and experiments on immiscible displacement in porous media, J. Fluid Mech., 189, 165–187, https://doi.org/10.1017/S0022112088000953, 1988. a
Liu, H.-H.: Fluid Flow in the Subsurface – History, Generalization and Applications of Physical Laws, Springer International Publishing Switzerland, https://doi.org/10.1007/978-3-319-43449-0, 2017. a, b
Liu, H.-H., Zhang, R., and Bodvarsson, G. S.: An active region model for capturing fractal flow patterns in unsaturated soils: Model development, J. Contam. Hydrol., 80, 18–30, https://doi.org/10.1016/j.jconhyd.2005.07.002, 2005. a, b
Masoodi, R. and Pillai, K. M.: Wicking in Porous Materials: Traditional and Modern Modeling Approaches, CRC Press, ISBN 978-1-4398-7432-5, 2012. a
Mishra, B. K. and Sharma, M. M.: Measurement of pore size distributions from capillary pressure curves, American Institute of Chemical Engineers Journals, 34, 684–687, https://doi.org/10.1002/aic.690340420, 1988. a, b
Mualem, Y.: A new model for predicting the hydraulic conductivity of unsaturated porous media, Water Resour. Res., 12, 513–522, https://doi.org/10.1029/WR012i003p00513, 1976. a
Mualem, Y. and Dagan, G.: Hydraulic conductivity of soils: unified approach to the statistical models, Soil Sci. Soc. Am. J., 42, 392–395, https://doi.org/10.2136/sssaj1978.03615995004200030003x, 1978. a
Nimmo, J. R.: The Processes of Preferential Flow in the Unsaturated Zone, Soil Sci. Soc. Am. J., 85, 1–27, https://doi.org/10.1002/saj2.20143, 2021. a
Ommi, S. H., Sciarra, G., and Kotronis, P.: A phase field model for partially saturated geomaterials describing fluid-fluid displacements, Part I: The model and one-dimensional analysis, Adv. Water Resour., 164, 104170, https://doi.org/10.1016/j.advwatres.2022.104170, 2022a. a
Ommi, S. H., Sciarra, G., and Kotronis, P.: A phase field model for partially saturated geomaterials describing fluid-fluid displacements, Part II: Stability analysis and two-dimensional simulations, Adv. Water Resour., 164, 104201, https://doi.org/10.1016/j.advwatres.2022.104201, 2022b. a
Pales, A. R., Li, B., Clifford, H. M., Kupis, S., Edayilam, N., Montgomery, D., Liang, W.-Z., Dogan, M., Tharayil, N., Martinez, N., Moysey, S., Powell, B., and Darnault, C. J. G.: Preferential flow systems amended with biogeochemical components: imaging of a two-dimensional study, Hydrol. Earth Syst. Sci., 22, 2487–2509, https://doi.org/10.5194/hess-22-2487-2018, 2018. a
Parker, J. C. and Lenhard, R. J.: A model for hysteretic constitutive relations governing multiphase flow: 1. Saturation‐pressure relations, Water Resour. Res., 23, 2187–2196, https://doi.org/10.1029/WR023i012p02187, 1987. a
Perfect, E., McKay, L. D., Cropper, S. C., Driese, S. G., Kammerer, G., and Dane, J. H.: Capillary Pressure – Saturation Relations for Saprolite: Scaling With and Without Correction for Column Height, Vadose Zone J., 3, 493–501, https://doi.org/10.2136/vzj2004.0493, 2004. a
Primkulov, B. K., Talman, S., Khaleghi, K., Rangriz Shokri, A., Chalaturnyk, R., Zhao, B., MacMinn, C. W., and Juanes, R.: Quasistatic fluid-fluid displacement in porous media: Invasion-percolation through a wetting transition, Phys. Rev. Fluids, 3, 104001, https://doi.org/10.1103/PhysRevFluids.3.104001, 2018. a
Primkulov, B. K., Pahlavan, A. A., Fu, X., Zhao, B., MacMinn, C. W., and Juanes, R.: Signatures of fluid-fluid displacement in porous media: wettability, patterns and pressures, J. Fluid Mech., 875, R4, https://doi.org/10.1017/jfm.2019.554, 2019. a
Raats, P. A. C.: Unstable wetting fronts in uniform and nonuniform soils, Soil Sci. Soc. Am. J., 37, 681–685, https://doi.org/10.2136/sssaj1973.03615995003700050017x, 1973. a
Rätz, A. and Schweizer, B.: Hysteresis models and gravity fingering in porous media, Z. Angew. Math. Mech., 94, 645–654, https://doi.org/10.1002/zamm.201200052, 2013. a
Rezanezhad, F., Vogel, H.-J., and Roth, K.: Experimental study of fingered flow through initially dry sand, Hydrol. Earth Syst. Sci. Discuss., 3, 2595–2620, https://doi.org/10.5194/hessd-3-2595-2006, 2006. a, b, c
Richards, L. A.: Capillary conduction of liquid through porous media, Physics, 1, 318–333, https://doi.org/10.1063/1.1745010, 1931. a, b
Rooij, G. H.: Modeling fingered flow of water in soils owing to wetting front instability: a review., J. Hydrol., 231–232, 277–294, https://doi.org/10.1016/S0022-1694(00)00201-8, 2000. a
Schaap, M. and Leij, F.: Improved Prediction of Unsaturated Hydraulic Conductivity with the Mualem-van Genuchten Model, Soil Sci. Soc. Am. J., 64, 843–851, https://doi.org/10.2136/sssaj2000.643843x, 2000. a
Schneider, M., Köppl, T., Helmig, R., Steinle, R., and Hilfer, R.: Stable propagation of saturation overshoots for two-phase flow in porous media, Transp. Por. Med., 121, 621–641, https://doi.org/10.1007/s11242-017-0977-y, 2017. a
Schroth, M., Ahearn, S., Selker, J., and Istok, J.: Characterization of Miller-similar silica sands for laboratory hydrologic studies, Soil Sci. Soc. Am. J., 60, 1331–1339, https://doi.org/10.2136/sssaj1996.03615995006000050007x, 1996. a, b
Schweizer, B.: Hysteresis in porous media: Modelling and analysis, Interface. Free Bound., 19, 417–447, https://doi.org/10.4171/IFB/388, 2017. a
Selker, J., Parlange, J.-Y., and Steenhuis, T.: Fingered flow in two dimensions: 2. Predicting finger moisture profile, Water Resour. Res., 28, 2523–2528, https://doi.org/10.1029/92WR00962, 1992. a
Sililo, O. T. N. and Tellam, J. H.: Fingering in Unsaturated Zone Flow: A Qualitative Review with Laboratory Experiments on Heterogeneous Systems, Ground Water, 38, 864–871, https://doi.org/10.1111/j.1745-6584.2000.tb00685.x, 2005. a
Silva, M. L. N., Libardi, P. L., and Gimenes, F. H. S.: Soil water retention curve as affected by sample height, Rev. Bras. Cienc. Solo, 42, e0180058, https://doi.org/10.1590/18069657rbcs20180058, 2018. a
Van Genuchten, M. T.: A closed-form equation for predicting the hydraulic conductivity of unsaturated soils, Soil Sci. Soc. Am. J., 44, 892–898, https://doi.org/10.2136/sssaj1980.03615995004400050002x, 1980. a, b
Visintin, A.: Differential models of hysteresis, Springer Berlin, Heidelberg, https://doi.org/10.1007/978-3-662-11557-2, 1994. a
Vodák, R., Fürst, T., Šír, M., and Kmec, J.: The difference between semi-continuum model and Richards' equation for unsaturated porous media flow, Scient. Rep., 12, 7650, https://doi.org/10.1038/s41598-022-11437-9, 2022. a, b, c, d, e, f, g, h, i, j, k, l, m
Wei, H., Zhu, X., Liu, X., Yang, H., Tao, W.-Q., and Chen, L.: Pore-scale study of drainage processes in porous media with various structural heterogeneity, Int. Commun. Heat Mass, 132, 105914, https://doi.org/10.1016/j.icheatmasstransfer.2022.105914, 2022. a
Wei, Y., Cejas, C. M., Barrois, R., Dreyfus, R., and Durian, D. J.: Morphology of Rain Water Channeling in Systematically Varied Model Sandy Soils, Phys. Rev. Appl., 2, 044004, https://doi.org/10.1103/PhysRevApplied.2.044004, 2014. a
White, J. A., Borja, R. I., and Fredrich, J. T.: Calculating the effective permeability of sandstone with multiscale lattice Boltzmann/finite element simulations, Acta Geotechnica, 1, 195–209, https://doi.org/10.1007/s11440-006-0018-4, 2006. a, b, c
Xiong, Y.: Flow of water in porous media with saturation overshoot: A review, J. Hydrol., 510, 353–362, https://doi.org/10.1016/j.jhydrol.2013.12.043, 2014. a
Yao, T. and Hendrickx, J. M. H.: Stability of wetting fronts in dry homogeneous soils under low infiltration rates, Soil Sci. Soc. Am. J., 60, 20–28, https://doi.org/10.2136/sssaj1996.03615995006000010006x, 1996. a, b, c
Zhou, D. and Stenby, E. H.: Interpretation of capillary-pressure curves using invasion percolation theory, Transport Porous Med., 11, 17–31, https://doi.org/10.1007/BF00614632, 1993. a