the Creative Commons Attribution 4.0 License.
the Creative Commons Attribution 4.0 License.
 | 22 Mar 2023
Seasonal variation and release of soluble reactive phosphorus in an agricultural upland headwater in central Germany
Jörg Tittel
Frido Reinstorf
Michael Schubert
Kay Knöller
Benjamin Gilfedder
Florian Merensky-Pöhlein
Andreas Musolff
Soluble reactive phosphorus (SRP) concentrations in agricultural headwaters can display pronounced seasonal variability at low flow, often with the highest concentrations occurring in summer. These SRP concentrations often exceed eutrophication levels, but their main sources, spatial distribution, and temporal dynamics are often unknown. The purpose of this study is therefore to differentiate between potential SRP losses and releases from soil drainage, anoxic riparian wetlands, and stream sediments in an agricultural headwater catchment. To identify the dominant SRP sources, we carried out three longitudinal stream sampling campaigns for SRP concentrations and fluxes. We used salt dilution tests and natural 222Rn to determine water fluxes in different sections of the stream, and we sampled for SRP, Fe, and 14C dissolved organic carbon (DOC) to examine possible redox-mediated mobilization from riparian wetlands and stream sediments. The results indicate that a single short section in the upper headwater reach was responsible for most of the SRP fluxes to the stream. Analysis of samples taken under summer low-flow conditions revealed that the stream water SRP concentrations, the fraction of SRP within total dissolved P (TDP), and DOC radiocarbon ages matched those in the groundwater entering the gaining section. Pore water from the stream sediment showed evidence of reductive mobilization of SRP, but the exchange fluxes were probably too small to contribute substantially to SRP stream concentrations. We also found no evidence that shallow flow paths from riparian wetlands contributed to the observed SRP loads in the stream. Combined, the results of this campaign and previous monitoring suggest that groundwater is the main long-term contributor of SRP at low flow, and agricultural phosphorus is largely buffered in the soil zone. We argue that the seasonal variation of SRP concentrations was mainly caused by variations in the proportion of groundwater present in the streamflow, which was highest during summer low-flow periods. Accurate knowledge of the various input pathways is important for choosing effective management measures in a given catchment, as it is also possible that observations of seasonal SRP dilution patterns stem from increased mobilization in riparian zones or from point sources.
- Article
(2712 KB) - Full-text XML
-
Supplement
(740 KB) - BibTeX
- EndNote


Land-to-water diffuse phosphorus emissions caused by intensive agricultural land use are a major cause of eutrophication in streams, rivers, and lakes (Bol et al., 2018). Phosphorus losses from headwater catchments are the result of integrated hydrological and biogeochemical processes occurring within the drainage area and in the stream (Bormann and Likens, 1967; Bernal et al., 2015). Such headwater P transport processes can exhibit high spatio-temporal variability and are controlled by landscape properties. This high variability is especially well-described for particulate P losses (Bechmann et al., 2008; Bol et al., 2018). However, recent studies suggest that dissolved and colloidal P mobilization from agricultural land can also result in a high seasonal variation in soluble reactive phosphorus (SRP) concentrations in headwater streams (Bol et al., 2018). This variability in seasonal P concentrations is possibly of greater importance than previously assumed (Dupas et al., 2018), and it can be related to a change in the proportion of different P sources throughout the year. SRP mobilization can occur from various headwater compartments, comprising (1) preferential flow in soils and tile drainage, (2) riparian wetlands in connection with anoxic conditions and a reductive dissolution of Fe (oxy)hydroxides (Tittel et al., 2022), (3) stream sediments via the same reductive process or desorption (Kleinman et al., 2003; Gu et al., 2017; Smolders et al., 2017), and (4) groundwater systems (Brookfield et al., 2021).
The leaching of dissolved P from soils has been linked to surface-soil P desorption (McDowell and Sharpley, 2001) and the application of fertilizer (Chardon et al., 2007). Subsurface transport is often dominated by preferential flow through soil macropores (Simard et al., 2000). In addition, factors such as high soil P sorption saturation (Psat) and oxidation-reduction cycles can greatly increase P mobility through soils (Behrendt and Boekhold, 1993; Heckrath et al., 1995). The lateral transport of P is mostly induced by artificial drainage that provides a lateral shortcut between subsurface macropores and surface water (Heathwaite and Dils, 2000), but it also occurs in association with particular soil characteristics, e.g., sandy soils (Kleinman et al., 2009).
The hydrological variability of riparian wetlands has also been widely shown to influence SRP mobilization via redox conditions in soils. The high water table and low-flow velocities that are typical for riparian wetlands during the wet season can create anoxic conditions. This can lead to the reductive dissolution of Fe (oxy)hydroxides (Jeanneau et al., 2014; Knorr, 2013) and hence to the solubilization of the P previously adsorbed or coprecipitated onto/within these mineral phases (Zak and Gelbrecht, 2007). Similar findings have been recorded for upland headwater catchments, with increased SRP mobilization via redox processes during periods when groundwater levels are high and intersect organic-rich soils (Dupas et al., 2017a). It is assumed that these temperature-dependent biogeochemical processes could lead to P release into streams and rivers during the summer period when is denitrified and thus missing as a redox buffer for the reductive mobilization of Fe oxides (Musolff et al., 2017; Dupas et al., 2018).
Stream sediments have the potential to remove or release P to stream water during summer low-flow conditions (Simpson et al., 2021). When streams are mainly fed by groundwater, P reactions in the groundwater–stream interface (i.e., hyporheic zone) may control the release of P. Data suggest that anoxic conditions can cause the release of sediment P in streams (Simpson et al., 2021). The highest seasonal concentrations of SRP are often found in summer and during low flow, and they are higher in lowland than in upland rivers (Bowes et al., 2003). SRP redox-mediated release from river sediments has been identified in lowland rivers during summer anoxia (Smolders et al., 2017). This mobilization of P from sediments to the water column was found to be related to the molar ratio in stream sediments. The authors suggested that the temporal and spatial variability of soluble P in the waterbody of lowland rivers was mainly related to internal loading, i.e., to the legacy P in the sediment and not to the corresponding variability in emission and dilution rates (Smolders et al., 2017).
Finally, groundwater systems can be important sources for the mobilization and transport of P to surface waters. The P concentration in groundwater depends on the geology and long-term land use pattern in the catchment (Brookfield et al., 2021). Long-term agricultural activities can lead to P concentrations in the soil that exceed the sorption capacity of the soil, and soil P may be released in dissolved form into the groundwater system (Brookfield et al., 2021; Haygarth et al., 2014). In addition to this accumulation of P in groundwater through anthropogenic activities, the extent of water–rock interaction can also impact the P concentration in groundwater. An important factor is the contact time of groundwater with the aquifer matrix, and slower groundwater flow can lead to more interactions between water, rock, and microbes. For example, chemical weathering can affect the sorption of P onto aquifer minerals, where the sorption ability of P can decrease with increasing pH (Cornell and Schwertmann, 2003).
A recent comparative study in forest and agricultural headwaters revealed that the highest levels of seasonal SRP occurred in headwater streams featuring riparian wetlands or high groundwater levels in the near-stream zone (Dupas et al., 2017b). One of the catchments evaluated in Dupas et al. (2017b) is the agricultural Schäfertal catchment, which is a typical headwater of the central German lower mountain hard-rock area. Until now it has been unclear which P sources and transfer pathways are responsible for the distinct seasonal pattern of winter lows and summer highs in the SRP level, and evidence is lacking on the dominant P transfer pathways. Furthermore, it is not clear how land use (e.g., P status) might impact baseline SRP concentrations nor which factors control SRP mobilization (groundwater heads, land use, temperature, redox processes, P status of riparian zones, etc.). An analysis of these controlling factors would enable identification of the sources of SRP in a characteristic hard-rock agricultural catchment in a lower mountain range.
The objectives of the present study were (1) to identify the main pathways for SRP transfer into the stream water of an agricultural headwater catchment during low-flow conditions (e.g., transfer from deep groundwater, redox-controlled delivery from riparian wetlands, release from stream sediment), (2) to localize the major source areas of SRP within the catchment, and (3) to explain the mechanisms leading to the development of characteristic seasonal SRP concentrations.
This study aims to spatially localize and quantify gaining and losing water fluxes along the Schäfertal stream, using salt tracer injections and longitudinal measurements of stream 222Rn activities. By combining these spatially distributed water fluxes with longitudinal water quality measurements, it was possible to quantify proximal SRP fluxes along the whole stream length. To identify the SRP release processes, we conducted additional radiocarbon, dissolved organic carbon (DOC), and Fe measurements in gaining groundwater and in the streambed sediments for comparison with the stream water signature. Combined measurement campaigns during summer and winter low-flow conditions enabled us to evaluate the seasonal influence on the behavior of SRP transport in the study headwater.
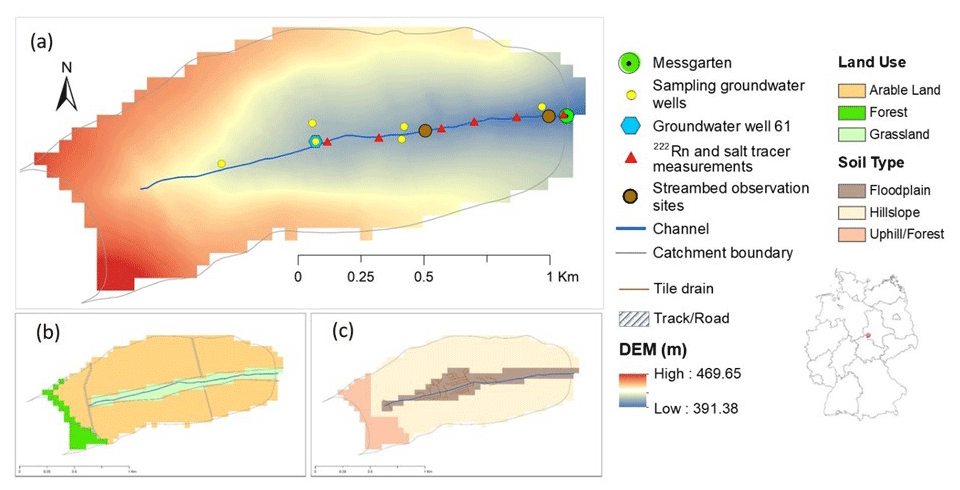
Figure 1The Schäfertal catchment and monitoring locations used by Yang et al. (2021), showing (a) digital elevation model (DEM) and monitoring sites with sampled groundwater wells, (b) land use types, and (c) soil types and the tile drain network. A V-notch weir is installed in the “Messgarten” climate station for discharge measuring and stream water sampling (adapted from Yang et al., 2021).
2.1 Study site
The Schäfertal stream is located in an agricultural headwater catchment (1.44 km2, Fig. 1), in the Lower Harz Mountains in central Germany. Elevation ranges from 391 at the outlet to 474 m. The north- and south-facing hillslopes, with an average slope of 11∘, are intensively cultivated (crop rotation – winter wheat, triticale, rapeseed, winter wheat); mineral-fertilizer application levels were between 60 (rapeseed) and 148 kg N ha−1 yr−1 (winter wheat), and between 11 and 14 kg P ha−1 yr−1 (State Institute for Agriculture and Horticulture, LLG, 2021; Kistner et al., 2013). In 2018, the cropping system shifted to organic farming, and no more mineral fertilizer was applied. The mid-catchment valley bottom is dominated by grassland with drainage channels; the upstream hilltop is occupied by sparse forest (Fig. 1).
The underlying Paleozoic greywacke and Devonian shale are covered by periglacial layers with varying fractions of loess and rock fragments, resulting in complex geomorphological structures through the soil profile (Kistner et al., 2013). The hillslope soils (Graeff et al., 2009) exhibit relatively high porosity and hydraulic conductivity (mean value of m s−1) in the topsoil layer and lower hydraulic conductivity (mean value of m s−1) in the base layer at depths below 0.4 m (Graeff et al., 2009). Soil properties ascertained by field soil core sampling are generally homogenous (Schrön et al., 2017), with a certain degree of spatial variability caused by detailed topographic characteristics such as slope position, valley bottom, and exposition (e.g., as reported in Ollesch et al., 2005; Anis and Rode, 2015). Additionally, there is an extensive network of artificial tile drains throughout the central valley bottom (see Yang et al., 2021). Fluvisols and Gleysols dominate in the valley bottom and are partly drained by the tile drainage network. The arable hillslope soils are Gleyic Cambisols and Luvisols, and a small area of forest soils made up of Rankers and Cambisols is found at the top of the catchment (Fig. 1) (Yang et al., 2021). It can be assumed that aquifer thickness ranges from 2 m at the top of the hillslopes to 5 m at the valley bottom (2.4 m on average), based on the dominance of Gleysols and Luvisols toward the valley bottom (Yang et al., 2018). The stream itself has a length of 1747 m and a slope of 2 %, with a mean catchment area normalized discharge of 0.33 mm d−1 (∼5.5 L s−1). The stream has a mean width of 0.4 and a depth of 0.05 m. The substrate consists of fine and mid-granular sand. It is an open canopy stream without riparian trees and with high light availability. The forest area of 3 % is restricted to the upper part of the catchment.
Previous research has shown mean soil total phosphorus (TP) content in the topsoil layer (3–5 cm) to be ∼916 mg P kg−1, while water-soluble phosphorus (WSP) content is 13.1 mg P kg−1, indicating a strong influence from fertilizer use. The degree of phosphorus saturation (DPS) is 31.7 % (Kistner et al., 2013). It can be assumed that the TP concentration changes only slightly over time (Little et al., 2007), while modeling has shown that temporal variation in WSP concentrations can be high, caused by fertilizer application and crop uptake (Kistner et al., 2013). Calculated short-term declines of DPS in the topsoil layer (upper 2 cm of soil) can be explained by rainfall events. This suggests a transport of soluble P compounds to deeper soil layers (Kistner et al., 2013). Topsoil WSP concentrations also display high spatial variability, from 2.3 to 37.6 mg P kg−1 (Kistner et al., 2013). The recorded means for soil organic carbon content and pH in the topsoil layer are 21.3 g kg−1 and 6.39, respectively (Kistner et al., 2013). DOC concentration in soil pore water ranges between 1.2 and 62.6 mg L−1 (Ackermann, 2016).
Due to its location in the eastern lee of the Upper Harz Mountains, the catchment sits in a rain shadow of the Brocken Mountain and therefore has a relatively low average annual precipitation of about 629 mm yr−1 (1991–2020). Precipitation is relatively evenly distributed over the year, with slightly higher precipitation values in summer. The discharge regime of the Schäfertal stream however is dominated by higher discharges in winter, mainly due to snowmelt, and low-flow periods in summer (Fig. 2). The influence of earlier mining activities further down the catchment on the flow regime and groundwater levels ceased with the mining activities in the beginning of the 1990s, and pre-mining hydrological conditions have returned.
In summer, the stream regularly dries up in the area near the source, while it is perennial in the lower sections. The dynamics of groundwater levels near the wetland in the central part of the catchment show a significant decrease due to the relatively strong drought conditions during 2018–2019 (well 61; see Fig. 1, period 2010–2021, in the Supplement). An isotope tracer-aided modeling study has shown that under these drought conditions, modeled stream runoff from deeper, older storages increased significantly after a particularly wet season, resulting in a sharp increase in mean stream water age (Yang et al., 2021). Earlier long-term stream water quality measurements at the catchment outlet (1999–2010) reveal concentrations in discharge to be between 0.11 and 11 mg N L−1 (mean: 4.37 mg L−1), DOC concentration between 1.7 and 12.6 mg L−1 (mean: 4.23 mg L−1), SRP between 0.002 and 0.16 mg L−1 (mean: 0.025 mg L−1), and TP concentrations between 0.009 and 0.33 mg L−1 (mean: 0.067 mg L−1). Baseflow stream-concentration data show clear seasonal variations, with peaking in winter, while DOC and SRP peak in summer (Dupas et al., 2017b).
2.2 Measurement campaigns
Measurement campaigns took place after snowmelt in January 2019 during a period of slightly elevated discharge and groundwater levels and in September 2019 and 2020 during prolonged periods of low flow and low groundwater levels. These campaigns comprised in-stream salt tracer dilution tests and 222Rn measurements in order to analyze lateral inflows to the stream and water quality measurements to characterize stream water, riparian groundwater, and stream-sediment properties. Meteorological conditions for all campaigns were characterized by comparatively low rainfall in the preceding days (Fig. 2). The groundwater levels in the sampling period ranged between 0.5 and 1.1 m below soil surface. During the three sampling campaigns, mean groundwater levels were 0.65 m (January 2019), 1.0 m (September 2019), and 0.85 m (September 2020) below the surface (see Fig. S1 in the Supplement). Note that screens of the wells and thus groundwater sampling depths are between 3.25 and 10.88 m below the soil surface.
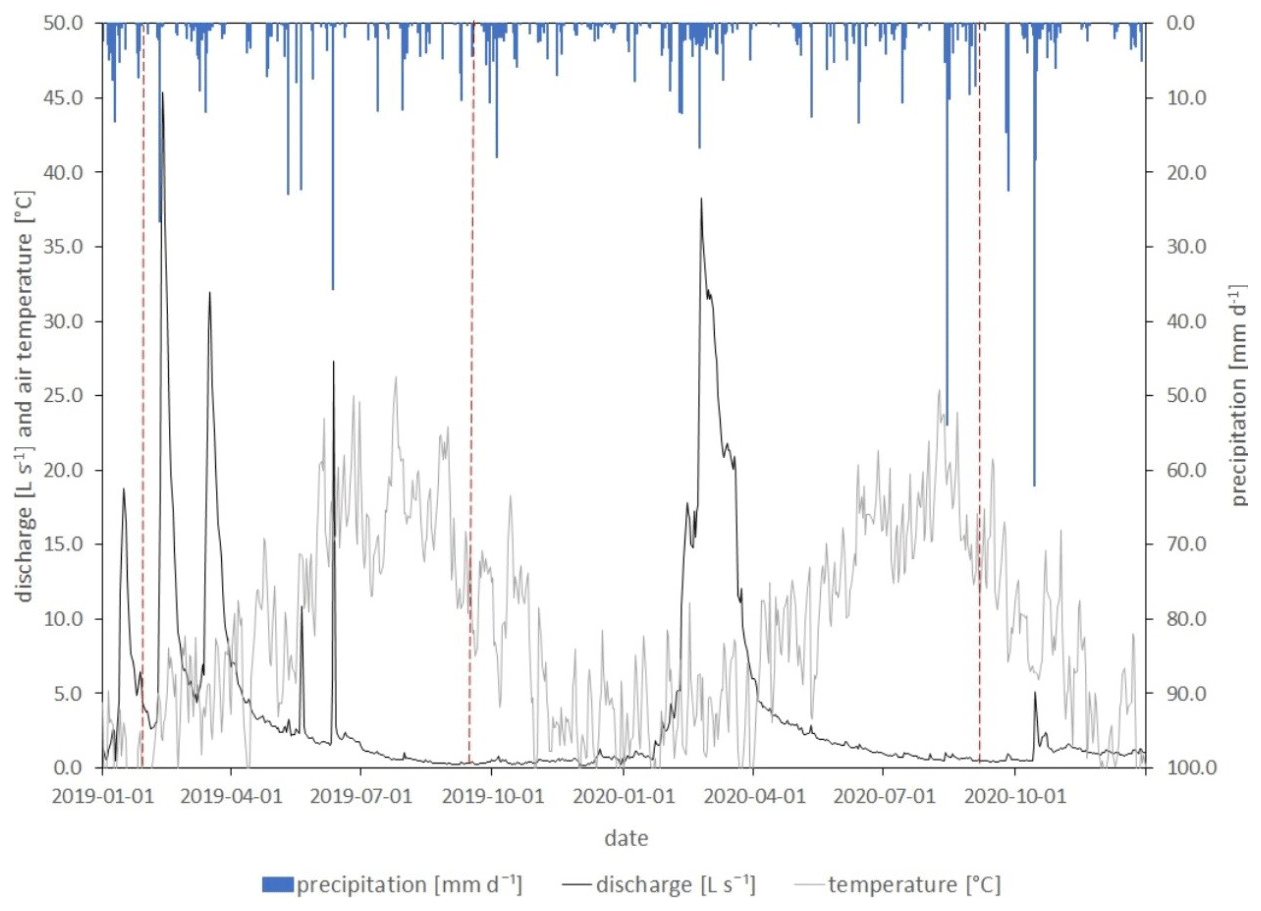
Figure 2Daily precipitation (mm d−1), daily average discharge (L s−1), and daily average air temperature (∘C) for the Schäfertal stream during the measurement campaign period. Dashed red lines mark the campaign dates.
2.2.1 Water inflows to the stream
Water balance of stream sections measured by tracer dilution tests
Consecutive salt tracer dilution tests were applied to quantify gross gains, gross losses, and net change in water flow following Payn et al. (2009). The tracer tests were performed in January 2019, September 2019, and September 2020 at six locations defining five stream sections with lengths between 130 and 250 m. The total length of the stream sections studied was 955 m. The sodium chloride tracer was prepared in the lab and diluted in 7 L of stream water prior to injection. In the two 2019 campaigns, 500 g of tracer was used for each injection, while in the 2020 summer campaign, 100 g of tracer was used. The tracer was injected 10 m upstream of each observation point, giving a mixing length of 20 to 30 times the stream's width. Tracer breakthrough was measured at 5 s intervals using individual in situ conductance loggers (Eijkelkamp CTD-Divers) fixed in a central position in the stream. The tracer was injected working consecutively upstream of the observation point with a time interval of 30 min to ensure that the breakthrough curves of consecutive injections did not overlap. The measured time series for specific conductance were converted to sodium chloride concentrations using a linear regression (with the intercept fixed at zero) for each individual data logger based on four data points with known sodium chloride concentrations (measured in the laboratory). The background specific conductance was subtracted from the time series prior to conversion. For each tracer breakthrough concentration (mg L−1), the time series was summed up to the mass flux (mg L−1 s−1). A known injected tracer mass (mg) makes it possible to derive discharge (L s−1). Following Payn et al. (2009), we quantified breakthrough of the injection at each observation point in relation to the breakthrough of the injection at the observation point immediately upstream, assuming that the net change in discharge is the sum of gross gains and gross losses along the stream. The net change for a given section is calculated as the difference between upstream and downstream discharge measurements. Gross loss for each section is derived at the downstream observation points from mass recovery analysis of the upstream injected tracer and upstream discharge. Gross gain for each section is derived from the difference between net change and gross loss. Note that in the 2019 summer campaign it was not possible to measure upstream injection breakthrough for the uppermost two sections, because flow velocity was too low for breakthrough to be measured in the allotted time. In summer 2020, this was the case for the uppermost section only. Here, only net changes could be quantified.
Groundwater discharge investigated by radon (222Rn) measurements
The natural radon (222Rn) activity in the stream water was used in addition to the salt tracer investigations to provide insight into both the spatial distribution and the quantity of groundwater discharge into the Schäfertal stream along the stream section. Radon is an excellent tracer for investigating groundwater–surface water interactions (Adyasari et al., 2023). Longitudinal stream radon measurements allow the (1) localization of groundwater discharge zones and (2) calculation of radon mass balances within defined sections of the stream and subsequently groundwater discharge into the stream. A crucial parameter for this method is the rate of radon degassing from the stream to the atmosphere, which is primarily dependent on the stream turbulence, i.e., on stream geometry, streambed roughness, and streamflow velocity (Genereux and Hemond, 1992; Raymond et al., 2012). A number of experimental and empirical methods are available to estimate radon degassing from a stream. A detailed discussion of the approach applied specifically to the Schäfertal stream is provided in Schubert et al. (2020). Furthermore, Raymond et al. (2012) have published a comprehensive review of scaling gas transfer velocities in streams and small rivers.
Radon mapping along the Schäfertal stream was carried out during the low-flow measurement campaigns in January 2019 and September 2020. During each campaign, stream water samples were taken from six locations distributed (roughly) equidistantly along the stream, thus subdividing the study reach into five subsections (cf. Fig. 6). The radon sampling points were identical to the salt tracer measurement points. To determine the lumped radon groundwater and tile drainage endmember (hereinafter referred to as “lumped radon groundwater endmember”), water samples were taken from three groundwater wells located adjacently to the stream and from two subsurface tile drains that discharge into the stream within the section located furthest upstream. Radon measurements were carried out on-site immediately after sampling using a mobile radon-in-air monitor (RAD7) as described by Schubert et al. (2006). Groundwater discharge localization and quantification were performed using a mass balance approach in the implicit finite element model FINIFLUX2.0, which is described in detail in Frei and Gilfedder (2015). FINIFLUX numerically solves the mass balance equation for stream 222Rn at the reach scale by using a Petrov–Galerkin finite element scheme fitting modeled radon to the measurement radon results. The model input parameters include (1) the length of the investigated subsection, (2) its mean width and mean depth, and (3) the discharge of the stream and the 222Rn activities of (4) the stream water specific to the subsection and of (5) the overall lumped radon groundwater endmember. Hyporheic exchange is also allowed for by the model (based on the physical characteristics of the hyporheic zone and used as an optimization parameter). The model accounts for radon losses such as (6) degassing using a water–air exchange coefficient (k; specific to each stream subsection) and (7) the first-order decay constant for 222Rn.
2.2.2 Stream water, groundwater, and stream-sediment chemistry
Longitudinal water quality measurements (n=11) were carried out during the three campaigns at intervals of approximately 100 m, starting at the catchment outlet gauging station (in the Messgarten) using a YSI 610 multiparameter probe (O2, pH, electric conductivity) and a TRIOS ProPS-UV sensor with an optical path length of 2 mm (). Probes were calibrated on the day of measurement. Further details on accuracy and precision detection limits are given in Rode et al. (2016). Additional grab samples were taken for the measurement of SRP and total dissolved phosphorus (TDP) using standardized methods. The pore size of filters was 0.22 µm. TP and SRP were measured using the ammonium molybdate spectrometric method (DIN EN ISO 6878, 2004). The detection limit was 0.005 mg P L−1. We operationally define the difference between TDP and SRP as dissolved organic phosphorus (DOP), although this fraction may contain some inorganic phosphorus species.
To elucidate SRP concentrations in potential source zones and possible redox-mediated mobilization, SRP and dissolved Fe from groundwater wells were measured during the September 2020 campaign. Dissolved Fe concentrations were measured by ICP-OES (inductively coupled plasma optical emission spectroscopy, PerkinElmer 7300 DV). The detection limit was 0.01 mg L−1. Additionally, SRP and dissolved Fe were measured in gaining groundwater, streambed pore water, and the stream water. Groundwater samples were taken from six wells near the stream using a peristaltic pump. Streambed pore water samples were taken at two points, one located 400 m from the head of the study reach (upstream station) and the other located 900 m from the head (downstream station or outlet). Gaining groundwater was sampled at the upstream station. Additionally, samples for 14C DOC were taken from stream water and from stream-sediment leachate from both the upstream station and outlet and from gaining groundwater at the upstream station.
Pore water and gaining groundwater were sampled using PTFE piezometers with a diameter of 10 mm and a screen length of 80 mm. The piezometers were placed in the streambed sediments with the help of a solid metal rod, either at a depth of 7 cm below the streambed surface (pore water) or at the bottom of the sediment at a depth of 15 cm (gaining groundwater). Samples were drawn through a PTFE tube with a syringe and filtered with 0.45 µm cellulose acetate filters on-site before being transported in gas-tight flasks without headspace and cooled in the laboratory.
Streambed sediment samples were taken at both stations using a shovel from depths of 5 cm. In the laboratory, 25 g of sediment was slurried with 150 mL of deionized water and incubated for 24 h in an overhead shaker at 20 ∘C in the dark. The pH ranged between 5.0 and 6.1 at the end of incubation. After centrifugation (5250 g, 15 min), the supernatant was filtered (Whatman GF/F, pre-combusted for 4 h at 500 ∘C), and the DOC in the water samples was processed for radiocarbon analysis as described previously (Tittel et al., 2013). Radiocarbon quantities were analyzed by accelerator mass spectrometry (AMS) at the Poznan Radiocarbon Laboratory (Poland). The results refer to the oxalic acid II standard and were corrected for fractionation (Stuiver et al., 1977).
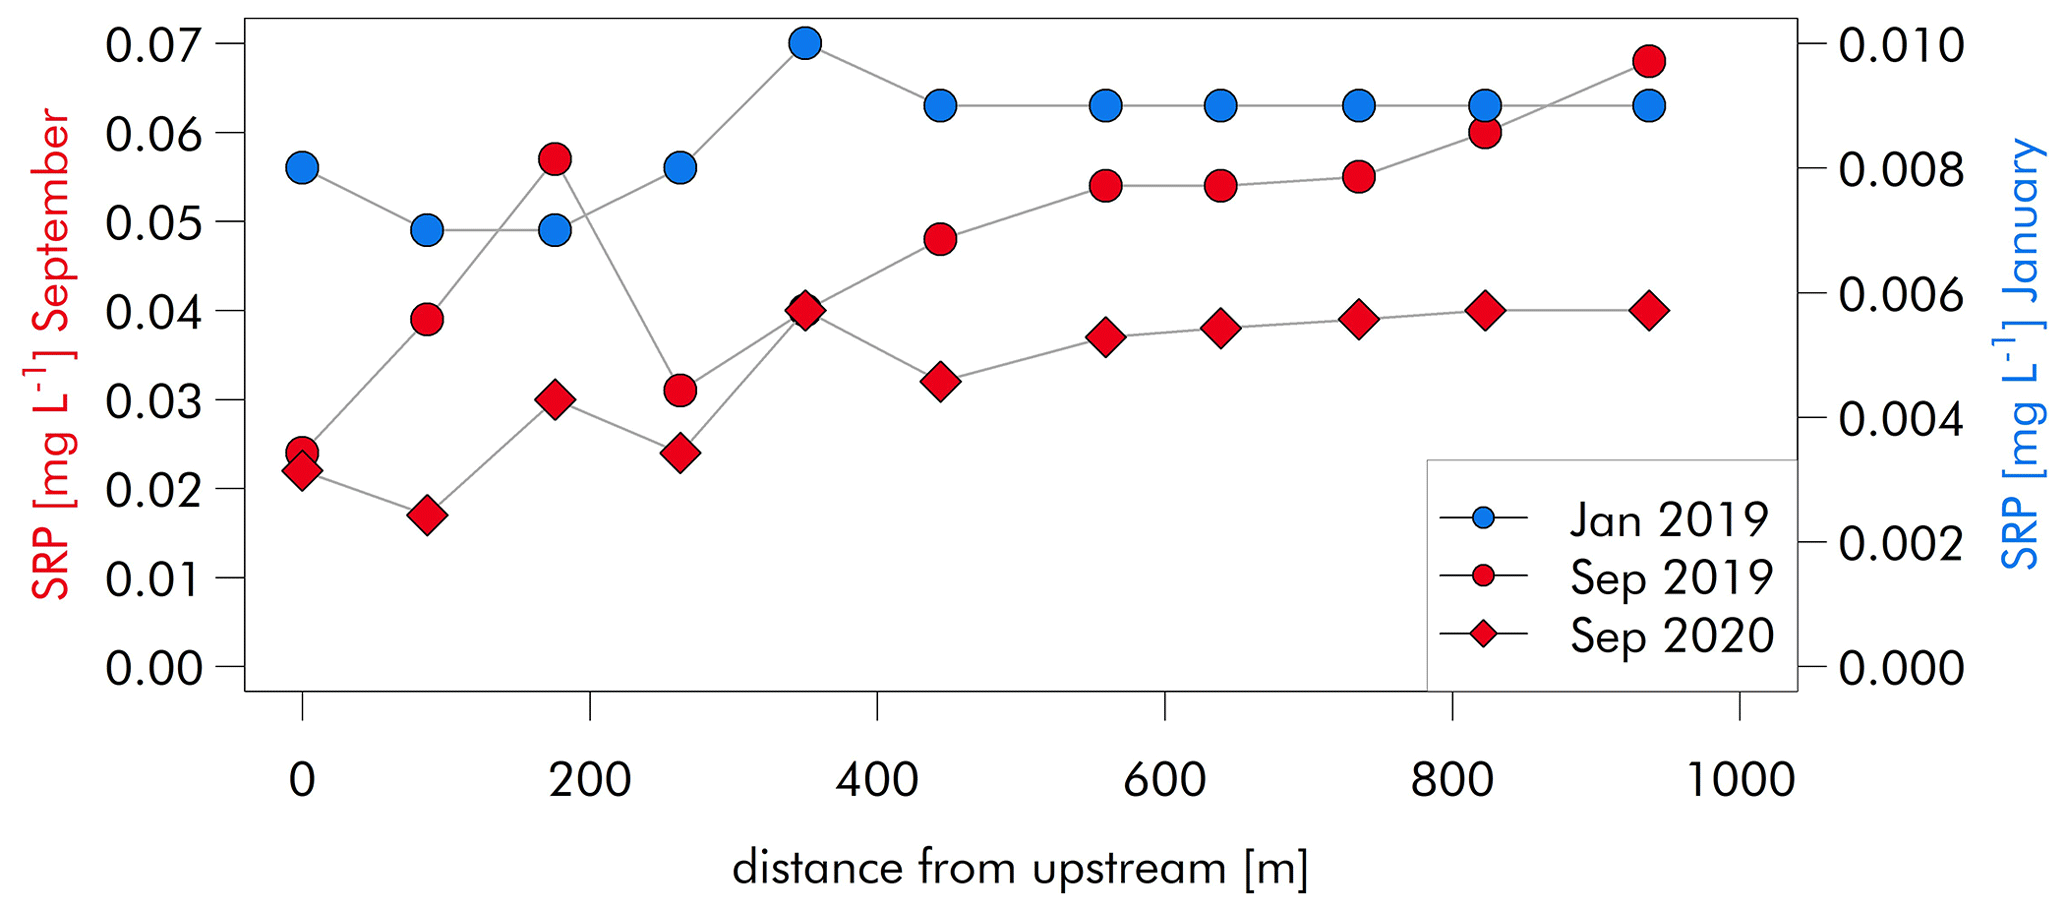
Figure 3Longitudinal SRP concentration profiles for the three measurement campaigns in January 2019, September 2019, and September 2020.
3.1 Observed discharge and stream SRP concentrations
During the January 2019 campaign, the stream discharge at the outlet was 5.35 L s−1. This campaign was carried out in the recession phase of a discharge event (Fig. 2) with no visible active surface flow to the stream. By contrast, the summer campaigns were carried out under strong drought conditions, and the stream discharge measured at the outlet was only 0.26 (September 2019) and 0.51 L s−1 (September 2020) (see Fig. 2). During the two summer campaigns, SRP concentration at the outlet (0.068 mg L−1 in September 2019 and 0.041 mg L−1 in September 2020) was higher by a factor of 4 to 8 than in the winter campaign (0.009 mg P L−1 in January 2019). SRP concentrations displayed very constant longitudinal behavior with only a very slight increase upstream to downstream from 0.008 to 0.009 mg P L−1 in January 2019 (Fig. 3). We monitored more pronounced increases along the stream in September 2019 from 0.024 to 0.068 mg P L−1 and in September 2020 from 0.022 to 0.040 mg P L−1. Total dissolved P (TDP) was 0.040 mg L−1 higher than SRP during both 2019 campaigns but was only 0.001 mg L−1 higher in September 2020. The strongest increase in SRP concentrations was found at a distance of approximately 200 m from the head of the study reach during summer campaigns, whereas the highest concentrations in January 2019 were observed at a location approximately 400 m from the head of the reach (Fig. 3). Nitrate concentrations tended to increase from upstream to downstream during both summer campaigns up to 3.81 (September 2019: mean of 3.59 mg N L−1) and 4.48 mg N L−1 (September 2020: mean of 4.50 mg N L−1). A much higher mean concentration of 12.7 mg N L−1 was recorded during January 2019.
3.2 Observed longitudinal water and SRP fluxes
The salt tracer dilution tests produced a distinct, non-uniform distribution of increases in discharge. In the January 2019 campaign, the two uppermost stream sections (0 to 460 m) cumulatively gained 44 % of the discharge observed at the catchment outlet gauging station. There was no further increase in discharge in the three downstream sections, while the lowest stream section appeared to have significant losses. In the two September campaigns, a high proportion of the increases in discharge occurred in the second section alone (210 to 460 m from upstream). This section could account for 52 % (2020) to 89 % (2019) of the discharge observed at the outlet of the catchment.
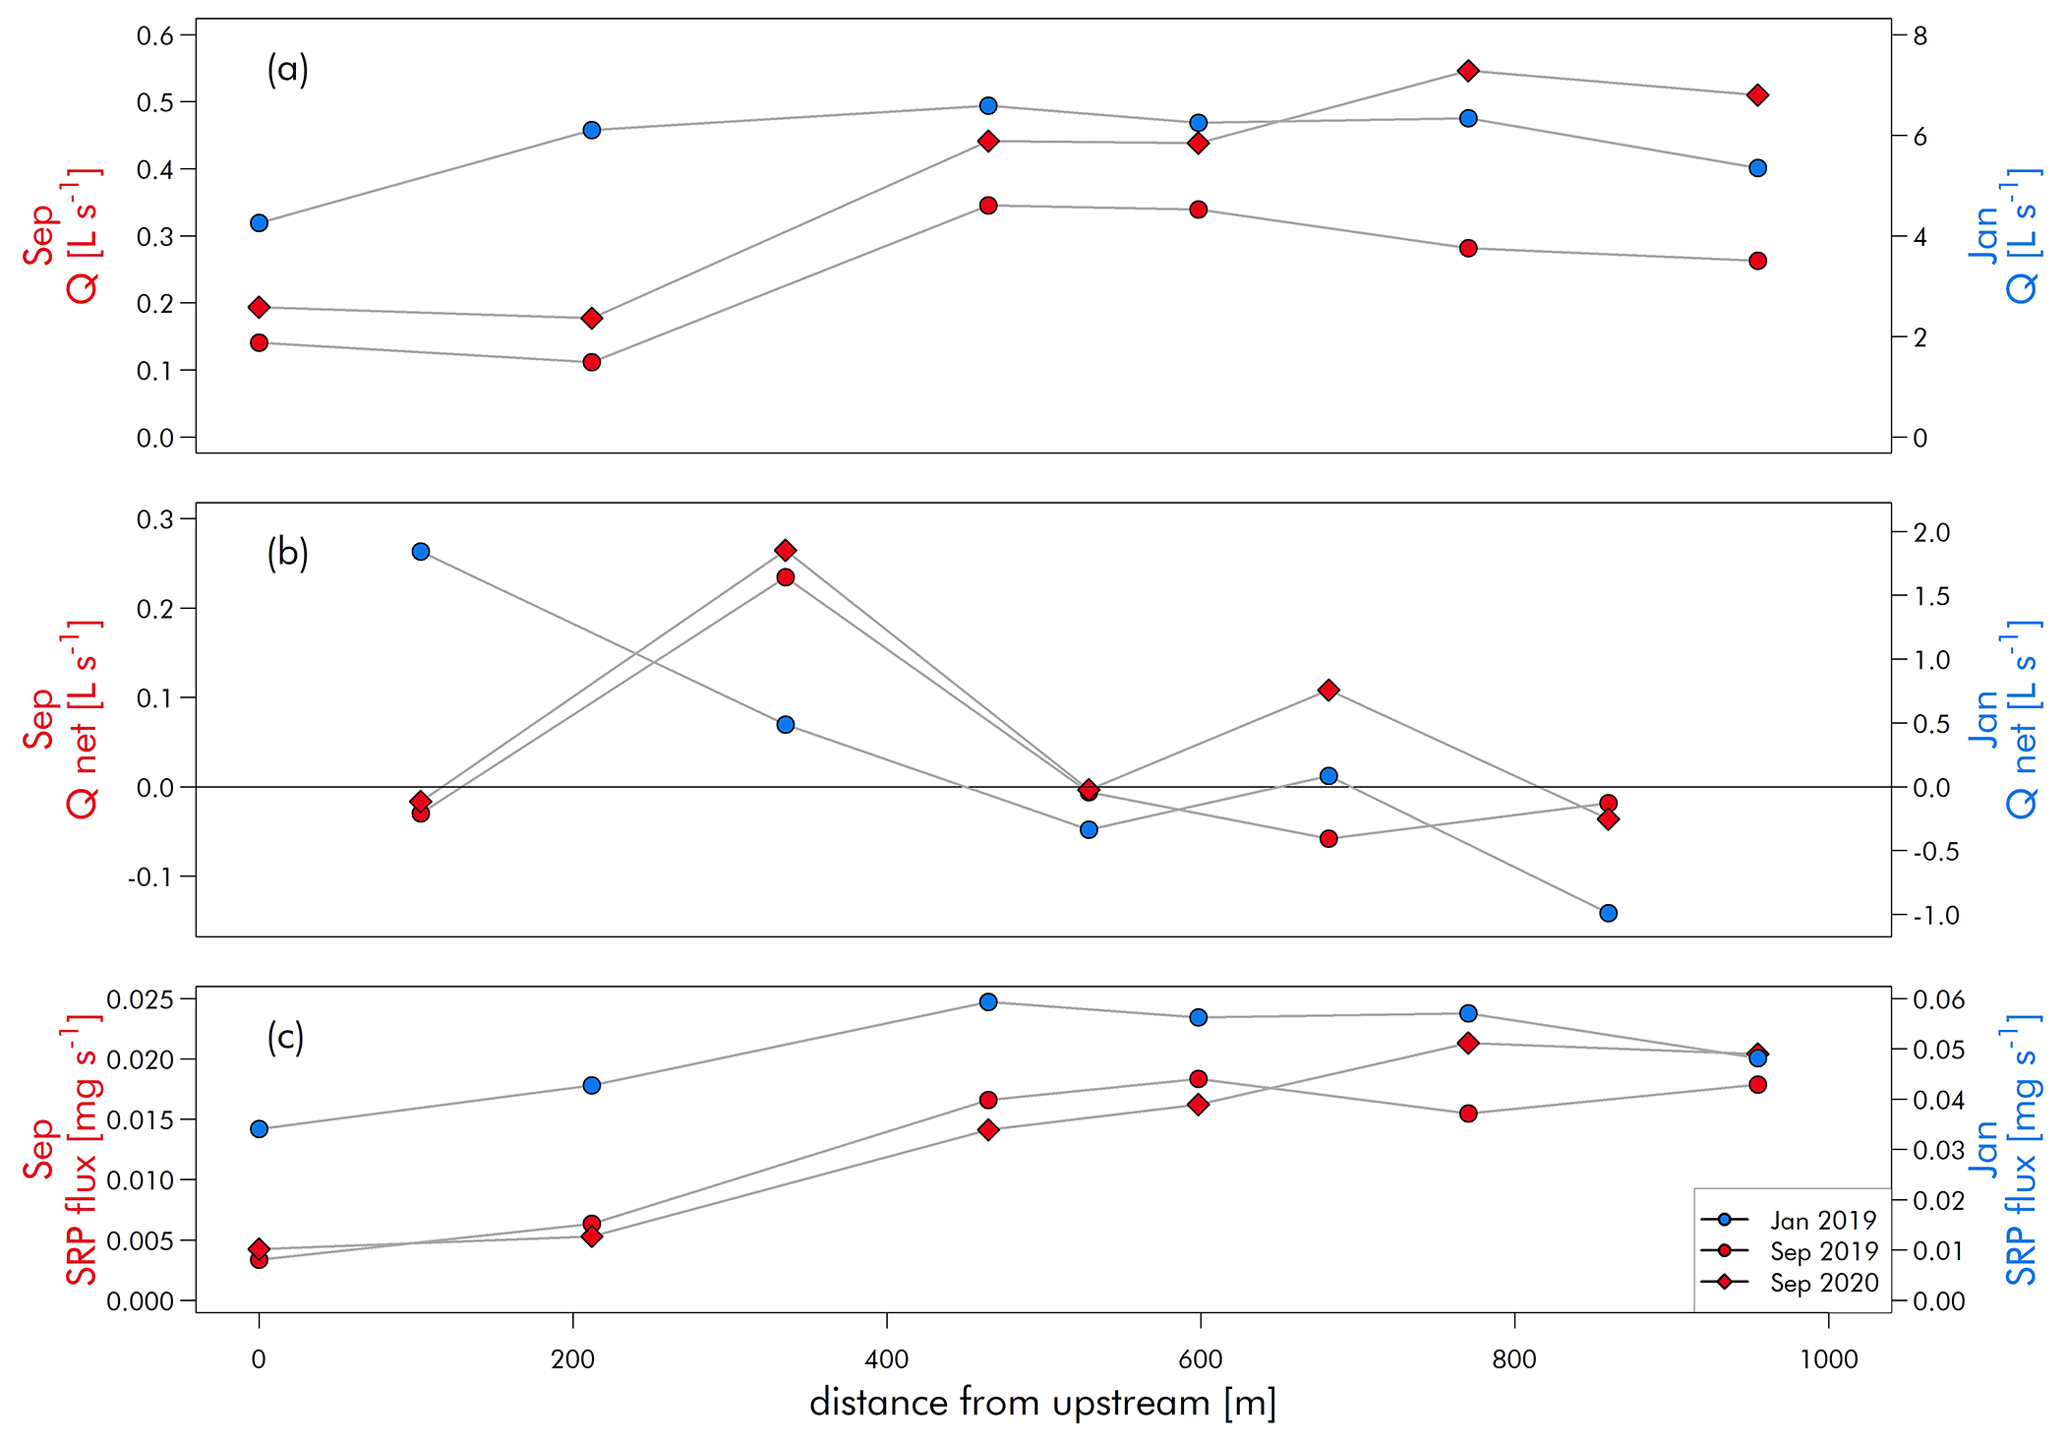
Figure 4Discharge, net discharge gains and losses, and SRP flux along the stream during the three sampling campaigns.
The SRP flux at the catchment outlet in the winter campaign (0.048 mg s−1) was double the flux observed during the two September campaigns (0.018 and 0.028 mg s−1, respectively). The spatial pattern of discharge along the stream largely translated to the pattern observed for SRP flux. In January 2019, the two upstream sections gained 52 % of the SRP flux observed at the outlet, while the downstream section lost a small amount of water and SRP. In the September campaigns, just one stream section gained 43 % (2020) and 57 % (2019) of the SRP flux observed at the outlet. In 2020, we observed a further increase in the lowest three sections of 30 %, which had not been observed in 2019.
3.3 Groundwater discharge investigated by 222Rn measurements
The two radon sampling campaigns (“winter”: January 2019 and “summer”: September 2020) resulted in almost identical radon concentration distribution patterns along the study reach, with high radon concentrations in the two upstream subsections and concentrations declining exponentially at approximately similar rates in the three downstream subsections (Fig. 5). The lumped radon groundwater endmember (as determined from samples taken from three groundwater wells and two tile drains) averaged 23.2±1.14 kBq m−3. In the summer campaign, the very low water level at the sampling point furthest upstream made it necessary to dig a small depression in the streambed sediment for stream water sampling. This disturbance to the streambed is highly likely to have resulted in a minor but locally significant preferential groundwater discharge pathway, leading to a radon concentration in this particular sample that can be assumed to be closely representative of pure groundwater. Thus, the value detected here was not considered representative of stream water at this location (illustrated as the dashed line in Fig. 5).
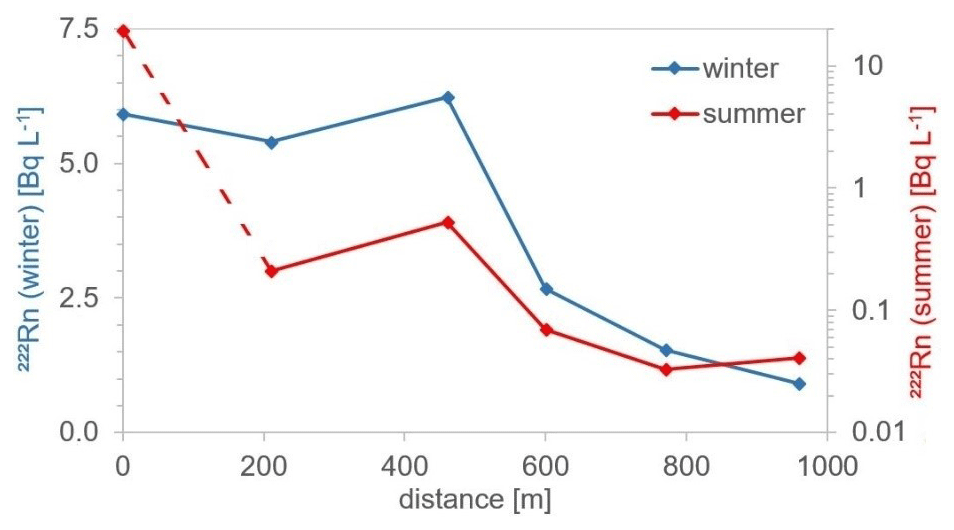
Figure 5222Rn concentration patterns along the stream sections during winter (January 2019) and summer (September 2020) campaigns; the dashed line indicates that the most upstream summer sample cannot be considered representative of stream water (see text above).
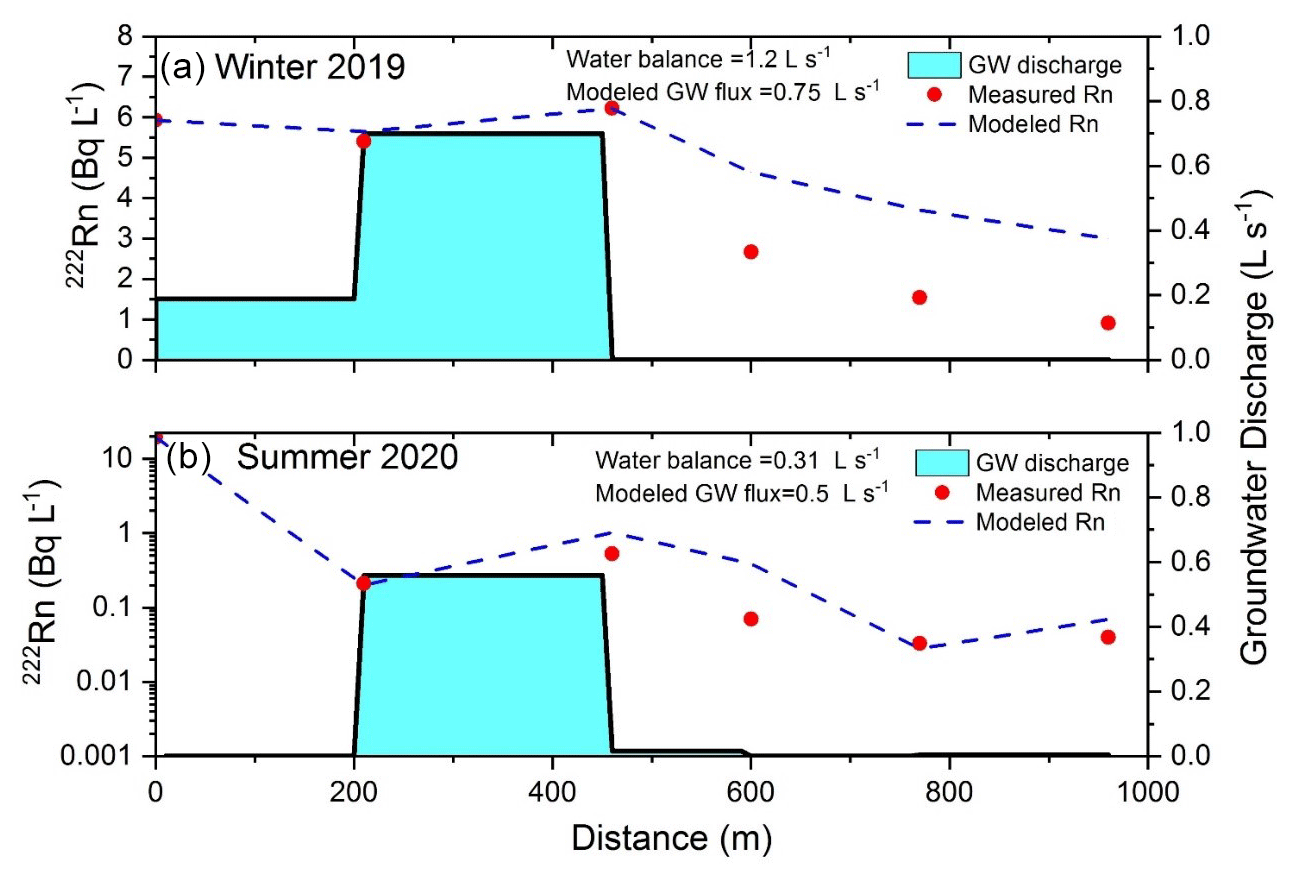
Figure 6222Rn concentrations in the stream water (measured and modeled) and groundwater discharge levels during a the winter (January 2019) campaign and b the summer (September 2020) campaign. Groundwater discharge during the winter campaign includes drain water discharge. Note that the most upstream summer sample was not considered representative of stream water (see Fig. 5).
Although the radon distribution patterns of the winter and summer plots are roughly comparable, the concentrations observed during the winter campaign were significantly higher than in summer. This general difference is thought to result from the differences in hydrological gradients. The summer campaign was conducted under strong drought conditions, implying low groundwater levels and low groundwater discharge to the stream. By contrast, the winter campaign was characterized by high groundwater levels generating normal baseflow (including interflow from shallower stores and/or drains, i.e., from the soil matrix) into the stream.
Groundwater discharge rates were calculated based on the lumped radon groundwater endmember and the stream radon activities displayed in Fig. 5 using the FINIFLUX model. The results for the five stream subsections consistently showed that the majority of groundwater discharge occurred in the second upstream section. The exponential decrease in radon concentration in the following three downstream sections suggests that degassing is the dominant radon sink with little or no contribution from radon sources such as groundwater discharge or hyporheic exchange.
The section-specific quantification of groundwater discharge was more difficult than their localization, due to considerable uncertainties in parameterizing radon degassing (i.e., in defining a degassing coefficient k (m d−1)) for the FINIFLUX model in such a small stream. The uncertainties of the model results are mainly correlated to the uncertainty of the applied degassing coefficient (for a detailed discussion, see Schubert et al., 2020). The k values that resulted from our FINIFLUX model (for details, see Frei and Gilfedder, 2015) for the summer and winter campaign were 4.2 and 2.3 m d−1, respectively. In order to, as a first step, roughly assess the range of reasonable k values, we calculated k for the stream using three equations introduced by Raymond et al. (2012) (their Eqs. 1, 2, and 7). The resulting k values ranged from 1.1 to 3.0 m d−1 (their Eqs. 2 and 7, respectively) for the summer campaign and from 19 to 29 m d−1 for the winter campaign (their Eqs. 1 and 7, respectively). This shows that the equations of Raymond et al. (2012) give in our case reasonable results only for the summer campaign. Using the above estimates from Raymond et al. (2012) for the winter campaign with FINIFLUX resulted in an excess of groundwater compared to the actual water balance. One possible reason for the observed discrepancies in winter may be that the empirical equations introduced by Raymond et al. (2012) are generally based on data collected in rivers much larger than the small headwaters we examined in this study.
For estimating how sensitive our modeled groundwater discharge rates are to the degassing coefficient that was finally considered most reasonable for our FINIFLUX model setup, we calculated a range of uncertainties for each campaign. For this purpose, we increased/decreased the degassing coefficient applied in FINIFLUX by ±25 % and ran several individual model calculations.
The resulting cumulative groundwater discharge rates for the winter campaign were 0.75 L s−1 ranging from 0.42 to 1.13 L s−1 (mean: 0.75 L s−1), with the higher discharge rates associated with +25 % values for the degassing coefficient. Hence, a ±25 % uncertainty in the applied degassing coefficient corresponds to a relative uncertainty in the modeled groundwater discharge ranging between ca. −44 % and +51 %. Assuming 0.75 L s−1 as the cumulative groundwater discharge rate within the study reach for the winter campaign suggests that about 63 % of all water entering the stream within the reach (water balance of 1.2 L s−1) was groundwater.
For the summer campaign, the groundwater discharge was modeled to be 0.5 L s−1. The ±25 % variation resulted in groundwater discharge estimates ranging from 0.20 to 0.47 L s−1. Note that the +25 % run resulted in a discharge value (0.47 L s−1) that is slightly lower than the result of the ±0 % run (0.5 L s−1). The reason for this is that the model fit was slightly better for the downstream reaches in the +25 % scenario. Hence, for the summer campaign, the ±25 % variance corresponds to a relative uncertainty in the modeled groundwater discharge ranging between −60 % and −6 %. However, the modeled groundwater discharge of 0.5 L s−1 is physically impossible, as the water balance of the stream section was lower (0.31 L s−1). The difficulty arises from low stream discharge during the summer campaign (0.51 L s−1), which led to a very shallow water level (only centimeters) and a very low-flow velocity of the stream water (around 0.07 m s−1). This resulted in intense radon degassing from the stream along its flow path and a rather high uncertainty when quantifying the degassing constant. Even though the FINIFLUX model can generally allow for such high radon loss by degassing, it reaches its limits for the modeling of the groundwater discharge quantities during the summer campaign. A physically possible cumulative groundwater discharge rate calculated based on the radon data for the summer campaign results from using the −25 % value for k for calculating the degassing (i.e., 0.2 L s−1). The most plausible assumption for the summer campaign based on the radon data is a cumulative groundwater discharge rate between 0.2 and 0.3 L s−1, suggesting that nearly 100 % of the water gained by the stream during the summer campaign along the study reach was derived from groundwater.
3.4 Assessing potential sources of SRP in summer baseflow (September 2020)
Under summer low-flow conditions in September 2020, we conducted a systematic survey of potential sources for the SRP entering the stream: streambed sediments and sediment pore water were sampled at the upper observation point of the section with the highest gains (400 m from the top of the study reach) and at the downstream discharge gauging station located at the outlet. Further samples of groundwater were taken from the surrounding wells and directly from the deeper part of the streambed at the upstream station. SRP, Fe, DOC, and NH concentrations; the ratio of SRP DOP, where we define dissolved organic phosphorus (DOP) as TDP minus SRP; and radiocarbon age were used to compare the characteristics of these potential source waters with those of the stream water.
Electric conductivity in stream water differed only slightly between the stations (upstream at 0.24 and downstream at 0.25 µS cm−1), and pH was 7.4 at both stations. Stream SRP concentration ranged between 0.029 and 0.041 mg L−1. SRP contributed 95 % of dissolved (inorganic and organic) P (Table 1). The fraction of DOP was therefore insignificant. In the samples from the groundwater wells and gaining groundwater, SRP concentrations were of the same order of magnitude (0.012–0.068 mg L−1), and SRP also constituted the dominant fraction of TDP (92±15 %, mean ± SD). Low Fe and NH concentrations in the groundwater indicate oxidizing groundwater conditions (see Table 1). Sediment pore water concentrations differed substantially between stations. At the outlet, an elevated SRP pore water concentration exceeding 0.600 mg L−1 was recorded, whereas other P fractions were insignificant. At the upstream station, low sediment pore water levels of SRP (0.022 mg L−1) similar to those in the stream were found, but the dissolved P concentration (0.312 mg L−1) was more than 10-fold higher. The SRP DOP ratio in the sediment was 0.078 and ∼0.935 in stream water. It is unlikely that turnover in the stream with such a short travel time reverses the ratio of sediment-borne P. It could therefore be concluded that the sediment in the upper part of the stream was unlikely to be a significant source of stream P.
Table 1Concentration of SRP, TDP, Fe, DOC, , NH, and Δ14C DOC at upstream and downstream stations (outlet) in different stream compartments and in groundwater wells; September 2020 sampling campaign.
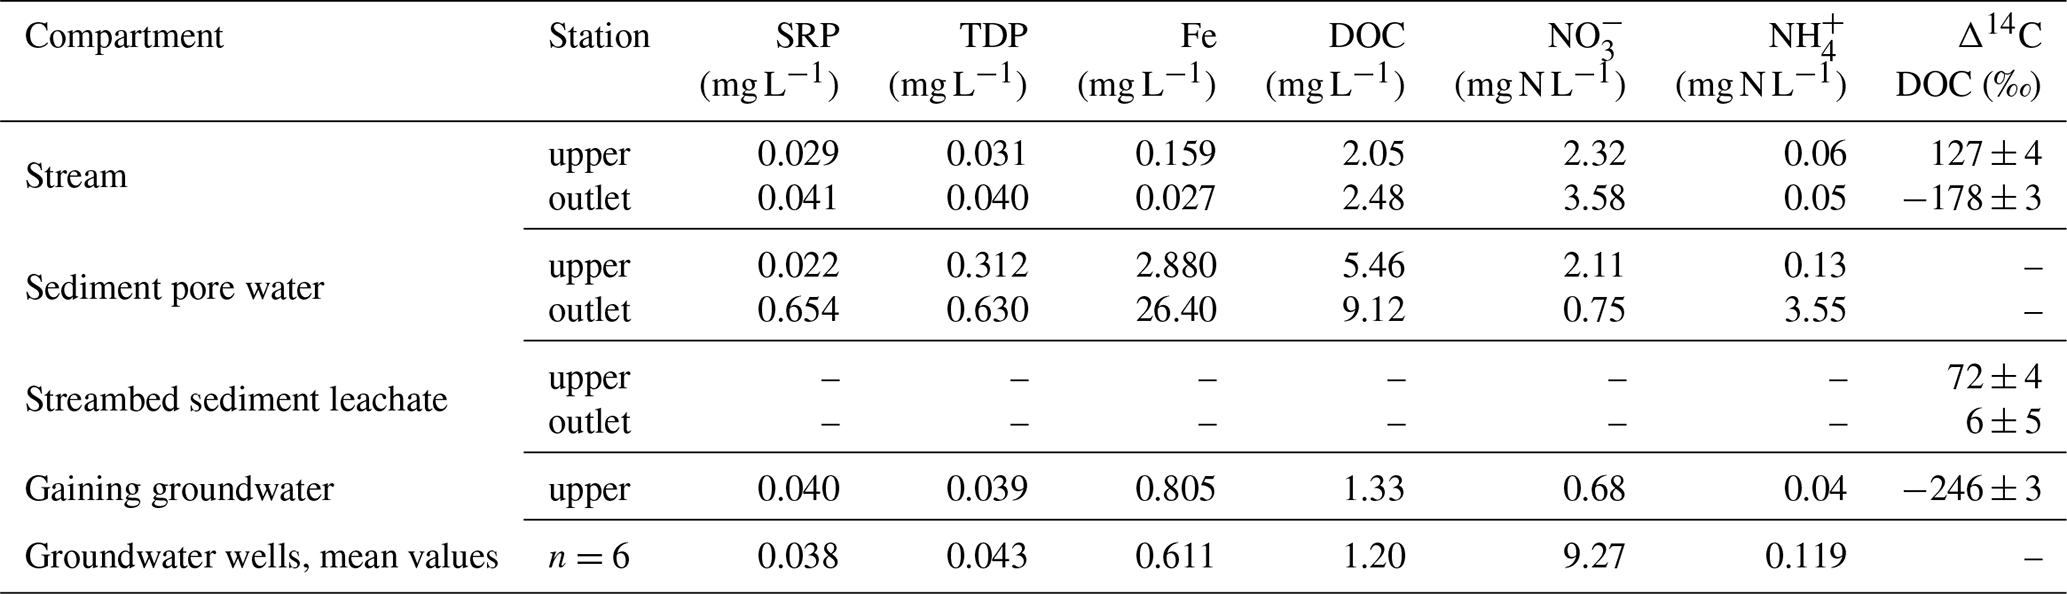
At the outlet concentrations of Fe, DOC, dissolved P, and NH were higher in the sediment pore water than those in the stream (Table 1), indicating iron-reducing conditions and anaerobic decomposition of organic matter. At both stations, the accumulation of Fe, dissolved P, and NH in the sediment was consistent with only diffusive fluxes and a quantitatively insignificant source of pore water solutes to the stream.
Stream DOC radiocarbon ratios differed dramatically between the two sampled stations. At the upper station, the DOC was enriched in radiocarbon (Δ14C 127 ‰), meaning that the organic carbon was young, containing post-bomb carbon that had been fixed photosynthetically after 1950. At the outlet, by contrast, stream water DOC exhibited a negative Δ14C of −178 ‰, corresponding to a conventional radiocarbon age (CRA) of ∼1500 years BP. This signature was much closer to the upwelling gaining groundwater DOC (−246 ‰, CRA 2200 years BP) than to the DOC signature for the upper station. However, in experiments performed on incubated streambed sediment samples from both stations, young DOC was seen to be released (Δ14C 6 ‰ to 72 ‰).
4.1 Main pathways of SRP transfer into streams
In all three sampling campaigns, results of the longitudinal SRP concentration and flux analysis indicate a distinct zone where most of SRP enters the stream. The radon analysis showed that a large part of the water entering the stream in the winter campaign and all of the gained water in the 2019 summer campaign can be explained by inflowing groundwater or tile drain water. Combining the 222Rn-based groundwater (including tile drain water) inflow and its uncertainties (Chap. 3.3) with the SRP concentration observed in groundwater wells (Table 1, accounting for a standard deviation of 0.019 mg L−1) yields a SRP flux of 0.008–0.064 mg s−1 (mean of 0.029 mg s−1) for winter 2019 and 0.004–0.064 mg s−1 (mean of 0.012 mg s−1) for summer 2019. The observed SRP fluxes at the catchment outlet (0.048 in winter 2019 and 0.018 mg s−1 in summer 2019) are within the range of the estimated incoming SRP flux. This also suggests that SRP fluxes were not significantly buffered by in-stream and hyporheic processes that may play a role under summer low-flow conditions. This is consistent with the results of Bernot et al. (2006), who observed very low SRP uptake in small agricultural streams with comparably low SRP concentrations. We therefore argue that the groundwater fluxes inferred from the 222Rn data and SRP groundwater concentration can explain the SRP flux observed at the catchment outlet. This means that groundwater inflow could be a dominant pathway for SRP to enter the stream.
Our detailed hydrochemical and radiocarbon analysis in summer 2020 reveals that the SRP and TDP concentrations and DOC radiocarbon age of the stream water at the outlet compare most closely to the groundwater entering the stream in the upper stream section. Sediment pore water quality differed from that of the gaining groundwater and stream water, with much higher TDP, NH, and DOC concentrations. Thus, gaining groundwater did not interact significantly with the streambed pore water and was probably transported by preferential flow paths, such as the tile drains. It is known that a fine-grained streambed with low hydraulic conductivity favors preferential flow paths, so that the largest part of incoming groundwater flux is channeled to a few distinct locations (Schmidt et al., 2006). Sediment pore water, in particular that sampled at the outlet, exhibited high concentrations of TDP, Fe, and NH but low concentrations of NO along with young DOC radiocarbon ages, suggesting that reductive conditions predominate for mobilization of Fe and TDP (Smolders et al., 2017). This indicates that sediment was a source of P to the stream but that transport was quantitatively limited and likely of diffusive and not advective nature only. However, there was no further interaction between the stream water and the sediment pore water at downstream points along the stream length; instead, the stream water retained the signature introduced in the upstream section through the gaining groundwater. We should note that the stream water sampled at the uppermost station showed no signature from the gaining groundwater.
The young radiocarbon age of the upstream DOC suggests its source lies in shallow organic-rich sediments, such as riparian wetland soils. In contrast, the presence of aged DOC in groundwater, here with a radiocarbon age of more than 2000 years BP, is typical of low-flow periods (Schiff et al., 1997; Tittel et al., 2022). The groundwater is unlikely to be this old; the DOC may have been mobilized from the aquifer matrix recently by hydrolysis of historic organic carbon in the soil. The limited influence of shallow pore water in the upstream strongly gaining section is largely due to the different P species in pore water compared to that observed in the stream water downstream. The limited influence of the streambed SRP sources is supported by (1) distinct water and SRP flux gaining in the upstream section but not in the downstream section, (2) hydrochemical similarity of stream water and gaining groundwater including tile drains, and (3) hydrochemical dissimilarity of sediment pore water and the stream water.
A similar argumentation holds true for potential lateral inputs from shallow anoxic riparian wetlands as suggested by Dupas et al. (2017a). Given the lack of evidence of significant water and SRP fluxes apart from the upstream section and the hydrochemical similarity of stream water and gaining groundwater, we argue that water from anoxic riparian wetlands was not a significant source for SRP to the Schäfertal stream during the low-flow sampling campaigns.
4.2 Explaining seasonal variability and pathways of SRP by integrating current observations with measurements from previous studies
The long history of studies on water quality in the Schäfertal catchment (see Ollesch, 2010) allows us to integrate the results of the three sampling campaigns with the wider context of variability in seasonal and discharge-dependent SRP concentrations. Additionally, earlier work allows a comparison with tile drainage water SRP concentrations, which may play a role under high flow conditions.
Stream water quality observations from previous assessments cover the years 1999 to 2010. We should note that within this time series there is a small, but significant, increasing trend in SRP concentrations in stream water (Mann–Kendall test, average increase of 0.65 µg L−1 yr−1). Previous SRP concentrations are comparable to those presented here (Fig. 7). Mean groundwater SRP concentrations in previous assessments of 0.072 mg P L−1 (Fig. 7) were higher than those sampled in September 2020. The number of wells sampled in past studies was higher than the six wells located close to the stream that were the focus of the September campaign. When the average SRP concentrations (34.1 µg P L−1) were examined for these six wells only, there was a good agreement between historic values and those obtained in the present study. Water samples from tile drains in 1999 and 2004 showed somewhat low SRP concentrations (0.011 mg P L−1) with a low temporal variability (SD of 0.006 mg P L−1) (Fig. 7), although most of the drain samples (73 %) were taken under colder high flow conditions between January and May.
Stream SRP concentrations displayed clear seasonality, with the highest concentrations occurring under summer low-flow conditions. The resultant concentration–discharge relationship (C=aQb, where C is concentration, Q is discharge, a is a factor defining the concentration level, and b is an exponent defining the direction and strength of concentration changes with Q) yields an exponent b of −0.24 (SE: 0.045) and thus indicates a mild dilution pattern (Fig. 7). The three sampling campaigns in this study capture the typical range of discharge conditions and associated SRP concentrations very well (Fig. 7). The observed mild dilution pattern is in good agreement with an assessment of concentration dynamics of dissolved PO in over 700 catchments across Germany: for example, Ebeling et al. (2021) state a mean exponent b of −0.22 and a dominance of dilution patterns in German catchments.
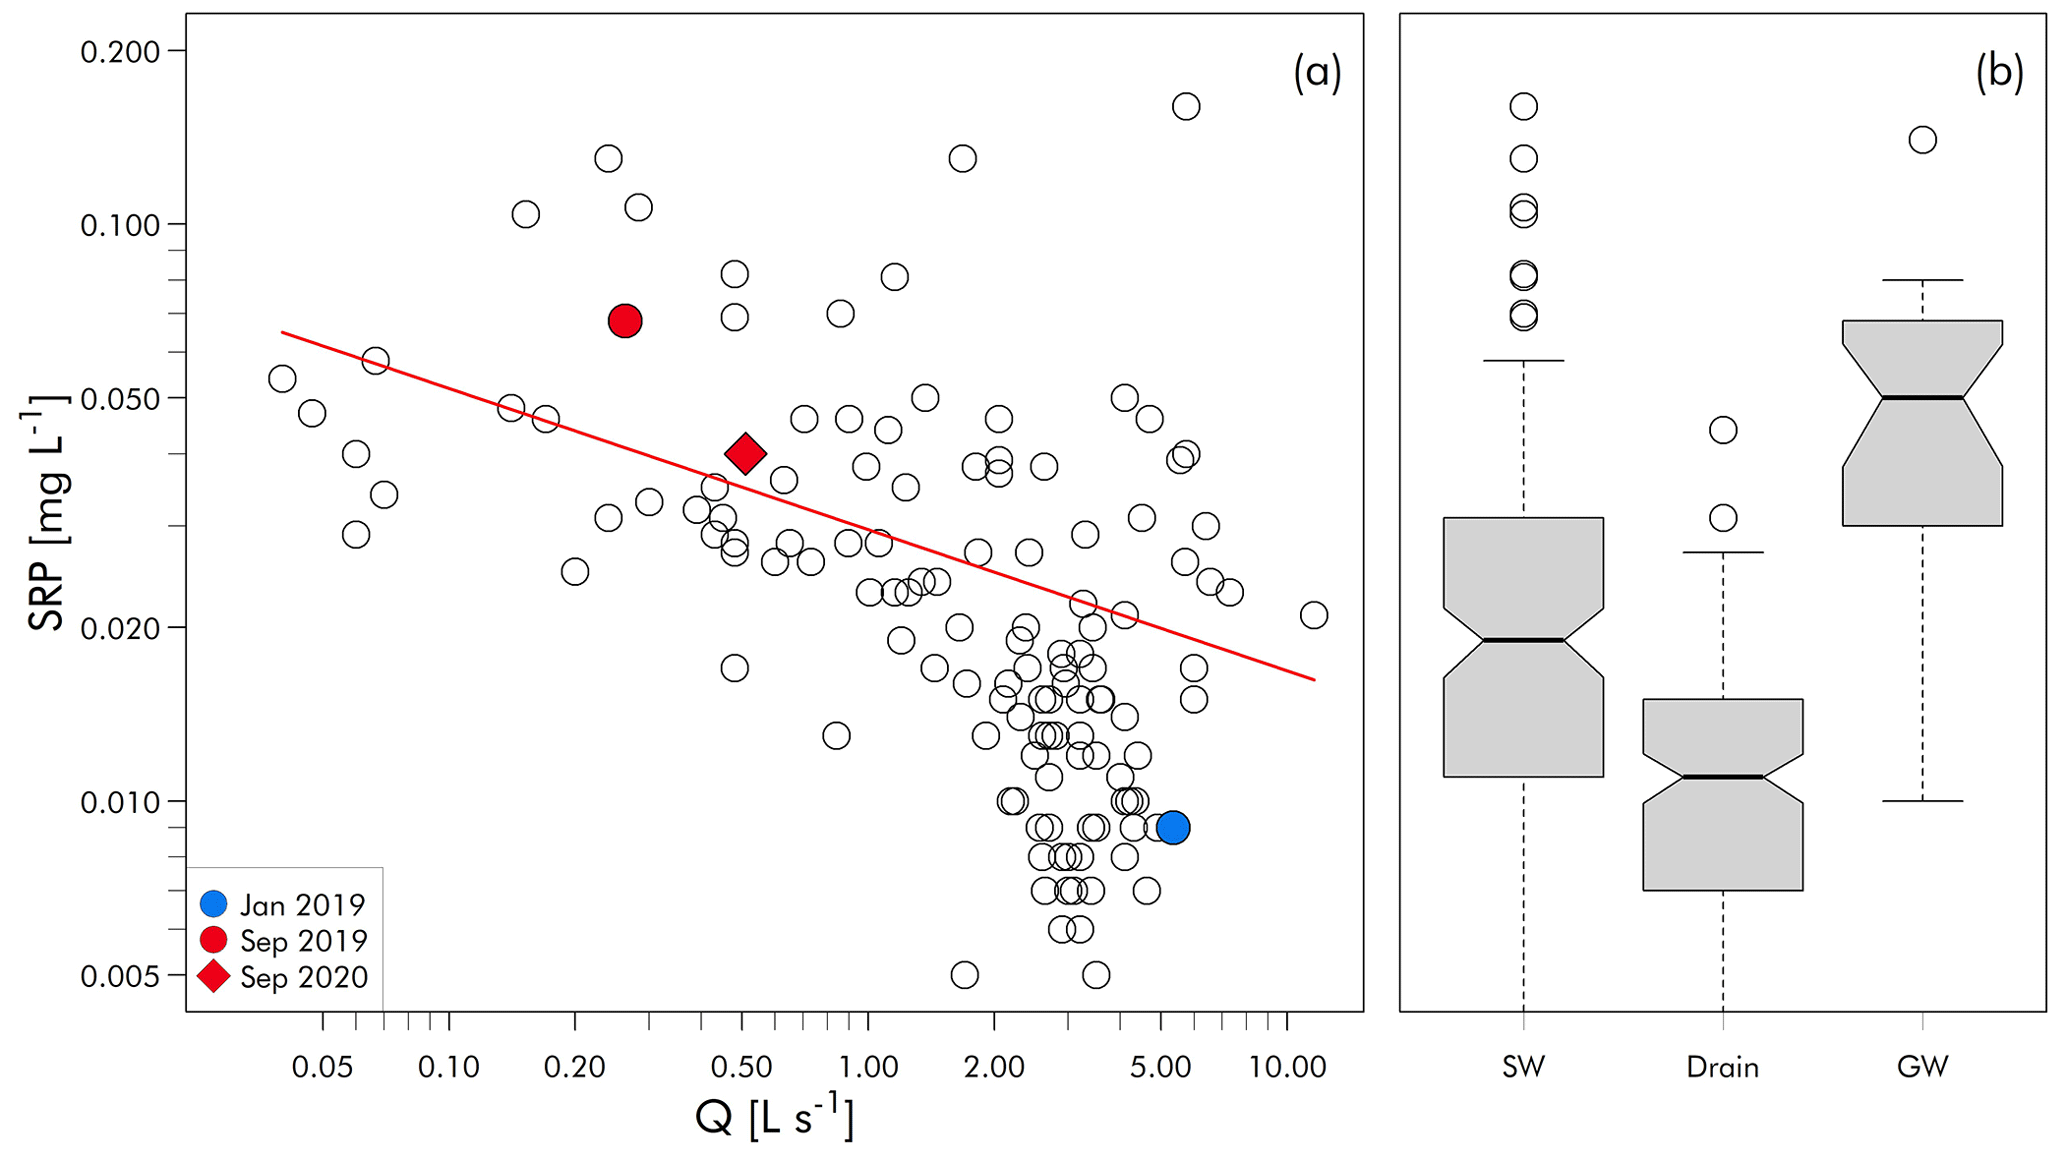
Figure 7Long-term distribution of concentration–discharge relationships for stream SRP at the catchment outlet (a), box–whisker plots of concentrations in stream water (SW: n=146), tile drains (drain: n=138), and groundwater (GW: n=25) (b). Data are from Kistner (2007) (drain); Dupas et al. (2017b) (SW); and UFZ TERENO monitoring, unpublished (GW) (see Supplement).
The SRP source partitioning provides strong evidence that groundwater inflow into the stream is the major contributor of SRP in the Schäfertal catchment throughout the year. The groundwater discharge dominates stream concentrations under summer low-flow conditions, with stream and groundwater concentrations observed in the same range. Under higher flow conditions other, younger water components dilute the broadly constant groundwater signature. While there is evidence for reductive mobilization of SRP within the streambed-sediment pore water, this source does not contribute significantly to exported SRP. The seasonality of SRP concentration is thus not predominantly driven by in-stream biogeochemical processes and therefore is caused by the seasonally variable proportion of groundwater to total stream discharge. Therefore, they are highest when groundwater dominates stream discharge under summer low-flow conditions. This dominance of groundwater SRP in stream water SRP during low-flow periods was also recorded by Jarvie et al. (2008) in some rural catchments in the UK. Findings from Holman et al. (2008) in the UK also suggest that groundwater can be an important contributor to surface water P especially when it is dominating discharge. It also matches the dilution patterns of dissolved P observed in German catchments (Ebeling et al., 2021). Although groundwater SRP concentrations are moderate in our study, they are well above the critical surface water threshold for eutrophication of 0.02 to 0.03 mg P L−1 (Corell, 1998; King et al., 2014). These findings apply only to typical hard-rock mountain ranges, and groundwater concentrations may differ in other geological settings. Geogenic SRP concentrations can reach even higher levels where organic matter content is higher or redox processes are more prevalent in soils and riparian wetlands, as is typically the case for peatlands. The high mobilization of P under reducing conditions may increase its bioavailability; however, it may also increase its loss from soils, particularly in the toe-slope profile (Shaheen et al., 2021).
Furthermore, we show that P release from stream sediments was not a major source of stream water P during summer low-flow conditions. This finding is consistent with the results of the review by Simpson et al. (2021), who found that on average there was a negative net phosphate exchange potential, meaning that sediments predominantly have potential to remove P from the water column. In general, stream sediments often have potential to exchange P with the water column and can buffer (retain or release) SRP (House, 2003; Whiters and Jarvie, 2008; Simpson et al., 2021). This phosphate exchange potential can vary depending on seasonally fluctuating environmental factors (e.g., temperature, light, stream discharge, redox, and sediment inputs) (Simpson et al., 2021). Recent findings suggest that stream sediments can act as a source when P loading is elevated, the SRP Fe ratio is high, and DO concentrations are low (van Deal et al., 2021). Although we observed anoxic conditions in stream sediments, the rates of diffusive transport are too low to release any significant quantity of P into the stream water. P releases from stream sediments tend to be more significant in slow-flowing lowland streams with considerable legacy P from point source inputs (van Dael et al., 2020b). Such experimental evidence of P release from stream sediments is still rare, but new modeling approaches may help to assess potential P losses from stream sediments to the water column (van Dael et al., 2021).
4.3 Potential sources of SRP in groundwater
Groundwater in the studied catchment exhibit elevated concentration of SRP (see Sect. 3.4 and 4.2). Potential sources of this SRP in groundwater include agricultural land use and the geologic parent substrate. The mean SRP concentrations found in the groundwater (0.05 mg P L−1, Fig. 7) were slightly above mean background concentrations of groundwater from Paleozoic greywacke and Devonian shale of around 0.025 mg P L−1 but still within the observed range of 0.01 to 0.10 P L−1 (Wriedt et al., 2019). Our findings suggest that SRP concentration in the saturated zone is controlled by oxidizing conditions in the upper groundwater and that SRP losses through seepage are largely buffered. This is in line with the results of Wriedt and Randt (2019), who could not find general differences in groundwater SRP concentrations between land use types (arable land, grassland, and forest) for these geological units. The study site is characterized by loamy soils which in general display low susceptibility to the preferential flows that can be critical for subsurface SRP losses (Stamm, 1998; Simard et al., 2000). In a typical agricultural soil of the study catchment, TP concentrations were elevated in the Ap horizon (778 mg kg−1) but showed a dramatic drop to a mean value of 193 mg kg−1 in the B and C horizon below the plow pan in 40 cm depth, indicating a high P sorption capacity of the soil. The loamy soils in the study catchment show also a distinct reduction in Corg concentration with increasing soil depth. This suggests that P is unlikely to be leached from the Ap horizon to a greater extent into deeper layers of the studied soil (Kistner, 2007). This is consistent with Leinweber et al. (1999), who found that fine-textured soils have a much lower potential for P leaching than sandy or organic soils, unless there are high P accumulations in the soil (Reid et al., 2012). In addition, the study catchment showed low levels of organic fertilizer (manure) application which, under certain conditions, can increase SRP losses to streams (McDowell et al., 2005; King et al., 2014). Although our analyses show that soil leaching of SRP in the study catchment is possibly low, we cannot completely rule out SRP leaching from agricultural soils to groundwater due to the slightly higher mean given the SRP concentrations in groundwater compared to the geological background values. Currently enriched P in agricultural soils (Pöthig et al., 2010) is still a potential long-term P source for surface waters. Under the right conditions, this legacy P can be transported from soils to surface waters by surface runoff and soil erosion and by leaching from soils (e.g., Rowe et al., 2016; McCrackin et al., 2018).
The results of this study indicate that groundwater was the major source of stream water P, especially during ecologically relevant low-flow conditions. Because of the limited quantitative P exchange between stream sediments and stream water, stream sediments that may have originated from agricultural soils eroded into the stream did not contribute significantly to the SRP loads exported by the stream. Similarly, we did not find evidence for inputs of SRP from shallow anoxic riparian wetlands. Rather, the seasonal variations in SRP concentrations in streams with summer maxima and winter minima can be explained by the varying contribution of groundwater to the overall discharge. Previous studies attributed the commonly observed high summer SRP concentrations (Ebeling et al., 2021) to the lack of dilution from wastewater point sources (Bowes et al., 2014) or the redox-driven mobilization of SRP from riparian wetlands (Dupas et al., 2017b). Here we found evidence that also time-varying dilution of groundwater inflow due to changing proportion of groundwater to total stream discharge can also lead to this concentration pattern and that the corresponding SRP concentrations during summer low flow can be well above the critical threshold for eutrophication. Deriving measures to reduce P concentration and fluxes in streams and rivers is therefore still a challenging task, as top-down analyses of surface water quality may not clearly indicate P sources.
Our study has shown that different methods need to be combined to successfully identify relevant SRP flow paths even in small headwaters. It is still uncertain how we can transfer the results from the Schäfertal to landscapes with other geologic, hydrologic, and land use characteristics, but this is a prerequisite for the implementation of effective measures for preventing eutrophication in agricultural streams and receiving water bodies.
The FINIFLUX software can be accessed under http://www.hydro.uni-bayreuth.de/hydro/en/software/software/software_dl.php?id_obj=129191 (Frei and Gilfedder, 2023).
Long-term hydrological data sets have been published in the Supplement of Yang et al. (2021) (https://agupubs.onlinelibrary.wiley.com/action/downloadSupplement?doi=10.1029/2020WR029094&file=2020WR029094-sup-0002-Data+Set+SI-S01.txt, last access: 30 January 2023). The long-term SRP groundwater data set used in this study is available in the Supplement.
The supplement related to this article is available online at: https://doi.org/10.5194/hess-27-1261-2023-supplement.
MR: conceptualization, methodology, formal analysis, investigation, writing (original draft preparation), and visualization. JT: conceptualization, methodology, formal analysis, investigation, and writing (original draft preparation). FR: investigation, writing (reviewing and editing), and visualization. MS: investigation, writing (reviewing and editing), and visualization. KK: methodology, investigation, reviewing, and editing. BG: software, validation, and visualization. FMP: investigation, visualization, reviewing, and editing. AM: conceptualization, methodology, formal analysis, investigation, writing (original draft preparation), and visualization.
The contact author has declared that none of the authors has any competing interests.
Publisher’s note: Copernicus Publications remains neutral with regard to jurisdictional claims in published maps and institutional affiliations.
We thank our colleagues at the Helmholtz Centre for Environmental Research (UFZ) for valuable discussions at the early stage of this study. We thank the UFZ Analytics Department (GEWANA) for performing the chemical analysis of the collected samples. We also thank the technicians at UFZ Magdeburg and UFZ Halle for their continuous efforts to maintain the monitoring activities at the Schäfertal. We thank Xiaoqiang Yang for support of the figure preparation. We thank Gregor Ollesch for providing the long-term SRP data. The monitoring equipment was partly funded by TERENO (https://www.tereno.net/, last access: 30 January 2023), financed by the German Federal Ministry of Education and Research (BMBF).
The article processing charges for this open-access publication were covered by the Helmholtz Centre for Environmental Research – UFZ.
This paper was edited by Genevieve Ali and reviewed by three anonymous referees.
Ackermann, A.: Simulation des Austrags von gelöstem organischen Kohlenstoff aus landwirtschaftlich genutzten Mineralböden (in German), Dissertation, Martin Lutter University, Halle, p. 181, https://nbn-resolving.org/urn:nbn:de:gbv:3:2-80448 (last access: 30 January 2023), 2016.
Adyasari, D., Dimova, N. T., Dulai, H., Gilfedder, B. S., Cartwright, I., McKenzie, T., and Fuleky, P.: Radon-222 as a groundwater discharge tracer to surface waters, Earth-Sci. Rev., 104321, https://doi.org/10.1016/j.earscirev.2023.104321, 2023.
Anis, M. R. and Rode, M.: Effect of climate change on overland flow generation: a case study in central Germany, Hydrol. Process., 29, 2478–2490, 2015.
Bechmann, M., Deelstra, J., Stalnacke, P., Eggestad, H. O., Oygarden, L., and Pengerud, A.: Monitoring catchment scale agricultural pollution in Norway: policy instruments, implementation of mitigation methods and trends in nutrient and sediment losses, Environ. Sci. Pol., 11, 102–114, 2008.
Behrendt, H. and Boekhold, A.: Phosphorus Saturation In Soils And Groundwaters, Land Degrad. Rehabil., 4, 233–243, 1993.
Bernal, S., Lupon, A., Ribot, M., Sabater, F., and Martí, E.: Riparian and in-stream controls on nutrient concentrations and fluxes in a headwater forested stream, Biogeosciences, 12, 1941–1954, https://doi.org/10.5194/bg-12-1941-2015, 2015.
Bernot, M. J., Tank, J. L., Royer, T. V., and David, M. B.: Nutrient uptake in streams draining agricultural catchments of the midwestern United States, Freshw. Sci., 51, 499–509, 2006.
Bol, R., Gruau, G., Mellander, P. E., Dupas, R., Bechmann, M., Skarbovik, E., Bieroza, M., Djodjic, F., Glendell, M., Jordan, P., Van der Grift, B., Rode, M., Smolders, E., Verbeeck, M., Gu, S., Klumpp, E., Pohle, I., Fresne, M., and Gascuel-Odoux, C.: Challenges of Reducing Phosphorus Based Water Eutrophication in the Agricultural Landscapes of Northwest Europe, Frontiers Mar. Sci., 5, https://doi.org/10.3389/fmars.2018.00276, 2018.
Bormann, F. H. and Likens, G. E.: Nutrient Cycling, Science, 155, 424, 1967.
Bowes, M. J., House, W. A., and Hodgkinson, R. A.: Phosphorus dynamics along a river continuum, Sci. Total Environ., 313, 199–212, https://doi.org/10.1016/S0048-9697(03)003.00260-2, 2003.
Bowes, M. J., Jarvie, H. P., Naden, P. S., Old, G. H., Scarlett, P. M., Roberts, C., Armstrong, L. K., Harman, S. A., Wickham, H. D., and Collins, A. L.: Identifying priorities for nutrient mitigation using river concentration-flow relationships: The Thames basin, UK, J. Hydrol., 517, 1–12, 2014.
Brookfield, A. E., Hansen, A. T., Sullivan, P. L., Czuba, J. A., Kirk, M. F., Li, L., Newcomer, M. E., and Wilkinson, G.: Predicting algal blooms: Are we overlooking groundwater?, Sci. Total Environ., 769, https://doi.org/10.1016/j.scitotenv.2020.144442, 2021.
Chardon, W. J., Aalderink, G. H., and van der Salm, C.: Phosphorus leaching from cow manure patches on soil columns, J. Environ. Qual., 36, 17–22, 2007.
Correll, D. L.: The role of phosphorus in the eutrophication of receiving waters: A review, J. Environ. Qual., 27, 261–266, 1998.
Cornell, R. M. and Schwertmann, U.: The Iron Oxides: Structure, Properties, Reactions, Occurences and Uses, 2nd edn., Wiley-VCH Verlag GmbH and Co., https://doi.org/10.1002/3527602097, 2003.
Dils, R. M. and Heathwaite, A. L.: The controversial role of tile drainage in phosphorus export from agricultural land, Water Sci. Tech., 39, 55–61, 1999.
DIN EN ISO 6878: Water quality determination of Phosphorus-ammonium molybdate spectrometric method, Beuth, Berlin, https://doi.org/10.31030/9552789, 2004.
Dupas, R., Mellander, P. E., Gascuel-Odoux, C., Fovet, O., McAleer, E. B., McDonald, N. T., Shore, M., and Jordan, P.: The role of mobilisation and delivery processes on contrasting dissolved nitrogen and phosphorus exports in groundwater fed catchments, Sci. Total Environ., 599, 1275–1287, 2017a.
Dupas, R., Musolff, A., Jawitz, J. W., Rao, P. S. C., Jäger, C. G., Fleckenstein, J. H., Rode, M., and Borchardt, D.: Carbon and nutrient export regimes from headwater catchments to downstream reaches, Biogeosciences, 14, 4391–4407, https://doi.org/10.5194/bg-14-4391-2017, 2017b.
Dupas, R., Tittel, J., Jordan, P., Musolff, A., and Rode, M.: Non-domestic phosphorus release in rivers during low-flow: Mechanisms and implications for sources identification, J. Hydrol., 560, 141–149, 2018.
Ebeling, P., Kumar, R., Weber, M., Knoll, L., Fleckenstein, J. H., and Musolff, A.: Archetypes and controls of riverine nutrient export across German catchments, Water Resour. Res., 57, 1–29, 2021.
Frei, S. and Gilfedder, B. S.: Finiflux: An implicit finite element model for quantification of groundwater fluxes and hyporheic exchange in streams and rivers using radon, Water Resour. Res., 51, 6776–6786, 2015.
Frei S. and Gilfedder, B. S.: FINIFLUX [code], http://www.hydro.uni-bayreuth.de/hydro/en/software/software/software_dl.php?id_obj=129191, last access: 30 January 2023.
Genereux, D. P. and Hemond, H. F.: Determination Of Gas-Exchange Rate Constants For A Small Stream On Walker Branch Watershed, Tennessee, Water Resour. Res., 28, 2365–2374, 1992.
Graeff, T., Zehe, E., Reusser, D., Luck, E., Schroder, B., Wenk, G., John, H., and Bronstert, A.: Process identification through rejection of model structures in a mid-mountainous rural catchment: observations of rainfall-runoff response, geophysical conditions and model inter-comparison, Hydrol. Process., 23, 702–718, 2009.
Gu, S., Gruau, G., Dupas, R., Rumpel, C., Creme, A., Fovet, O., Gascuel-Odoux, C., Jeanneau, L., Humbert, G., and Petitjean, P.: Release of dissolved phosphorus from riparian wetlands: Evidence for complex interactions among hydroclimate variability, topography and soil properties, Sci. Total Environ., 598, 421–431, 2017.
Haygarth, P. M., Jarvie, H. P., Powers, S. M., Sharpley, A. N., Elser, J. J., Shen, J. B., Peterson, H. M., Chan, N. I., Howden, N. J. K., Burt, T., Worrall, F., Zhang, F. S., and Liu, X. J.: Sustainable Phosphorus Management and the Need for a Long-Term Perspective: The Legacy Hypothesis, Environ. Sci. Technol., 48, 8417–8419, 2014.
Heathwaite, A. L. and Dils, R. M.: Characterising phosphorus loss in surface and subsurface hydrological pathways, Sci. Total Environ., 251, 523–538, 2000.
Heckrath, G., Brookes, P. C., Poulton, P. R., and Goulding, K. W. T.: Phosphorus Leaching From Soils Containing Different Phosphorus Concentrations In The Broadbalk Experiment, J. Environ. Qual., 24, 904–910, 1995.
Holman, I. P., Whelan, M. J., Howden, N. J. K., Bellamy, P. H., Willby, N. J., Rivas-Casado, M., and McConvey, P.: Phosphorus in groundwater-an overlooked contributor to eutrophication?, Hydrol. Process., 22, 5121–5127, https://doi.org/10.1002/hyp.7198, 2008.
House, W. A.: Geochemical cycling of phosphorus in rivers, Appl. Geochem., 18, 739–748, 2003.
Jarvie, H. P., Haygarth, P. M., Neal, C., Butler, P., Smith, B., Naden, P. S., Joynes, A., Neal, M., Wickham, H., Armstrong, L., Harman, S., and Palmer-Felgate, E. J.: Stream water chemistry and quality along an upland-lowland rural land-use continuum, south west England, J. Hydrol., 350, 215–231, 2008.
Jeanneau, L., Jaffrezic, A., Pierson-Wickmann, A. C., Gruau, G., Lambert, T., and Petitjean, P.: Constraints on the Sources and Production Mechanisms of Dissolved Organic Matter in Soils from Molecular Biomarkers, Vadose Zone J., 13, 1–29, 2014.
King, S. A., Heffernan, J. B., and Cohen, M. J.: Nutrient flux, uptake, and autotrophic limitation in streams and rivers, Freshw. Sci., 33, 85–98, 2014.
Kistner, I., Ollesch, G., Meissner, R., and Rode, M.: Spatial-temporal dynamics of water soluble phosphorus in the topsoil of a low mountain range catchment, Agr. Ecosyst. Environ., 176, 24–38, 2013.
Kistner, I.: Anwendung des Modells ANIMO zur Simualtion des gelösten Phosphors im Oberflächenabfluss auf der Feldskala und der Phosphorverfügbarkeit im Oberboden auf der Einzugsgebietsskala (in German), Dissertation, Martin Lutter University Halle, p. 182, ISSN 1860-0387, 2007.
Kleinman, P. J. A., Needelman, B. A., Sharpley, A. N., and McDowell, R. W.: Using soil phosphorus profile data to assess phosphorus leaching potential in manured soils, Soil Sci. Soc. Am. J., 67, 215–224, 2003.
Kleinman, P. J. A., Sharpley, A. N., Saporito, L. S., Buda, A. R., and Bryant, R. B.: Application of manure to no-till soils: phosphorus losses by sub-surface and surface pathways, Nutr. Cycl. Agroecosys., 84, 215–227, 2009.
Kleinman, P. J. A., Sharpley, A. N., Saporito, L. S., Buda, A. R., and Bryant, R. B.: Application of manure to no-till soils: phosphorus losses by sub-surface and surface pathways, Nutr. Cycl. Agroecosys., 84, 215–227, 2009.
Knorr, K.-H.: DOC-dynamics in a small headwater catchment as driven by redox fluctuations and hydrological flow paths – are DOC exports mediated by iron reduction/oxidation cycles?, Biogeosciences, 10, 891–904, https://doi.org/10.5194/bg-10-891-2013, 2013.
Leinweber, P., Meissner, R., Eckhardt, K. U., and Seeger, J.: Management effects on forms of phosphorus in soil and leaching losses, Eur. J. Soil Sci., 50, 413–424, 1999.
Little, J. L., Nolan, S. C., Casson, J. P., and Olson, B. M.: Relationships between soil and runoff phosphorus in small Alberta watersheds, J. Environ. Qual., 36, 1289–1300, 2007.
McCrackin, M. L., Muller-Karulis, B., Gustafsson, B. G., Howarth, R. W., Humborg, C., Svanback, A., and Swaney, D. P.: A Century of Legacy Phosphorus Dynamics in a Large Drainage Basin, Global Biogeochem. Cy., 32, 1107–1122, https://doi.org/10.1029/2018GB005914, 2018.
McDowell, R. W., Condron, L. M., Stewart, I., and Cave, V.: Chemical nature and diversity of phosphorus in New Zealand pasture soils using P-31 nuclear magnetic resonance spectroscopy and sequential fractionation, Nutr. Cycl. Agroecosys., 72, 241–254, 2005.
McDowell, R. W. and Sharpley, A. N.: Approximating phosphorus release from soils to surface runoff and subsurface drainage, J. Environ. Qual., 30, 508–520, 2001.
Moncelon, R., Gouaze, M., Pineau, P., Beneteau, E., Breret, M., Philippine, O., Robin, F. X., Dupuy, C., and Metzger, E.: Coupling between sediment biogeochemistry and phytoplankton development in a temperate freshwater marsh (Charente-Maritime, France): Evidence of temporal pattern, Water Res., 189, 116567, https://doi.org/10.1016/j.watres.2020.116567, 2021.
Musolff, A., Selle, B., Bttner, O., Opitz, M., and Tittel, J.: Unexpected release of phosphate and organic carbon to streams linked to declining nitrogen depositions, Global Change Biol., 23, 1891–1901, 2017.
Ollesch, G., Hermann, J., Meissner, R., and Reinstrof, F.: Anthropogenic changes of water balance and runoff processes in a small low-mountain catchment, in: Status and perspectives of hydrology in small basins, Proceedings of the international workshop held in Goslar-Hahnenklee, 65–70, IAHS, ISSN/ISBN: 0144-7815, 2010.
Ollesch, G., Sukhanovski, Y., Kistner, I., Rode, M., and Meissner, R.: Characterization and modelling of the spatial heterogeneity of snowmelt erosion, Earth. Surf. Processes., 30, 197–211, 2005.
Payn, R. A., Gooseff, M. N., McGlynn, B. L., Bencala, K. E., and Wondzell, S. M.: Channel water balance and exchange with subsurface flow along a mountain headwater stream in Montana, United States, Water Resour. Res., 45, https://doi.org/10.1029/2008WR007644, 2009.
Pöthig, R., Behrendt, H., Opitz, D., and Furrer, G.: A universal method to assess the potential of phosphorus loss from soil to aquatic ecosystems, Environ. Sci. Pollut. Res. 17, 497–504, 2010.
Raymond, P. A., Zappa, C. J., Butman, D., Bott, T. L., Potter, J., Mulholland, P., Laursen, A. E., McDowell, W. H., and Newbold, D.: Scaling the gas transfer velocity and hydraulic geometry in streams and small rivers, Limnology and Oceanography: Fluids and Environments, 2, 41–53, 2012.
Reid, D. K., Ball, B., and Zhang, T. Q.: Accounting for the Risks of Phosphorus Losses through Tile Drains in a Phosphorus Index, J. Environ. Qual., 41, 1720–1729, 2012.
Rode, M., Wade, A. J., Cohen, M. J., Hensley, R. T., Bowes, M. J., Kirchner, J. W., Arhonditsis, G. B., Jordan, P., Kronvang, B., Halliday, S. J., Skeffington, R. A., Rozemeijer, J. C., Aubert, A. H., Rinke, K., and Jomaa, S.: Sensors in the Stream: The High-Frequency Wave of the Present, Environ. Sci. Tech., 50, 10297–10307, 2016.
Rowe, H., Withers, P. J. A., Baas, P., Chan, N. I., Doody, D., Holiman, J., Jacobs, B., Li, H. G., MacDonald, G. K., McDowell, R., Sharpley, A. N., Shen, J. B., Taheri, W., Wallenstein, M., and Weintraub, M. N.: Integrating legacy soil phosphorus into sustainable nutrient management strategies for future food, bioenergy and water security, Nutr. Cycl. Agroecosys., 104, 393–412, 2016.
Schiff S. L., Aravena R., Trumbore S. E., Hinton M. J., Elgood R., and Dillon P. J.: Export of DOC from forested catchments on the Precambrian Shield of Central Ontario: Clues from 13C and 14C, Biogeochem., 36, 43–65, 1997.
Schmidt, C., Bayer-Raich, M., and Schirmer, M.: Characterization of spatial heterogeneity of groundwater-stream water interactions using multiple depth streambed temperature measurements at the reach scale, Hydrol. Earth Syst. Sci., 10, 849–859, https://doi.org/10.5194/hess-10-849-2006, 2006.
Schrön, M., Köhli, M., Scheiffele, L., Iwema, J., Bogena, H. R., Lv, L., Martini, E., Baroni, G., Rosolem, R., Weimar, J., Mai, J., Cuntz, M., Rebmann, C., Oswald, S. E., Dietrich, P., Schmidt, U., and Zacharias, S.: Improving calibration and validation of cosmic-ray neutron sensors in the light of spatial sensitivity, Hydrol. Earth Syst. Sci., 21, 5009–5030, https://doi.org/10.5194/hess-21-5009-2017, 2017.
Schubert, M., Buerkin, W., Pena, P., Lopez, A. E., and Balcazar, M.: On-site determination of the radon concentration in water samples: Methodical background and results from laboratory studies and a field-scale test, Radiat. Measur., 41, 492–497, 2006.
Schubert, M., Knoeller, K., Mueller, C., and Gilfedder, B.: Investigating River Water/Groundwater Interaction along a Rivulet Section by Rn-222 Mass Balancing, Water, 12, 3027, 2020.
Shaheen, S. M., Wang, J. X., Baumann, K., Wang, S. L., Leinweber, P., and Rinklebe, J.: Redox-induced mobilization of phosphorus in groundwater affected arable soil profiles, Chemosphere, 275, 129928, https://doi.org/10.1016/j.chemosphere.2021.129928, 2021.
Simard, R. R., Beauchemin, S., and Haygarth, P. M.: Potential for preferential pathways of phosphorus transport, J. Environ. Qual., 29, 97–105, 2000.
Simpson, Z. P., McDowell, R. W., Condron, L. M., McDaniel, M. D., Jarvie, H. P., and Abell, J. M.: Sediment phosphorus buffering in streams at baseflow: A meta-analysis, J. Environ. Qual., 50, 287–311, 2021.
Smolders, E., Baetens, E., Verbeeck, M., Nawara, S., Diels, J., Verdievel, M., Peeters, B., De Cooman, W., and Bakens, S.: Internal Loading and Redox Cycling of Sediment Iron Explain Reactive Phosphorus Concentrations in Lowland Rivers, Environ. Sci. Technol., 51, 2584–2592, 2017.
Stamm, C., Fluhler, H., Gachter, R., Leuenberger, J., and Wunderli, H.: Preferential transport of phosphorus in drained grassland soils, J. Environ. Qual., 27, 515–522, 1998.
Stuiver, M. and Polach, H. A.: Discussion Reporting of 14C Data, Radiocarbon, 19, 355–363, 1977.
Tittel, J., Büttner, O., Freier, K., Heiser, A., Sudbrack, R., and Ollesch, G.: The age of terrestrial carbon export and rainfall intensity in a temperate river headwater system, Biogeochem., 115, 53–63, 2013.
Tittel, J., Büttner, O., Friese, K., Lechtenfeld, O. J., Schuth, S., von Tümpling, W., and Musolff, A.: Iron Exports From Catchments Are Constrained by Redox Status and Topography, Global Biogeochemical Cycles, 36, e2021GB007056, https://doi.org/10.1029/2021GB007056, 2022.
van Dael, T., De Cooman, T., and Smolders, E.: In-stream oxygenation to mitigate internal loading of phosphorus in lowland streams, J. Hydrol., 590, https://doi.org/10.1016/j.jhydrol.2020.125536, 2020a.
van Dael, T., De Cooman, T., Verbeeck, M., and Smolders, E.: Sediment respiration contributes to phosphate release in lowland surface waters, Water Res., 168, https://doi.org/10.1016/j.watres.2019.115168, 2020b.
van Dael, T., Xia, L., Van Dijck, K., Potemans, S., and Smolders, E.: Internal loading of phosphate in rivers reduces at higher flow velocity and is re duce d by iron rich sand application: an experimental study in flumes, Water Res., 198, https://doi.org/10.1016/j.watres.2021.117160, 2021.
Withers, P. J. A. and Jarvie, H. P.: Delivery and cycling of phosphorus in rivers: A review, Sci. Total Environ., 400, 379–395, 2008.
Wriedt, G. and Randt, C.: Groundwater phosphate levels in Lower Saxony-Distribution, influence factors and threshold value, Grundwasser, 24, 109–127, 2019.
Yang, J., Heidbuchel, I., Musolff, A., Reinstorf, F., and Fleckenstein, J. H.: Exploring the Dynamics of Transit Times and Subsurface Mixing in a Small Agricultural Catchment, Water Resour. Res., 54, 2317–2335, 2018.
Yang, X. Q., Tetzlaff, D., Soulsby, C., Smith, A., and Borchardt, D.: Catchment Functioning Under Prolonged Drought Stress: Tracer-Aided Ecohydrological Modeling in an Intensively Managed Agricultural Catchment, Water Resour. Res., 57, https://doi.org/10.1029/2020WR029094, 2021.
Zak, D. and Gelbrecht, J.: The mobilisation of phosphorus, organic carbon and ammonium in the initial stage of fen rewetting (a case study from NE Germany), Biogeochem., 85, 141–151, 2007.