the Creative Commons Attribution 4.0 License.
the Creative Commons Attribution 4.0 License.
 | 02 Jan 2023
Daily ensemble river discharge reforecasts and real-time forecasts from the operational Global Flood Awareness System
Ervin Zsoter
Hannah Cloke
Peter Salamon
Christel Prudhomme
Operational global-scale hydrological forecasting systems are used to help manage hydrological extremes such as floods and droughts. The vast amounts of raw data that underpin forecast systems and the ability to generate information on forecast skill have, until now, not been publicly available. As part of the Global Flood Awareness System (GloFAS; https://www.globalfloods.eu/, last access: 3 December 2022) service evolution, in this paper daily ensemble river discharge reforecasts and real-time forecast datasets are made free and openly available through the Copernicus Climate Change Service (C3S) Climate Data Store (CDS). They include real-time forecast data starting on 1 January 2020 updated operationally every day and a 20-year set of reforecasts and associated metadata. This paper describes the model components and configuration used to generate the real-time river discharge forecasts and the reforecasts. An evaluation of ensemble forecast skill using the continuous ranked probability skill score (CRPSS) was also undertaken for river points around the globe. Results show that GloFAS is skilful in over 93 % of catchments in the short (1 to 3 d) and medium range (5 to 15 d) against a persistence benchmark forecast and skilful in over 80 % of catchments out to the extended range (16 to 30 d) against a climatological benchmark forecast. However, the strength of skill varies considerably by location with GloFAS found to have no or negative skill at longer lead times in broad hydroclimatic regions in tropical Africa, western coast of South America, and catchments dominated by snow and ice in high northern latitudes. Forecast skill is summarised as a new headline skill score available as a new layer on the GloFAS forecast Web Map Viewer to aid user interpretation and understanding of forecast quality.
- Article
(13799 KB) - Full-text XML
-
Supplement
(13493 KB) - BibTeX
- EndNote


Hydrological extremes, such as floods and droughts, have severe negative socio-economic impacts, and climate change is expected to alter their timing and magnitude (Blöschl et al., 2017, 2019; Ward et al., 2020). Since 1990, reported disasters have led to over 94 million people being affected by flooding each year, and economic losses are estimated at around USD 260–310 billion per year (UNDRR, 2015a). The need to reduce this risk has been identified under the Sendai Framework for Disaster Risk Reduction (UNDRR, 2015b). One of the primary methods of achieving DRR and building resilience in society is through early warning of extreme events. There are now several centres producing global- and continental-scale hydrological forecasts operationally which are working to support national forecasting and decision-making in the water sector (Emerton et al., 2016). In Europe, there is the European Flood Awareness System (EFAS; https://www.efas.eu/en, last access: 3 December 2022; Thielen et al., 2009) and the European Hydrological Predictions for the Environment (E-HYPE; https://hypeweb.smhi.se/, last access: 3 December 2022; Donnelly et al., 2016), in the US the Hydrologic Ensemble Forecast Service (HEPS; https://water.weather.gov/ahps/, last access: 3 December 2022; Demargne et al., 2014), and in Australia the Flood Forecasting and Warning Service (FFWS; http://www.bom.gov.au/water/, last access: 3 December 2022). For global-scale systems there is the Global Flood Awareness System (GloFAS; https://www.globalfloods.eu/, last access: 3 December 2022; Alfieri et al., 2013) and World-Wide HYPE (WWH; https://hypeweb.smhi.se/, last access: 3 December 2022; Arheimer et al., 2020).
GloFAS is the global flood service of the European Commission's Copernicus Emergency Management Service (CEMS), an operational system for monitoring and forecasting floods across the world with over 6000 registered users in March 2021. The service and data are available through a free and open license and the system is designed to help decision makers and forecasters in sectors such as national and international water authorities, water resources managers, hydropower companies, civil protection authorities, and international humanitarian aid organisations. GloFAS is not designed to be a replacement for local operational hydrological forecasting systems; in many parts of the world, however, a local or national system for operational forecasts of river discharge does not yet exist so it might be the only information available. GloFAS covers all river basins out to medium- and extended-range lead times (30 d ahead) and updated daily, with GloFAS-Seasonal (Emerton et al., 2018) updated monthly out to a 16-week lead time. Therefore, it has been used to complement local forecast systems by allowing forecasters to gain information on surrounding and upstream basins, monitoring for potential flood signals where advanced warning is needed.
GloFAS can be used for providing daily assessments of potential upcoming flood events for the whole globe, such a spatio-temporal consistent overview is required by several users. For example, GloFAS is used daily as the main information source to monitor existing and upcoming river flood events and report back potential risks of flood impacts to the Emergency Response Coordination Centre (ERCC) of the European Commission, as part of the Aristotle-ENHSP project (European Natural Hazard Scientific Partnership, http://aristotle.ingv.it/tiki-index.php, last access: 10 September 2020). Example real-world use cases of GloFAS include supporting the humanitarian response to the devastating floods that affected large parts of Mozambique, Malawi, and Zimbabwe in the wake of tropical cyclones Idai in March 2019 following a request from the Department for International Development of the UK government (Magnusson et al., 2019; Emerton et al., 2020) and during the 2020 monsoon season by the Bangladesh Flood Forecasting and Warning Centre (FFWC) (Hossain et al., 2020).
GloFAS has been developed together by the Joint Research Centre (JRC) of the European Commission, the University of Reading, and the European Centre for Medium-Range Weather Forecasts (ECMWF), and was originally designed for large river basins and transboundary rivers. The system went pre-operational in July 2011 (Alfieri et al., 2013), becoming a fully operational supported service in April 2018 (version 1.0, upgraded to version 2.0 in November 2018). GloFAS version 2.1 was released on 5 November 2019 (GloFAS user wiki: https://confluence.ecmwf.int/display/CEMS/GloFAS+versioning+system, last access: 16 December 2022).
There are two major gaps in data service delivery of the current generation of global hydrological forecasting, including GloFAS: Firstly, forecasts are generally issued as post-processed information (e.g. focusing on river discharge exceeding pre-defined flood thresholds) shown as maps and graphics on a dedicated web interface, but the raw data are not readily available to users. Having fast access to post-processed information has the advantage of providing an overview of the forecast output as an active flood event unfolds. However, not also having direct access to the raw data precludes the use in further downstream applications (e.g. impact modelling, multi-model forecast systems, production of value-added products for specific sectors such as river transport and hydropower industries, and advancement in techniques requiring large-scale datasets such as machine learning). Secondly, “reforecasts” (i.e. forecasts for a set of past dates, also known as hindcasts) as consistent as possible with the real-time forecasting system, ideally updated for each major model cycle upgrade, have not been made publicly available, limiting both global and user-specific local evaluation of forecast skill.
As part of the continued evolution of GloFAS in light of the aforementioned service gaps, the GloFAS real-time forecasts and a long-term and large-sample set of reforecasts was made available to users as part of the release of GloFAS version 2.2 on 2 December 2020 (https://confluence.ecmwf.int/display/CEMS/GloFAS+v2.2, last access: 16 December 2022). This paper describes how the GloFAS forecast datasets (real-time and reforecasts) are generated, the methodology implemented for the forecast skill evaluation, and provides a global overview of the forecast skill assessment results that form the scientific basis for a new headline forecast skill layer on the GloFAS Web Map Viewer.
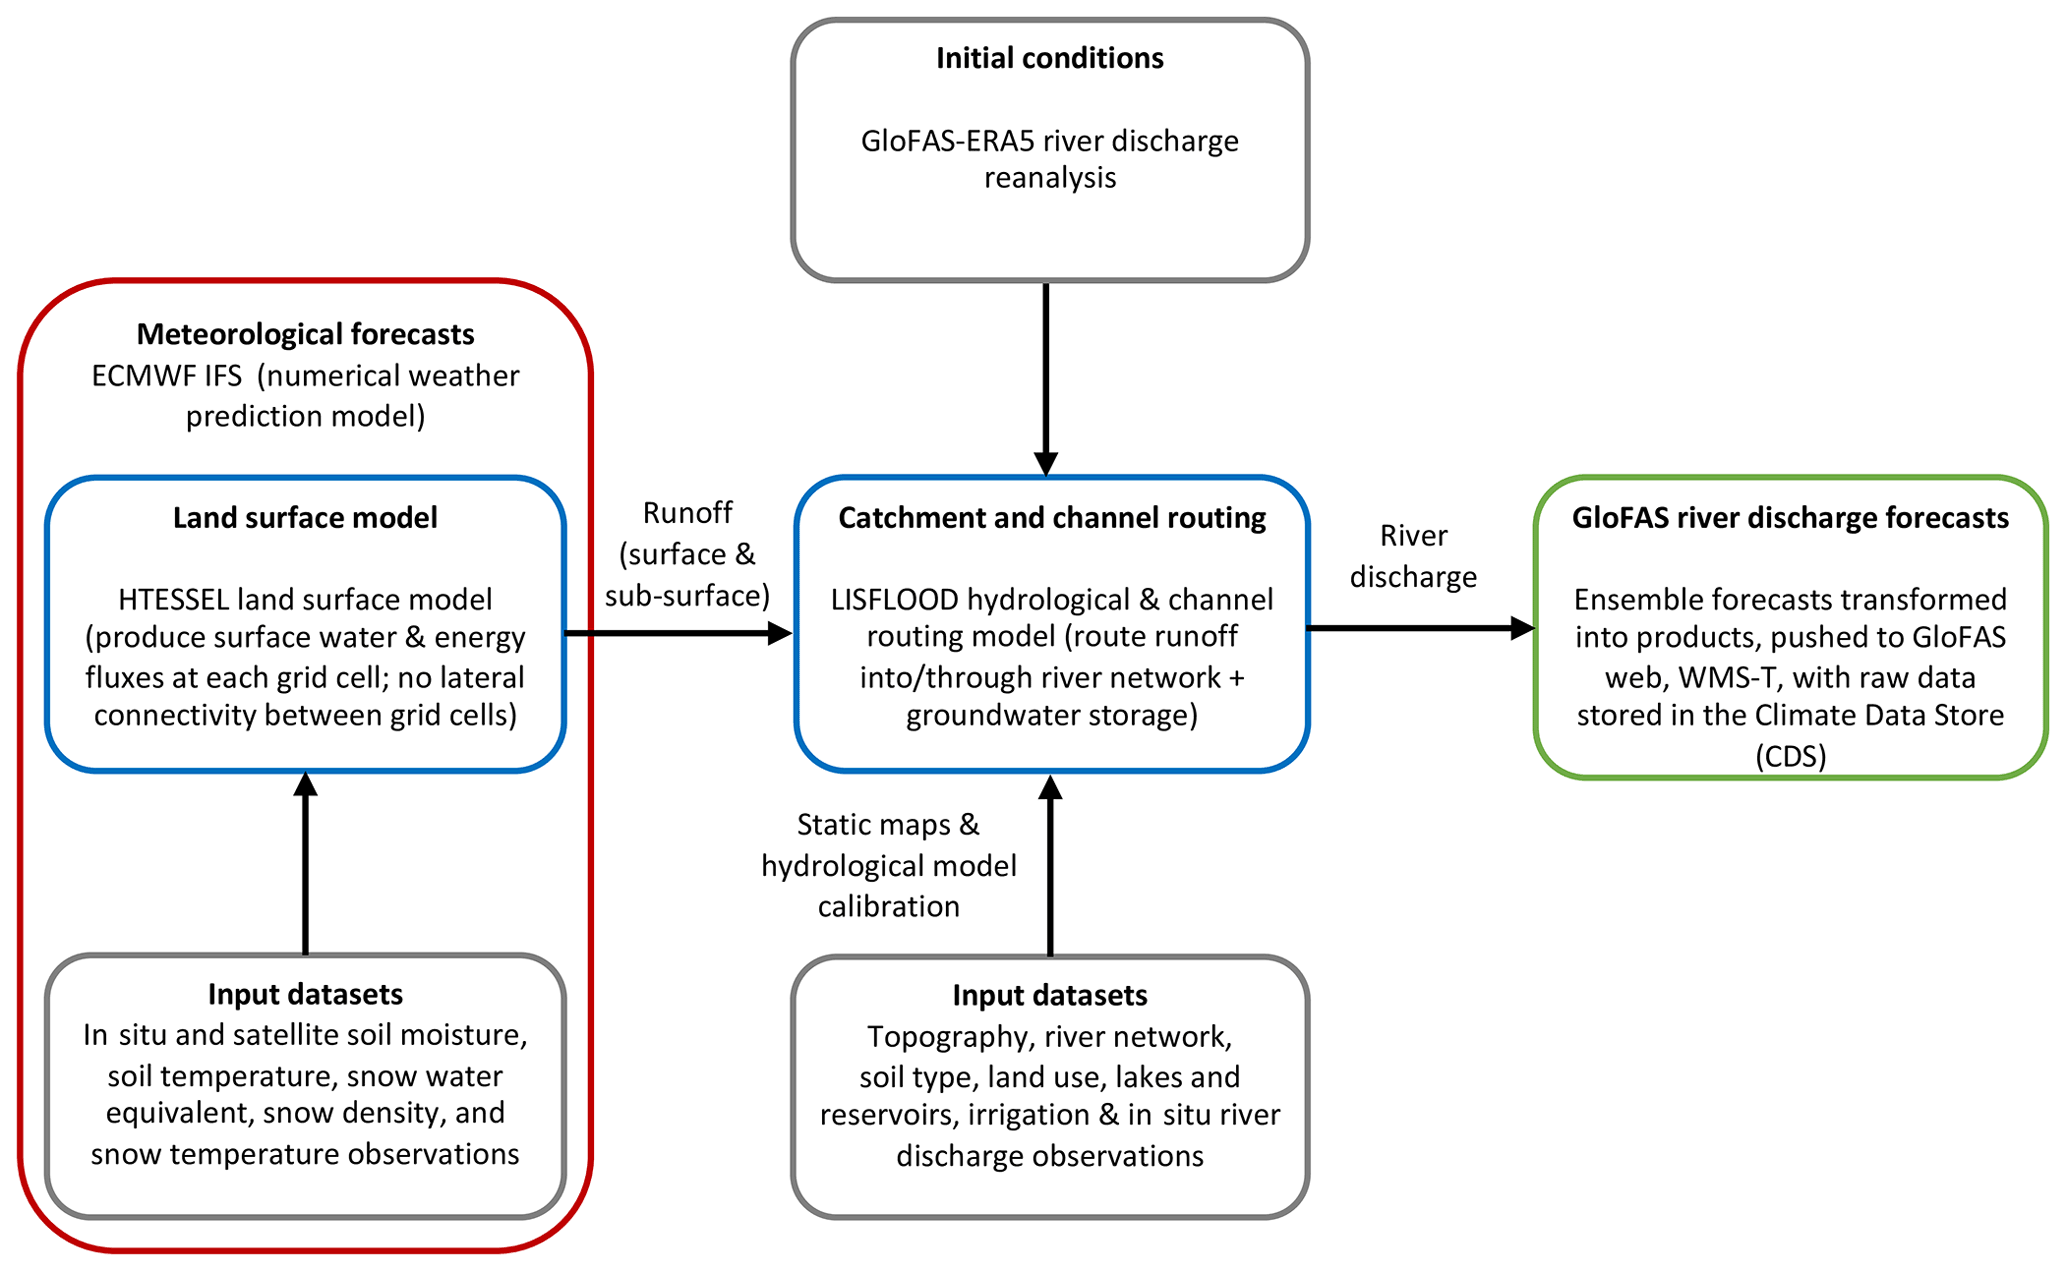
The GloFAS hydrological forecasting system couples global numerical weather prediction (NWP) with hydrological modelling to produce ensemble forecasts of river discharge operationally each day across the world. The key model components of GloFAS version 2.1 (identical to version 2.2, the latter being a minor service-only upgrade with increased data availability and new information layers added to the service) are shown in Fig. 1 with a summary of real-time forecast (Sect. 2.1), reforecast (Sect. 2.2), and reanalysis (Sect. 2.3) configurations in Table 1. Individual GloFAS model components have already been published in the scientific literature and hence are not described in detail here (Table A1).
Table 1Real-time forecast and reforecast configurations for GloFAS version 2.1/2.2.

a https://confluence.ecmwf.int/display/CEMS/GloFAS+versioning+system (last access: 3 December 2022); b https://www.ecmwf.int/en/forecasts/documentation-and-support/changes-ecmwf-model (last access: 3 December 2022).
2.1 GloFAS real-time forecasts
GloFAS is driven by the NWP model of the European Centre for Medium-Range Weather Forecasts (ECMWF), known as the Integrated Forecasting System (IFS). The current operational IFS model cycle is 47r3, implemented on 12 October 2021 (https://www.ecmwf.int/en/forecasts/about-our-forecasts/evolution-ifs/cycles/summary-cycle-47r3, last access: 25 March 2022). Because the atmosphere is a chaotic system, ECMWF ensemble forecasts (ENS) are used to account for the inherent uncertainty and provide probabilistic forecasts in GloFAS (Fig. 2). ECMWF ENS (∼18 km horizontal resolution) produces 51 ensemble members operationally out to a lead time of 15 d twice per day at 00:00 and 12:00 UTC. Ensemble members are comprised of a single “control” (CTL) member which is generated from the most accurate estimate of current conditions and the remaining 50 members which have their initial conditions perturbed to provide a range of possible future weather states. Twice per week (on Monday and Thursday) ECMWF ENS is extended to run to 46 d ahead at a coarser resolution (∼36 km horizontal resolution), although in GloFAS only days 16 to 30 are used. The ECMWF ENS is run at a 6-hourly forecast time step and for ingestion into the GloFAS hydrological modelling chain, data from the 00:00 UTC run are extracted and aggregated to 24-hourly time step.
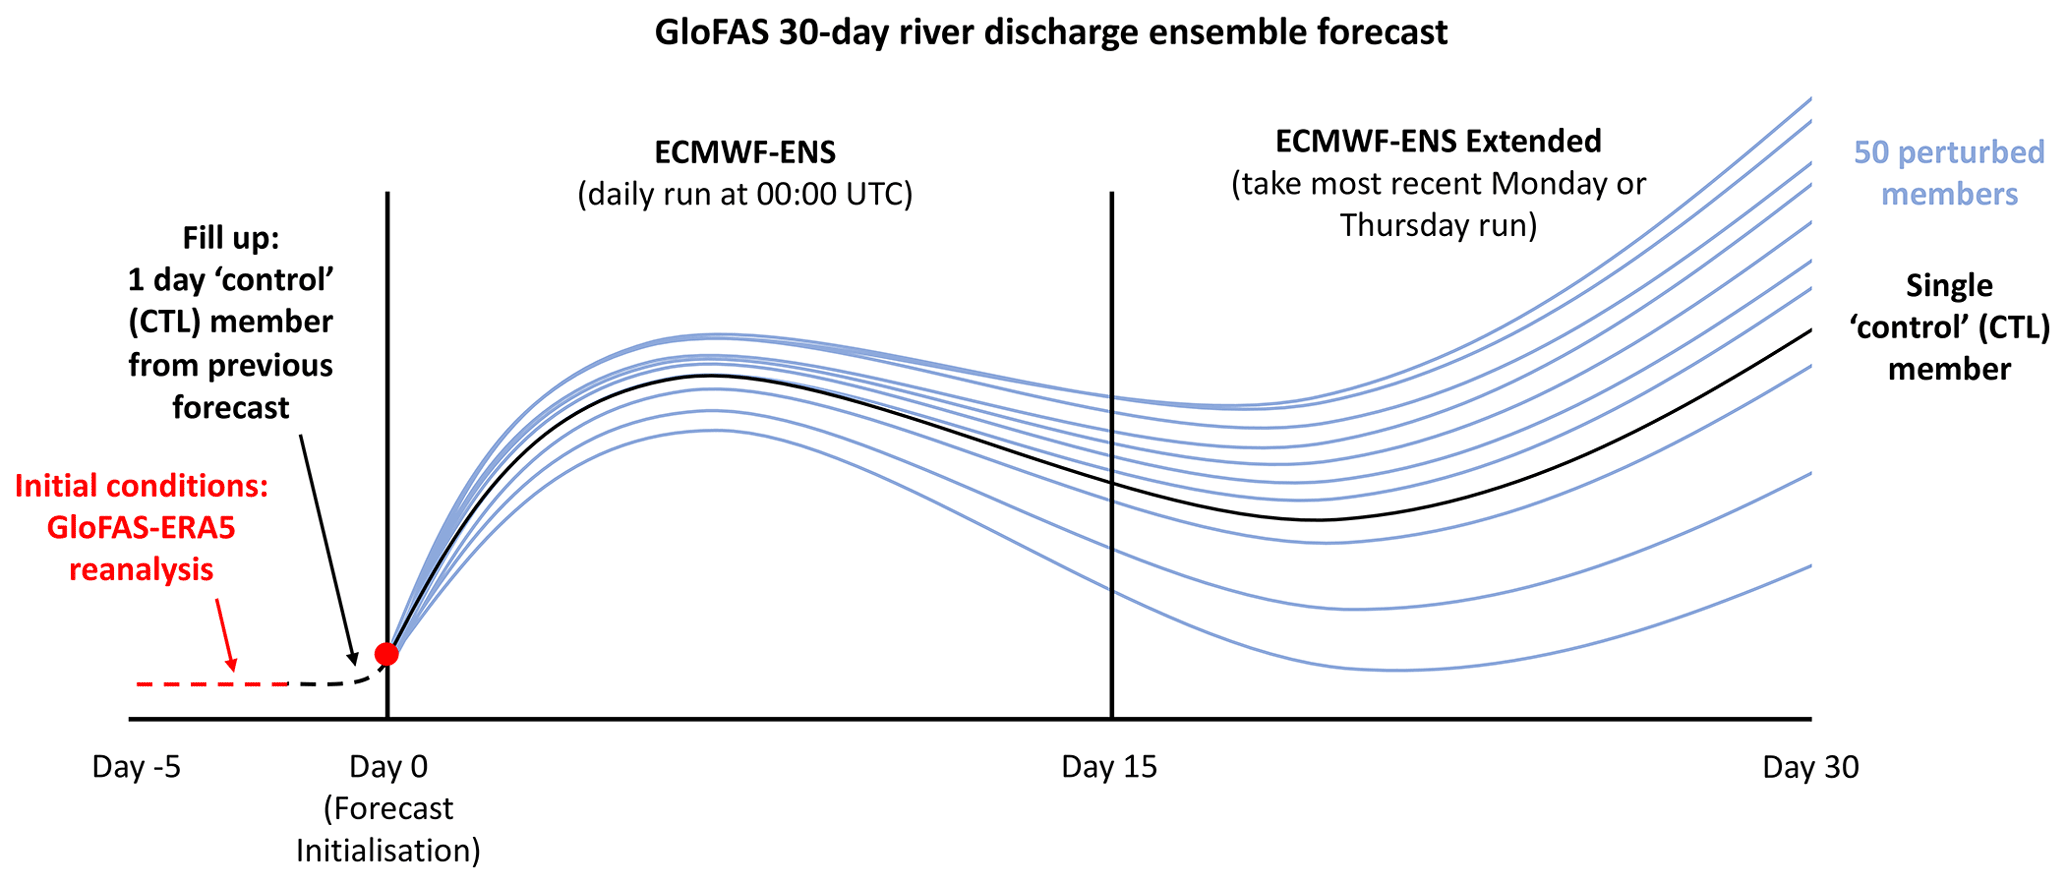
Figure 2Schematic of a single GloFAS 30 d real-time river discharge ensemble forecast initialised at day 0 for GloFAS version 2.1/2.2.
The hydrological modelling components of GloFAS (Fig. 1) comprises the land surface model of ECMWF IFS, HTESSEL (Hydrology Tiled ECMWF Scheme for Surface Exchanges over Land; Balsamo et al., 2009), and LISFLOOD, a spatially distributed grid-based hydrological and channel routing model (van der Knijff et al., 2010). Precipitation is transformed to surface and subsurface runoff in HTESSEL, with groundwater and channel routing processes simulated in LISFLOOD. In HTESSEL, excess precipitation and snowmelt are partitioned as surface runoff or infiltrated into a four-layer soil column (7 cm depth for top layer and then 21, 72, and 189 cm) at each IFS grid cell, before draining from the bottom of the soil column as subsurface runoff.
Output from HTESSEL is downscaled to the GloFAS 0.1∘ (∼11 km) gridded river network using the nearest neighbour method before being input to LISFLOOD. Surface runoff is then routed through the river network using the kinematic wave approach. Subsurface runoff is used as input to the LISFLOOD groundwater module representing both base flow and faster groundwater pathways; it consists of two parallel linear reservoirs (upper zone for quick and lower zone for slower groundwater flow) that store and subsequently transport water to the river channel with a time delay. Groundwater and river routing parameters were calibrated against river discharge observations for 1287 catchments globally by Hirpa et al. (2018). A total of 463 of the largest lakes (surface area > 100 km2) and 667 largest reservoirs have been incorporated into the GloFAS river network (Zajac et al., 2017). Reservoir outflow is calculated with a set of four rules depending on the current reservoir filling level (see Burek et al., 2013).
GloFAS real-time river discharge forecasts are produced operationally once per day using the ECMWF ENS initialised at 00:00 UTC (Fig. 2). Initial hydrometeorological conditions are provided by the latest near-real-time GloFAS-ERA5 river discharge reanalysis (Harrigan et al., 2020a and Sect. 2.3), a product publicly available to users 2 to 5 d behind real time through the CDS. To fill this 2 to 5 d gap between the latest available GloFAS-ERA5 data and real-time initialisation of the GloFAS forecast, the first 24 h period from the single ECMWF ENS CTL member from the preceding day's forecast is used as “fill-up” (see Fig. 2).
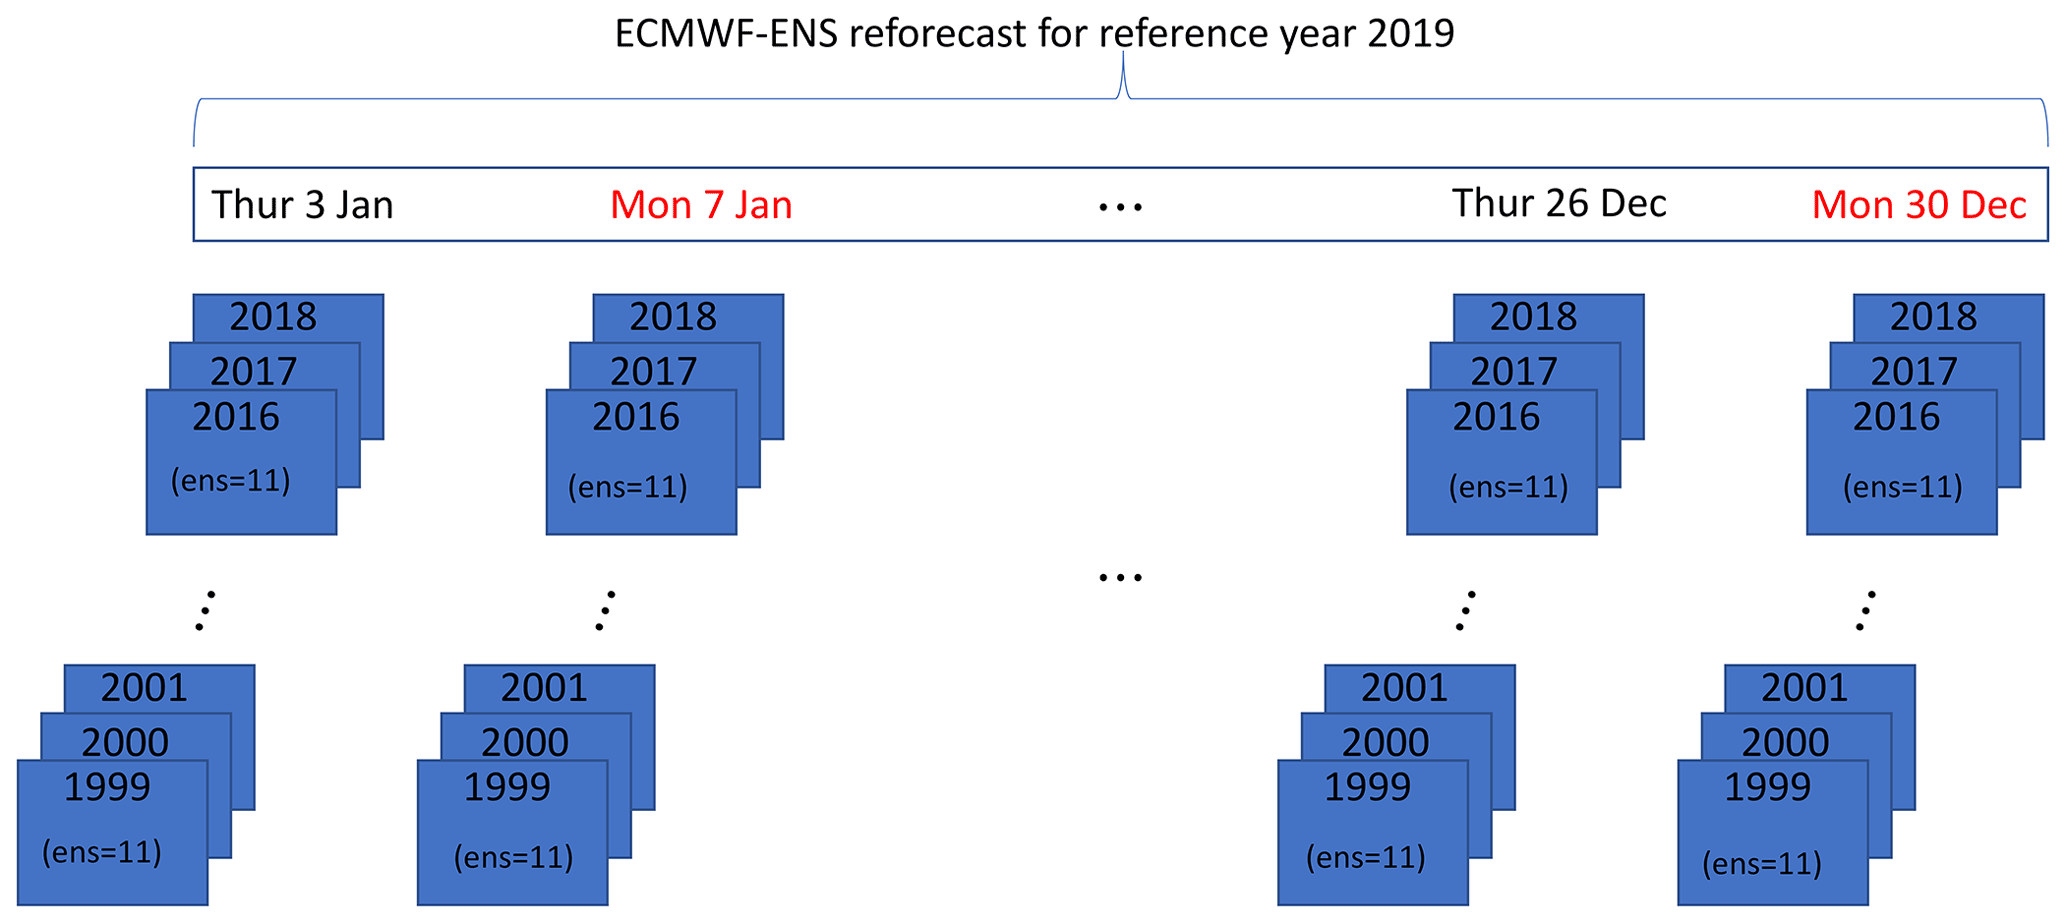
Figure 3ECMWF-ENS reforecast schematic for the reference period January to December 2019 with 11 ensemble members (ens = 11).
The final stage in the real-time forecast production is to generate plots and maps from the raw data highlighting possible upcoming flood events (see https://confluence.ecmwf.int/display/CEMS/Overall+GloFAS+products+summary, last access: 25 March 2022) for a complete description of all GloFAS products. These products are pushed each day to the GloFAS Web Map Viewer and are freely available to users (https://www.globalfloods.eu/, last access: 3 December 2022 and available as Web Map Service with temporal requests each day, WMS-T: https://confluence.ecmwf.int/display/CEMS/Web+Services, last access: 25 March 2022). The raw real-time forecast GloFAS river discharge data, together with corresponding metadata, are then stored in the user-friendly data repository, the Copernicus Climate Data Store (CDS; https://cds.climate.copernicus.eu/#!/home, last access: 25 March 2022) for use in downstream applications. Full details on data access can be found in Sect. 4.3.
2.2 GloFAS reforecasts
The quality of any forecast system can be evaluated by comparing a set of past forecasts with their corresponding observations (Jolliffe and Stephenson, 2012; Wilks, 2011). The set of past forecasts can be forecasts from the operational forecast system or a dedicated set of “reforecasts” (also known as hindcasts) that are computed retrospectively using the same (or as close as possible) model as the real-time forecast for a number of past dates.
The set of past forecasts used to evaluate the skill of GloFAS (Sect. 3) were generated from the ECMWF 20-year operational reforecasts. Compared with archived forecasts, using reforecasts has the advantage of being generated from the latest NWP configuration, which is generally more stable than archived forecasts produced from different model cycles. Typically, there is a new ECMWF IFS cycle release every 6 to 18 months (Table 1). In addition, changes can be made to the IFS or GloFAS modelling system components independently from the full ECMWF IFS cycle release (see https://confluence.ecmwf.int/display/CEMS/GloFAS+versioning+system, last access: 3 December 2022, for a description of GloFAS release cycles since its operational launch). The last 10 years of GloFAS archived forecasts contain at least 19 different ECMWF IFS model evolutions. Whilst not all IFS model changes impact the terrestrial water cycle, it is likely that there are significant changes in forecast errors between each model evolution, making the evaluation inconsistent through time. In contrast, the use of reforecasts has a number of advantages compared to using archived forecasts for forecast performance evaluation: (1) being run off-line, the latest hydrological routing component and simulation configuration (e.g. initial conditions) can be used, providing a stable simulation of river discharge processes; and (2) a large sample of ECMWF-ENS reforecasts are available (20 years long), albeit with a smaller-sized ensemble than the real-time simulation (11 members instead of 51), allowing for robust evaluation of forecast skill.
ECMWF uses an “on-the-fly” configuration to generate a continuous large reforecast sample, while balancing the computational resources needed to run the operational global NWP. A reforecast task is run twice per week (on Mondays and Thursdays) in parallel to the real-time forecast, using ERA5 atmospheric reanalysis (Hersbach et al., 2020) for initial conditions of past dates. A reforecast of the corresponding date for the previous 20 years is produced with a reduced number of 11 ensemble members but using the same model version as real-time (Vitart, 2014). For example, on Thursday 3 January 2019 a real time forecast based on IFS cycle 45r1 as well as a retrospective reforecast for 3 January for 20 years in the past (i.e. 3 January 1999 to 3 January 2018) was produced and archived. On Monday 7 January 2019, the process was repeated with reforecasts run for 7 January 1999 to 7 January 2018, and so on each Monday and Thursday operationally (Fig. 3).
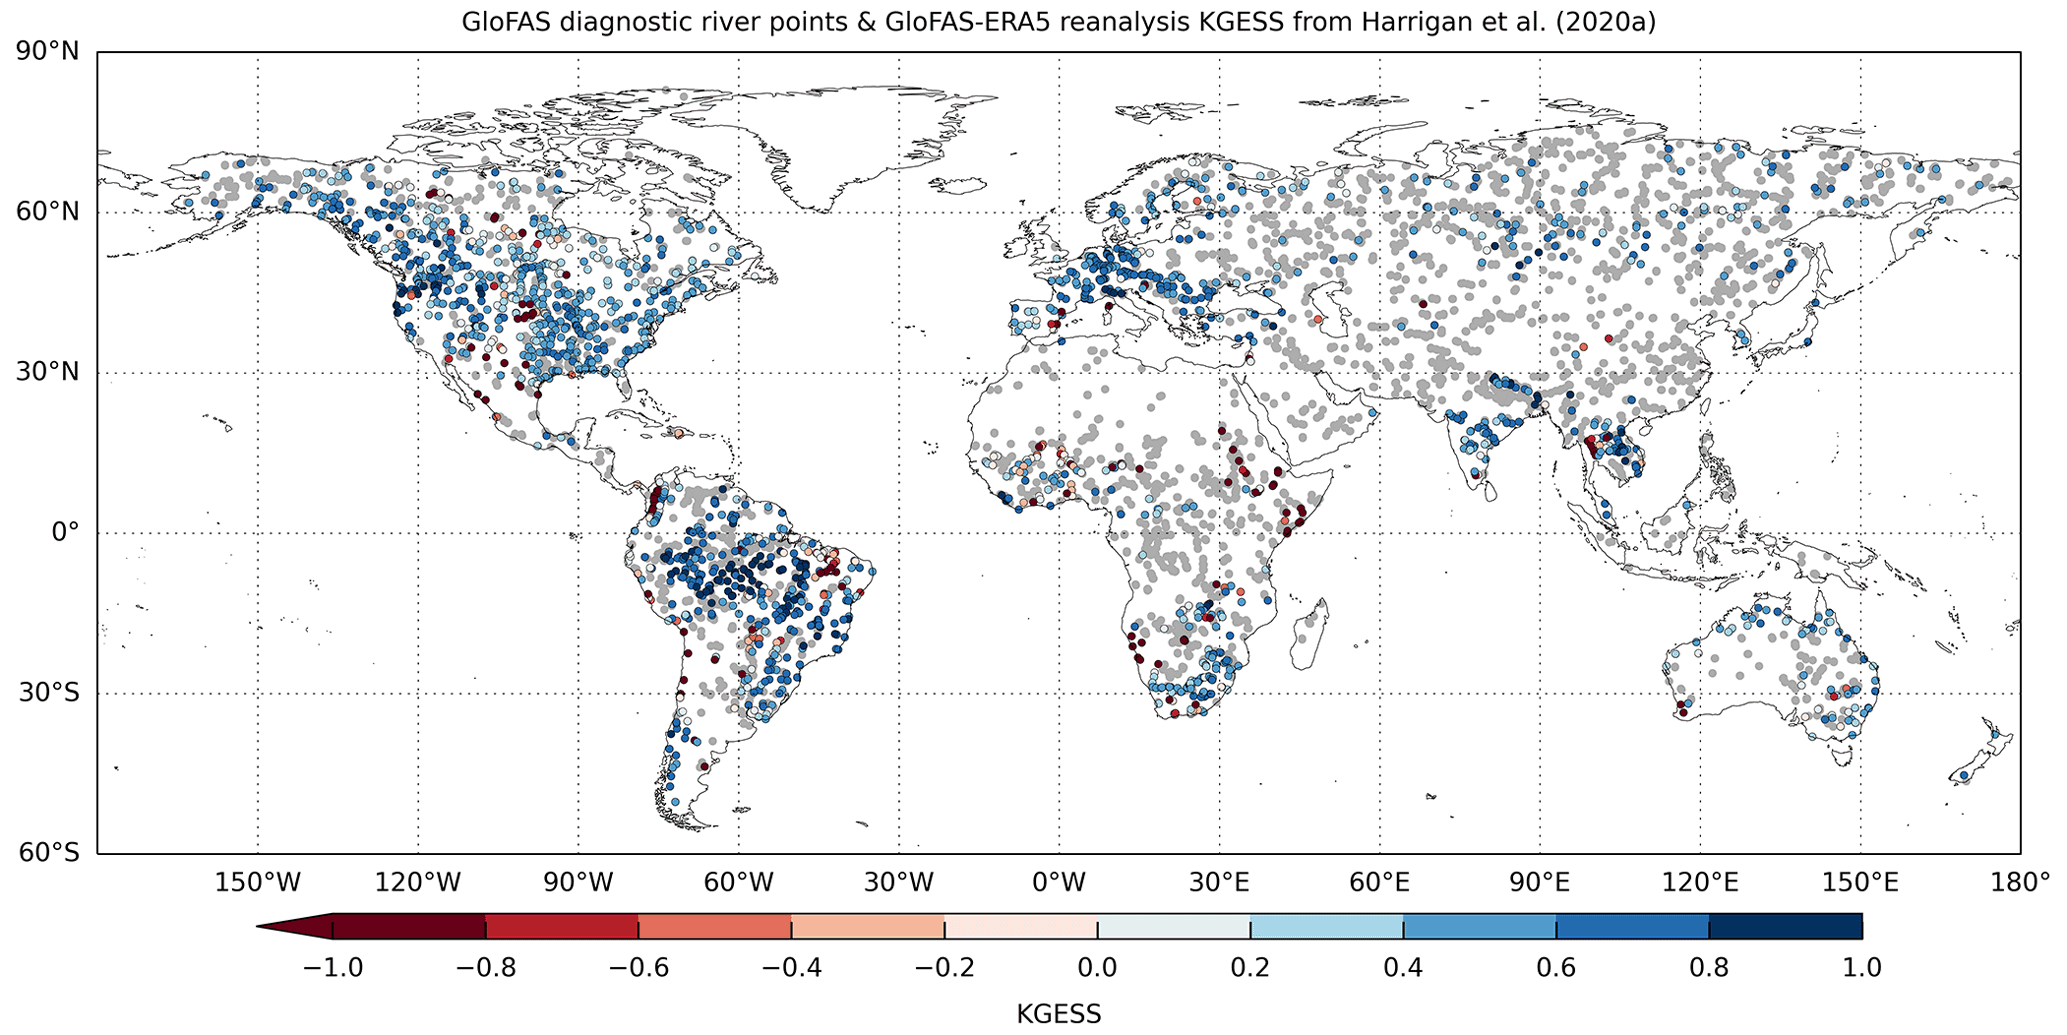
Figure 4GloFAS diagnostic river points (n=5997) are highlighted by grey dots. Coloured dots show hydrological performance of GloFAS-ERA5 river discharge reanalysis against a subset of GloFAS diagnostic river points with observations (n=1801) from Harrigan et al. (2020a) using the modified Kling–Gupta efficiency skill score (KGESS). Optimum value of KGESS is 1. Blue (red) dots show catchments with positive (negative) hydrological skill.
The GloFAS reforecast used here and made available was generated during the full calendar year of 2019 (i.e. Thursday 3 January to Monday 30 December). It is an ensemble containing forecast simulations of 104 start dates per year for the previous 20 years 1999 to 2018 (2080 start dates in total) composed of 11 members and running for lead times 1 to 30 d at a 24 h time step (Table 1). The river discharge reforecast was initialised from GloFAS-ERA5 (Sect. 2.3) and forced by ECMWF-ENS reforecast runoff from the twice weekly, 11-member, 20-year ECMWF meteorological ensemble reforecasts.
2.3 GloFAS-ERA5 river discharge reanalysis
The GloFAS-ERA5 reanalysis dataset (Harrigan et al., 2020a) provides a spatio-temporally consistent estimate of daily historic river discharge. It is produced for every 0.1∘ river cell globally from 1979 to the present. It is updated operationally with a latency of 2 to 5 d behind real time, following the release of ERA5 atmospheric reanalysis (Hersbach et al., 2020). In GloFAS operational forecasts, GloFAS-ERA5 is used as initial conditions for the real-time forecasts (Figs. 1 and 2), and for calculating flood thresholds against which real time ensemble forecasts are compared to determine the probability of a flood signal (Zsoter et al., 2020a). For the forecast evaluation undertaken here, GloFAS-ERA5 is used as initial conditions for reforecasts, to generate benchmark forecasts and as proxy observations to evaluate forecast skill.
The hydrological performance of GloFAS-ERA5 will have implications for the forecasts and reforecasts here. If for example GloFAS-ERA5 has poor hydrological skill in resolving hydrological dynamics, particularly the timing of river discharge, this would contribute to poorer forecasts. An evaluation of GloFAS-ERA5 against a global network of 1801 in-situ river discharge observation stations was undertaken by Harrigan et al. (2020a) and shown here in Fig. 4 for context. They found the reanalysis is skilful in 86 % of catchments according to the modified Kling–Gupta Efficiency Skill Score (KGESS) against a mean flow benchmark (see Fig. 4). The global median Pearson correlation coefficient is 0.61 with an interquartile range of 0.44 to 0.74. However, skill varies considerably with location with several regions such as central US, Africa, eastern Brazil, and western coast of South America having large systematic positive biases. For the evaluation presented here, GloFAS-ERA5 v2.1 data from 1979 to 2019 are used as downloaded from the Copernicus Climate Data Store (CDS): https://cds.climate.copernicus.eu/cdsapp#!/dataset/cems-glofas-historical?tab=overview (last access: 25 March 2022) (Harrigan et al., 2019).
A first systematic evaluation of GloFAS hydrological forecast skill was carried out using the operational version 2.1/2.2 at the global scale, across lead times from 1 to 30 d, based on the comprehensive set of 20-year reforecasts described in Sect. 2.2. The forecast evaluation methodology is set out below with the aim of being applied routinely to all future major releases of GloFAS, with the forecast skill statistics provided as a new forecast skill layer on the GloFAS Web Map Viewer as well as metadata information associated with the raw data provided on the Copernicus Climate Data Store (CDS). This aims to help users make better informed decisions on how, when, and where GloFAS forecasts might be appropriate for their needs.
3.1 Data sample
There are 5.4 M GloFAS 0.1∘ river network cells covering the global land area, so to avoid excessive redundancy, forecast skill is calculated for a subset called the GloFAS diagnostic river points. There are 5997 of these diagnostic points in total used across the GloFAS project by both model developers and users for a range of purposes, such as displaying forecast hydrographs and associated detailed metadata at each point on the Web Map Viewer (known as GloFAS web points), diagnosing reanalysis and forecast errors, and tracking improvement between model upgrades. These river points drain catchment areas ranging from 1068 to 5 359 150 km2 with a median area of 29 051 km2 (Fig. 4) and more information on each point can be found in Table S1 in the Supplement.
3.2 Benchmark forecasts
Forecast skill refers to the relative accuracy of a set of forecasts with respect to a set of standard reference or benchmark forecasts (Wilks, 2011). When designing a forecast evaluation experiment, a critical consideration is the selection of a benchmark forecast that has sufficient skill discrimination, i.e. is not too simple and represents as closely as possible the observations (Pappenberger et al., 2015).
Following Pappenberger et al. (2015) and because GloFAS produces seamless forecasts across short-, medium- and extended-range lead times (day 1 to 30), two benchmarks are considered here, each calculated for all GloFAS diagnostic river points: persistence, typically used for short-range lead times where the forecast signal is dominated by serial correlation of river discharge, and climatology, typically used for longer lead times where the forecast signal is dominated by the seasonality of river discharge defined as follows.
-
Persistence benchmark forecast is defined as the single GloFAS-ERA5 daily river discharge of the day preceding the reforecast start date. The same river discharge value is used for all lead times. For example, for a forecast issued on 3 January at 00:00 UTC, the persistence benchmark forecast is the average river discharge over the 24 h time step from 2 January 00:00 UTC to 3 January 00:00 UTC, and the same value is used as benchmark for all 30 lead times (i.e., 4 January to 2 February).
-
Climatology benchmark forecast is based on a 40-year climatological sample (1979–2018) of moving 31 d windows of GloFAS-ERA5 river discharge reanalysis values, centred on the date being evaluated (±15 d). From each 1240-valued climatological sample (i.e. 40 years × 31 d window), 11 fixed quantiles (Qn) at 10 % intervals were extracted (Q0, Q10, Q20, …, Q80, Q90, Q100). The fixed quantile climate distribution used therefore varies by lead time, capturing the temporal variability in local river discharge climatology.
3.3 Skill score
The ensemble forecast performance is evaluated using the continuous ranked probability score (CRPS) (Hersbach, 2000), one of the most widely used headline scores for operational probabilistic forecasts (Pappenberger et al., 2015; Alfieri et al., 2014). The CRPS compares the continuous cumulative distribution of an ensemble forecast with the distribution of the observations. It has an optimum value of 0 and measures the error in the same units as the variable of interest (here river discharge in m3 s−1). It collapses to the mean absolute error (MAE) for deterministic forecasts, which is important here as the persistence benchmark forecast we use is deterministic. The CRPS is expressed as a skill score, CRPSS, to calculate forecast skill which measures the improvement in GloFAS over the benchmark forecast and is given in Eq. (1):
where CRPSfc is the CRPS of the forecast against observations and CRPSbench is the CRPS of the benchmark forecast against observations. A CRPSS value of 1 indicates a perfect forecast, CRPSS > 0 shows forecasts are more skilful than the benchmark, CRPSS = 0 shows forecasts are only as accurate as the benchmark, and CRPSS < 0 means that forecasts are less skilful than the benchmark forecast.
The CRPSS was calculated using GloFAS reforecasts over 1999 to 2018 generated in Sect. 2.2 using both persistence and climatology benchmark forecasts (Sect. 3.2) and verified against GloFAS-ERA5 river discharge reanalysis used as proxy observations (following Alfieri et al., 2014) at each of the 5997 GloFAS diagnostic river points. Calculating forecast skill against proxy observations such as reanalysis is common in hydrological forecasting as it has the advantage of providing a spatio-temporally complete picture of forecast skill, currently not possible based on availability of the current global in situ observed river network (Lavers et al., 2019). It also allows the forecast predictability range to be isolated in the absence of systematic hydrological model errors. There is a disadvantage of forecast evaluation against proxy observations for catchments that represent hydrological dynamics poorly. While Harrigan et al. (2020a) demonstrate the performance of GloFAS-ERA5 reanalysis is largely hydrologically skilful, readers should be aware that there are areas where performance is poor and that there are large parts of the world where the performance is unknown due to the lack of in situ observations to evaluate against (Fig. 4).
4.1 GloFAS forecast skill
4.1.1 GloFAS skill by lead time
Overall, GloFAS version 2.1/2.2 is skilful at the global scale for the majority of catchments across all lead times analysed (Fig. 5a). The CRPSS against persistence decays exponentially as a function of lead time out to around 15 d lead time, then stabilises reaching a minimum of 0.48 by day 22. The CRPSS at day 1 is 0.96 (interquartile range of 0.88 to 0.99), day 3 = 0.82 (0.62, 0.94), day 5 = 0.70 (0.50, 0.87), day 10 = 0.55 (0.37, 0.72). The CRPSS against climatology begins higher than persistence and decays continuously towards day 30. At day 15 the CRPSS is 0.47 (0.27, 0.68), day 20 = 0.37 (0.17, 0.58), day 25 = 0.30 (0.11, 0.49), day 30 = 0.25 (0.06, 0.43).

Figure 5Skill of GloFAS 2.1/2.2 with global median continuous ranked probability skill score (CRPSS) for reforecasts against persistence (red line) and climatology (blue line) benchmarks from 1 to 30 d lead times with respect to GloFAS-ERA5 river discharge reanalysis at 5997 diagnostic river points (a). The interquartile range of CRPSS values at each lead time are shown by semi-transparent bands. Corresponding individual CRPS components used in Eq. (1) for GloFAS forecasts (black line), persistence benchmark (blue line) and climatology (red line) shown as a median across the diagnostic river points (b).
As the global median CRPSS against climatology becomes lower than against persistence (0.49 versus 0.50, respectively) from day 14, we present and discuss all forecast skill from short- (1 to 3 d) to medium-range (5 to 10 d) lead times calculated against the persistence benchmark forecast, and from extended lead times (15 to 30 d) calculated against the climatology benchmark forecast. To aid the readers interpretation of the CRPSS, individual CRPS components used in Eq. (1) (i.e. CRPSfc_GloFAS, CRPSbench_persistence, and CRPSbench_climatology) are also shown in Fig. 5b expressed as a global median across all lead times.
4.1.2 Spatial distribution of GloFAS skill
At short-range lead times (1 and 3 d), GloFAS is skilful compared to the persistence benchmark forecast in over 96 % of catchments (Fig. 6). In the medium range at day 5, GloFAS remains skilful for 93 % of catchments. Regions with the highest skill (CRPSS ≥ 0.8) include South America, especially the Amazon basin, the US, southern Africa, central Asia, and eastern Australia. There are notable clusters of catchments with negative skill (i.e. CRPSS < 0) mainly located in northern polar latitudes above 60∘ N as well as in the Congo River Basin. The global median CRPSS at day 5 for catchments located in the northern polar climate region is 0.63 compared to 0.70 and 0.73 for extratropics and tropics, respectively (Fig. 8a). By day 10, the strength of skill has decreased, but 89 % of catchments remain skilful (i.e. CRPSS > 0).
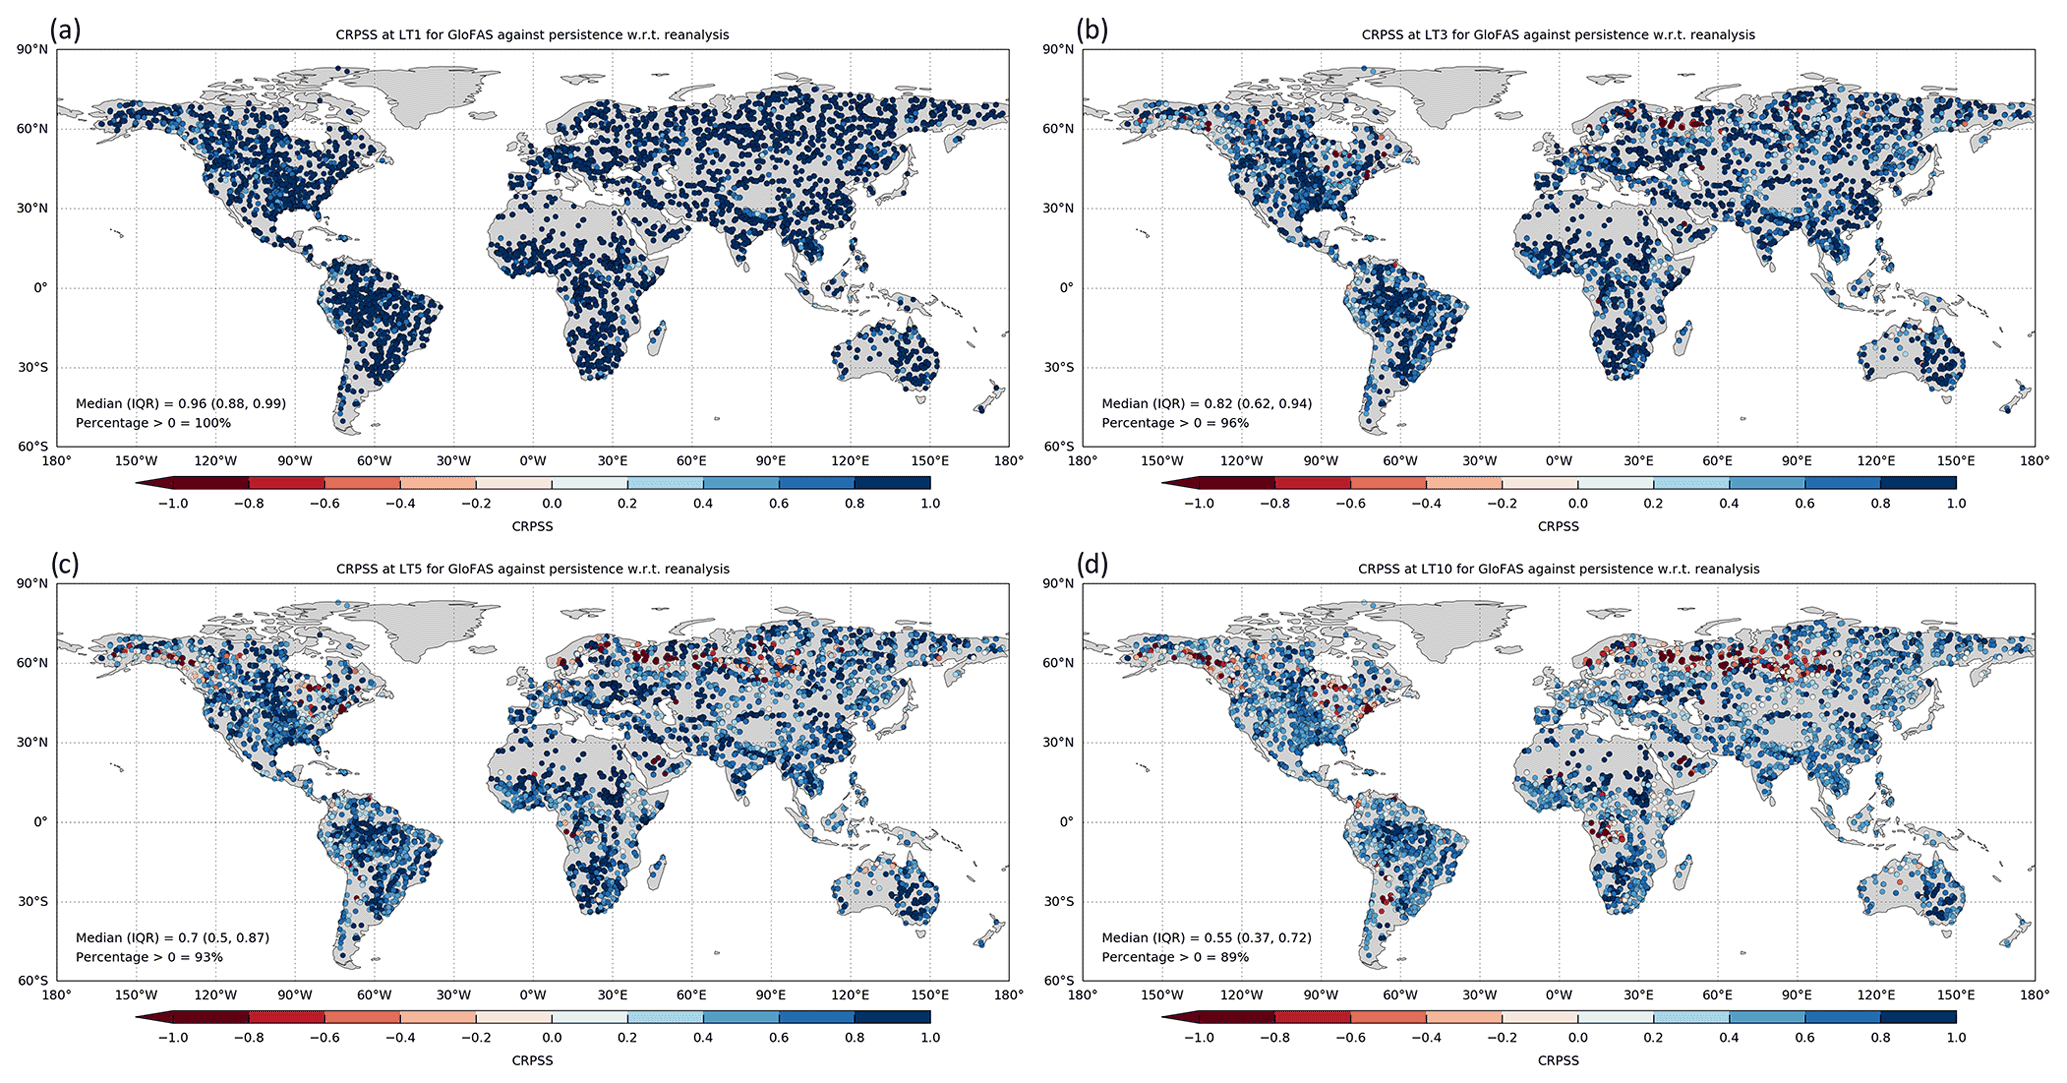
Figure 6GloFAS 2.1/2.2 with continuous ranked probability skill score (CRPSS) for reforecasts against the persistence benchmark for short- to medium-range lead times – 1 d (a), 3 d (b), 5 d (c), and 10 d (d) – with respect to GloFAS-ERA5 river discharge reanalysis at 5997 diagnostic river points. Optimum value of CRPSS is 1. Blue (red) dots show catchments with positive (negative) skill.
For extended-range lead times shown in Fig. 7, GloFAS is skilful compared to the climatology benchmark forecast in 89 % of catchments by day 15, reducing to 86 %, 83 % and 80 % by lead times 20, 25 and 30 d, respectively. The regions of highest skill are similar to those for the short and medium range, with areas of negative skill expanding to tropical Africa, a large region in central and northern Asia, and western coast of South America. The global median CRPSS at day 20 for catchments located in the broader tropics (latitudes 23∘ S to 23∘ N) is 0.31 compared to 0.40 and 0.37 for the extratropics and polar climate regions, respectively (Fig. 8a).
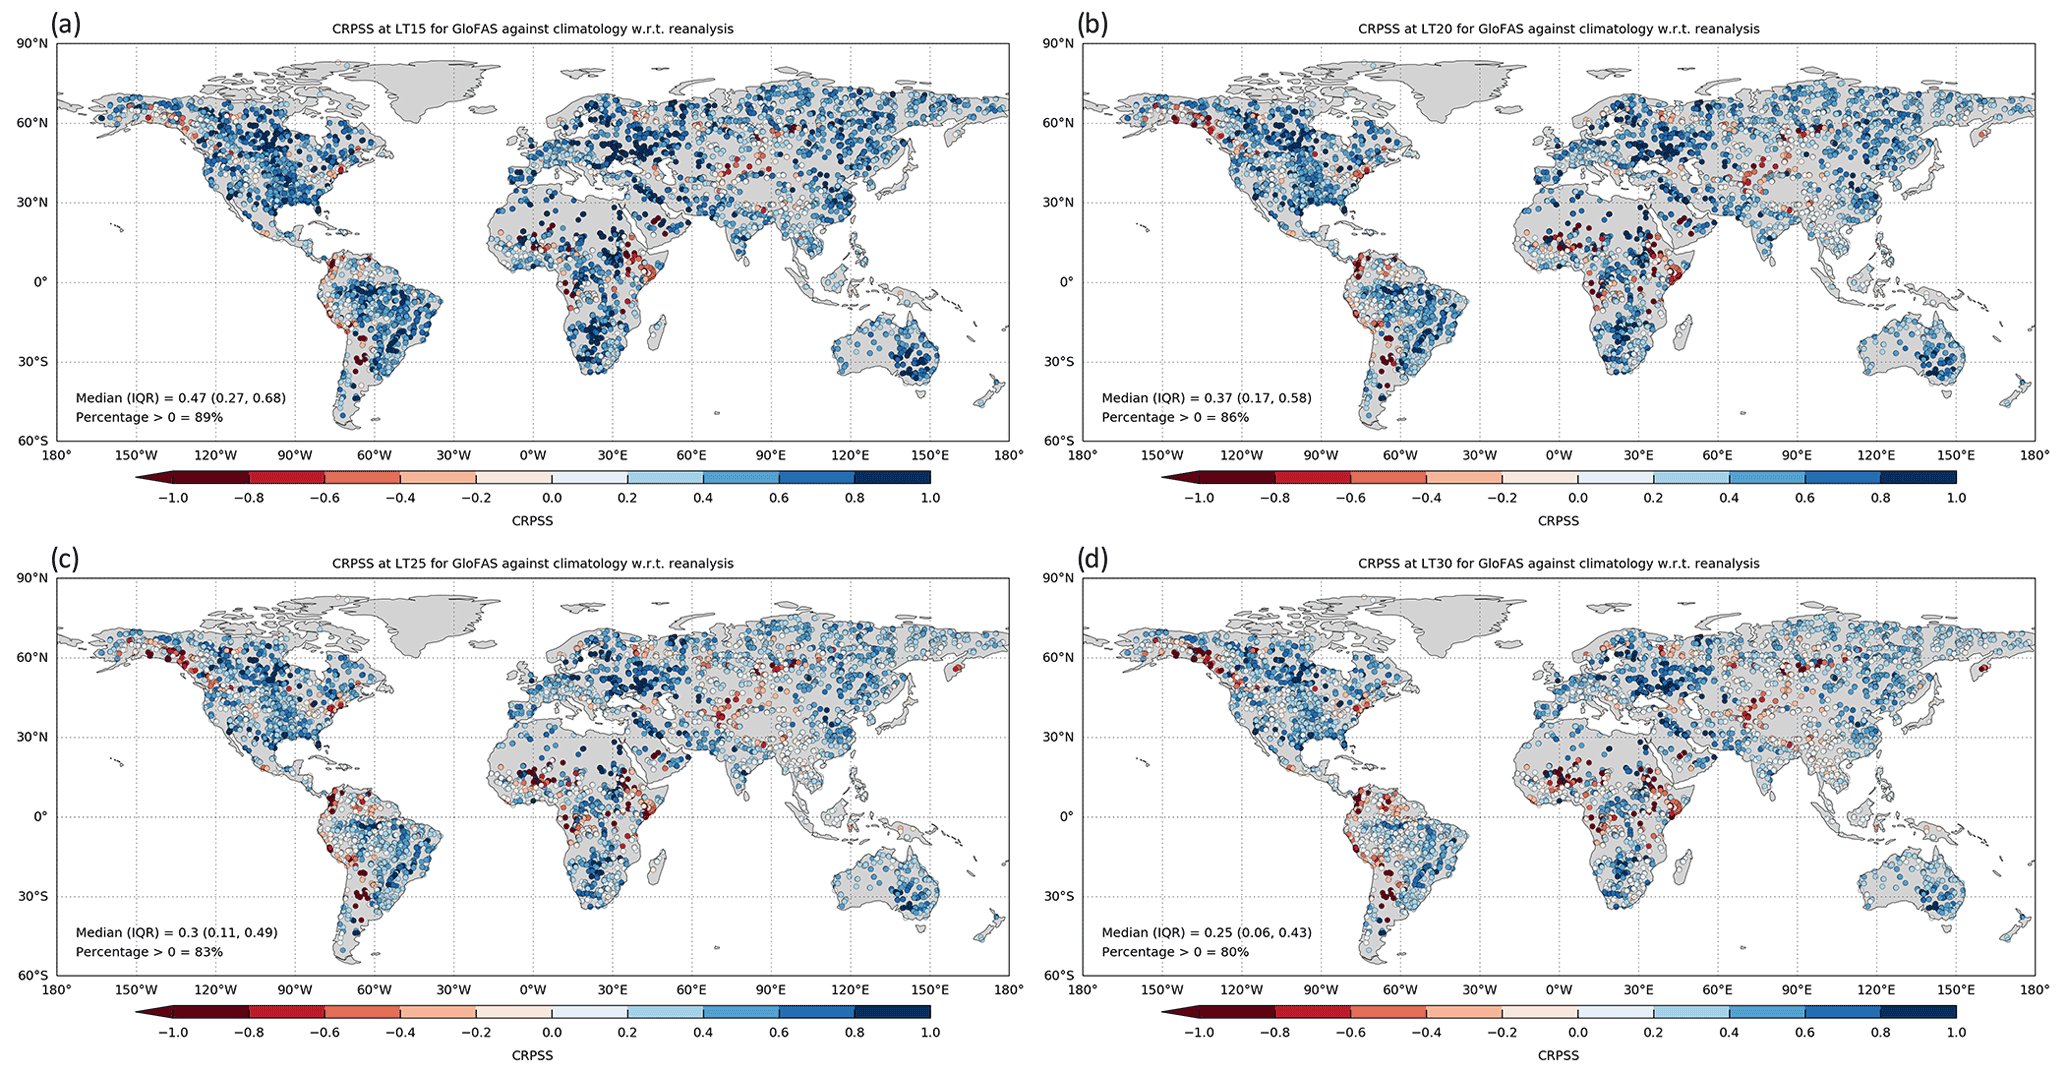
Figure 7GloFAS 2.1/2.2 continuous ranked probability skill score (CRPSS) for reforecasts against the climatology benchmark for extended lead times – 15 d (a), 20 d (b), 25 d (c), and 30 d (d) – with respect to GloFAS-ERA5 river discharge reanalysis at 5997 diagnostic river points. Optimum value of CRPSS is 1. Blue (red) dots show catchments with positive (negative) skill.
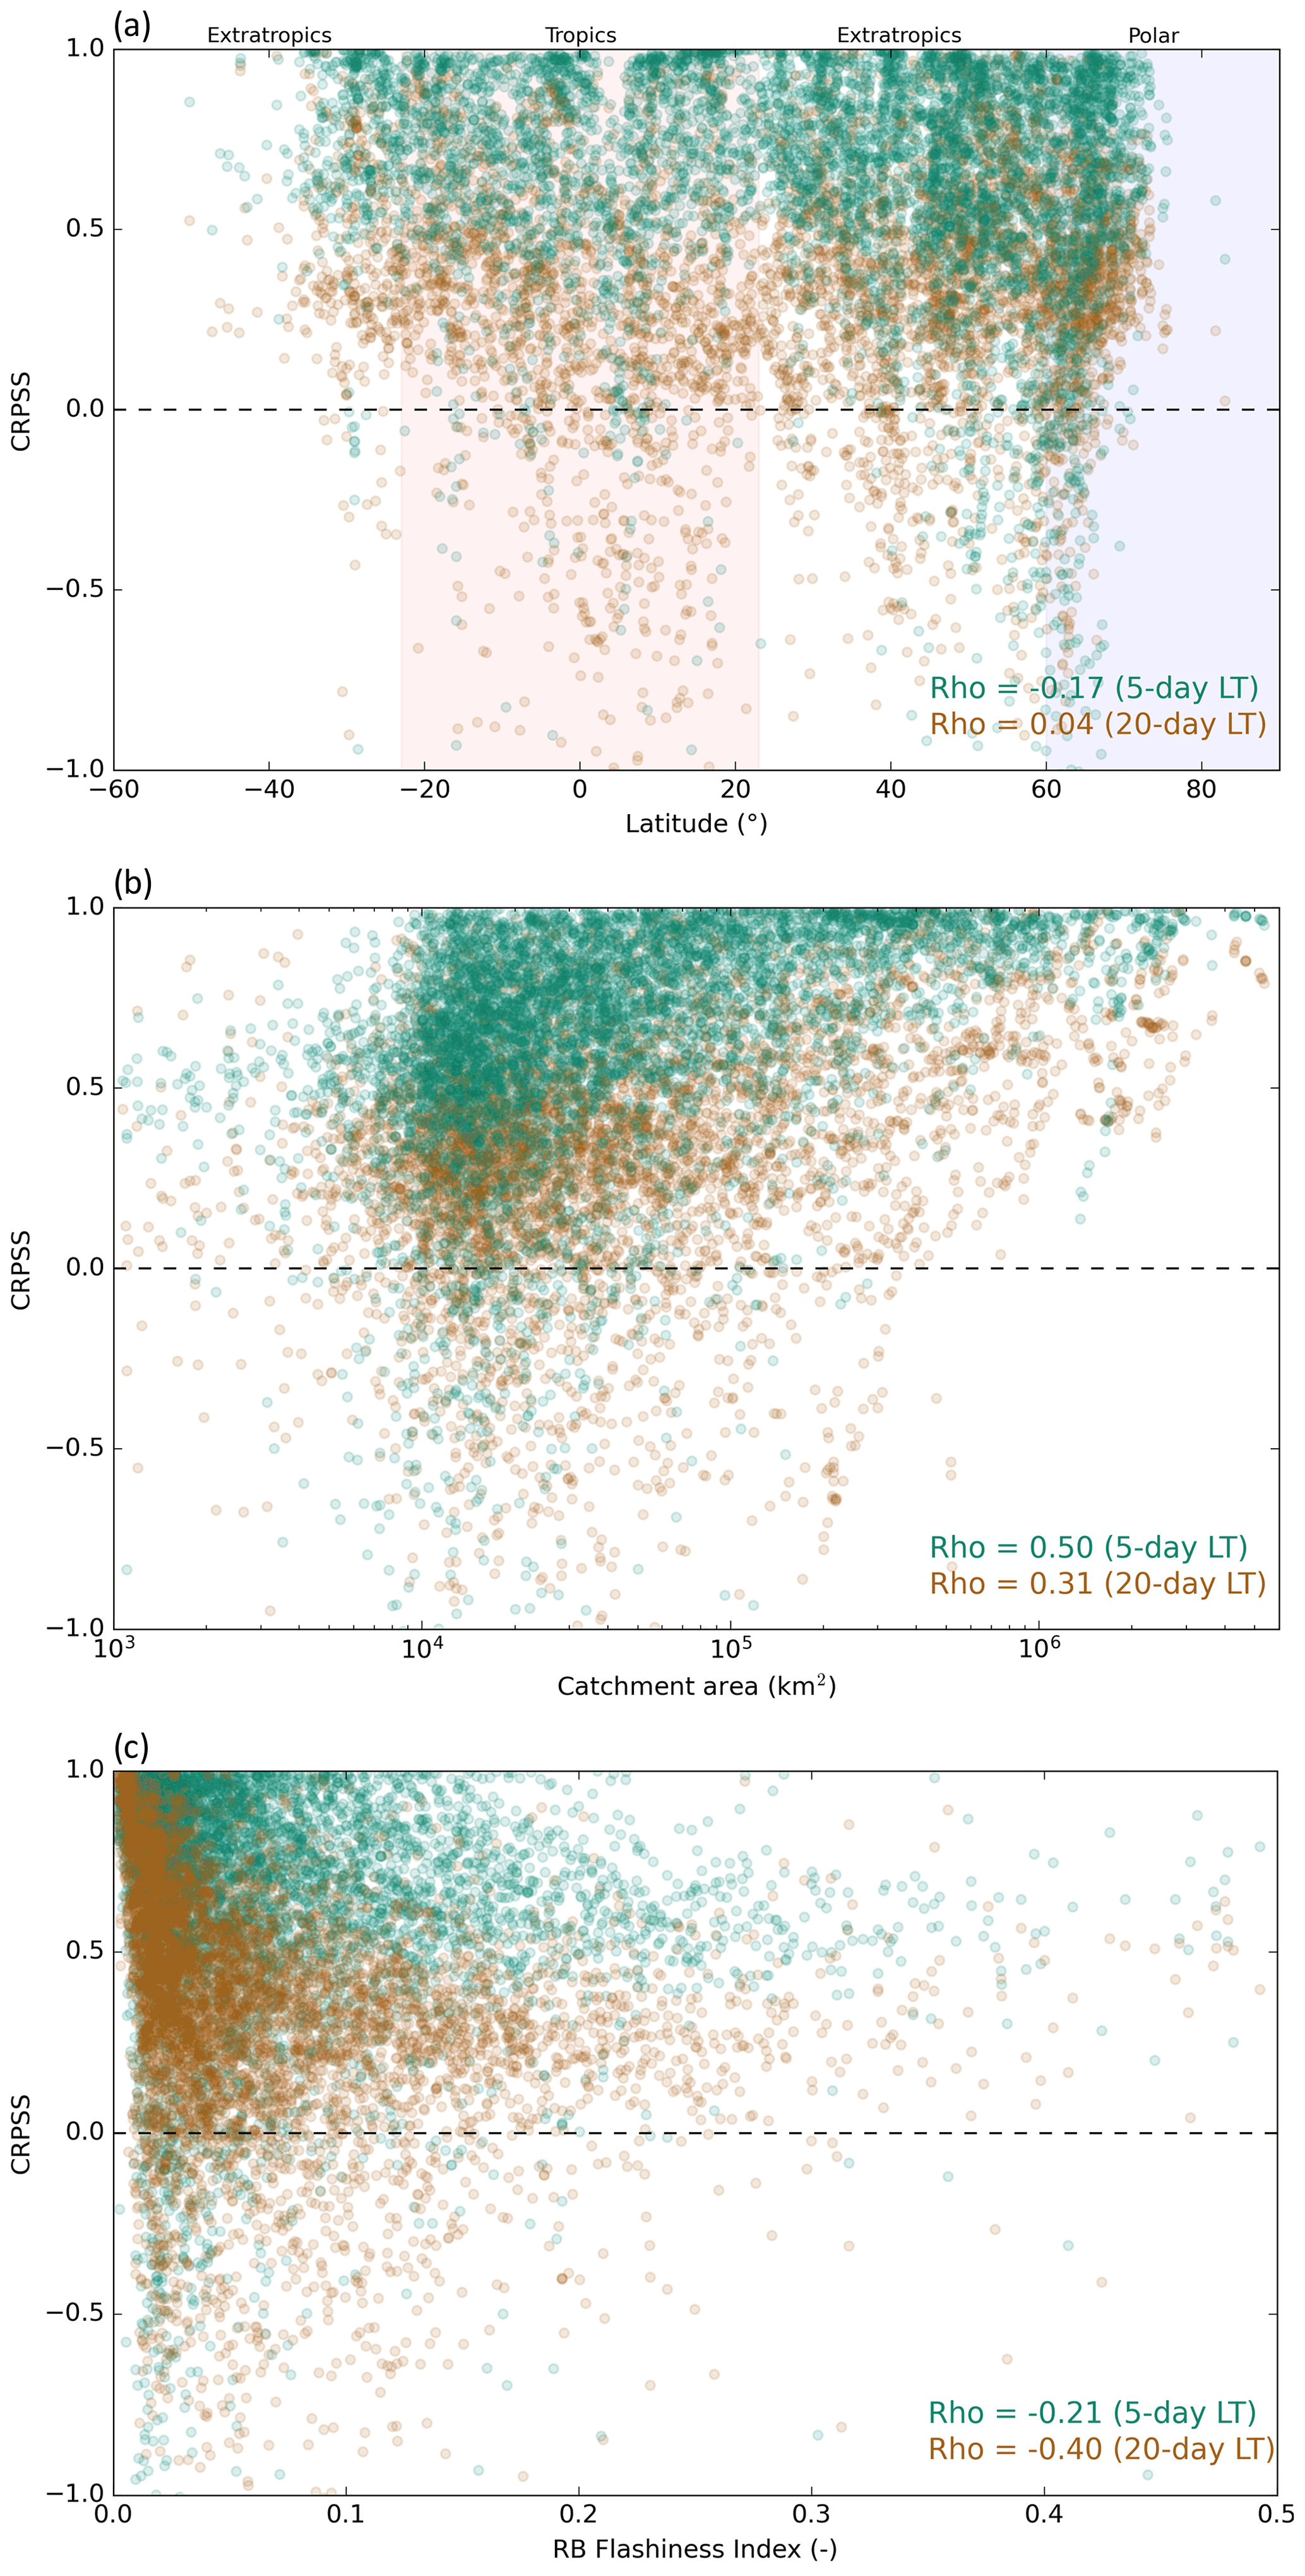
Figure 8GloFAS 2.1/2.2 continuous ranked probability skill Score (CRPSS) for 5 d (green dots; against persistence benchmark) and 20 d (brown dots; against climatology benchmark) lead times at 5997 diagnostic river points by degree latitude of the river point with polar (tropics) climate region shaded in blue (red) (a), catchment area (b), and RB flashiness index (c). Spearman rank correlation coefficients (ρ) for each combination given in text in the bottom right.
The choice of benchmark forecast used for the short- to medium-range (i.e., Fig. 6) and extended-range (i.e., Fig. 7) maps was based on the global median of all stations in Fig. 5a. However, there is spatial variability in the choice of best benchmark according to unique hydroclimate properties. For example, in northern latitudes around Russia and northern Scandinavia GloFAS was shown to be negatively skilful against persistence at a 10 d lead time (Fig. 6d). However, GloFAS is shown to be skilful against a climatology benchmark in the same region at lead time 15 d. This shows that persistence is a much tougher benchmark to beat in these catchments compared to climatology, likely due to the high degree of serial correlation from snow processes.
4.1.3 GloFAS skill by catchment area and hydrological flashiness
GloFAS skill using CRPSS for representative medium-range (using 5 d) and extended-range (using 20 d) lead times is correlated against catchment area in Fig. 8b and the Richards–Baker flashiness index (RB index; Baker et al., 2004) in Fig. 8c using the Spearman rank correlation coefficient (ρ). Forecast skill is moderately positively correlated with catchment area (ρ=0.50 (0.31) for 5 (20) d lead times); catchments with larger areas have higher skill. This is consistent with findings in Ireland (Donegan et al., 2021; Quinn et al., 2021), and at the European scale from EFAS (Alfieri et al., 2014). While catchments with no skill (CRPSS ≤ 0) tend to be smaller, the majority of catchments with areas ranging between 1000 to 10 000 km2 are skilful.
The RB index is calculated by dividing the pathlength of day-to-day river discharge changes by total river discharge for a given time interval. For each catchment, the RB index was extracted from GloFAS-ERA5 over the time interval 1979 to 2019. The index provides a useful summary of hydrological functioning of a catchment. Catchments with a high RB index tend to have flashy hydrological response and are characterised as smaller upland catchments with increased frequency and magnitude of storm events, whereas catchments with a low RB index tend to be slower responding larger catchments with higher baseflow components (Baker et al., 2004). Forecast skill is weakly to moderately negatively correlated with RB index ( (−0.40) for 5 (20) d lead times); catchments with higher hydrological flashiness have lower skill. The link between higher catchment responsiveness and lower forecast skill has also been found in Ireland (Donegan et al., 2021; Quinn et al., 2021), the UK (Harrigan et al., 2018), Sweden (Girons Lopez et al., 2021), and at the European scale from EFAS (Pappenberger et al., 2015).
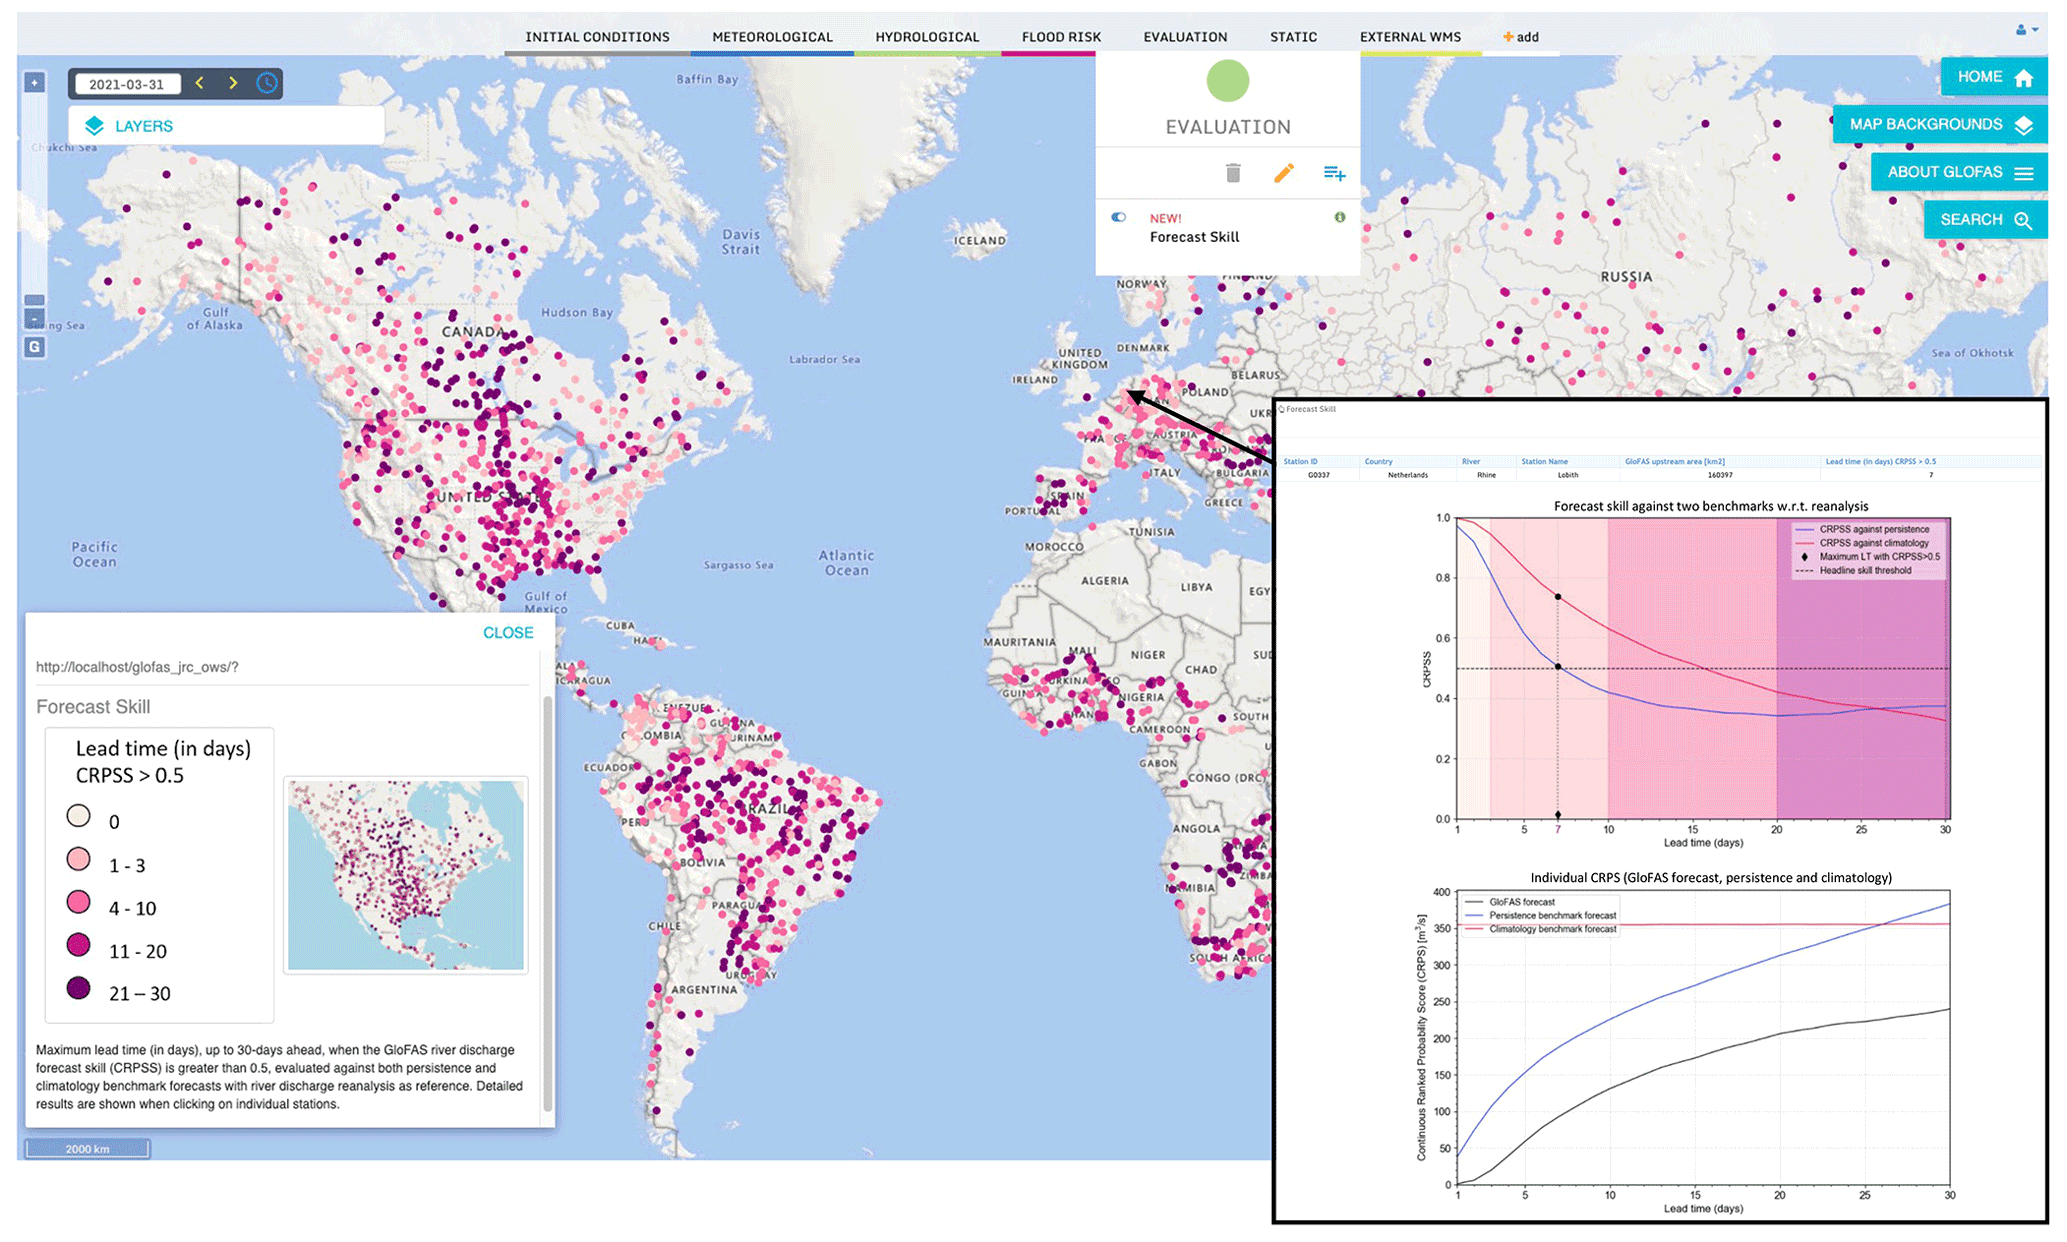
Figure 9GloFAS 30 d forecast skill layer for the headline score available on the GloFAS Web Map Viewer. The headline score is the maximum lead time (in days) the continuous ranked probability skill scores (CRPSS) is greater than a value of 0.5, evaluated against a persistence or climatology benchmark forecast. Clicking on each GloFAS reporting point, a “pop-out” window shows the detailed CRPSS and CRPS across all lead times. An example for the Rhine at Lobith (Netherlands, G0337) is shown in the inset.
Formal attribution of the drivers of high and low hydrological forecast skill is outside the scope of this study but results point to several areas to prioritise research and development into model improvements. First, improving GloFAS forecast performance in smaller catchments with more flashy hydrological response should be a priority. This finding is expected given the relatively coarse horizontal (∼11 km) and time (daily) resolution of a global-scale system such as GloFAS. A “hyperresolution” target in the order 1 km globally is required for hydrological prediction to be useful at local scales (Wood et al., 2011), but will bring computational, data, and hydrological science challenges (Harrigan et al., 2020b). Second, hydrological forecast skill is inherently dependent on global NWP model skill. Prediction of convective rainfall, dominant in the tropics, remains a challenge in the current generation of NWP, including the ECMWF IFS (∼18 km horizontal resolution for ENS) used to force GloFAS forecasts (Haiden et al., 2021; Lavers et al., 2021). Progress is, however, already underway. Recent increases in supercomputer power has allowed ground-breaking kilometre-scale NWP to be tested with promising results showing that deep convection can be explicitly simulated rather than parameterised as it is currently, thus providing better representation of convective storm activity (Wedi et al., 2020). Assessing the hydrological impact of any new precipitation improvement needs to be prioritised. Thirdly, hydrological prediction in regions with more challenging hydroclimate conditions needs further investigation, particularly snowy and icy catchments in polar regions where simplified snow accumulation and melt processes as well as rain-on-snow events are known to be highly sensitive to error (Fehlmann et al., 2019). From this first order assessment GloFAS forecast performance can drop considerably for many catchments in these regions. Therefore, more work is needed to investigate how existing and new representations of snow processes can deliver more skilful river discharge forecasts.
4.2 New GloFAS headline forecast skill layer on Web Map Viewer
To help the interpretation and understanding of the quality of GloFAS 30 d forecasts, the forecast skill scores produced in this paper are presented as new layer on the GloFAS Web Map Viewer since the release of GloFAS version 2.2 on 9 December 2020. Figure 9 shows a screenshot of the “Forecast skill” layer on the website. The new headline forecast skill score is defined as the maximum lead time (in days), up to 30 d ahead, in which the CRPSS is greater than a value of 0.5, when compared to a persistence or climatology benchmark forecast using GloFAS-ERA5 as proxy observations. A threshold of CRPSS = 0.5 is chosen for the summary layer to distinguish the lead time in which a station is “highly skilful” and is interpreted practically as the threshold at which the GloFAS forecast are 50 % more accurate than the respective benchmark forecast. The headline score is shown for the GloFAS reporting points. An example of the detailed skill information available for individual stations is shown for the Rhine at Lobith (Netherlands; G0337) in the inset of Fig. 9. The headline score for this station is at day 7, when the CRPSS against persistence drops below the 0.5 threshold. When the station is clicked on the web interface, a “pop-out” window appears and includes two plots, the CRPSS across the 30 d lead time and corresponding individual CRPS components. This will provide vital information for forecasters when conducting forecasting assessment during emergency situations.
4.3 Operational delivery of GloFAS data and metadata
The GloFAS global river discharge forecasts (real-time and reforecasts) and associated skill assessment analysis are provided free and openly by the European Commission Copernicus Emergency Management Service (CEMS). It follows the Copernicus open data policy that users shall have free, full, and open access to Copernicus Service Information. Users should, however, adhere to its terms and conditions available at https://www.globalfloods.eu/terms-of-service/ (last access: 3 December 2022).
The Copernicus Climate Change Service (C3S) Climate Data Store (CDS; https://cds.climate.copernicus.eu/cdsapp#!/home, last access: 3 December 2022) hosts numerous global and regional reanalysis and forecast products, generally in the form of gridded records for essential climate variables (ECVs), including river discharge data as a key terrestrial ECV. The CDS requires standardisation of data and metadata so that datasets are more useable and discoverable through the CDS metadata pages. Its website provides easy access to data through user-friendly download forms, as well as a CDS Python Application Programming Interface (API) to allow programmatic access to data. An innovative feature of the CDS is its “Toolbox”, which makes it easier to handle large volumes of data by allowing users to make custom applications, filter data by geographical region and date range, and finally present the data using maps and charts directly through the CDS cloud infrastructure.
The GloFAS real-time river discharge forecasts from 5 November 2019 until present are available on the CDS and updated operationally every day: https://cds.climate.copernicus.eu/cdsapp#!/dataset/cems-glofas-forecast?tab=overview (last access: 25 March 2022) (Zsoter et al., 2019). The GloFAS river discharge reforecasts for the period 1999 to 2018 are also available on the CDS and update ahead of each major model cycle release since version 2.2: https://cds.climate.copernicus.eu/cdsapp#!/dataset/cems-glofas-reforecast?tab=overview (last accessed: 25 March 2022) (Zsoter et al., 2020b). The CDS landing page for the GloFAS forecast dataset is shown in Fig. 10. The forecast data are available in two ways. The first is through the “Data Download” tab whereby users can manually select options in a form for which data they would like to download in either GRIB or NetCDF file format. Second, data can be retrieved through the dedicated Python CDS API; an example API retrieval script is shown in Fig. B1 for the forecast start date of 1 January 2022 for both the single control (CTL) forecast and 50 ensemble perturbed members out to a lead time of 30 d at 24 h steps and downloaded in NetCDF format. Note that users must register for a CDS account (for free) before gaining access. This landing page always provide access to the latest operational system, with the possibility to go through earlier versions in the archive when searching through past dates. For users interested in the raw forecast skill scores calculated in this paper, they are provided for all GloFAS diagnostic river points through the “Documentation” tab on the CDS as well as in Table S1. See Fig. 11 for an extract of the skill score information provided.
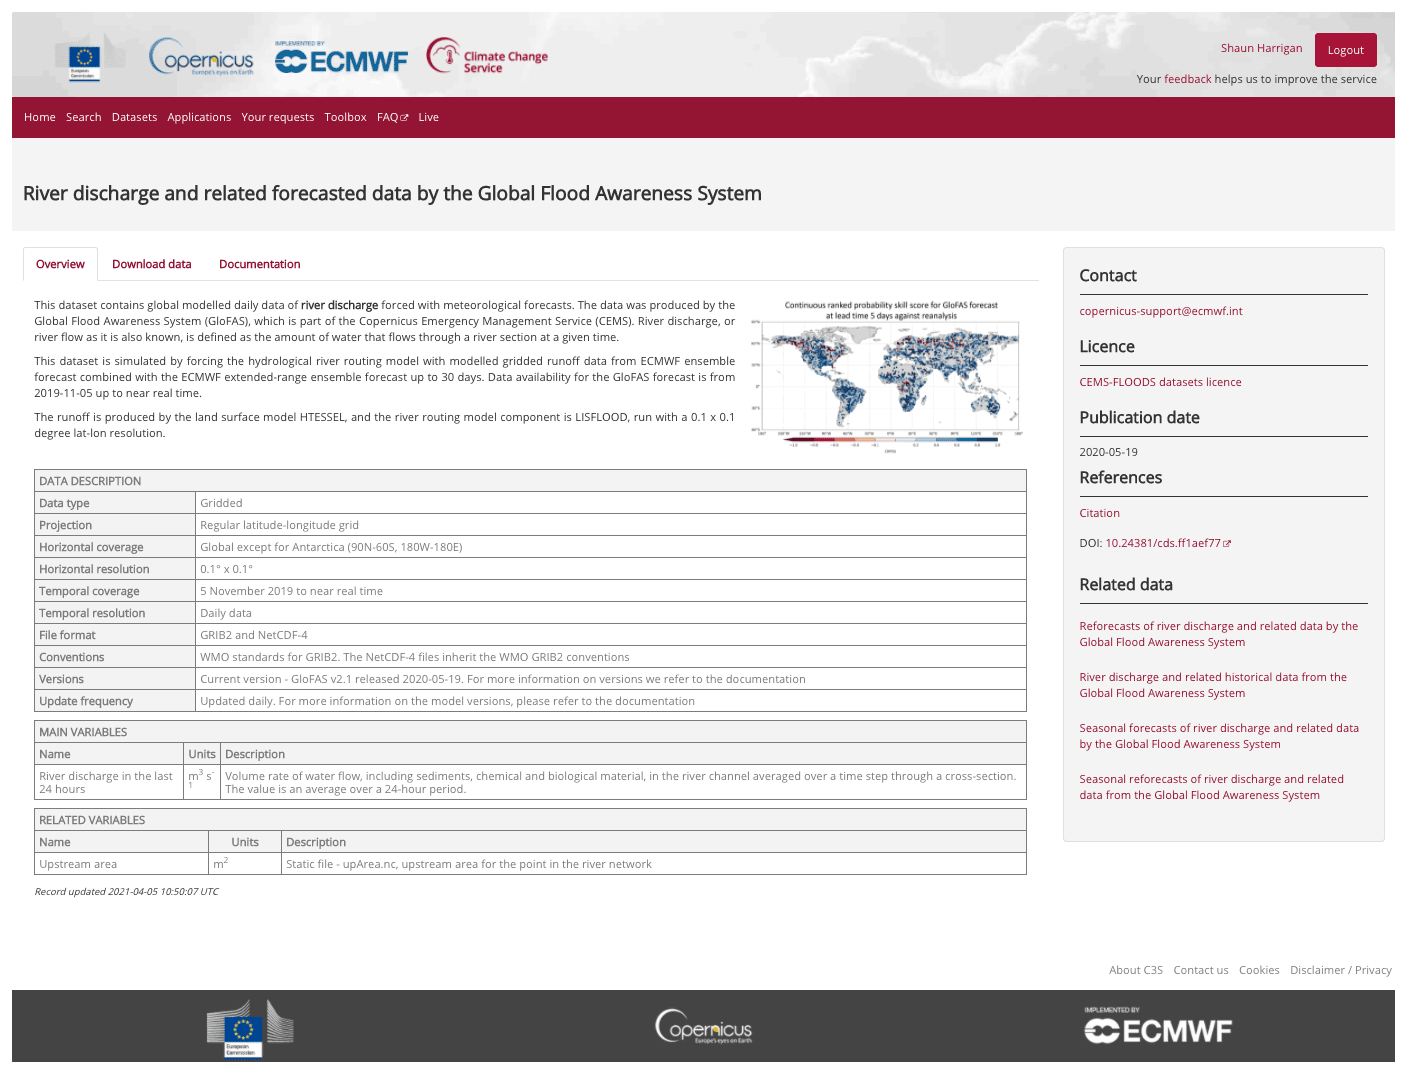
Figure 10The GloFAS river discharge forecast landing page on the C3SClimate Data Store (CDS: https://cds.climate.copernicus.eu/cdsapp#!/dataset/cems-glofas-forecast?tab=overview, last access: 3 December 2022).
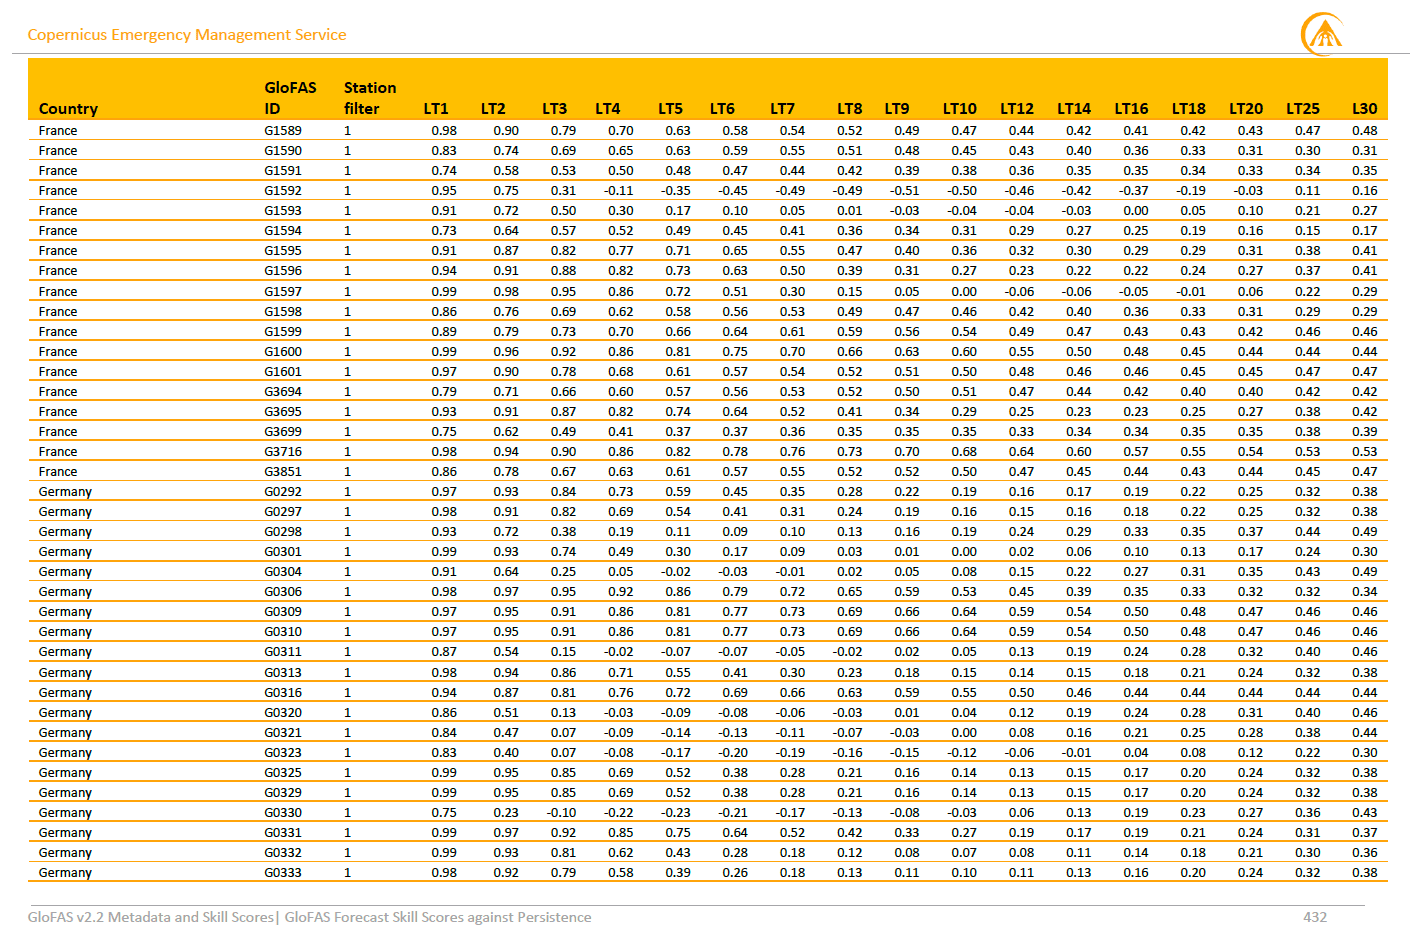
Figure 11Extract of GloFAS 2.1/2.2 river discharge forecast skill scores for CRPSS against persistence provided for a selection of lead times (LT) out to 30 d ahead as metadata information available through the Climate Data Store (CDS) documentation tab for each of the GloFAS diagnostic points as well as in Table S1.
While producing large sets of reforecasts and providing data free and open to the community has many benefits, it comes with challenges and key considerations. One of the main considerations is the data storage and delivery infrastructure. A full set of 20-year GloFAS reforecasts is ∼23 TB in size. For each new major model upgrade a new set of reforecasts are generated, together with ∼35 GB of raw data generated every day for the real-time forecast stream. It is clear that the size of data is a barrier for many users to use. Most users do not require the full temporal range of data and are usually interested in a sub-domain, for example their study region or country. It is simply not practical for every user to download ∼23 TB of global data to their computing infrastructure if they only want data for their individual catchment, not to mention if a standard laptop is the only computer available to them. Our solution was to store GloFAS data on the ECMWF Meteorological Archival and Retrieval System (MARS; https://confluence.ecmwf.int/display/UDOC/MARS+user+documentation, last access: 25 March 2022) – MARS offers the functionality for users to choose temporal and/or spatial subsets (among others) and the heavy data handling and computation happens on ECMWF infrastructure so the user can download a smaller and more manageable subset of data. The CDS is the public facing front end for users to access GloFAS data and metadata, and communicates with MARS in the backend. A further consideration is producing sufficient documentation for users to interact with the data and provision of a support service whereby users can get in contact with GloFAS data and domain experts for queries: https://confluence.ecmwf.int/site/support (last access: 25 March 2022).
4.4 Future directions
While this paper sets out the components, operational configuration, and a global forecast evaluation of GloFAS 2.1/2.2, the raw real-time forecast and reforecast data have been made openly available to encourage users to use the data for downstream value-added applications and to perform user-specific evaluation of forecast quality. Additionally, GloFAS forecasts and reforecasts have not been post-processed, therefore there is room for users to increase further forecast quality by applying post-processing with their local observations data to correct forecast bias or timing errors, for example. The evaluation carried out here looks at the overall quality of forecasts only. Future work should assess other aspects of forecast quality such as reliability (Robertson et al., 2013), value (Cloke et al., 2017) or performance during extreme events (Bischiniotis et al., 2019). The robust and comprehensive reforecast strategy established for this first evaluation will serve as benchmark against which any new major GloFAS model upgrades can be compared. The GloFAS release strategy now includes public availability and easy access to the river discharge reanalysis, real-time forecasts and reforecasts together with a first assessment of global forecast skill and will continue for all future major GloFAS launches. We recommend a similar strategy for all global- and continental-scale hydrological forecasting systems as release of data has traditionally been limited to historical data used for specific inter-comparisons in hydrological performance (e.g. Beck et al., 2017; Towner et al., 2019) rather than a comprehensive set of reforecasts or real-time forecasts. This will pave the way for multi-model forecast skill comparisons, such as those carried out routinely in the NWP field (for example, WMO Lead Centre for Deterministic NWP verification: https://apps.ecmwf.int/wmolcdnv/, last access: 13 October 2020).
It is now technically and computationally feasible to produce operational hydrological forecasting at the global scale. This offers enormous potential in aiding decision-making and humanitarian action in the face of large-scale and often transboundary flood events, as demonstrated by the application of GloFAS in recent floods such as those in Mozambique and Bangladesh. Nevertheless, up until now there have been limited information on hydrological forecast skill, both published in the scientific literature and available to users within the forecast web interface. This paper sets out the model components and operational configuration used in the production of GloFAS real-time forecasts and in the generation of the corresponding large-sample set of 20-year reforecasts. A comprehensive global ensemble forecast evaluation strategy was developed that included a sensitivity assessment on both persistence and climatology benchmark forecasts given the 30 d range of GloFAS (re)forecasts. Global forecast skill results show that GloFAS is skilful in over 93 % of catchments in the short (1 to 3 d) and medium range (5 to 15 d) against a persistence benchmark forecast and skilful in over 80 % of catchments out to the extended range (16 to 30 d) against a climatology benchmark forecast. However, the strength of skill varies considerably by location with GloFAS found to have no or negative skill at longer lead times in broad hydroclimatic regions in tropical Africa, western coast of South America, and catchments dominated by snow and ice in high northern latitudes. These results highlight to users where and when GloFAS is skilful and is a crucial piece of information in the forecast decision-making process and has been made available to forecasters as a new layer in the GloFAS Web Map Viewer since the service-only upgrade to version 2.2 as of 9 December 2020. The results are also useful for model development so that areas where GloFAS performs poorly can be further investigated and new model components designed and tested for improvements. An innovative feature of the GloFAS service development is providing the raw real-time forecast and reforecast data openly to encourage users to explore the data for downstream value-added applications and to perform user-specific and local evaluation of forecast quality.
Table A1Scientific papers and model documentation for the key GloFAS model components. Adapted from Harrigan et al. (2020a).
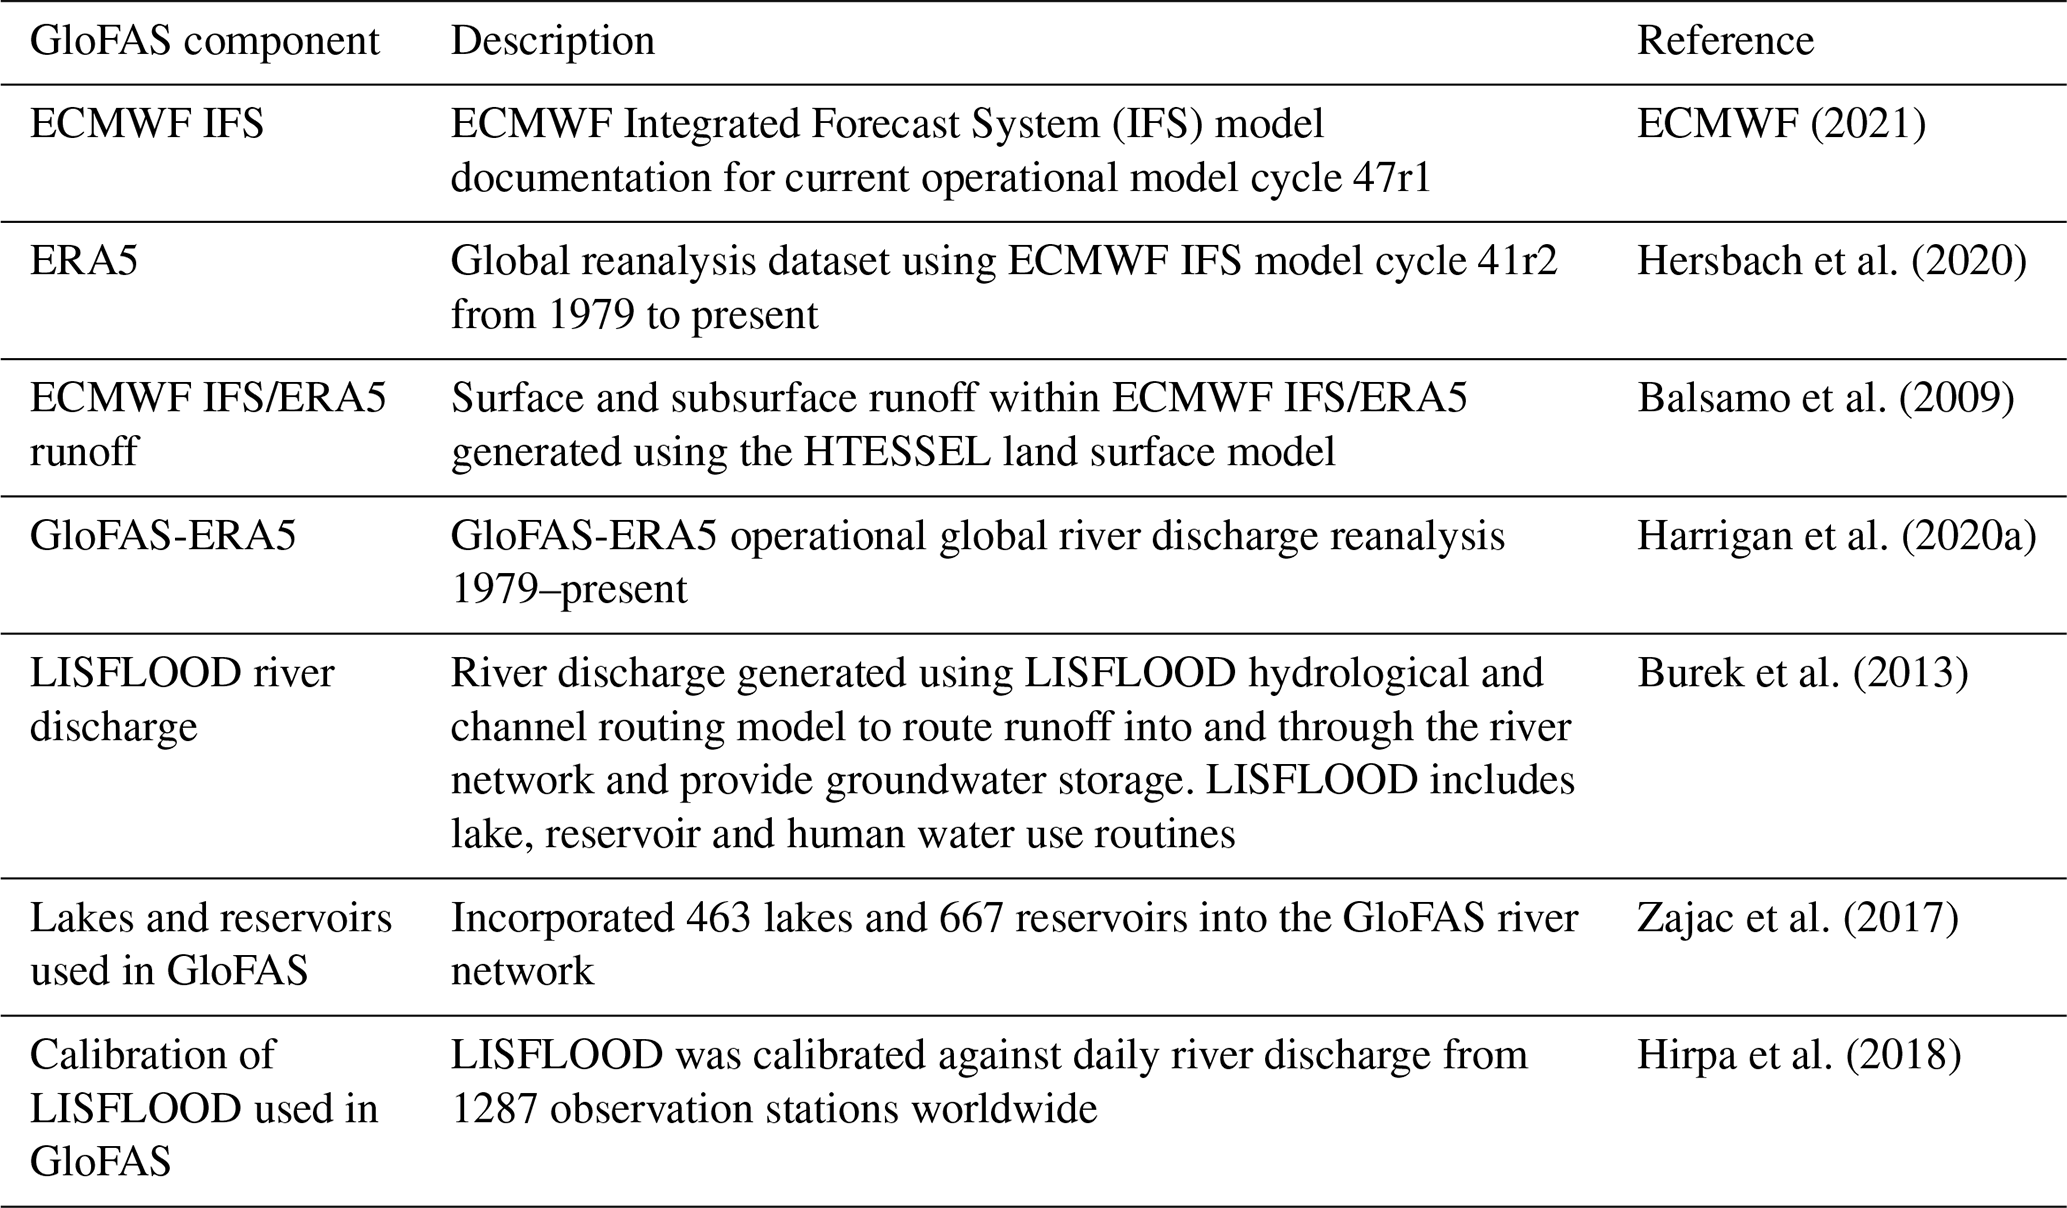
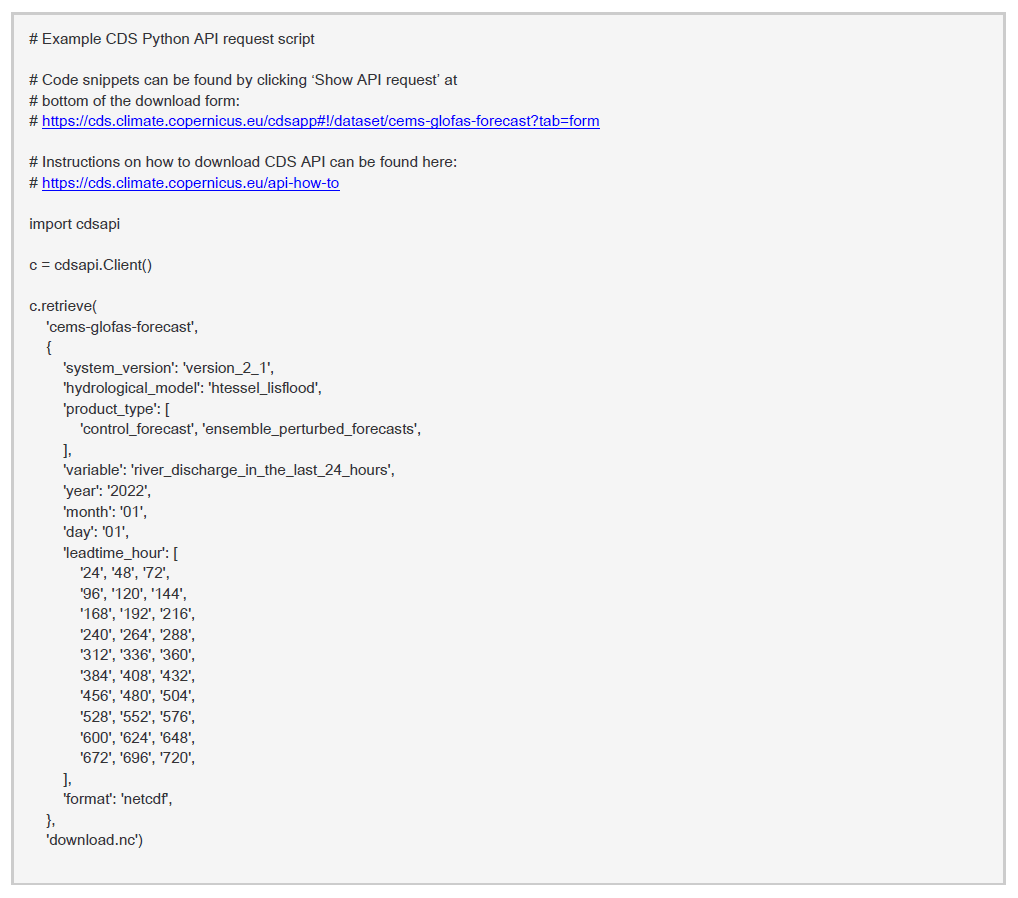
Figure B1Example Climate Data Store (CDS) Python API retrieval script for the GloFAS v2.1 daily river discharge forecast on 1 January 2022 for both the single control (CTL) forecast and 50 ensemble perturbed members out to a lead time of 30 d to be downloaded in NetCDF format.
The underlying code is available upon request from the corresponding author.
GloFAS-ERA5 v2.1 river discharge reanalysis data can be downloaded from the Copernicus Climate Data Store (CDS): https://doi.org/10.24381/cds.a4fdd6b9 (Harrigan et al., 2019). GloFAS v2.1 river discharge real-time forecast data can be downloaded from the Copernicus Climate Data Store (CDS): https://doi.org/10.24381/cds.ff1aef77 (Zsoter et al., 2019). GloFAS v2.2 river discharge reforecast data can be downloaded from the Copernicus Climate Data Store (CDS): https://doi.org/10.24381/cds.2d78664e (Zsoter et al., 2020b).
The supplement related to this article is available online at: https://doi.org/10.5194/hess-27-1-2023-supplement.
SH and CP designed the study. SH drafted the manuscript and performed the forecast evaluation. EZ developed the GloFAS suites to produce the reforecasts and real-time forecasts. HC and PS helped frame the paper. All co-authors contributed to the editing of the manuscript and to the discussion and interpretation of results.
The contact author has declared that none of the authors has any competing interests.
Publisher's note: Copernicus Publications remains neutral with regard to jurisdictional claims in published maps and institutional affiliations.
We thank Francesca Moschini and Karen O'Regan (both ECMWF) for their help with production of the forecast skill layer and metadata for the GloFAS Web Map Viewer and CDS, respectively; Christopher Barnard (ECMWF) for his help in integrating the real-time forecast and reforecast suits into operations; Corentin Carton De Wiart (ECMWF) for his help in implementing the forecast evaluation suite; and Iacopo Ferrario, Christopher Barnard, Fredrik Wetterhall, Sebastien Villaume and the wider CDS/MARS team at ECMWF for their work ingesting the GloFAS data into the CDS and MARS. We thank the water@reading team from the University of Reading who collaborate in the development and use of GloFAS in which many conversations and engagement with users have shaped the service evolution. Finally, we thank Berit Arheimer and four anonymous referees for their constructive feedback that has greatly improved this paper.
This research has been supported by the European Commission Copernicus Emergency Management Service (CEMS) (grant no. 198702).
This paper was edited by Jim Freer and reviewed by Berit Arheimer and four anonymous referees.
Alfieri, L., Burek, P., Dutra, E., Krzeminski, B., Muraro, D., Thielen, J., and Pappenberger, F.: GloFAS – global ensemble streamflow forecasting and flood early warning, Hydrol. Earth Syst. Sci., 17, 1161–1175, https://doi.org/10.5194/hess-17-1161-2013, 2013.
Alfieri, L., Pappenberger, F., Wetterhall, F., Haiden, T., Richardson, D., and Salamon, P.: Evaluation of ensemble streamflow predictions in Europe, J. Hydrol., 517, 913–922, https://doi.org/10.1016/j.jhydrol.2014.06.035, 2014.
Arheimer, B., Pimentel, R., Isberg, K., Crochemore, L., Andersson, J. C. M., Hasan, A., and Pineda, L.: Global catchment modelling using World-Wide HYPE (WWH), open data, and stepwise parameter estimation, Hydrol. Earth Syst. Sci., 24, 535–559, https://doi.org/10.5194/hess-24-535-2020, 2020.
Baker, D. B., Richards, R. P., Loftus, T. T., and Kramer, J. W.: A New Flashiness Index: Characteristics and Applications to Midwestern Rivers and Streams, J. Am. Water Resour. Assoc., 40, 503–522, https://doi.org/10.1111/j.1752-1688.2004.tb01046.x, 2004.
Balsamo, G., Beljaars, A., Scipal, K., Viterbo, P., van den Hurk, B., Hirschi, M., and Betts, A. K.: A Revised Hydrology for the ECMWF Model: Verification from Field Site to Terrestrial Water Storage and Impact in the Integrated Forecast System, J. Hydrometeorol., 10, 623–643, https://doi.org/10.1175/2008JHM1068.1, 2009.
Beck, H. E., Dijk, A. I. J. M. van, Roo, A. de, Dutra, E., Fink, G., Orth, R., and Schellekens, J.: Global evaluation of runoff from 10 state-of-the-art hydrological models, Hydrol. Earth Syst. Sci., 21, 2881–2903, https://doi.org/10.5194/hess-21-2881-2017, 2017.
Bischiniotis, K., van den Hurk, B., Zsoter, E., de Perez, E. C., Grillakis, M., and Aerts, J. C. J. H.: Evaluation of a global ensemble flood prediction system in Peru, Hydrolog. Sci. J., 64, 1171–1189, https://doi.org/10.1080/02626667.2019.1617868, 2019.
Blöschl, G., Hall, J., Parajka, J., Perdigão, R. A. P., Merz, B., Arheimer, B., Aronica, G. T., Bilibashi, A., Bonacci, O., Borga, M., Čanjevac, I., Castellarin, A., Chirico, G. B., Claps, P., Fiala, K., Frolova, N., Gorbachova, L., Gül, A., Hannaford, J., Harrigan, S., Kireeva, M., Kiss, A., Kjeldsen, T. R., Kohnová, S., Koskela, J. J., Ledvinka, O., Macdonald, N., Mavrova-Guirguinova, M., Mediero, L., Merz, R., Molnar, P., Montanari, A., Murphy, C., Osuch, M., Ovcharuk, V., Radevski, I., Rogger, M., Salinas, J. L., Sauquet, E., Šraj, M., Szolgay, J., Viglione, A., Volpi, E., Wilson, D., Zaimi, K., and Živković, N.: Changing climate shifts timing of European floods, Science, 357, 588–590, https://doi.org/10.1126/science.aan2506, 2017.
Blöschl, G., Hall, J., Viglione, A., Perdigão, R. A. P., Parajka, J., Merz, B., Lun, D., Arheimer, B., Aronica, G. T., Bilibashi, A., Boháč, M., Bonacci, O., Borga, M., Čanjevac, I., Castellarin, A., Chirico, G. B., Claps, P., Frolova, N., Ganora, D., Gorbachova, L., Gül, A., Hannaford, J., Harrigan, S., Kireeva, M., Kiss, A., Kjeldsen, T. R., Kohnová, S., Koskela, J. J., Ledvinka, O., Macdonald, N., Mavrova-Guirguinova, M., Mediero, L., Merz, R., Molnar, P., Montanari, A., Murphy, C., Osuch, M., Ovcharuk, V., Radevski, I., Salinas, J. L., Sauquet, E., Šraj, M., Szolgay, J., Volpi, E., Wilson, D., Zaimi, K., and Živković, N.: Changing climate both increases and decreases European river floods, Nature, 573, 108–111, https://doi.org/10.1038/s41586-019-1495-6, 2019.
Burek, P., van der Knijff, J. M., and de Roo, A. P. J. D.: LISFLOOD – Distributed Water Balance and Flood Simulation Model – Revised User Manual, Publications Office of the European Union, https://doi.org/10.2788/24719, 2013.
Cloke, H. L., Pappenberger, F., Smith, P. J., and Wetterhall, F.: How do I know if I've improved my continental scale flood early warning system?, Environ. Res. Lett., 12, 044006, https://doi.org/10.1088/1748-9326/aa625a, 2017.
Demargne, J., Wu, L., Regonda, S. K., Brown, J. D., Lee, H., He, M., Seo, D.-J., Hartman, R., Herr, H. D., Fresch, M., Schaake, J., and Zhu, Y.: The Science of NOAA's Operational Hydrologic Ensemble Forecast Service, B. Am. Meteorol. Soc., 95, 79–98, https://doi.org/10.1175/BAMS-D-12-00081.1, 2014.
Donegan, S., Murphy, C., Harrigan, S., Broderick, C., Foran Quinn, D., Golian, S., Knight, J., Matthews, T., Prudhomme, C., Scaife, A. A., Stringer, N., and Wilby, R. L.: Conditioning ensemble streamflow prediction with the North Atlantic Oscillation improves skill at longer lead times, Hydrol. Earth Syst. Sci., 25, 4159–4183, https://doi.org/10.5194/hess-25-4159-2021, 2021.
Donnelly, C., Andersson, J. C. M., and Arheimer, B.: Using flow signatures and catchment similarities to evaluate the E-HYPE multi-basin model across Europe, Hydrolog. Sci. J., 61, 255–273, https://doi.org/10.1080/02626667.2015.1027710, 2016.
ECMWF: IFS Documentation CY47R3, https://doi.org/10.21957/eyrpir4vj, 2021.
Emerton, R., Zsoter, E., Arnal, L., Cloke, H. L., Muraro, D., Prudhomme, C., Stephens, E. M., Salamon, P., and Pappenberger, F.: Developing a global operational seasonal hydro-meteorological forecasting system: GloFAS-Seasonal v1.0, Geosci. Model Dev., 11, 3327–3346, https://doi.org/10.5194/gmd-11-3327-2018, 2018.
Emerton, R., Cloke, H., Ficchi, A., Hawker, L., de Wit, S., Speight, L., Prudhomme, C., Rundell, P., West, R., Neal, J., Cuna, J., Harrigan, S., Titley, H., Magnusson, L., Pappenberger, F., Klingaman, N., and Stephens, E.: Emergency flood bulletins for cyclones Idai and Kenneth: A critical evaluation of the use of global flood forecasts for international humanitarian preparedness and response, Int. J. Disast. Risk Reduct., 50, 101811, https://doi.org/10.1016/j.ijdrr.2020.101811, 2020.
Emerton, R. E., Stephens, E. M., Pappenberger, F., Pagano, T. C., Weerts, A. H., Wood, A. W., Salamon, P., Brown, J. D., Hjerdt, N., Donnelly, C., Baugh, C. A., and Cloke, H. L.: Continental and global scale flood forecasting systems, Wiley Interdiscip. Rev. Water, 3, 391–418, https://doi.org/10.1002/wat2.1137, 2016.
Fehlmann, M., Gascón, E., Rohrer, M., Schwarb, M., and Stoffel, M.: Improving Medium-Range Forecasts of Rain-on-Snow Events in Prealpine Areas, Water Resour. Res., 55, 7638–7661, https://doi.org/10.1029/2018WR024644, 2019.
Girons Lopez, M., Crochemore, L., and Pechlivanidis, I. G.: Benchmarking an operational hydrological model for providing seasonal forecasts in Sweden, Hydrol. Earth Syst. Sci., 25, 1189–1209, https://doi.org/10.5194/hess-25-1189-2021, 2021.
Haiden, T., Janousek, M., Vitart, F., Ben-Bouallegue, Z., Ferranti, L., Prates, C., and Richardson, D.: Evaluation of ECMWF forecasts, including the 2020 upgrade, ECMWF, https://doi.org/10.21957/6njp8byz4, 2021.
Harrigan, S., Prudhomme, C., Parry, S., Smith, K., and Tanguy, M.: Benchmarking ensemble streamflow prediction skill in the UK, Hydrol. Earth Syst. Sci., 22, 2023–2039, https://doi.org/10.5194/hess-22-2023-2018, 2018.
Harrigan, S., Zsoter, E., Barnard, C., Wetterhall, F., Salamon, P., and Prudhomme, C.: River discharge and related historical data from the Global Flood Awareness System, v2.1, Copernicus Climate Change Service (C3S) Climate Data Store (CDS) [data set], https://doi.org/10.24381/cds.a4fdd6b9, 2019.
Harrigan, S., Zsoter, E., Alfieri, L., Prudhomme, C., Salamon, P., Wetterhall, F., Barnard, C., Cloke, H., and Pappenberger, F.: GloFAS-ERA5 operational global river discharge reanalysis 1979–present, Earth Syst. Sci. Data, 12, 2043–2060, https://doi.org/10.5194/essd-12-2043-2020, 2020a.
Harrigan, S., Cloke, H., and Pappenberger, F.: Innovating global hydrological prediction through an Earth system approach, WMO Bull., https://public.wmo.int/en/resources/bulletin/innovating-global-hydrological-prediction-through-earth-system (last access: 3 December 2022), 2020b.
Hersbach, H.: Decomposition of the Continuous Ranked Probability Score for Ensemble Prediction Systems, Weather Forecast., 15, 559–570, https://doi.org/10.1175/1520-0434(2000)015<0559:DOTCRP>2.0.CO;2, 2000.
Hersbach, H., Bell, B., Berrisford, P., Hirahara, S., Horányi, A., Muñoz-Sabater, J., Nicolas, J., Peubey, C., Radu, R., Schepers, D., Simmons, A., Soci, C., Abdalla, S., Abellan, X., Balsamo, G., Bechtold, P., Biavati, G., Bidlot, J., Bonavita, M., Chiara, G. D., Dahlgren, P., Dee, D., Diamantakis, M., Dragani, R., Flemming, J., Forbes, R., Fuentes, M., Geer, A., Haimberger, L., Healy, S., Hogan, R. J., Hólm, E., Janisková, M., Keeley, S., Laloyaux, P., Lopez, P., Lupu, C., Radnoti, G., de Rosnay, P. Rozum, I., Vamborg, F., Villaume, S., and Thépaut, J.-N.: The ERA5 Global Reanalysis, Q. J. Roy. Meteorol. Soc., 146, 1999–2049, https://doi.org/10.1002/qj.3803, 2020.
Hirpa, F. A., Salamon, P., Beck, H. E., Lorini, V., Alfieri, L., Zsoter, E., and Dadson, S. J.: Calibration of the Global Flood Awareness System (GloFAS) using daily streamflow data, J. Hydrol., 566, 595–606, https://doi.org/10.1016/j.jhydrol.2018.09.052, 2018.
Hossain, S., Prudhomme, C., Cloke, H., and Stephens, L.: GloFAS helps Bangladesh flood forecasters to predict monsoon flood, ECMWF Newslett., 165, 6–7, 2020.
Jolliffe, I. T. and Stephenson, D. B.: Forecast verification: a practitioner's guide in atmospheric science, John Wiley & Sons, ISBN 978-0-470-66071-3, 2012.
Lavers, D., Harrigan, S., Andersson, E., Richardson, D. S., Prudhomme, C., and Pappenberger, F.: A vision for improving global flood forecasting, Environ. Res. Lett., 14, 121002, https://doi.org/10.1088/1748-9326/ab52b2, 2019.
Lavers, D. A., Harrigan, S., and Prudhomme, C.: Precipitation Biases in the ECMWF Integrated Forecasting System, J. Hydrometeorol., 22, 1187–1198, https://doi.org/10.1175/JHM-D-20-0308.1, 2021.
Magnusson, L., Zsoter, E., Prudhomme, C., Baugh, C., Harrigan, S., Ficchi, A., Emerton, R., Cloke, H., Stephens, L. and Speight, L.: ECMWF works with universities to support response to tropical cyclone Idai, ECMWF Newslett., 160, 2–3, 2019
Pappenberger, F., Ramos, M. H., Cloke, H. L., Wetterhall, F., Alfieri, L., Bogner, K., Mueller, A., and Salamon, P.: How do I know if my forecasts are better? Using benchmarks in hydrological ensemble prediction, J. Hydrol., 522, 697–713, https://doi.org/10.1016/j.jhydrol.2015.01.024, 2015.
Quinn, D. F., Murphy, C., Wilby, R. L., Matthews, T., Broderick, C., Golian, S., Donegan, S., and Harrigan, S.: Benchmarking seasonal forecasting skill using river flow persistence in Irish catchments, Hydrolog. Sci. J., 66, 672–688, https://doi.org/10.1080/02626667.2021.1874612, 2021.
Robertson, D. E., Pokhrel, P., and Wang, Q. J.: Improving statistical forecasts of seasonal streamflows using hydrological model output, Hydrol. Earth Syst. Sci., 17, 579–593, https://doi.org/10.5194/hess-17-579-2013, 2013.
Thielen, J., Bartholmes, J., Ramos, M.-H., and de Roo, A.: The European Flood Alert System – Part 1: Concept and development, Hydrol. Earth Syst. Sci., 13, 125–140, https://doi.org/10.5194/hess-13-125-2009, 2009.
Towner, J., Cloke, H. L., Zsoter, E., Flamig, Z., Hoch, J. M., Bazo, J., Coughlan de Perez, E., and Stephens, E. M.: Assessing the performance of global hydrological models for capturing peak river flows in the Amazon basin, Hydrol. Earth Syst. Sci., 23, 3057–3080, https://doi.org/10.5194/hess-23-3057-2019, 2019.
UNDRR: Global Assessment Report 2015, Making Development Sustainable: The Future of Disaster Risk Management, UN Office for Disaster Risk Reduction, Geneva, ISBN 978921132042, 2015a.
UNDRR: Sendai Framework for Disaster Risk Reduction 2015–2030, United Nations Office for Disaster Risk Reduction, Geneva, Switzerland, https://www.undrr.org/publication/sendai-framework-disaster-risk-reduction-2015-2030 (last access: 3 December 2022), 2015b.
van der Knijff, J. M., Younis, J., and de Roo, A. P. J. D.: LISFLOOD: a GIS-based distributed model for river basin scale water balance and flood simulation, Int. J. Geogr. Inf. Sci., 24, 189–212, https://doi.org/10.1080/13658810802549154, 2010.
Vitart, F.: Evolution of ECMWF sub-seasonal forecast skill scores, Q. J. Roy. Meteorol. Soc., 140, 1889–1899, https://doi.org/10.1002/qj.2256, 2014.
Ward, P. J., Blauhut, V., Bloemendaal, N., Daniell, J. E., de Ruiter, M. C., Duncan, M. J., Emberson, R., Jenkins, S. F., Kirschbaum, D., Kunz, M., Mohr, S., Muis, S., Riddell, G. A., Schäfer, A., Stanley, T., Veldkamp, T. I. E., and Winsemius, H. C.: Review article: Natural hazard risk assessments at the global scale, Nat. Hazards Earth Syst. Sci., 20, 1069–1096, https://doi.org/10.5194/nhess-20-1069-2020, 2020.
Wedi, N. P., Polichtchouk, I., Dueben, P., Anantharaj, V. G., Bauer, P., Boussetta, S., Browne, P., Deconinck, W., Gaudin, W., Hadade, I., Hatfield, S., Iffrig, O., Lopez, P., Maciel, P., Mueller, A., Saarinen, S., Sandu, I., Quintino, T., and Vitart, F.: A Baseline for Global Weather and Climate Simulations at 1 km Resolution, J. Adv. Model. Earth Syst., 12, e2020MS002192, https://doi.org/10.1029/2020MS002192, 2020.
Wilks, D. S.: Statistical methods in the atmospheric sciences, Academic Press, ISBN 9780123850232, 2011.
Wood, E. F., Roundy, J. K., Troy, T. J., Beek, L. P. H. van, Bierkens, M. F. P., Blyth, E., Roo, A. de, Döll, P., Ek, M., Famiglietti, J., Gochis, D., Giesen, N. van de, Houser, P., Jaffé, P. R., Kollet, S., Lehner, B., Lettenmaier, D. P., Peters-Lidard, C., Sivapalan, M., Sheffield, J., Wade, A., and Whitehead, P.: Hyperresolution global land surface modeling: Meeting a grand challenge for monitoring Earth's terrestrial water, Water Resour. Res., 47, W05301, https://doi.org/10.1029/2010WR010090, 2011.
Zajac, Z., Revilla-Romero, B., Salamon, P., Burek, P., Hirpa, F. A., and Beck, H.: The impact of lake and reservoir parameterization on global streamflow simulation, J. Hydrol., 548, 552–568, https://doi.org/10.1016/j.jhydrol.2017.03.022, 2017.
Zsoter, E., Harrigan, S., Barnard, C., Wetterhall F., Salamon, P., and Prudhomme, C.: River discharge and related forecasted data from the Global Flood Awareness System, v2.1, Copernicus Climate Change Service (C3S) Climate Data Store (CDS) [data set], https://doi.org/10.24381/cds.ff1aef77, 2019.
Zsoter, E., Prudhomme, C., Stephens, E., Pappenberger, F., and Cloke, H.: Using ensemble reforecasts to generate flood thresholds for improved global flood forecasting, J. Flood Risk Manage., 13, e12658, https://doi.org/10.1111/jfr3.12658, 2020a.
Zsoter, E., Harrigan, S., Barnard, C., Blick, M., Ferrario, I., Wetterhall F., and Prudhomme, C.: Reforecasts of river discharge and related data by the Global Flood Awareness System, v2.2, Copernicus Climate Change Service (C3S) Climate Data Store (CDS) [data set], https://doi.org/10.24381/cds.2d78664e, 2020b.
- Abstract
- Introduction
- GloFAS components, configuration and data
- Global forecast skill evaluation method
- Results and discussion
- Conclusion
- Appendix A
- Appendix B
- Code availability
- Data availability
- Author contributions
- Competing interests
- Disclaimer
- Acknowledgements
- Financial support
- Review statement
- References
- Supplement