the Creative Commons Attribution 4.0 License.
the Creative Commons Attribution 4.0 License.
 | 11 Feb 2022
Influence of initial soil moisture in a regional climate model study over West Africa – Part 2: Impact on the climate extremes
Brahima Koné
Adama Diawara
Sandrine Anquetin
N'datchoh Evelyne Touré
Adama Bamba
Arsene Toka Kobea
The influence of soil moisture initial conditions on the climate extreme indices over West Africa was investigated using the fourth generation of the International Centre for Theoretical Physics regional climate model (non-hydrostatic) coupled with version 4.5 of the Community Land Model (RegCM4–CLM4.5) at a 25 km spatial resolution. We initialized the control experiments with the reanalysis soil moisture data from the European Centre for Medium-Range Weather Forecasts (ECMWF) reanalysis of the 20th century (ERA-20C), while we initialized the dry and wet experiments with the maximum and minimum soil moisture values over the West Africa domain, respectively. For each experiment, an ensemble of five runs was performed for 5 years (2001–2005) with soil moisture initial conditions for the runs prescribed on 1 June and the simulations being performed over 4 months (122 d) from June to September. The performance of RegCM4–CLM4.5 with respect to simulating the 10 extreme rainfall and temperature indices used in this study is presented. The results are then discussed for the two idealized simulations that are most sensitive to the dry and wet soil moisture initial conditions in order to highlight the impacts beyond the limits of soil moisture internal forcing in the model. Over the Central Sahel, dry (wet) experiments lead to a decrease (increase) in precipitation extreme indices related to the number of events, but this was not seen for indices related to the intensity of the events. Soil moisture initial conditions unequally affect the daily minimum and maximum temperatures. The strongest impact is found on the maximum temperature: wet (dry) experiments decrease (increase) the maximum temperature over the whole region. Over the Central Sahel, wet (dry) experiments lead to a decrease (increase) in the maximum values of the minimum temperature.
- Article
(3228 KB) - Full-text XML
- Companion paper
- BibTeX
- EndNote


West Africa experienced large rainfall variability during the late 1960s. This variability often leads to flooding events, severe drought and regional heat waves, which have major economic, environmental and societal impacts (Easterling et al., 2000; Larsen, 2003). In recent years, climate extremes have attracted much interest because they are expected to occur more frequently (International Panel on Climate Change – IPCC, 2013) than changes in the mean climate. Yan and Yang (2000) showed that extreme climate changes were 5–10 times greater than climate mean change in many cases. Many key factors or physical mechanisms could be the cause of the increase in climate extremes (Nicholson, 1980; Le Barbé et al., 2002), such as the effect of increasing greenhouse gases in the atmosphere on the intensification of hot extremes (IPCC, 2007), sea surface temperature (SST) anomalies (Fontaine and Janicot, 1996; Folland et al., 1986) and land surface conditions (Philippon et al., 2005; Nicholson, 2000). In addition, smaller-scale physical processes, including the interactions of land–atmosphere coupling, can lead to changes in climate extremes. Jaeger and Seneviratne (2011) studied the influence of soil moisture on land–atmosphere coupling during the European summer using a regional climate model with a focus on the extremes and trends in precipitation and temperature. For extreme temperatures, their study showed that interactions between soil moisture and climate have a significant impact, whereas they only influence the frequency of wet days for extreme precipitation. Over Asia, Liu et al. (2014) studied the impact of soil moisture anomalies on subsequent precipitation and temperature using a regional climate model. They showed that numerical wet (dry) experiments decrease (increase) the hot extremes, decrease (increase) the drought extremes and increase (decrease) the cold extremes in a zone with strong soil moisture–atmospheric coupling. However, none of these studies examined the impacts of the soil moisture initial conditions on subsequent climate extremes using a regional climate model over West Africa. In Part 1 (Konë et al., 2022) of this study, the influence of initial soil moisture on the climate mean was based on a performance assessment of the fourth generation of the International Centre for Theoretical Physics regional climate model coupled with the complex Community Land Model (RegCM4–CLM4.5) performed by Koné et al. (2018), who validated the ability of the model to reproduce the climate mean. However, in this paper (Part 2), prior to studying the influence of initial soil moisture on climate extremes, it was necessary to assess the performance of RegCM4–CLM4.5 with respect to simulating the 10 temperature indices and extreme rainfall events used in this work. This has never been done before in Africa; therefore, we separated the work in two parts. This paper is organized as follows: Sect. 2 describes the RegCM4 model, the experimental design and the methodology used in this study; Sect. 3 presents the assessment of RegCM4–CLM4.5 with respect to extreme climate simulation and the impacts of the soil moisture initial conditions on climate extremes; and Sect. 4 documents the conclusions.
2.1 Model description and numerical experiments
The fourth generation of the International Centre for Theoretical Physics (ICTP) regional climate model (RegCM4) is used in this study. Since this version, physical representations have been subject to a continuous process of implementation and development. The release used in this study was RegCM4.7. The non-hydrostatic dynamical core of the MM5 (Mesoscale Model version 5; Grell et al., 1994) was ported to RegCM4 while maintaining the existing hydrostatic core. RegCM4 is a limited-area model using a vertical grid sigma hydrostatic pressure coordinate and a horizontal grid of the Arakawa B-grid (Giorgi et al., 2012). The radiation scheme is from the National Center for Atmospheric Research (NCAR) Community Climate Model version 3 (CCM3) (Kiehl et al., 1996), and the aerosol representation is from Zakey et al. (2006) and Solmon et al. (2006). The large-scale precipitation scheme used in this study is from Pal et al. (2000); the moisture scheme is called the SUBgrid EXplicit moisture scheme (SUBEX) and considers the sub-grid variability in clouds. The accretion and evaporation processes for stable precipitation are from Sundqvist et al. (1989). The sensible heat and water vapor in the planetary boundary layer over land and ocean as well as the turbulent transport of momentum are reported by Holtslag et al. (1990). The heat and moisture as well as the momentum of ocean surface fluxes are from Zeng et al. (1998). Convective precipitation and land surface processes in RegCM4.7 are represented by several options. Based on Koné et al. (2018), the convective scheme of Emanuel (1991) is used. The parameterization of land surface processes is from CLM4.5 (Oleson et al., 2013). In each grid cell of CLM4.5, there are 16 different plant functional types (PFTs) and 10 soil layers (Lawrence et al., 2011; Wang et al., 2016). The integration of RegCM4 over the West Africa domain is shown in Fig. 1 with 18 vertical levels and a 25 km horizontal resolution (182×114 grid points; from 20∘ W to 20∘ E and from 5∘ S to 21∘ N). The European Centre for Medium-Range Weather Forecasts (ECMWF) ERA-Interim reanalysis (EIN75; Uppala et al., 2008; Simmons et al., 2007) provides the initial and boundary conditions. The sea surface temperatures are derived from the National Oceanic and Atmosphere Administration Optimal Interpolation weekly (NOAA OI_WK) (Reynolds and Smith, 1994). The topography is derived from the United States Geological Survey (USGS) Global Multi-resolution Terrain Elevation Data (GMTED; Danielson and Gesch, 2011) at a spatial resolution of 30 arcsec, which is an update of the Global Land Cover Characterization (GTOPO; Loveland et al., 2000) dataset.
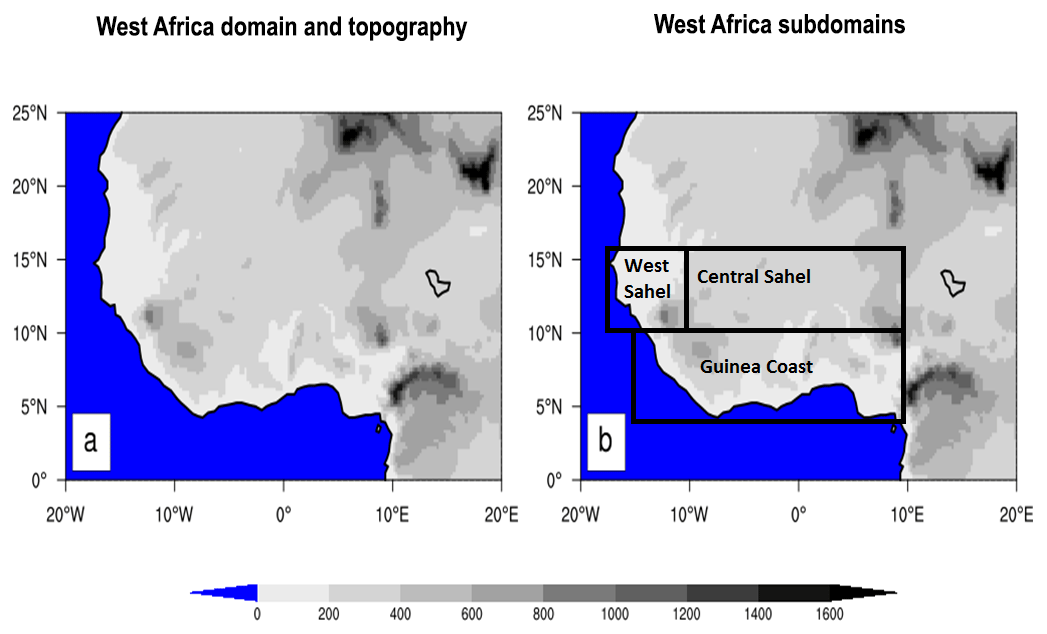
Figure 1Topography of the West Africa domain. The analysis of the model results has an emphasis on the whole West Africa domain and the three subregions, Guinea coast, Central Sahel and West Sahel, which are marked with black boxes.
We used the soil moisture from the ECMWF reanalysis of the 20th century (ERA-20C) to initialize the control runs. Wet and dry experiments were initialized for the soil moisture at the maximum (0.489 m3 m−3) and minimum ( m3 m−3) soil moisture values over West Africa derived from the ERA-20C soil moisture dataset. We designed three experiments (reference, wet and dry), each with an ensemble of five simulations (2001, 2002, 2003, 2004 and 2005) starting from 1 June to 30 September. The difference between these three experiments is the change in the initial soil moisture conditions (reference initial soil moisture condition, wet initial soil moisture condition and dry initial soil moisture condition) during the first day of the simulation over the West Africa domain. We then selected the 2 years most affected by the wet and dry initial soil moisture conditions (2003 and 2004) to estimate the limits of the impact of the internal soil moisture forcing on the new non-hydrostatic dynamic core of RegCM4.
For the 2 years most sensitive to soil moisture initial conditions, a Student t test is used to compare the significance of changes in climate extreme indices between a wet or dry sensitivity test (sample 1) and the control (sample 2), under the assumption that this method performs well for climate simulations (Damien et al., 2014) and knowing that it is extensively used for climatological analysis (Menédez et al., 2019; Takahashi and Polcher, 2019). In this study, a t test at the 95 % confidence level was used to define statistical significance.
2.2 Validation datasets and evaluation metrics
Our investigation focused on the air temperature at 2 m and the precipitation over the West Africa domain during the June–July–August–September (JJAS) period for 2003 and 2004. The simulated precipitation fields were validated with the high-resolution 0.05∘ Climate Hazards Group InfraRed Precipitation Station (CHIRPS) dataset from the University of California at Santa Barbara, available from 1981 to 2020. We used CHIRPS as a reference in this study mainly because it has been widely assessed and used for the study of extreme events in West Africa by Bichet and Diedhiou (2018a, b) and Didi et al. (2020).
We validated the 2 m temperature using the National Oceanic and Atmospheric Administration (NOAA) Climate Prediction Center (CPC) daily maximum and minimum global surface air temperature. The NOAA/CPC global daily surface 2 m air temperature (CPC-T2m) is a land-only gridded global daily maximum (Tmax) and minimum (Tmin) temperature analysis from 1979 to the present, available at two spatial resolutions: 10 min × 10 min and (latitude × longitude). This product provides an observational T2m estimate for climate monitoring, model evaluation and forecast verification (Fan and van den Dool, 2008; Pan et al., 2019). In this study, the daily Tmax and Tmin are used at a spatial resolution of . To compare the model simulations with the observation datasets, we regridded all the products to using a bilinear interpolation method (Nikulin et al., 2012).
The performance of RegCM4–CLM4.5 with respect to simulating the extreme indices is evaluated using four selected subregions (Fig. 1), based on the previous work of Koné et al. (2018), that correspond to different annual precipitation cycle features. We used the mean bias (MB), which captures the small-scale differences between the simulations and observations. The pattern correlation coefficient (PCC) is also used as a spatial correlation between model simulations and observations to indicate the large-scale similarity degree.
To quantify the impact of soil moisture initial conditions on climate extremes over Asia, Liu et al. (2014) used the MBs of five subregions. In our study, we used the MBs and the probability density functions (PDFs; Gao et al., 2016; Jaeger and Seneviratne, 2011) for this purpose in order to better capture the number of grid points impacted by initial soil moisture as well as their highest value.
2.3 Extreme rainfall and temperature indices
In this study, we investigated the changes in precipitation and temperature in terms of duration, occurrence and intensity of six extreme rainfall and four extreme temperature indices using daily rainfall and daily minimum and maximum temperature data (Table 1). These 10 extreme indices are recommended by the Expert Team on Climate Change Detection and Indices (ETCCDI; Peterson et al., 2001).

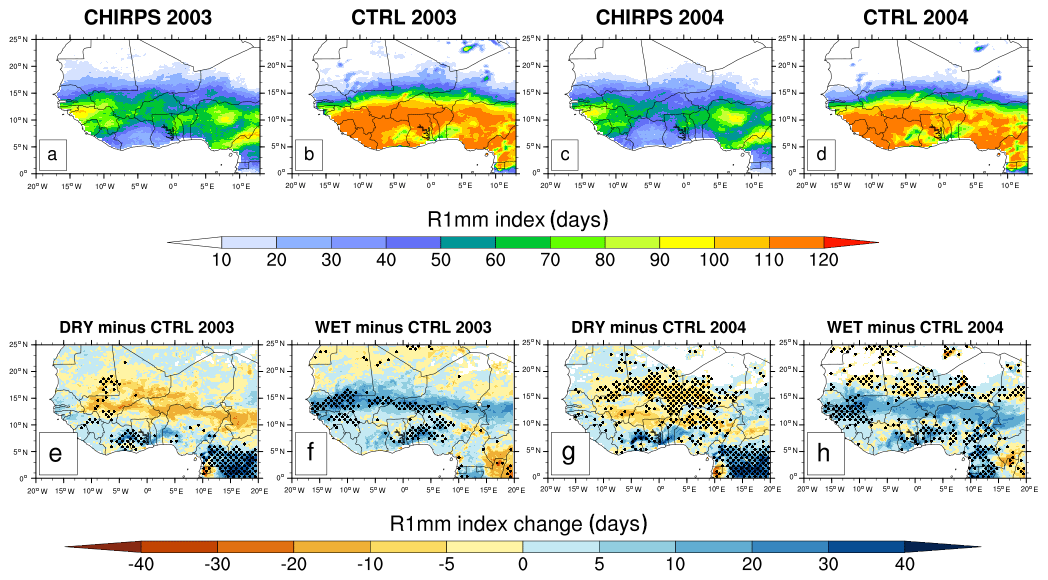
Figure 2Mean values of the number of the wet days (R1mm index in days) from CHIRPS (a, c) observations for JJAS 2003 and JJAS 2004 and the simulated control (CTRL) experiments (b, d) initialized with initial soil moisture values from the ERA-20C reanalysis (top row) and changes in R1mm index in days (bottom row) for JJAS 2003 and JJAS 2004, from dry (e, g) and wet (f, h) experiments with respect to the control experiments. Areas with values passing the 95 % significance test are dotted.
3.1 Seasonal extreme rainfall
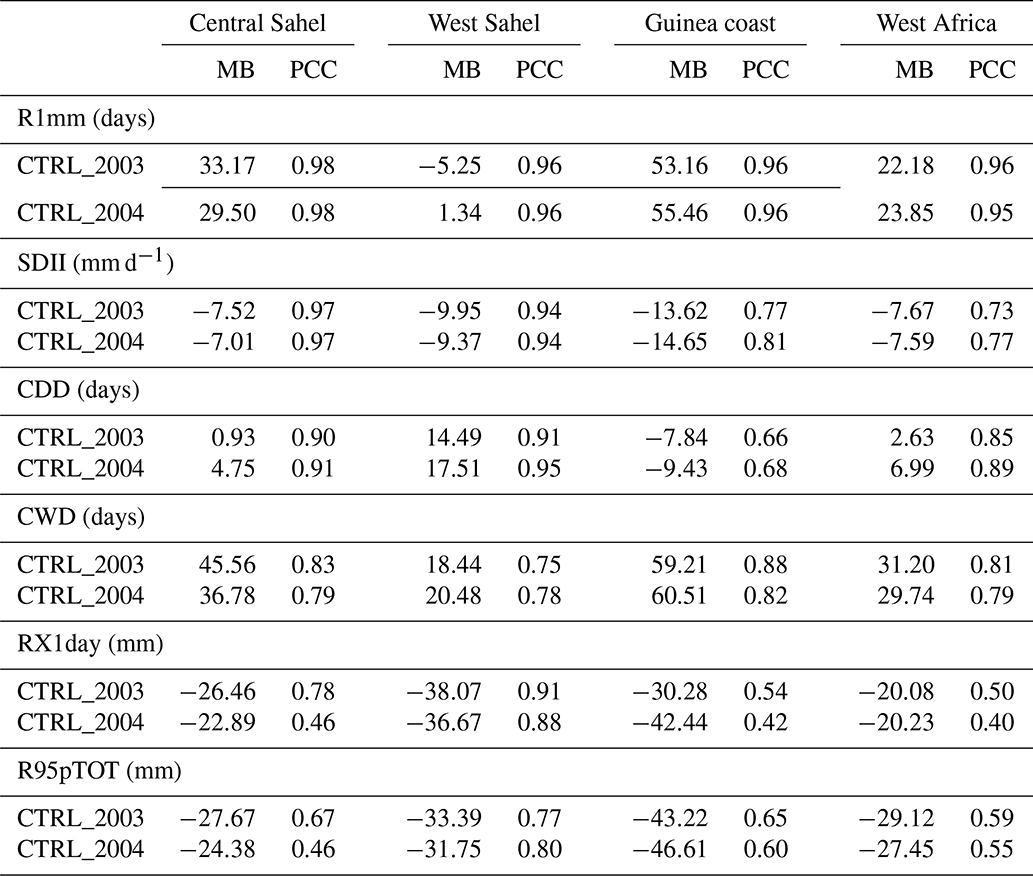
In this section, we analyzed six extreme rainfall indices based on daily precipitation in RegCM4 simulations over West Africa. All precipitation indices were calculated for JJAS in 2003 and 2004. Table 2 summarizes the PCC and MB values of all of the precipitation indices studied in this section for simulations obtained from control experiments with respect to CHIRPS observations calculated for the West Sahel, Central Sahel, Guinea coast and entire West Africa domains during the JJAS 2003 and JJAS 2004 runs.
Table 2The pattern correlation coefficient (PCC) and the mean bias (MB) of the R1mm (in days), SDII (in mm d−1), CDD (in days), CWD (in days), RX1day (in mm) and R95pTOT (in mm) indices for control experiments (initialized with initial soil moisture values from the ERA-20C reanalysis) with respect to CHIRPS calculated over the Guinea coast, Central Sahel, West Sahel and entire West Africa domains for JJAS 2003 and JJAS 2004.
3.1.1 The number of the wet days (R1mm)
Figure 2 shows the mean values of the number of wet days (R1mm, in days) from CHIRPS observations (Fig. 2a, c) and the simulated control experiments (Fig. 2b, d) with the initial soil moisture derived from the ERA-20C reanalysis. The R1mm index maximum values of up to 100 d in CHIRPS observations are found over mountainous regions such as the Cameroon Mountains, Jos Plateau and Guinea Highlands, whereas minimum values of less than 50 d are found over the Sahel and along the coastline from Liberia to Ghana, with the number of wet days decreasing gradually from south to north.
The control experiments (Fig. 2b, d) reproduce the large-scale pattern of the observed rainfall well, with PCC values of 0.96 and 0.95 for the JJAS 2003 and JJAS 2004 runs, respectively (Table 2), over the entire West Africa domain, but they exhibit some spatial extent and magnitude biases at the local scale. The control experiments display a large and quite homogeneous area of maximum R1mm index values below 12∘ N latitude and overestimate the number of wet days over most of the study domains (Table 2). The largest MBs are found over the Guinea coast, with MB values of more than 53.16 and 55.46 d for the JJAS 2003 and JJAS 2004 runs, respectively (Table 2). This overestimation of the number of wet days in RegCM4 is also found by Thanh et al. (2017) with RegCM4 for Asia.
Figure 2 (bottom row) displays additional changes in the R1mm index for JJAS 2003 and JJAS 2004 from the dry (Fig. 2e, g) and wet experiments (Fig. 2f, h) compared with the control experiments; the dotted area shows changes with statistical significance at the 95 % level. The dry experiments (Fig. 2e, g) decrease the R1mm index values, whereas the wet experiments (Fig. 2h, j) increase them, especially over the Central Sahel. However, over the Guinea coast subregion, both wet and dry experiments show a significant increase in R1mm index values.
For a better quantitative evaluation, Fig. 3 displays the PDF distributions of changes in R1mm over the subdomains (Fig. 1) during the JJAS 2003 and JJAS 2004 runs, and Table 3 summarizes the maximum PDF values. The results essentially confirm the linear impact found over the Central Sahel (Fig. 3a). Over the West Sahel, the Guinea coast and the West Africa domain (Fig. 3b–d), both dry and wet experiments increase the R1mm index values. The strongest R1mm increase is found in wet experiments over the West Sahel, with a maximum change of about 12 d in JJAS 2003 (Table 3), whereas the strongest R1mm decrease is found for dry experiments over the Central Sahel, with a maximum change of about −5.19 d (Table 3).
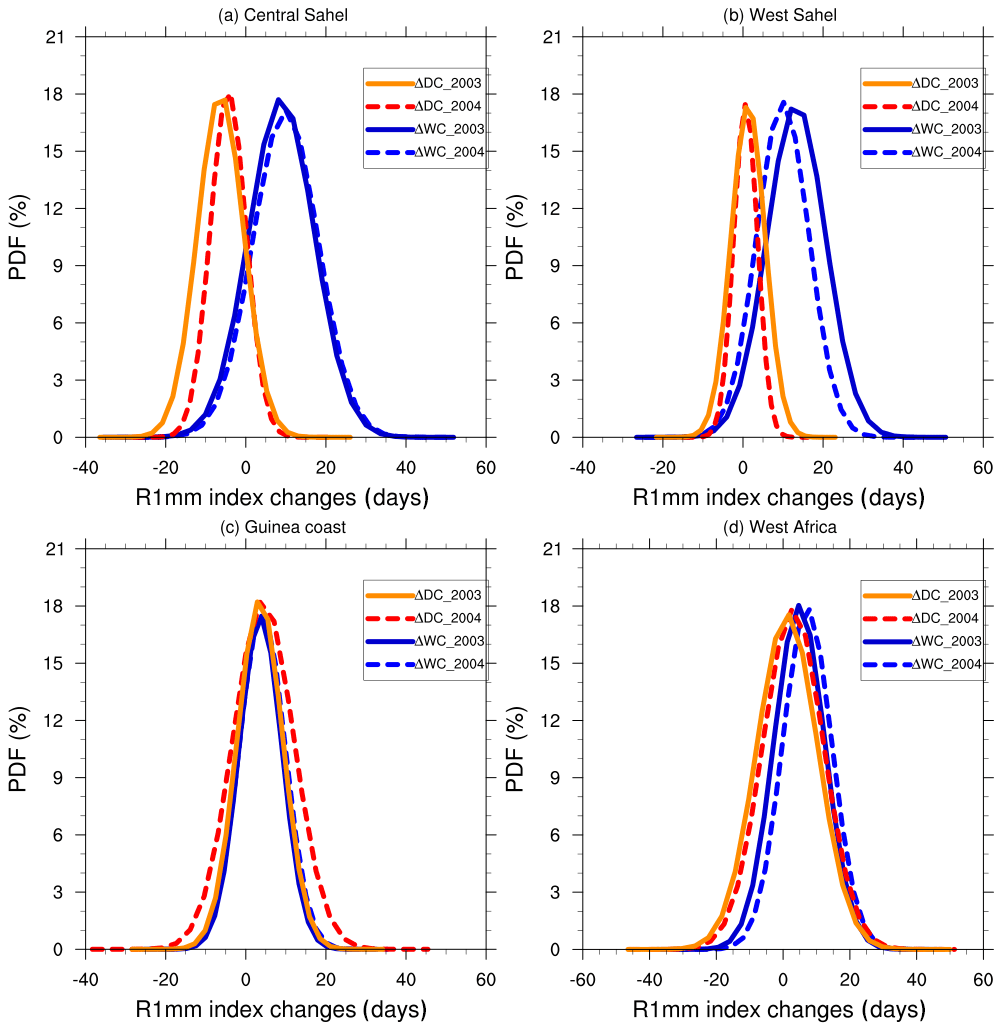
Figure 3PDF distributions (%) of mean values of the changes in the number of the wet days in JJAS 2003 and JJAS 2004 over the (a) Central Sahel, (b) West Sahel, (c) Guinea coast and (d) West Africa domains derived from dry (ΔDC) and wet (ΔWC) experiments with respect to the control experiment.
Table 3Summary of the maximum values of change in PDFs for the R1mm, SDII, CDD, CWD, RX1day and R95pTOT indices. Values in bold indicate regions with the largest changes in maximum values for the dry and wet experiments.
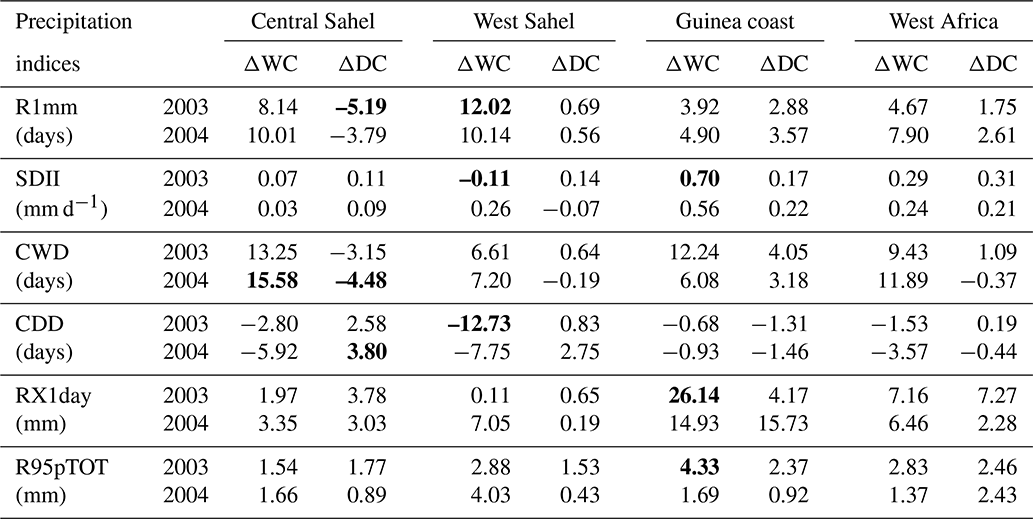
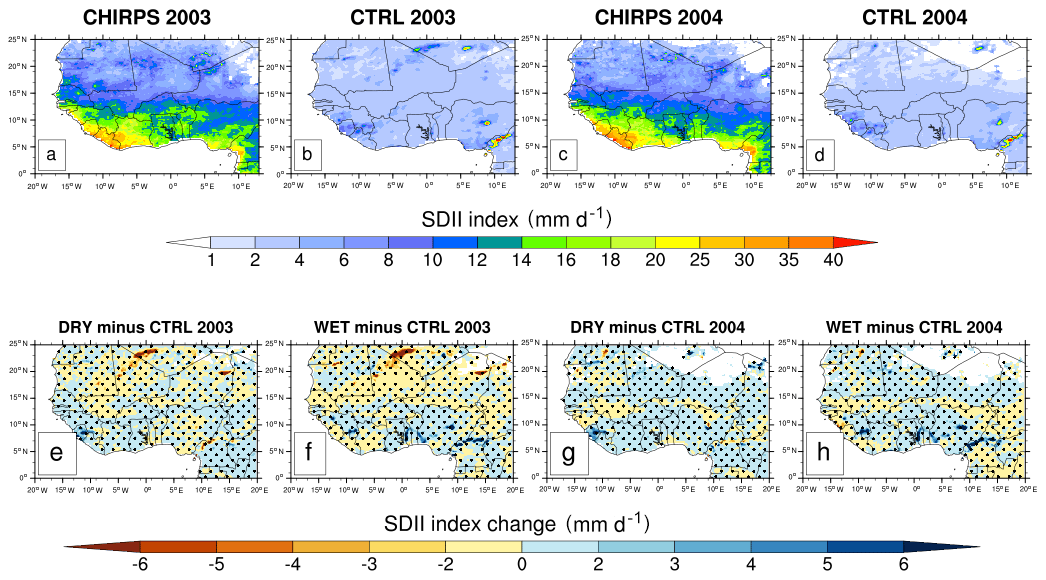
Figure 4Same as Fig. 2 but for the SDII index (in mm d−1).
Summarizing the results of this section, RegCM4 overestimated the number of wet days over most of the study domains. Over the Central Sahel, wet and dry experiments both lead to a linear impact on the R1mm index with an increase and a decrease in the number of rainy days, respectively. These results are compatible with previous work that sustained a strong land–atmosphere coupling in transition areas between wet and dry climate regimes (Zhang et al., 2011; Koster et al., 2006).
3.1.2 Simple daily intensity index (SDII)
In this section, we analyze the SDII index (rainfall intensity, in mm d−1), which gives the mean amount of precipitation on total wet days (daily precipitation > 1 mm). Figure 4 (top row) is the same as Fig. 2 (top row) but for the rainfall intensity. Over the Guinea coast coastline, CHIRPS observations (Fig. 4a, c) depicted the highest SDII index values (more than 25 mm d−1), whereas, CHIRPS observations showed large extend SDII index values (not exceeding 12 mm d−1) over the Sahel and Sahara in both the JJAS 2003 and JJAS 2004 runs.
The control experiments (Fig. 4b, d) reproduced the large-scale pattern of CHIRPS well, with PCC values reaching 0.73 and 0.77 over the West Africa domain in the respective JJAS 2003 and JJAS 2004 runs (Table 2). However, at the local scale, some biases are found. Over most of the study domains, the magnitude of the SDII is underestimated and does not exceed 10 mm d−1, except over the Cameroon Mountains (Fig. 4b, d). The largest MB values were located over the Guinea coast, with MB values greater than −13.62 and −14.65 mm d−1 for the JJAS 2003 and JJAS 2004 runs, respectively (Table 2).
Figure 4 (bottom row) is the same as Fig. 2 (bottom row) but for the rainfall intensity. Unlike the R1mm index, changes in the SDII index due to soil moisture initial conditions are not linear over most of the study domains. Figure 4 (bottom row) shows that the impacts of dry and wet experiments on rainfall intensity generally present areas of increase and decrease over most of the subdomains studied.
Figure 5 displays PDFs of changes in the SDII, as in Fig. 3. The PDFs show a maximum change value centered approximately on zero (Table 3), indicating that changes in the rainfall intensity for wet and dry experiments are not significant.
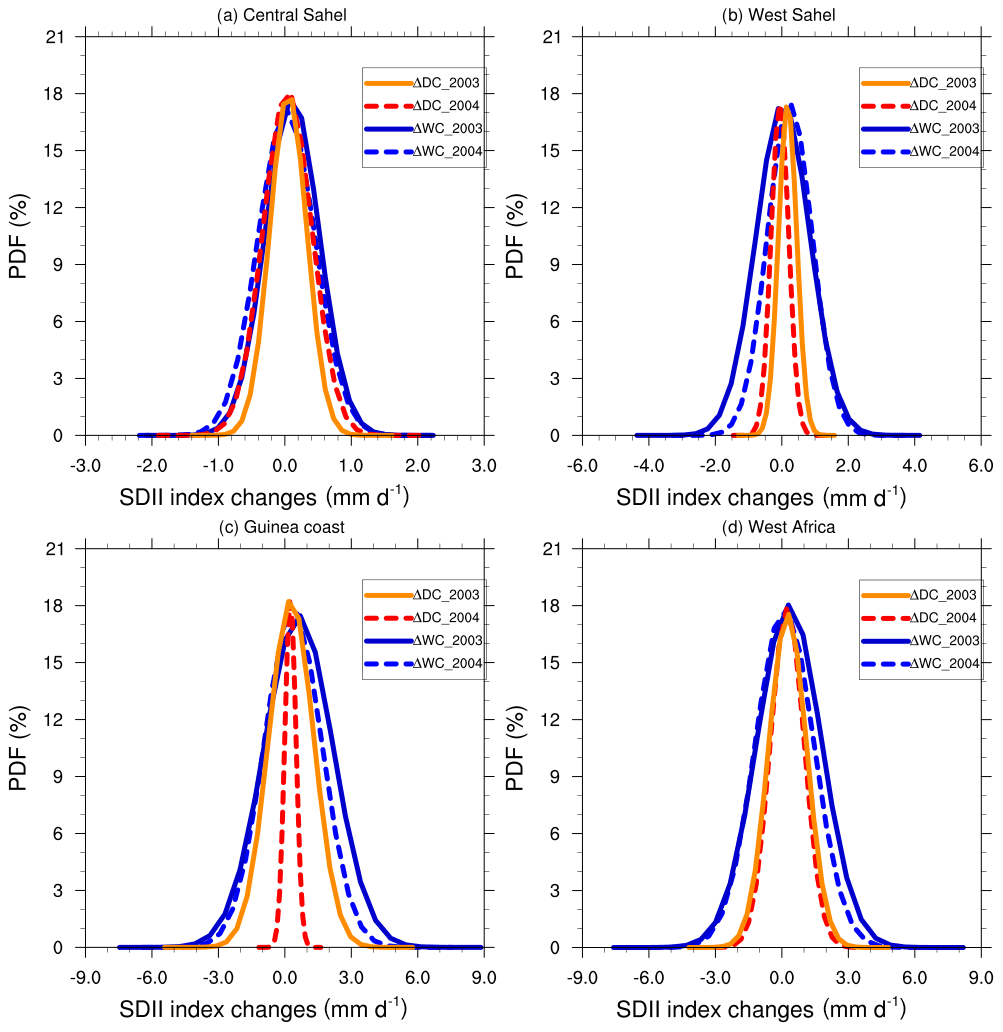
In summary, RegCM4 underestimates the rainfall intensity over the study domain compared with the observations, and the impacts of the wet and dry experiments on the SDII index are not significant.
3.1.3 Maximum number of consecutive dry days (CDD)
The duration of consecutive dry days (CDD, in days), which represents the maximum number of consecutive dry days with precipitation less than 1 mm y−1, is analyzed in this subsection. Figure 6 (top row) is the same as Fig. 2 (top row) but for CDD. CHIRPS observations locate the highest CDD values over the Sahara, with a length of more than 50 d (Fig. 6a, c). The lowest CDD values are found over the Guinea coast, with a length of less than 8 d.
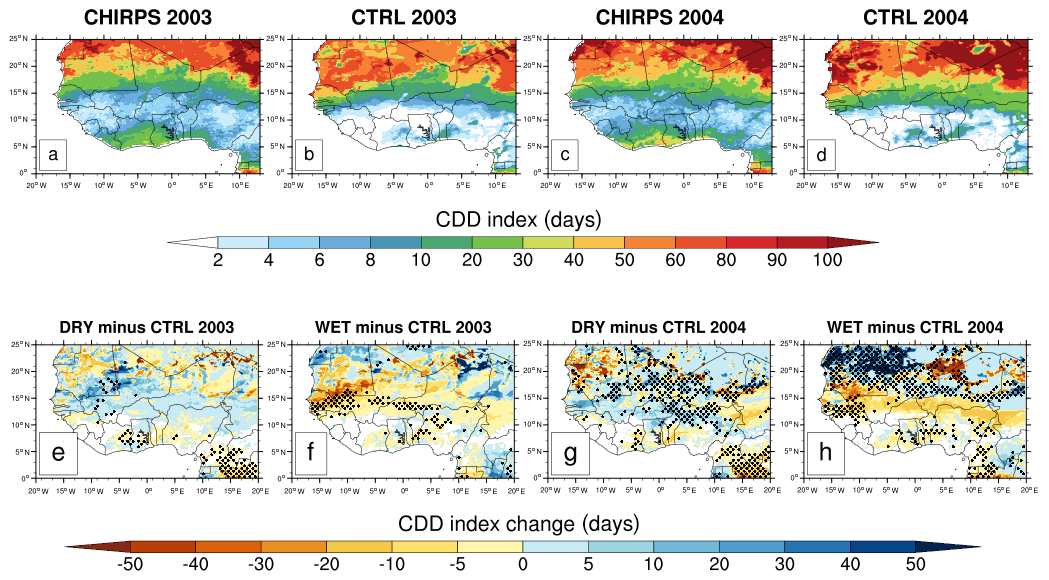
Figure 6Same as Fig. 2 but for the CDD index (in days).
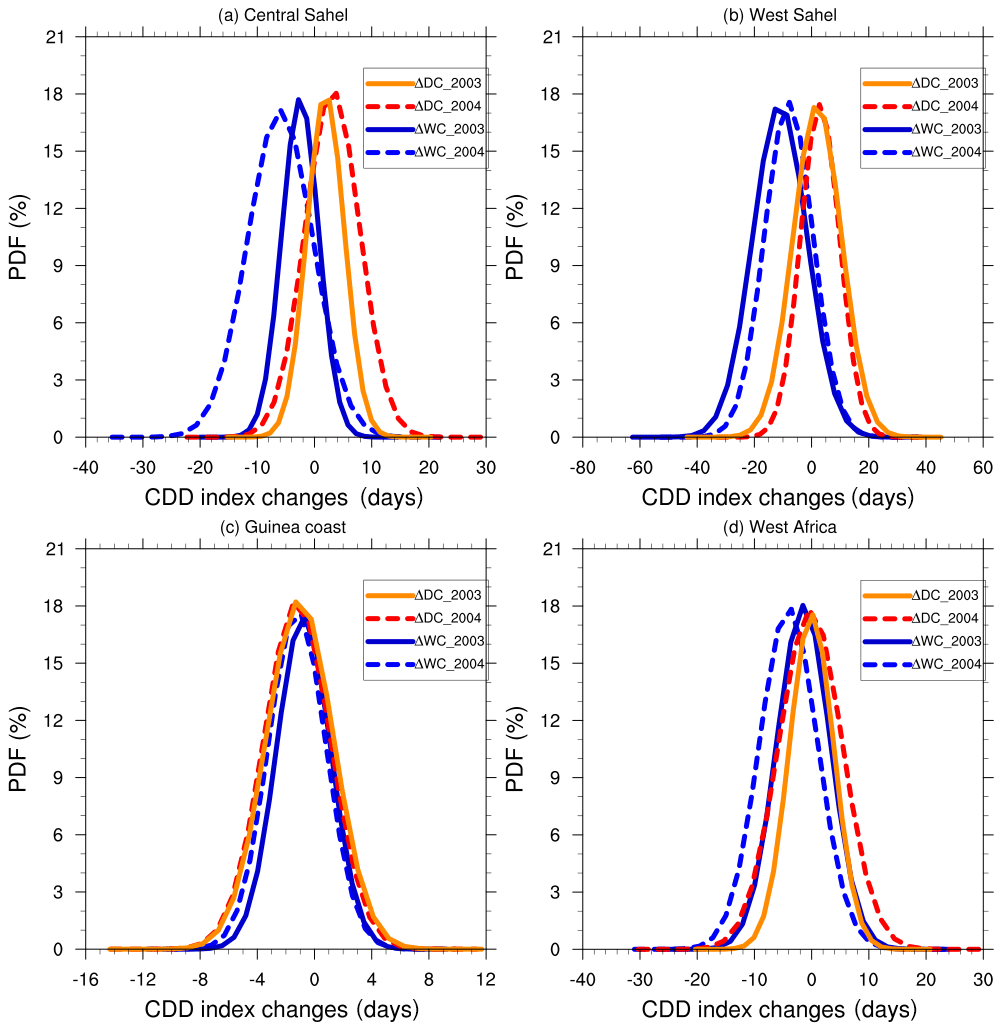
The control experiments (Fig. 6b, d) over the entire West Africa domain reproduce the large-scale pattern of the observed rainfall well, with PCC values of more than 0.85 and 0.89 for the JJAS 2003 and JJAS 2004 runs, respectively (Table 1). However, in terms of magnitude, some differences are observed at the local scale. In general, the control experiments overestimate the CDD over most of subdomains studied, except over the Guinea coast (Table 2). The strongest overestimation is found over the West Sahel, with MB values reaching more than 14.49 and 17.51 d for the JJAS 2003 and JJAS 2004 runs, respectively (Table 2). The current model parameterization increases the drought extreme over most of the study domains, except over the Guinea coast (Table 2).
Figure 6 (bottom row) is the same as Fig. 2 (bottom row) but for the CDD. The soil moisture initial conditions' impact on the CDD index is linear over the Central and West Sahel (Fig. 6, bottom row); over the Sahel, dry (wet) experiments increase (decrease) the length of dry spells. Over the Guinea coast, the impacts on the CDD are weak for both dry and wet experiments and, on average, soil moisture initial conditions seem to decrease the length of dry spells in a central band between Côte d'Ivoire and Nigeria.
Figure 7 is the same as Fig. 3 but displays the PDF distribution of the changes in the CDD. The highest increase in length in the CDD is found over the Central Sahel in dry experiments, with a maximum change in length of up to 3.80 d in JJAS 2004 (Table 3), whereas the highest decrease in the CDD is found over the West Sahel in wet experiments, with maximum change in length of up to −12.73 d in the JJAS 2003 run (Table 3).
In summary, RegCM4 overestimated the maximum number of consecutive dry days over most of the subdomains studied, except over the Guinea coast. However, the impact of soil moisture initial conditions is linear over the Central and West Sahel. Over the Guinea coast, the dry and wet experiments generally decrease the length of dry spells.

Figure 8Same as Fig. 2 but for the CWD index (in days).
3.1.4 Maximum number of consecutive wet days (CWD)
The duration of wet spells, represented by the maximum number of consecutive wet days (CWD) with precipitation ≥ 1 mm d−1, is investigated in this subsection. Figure 8 (top row) is the same as Fig. 2 (top row) but shows the CWD duration. In the CHIRPS observations, a maximum CWD length of more than 20 d is found over the mountain regions, such as the Cameroon Mountains, Jos Plateau and Guinea Highlands, whereas a minimum CWD length of less than 4 d is found over most of the area above 17∘ N latitude (Fig. 8a, c).
The control experiments reproduce the large-scale pattern over the entire West Africa domain well, with PCC values of around 0.81 and 0.87 for JJAS 2003 and JJAS 2004, respectively (Table 2). However, at the local scale, the control experiments exhibit some biases in the CWD minimum and maximum values, both in terms of magnitude and spatial extent. Control experiments overestimate the CWD length over most of the subdomains studied (Fig. 8b, d). We note that areas of overestimation coincide with areas of excessive R1mm values (Fig. 2b, d). The strongest overestimation is found over the Guinea coast, reaching 59.21 and 60.51 d for JJAS 2003 and JJAS 2004, respectively (Table 2).
Figure 8 (bottom row) is the same as Fig. 2 (bottom row) but displays changes in the CWD. As for the R1mm index, the dry (wet) experiments decrease (increase) the CWD length for both JJAS 2003 and JJAS 2004 over the Central Sahel. This result confirms the strong influence of soil moisture initial conditions in the Sahel band, as found by Zhang et al. (2011) and Koster et al. (2006) over transition zones with a climate between dry and wet regimes. However, over the Guinea coast and the West Sahel, the changes are not linear, and both dry and wet experiments increase the CWD length (Fig. 8e–h).
Figure 9 is the same as Fig. 3 but shows the PDF distribution of changes in the CWD. In the wet experiments, the strongest CWD increase is found over the Central Sahel, with maximum changes reaching 15.58 d; for the dry experiments, the strongest CWD decrease is found in the same subdomain, with maximum changes reaching −4.48 d.
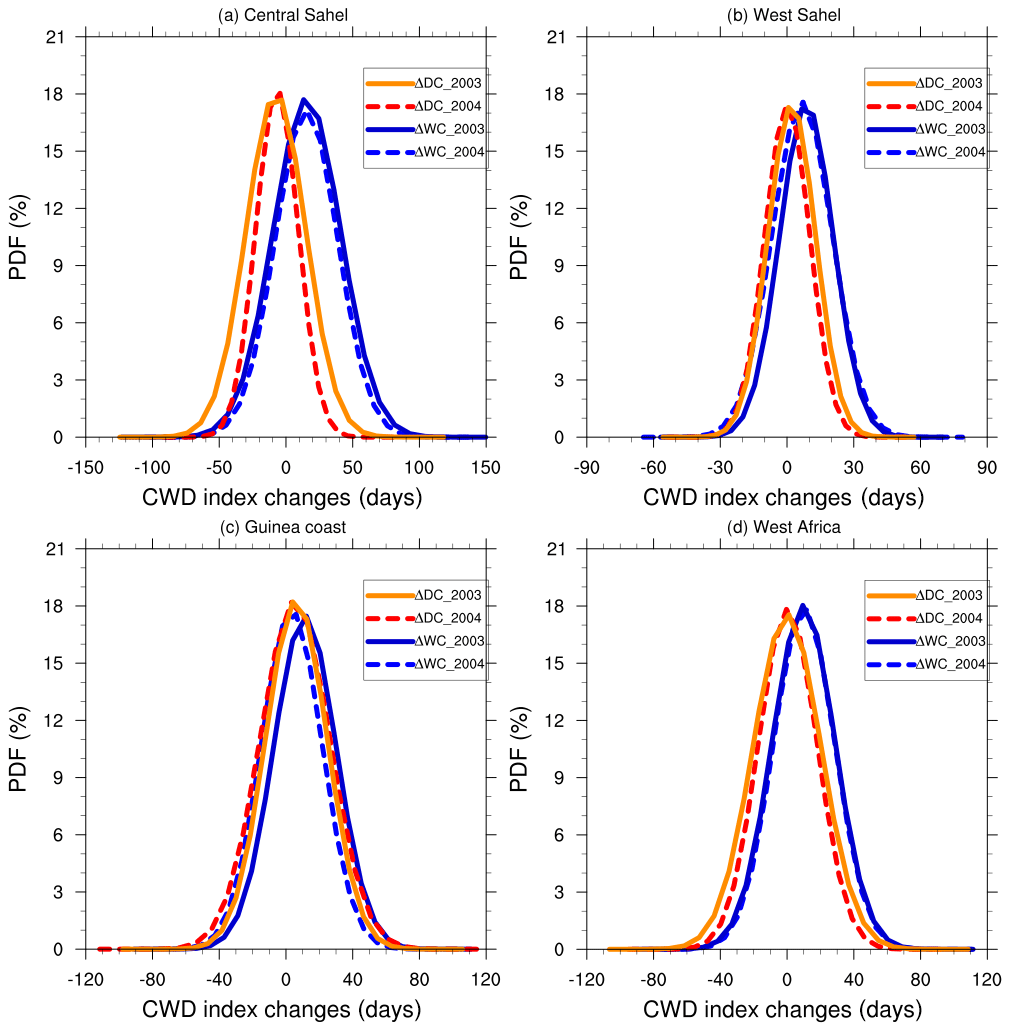
Summarizing the results of this section, as for the R1mm and CDD indices, the impact of wet and dry experiment on the CWD is linear over the Central Sahel, meaning that dry (wet) experiments decrease (increase) the CWD lengths. The RegCM4 model overestimates the duration of consecutive wet days over most of the subdomains studied. This overestimation is associated with the excessive number of wet days in the model, as documented by Diaconescu et al. (2015).
3.1.5 Maximum 1 d precipitation accumulation (RX1day)
The maximum 1 d precipitation accumulation (RX1day) during JJAS 2003 and JJAS 2004 is assessed in this section. Figure 10 (top row) shows the spatial distribution of the RX1day. CHIRPS observations confine the spatial extent of RX1day maximum values greater than 80 mm to the Guinea coast coastline, whereas a large extent of RX1day minimum values (less than 50 mm) are found over the Sahara, Sahel and part of Guinea coast.
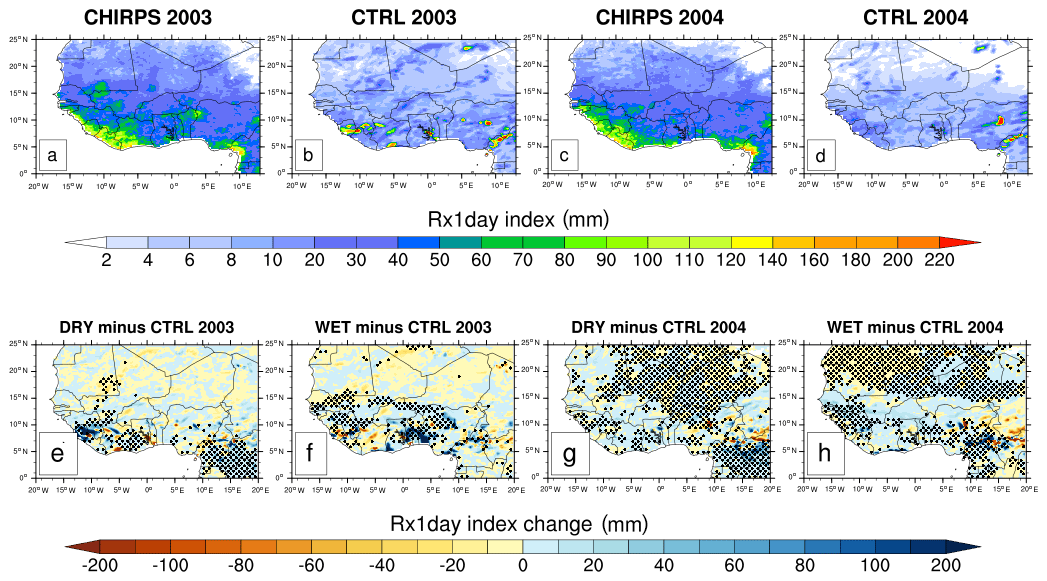
Figure 10Same as Fig. 2 but for the RX1day index (in mm).
The control experiments capture the spatial pattern of the RX1day, with PCC values of around 0.50 and 0.4 for JJAS 2003 and JJAS 2004, respectively (Table 2). A low PCC is also obtained by Thanh et al. (2017) over Asia with RegCM4 (correlation < 0.3). The model simulations fail to capture the magnitude and spatial extent of the RX1day maxima. The control experiments underestimate the RX1day over most of the subdomains studied, and this seems to be associated with the overly weak precipitation simulated by the model. The largest underestimation is located over the Guinea coast and the West Sahel. For instance, over the West Sahel, the MB values are −38.07 and −36.67 mm for JJAS 2003 and JJAS 2004, respectively (Table 2).
Figure 10 (bottom row) is similar to Fig. 2 (bottom row) but displays changes in the RX1day. As for the SDII, the impact of the soil moisture initial conditions on the RX1day is not linear (Fig. 10, bottom row).
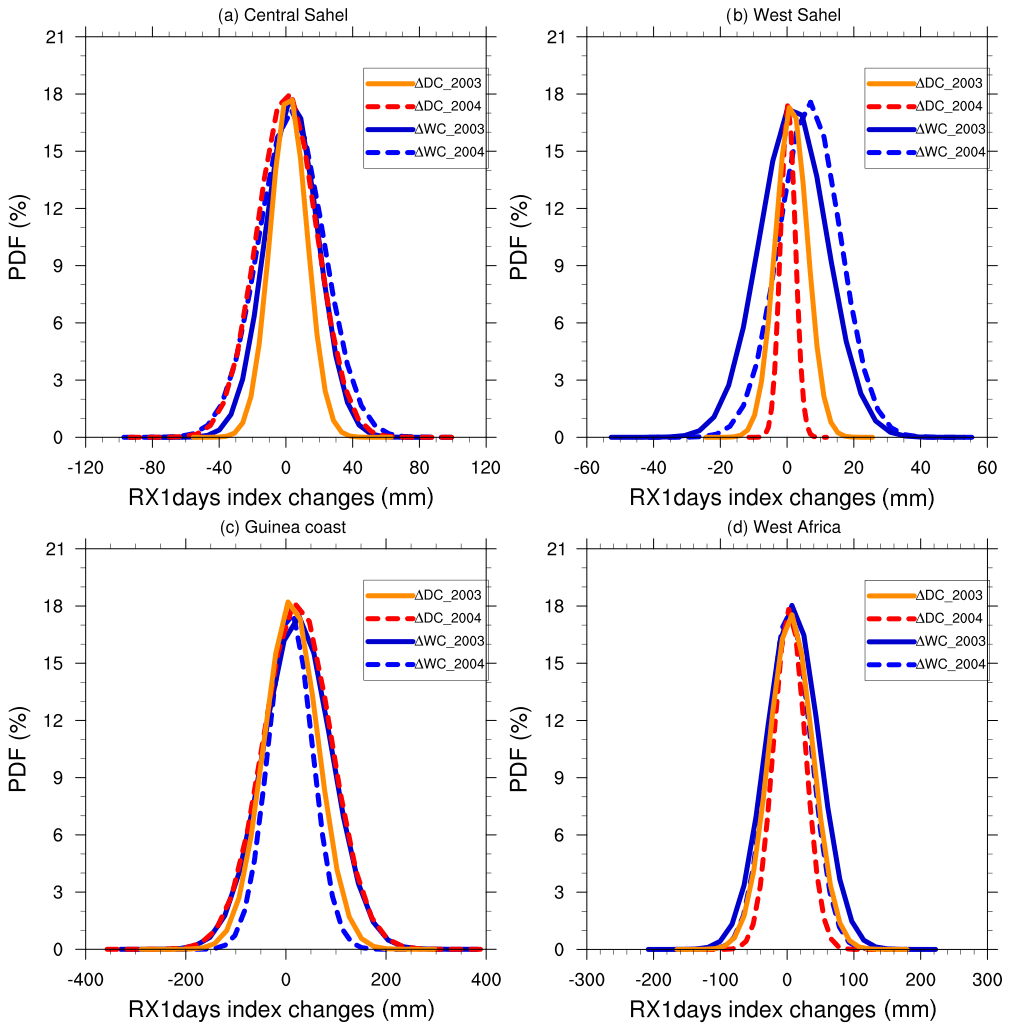
Figure 11 is similar to Fig. 3 but shows the PDF distribution of changes in the RX1day. Increases in the RX1day for both dry and wet experiments are found over most of the subdomains studied (Fig. 11). The strongest increase in the RX1day is found over the Guinea coast for wet experiments, with values reaching 26.14 and 14.93 during JJAS 2003 and JJAS 2004, respectively (Table 3).
In summary, RegCM4 underestimates the maximum 1 d precipitation accumulation over most of the study domain. Both wet and dry experiments lead to an increase in the RX1day.
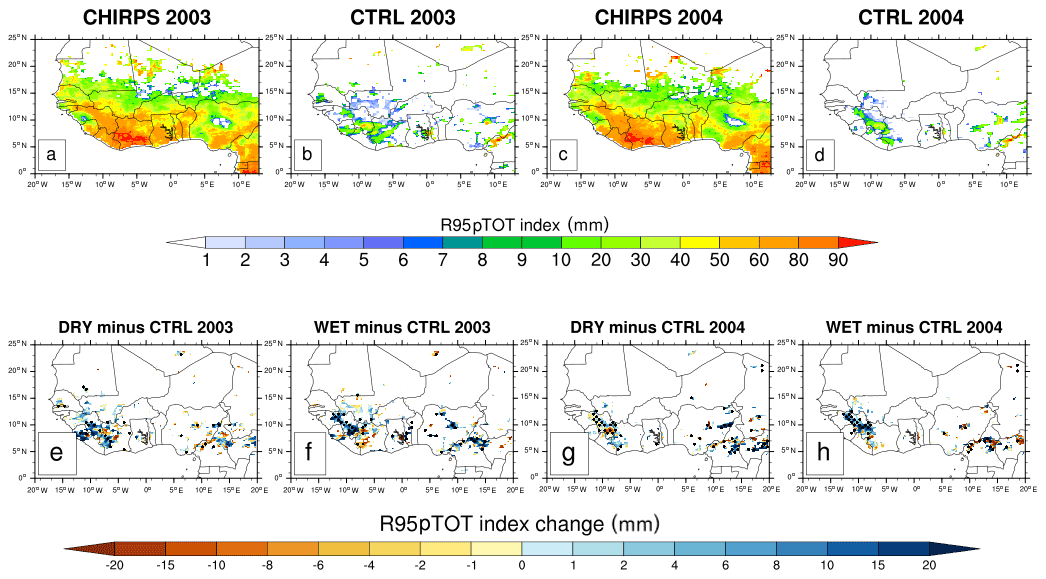
Figure 12Same as Fig. 2 but for the R95pTOT index (in mm).
3.1.6 Precipitation percent due to very heavy precipitation days (R95pTOT)
In this section, we investigate the precipitation percentage due to very heavy precipitation days during JJAS 2003 and JJAS 2004. Figure 12 (top row) is the same as Fig. 2 (top row) but shows the spatial distribution of R95pTOT. CHIRPS observations confine the R95pTOT maximum values greater than 40 mm to the Guinea coast, whereas R95pTOT index minimum values of less than 30 mm are found over the Central and West Sahel (Fig. 10a, c). The control experiments (Fig. 12b, d) capture the large spatial pattern, with PCC values of 0.59 and 0.55 for JJAS 2003 and JJAS 2004, respectively (Table 2). As with the SDII and RX1day indices, the control experiments underestimate the values of the R95pTOT index, whereas they overestimate the R1mm index. This is also due to the current physical parameterization scheme of the RegCM4 model, which results in a positive bias for the number of wet days with a low precipitation amount (e.g., 1 mm d−1) and a negative bias for the number of wet days with a higher precipitation threshold (e.g., 10 mm d−1; not shown here).
The control experiments underestimate R95pTOT over the different study domains. The highest R95pTOT underestimation is found over the Guinea coast, with MB values of more than −43.22 and −46.61 mm for JJAS 2003 and JJAS 2004, respectively (Table 2).
Figure 12 (bottom row) is similar to Fig. 2 (bottom row) but displays changes in the R95pTOT index. Both dry and wet experiments lead to an R95pTOT index increase over the orographic regions. Therefore, the soil moisture initial conditions, whether they are dry or wet extremes, reinforce the occurrence of extreme floods events.
Figure 13 is the same as Fig. 3 but shows the PDF distribution of changes in the R95pTOT. The highest R95pTOT increase is found over the West Sahel and Guinea coast with maximum change values of around 4.03 and 4.33 mm for JJAS 2003 and JJAS 2004, respectively (Table 3).
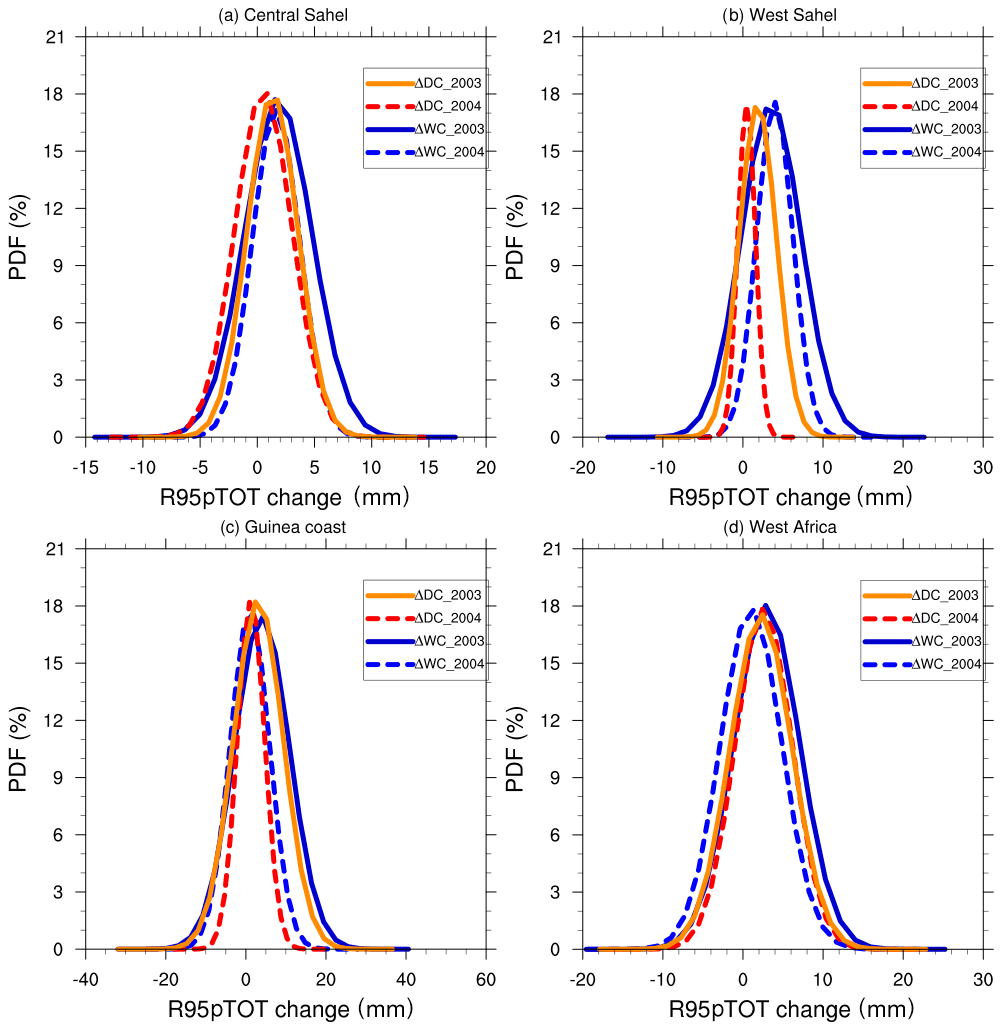
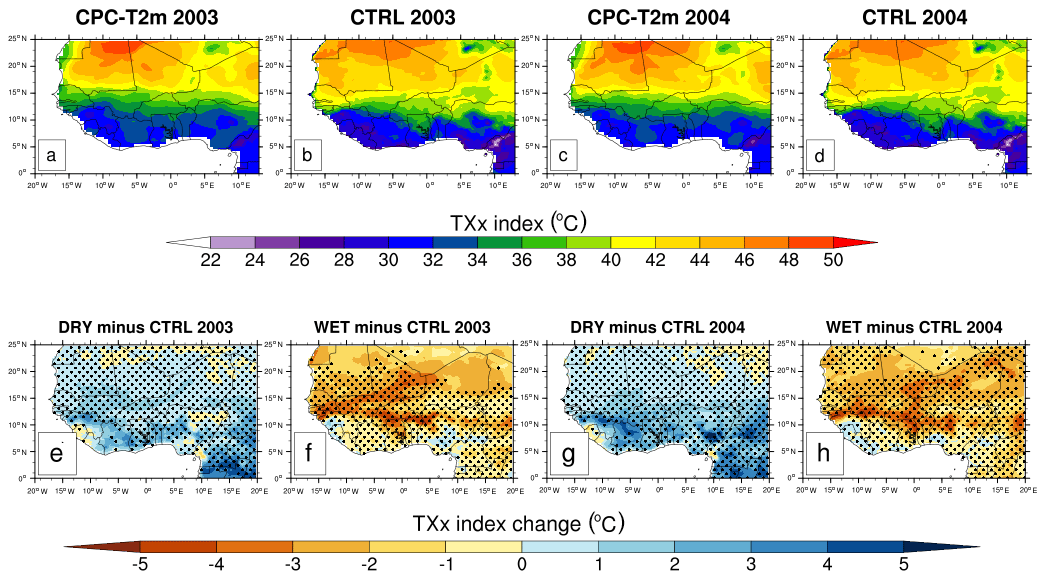
Figure 14The mean maximum value of the daily maximum temperature (TXx index, in ∘C) from CPC-T2m observations (a, c) for JJAS 2003 and JJAS 2004 and from the simulated control (CTRL) experiments (b, d) initialized with the initial soil moisture of the ERA-20C reanalysis (top row), and changes in the TXx index (in ∘C; bottom row) for JJAS 2003 and JJAS 2004 from dry (e, g) and wet (f, h) experiments with respect to the control experiments. Areas with values passing the 95 % significance test are dotted.
In summary, RegCM4 underestimates R95pTOT, and the soil moisture initial conditions, either dry or wet, increase the precipitation percent due to very heavy precipitation days. This result is consistent with the work of Liu et al. (2014) over Asia using RegCM4.
3.2 Temperature extreme indices
In this section, using daily maximum and minimum temperatures, we analyzed four extreme temperature indices (Table 1) in RegCM4 simulations over West Africa. All temperature indices are calculated for JJAS 2003 and JJAS 2004. Table 4 summarizes the PCC and MB values of all temperature indices for the control experiments (with initial soil moisture from the ERA-20C reanalysis) with respect to CPC-T2m observations, calculated over the subdomains presented in Fig. 1, during JJAS 2003 and JJAS 2004.
3.2.1 Maximum value of the daily maximum temperature (TXx)
In this section, we analyze the TXx, which gives the hottest day's temperature during JJAS 2003 and JJAS 2004. Figure 14 (top row) shows the TXx (in ∘C) from the CPC-T2m observations (Fig. 14a, c) for JJAS 2003 and JJAS 2004 and from the mean control experiments (Fig. 14b, d). The CPC-T2m observations show that the highest TXx values (more than 46 ∘C) are found over the Sahara, whereas the lowest TXx index values (less than 32 ∘C) are found over the Guinea coast (Fig. 14a, d).
Table 4The pattern correlation coefficient (PCC) and the mean bias (MB, in ∘C) of the TXx, TXn, TNn and TNx indices for the control experiments (initialized with initial soil moisture from the ERA-20C reanalysis) with respect to CPC-T2m, calculated for the Guinea coast, Central Sahel, West Sahel and entire West Africa domain for JJAS 2003 and JJAS 2004.

Table 5Summary of the maximum values of change in PDFs for the TXx, TXn, TNn and TNx indices. Values in bold indicate regions with the largest changes in maximum values for the dry and wet experiments.

The control experiments (Fig. 14c, f) reasonably replicate the large-scale patterns of the TXx values, with PCC values of up to 0.99 (Table 3) over the entire West Africa domain; however, they exhibit some biases at the local scale. The control experiments are closer to the maximum and minimum values displayed in the CPC-T2m observations. The control simulations overestimate the TXx values over the Central and West Sahel, and they underestimate the TXx values over the Guinea coast (Table 4). The greatest overestimation is found over the West Sahel, with MB values of around 3.02 and 2.02 ∘C for JJAS 2003 and JJAS 2004, respectively (Table 4). However, the biases obtained for TXx are much lower than those reported by Thanh et al. (2017), who used RegCM4 over Asia and found biases of up to 8 ∘C.
Figure 14 (bottom row) displays changes in TXx for JJAS 2003 and JJAS 2004 in dry (Fig. 14g, i) and wet experiments (Fig. 14h, j) with respect to the control experiments; the dotted area shows changes with a statistical significance of 95 %. Dry experiments lead to an increase in TXx values, whereas the wet experiments decrease them.
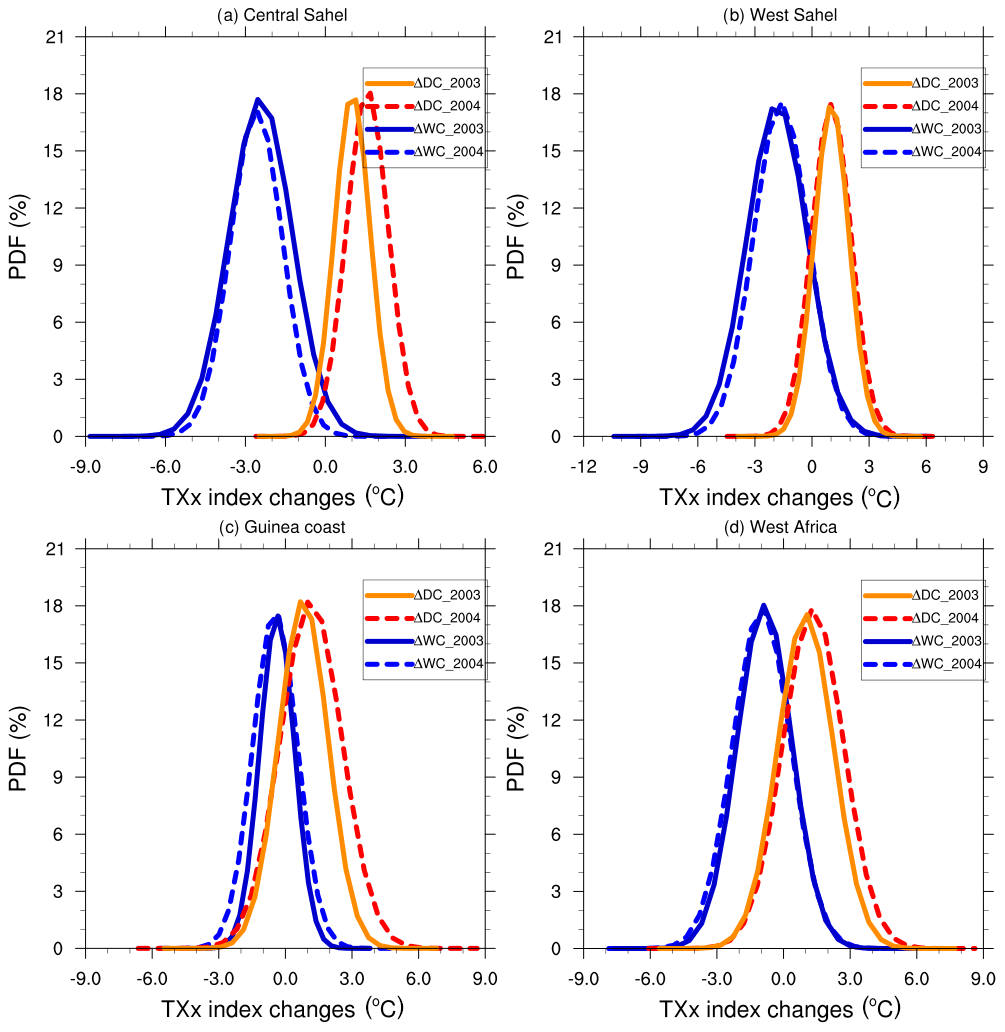
Figure 15PDF distributions (%) of changes in the maximum value of the daily maximum temperature (TXx index, in ∘C) for JJAS 2003 and JJAS 2004 over the (a) Central Sahel, (b) West Sahel, (c) Guinea coast and (d) West Africa derived from dry (ΔDC) and wet (ΔWC) experiments compared with the control experiment.
The PDF distributions of TXx changes for JJAS 2003 and JJAS 2004 over the Central Sahel, West Sahel, Guinea coast and West Africa domains (Fig. 15a, b, c and d, respectively) derived from dry and wet experiments compared with the control experiments are shown. Table 5 summarizes the maximum values of changes obtained in the PDFs of TXx. The strongest decrease (increase) in the TXx index is found over the Central Sahel, with a maximum change of around −2.57 ∘C (more than 1.69 ∘C) in wet (dry) experiments in JJAS 2004.
In summary, during JJAS 2003 and JJAS 2004, the RegCM4 model overestimates and underestimates the hottest day's temperature over the Sahel and Guinea coast, respectively. Dry experiments result in an increase in TXx, whereas wet experiments lead to a decrease in TXx values.
3.2.2 Minimum value of the daily maximum temperature (TXn)
In this section, we investigate the TXn index, which gives the coolest day's temperature during JJAS 2003 and JJAS 2004. Figure 16 (top row) is the same as Fig. 14 (top row) but presents the spatial distribution of the TXn index. The CPC-T2m observations display maxima (greater than 36 ∘C) and minima (less than 24 ∘C) of TXn over the Sahara and the Guinea coast, respectively (Fig. 16a, c).
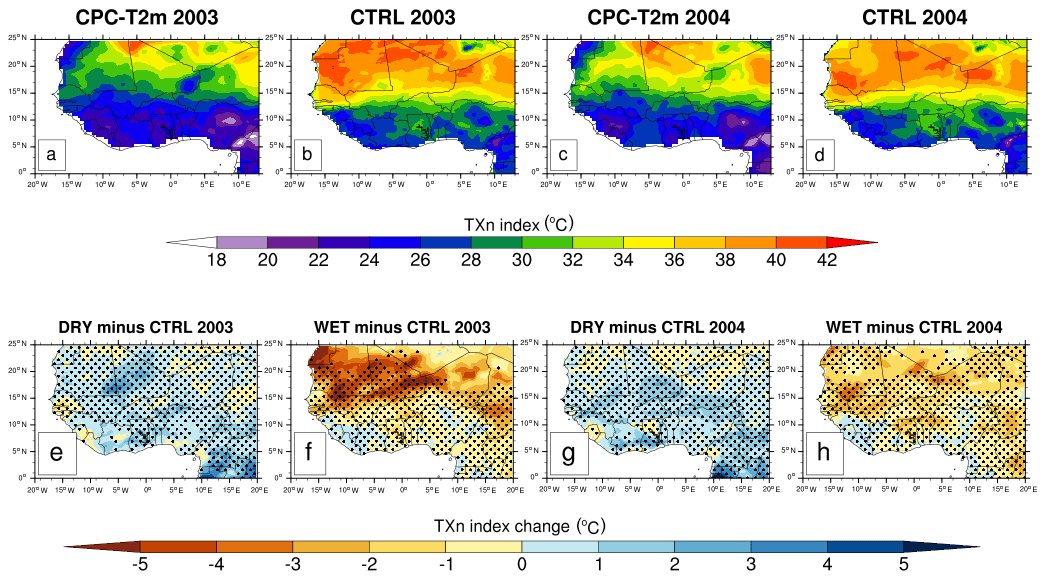
Figure 16Same as Fig. 14 but for the TXn index.
The control experiments (Fig. 16b, d) show good agreement with the CPC-T2m datasets with respect to the large-scale patterns, with PCC values of approximately 0.99; however, the magnitude of the TXn index over most of the study domain is overestimated. The strongest positive bias was observed over the West Sahel domain, with MB values of about 6.56 and 5.44 ∘C for JJAS 2003 and JJAS 2004, respectively (Table 4). The TXn biases in our study are lower than those obtained by Thanh et al. (2017) in their work over Asia using RegCM4. As in Fig. 14 (bottom row), Fig. 16 (bottom row) displays changes in the TXn index. Dry experiments increase TXn index values, whereas wet experiments decrease them.
Figure 17 is similar to Fig. 15 but displays the PDF distribution of changes in TXn. The impact on the TXn is rather weak compared with the TXx. The strongest increase in the TXn index is found over the Central Sahel, reaching 1.03 ∘C in dry experiments during JJAS 2004 (Table 5), whereas the strongest decrease is found over the West Sahel, reaching about −1.67 ∘C in wet experiments during JJAS 2004 (Table 5).
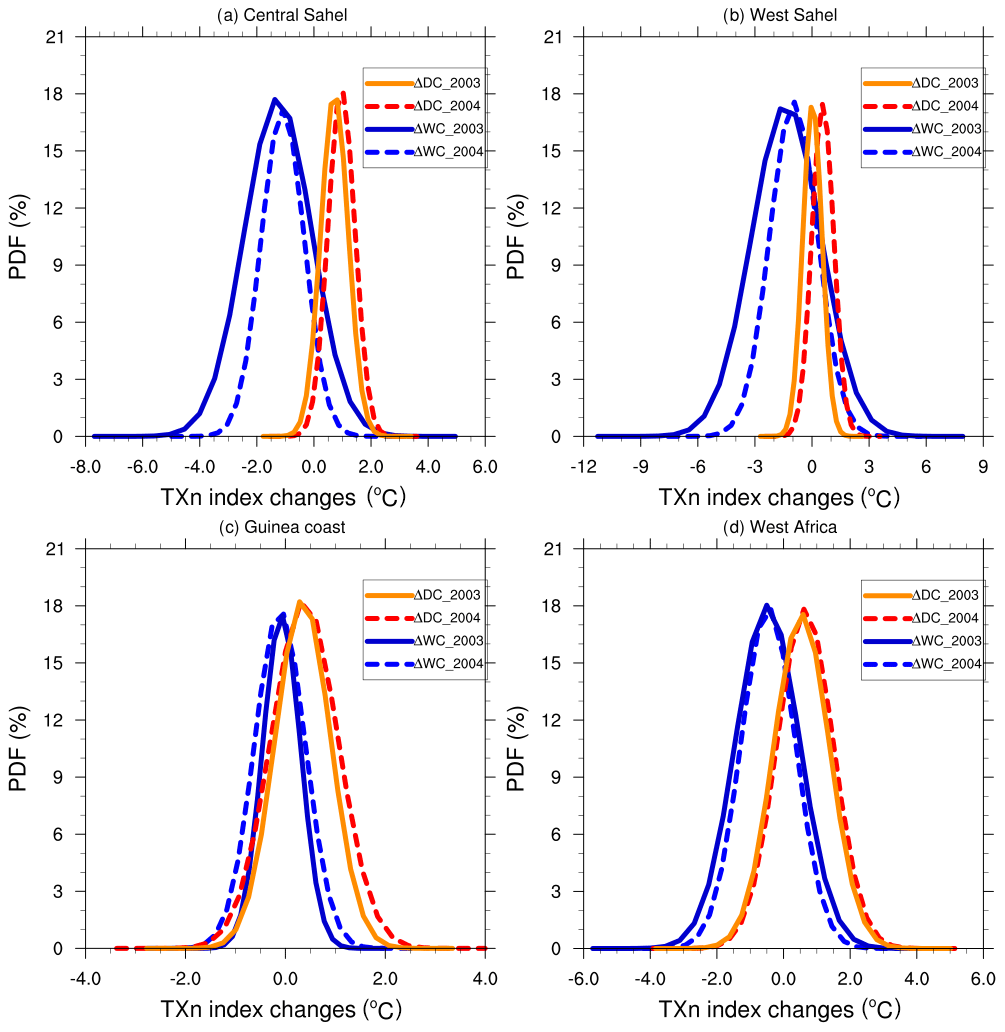
In summary, RegCM4 overestimates the coolest day's temperature during JJAS 2003 and JJAS 2004 over the whole West Africa domain. As for the TXx index, dry (wet) experiments increase (decrease) the TXn values.
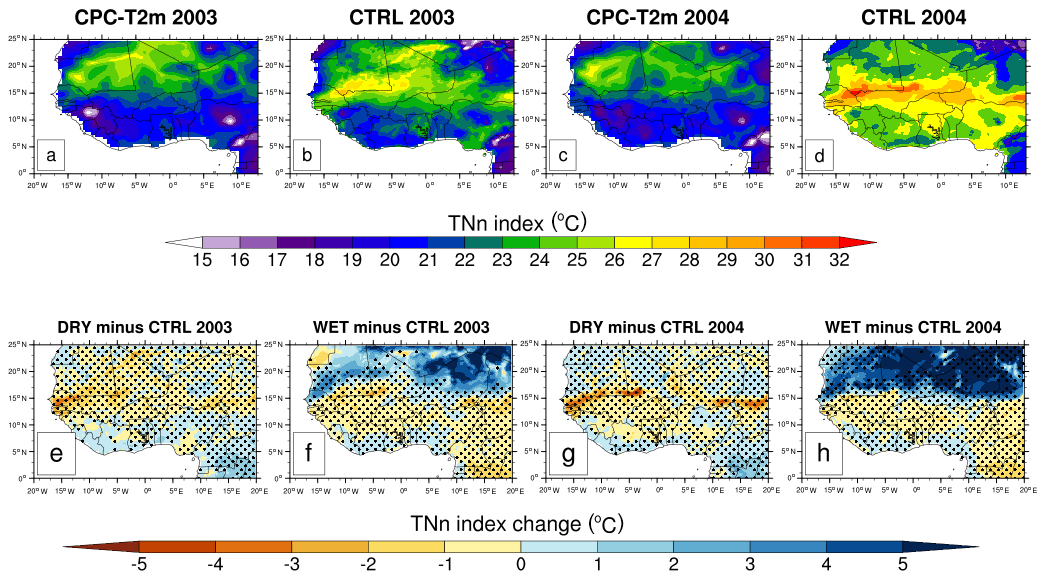
Figure 18Same as Fig. 14 but for the TNn index.
3.2.3 Minimum value of the daily minimum temperature (TNn index)
In this section, we examine the TNn index, which gives the lowest temperature at night during JJAS 2003 and JJAS 2004. Figure 18 (top row) is the same as Fig. 14 (top row) but displays the spatial distribution of the TNn index. The CPC-T2m observations (Fig. 18a, c) show TNn maxima with values not exceeding 27 ∘C (above 15∘ N latitude), whereas the minima values (less than 17 ∘C) are found over the mountainous regions such as the Cameroon Mountains, Jos Plateau and Guinea Highlands.
The control experiments (Fig. 18b, d) show good agreement with CPC-T2m observations, with PCC values of approximately 0.99; however, they exhibit some biases at the local scale. The control experiments overestimate the magnitude of the TNn index over most of the study domains.
The strongest positive biases are found over the West Sahel, with MB values reaching 3.30 and 2.55 ∘C for JJAS 2003 and JJAS 2004, respectively (Table 4). These positive biases obtained for the TXx, TXn and TNn indices are the inverse of the cold bias known from RegCM4 in mean climate simulations (Koné et al., 2018; Klutse et al., 2016). It is difficult to determine the origin of RegCM4 temperature biases, as they can depend on several factors, such as surface energy fluxes and water, cloudiness, and surface albedo (Sylla et al., 2012; Tadross et al., 2006).
Figure 18 (bottom row) is the same as Fig. 14 (bottom row) but displays changes in the TNn. Over the Central and West Sahel, both dry and wet experiments decrease the TNn values; conversely, over the Guinea coast, they increase the TNn values.
Figure 19 is the same as Fig. 15 but shows the PDF distribution of changes in the TNn. Wet (dry) experiments increase (decrease) the TNn values, especially over the Central Sahel. Table 5 shows that the strongest increase in the TNn index in wet experiments is found over Guinea coast, with a maximum change of around 0.11 ∘C in JJAS 2004, whereas the strongest decrease in the TNn is found in dry experiments over the West Sahel, with a maximum change of around −1.15 ∘C in JJAS 2003.
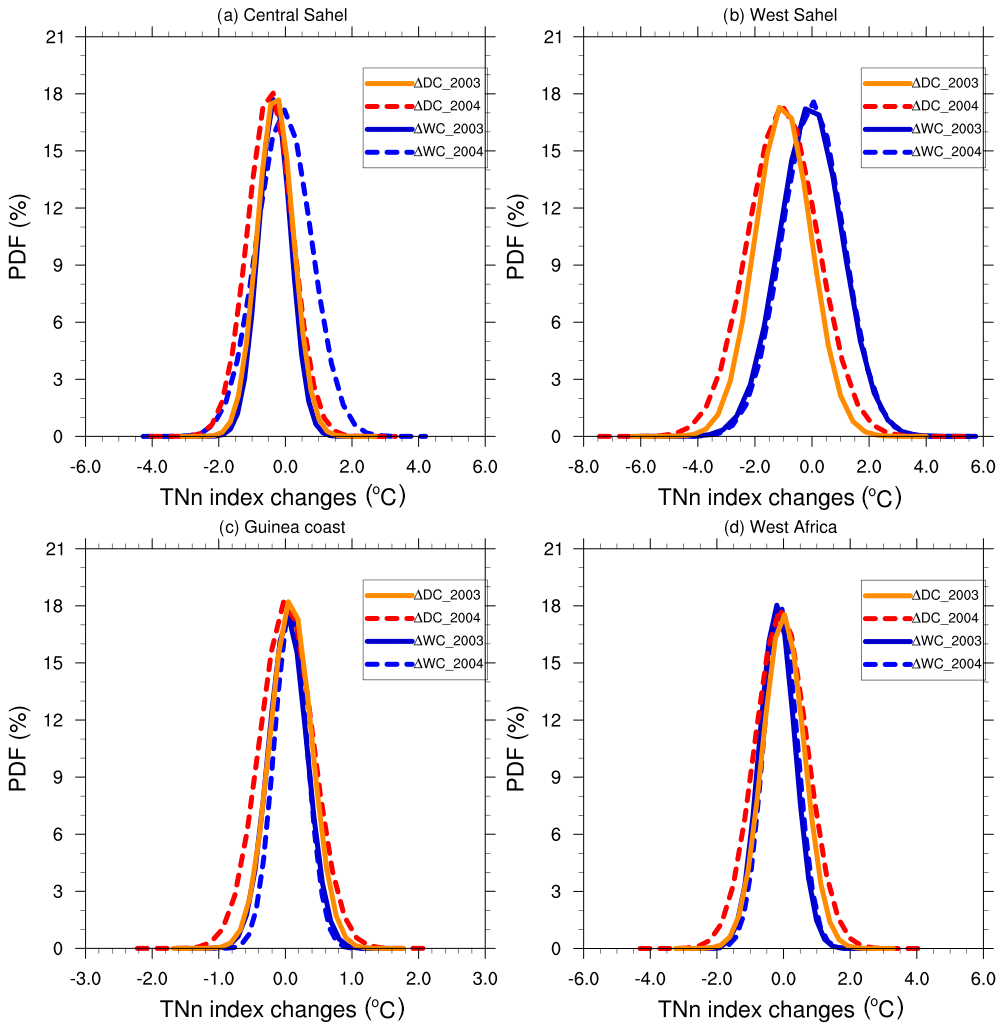
In summary, RegCM4 overestimates the lowest temperature at night during JJAS 2003 and JJAS 2004. Wet (dry) experiments lead to an increase (a decrease) in the TNn index.
3.2.4 Maximum value of the daily minimum temperature (TNx)
In this section, the TNx index, which gives the warmest night temperature during JJAS 2003 and JJAS 2004, is analyzed. Figure 20 (top row) is the same as Fig. 14 (top row) but for the TNx index. The CPC-T2m observations (Fig. 20a, c) show the maxima of the TNx index over the Sahara, with values reaching 40 ∘C, whereas the minima (around 24 ∘C) are located over the Guinea coast.
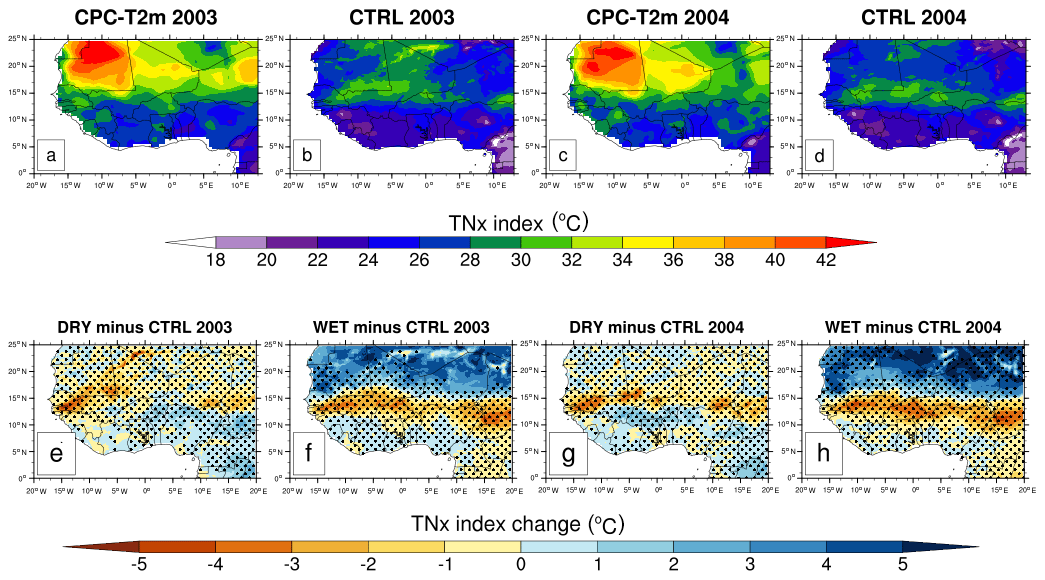
Figure 20Same as Fig. 14 but for the TNx index.

The control experiments (Fig. 20b, d) reproduced the general features of the TNx index well, with PCC value of up to 0.99; however, some differences exist at the local scale. Unlike the TNn index, the control experiments underestimate the TNx over most of the study domain. The strongest negative biases are found over the Central Sahel, with MB values of up to −3.35 and −3.32 ∘C for JJAS 2003 and JJAS 2004, respectively (Table 4). The TNx index underestimation seems to be systematically related to the cold bias in RegCM4 over West Africa, which has been reported in several papers (Koné et al., 2018; Klutse et al., 2016).
Figure 20 (bottom row) is the same as Fig. 14 (bottom row) but displays changes in the TNx. As for the TNn index, dry experiments increase the TNx values over the Central Sahel, whereas the wet experiments decrease them. However, both wet and dry experiments led to a dominant decrease over the West Sahel. Conversely, although the signal is weak, both dry and wet experiments led to a dominant increase over the Guinea coast.
Figure 21 is the same as Fig. 15 but displays the PDF distributions of the changes in the TNx. The highest TNx increase (decrease) is found over the Central Sahel in dry (wet) experiments with maximum changes of up to 0.25 (−1.67 ∘C) for JJAS 2003 (JJAS 2004) (Table 5). In summary, RegCM4 underestimates the warmest night temperature, and dry (wet) experiments lead to an increase (decrease) in TNx magnitude.
The impact of the soil moisture initial conditions on six precipitation extreme indices and four temperature extreme indices over West Africa was investigated using RegCM4–CLM45. We first evaluated the performance of RegCM4–CLM4.5 with respect to representing these climate extreme indices over West Africa. We then performed sensitivity studies over the West Africa domain, with a spatial resolution of 25 km. We initialized the control runs using soil moisture from the ERA-20C reanalysis, and we initialized dry and wet experiments using the respective maximum and minimum values from ERA-20C over the whole domain. Results are presented for JJAS 2003 and JJAS 2004, which are two contrasting runs that were the most sensitive to the effects of dry and wet soil moisture initial conditions.
Compared with CHIRPS observations, the model overestimates and underestimates the number of wet days. RegCM4 also underestimates the simple daily precipitation intensity index (SDII), the maximum 1 d precipitation (Rx1day) and the precipitation percentage due to very heavy precipitation days (R95pTOT). The current physical parameterization scheme of the RegCM4 model used in our study results in a positive bias of the number of wet days with a low precipitation threshold (e.g., 1 mm d−1) as well as in a negative bias for a higher precipitation threshold (e.g., 10 mm d−1; not shown here). RegCM4 generally overestimates the CWD and CDD indices over West Africa. Most of the temperature extreme indices used in this study (TXx, TXn and TNn) are also overestimated, except for the TNx index, which is underestimated over the West Africa domain.
The impact of the soil moisture initial conditions on extreme precipitation indices is only linear over the Central Sahel for indices related to the number of precipitation events (the R1mm, CDD and CWD indices), meaning that wet (dry) experiments lead to an increase (decrease) in the number of days; however, for indices related to the amount or intensity of precipitation (the SDII, RX1day and R95pTOT indices), no linear relation is found. Nevertheless, the dry and wet experiments increase the precipitation percentage due to very heavy precipitation days and the maximum 1 d precipitation accumulation (the R95pTOT and RX1day indices, respectively) over most of the study domain.
The soil moisture initial conditions unequally influence the daily maximum and minimum temperatures over the West Africa domain: the impact on daily maximum temperature extremes are greater than those on the daily minimum temperature extremes. These results are consistent with previous studies (Jaeger and Seneviratne, 2011; Zhang et al., 2009). The wet (dry) experiments lead to TXx and TXn increases (decreases) over West Africa. However, regarding the minimum temperature, we showed that dry (wet) experiments lead to a TNx increase (decrease).
This study helped to quantify the impact of the soil moisture initial conditions on precipitation and temperature extreme events in terms of intensity, frequency and duration over West Africa. This study is the first to investigate the impact of soil moisture initial conditions on climate extreme indices in this region. These experiments were done in a highly idealized framework and were intended to show the potential impact of very strong soil moisture initial conditions on climate extremes. Consequently, this work should be considered as a first overview of the influence of initial soil moisture on climate extremes using an RCM (RegCM4). This study will benefit from being performed in a multi-model framework with several RCMs within the CORDEX-Africa initiative (Coordinated Regional Downscaling Experiment).
The RegCM4.7 model is freely available for public use at https://github.com/ICTP/RegCM/releases/tag/4.7.1 (Giuliani, 2021). The NCL language was used for the computations and the plots, and the source can be found at https://doi.org/10.5065/D6WD3XH5 (NCAR, 2019).
The validation of simulated precipitation was done using the high-resolution 0.05∘ Climate Hazards Group InfraRed Precipitation with Station (CHIRPS) dataset, developed at the University of California at Santa Barbara, for the period from 1981 to 2020 (Funk et al., 2015). The CHIRPS dataset is available at https://data.chc.ucsb.edu/products/CHIRPS-2.0/global_daily/netcdf/p05/ (Funk et al., 2014).
We validated the 2 m temperature using the National Oceanic and Atmospheric Administration (NOAA) Climate Prediction Center (CPC) daily maximum and minimum global surface air temperature: https://downloads.psl.noaa.gov/Datasets/cpc_global_temp/ (Pan et al., 2019).
The contact author has declared that neither they nor their co-authors have any competing interests.
BK and ADie fixed the analysis framework. BK carried out all of the simulations and produced the figures according to the outline proposed by ADie. BK, ADie, SA and ADia worked on the analyses. All authors contributed to drafting this paper.
Publisher's note: Copernicus Publications remains neutral with regard to jurisdictional claims in published maps and institutional affiliations.
The research leading to this publication is co-funded by the NERC/DFID “Future Climate for Africa” program under the AMMA-2050 project (grant no. NE/M019969/1) and by the Institut de Recherche pour le Développement (IRD), France (UMR IGE Imputation, grant no. 252RA5).
This research has been supported by the NERC/DFID “Future Climate for Africa” program under the AMMA-2050 project (grant no. NE/M019969/1) and the Institut de Recherche pour le Développement (IRD), France (UMR IGE Imputation, grant no. 252RA5).
This paper was edited by Shraddhanand Shukla and reviewed by three anonymous referees.
Bichet, A. and Diedhiou, A.: West African Sahel has become wetter during the last 30 years, but dry spells are shorter and more frequent, Clim. Res., 75, 155–162, 2018a.
Bichet, A. and Diedhiou, A.: Less frequent and more intense rainfall along the coast of the Gulf of Guinea in West and Central Africa (1981–2014), Clim. Res., 76, 191–201, 2018b.
Damien, D., Chung, C. E., Ekman, A. M. L., and Brandefelt, J.: Which significance test performs the best in climate simulations?, Tellus A, 66, 23139, https://doi.org/10.3402/tellusa.v66.23139, 2014.
Danielson, J. J. and Gesch, D. B.: Global multi-resolution terrain elevation data 2010 (GMTED2010), US Geological Survey Open-File Report 2011-1073, p. 26, https://doi.org/10.3133/ofr20111073, 2011.
Diaconescu, E. P., Gachon, P., Scinocca, J., and Laprise, R.: Evaluation of daily precipitation statistics and monsoon onset/retreat over West Sahel in multiple data sets, Clim. Dynam., 45, 1325–1354, https://doi.org/10.1007/s00382-014-2383-2, 2015.
Didi Sacré Regis, M , Mouhamed, L., Kouakou, K., Adeline, B., Arona, D., Koffi Claude, A. K., Talnan, J. H. C., Salomon, O., and Issiaka, S.: Using the CHIRPS Dataset to Investigate Historical Changes in Precipitation Extremes in West Africa, Climate, 8, 84, https://doi.org/10.3390/cli8070084, 2020.
Easterling, D. R., Meehl, G. A., Parmesan, C., Changnon, S. A., Karl, T. R., and Mearns, L. O.: Climate Extremes: Observations, Modeling and Impacts, Science, 289, 2068–2074, https://doi.org/10.1126/science.289.5487.2068, 2000.
Emanuel, K. A.: A scheme for representing cumulus convection in large-scale models, J. Atmos. Sci., 48, 2313–2335, 1991.
Fan, Y. and van den Dool, H.: A global monthly land surface air temperature analysis for 1948–present, J. Geophys. Res., 113, D01103, https://doi.org/10.1029/2007JD008470, 2008.
Folland, C. K., Palmer, T. N. , and Parker, D. E.: Sahel rainfall and worldwide sea temperatures, Nature, 320, 602–607, 1986.
Fontaine, B. and Janicot, S.: Sea Surface Temperature Fields Associated with West African Rainfall Anomaly Types, J. Climate, 9, 2935–2940, https://doi.org/10.1175/15200442(1996)009$<$2935:SSTFAW$>$, 1996.
Funk, C. C., Peterson, P. J., Landsfeld, M. F., Pedreros, D. H., Verdin, J. P., Rowland, J. D., Romero, B. E., Husak, G. J., Michaelsen, J. C., and Verdin, A. P.: A quasi-global precipitation time series for drought monitoring, US Geological Survey Data Series 832, US Geological Survey [data set], p. 4, https://data.chc.ucsb.edu/products/CHIRPS-2.0/global_daily/netcdf/p05/ (last access: 7 February 2022), 2014.
Gao, X.-J., Shi, Y., and Giorgi, F.: Comparison of convective parameterizations in RegCM4 experiments over China with CLM as the land surface model, Atmos. Ocean. Sci. Lett., 9, 246–254, https://doi.org/10.1080/16742834.2016.1172938, 2016.
Giorgi, F., Coppola, E., Solmon, F., Mariotti, L., Sylla, M. B., Bi, X., Elguindi, N., Diro, G. T., Nair, V., Giuliani, G., Cozzini, S., Guettler, I., O'Brien, T., Tawfik, A., Shalaby, A., Zakey, A. S., Steiner, A., Stordal, F., Sloan, L., and Brankovic, C.: RegCM4: model description and preliminary tests over multiple CORDEX domains, Clim. Res., 52, 7–29, https://doi.org/10.3354/cr01018, 2012.
Giuliani, G.: The Regional Climate Model version 4.7.1 source code, ICTP [code], https://github.com/ICTP/RegCM/releases/tag/4.7.1 (last access: 7 February 2022), 2021.
Grell, G., Dudhia, J., and Stauffer, D. R.: A description of the fifth generation Penn State/NCAR Mesoscale Model (MM5), National Center for Atmospheric Research Tech Note NCAR/TN-398+STR, NCAR, Boulder, CO, https://doi.org/10.5065/D60Z716B, 1994.
Holtslag, A., De Bruijn, E., and Pan, H. L.: A high resolution air mass transformation model for short-range weather forecasting, Mon. Weather Rev., 118, 1561–1575, 1990.
IPCC: Climate Change 2007: The Physical Science Basis, in: Contribution of Working Group I to the Fourth Assessment Report of the Intergovernmental Panel on Climate Change, edited by: Solomon, S., Qin, D., Manning, M., Chen, Z., Marquis, M., Averyt, K. B., Tignor, M., and Miller, H. L., Cambridge University Press, Cambridge, UK., 996 pp., https://www.ipcc.ch/report/ar4/wg1/ (last access: 7 February 2022), 2007.
IPCC: Climate Change 2013: The Physical Science Basis, in: Contribution of Working Group I to the Fifth Assessment Report of the Intergovernmental Panel on Climate Change, edited by: Stocker, T. F., Qin, D., Plattner, G.-K., Tignor, M., Allen, S. K., Boschung, J., Nauels, A., Xia, Y., Bex, V., and Midgley, P. M., Cambridge University Press, Cambridge, UK and New York, NY, USA, 1535 pp., http://www.ipcc.ch/report/ar5/wg1/ (last access: 7 February 2022), 2013.
Jaeger, E. B., and Seneviratne, S. I.: Impact of soil moisture–atmosphere coupling on European climate extremes and trends in a regional climate model, Clim. Dynam., 36, 1919–1939, https://doi.org/10.1007/s00382-010-0780-8, 2011.
Kiehl, J. T., Hack, J. J., Bonan, G. B., Boville, B. A., Briegleb, B. P., Williamson, D. L., and Rasch, P. J.: Description of the NCAR Community Climate Model (CCM3), Technical Note NCAR/TN−420+STR, University Corporation for Atmospheric Research, 152 pp., https://doi.org/10.5065/D6FF3Q99, 1996.
Klutse, B. A. N., Sylla, B. M., Diallo, I., Sarr, A., Dosio, A., Diedhiou, A., Kamga, A., Lamptey, B., Ali, A., Gbobaniyi, E. O., Owusu, K., Lennard, C., Hewitson, B., Nikulin, G., Panitz, H.-J., and Büchner, M.: Daily characteristics of West African summer monsoon precipitation in CORDEX simulations, Theor. Appl. Climatol., 123, 369–386, https://doi.org/10.1007/s00704-014-1352-3, 2016.
Koné, B., Diedhiou, A., N'datchoh, E. T., Sylla, M. B., Giorgi, F., Anquetin, S., Bamba, A., Diawara, A., and Kobea, A. T.: Sensitivity study of the regional climate model RegCM4 to different convective schemes over West Africa, Earth Syst. Dynam., 9, 1261–1278, https://doi.org/10.5194/esd-9-1261-2018, 2018.
Koné, B., Diedhiou, A., Diawara, A., Anquetin, S., Touré, N. E., Bamba, A., and Kobea, A. T.: Influence of initial soil moisture in a regional climate model study over West Africa – Part 1: Impact on the climate mean, Hydrol. Earth Syst. Sci., 26, 711–730, https://doi.org/10.5194/hess-26-711-2022, 2022.
Koster, R. D., Guo, Z. H., Dirmeyer, P. A., Bonan, G., Chan, E., Cox, P., Davies, H., Gordon, C. T., Gordon, C. T., Lawrence, D., Liu, P., Lu, C. H., Malyshev, S., McAvaney, B., Mitchell, K., Mocko, D., Oki, K., Oleson, K., Pitman, A., Sud, Y. C., Taylor, C. M., Verseghy, D., Vasic, R., Xue, Y., and Yamada, T.: The global land–atmosphere coupling experiment. Part I: Overview, J. Hydrometeorol., 7, 590–610, https://doi.org/10.1175/JHM510.1, 2006.
Larsen, J.: Record heat wave in Europe takes 35,000 lives, Earth Policy Institute, http://www.earth-policy.org/plan_b_updates/2003/update29 (last access: 5 February 2022), 2003.
Lawrence, D. M., Oleson, K. W., Flanner, M. G., Thornton, P. E., Swenson, S. C., Lawrence, P.J., Zeng, X., Yang, Z.-L., Levis, S., Sakaguchi, K., Bonan, G. B., and Slater, A. G.: Parameterization improvements and functional and structuraladvances in version 4 of the Community Land Model, J. Adv. Model. Earth Syst., 3, M03001, https://doi.org/10.1029/2011MS000045, 2011.
Le Barbé, L., Lebel, L., and Tapsoba, D.: Rainfall variability in west africa during the years 1950–1990, J. Climate, 15, 187–202, 2002.
Loveland, T. R., Reed, B. C., Brown, J. F., Ohlen, D. O., Zhu, Z., Yang, L., and Merchant, J. W.: Development of a global land cover characteristics database and IGBP DISCover from 1 km AVHRR data, Int. J. Remote Sens., 21, 1303–1330, 2000.
Liu, D., Wang, G., Mei, R., Yu, Z., and Yu, M.: Impact of initial soil moisture anomalies on climate mean and extremes over Asia, J. Geophys. Res.-Atmos., 119, 529–545, https://doi.org/10.1002/2013JD020890, 2014.
Menéndez, C. G., Giles, J., Ruscica, R., Zaninelli, P., Coronato, T., Falco, M., Sörensson, A., Fita, L., Carril, A., and Li, L.: Temperature variability and soil–atmosphere interaction in South America simulated by two regional climate models, Clim. Dynam., 53, 2919–2930, https://doi.org/10.1007/s00382-019-04668-6, 2019.
NCAR: Command Language (Version 6.6.2) [Software], UCAR/NCAR/CISL/TDD, Boulder, Colorado [code], https://doi.org/10.5065/D6WD3XH5, 2019.
Nicholson, S. E.: The nature of rainfall fluctuations in subtropical West-Africa, Mon. Weather Rev., 22109, 2191–2208, 1980.
Nicholson, S. E.: Land Surface processes and Sahel climate, Rev. Geophys., 38, 117–139, https://doi.org/10.1029/1999rg900014, 2000.
Nikulin, G., Jones, C., Samuelsson, P., Giorgi, F., Asrar, G., Büchner, M., Cerezo-Mota, R., Christensen, O. B., Déque, M., Fernandez, J., Hansler, A., van Meijgaard, E., Sylla, M. B., and Sushama, L.: Precipitation climatology in an ensemble of CORDEX-Africa regional climate simulations, J. Climate, 25, 6057–6078, https://doi.org/10.1175/JCLI-D-11-00375.1, 2012.
Oleson, K., Lawrence, D. M., Bonan, G. B., Drewniak, B., Huang, M., Koven, C. D., and Yang, Z.-L.: Technical description of version 4.5 of the Community Land Model (CLM), No. NCAR/TN-503+STR, NCAR, https://doi.org/10.5065/D6RR1W7M, 2013.
Pal, J. S., Small, E. E., and Elthair, E. A.: Simulation of regional scale water and energy budgets: representation of subgrid cloud and precipitation processes within RegCM, J. Geophys. Res., 105, 29579–29594, 2000.
Pan, Y., Wang, W., and Shi, W.: Assessment of CPC-T2m Global Daily Surface Air Temperature (CPC-T2m) Analysis, Assessment, Science and Technology Infusion Climate Bulletin, NOAA's National Weather Service, in: 44th NOAA Annual Climate Diagnostics and Prediction Workshop, 22–24 October 2019, Durham, NC [data set], https://downloads.psl.noaa.gov/Datasets/cpc_global_temp/ (last access: 7 February 2022), 2019.
Peterson, T. C., Folland, C., Gruza, G., Hogg, W. Mokssit, A., and Plummer, N.: Report on the activities of the working group on climate change detection and related rapporteurs 1998–2001, WMO Rep. WCDMP 47, WMO-TD 1071, WMO, Geneva, Switzerland, 144 pp., https://eprints.soton.ac.uk/30144/1/048_wgccd.pdf (last access: 5 February 2022), 2001.
Philippon, N., Mougin, E., Jarlan, L., and Frison, P.-L.: Analysis of the linkages between rainfall and land surface conditions in the West African monsoon through CMAP, ERS-WSC,and NOAA-AVHR R data, J. Geophys. Res., 110, D24115, https://doi.org/10.1029/2005JD006394, 2005.
Reynolds, R. W. and Smith, T. M.: Improved global sea surface temperature analysis using optimum interpolation, J. Climate, 7, 929–948, https://doi.org/10.1175/1520-0442(1994)007<0929:IGSSTA>2.0.CO;2, 1994.
Simmons, A. S., Uppala, D. D., and Kobayashi S.: ERA-interim: new ECMWF reanalysis products from 1989 onwards, ECMWF Newslett., 110, 29–35, 2007.
Solmon, F., Giorgi, F., and Liousse, C.: Aerosol modeling for regional climate studies: application to anthropogenic particles and evaluation over a European/African domain, Tellus B, 58, 51–72, 2006.
Sundqvist, H. E., Berge, E., and Kristjansson, J. E.: The effects of domain choice on summer precipitation simulation and sensitivity in a regional climate model, J. Climate, 11, 2698–2712, 1989.
Sylla, M. B., Giorgi, F., and Stordal, F.: Large-scale origins of rainfall and temperature bias in high resolution simulations over Southern Africa, Clim. Res., 52, 193–211, https://doi.org/10.3354/cr01044, 2012.
Tadross, M. A., Gutowski Jr., W. J., Hewitson, B. C., Jack, C., and New, M.: MM5 simulations of interannual change and the diurnal cycle of southern African regional climate, Theor. Appl. Climatol., 86, 63–80, 2006.
Takahashi, H. G. and Polcher, J.: Weakening of rainfall intensity on wet soils over the wet Asian monsoon region using a high-resolution regional climate model, Prog. Earth Planet. Sci., 6, 1–18, 2019.
Thanh, N.-D., Fredolin, T. T., Jerasorn, S., Faye, C., Long, T.-T., Thanh, N.-X., Tan, P.-V., Liew, J., Gemma, N., Patama, S., Dodo, G., and Edvin, A.: Performance evaluation of RegCM4 in simulating extreme rainfall and temperature indices over the CORDEX-Southeast Asia region, Int. J. Climatol., 37, 1634–1647, https://doi.org/10.1002/joc.4803, 2017.
Uppala, S., Dee, D., Kobayashi, S., Berrisford, P., and Simmons, A.: Towards a climate data assimilation system: status update of ERA-interim, ECMWF Newslett., 15, 12–18, 2008.
Wang, G., Yu, M., Pal, J. S., Mei, R., Bonan, G. B., Levis, S., and Thornton, P. E.: On the development of a coupled regional climate vegetation model RCM-CLM-CN-DV and its validation its tropical Africa, Clim. Dynam., 46, 515–539, 2016.
Yan, Z. and Yang, C.: Geographic patterns of climate extreme changes in China during 1951–1997, Clim. Environ. Res., 5, 267–272, https://doi.org/10.3878/j.issn.1006-9585.2000.03.05, 2000.
Zakey, A. S., Solmon, F., and Giorgi, F.: Implementation and testing of a desert dust module in a regional climate model, Atmos. Chem. Phys., 6, 4687–4704, https://doi.org/10.5194/acp-6-4687-2006, 2006.
Zeng, X., Zhao, M., and Dickinson, R .E.: Intercomparison of bulk aerodynamic algorithms for the computation of sea surface fluxes using TOGA COARE and TAO DATA, J. Climate, 11, 2628–2644, 1998.
Zhang, J., Wang, W. C., and Wu, L.: Land–atmosphere coupling and diurnal temperature range over the contiguous United States, Geophys. Res. Lett., 36, L06706, https://doi.org/10.1029/2009GL037505, 2009.
Zhang, J. Y., Wu, L. Y., and Dong, W.: Land-atmosphere coupling and summer climate variability over East Asia, J. Geophys. Res., 116, D05117, https://doi.org/10.1029/2010JD014714, 2011.