the Creative Commons Attribution 4.0 License.
the Creative Commons Attribution 4.0 License.
 | 11 Feb 2022
Influence of initial soil moisture in a regional climate model study over West Africa – Part 1: Impact on the climate mean
Brahima Koné
Adama Diawara
Sandrine Anquetin
N'datchoh Evelyne Touré
Adama Bamba
Arsene Toka Kobea
The impact of soil moisture initial conditions on the mean climate over West Africa was examined using the latest version of the regional climate model of the International Centre for Theoretical Physics (RegCM4) at a 25 km horizontal resolution. The soil moisture reanalysis of the European Centre for Medium-Range Weather Forecasts (ECMWF) reanalysis of the 20th century (ERA-20C) was used to initialize the control experiment, while its minimum and maximum values over the entire domain were used to establish the respective initial dry and wet soil moisture conditions (hereafter referred to as dry and wet experiments, respectively). For the respective control, wet and dry experiments, an ensemble of five runs from June to September was performed. In each experiment, we analyzed the two idealized simulations most sensitive to the dry and wet soil moisture initial conditions. The impact of soil moisture initial conditions on precipitation in West Africa is linear over the Central and West Sahel regions, where dry (wet) experiments lead to a rainfall decrease (increase). The strongest precipitation increase is found over the West Sahel for wet experiments, with a maximum change value of approximately 40 %, whereas the strongest precipitation decrease is found for dry experiments over the Central Sahel, with a peak change of approximately −4 %. The sensitivity of soil moisture initial conditions can persist for 3–4 months (90–120 d) depending on the region. However, the influence on precipitation is no longer than 1 month (between 15 and 30 d). The strongest temperature decrease is located over the Central and West Sahel, with a maximum change of approximately −1.5 ∘C in wet experiments, whereas the strongest temperature increase is found over the Guinea coast and Central Sahel for the dry experiments, with a maximum change of around 0.6 ∘C. A significant impact of soil moisture initial conditions on the surface energy fluxes is noted: in the wet (dry) experiments, a cooling (warming) of the surface temperature is associated with a decrease (increase) in sensible heat flux, an increase (decrease) in latent heat flux and a decrease (increase) in the boundary layer depth. Part 2 of this study (Koné et al., 2022) investigates the influence of soil moisture initial conditions on climate extremes.
- Article
(3669 KB) - Full-text XML
- Companion paper
- BibTeX
- EndNote


In the climate system, soil moisture is a crucial variable that influences water balance and surface energy components through latent surface fluxes and evaporation. Therefore, soil moisture impacts the development of weather patterns and precipitation. The strength of soil moisture impacts on land–atmosphere coupling varies with location and season. Koster et al. (2004) sustained that improving the simulation of the atmospheric response to the slow variations in land and ocean surface conditions may be important for seasonal climate prediction. The atmospheric response to ocean temperature anomalies has been well documented (Diedhiou and Mahfouf, 1996; Kirtman and Schopf, 1998; Rasmusson et al., 1982). Schär et al. (1999) sustained that the role of soils may be comparable to that of the oceans. The solar energy received by the oceans is stored in summer and used to heat the atmosphere in winter. Conversely, the precipitation received by the soil is stored in winter, and the moistening (cooling) is returned to the atmosphere in summer. Through its impact on surface energy fluxes and evaporation, there are many additional impacts on the climate process of soil moisture, such as boundary layer stability and air temperature (Hong and Pan, 2000; Kim and Hong, 2006). Several studies have shown that the anomalies in soil moisture may persist for several weeks or months; however, its impact remains only for a shorter time in the atmosphere, not exceeding few days (Vinnikov and Yeserkepova 1991; Liu et al., 2014). The important role of anomalies in soil moisture in the coupling between land and atmosphere has been shown in several studies, using numerical climate models (Zhang et al., 2011) and observation datasets (Zhang et al., 2008a; Dirmeyer et al., 2006). For instance, over East Asia, Zhang et al. (2011) showed that soil moisture is found to have a much stronger impact on daily maximum temperature variability than on daily mean temperature variability, but it generally has small effects on daily minimum temperature, except in the eastern Tibetan Plateau. They also showed that soil moisture has a prominent contribution to precipitation variability in many parts of western China.
West Africa is known to exhibit strong coupling between soil moisture and precipitation (Koster et al., 2004). Several previous studies have been conducted over West Africa on a global scale using atmospheric general circulation models (AGCMs) to investigate the impact of soil moisture initial conditions on the land–atmosphere coupling (Koster et al., 2004; Douville and al., 2001; Zhang et al., 2008b). However, at local and regional scales, the land–atmosphere coupling studies with AGCMs present significant uncertainties (Xue et al., 2010). Thus, regional climate models (RCMs) have been used to simulate the impact on interannual climate variability of anomalies in soil moisture (Zhang et al., 2011). These studies have received a lot of attention due to the increase in climate variability associated with extreme weather events that have greater societal and environmental impacts. In general, these studies have been conducted in Asia, Europe and America (e.g., Seneviratne et al., 2006, for Europe; Zhang et al., 2011, for Asia; Zhang et al., 2008b, for America). Overall, the results of these studies showed that, during summer, the strong impact of the anomalies in soil moisture in land–atmosphere coupling occurred mainly over the transition zones with a climate between wet and dry regimes, which is in agreement with Koster et al. (2004). The relevance and extent of this potential feedback are still poorly understood in West Africa.
This study will focus on the influence of soil moisture initial conditions on the climate mean. It is based on a performance assessment of the International Centre for Theoretical Physics regional climate model version 4 coupled with version 4.5 of the Community Land Model (RegCM4–CLM4.5) performed by Koné et al. (2018), who validated the ability of the model to reproduce the climate mean. The descriptions of the model and experimental setup used in this study are presented in Sect. 2. In the Sect. 3, the influence of wet and dry soil moisture initial conditions on the subsequent climate mean is analyzed and discussed. The main conclusions are presented in Sect. 4. While this paper (Part 1) investigates the impacts on the climate mean, Part 2 of this article (Koné et al., 2022) will be focused on the influence of soil moisture initial conditions on climate extremes.
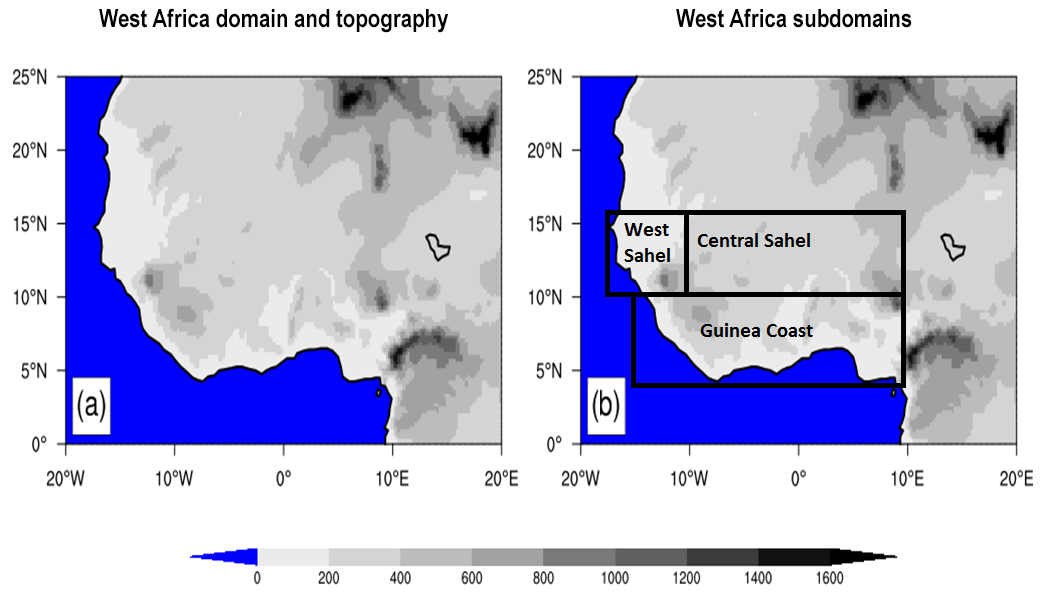
Figure 1Topography of the West African domain. The analysis of the model results has an emphasis on the whole West African domain and the three subregions, the Guinea coast, Central Sahel and West Sahel, which are marked with black boxes.
2.1 Model description and observed datasets
The fourth generation of the International Centre for Theoretical Physics (ICTP) regional climate model (RegCM4) is used in this study. Since its release, its physical representations have been continuously developed and implemented. The version used in the present study is RegCM4.7. The MM5 (Mesoscale Model version 5; Grell et al., 1994) non-hydrostatic dynamical core has been ported to RegCM without removing the existing hydrostatic core. RegCM4 is a limited-area model using a sigma pressure vertical grid and the finite differencing algorithm of the Arakawa B-grid (Giorgi et al., 2012). The radiation scheme used in this version of RegCM4.7 is derived from the National Center for Atmospheric Research (NCAR) Community Climate Model version 3 (CCM3) (Kiehl et al., 1996). Aerosol representation is from Zakey et al. (2006) and Solmon et al. (2006). The large-scale precipitation scheme is from Pal et al. (2000), and the moisture scheme is the SUBgrid EXplicit moisture scheme (SUBEX), which takes the sub-grid-scale cloud variability into account. The accretion processes and evaporation for stable precipitation follow the work of Sundqvist et al. (1989). In the planetary boundary layer (PBL), the sensible heat over ocean and land, the water vapor, and the turbulent transport of momentum are calculated according to the scheme of Holtslag et al. (1990). Heat and moisture as well as the momentum fluxes of ocean surfaces in this study are computed as in Zeng et al. (1998). In RegCM4.7, convective precipitation and land surface processes can be described by several parameterizations. Based on Koné et al. (2018), we selected the convective scheme reported by Emanuel (1991), and the interaction processes between soil, vegetation and the atmosphere are parameterized with CLM4.5. In each grid cell, CLM4.5 has 16 different plant functional types (PFTs) and 10 soil layers (Lawrence et al., 2011; Wang et al., 2016). RegCM4 is integrated over the domain of West Africa depicted in Fig. 1 with a 25 km (182×114 grid points; from 20∘ W to 20∘ E and from 5∘ S to 21∘ N) horizontal resolution and 18 vertical levels, and the initial and boundary conditions are taken from the European Centre for Medium-Range Weather Forecasts (ECMWF) ERA-Interim reanalysis (EIN75; Uppala et al., 2008; Simmons et al., 2007). The sea surface temperatures (SSTs) are obtained from the National Oceanic and Atmosphere Administration (NOAA) Optimal Interpolation weekly (OI_WK) (Reynolds and Smith, 1994). The topography data are taken from the United States Geological Survey (USGS) Global Multi-resolution Terrain Elevation Data (GMTED; Danielson and Gesch, 2011) at a 30 arcsec spatial resolution, which is an update to the Global Land Cover Characterization (GTOPO; Loveland et al., 2000) dataset.
Our analysis focuses on precipitation and the 2 m air temperature over the West African domain during the June–July–August–September (JJAS) period. We validate the simulated precipitation with the high-resolution 0.05∘ Climate Hazards Group InfraRed Precipitation with Station (CHIRPS) dataset, developed at the University of California at Santa Barbara, for the period from 1981 to 2020 (Funk et al., 2015). The validation of the simulated 2 m temperature relies on the CRU (Climate Research Unit) datasets, version 3.20, from the University of East Anglia, gridded at a horizontal resolution of 0.5∘ for the period from 1901 to 2011 (Harris et al., 2013). To facilitate comparison between RegCM4 simulations, all products have been regridded to using a bilinear interpolation method (Nikulin et al., 2012).
2.2 Experimental setup and analysis methodology
The ECMWF 20th century (ERA-20C) soil moisture reanalysis was used to initialize the control experiment, while its domain-wide minimum and maximum values were used to establish the respective initial dry and wet soil moisture conditions (hereafter dry and wet experiments, respectively). We initialized the dry and wet soil moisture initial conditions (as volumetric fractions, m3 m−3) at the minimum value of and the maximum value of 0.489.
We designed three experiments (reference, wet and dry), each with an ensemble of five simulations. The simulation time period for each experiment lasts for 4 months, starting from 1 June to 30 September. The difference between these three experiments is the change in the initial soil moisture conditions (reference initial soil moisture condition, wet initial soil moisture condition and dry initial soil moisture condition) during the first day of the simulation (1 June 2001, 2002, 2003, 2004 and 2005, respectively) over the West African domain. We then selected the two runs most impacted by the wet and dry soil moisture initial conditions in order to exhibit the effects on the climate mean beyond the limits of the impacts of RegCM4 initial soil moisture internal forcing. In the same context, several previous studies have selected 2 extreme years to investigate the climate model's sensitivity to soil moisture initial conditions (Hong and Pan, 2000; Kim and Hong, 2006) outside of Africa.
Hong and Pan (2000) used only 2 years (3 months per year) to investigate the impact of initial soil moisture over North America (in the Great Plains) during two summers spanning May–June–July (MJJ) in 1988 (corresponding to a drought) and 1993 (corresponding to a flooding event). Kim and Hong (2006) selected 2 contrasting years, 1997 (below-normal precipitation) and 1998 (above-normal precipitation year), for their study over east Asia. The first 7 d (Kang et al., 2014) were excluded from the analysis as a spin-up period. Except for the geographical location, the experimental setup was the same as that of Hong and Pan (2000). The geographical location of this study is the same as in Koné et al. (2018), with four subregions (Fig. 1) that exhibit different features of the annual precipitation cycle: Central Sahel (10∘ W–10∘ E, 10–16∘ N), West Sahel (18–10∘ W, 10–16∘ N) and Guinea coast (15∘ W–10∘ E; 3–10∘ N).
In several previous studies (Liu et al., 2014; Hong and Pan, 2000; Kim and Hong, 2006), the mean bias (MB) values averaged over the study domains are used to quantify the impact of the soil moisture initial conditions. In our study, we used the MB and the probability density function (PDF; Gao et al., 2016; Jaeger and Seneviratne, 2011) by fitting a normal distribution to better capture how many grid points are impacted by soil moisture initial conditions. The pattern correlation coefficient (PCC) is also used as a spatial correlation to reveal the degree of large-scale similarity between model simulations and observations. These performance metrics (MB, PCC and PDF) are computed for both modeled and observed temperature and precipitation only over land grid points.
For the 2 years most sensitive to soil moisture initial conditions, a Student t test was used to compare the significance of the difference between a wet or dry sensitivity test (sample 1) and the control (sample 2), assuming that our two samples are independent and considering that this method performs well for climate simulations compared with more sophisticated techniques developed to address autocorrelation (Damien et al., 2014). The Student t test is extensively used for analysis in climate sciences; it is fairly robust and easy to use and interpret (Menédez et al., 2019; Takahashi and Polcher, 2019). The Student t test takes the difference between the means of each sample, the variance (S) and the number of degrees of freedom (n−1), which depends on the sample size (n), into account. The test statistic is calculated as follows:
where and are the sample means, n1 and n2 are the sample sizes, and and are the sample variances. In this study, a t test at the 95 % confidence level is used to define statistical significance.
3.1 Influence of soil moisture initial conditions on precipitation
To identify the two runs most impacted by the dry and wet experiments among the ensemble of five simulations (initiated on 1 June 2001, 2002, 2003, 2004 and 2005, respectively), we superimpose (in Fig. 2) the magnitude of daily soil moisture changes in the five runs compared with their corresponding control experiment over the West African domain. For the dry experiments (negative values of daily soil moisture changes), Fig. 2 shows that the weakest and strongest impacts of soil moisture initial conditions are found for the runs initiated on 1 June 2004 and 2003, respectively. For the wet experiments (positive values of daily soil moisture changes), the weakest impact is found for the run initiated on 1 June 2003, whereas the other runs exhibit a similar strong sensitivity. From these results, we selected the two runs initiated on 1 June 2003 and 1 June 2004 as the simulations most influenced by the initial wet and dry soil moisture conditions, respectively, in order to better highlight the effects on the climate mean beyond the limits of the impact of the initial internal soil moisture forcing. It is worth noting that 2003 is wetter than 2004 and is more sensitive to the dry experiment, whereas 2004, which is drier than 2003, is more sensitive to the wet experiment.
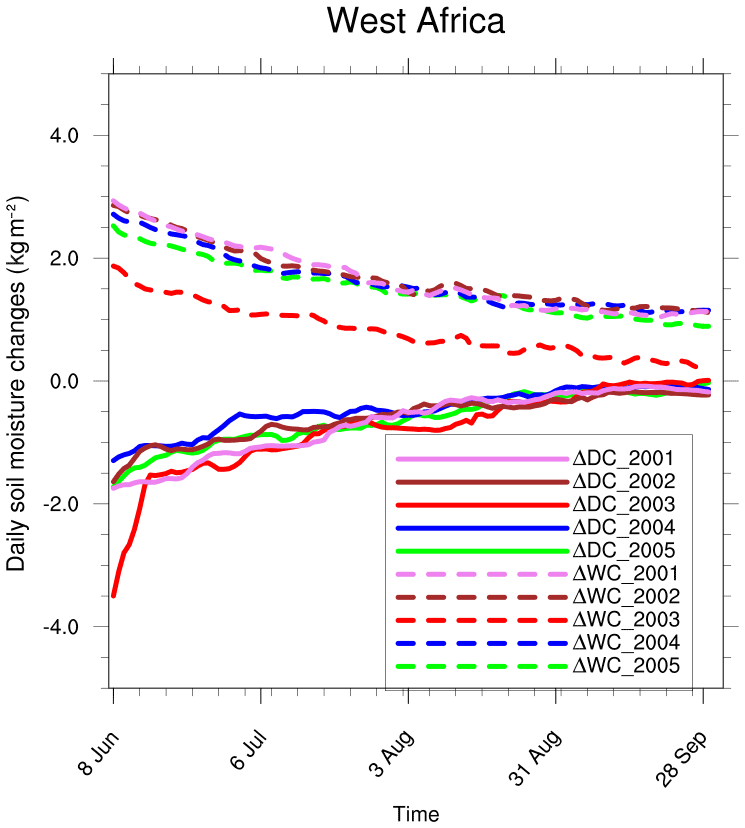
Figure 2Changes in daily soil moisture in the five runs (JJAS for 2001 to 2005) over the West African domain for the dry (ΔDC) and wet (ΔWC) experiments with respect to their corresponding control experiment.
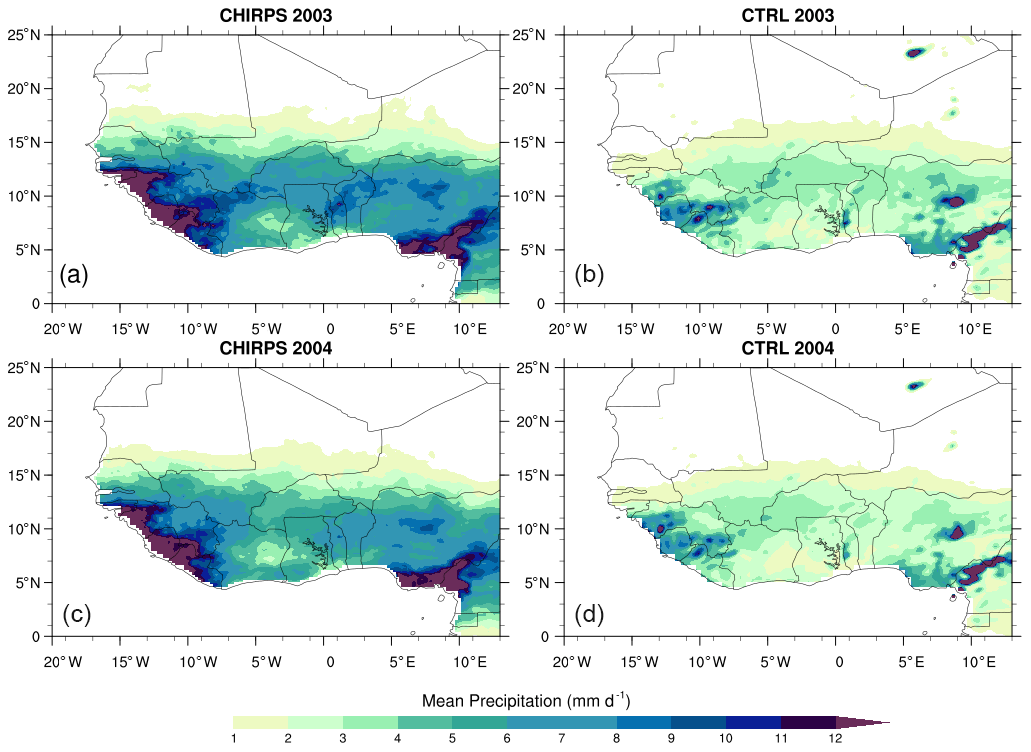
Figure 3Mean precipitation (mm d−1) from CHIRPS (a, c) and the simulated control experiments (CTRL) (b, d) using the reanalysis initial soil moisture from ERA-20C during JJAS 2003 and JJAS 2004.
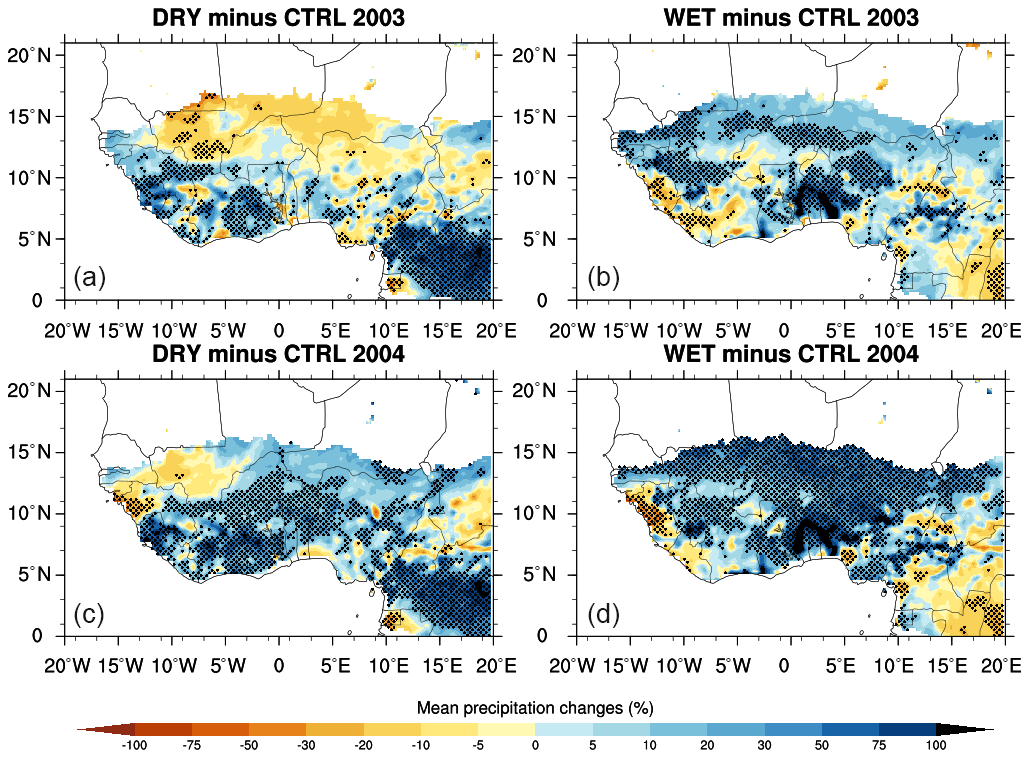
Figure 4Changes in mean precipitation (in %) for JJAS 2003 and JJAS 2004 from dry (a and c, respectively) and wet (b and d, respectively) experiments with respect to the control experiment; the dotted area shows differences that are statistically significant at the 0.05 level.
Figure 3 displays the spatial distribution of the observed mean rainfall (mm d−1) from CHIRPS (Fig. 3a, c) for the JJAS 2003 and JJAS 2004 runs and the simulated control experiments (Fig. 3b, d) initialized using reanalysis soil moisture from ERA-20C. Table 1 reports the MB and PCC values for the model simulation compared to CHIRPS, computed for the Central Sahel, Guinea coast, West Sahel and entire West Africa domains. The CHIRPS product displays a zonal band of rainfall centered around 10∘ N, decreasing from north to south (Fig. 3a, c). The maximum values are located over the mountain regions of Cameroon and Guinea, whereas the precipitation minimum values are found over the Sahel and the Sahara. The control experiments (Fig. 3b, d) reproduced the large-scale pattern of observed rainfall with PCC values of 0.72 and 0.77 for the JJAS 2003 and JJAS 2004 runs, respectively (Table 1). The spatial extent of rainfall maxima and the north–south gradient are well captured by the control experiments; however, their magnitudes are underestimated with respected to the CHIRPS observation. Over the West African domain, dry MB values reaching −49.31 % and −50.56 % are obtained for the JJAS 2003 and JJAS 2004 runs, respectively (Table 1). Figure 4 displays the change in mean precipitation (in %) in JJAS 2003 and JJAS 2004 for dry and wet experiments with respect to the control experiments. The dotted area shows changes with a statistical significance of 95 %.
Table 1The pattern correlation coefficient (PCC) and the mean bias (MB) values for JJAS precipitation for model simulations with respect to CHIRPS, calculated for the Guinea coast, Central Sahel, West Sahel and the entire West Africa domains during the 2003 and 2004 periods.
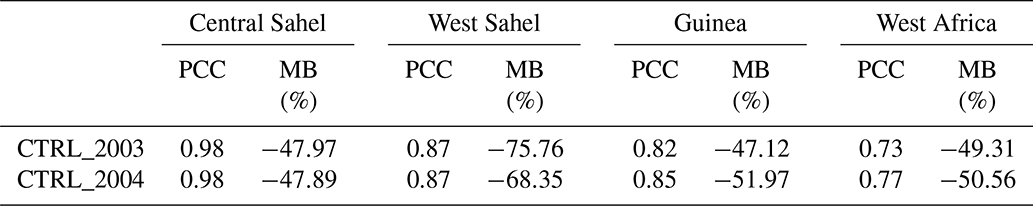

Figure 5PDF distributions (%) of mean precipitation changes in JJAS 2003 and JJAS 2004 over the (a) Central Sahel, (b) West Sahel, (c) Guinea coast and (d) West Africa domains derived from dry (ΔDC) and wet (ΔWC) experiments compared to the control experiment.
Dry and wet sensitivity experiments showed that precipitation is significantly affected by soil moisture initial conditions at a magnitude that varies with the subregion (Fig. 4). Over the Central Sahel, for the dry experiments (Fig. 4a, c), we found a precipitation decrease for JJAS 2003 and JJAS 2004 (Fig. 4a, c). On the other hand, over the Guinea coast, we found an increase in rainfall for both JJAS 2003 and JJAS 2004. For the wet experiments (Fig. 4b, d), there is an increase in rainfall over most of the study domains for both JJAS 2003 and JJAS 2004. Overall, the impact of the soil moisture initial conditions on the precipitation is linear only over the Central Sahel for both JJAS 2003 and JJAS 2004. Therefore, the dry (wet) experiments exhibit a significant decrease (increase) in precipitation with respect to the control experiments (Fig. 4a, c).
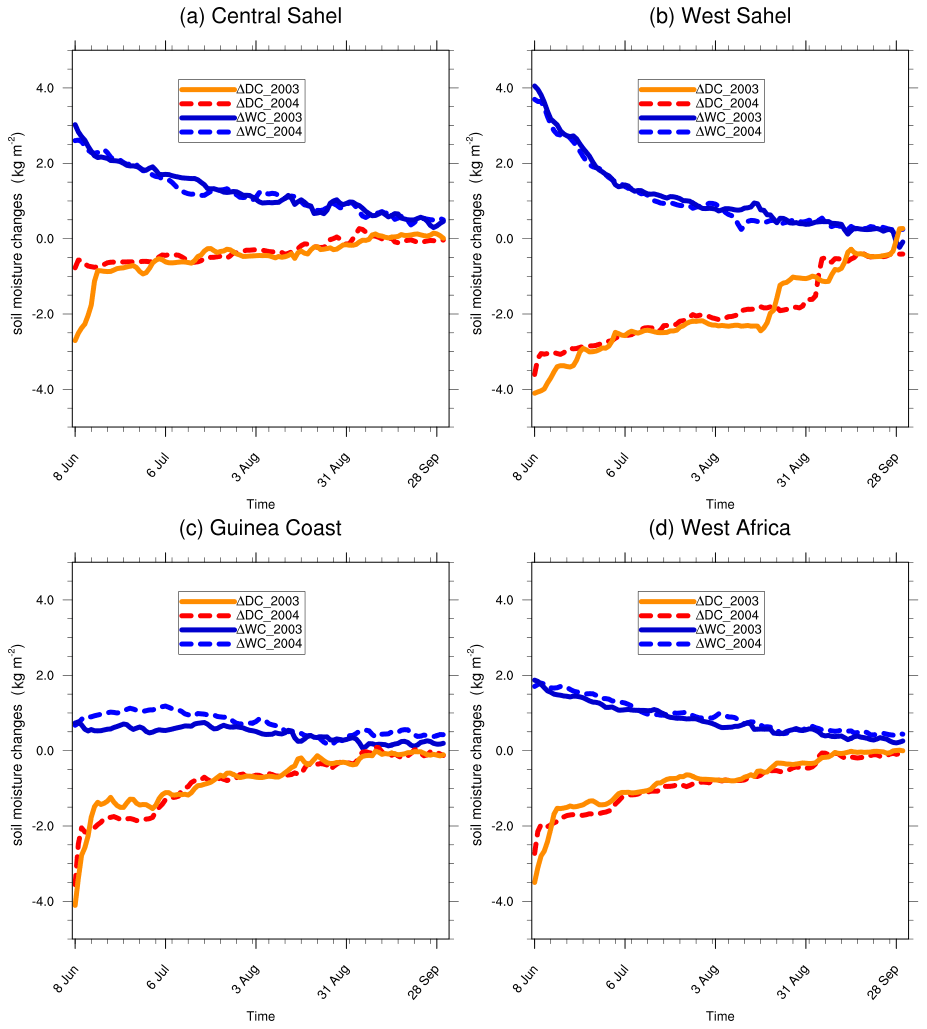
Figure 6Daily domain-averaged soil moisture changes for JJAS 2003 and JJAS 2004 from dry (ΔDC) and wet (ΔWC) experiments with respect to the control experiment.
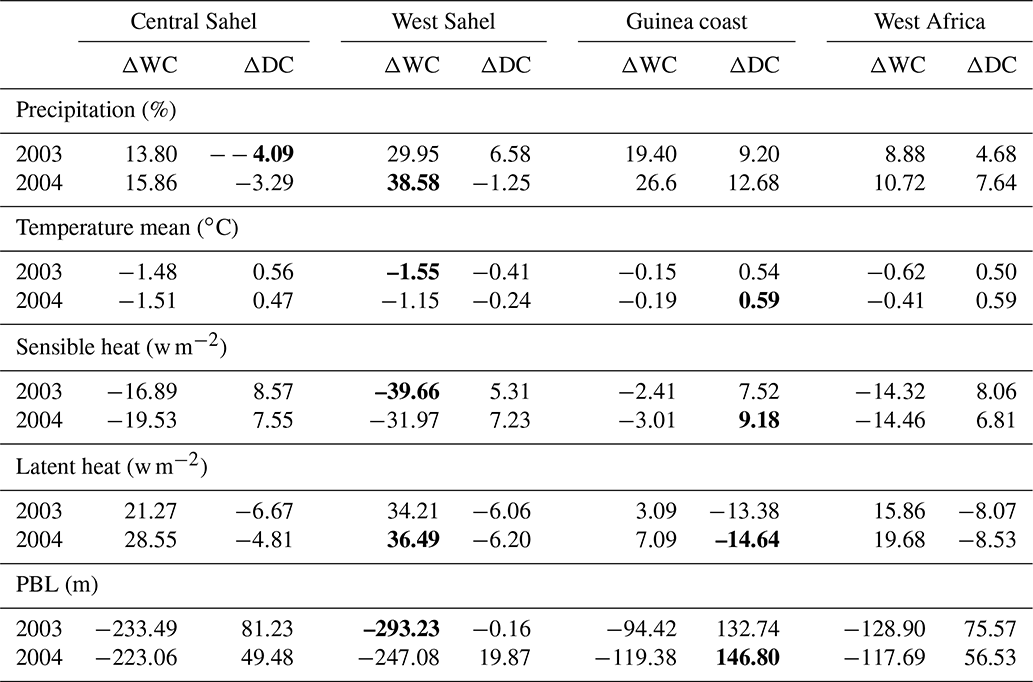
For a better quantitative evaluation, the PDF distributions of precipitation changes in JJAS 2003 and JJAS 2004 over the Central Sahel (Fig. 5a), West Sahel (Fig. 5b), Guinea coast (Fig. 5c) and West Africa (Fig. 5d) domains obtained from dry and wet experiments with respect to the control experiments are shown. Table 2 summarizes the maximum values of changes obtained from the PDFs of the different variables used in this study. The impact of the soil moisture initial conditions on precipitation is linear only over the Central Sahel (Fig. 5a), where the change in dry (wet) experiments showed a precipitation decrease (increase). The strongest precipitation increase is found over the West Sahel for the wet experiment, with a maximum change of 40 %; however, the strongest precipitation decrease is found over the Central Sahel for dry experiments, with a maximum change value of about −4 % (Table 2). We note that the impacts of the wet experiments on precipitation are greater than those from dry experiments (Table 2). These results are consistent with previous studies that have supported a strong relationship between precipitation and soil moisture, in particular over transition zones with a climate between wet and dry climate regimes (Koster et al., 2004; Liu et al., 2014; Douville et al., 2001).
Table 2Table summarizing the maximum values of change obtained from the PDF distribution for precipitation, temperature, sensible heat, latent heat and the PBL, calculated for the Guinea coast, Central Sahel, West Sahel and entire West Africa domains during the JJAS 2003 and JJAS 2004 periods. Values in bold indicate regions with the smallest and largest changes in maximum values for the dry and wet experiments.
Figures 6 and 7 show the changes in the daily soil moisture and precipitation, respectively, from dry and wet experiments with respect to the control experiments during the JJAS 2003 and JJAS 2004 runs. To compute the changes in daily soil moisture, we considered the second topsoil layer in CLM4.5 (from 0 to 2.80 cm). In general, the impacts of soil moisture initial conditions on the daily soil moisture persist for 3–4 months over the study domains (Fig. 6). The strongest duration and amplitude of the impact on the daily soil moisture is found over the West Sahel subregion. The impact on the daily soil moisture lasts 4 months in JJAS 2003 and JJAS 2004. For wet experiments, the weakest duration of the impact of soil moisture initial conditions is found over the Guinea coast and lasts 3 months (Fig. 6c). In contrast, for dry experiments, the weakest impact on the daily soil moisture is found over the Central Sahel and lasts 3 months (Fig. 6a). These results are in line with previous works which argued that the soil moisture–atmosphere feedback strength and the land memory are location dependent (Vinnikov et al., 1996; Vinnikov and Yeserkepova, 1991).
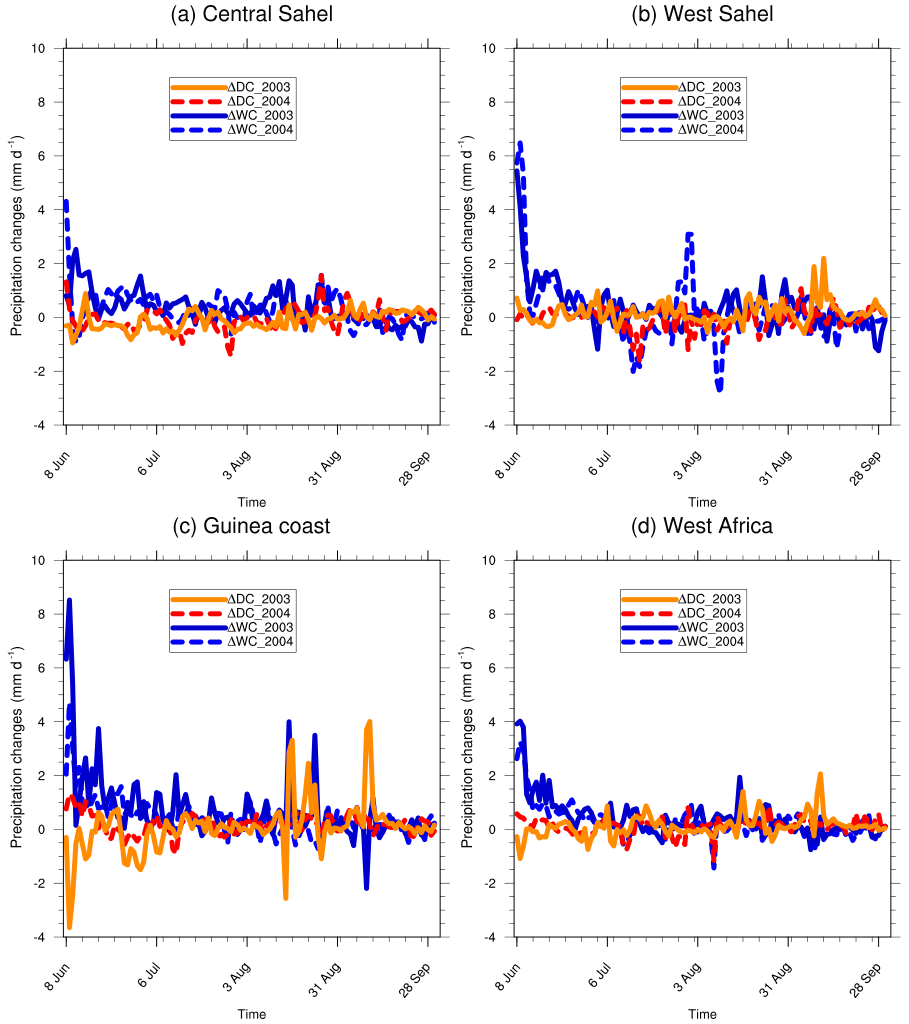
Figure 7Daily domain-averaged precipitation changes for JJAS 2003 and JJAS 2004 from dry (ΔDC) and wet (ΔWC) experiments with respect to the control experiment.
Figure 7 shows the changes in the daily precipitation to the soil moisture initial conditions over the different study domains. The impact of the wet experiments on daily precipitation is greater in magnitude than that of dry experiments over most study domains (Fig. 7). For dry experiments, the strongest daily precipitation response (about −4 mm d−1) is found over the Guinea coast in the JJAS 2003 run (Fig. 7c). In contrast, for the wet experiments, the strongest impact on the daily precipitation (more than 8 mm d−1) is found over the West Sahel and the Guinea coast (Fig. 7b and c, respectively). It is worth noting that the impact of initial soil moisture conditions on daily precipitation is much shorter than the duration of the impact on daily soil moisture. The significant impact on daily precipitation was found only for wet experiments and did not last more than 15 d in large parts of the study domain, except over a wetter subregion of the Guinea coast where it lasted approximately 1 month. We note that the precipitation peaks over the West Sahel and Guinea coast (Fig. 7b and c, respectively) during August and September coincide with fluctuation in the daily soil moisture impact (Fig. 6b and c, respectively). This probably indicates the strong feedback of soil moisture and precipitation during this period over the Guinea coast and West Sahel regions.
To investigate the causes of the precipitation changes, we examined the vertical profile change in relative humidity and air temperature for the JJAS 2003 and JJAS 2004 runs, respectively, from dry and wet experiments with respect their control experiment.
The impacts of soil moisture initial conditions on relative humidity and air temperature (Figs. 8 and 9, respectively) are significant in the lower troposphere. In the low and middle troposphere, a drying and warming are found in the dry experiments, whereas a moistening and cooling are simulated in the wet experiments. This indicates that a weak (strong) dry convection is found over most of the study domains for dry (wet) experiments. The strongest impact on the relative humidity and temperature in the lower and middle troposphere is found over the Central Sahel (see Figs. 8a and 9a).
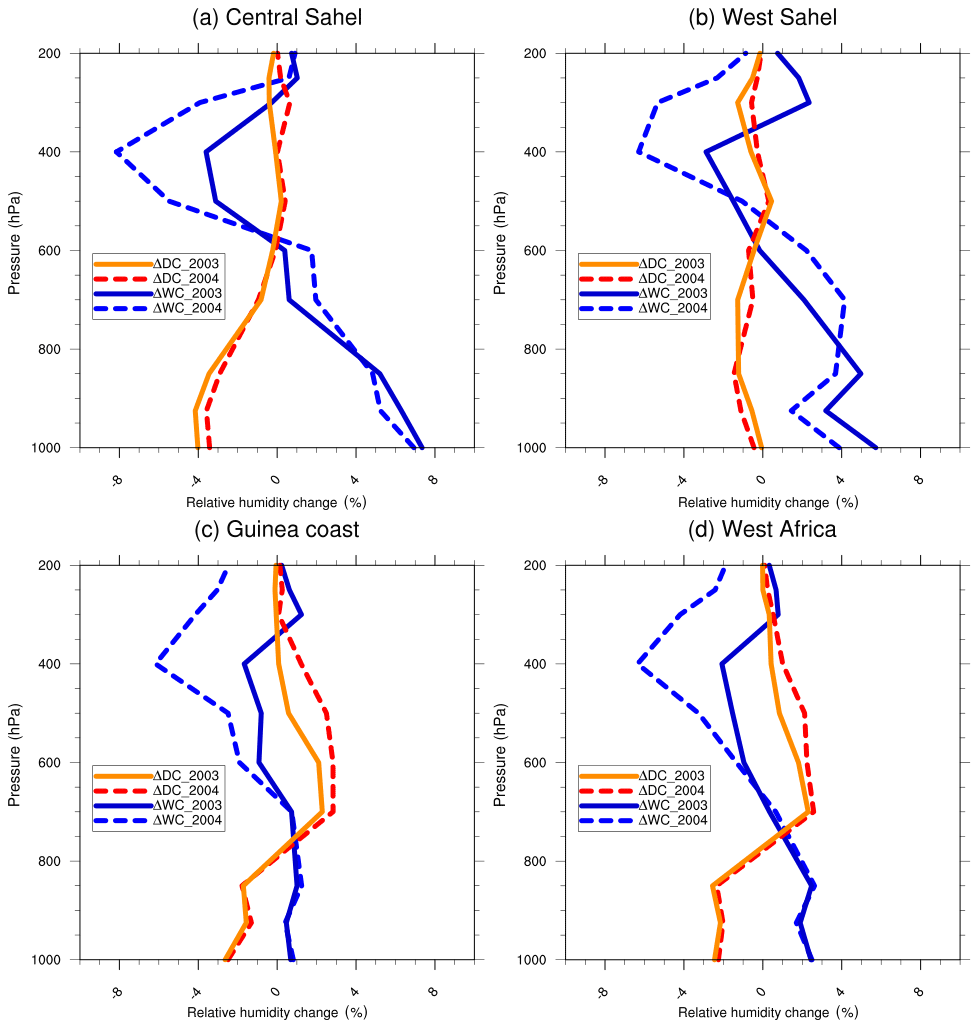
Figure 8Vertical profile changes in relative humidity for JJAS 2003 and JJAS 2004 from the dry (ΔDC) and wet (ΔWC) experiments with respect to the corresponding control experiment over the (a) Central Sahel, (b) West Sahel, (c) Guinea coast and (d) West Africa.
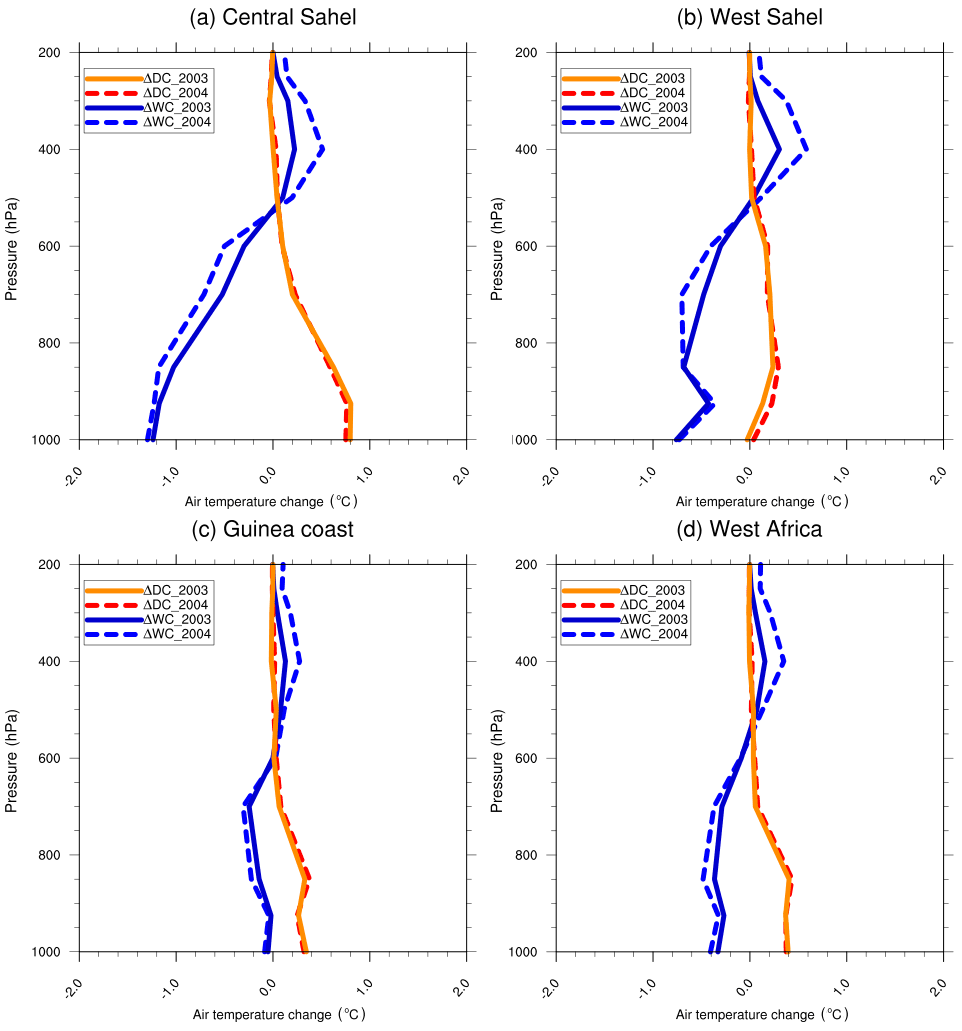
Figure 9Vertical profile changes in temperature for JJAS 2003 and JJAS 2004 from the dry (ΔDC) and wet (ΔWC) experiments with respect to the control experiment over the (a) Central Sahel, (b) West Sahel, (c) Guinea coast and (d) West Africa.
For the upper troposphere, a significant impact of soil moisture initial conditions on relative humidity and temperature is found only for wet experiments, with this region exhibiting a drying and warming over most of the study domains (Figs. 8, 9). This impact for the wet experiments was also reported by Hong and Pan (2000).
To understand other causes of the precipitation changes illustrated in Fig. 4, we analyzed the changes in lower-tropospheric wind (850 hPa) and specific humidity for the JJAS 2003 and JJAS 2004 runs during the dry and wet experiments with respect to the control experiments (Fig. 10). For the dry experiments (Fig. 10a, c), we found that the moistening of the lower atmosphere decreases over most of the study domain. However, the strong wind magnitude changes over the Atlantic Ocean, transporting the moistening from the ocean to the Guinea coast and West Sahel. This can explain the precipitation increase over these subregions in the dry experiments. Over the Central Sahel, the strong decrease in precipitation seems to be associated with the decrease in specific humidity, which is particularly notable in the JJAS 2003 run (Fig. 4a). Conversely, for the wet experiments (Fig. 10b, d), an increase in the moistening of the atmosphere is found mainly over the Sahel band, while a decrease in the specific humidity is simulated further south over the Guinea coast. The strong change in wind magnitude shifts the moistening from the north to the south, leading to a precipitation increase over most parts of the study domain (Fig. 4b, d). These results are broadly consistent with the precipitation changes for dry and wet experiments shown in Fig. 4.
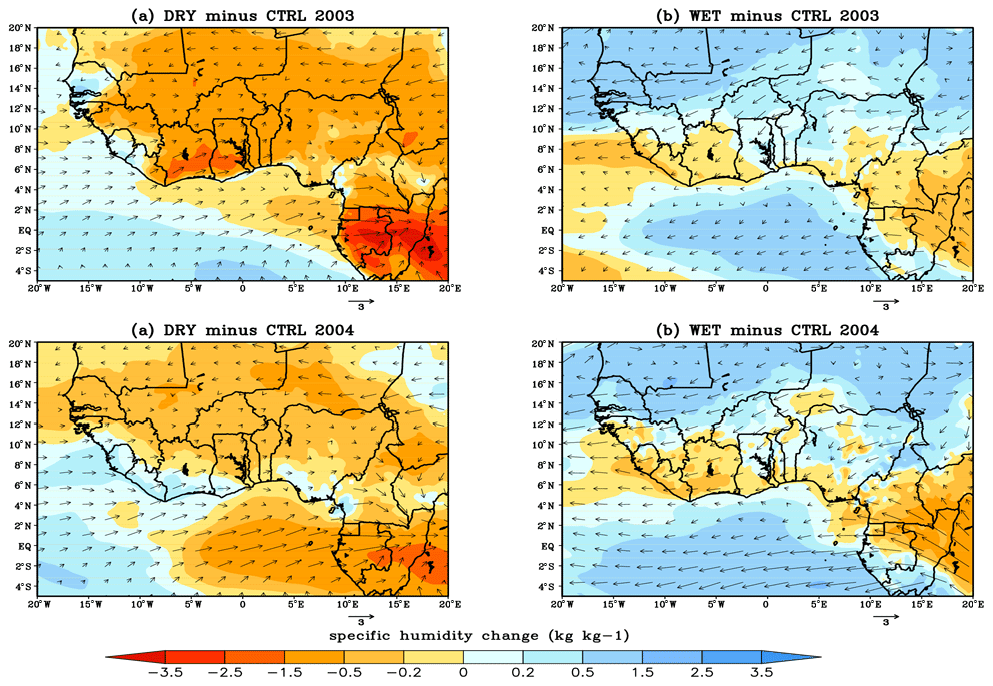
Figure 10The lower-tropospheric wind (850 hPa) and moisture bias for JJAS 2003 and JJAS 2004 from the dry (a, c) and wet (b, d) experiments with respect to the control experiment.
Summarizing these results, the impact of soil moisture initial conditions is linear only over the Central Sahel for the JJAS 2003 and JJAS 2004 runs. The strongest precipitation decrease is found over the Central Sahel for the dry experiment in the JJAS 2003 run, with maximum change reaching −4 %, whereas the strongest precipitation increase is found over the West Sahel for the wet experiment in the JJAS 2004 run, with a maximum change of about 40 %. The impact of soil moisture initial conditions on daily soil moisture can persist for 3–4 months depending on the subdomain, whereas the significant impact on precipitation (greater than 1 mm d−1) is much shorter and no longer than 1 month. The impact of soil moisture initial conditions is mostly confined to the near-surface climate and, somewhat, to the upper troposphere.
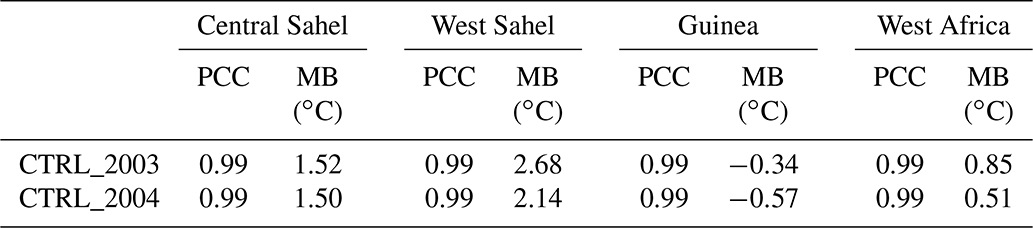
Table 3The pattern correlation coefficient (PCC) and the mean bias (MB) values for the JJAS 2 m temperature for model simulations with respect to CRU, calculated for the Guinea coast, Central Sahel, West Sahel and entire West Africa domains during the JJAS 2003 and JJAS 2004 periods.
3.2 Influence on temperature and other surface fluxes
Figure 11 shows the spatial distribution of the mean observed 2m temperature from CRU during JJAS 2003 and JJAS 2004 (Fig. 11a and c, respectively) and the mean simulated temperature from the control experiments of the JJAS 2003 and JJAS 2004 runs (Fig. 11b and d, respectively) initialized with ERA-20C. Table 3 summarizes the PCC and MB values between model simulations of temperature with respect to CRU, calculated for the West Sahel, Central Sahel, Guinea coast and entire West Africa domains. The CRU temperature displays a zonal distribution over the entire West Africa domain. Maximum values of approximately 34 ∘C are found over the Sahara, whereas the lowest temperatures (not exceeding 26 ∘C) are located over the Guinea coast, especially in orographic regions such as the Guinea Highlands, the Cameroon Mountains and the Jos Plateau. The control experiments (Fig. 11b, d) showed good agreement in the representation of the large-scale pattern of the CRU observations, with a PCC of about 0.99 for both JJAS 2003 and JJAS 2004 (Table 3), including the meridional gradient between the Sahara Desert and Guinea coast, which is crucial for the African easterly jet evolution and formation (Thorncroft and Blackburn, 1999; Cook, 1999). The spatial extents of temperature maxima and minima are well reproduced by control experiments; however, their magnitudes are overestimated compared with CRU. The strongest warm MB values of the control experiments relative to CRU are approximately 2.68 and 2.14 ∘C for JJAS 2003 and JJAS 2004, respectively; they are found over the West Sahel (Table 3).
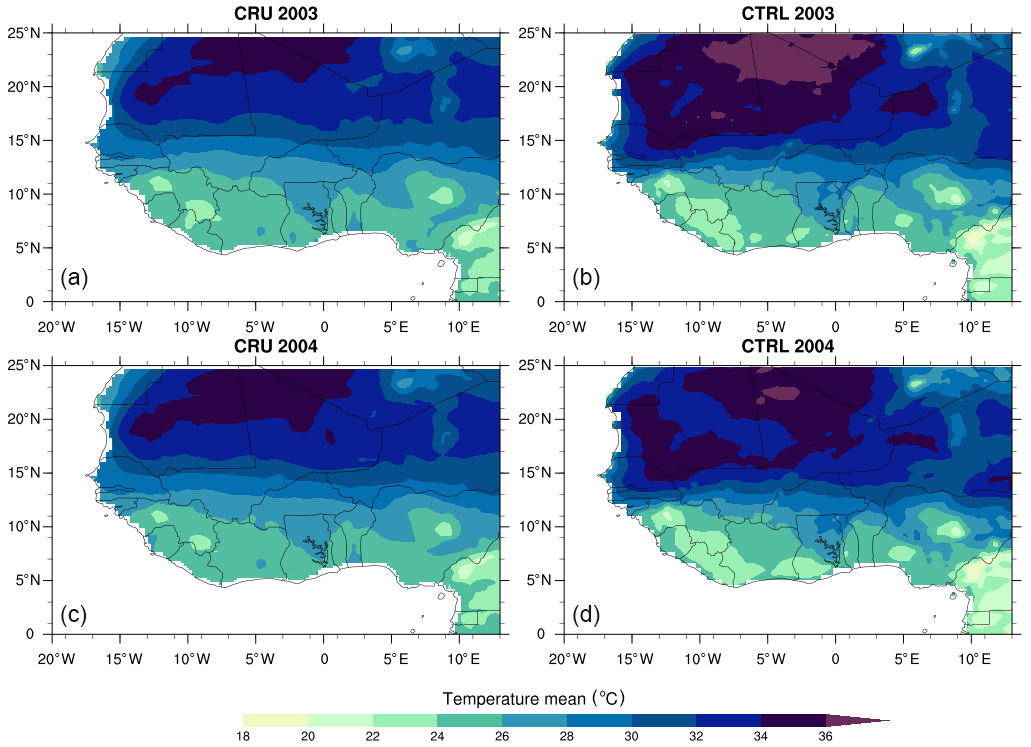
Figure 11Mean 2 m temperature (∘C) from CRU (a, c) for JJAS 2003 and JJAS 2004 and the simulated control experiment (b, d) with the reanalysis initial soil moisture from ERA-20C.
Figure 12 shows changes in mean temperature for the JJAS 2003 and JJAS 2004 runs of dry and wet experiments with respect to the control experiments. The dots show areas where the impacts of soil moisture initial conditions are statistically significant at the 0.05 level. In the dry experiments, for both the JJAS 2003 and JJAS 2004 runs, the warmest changes are located under the latitude of 13∘ N, with maximum values located over the Guinea coast. For the wet experiments, the coolest changes are found over the West and Central Sahel domains.
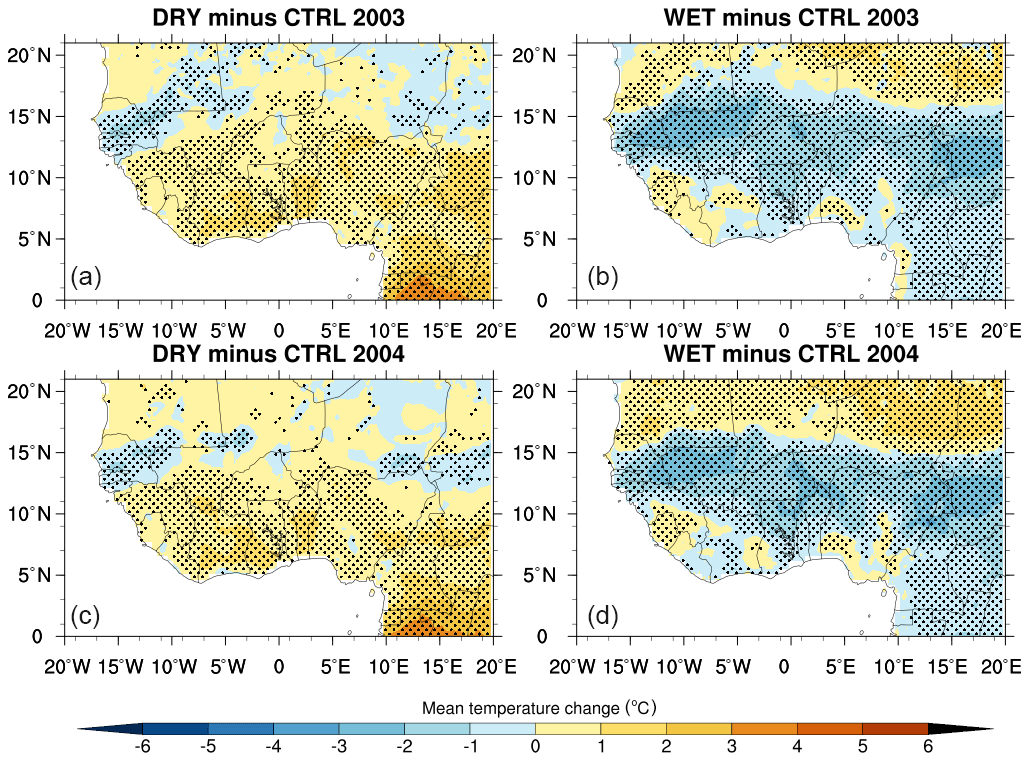
Figure 12Changes in 2 m temperature (∘C) for JJAS 2003 and JJAS 2004 from dry (a and c, respectively) and wet (b and d, respectively) experiments with respect to the control experiment; the dotted area shows differences that are statistically significant at the 0.05 level.
For a better quantitative evaluation, the PDF distributions of the changes in mean temperature in the JJAS 2003 and JJAS 2004 runs are shown in Fig. 13. The impact on temperature is linear over the Central Sahel, Guinea coast and entire West Africa domains (Fig. 13a, c and d, respectively). The strongest mean temperature decrease is observed over the Central and West Sahel in wet experiments, with a maximum change of approximately −1.5 ∘C (Table 2). In contrast, the strongest increase in mean temperature is found over the Central Sahel (JJAS 2003) and the Guinea coast (JJAS 2004) in dry experiments, reaching 0.56 and 0.59 ∘C, respectively (Table 2). Overall, the impact on 2 m temperature in the dry (wet) sensitivity experiments showed an increase (decrease) in warming (cooling) for both JJAS 2003 and JJAS 2004 over most of the study domains. An exception is found over the West Sahel, where both dry and wet experiments lead to temperature increase (Fig. 13, Table 2).
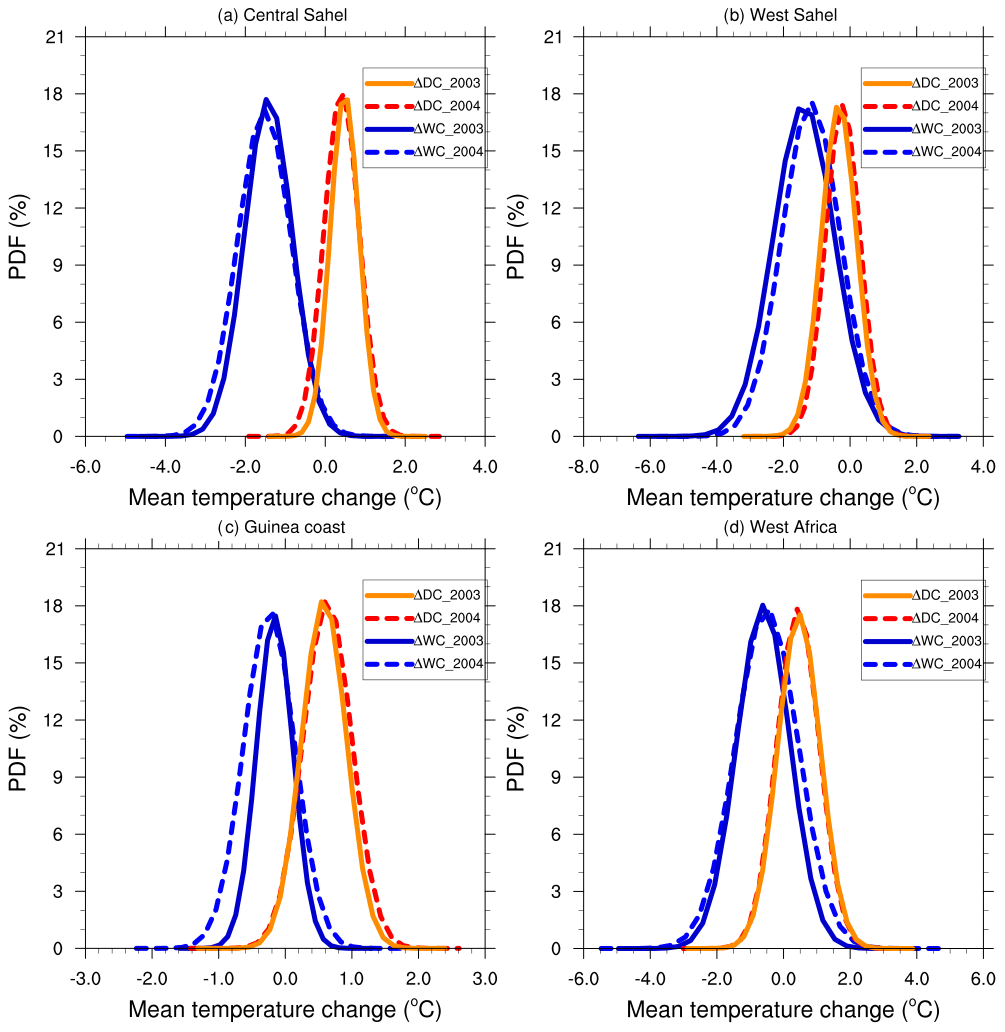
Figure 13PDF distributions (%) of mean temperature changes in JJAS 2003 and JJAS 2004 over the (a) Central Sahel, (b) West Sahel, (c) Guinea and (d) West Africa derived from dry (ΔDC) and wet (ΔWC) experiments compared to the control experiment.
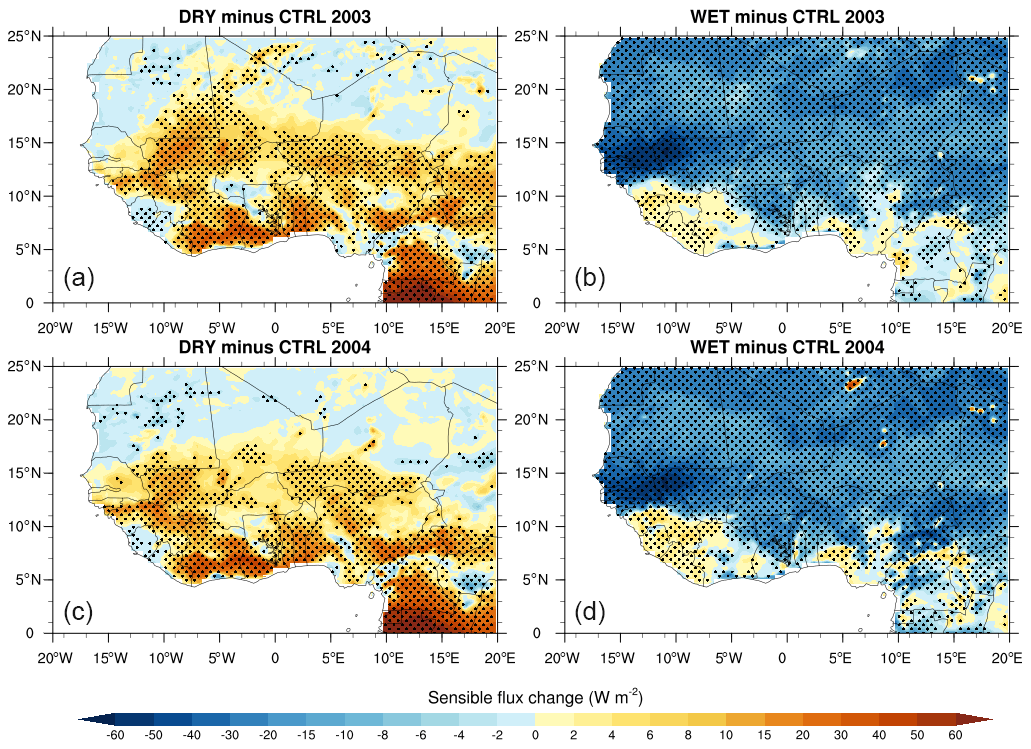
Figure 14Same as Fig. 12 but for sensible heat fluxes (in W m−2).
We now analyze the influence of soil moisture initial condition anomalies on the land energy balance, particularly on the surface fluxes of sensible and latent heat. Figure 14 shows changes in the sensible heat fluxes (in W m−2) in the JJAS 2003 and JJAS 2004 runs from dry and wet experiments compared with the control experiments. The dots show changes that are statistically significant at the 0.05 level. As shown in Fig. 14, the impact of soil moisture initial conditions on sensible fluxes is strong. It is linear over most of the study domains: the dry (wet) experiments exhibit a significant increase (decrease) in the sensible heat with respect to the control (Fig. 14).
The PDF distributions of change in sensible heat flux are displayed in Fig. 15. The dry (wet) experiments showed an increase (decrease) in the sensible flux in both the JJAS 2003 and JJAS 2004 runs (Fig. 15). The impact in wet experiments is strong over the Central and West Sahel compared with the dry experiments, although this is not the case for the Guinea coast (Fig. 15, Table 2). In the dry experiments, the strongest sensible heat flux increase is found over the Guinea coast, with a maximum change of about 9.18 W m−2 during JJAS 2004 (see Table 2). In the wet experiments, the strongest sensible heat flux decrease is located over the Central Sahel with a maximum change of about −39.66 W m−2 during JJAS 2003 (see Table 2).
Unlike the case of sensible heat flux, changes in latent heat show a linearly inverse pattern. Dry experiments result in a latent heat flux decrease, whereas the wet experiments result in a latent heat flux increase over most of the study domains (Fig. 16). The PDF distributions of latent heat flux changes are shown in Fig. 17. In the wet experiments, the strongest latent heat flux increase is found over the West Sahel, with the maximum change reaching 36.49 W m−2 in JJAS 2004 (Table 2). In the dry experiments, the strongest latent heat flux decrease is located over the Guinea coast, with the maximum change reaching −14.64 W m−2 in JJAS 2004 (Table 2). It is worth noting that the impacts on the latent and sensible heat flux in wet experiments are stronger than those in the dry experiments over most of the study domains, except over the Guinea coast (Table 2).
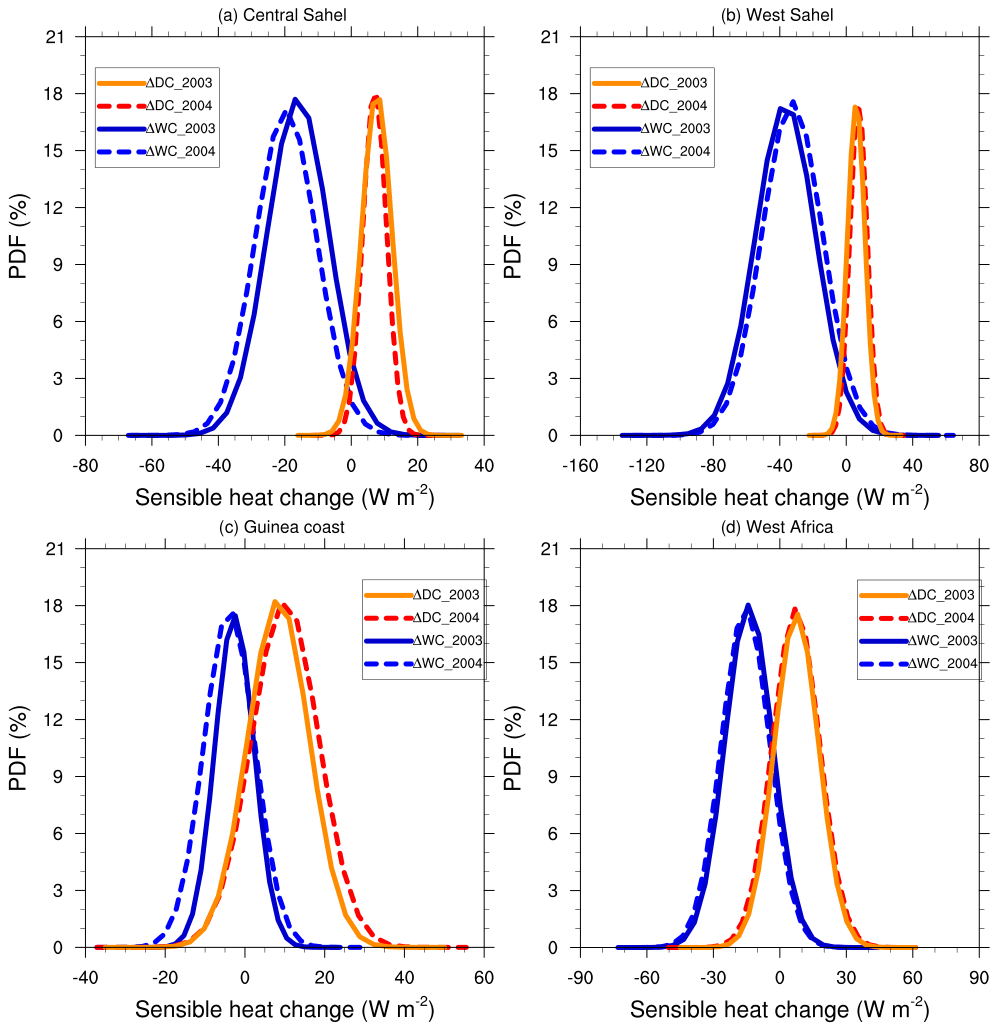
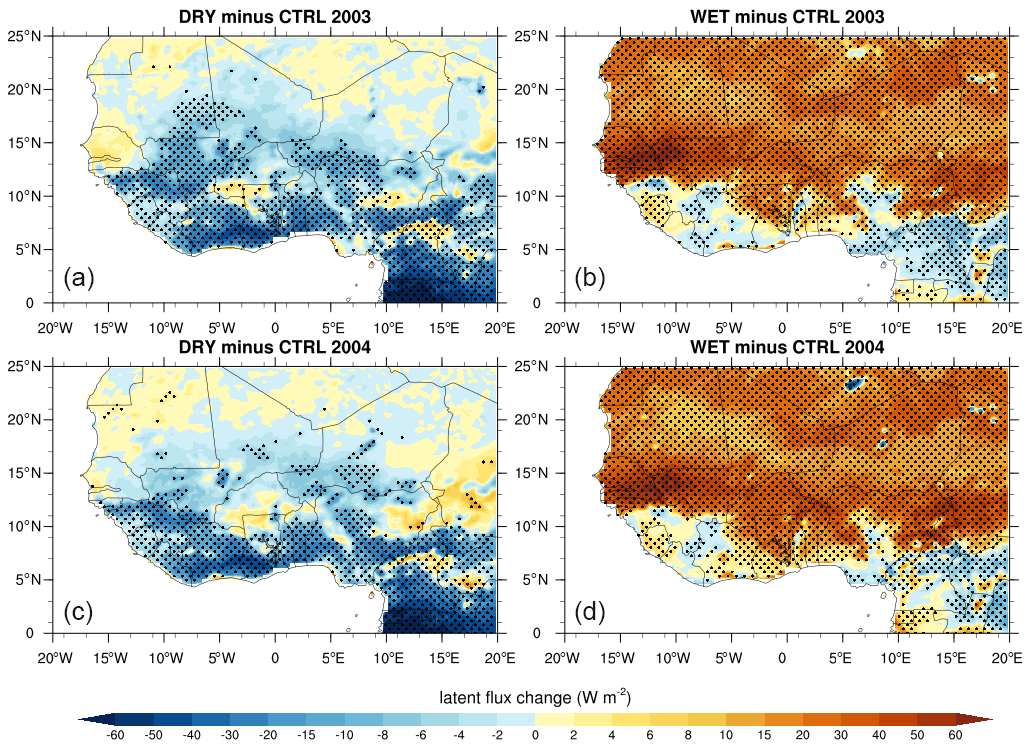
Figure 16Same as Fig. 12 but for latent heat fluxes (in W m−2).

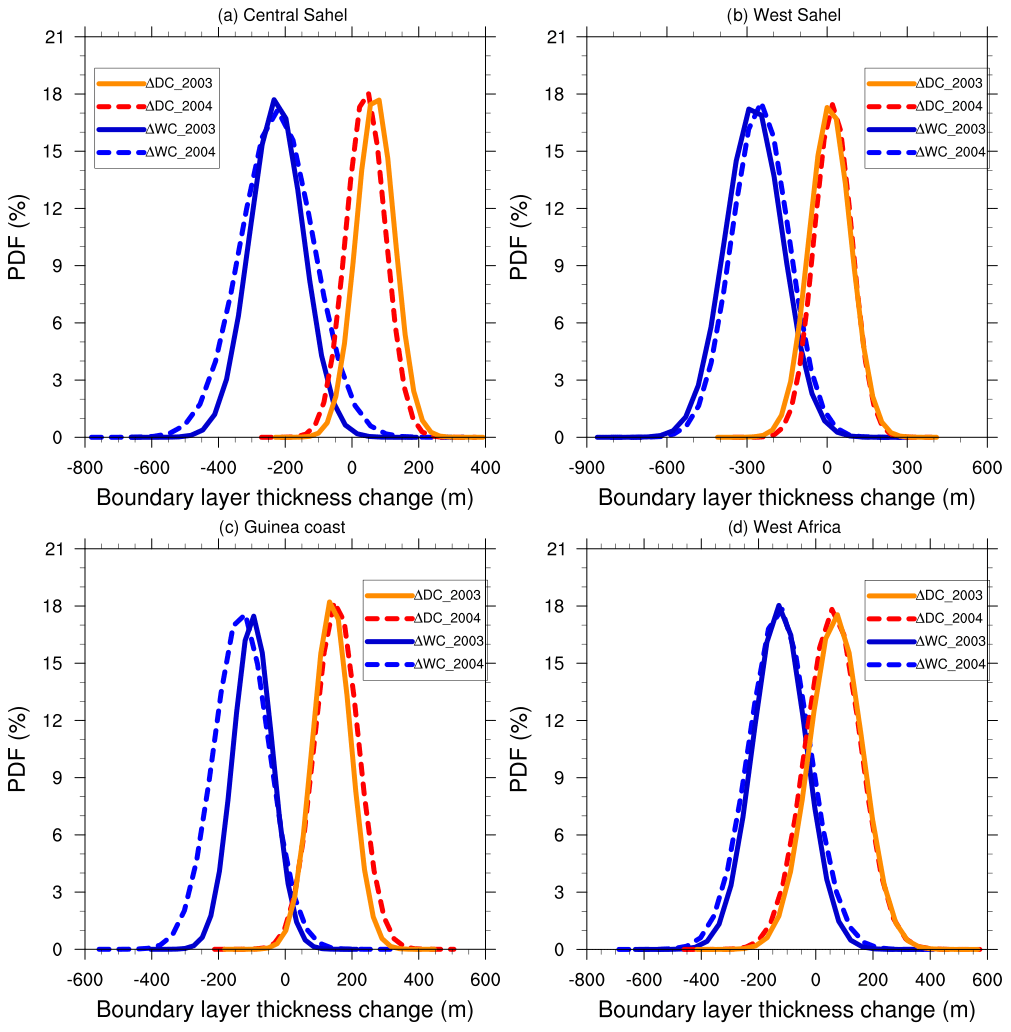
We then examined the impact of the soil moisture initial conditions on the stability of the PBL. Different spatial distributions of surface fluxes significantly affect the boundary layer development. Soil moisture can influence rainfall by limiting evapotranspiration, which affects the development of the daytime PBL and, therefore, the initiation and intensity of convective precipitation (Eltahir, 1998). Figure 18 shows changes in the PBL (in m) for JJAS 2003 and JJAS 2004 for dry and wet experiments with respect to the control experiments; dotted areas in the figure are statistically significant at the 0.05 level. The soil moisture initial conditions significantly impact the PBL. The dry experiments show a PBL increase under a latitude of 15∘ N for both JJAS 2003 and JJAS 2004 (Fig. 18a and c, respectively). For the wet experiments, a PBL decrease is found over most of the study domains. The PDFs of the PBL changes (Fig. 19) show that the impact on the PBL is linear over most of the study domains. The dry (wet) experiments lead to an increase (decrease) in the PBL for both JJAS 2003 and JJAS 2004. The strongest PBL increase (decrease) is found over the Guinea coast (West Sahel) in dry (wet) experiments during JJAS 2004 (JJAS 2003), reaching 146.80 m (−293.23 m). Dry (wet) air is located above the areas where the PBL increases (decreases), causing the air column to become warm (cool) and dry (moist) for the dry (wet) experiment (see Figs. 8 and 9). These results are consistent with the work of Hong and Pan (2000).
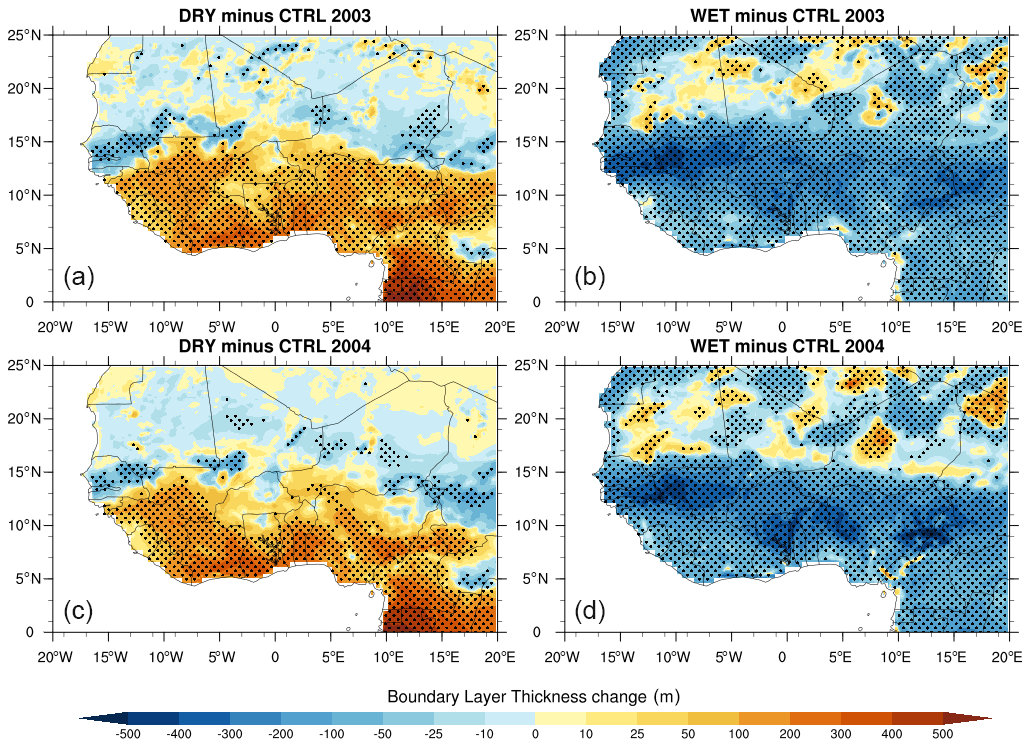
Figure 18Same as Fig. 12 but for the change in the height of the planetary boundary layer (in m).
Summarizing the results of this section, we found that the cooling of the mean temperature is associated with an increase in the latent heat flux, a decrease in the sensible heat flux and a decrease in the PBL depth over most of the study domain in the wet experiments. Conversely, in dry experiments, the warming of the surface temperature is associated with a decrease in latent heat, an increase in sensible heat flux and an increase in the PBL depth.
The impact of the soil moisture initial conditions on the subsequent summer (JJAS) mean climate over West Africa was explored using RegCM4–CLM45. In particular, the aim of this study was to investigate how soil moisture initialization at the beginning of the rainy season may affect the intra-seasonal variability of the mean temperature and precipitation within the subsequent season (June to September).
For this purpose, we set up three numerical experiments with RegCM4: on the first day (1 June), we applied a control soil moisture initial condition (control experiment), a wet soil moisture initial condition (wet experiment) and a dry soil moisture initial condition (dry experiment). For each experiment, an ensemble of five simulations beginning on 1 June and running until 30 September (JJAS) for the years 2001 to 2005 was performed. In this paper, we present the results of the two JJAS 2003 and JJAS 2004 runs most impacted by soil moisture dry and wet initial conditions, respectively, in order to avoid the effects of initial soil moisture internal forcing.
The impact of soil moisture initial conditions on precipitation is linear only over the Central Sahel for both JJAS 2003 and JJAS 2004, while it is linear over the West Sahel in JJAS 2004. In the dry experiment, the strongest precipitation decrease is found over the Central Sahel in JJAS 2003, with the maximum change reaching −4 %, whereas the strongest precipitation increase is found over the West Sahel in JJAS 2004 in the wet experiment, with the maximum change reaching 40 %. The impact of soil moisture initial conditions can persist for 3–4 months (90–120 d) depending on the subregion, but the impact on precipitation is no longer than 30 d (15 d over the Sahel and 30 d over the Guinea coast). This study shows that the sensitivity of rainfall to initial soil moisture conditions is not captured when averaged over the entire West African region. However, it is important to have a good initialization of soil moisture because the sensitivity of rainfall can vary depending on the region. Indeed, rainfall is more sensitive to initial soil moisture conditions in the West and Central Sahel domains (arid zones) than in the Guinea coast region (humid zone). In these arid Sahelian zones, wetter initial conditions will result in more rainfall, especially in the West Sahel, and dry initial conditions will result in less rainfall, especially in the Central Sahel. For the Guinea coast, the sensitivity of precipitation to initial soil moisture conditions is lower, and other factors could be involved, such as moisture advection from the Atlantic by the monsoon flow (Koné et al., 2018) and a lower albedo (Charney, 1975).
Our results show that wet soil moisture initial conditions lead to an increase in relative humidity in the lower troposphere associated with a cooling of air temperature, whereas they lead to a decrease in relative humidity and a warming of air temperature in the upper troposphere. In contrast, the dry initial conditions mainly impact the lower troposphere, with a decrease in the relative humidity associated with warming air temperature.
The temperature at 2 m is more sensitive to anomalies in the initial soil moisture conditions than the precipitation. The strongest impact on the 2 m temperature is found over the Central Sahel, with a maximum change of about −1.5 and 0.6 ∘C for the wet and dry experiments, respectively.
Our study showed significant impacts of soil moisture initial conditions on the surface energy fluxes. For the wet experiments, we found that the cooling of surface temperature is associated with a decrease in the sensible heat flux, an increase in the latent heat flux and a decrease in the PBL depth. For the dry experiments, the warming of surface temperature is associated with an increase in the sensible heat flux, a decrease in the latent heat flux and an increase in the PBL depth.
This study showed that soil moisture as a boundary condition plays a major role in controlling summer climate variability not only over the Sahel band but also over humid zones such as the Guinea coast. Therefore, good prescription of soil moisture initial conditions could improve the simulation of precipitation and temperature, which would help to reduce biases in climate model simulations. Overall, land surface initialization can contribute to improving subseasonal to seasonal forecast skill, but this requires further investigation.
This study is the first investigating the impact of soil moisture initial conditions in West Africa. However, this study is based on idealized experiments: sensitivity experiments such as the “wet” and “dry” experiments conducted in this study were not intended to simulate real climate, as such extremes are very rare. Moreover, this study is very specific to RegCM4. In the future, an investigation using different RCMs in a multi-model framework will contribute to better quantify the impact of soil moisture initial conditions. At shorter timescales, there is a need to understand how the soil moisture initial conditions contribute to the triggering and maintenance of the mesoscale convective systems which are known to explain a large amount of rainfall in the region (Mathon et al., 2002). Finally, in the context of climate change, considering the projected increase in high-impact weather events in the region, there is a need to explore the sensitivity of soil moisture initial conditions to climate extremes.
The RegCM4.7 model is freely available for public use at https://github.com/ICTP/RegCM/releases/tag/4.7.1 (Giuliani, 2021). The NCL language was used for the computations and the plots, and the source can be found at https://www.ncl.ucar.edu/ (NCAR, 2019).
The validation of simulated precipitation was done using the high-resolution 0.05∘ Climate Hazards Group InfraRed Precipitation with Station (CHIRPS) dataset, developed at the University of California at Santa Barbara, for the period from 1981 to 2020 (Funk et al., 2015). The CHIRPS dataset is available from https://data.chc.ucsb.edu/products/CHIRPS-2.0/global_daily/netcdf/p05/ (Funk et al., 2014).
The validation of simulated 2 m temperature relies on the CRU (Climate Research Unit) datasets, version 3.20, from the University of East Anglia, gridded at a horizontal resolution of 0.5∘ for the period from 1901 to 2011 (Harris et al., 2013). The CRU dataset is available from https://doi.org/10.5285/edf8febfdaad48abb2cbaf7d7e846a86 (Harris and Jones, 2017).
BK and ADie fixed the analysis framework. BK carried out all of the simulations and produced the figures according to the work plan proposed by ADie and ADia. All co-authors contributed to the analyses and to drafting this paper.
The contact author has declared that neither they nor their co-authors have any competing interests.
Publisher's note: Copernicus Publications remains neutral with regard to jurisdictional claims in published maps and institutional affiliations.
The research leading to this publication is co-funded by the NERC/DFID “Future Climate for Africa” program under the AMMA-2050 project (grant no. NE/M019969/1) and by the Institut de Recherche pour le Développement (IRD), France (UMR IGE Imputation, grant no. 252RA5).
This research has been supported by the NERC/DFID “Future Climate for Africa” program (grant no. NE/M019969/1) and the Institut de Recherche pour le Développement (IRD), France (UMR IGE Imputation, grant no. 252RA5).
This paper was edited by Shraddhanand Shukla and reviewed by three anonymous referees.
Charney, J. G.: Dynamics of deserts and drought in the Sahel, Q. J. Roy. Meteorol. Soc., 101, 193–202, https://doi.org/10.1002/qj.49710142802, 1975.
Cook, K. H.: Generation of the African easterly jet and its role in determining West African precipitation, J. Climate, 12, 1165–1184, https://doi.org/10.1175/1520-0442(1999)012<1165:GOTAEJ>2.0.CO;2, 1999.
Damien, D., Chung, C. E., Ekman, A. M. L., and Brandefelt, J.: Which significance test performs the best in climate simulations?, Tellus A, 66, 23139, https://doi.org/10.3402/tellusa.v66.23139, 2014.
Danielson, J. J. and Gesch, D. B.: Global multi-resolution terrain elevation data 2010 (GMTED2010): US Geological Survey Open-File Report 2011-1073, p. 26, https://doi.org/10.3133/ofr20111073, 2011.
Diedhiou, A. and Mahfouf, J. F.: Comparative influence of land and sea surfaces on the Sahelian drought: a numerical study, Ann. Geophys., 14, 115–130, https://doi.org/10.1007/s00585-996-0115-6, 1996.
Dirmeyer, P. A., Koster, R. D., and Guo, Z.: Do global models properly represent the feedback between land and atmosphere, J. Hydrometeorol., 7, 1177–1198, https://doi.org/10.1175/JHM532.1, 2006.
Douville, F., Chauvin, F., and Broqua, H.: Influence of soil moisture on the Asian and African monsoons. Part I: Mean monsoon and daily precipitation, J. Climate, 14, 2381–2403, 2001.
Eltahir, E. A. B.: A soil moisture-rainfall feedback mechanism 1. Theory and observations, Water Resour. Res., 34, 765–776, https://doi.org/10.1029/97WR03499, 1998.
Emanuel, K. A.: A scheme for representing cumulus convection in large-scale models, J. Atmos. Sci., 48, 2313–2335, 1991.
Funk, C., Peterson, P., Landsfeld, M., Pedreros, D., Verdin, J., Shukla, S., Husak, G., Rowland, J., Harrison, L., Hoell, A., and Michaelsen, J.: The climate hazards infrared precipitation with stations – a new environmental record for monitoring extremes, Sci. Data, 2, 150066, https://doi.org/10.1038/sdata.2015.66, 2015.
Funk, C. C., Peterson, P. J., Landsfeld, M. F., Pedreros, D. H., Verdin, J. P., Rowland, J. D., Romero, B. E., Husak, G. J., Michaelsen, J. C., and Verdin, A. P.: A quasi-global precipitation time series for drought monitoring, US Geological Survey Data Series 832, US Geological Survey [data set], p. 4, https://data.chc.ucsb.edu/products/CHIRPS-2.0/global_daily/netcdf/p05/ (last access: 7 February 2022), 2014.
Gao, X.-J., Shi, Y., and Giorgi, F.: Comparison of convective parameterizations in RegCM4 experiments over China with CLM as the land surface model, Atmos. Ocean. Sci. Lett., 9, 246–254, https://doi.org/10.1080/16742834.2016.1172938, 2016.
Giorgi, F., Coppola, E., Solmon, F., Mariotti, L., Sylla, M. B., Bi, X., Elguindi, N., Diro, G. T., Nair, V., Giuliani, G., Cozzini, S., Guettler, I., O'Brien, T., Tawfik, A., Shalaby, A., Zakey, A. S., Steiner, A., Stordal, F., Sloan, L., and Brankovic, C.: RegCM4: model description and preliminary tests over multiple CORDEX domains, Clim. Res., 52, 7–29, https://doi.org/10.3354/cr01018, 2012.
Giuliani, G.: The Regional Climate Model version 4.7.1 source code, ICTP [code], https://github.com/ICTP/RegCM/releases/tag/4.7.1 (last access: 7 February 2022), 2021.
Grell, G., Dudhia, J., and Stauffer, D. R.: A description of the fifth generation Penn State/NCAR Mesoscale Model (MM5), National Center for Atmospheric Research Tech Note NCAR/TN-398+STR, NCAR, Boulder, CO, https://doi.org/10.5065/D60Z716B, 1994.
Harris, I., Jones, P. D., Osborn, T. J., and Lister, D. H.: Updated high-resolution grids of monthly climatic observations, Int. J. Climatol., 34, 623–642, https://doi.org/10.1002/joc.3711, 2013.
Harris, I. C. and Jones, P. D.: CRU TS4.00: Climatic Research Unit (CRU) Time-Series (TS) version 4.00 of high-resolution gridded data of month-by-month variation in climate (Jan. 1901–Dec. 2015), Centre for Environmental Data Analysis [data set], https://doi.org/10.5285/edf8febfdaad48abb2cbaf7d7e846a86, 2017.
Holtslag, A., De Bruijn, E., and Pan, H. L.: A high resolution air mass transformation model for short-range weather forecasting, Mon. Weather Rev., 118, 1561–1575, 1990.
Hong, S.-Y. and Pan, H.-L.: Impact of soil moisture anomalies on seasonal, summertime circulation over North America in a regional climate model, J. Geophys. Res., 105, 29625–29634, 2000.
Jaeger, E. B., and Seneviratne, S. I.: Impact of soil moisture-atmosphere coupling on European climate extremes and trends in a regional climate model, Clim. Dynam., 36, 1919–1939, https://doi.org/10.1007/s00382-010-0780-8, 2011.
Kang, S., Im, E.-S., and Ahn, J.-B.: The impact of two land-surface schemes on the characteristics of summer precipitation over East Asia from the RegCM4 simulations, Int. J. Climatol., 34, 3986–3997, 2014.
Kiehl, J., Hack, J., Bonan, G., Boville, B., Breigleb, B., Williamson, D., and Rasch, P.: Description of the NCAR Community Climate Model (CCM3), National Center for Atmospheric Research Tech Note NCAR/TN-420+STR, NCAR, Boulder, CO, https://doi.org/10.5065/D6FF3Q99, 1996.
Kim, J.-E. and Hong, S.-Y.: Impact of Soil Moisture Anomalies on Summer Rainfall over East Asia: A Regional Climate Model Study, J. Climate, 20, 5732–5743, https://doi.org/10.1175/2006JCLI1358.1, 2006.
Kirtman, B. P. and Schopf, P. S.: Decadal Variability in ENSO Predictability and Prediction, J. Climate, 11, 2804–2822, https://doi.org/10.1175/1520-0442(1998)011<2804:DVIEPA>2.0.CO;2, 1998.
Koné, B., Diedhiou, A., N'datchoh, E. T., Sylla, M. B., Giorgi, F., Anquetin, S., Bamba, A., Diawara, A., and Kobea, A. T.: Sensitivity study of the regional climate model RegCM4 to different convective schemes over West Africa, Earth Syst. Dynam., 9, 1261–1278, https://doi.org/10.5194/esd-9-1261-2018, 2018.
Koné, B., Diedhiou, A., Diawara, A., Anquetin, S., Touré, N. E., Bamba, A., and Kobea, A. T.: Influence of initial soil moisture in a regional climate model study over West Africa – Part 2: Impact on the climate extremes, Hydrol. Earth Syst. Sci., 26, 731–754, https://doi.org/10.5194/hess-26-731-2022, 2022.
Koster, R. D., Dirmeyer, P. A., Zhichang, G., Bonan, G., Chan, E., Cox, P., Gordon, C. T., Kanae, S., Kowalczyk, E., Lawrence, D., Liu, P., Lu, C. H, Malyshev, S., McAvaney, B., Mitchell, K., Mocko, D., Oki, T., Oleson, K., Pitman, A., Sud, Y. C., Taylor, C. M., Verseghy, D., Vasic, R., Xue, Y., and Yamada, T.: Regions of strong coupling between soil moisture and precipitation, Science, 305, 1138–1140, https://doi.org/10.1126/science.1100217, 2004.
Lawrence, D. M., Oleson, K. W., Flanner, M. G., Thornton, P. E., Swenson, S. C., Lawrence, P. J., Zeng, X., Yang, Z.-L., Levis, S., Sakaguchi, K., Bonan, G. B., and Slater, A. G.: Parameterization improvements and functional and structuraladvances in version 4 of the Community Land Model, J. Adv. Model. Earth Syst, 3, M03001, https://doi.org/10.1029/2011MS000045, 2011.
Liu, D., Wang, G., Mei, R., Yu, Z., and Yu, M.: Impact of soil moisture initial conditions anomalies on climate mean and extremes over Asia, J. Geophys. Res.-Atmos., 119, 529–545, https://doi.org/10.1002/2013JD020890, 2014.
Loveland, T. R., Reed, B. C., Brown, J. F., Ohlen, D. O., Zhu, J., Yang, L., and Merchant, J. W.: Development of a global land cover characteristics database and IGBP DISCover from 1-km AVHRR Data, Int. J. Remote. Sens., 21, 1303–1330, 2000.
Mathon, V., Diedhiou, A., and Laurent, H.: Relationship between easterly waves and mesoscale convective systems over the Sahel, Geophys. Res. Lett., 29, 57-1–57-4, https://doi.org/10.1029/2001GL014371, 2002.
Menéndez, C. G., Giles, J., Ruscica, R., Zaninelli, P., Coronato, T., Falco, M., Sörensson, A., Fita, L., Carril, A., and Li, L.: Temperature variability and soil–atmosphere interaction in South America simulated by two regional climate models, Clim. Dynam., 53, 2919–2930, https://doi.org/10.1007/s00382-019-04668-6, 2019.
Pal, J. S., Small, E. E., and Elthair, E. A.: Simulation of regional scale water and energy budgets: representation of subgrid cloud and precipitation processes within RegCM, J. Geophys. Res., 105, 29579–29594, 2000.
NCAR: Command Language (Version 6.6.2) [Software], UCAR/NCAR/CISL/TDD, Boulder, Colorado [code], https://doi.org/10.5065/D6WD3XH5, 2019.
Nikulin, G., Jones, C., Samuelsson, P., Giorgi, F., Asrar, G., Büchner, M., Cerezo-Mota, R., Christensen, O. B., Déque, M., Fernandez, J., Hansler, A., van Meijgaard, E., Sylla, M. B., and Sushama, L.: Precipitation climatology in an ensemble of CORDEX-Africa regional climate simulations, J. Climate, 25, 6057–6078, https://doi.org/10.1175/JCLI-D-11-00375.1, 2012.
Rasmusson, E. M. and Carpenter, T. H.: Variations in Tropical Sea Surface Temperature and Surface Wind Fields Associated with the Southern Oscillation/El Niño, Mon. Weather Rev., 110, 354–384, https://doi.org/10.1175/1520-0493(1982)110<0354:vitsst>2.0.co;2, 1982.
Reynolds, R. W. and Smith, T. M.: Improved global sea surface temperature analysis using optimum interpolation, J. Climate, 7, 929–948, https://doi.org/10.1175/1520-0442(1994)007<0929:IGSSTA>2.0.CO;2, 1994.
Schär, C., Lüthi, D., Beyerle, U., and Heise, E.: The soil–precipitation feedback: A process study with a regional climate model, J. Climate, 12, 722–741, https://doi.org/10.1175/1520-0442(1999)012<0722:TSPFAP>2.0.CO;2, 1999.
Seneviratne, S. I., Lüthi, D., Litschi, M., and Schär, C.: Land–atmosphere coupling and climate change in Europe, Nature, 443, 205–209, https://doi.org/10.1038/nature05095, 2006.
Simmons, A. S., Uppala, D. D., and Kobayashi, S.: ERA-interim: new ECMWF reanalysis products from 1989 onwards, ECMWF Newslett., 110, 29–35, 2007.
Solmon, F., Giorgi, F., and Liousse, C.: Aerosol modeling for regional climate studies: application to anthropogenic particles and evaluation over a European/African domain, Tellus B, 58, 51–72, 2006.
Sundqvist, H. E., Berge, E., and Kristjansson, J. E.: The effects of domain choice on summer precipitation simulation and sensitivity in a regional climate model, J. Climate, 11, 2698–2712, 1989.
Takahashi, H. G. and Polcher, J.: Weakening of rainfall intensity on wet soils over the wet Asian monsoon region using a high-resolution regional climate model, Prog. Earth Planet. Sci., 6, 1–18, 2019.
Thorncroft, C. D. and Blackburn, M.: Maintenance of the African easterly jet, Q. J. Roy. Meteorol Soc., 125, 763–786, 1999.
Uppala, S., Dee, D., Kobayashi, S., Berrisford, P., and Simmons, A.: Towards a climate data assimilation system: status update of ERA-interim, ECMWF Newslett., 15, 12–18, 2008.
Vinnikov, K. Y. and Yeserkepova, I. B.: Soil moisture: Empirical data and model results, J. Climate, 4, 66–79, https://doi.org/10.1175/1520-0442(1991)004<0066:SMEDAM>2.0.CO;2, 1991.
Vinnikov, K. Y., Robock, A., Speranskaya, N. A., and Schlosser, A.: Scales of temporal and spatial variability of midlatitude soil moisture, J. Geophys. Res., 101, 7163–7174, https://doi.org/10.1029/95JD02753, 1996.
Wang, G., Yu, M., Pal, J. S., Mei, R., Bonan, G. B., Levis, S., and Thornton, P. E.: On the development of a coupled regional climate vegetation model RCM-CLM-CN-DV and its validation its tropical Africa, Clim. Dynam., 46, 515–539, 2016.
Xue, Y., De Sales, F., Lau, K. M. W., Bonne, A., Feng, J., Dirmeyer, P., Guo, Z., Kim, K. M., Kitoh, A., Kumar, V., Poccard-Leclercq, I., Mahowald, N., Moufouma-Okia, W., Pegion, P., Rowell, D. P., Schemm, J., Schulbert, S., Sealy, A., Thiaw, W. M., Vintzileos, A., Williams, S. F., and Wu, M. L.: Intercomparison of West African Monsoon and its variability in the West African Monsoon Modelling Evaluation Project (WAMME) first model Intercomparison experiment, Clim. Dynam., 35, 3–27, https://doi.org/10.1007/s00382-010-0778-2, 2010.
Zakey, A. S., Solmon, F., and Giorgi, F.: Implementation and testing of a desert dust module in a regional climate model, Atmos. Chem. Phys., 6, 4687–4704, https://doi.org/10.5194/acp-6-4687-2006, 2006.
Zeng, X., Zhao, M., and Dickinson, R. E.: Intercomparison of bulk aerodynamic algorithms for the computation of sea surface fluxes using TOGA COARE and TAO DATA, J. Climate, 11, 2628–2644, 1998.
Zhang, J., Wang, W.-C., and Wei, J.: Assessing land-atmosphere coupling using soil moisture from the Global Land Data Assimilation System and observational precipitation, J. Geophys. Res., 113, D17119, https://doi.org/10.1029/2008JD009807, 2008a.
Zhang, J., Wang, W.-C., and Leung, L. R.: Contribution of land-atmosphere coupling to summer climate variability over the contiguous United States, J. Geophys. Res., 113, D22109, https://doi.org/10.1029/2008JD010136, 2008b.
Zhang, J. Y., Wu, L. Y., and Dong, W.: Land-atmosphere coupling and summer climate variability over East Asia, J. Geophys. Res., 116, D05117, https://doi.org/10.1029/2010JD014714, 2011.