the Creative Commons Attribution 4.0 License.
the Creative Commons Attribution 4.0 License.
 | 10 Feb 2022
Compound flood impact forecasting: integrating fluvial and flash flood impact assessments into a unified system
Josias Láng-Ritter
Marc Berenguer
Francesco Dottori
Milan Kalas
Daniel Sempere-Torres
Floods can arise from a variety of physical processes. Although numerous risk assessment approaches stress the importance of taking into account the possible combinations of flood types (i.e. compound floods), this awareness has so far not been reflected in the development of early warning systems: existing methods for forecasting flood hazards or the corresponding socio-economic impacts are generally designed for only one type of flooding. During compound flood events, these flood type-specific approaches are unable to identify overall hazards or impacts. Moreover, from the perspective of end-users (e.g. civil protection authorities), the monitoring of separate flood forecasts – with potentially contradictory outputs – can be confusing and time-consuming, and ultimately impede an effective emergency response. To enhance decision support, this paper proposes the integration of different flood type-specific approaches into one compound flood impact forecast. This possibility has been explored through the development of a unified system combining the simulations of two impact forecasting methods: the Rapid Risk Assessment of the European Flood Awareness System (EFAS RRA; representing fluvial floods) and the radar-based ReAFFIRM method (representing flash floods). The unified system has been tested for a recent catastrophic episode of compound flooding: the DANA event of September 2019 in south-east Spain (Depresión Aislada en Niveles Altos, meaning cut-off low). The combination of the two methods identified well the overall compound flood extents and impacts reported by various information sources. For instance, the simulated economic losses amounted to about EUR 670 million against EUR 425 million of reported insured losses. Although the compound impact estimates were less accurate at municipal level, they corresponded much better to the observed impacts than those generated by the two methods applied separately. This demonstrates the potential of such integrated approaches for improving decision support services.
- Article
(26335 KB) - Full-text XML
- BibTeX
- EndNote


Around the globe, floods regularly result in devastating impacts on human society. Between 2008 and 2017, floods claimed on average about 5000 lives per year (CRED, 2019). With more than one trillion USD over the last four decades, floods accounted for about 40 % of all natural hazard-related economic losses (Munich Re, 2020). Climate change projections suggest that the frequency and magnitude of floods will increase in many parts of the world over the decades to come (IPCC, 2018). In combination with rising trends in urbanisation and population growth, the impacts of floods on society are expected to increase significantly if no further adaptation measures are adopted (Dottori et al., 2018).
The development of early warning systems (EWSs) is a highly cost-effective way to reduce flood impacts as they support the coordination of emergency response measures, such as warnings to the population, evacuations, and the installation of temporary flood barriers (Pappenberger et al., 2015; World Bank, 2010). To enable an effective emergency response, the warning information needs to be accurate, easily interpretable, and disseminated in a timely manner to end-users such as civil protection authorities (WMO, 2018b). Flood EWSs generally rely on methods that continuously provide end-users with forecasts of upcoming flood hazards or impacts (UNISDR, 2006). Typically, these forecasting methods are based on models representing the physical processes that generate floods, which are diverse: the most common flood types include fluvial floods, flash floods, pluvial (urban or surface water) floods, and coastal floods (e.g. European Commission, 2007). Due to the differences in the governing physical processes, forecasting approaches are traditionally designed separately for the individual flood types (see, e.g. Alfieri et al., 2012). Fluvial floods, for instance, develop over days or weeks in large river basins and are most commonly forecasted by coupling weather observations and Numerical Weather Prediction (NWP) with distributed hydrological models. In contrast, flash floods have a more sudden onset (minutes to a few hours) and typically occur in small- to medium-sized mountainous catchments. The fast-evolving nature of flash floods requires a quick computation and dissemination of the warnings to end-users to maximise the time available for emergency response measures (e.g. evacuations or road closures). Processes leading to flash floods are usually strongly dominated by extreme rainfall intensities that evolve quickly in time and space, which makes the use of weather radar data attractive for flash flood monitoring and forecasting (Corral et al., 2019; Georgakakos, 1986; Javelle et al., 2016; Versini et al., 2010).
At present, the overwhelming majority of flood forecasting approaches focus on the hazard component of floods: methods for fluvial floods (Cloke and Pappenberger, 2009; Jain et al., 2018) or flash floods (Alfieri et al., 2019; Corral et al., 2019; Hapuarachchi et al., 2011) typically forecast peak flows or return periods in the stream network, while pluvial (Henonin et al., 2013; Zanchetta and Coulibaly, 2020) and coastal flood forecasting approaches (Fernández-Montblanc et al., 2019; Kohno et al., 2018) are mostly designed to predict water levels in the affected areas. For end-users such as civil protection authorities, these flood hazard forecasts are important tools that support emergency decision-making. The hazard forecasts provide information of potential flood locations and magnitudes before the onset of the event and thus help to coordinate measures such as warnings or evacuations. To estimate the expected impacts (e.g. the affected number of people), end-users combine hazard forecasts with socio-economic exposure and vulnerability information in the areas at risk. In current practice, this combination is commonly done based on personal knowledge and experience, or by means of simple GIS-based tools (e.g. Vaz, 2017). However, this non-automatic procedure of estimating the potential impacts can consume valuable time during approaching events and lead to sub-optimal decisions (Basher, 2006; Merz et al., 2020). For a more effective and faster emergency response, the World Meteorological Organization (WMO, 2015) and the United Nations International Strategy for Disaster Reduction (UNISDR, 2015a) promote the enhancement of existing tools with components that automatically translate forecasted hazards into expected socio-economic impacts.
The general recipe for impact forecasting is similar across flood types (Merz et al., 2020): the forecasted flood hazard is automatically combined with vulnerability and exposure layers, such as population density or land use maps. For fluvial floods, several impact forecasting approaches have been developed in recent years (e.g. Bevington et al., 2019; Brown et al., 2016; Cole et al., 2016; Dale et al., 2014; Guimarães Nobre et al., 2020). The Rapid Risk Assessment (RRA; Dottori et al., 2017) predicts economic losses and the affected critical infrastructure and population from flooding of European rivers up to 10 days ahead, based on discharge forecasts from the hydrological model LISFLOOD (Roo et al., 2000; Van Der Knijff et al., 2010). As part of the European Flood Awareness System (EFAS), for a few years the RRA has been providing forecasts to various end-users across the continent, who monitor the outputs on a daily basis for the coordination of response measures in case of emergencies. In recent years, progress in impact forecasting has also been made with respect to other flood types. For instance, regarding flash floods, several approaches are available for predicting impacts in individual catchments or relatively small areas (e.g. Le Bihan et al., 2017; Saint-Martin et al., 2016; Silvestro et al., 2019). The ReAFFIRM method (Ritter et al., 2020a) is the first approach applicable over larger domains (e.g. at regional or national scale). Based on flash flood hazard nowcasts obtained with the ERICHA system (Corral et al., 2019, 2009), ReAFFIRM estimates numbers of affected people and critical infrastructure, and economic losses at high spatiotemporal resolution (e.g. 25 m and 15 min).
All of the forecasting approaches mentioned above focus on one specific type of flooding. In reality, though, flood events are often the result of a combination of flood types, also referred to as “compound floods” (e.g. Wahl et al., 2015; Zscheischler et al., 2020). The Intergovernmental Panel on Climate Change (IPCC, 2018) defines compound events as “(1) two or more extreme events occurring simultaneously or successively, (2) combinations of extreme events with underlying conditions that amplify the impact of the events, or (3) combinations of events that are not themselves extremes but lead to an extreme event or impact when combined. The contributing events can be of similar (clustered multiple events) or different type(s)”. Previous studies on compound floods mostly focused on scenario-based hazard assessments accounting for different combinations of flood types. For instance, Chen et al. (2010) and Apel et al. (2016) applied coupled hydraulic models to simulate combined fluvial and pluvial flooding in urban environments. Similarly, many studies explored the compound hazard from fluvial and coastal flooding, often experienced as a crucial factor during hurricanes (for a review of such approaches, see Santiago-Collazo et al., 2019). To our knowledge, flash floods have so far not been considered in the context of compound flooding.
Although the results of the mentioned hazard assessments stress the importance of taking into account the possible combinations of flood types, this awareness has not yet been addressed by the developers of EWSs. At present, forecasting approaches remain flood type specific. For the forecasts' end-users, however, a distinction between flood types is secondary. Their main focus is information provided on potentially inundated locations and the corresponding impacts, regardless of the underlying flood type. Yet, the end-users’ decision-making process is, in current practice, usually based on a number of separate flood forecasts (representing the different flood types) that may even show contradictory outputs. This practice is inefficient and might reduce the end-users' trust in the forecasts. Systems that predict compound events in an integrated way – especially in terms of socio-economic impacts – could significantly improve decision support for end-users (Merz et al., 2020).
This paper proposes the development of a framework that automatically integrates flood type-specific forecasting approaches into one compound flood impact forecast. A particularly severe episode of compound flooding (the 2019 DANA event in south-east Spain; Sect. 2) has been taken as an opportunity to explore the possible advantages and drawbacks of such an integrated system. For this event, we test a simple real-time-adapted combination of fluvial flood impact simulations from EFAS RRA (Dottori et al., 2017) with flash flood impact simulations from ReAFFIRM (Ritter et al., 2020a, Sect. 3). The resulting simulated compound impacts for the DANA event are compared to impacts reported by satellite images, flood insurers, civil protection authorities, and the media (Sect. 4). This exploratory study allows for identifying potential opportunities and challenges of combining flood type-specific impact forecasting methods, and the future developments required to create a full compound flood impact forecast encompassing all common flood types (Sect. 5).
The south-eastern part of Spain (Fig. 1) is characterised by hydrometeorological extremes. Almost every year, the region experiences long-lasting droughts as well as torrential rains and floods. To balance the extremes over the course of the year and compensate for interannual rainfall variabilities, the stream network in the region has been strongly modified through structural interventions. In the Segura River basin (19 025 km2 including coastal catchments), the degree of regulation is especially exceptional: the 33 dams in the basin have an overall capacity of 1 230 Hm3 (CHS, 2020b), which is about 20 % larger than the basin's average yearly rainfall volume after discounting evapotranspiration (1027 Hm3; CHS, 2020a). Alongside various other purposes (e.g. public water supply, irrigation, and hydropower generation), the enormous retention capacities in the dams play a crucial role in flood protection.
From 11 to 15 September 2019, a weather phenomenon commonly known in Spain as “DANA” or “Gota Fría” (Martín León, 2003) affected the south-eastern part of the country. The term DANA means “upper tropospheric cut-off low”, a situation occurring typically in autumn when easterly winds push warm humid air masses from the Mediterranean Sea towards the steep topography of the coastal region (Ferreira, 2021). The DANA event of September 2019 caused rainfall accumulation of up to 461 mm in 24 h in the region (García et al., 2020). As a result, devastating floods occurred across eight provinces, of which Murcia and Alicante suffered the most severe impacts (for some visual impressions, see the references compiled in CRAHI, 2019). In total, seven people lost their lives and more than 5 000 were evacuated from their homes (Fig. 1). The Spanish Insurance Compensation Consortium (CCS, 2020) recorded private flood insurance claims of more than EUR 450 million, while AON (2019) estimated the overall economic losses from the event to exceed EUR 2.2 billion. The most severe incidents were reported in the floodplain of the lower Segura River (especially in the town of Orihuela), in several coastal towns in Murcia Province, and along some small tributaries of the Jucar River (e.g. the Clariano River; the Jucar River itself did not flood).
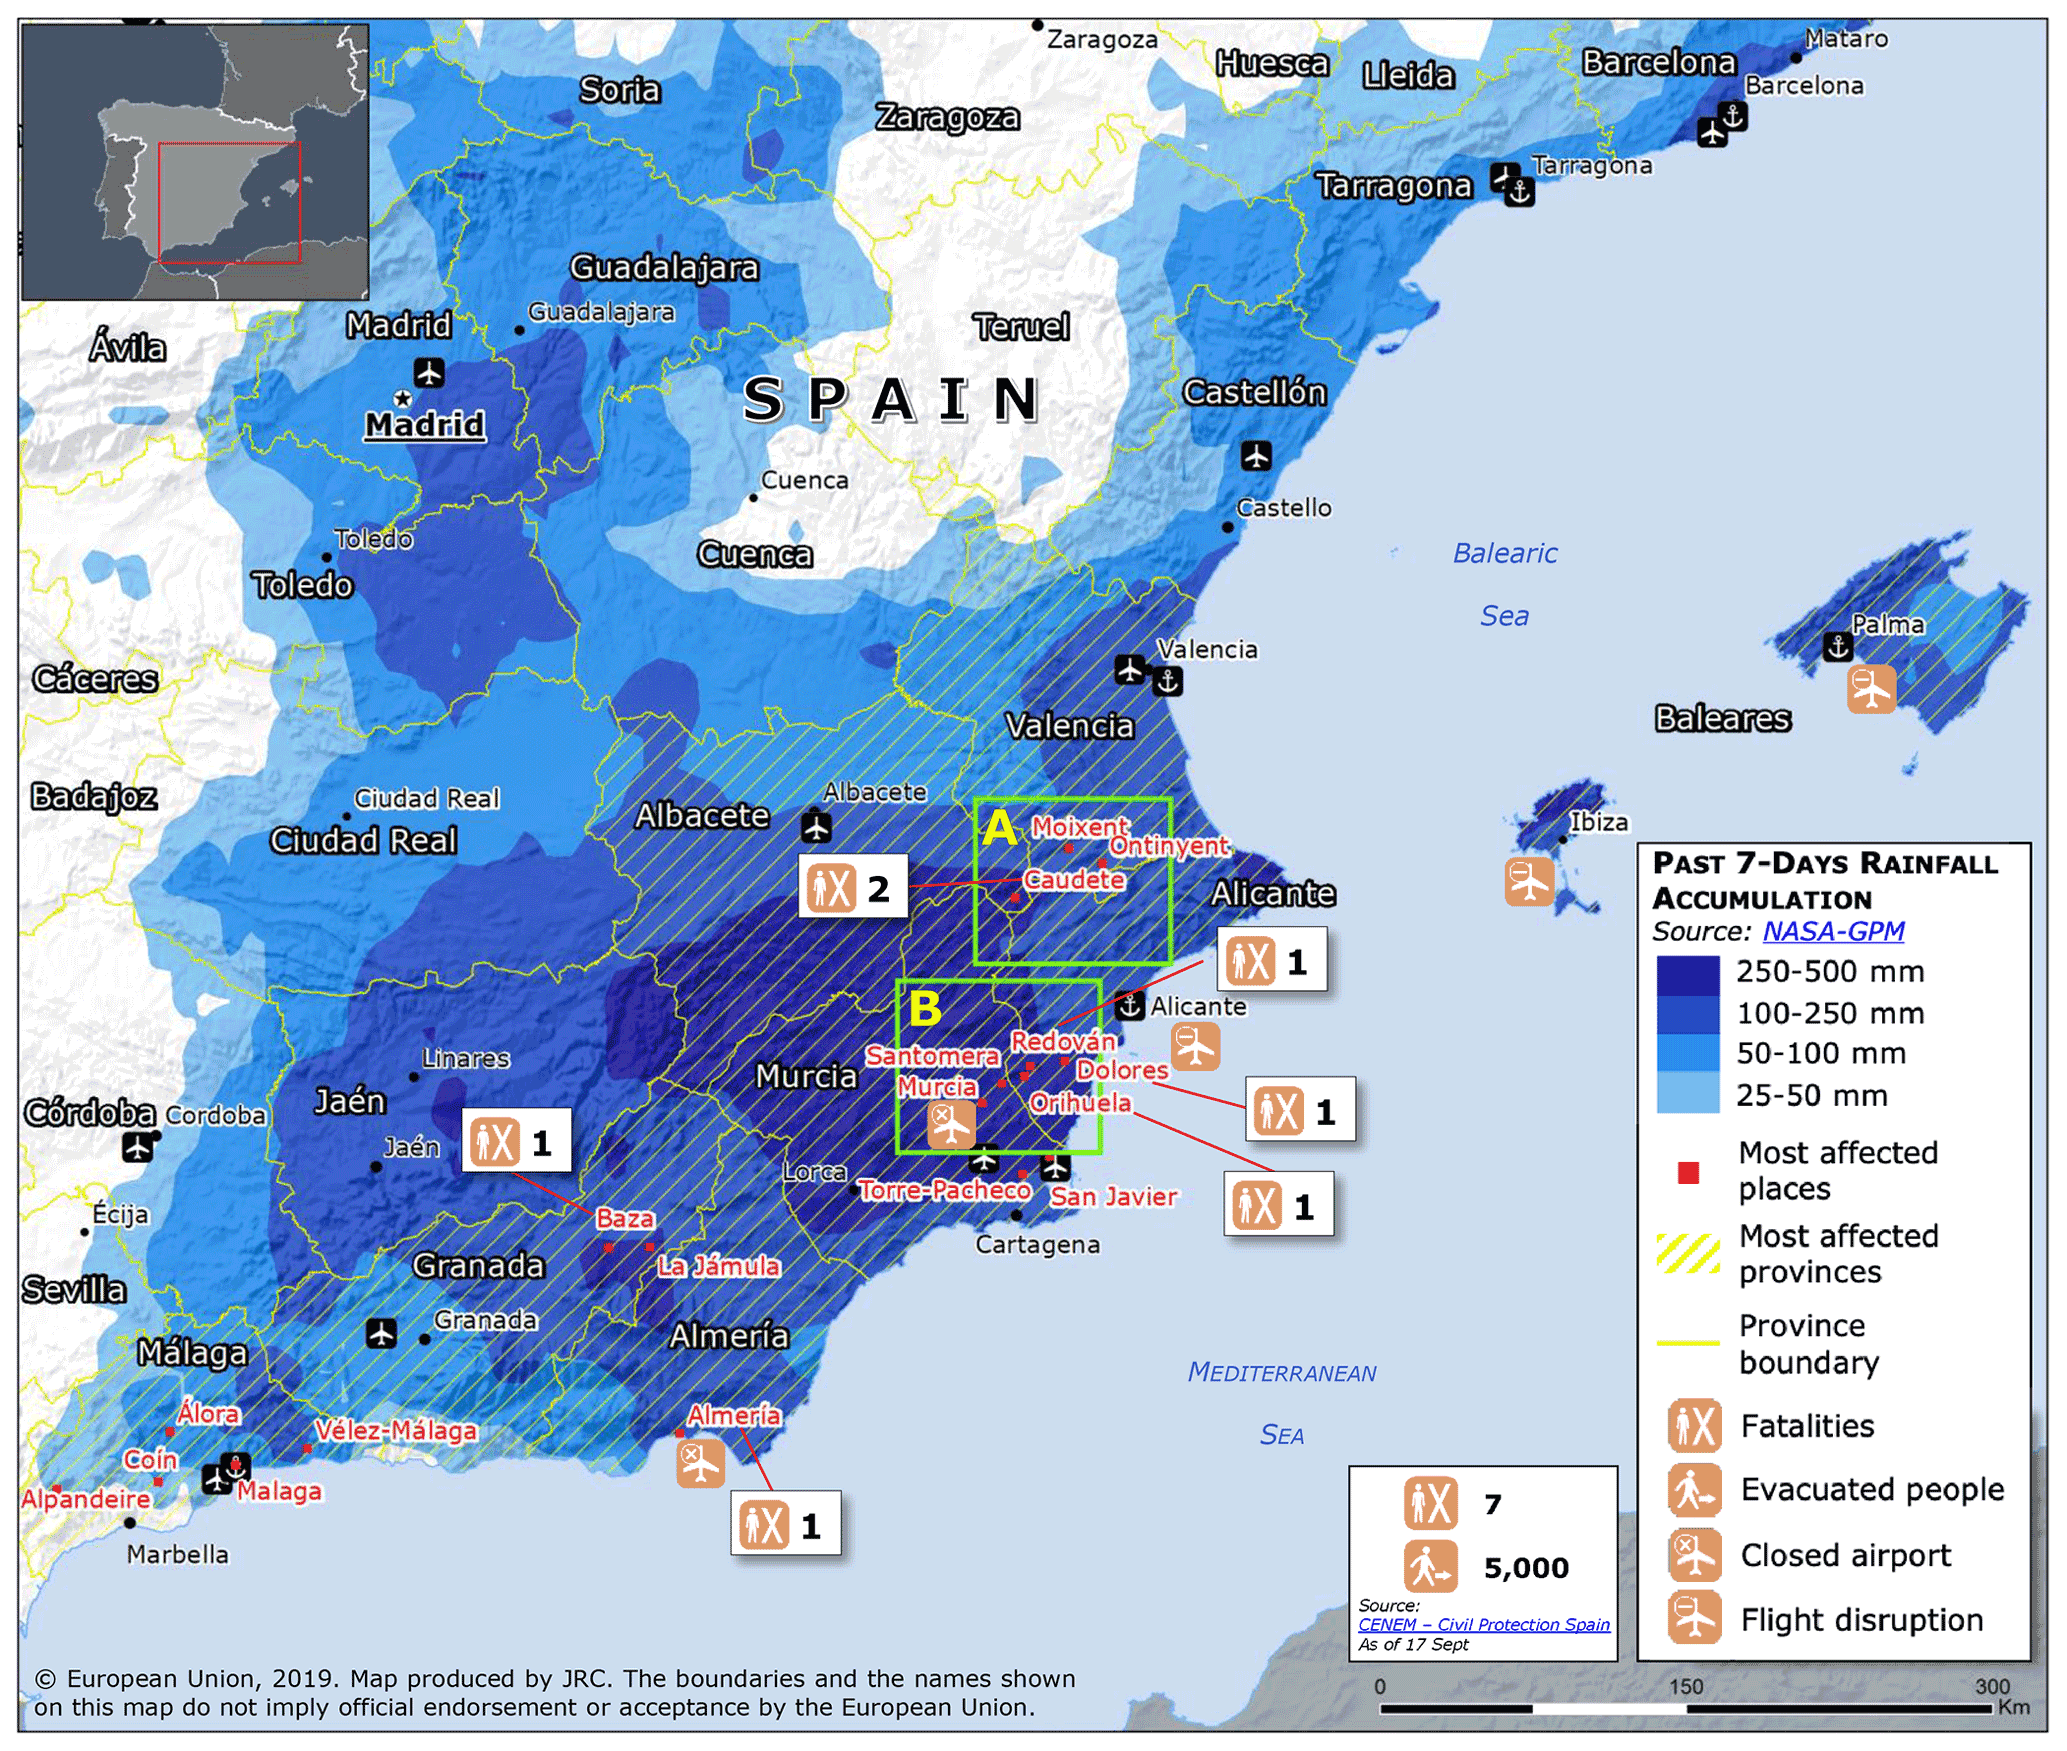
Figure 1Summary of the rainfall amounts and impacts of the 2019 DANA event. Adapted from https://www.gdacs.org/contentdata/maps/daily/FL/1100187/ECDM_20190917_Spain_Flood.pdf (last access: 1 February 2022).
One particularly interesting characteristic of this episode is that the most severely affected streams show a high variability in catchment size: while the Segura River has a drainage area of around 15 000 km2 at Orihuela, the catchment of the Clariano River in the Jucar Basin is about 2 orders of magnitude smaller at the most affected town of Ontinyent (160 km2). The large differences in catchment size represent different flood generation mechanisms: on the one hand fluvial flooding, and on the other hand flash flooding. In addition to fluvial and flash flooding, the DANA also caused pluvial flooding in several locations, e.g. in the cities of Alicante, Murcia, Malaga, Madrid, and in Almeria, where one person drowned in a car while crossing a flooded underpass. The combination of fluvial, pluvial, and flash flooding makes this DANA episode a classic example of a compound flood.
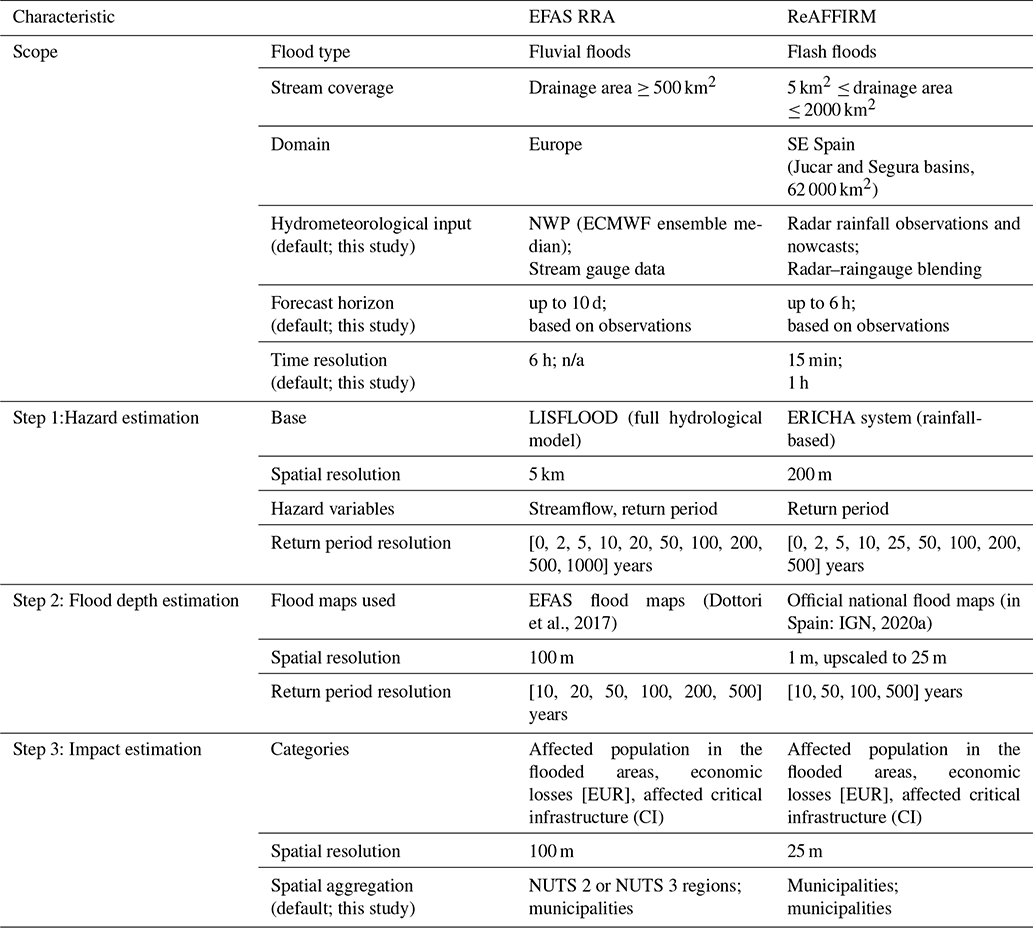
This section describes the two methods that have been employed for simulating the compound impacts of the DANA event. Fluvial impacts have been estimated using EFAS RRA (Dottori et al., 2017, Sect. 3.1) and flash flood impacts using the ReAFFIRM method (Ritter et al., 2020a, Sect. 3.2). After introducing the two methods separately, the procedure for combining them to a compound flood impact estimation is presented (Sect. 3.3). Table 1 provides an overview of the characteristics and specifications of the employed methods. In this study, both methods have been run based on hydrometeorological observations (rather than forecasts) to minimise external uncertainties and focus on the capabilities and limitations of estimating compound flood impacts.
(Dottori et al., 2017)(in Spain: IGN, 2020a)Table 1Characteristics of the employed methods for assessing fluvial (EFAS RRA) and flash flood impacts (ReAFFIRM). Note that n/a stands for not applicable.
3.1 Fluvial flood impacts: EFAS Rapid Risk Assessment (RRA)
This section briefly describes the EFAS RRA (for full details, see Dottori et al., 2017), which has been used to estimate the fluvial component of the flood impacts. The method consists of three steps (see also Table 1).
-
Hazard estimation: real-time discharge observations and NWP forecasts are used as input to the LISFLOOD hydrological model. Every 6 h, the model simulates the streamflow over the European drainage network in 5 km resolution.
-
Flood depth estimation: the streamflow simulated by LISFLOOD is transformed into flood extents and depths in 100 m resolution. This is done based on a pre-calculated inventory of flood maps of several discharge return periods (Table 1), covering rivers with catchments larger than 500 km2. It is important to note that the flood maps were generated at the pan-European scale and therefore have certain limitations as to resolution and accuracy (for an evaluation in Spain, see Dottori et al., 2021).
-
Impact estimation: the simulated flood extents and depths are combined with exposure and vulnerability datasets to assess the socio-economic impacts. Three impact categories are included: affected population (using the population density map of Freire et al., 2016), critical infrastructure (using the infrastructure database of Giovando et al., 2020), and direct economic losses (using CORINE land cover and the depth–damage functions of Huizinga et al., 2017). The impacts are automatically aggregated for the administrative regions (NUTS 2 or NUTS 3) to provide a concise summary of the outputs.
After this general description of EFAS RRA, we focus now on the particularities of the application of the method in this study. We have decided to substitute the LISFLOOD discharge simulations (step 1 of the method) with the discharges measured by the stream gauges of the Hydrographic Confederation of the Segura (CHS, 2021). The reasoning behind this decision is described in the following: for the Segura, recent long-term validation of LISFLOOD shows one of the lowest performance scores of all European catchments (Mazzetti and Harrigan, 2020). This has been attributed to two main sources: firstly, due to the high degree of flow regulation by dams and other hydraulic structures in the Segura Basin (see Sect. 2). The rules on which dam operators base their release decisions are typically unknown (e.g. Nazemi and Wheater, 2015; Ritter et al., 2020b), usually hindering an adequate representation of the effects of dams in hydrological models. Secondly, large parts of south-east Spain, and in particular the Segura Basin, are situated on a highly karstic topography (Goldscheider et al., 2020), in which hydrological simulations generally show high uncertainties (Hartmann et al., 2014). To substitute the LISFLOOD simulations for the DANA event, we have included discharge data from eight stream gauges along the Segura River (Fig. 2). The discharge observations have been connected to step 2 of the method as follows: in each river reach, the flood map that corresponded most closely to the measured peak flow has been selected from the set of EFAS flood maps (Fig. 2). The resulting mosaic of flood maps represents the maximum of simulated flood extents and depths over the full event duration (11–14 September 2019). To simulate the corresponding flood impacts, the maximum flood depths have been combined with exposure and vulnerability layers. In this last step, the default configuration of EFAS RRA has been applied (see step 3 of the method); however, the impact aggregation has been done at the level of municipalities to enable a more detailed analysis (Table 1).
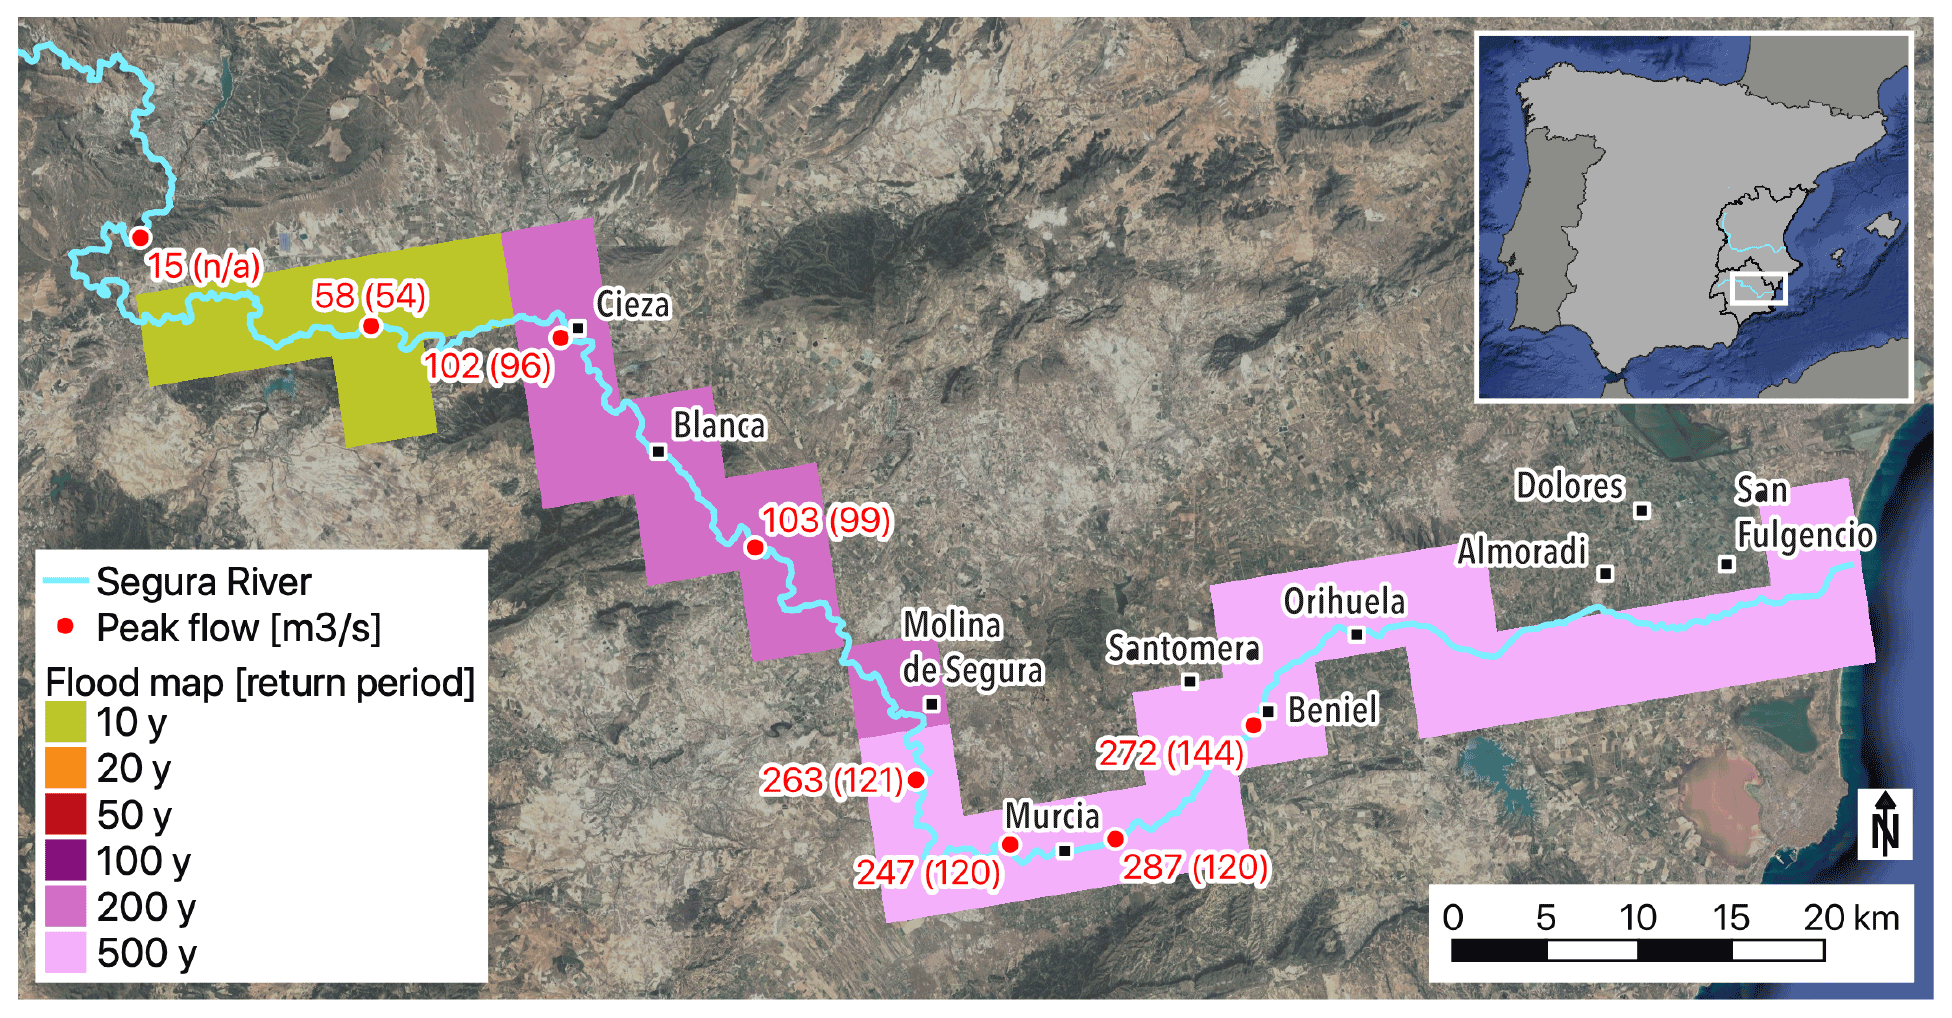
Figure 2Peak flows measured at gauging stations in the Segura River during the DANA event, and (in brackets) at each station the input discharge of the most closely corresponding EFAS flood map. The 5 km grid cells represent the resulting selection of EFAS flood maps along the LISFLOOD drainage network. Map data © Google Earth 2015.
3.2 Flash flood impacts: the ReAFFIRM method
The ReAFFIRM method (for full details, see Ritter et al., 2020a) has been used in this study to estimate the flash flood-induced impacts of the DANA event. The method assesses impacts originating from streams with catchment areas between 5 and 2000 km2. Similarly to EFAS RRA, also ReAFFIRM consists of three main steps (Table 1):
-
Firstly, a flash flood hazard module (the ERICHA system; Corral et al., 2009, 2019) uses weather radar observations to estimate the hazard return periods over a gridded drainage network.
-
Then, a flood map module translates the estimated hazard return periods into high-resolution flood extents and depths, based on the official flood maps created in the framework of the EU Floods Directive (European Commission, 2007).
-
Finally, an impact assessment module employs several layers of socio-economic exposure and vulnerability in the flooded areas to estimate the flash flood impacts in three categories: affected population in the flooded areas, economic losses, and affected critical infrastructure (CI).
Initially applied and tested in Catalonia (north-east Spain; Ritter et al., 2020a), the ReAFFIRM method has now been applied to the hydrographic demarcations (hereafter referred to as basins) of the Jucar and Segura rivers, covering an overall area of almost 62 000 km2 (Fig. 3). More than 92 % of economic losses from the DANA event occurred within this domain (CCS, 2020). The configuration of ReAFFIRM and the datasets used in this region are described in the following (see also Table 1).
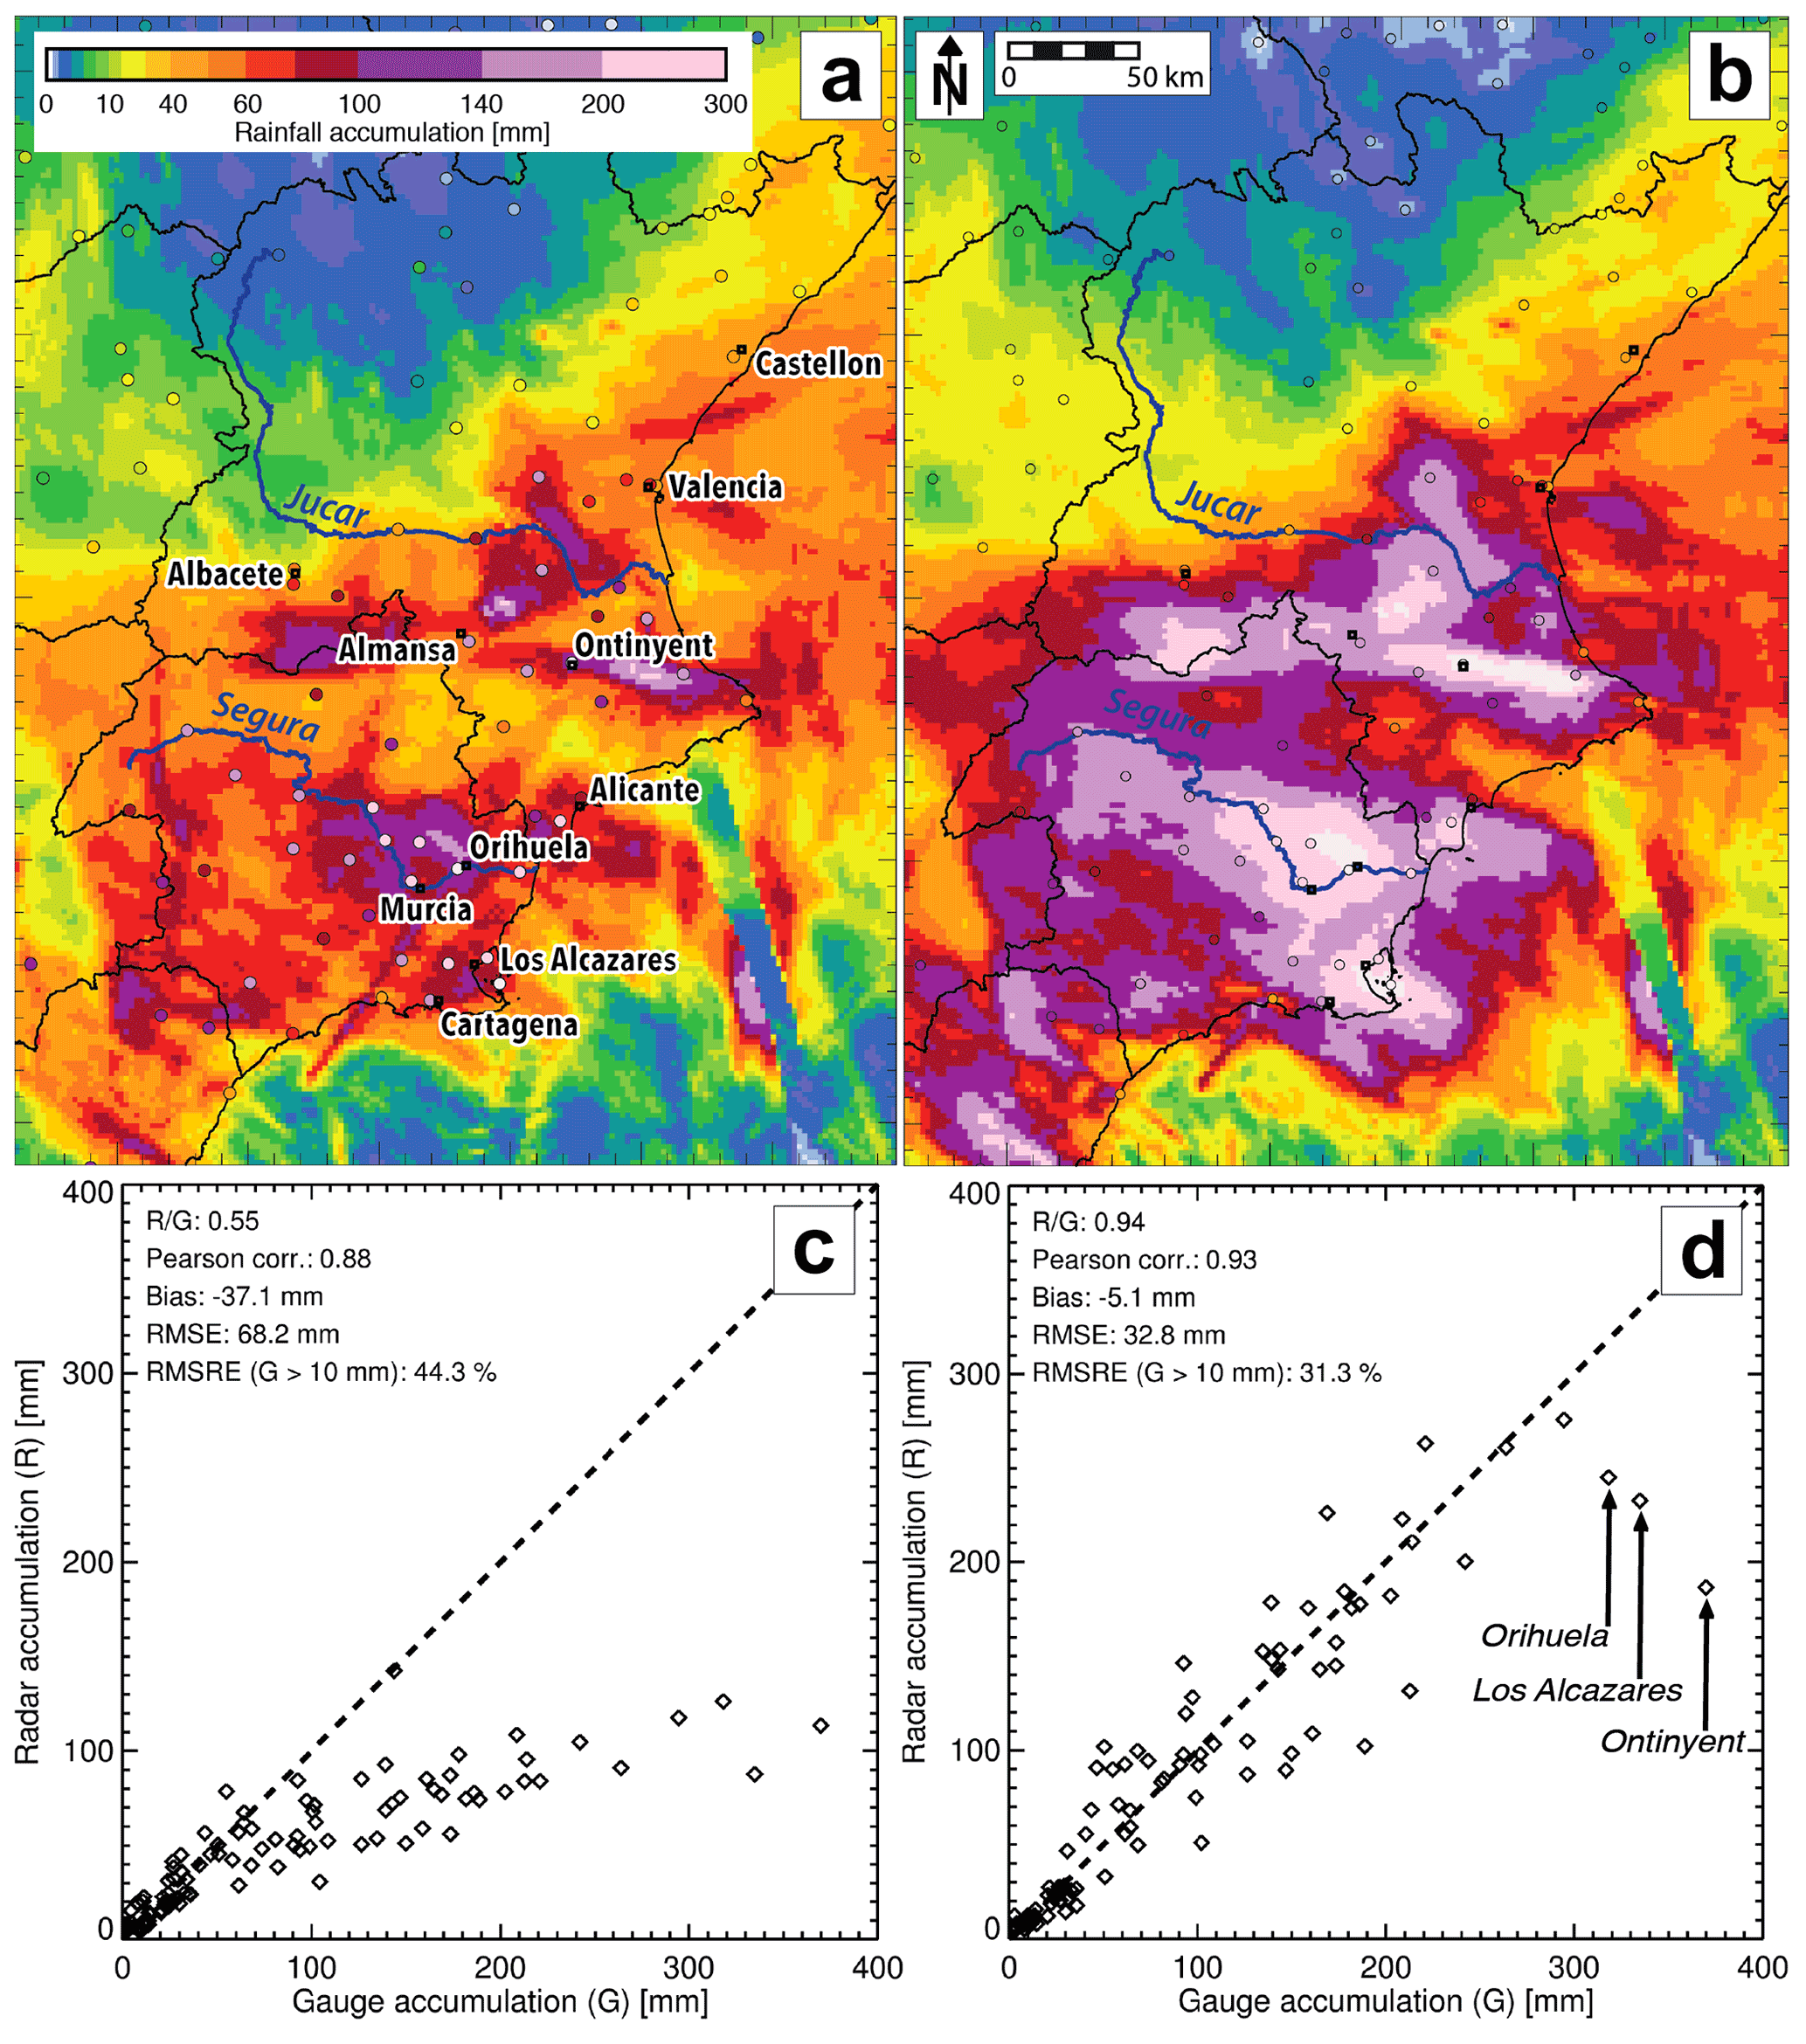
Figure 3Total rainfall accumulation (11–14 September 2019) for the real-time-adjusted OPERA radar (a, c) and for the result of the radar–raingauge blending technique used throughout this paper (b). (d) Performance of the radar–raingauge blending technique evaluated by means of (“leave-one-out”) cross validation. In panels (a) and (b), the raingauge accumulation and their locations are represented by the circles, and the black lines are the limits of the catchment administrations of the Jucar (north) and the Segura (south).
- i.
Rainfall inputs: as rainfall inputs for step 1 of ReAFFIRM, we have used the radar composites from OPERA (Operational Program for the Exchange of weather RAdar information; https://www.eumetnet.eu/opera, last access: 1 February 2022), which are produced in real time and have resolutions of 2 km and 15 min. Although improved by a chain of real-time adjustment algorithms (Saltikoff et al., 2019; see also Park et al., 2019), the OPERA rainfall products significantly underestimated the observed rainfall during the DANA event (Fig. 3a, c). To reduce the bias in the rainfall inputs for the analysis of the event, we have applied the radar–raingauge blending technique proposed by Velasco-Forero et al. (2009) (see also Cassiraga et al., 2020), using the raingauge measurements of the Spanish State Meteorological Agency (AEMET) with an hourly time step (as also done by Ritter et al., 2021a). The resulting improved rainfall estimates are shown in Fig. 3b, d. It can be seen that the largest rainfall amounts were observed near the severely affected towns of Orihuela, Los Alcazares, and Ontinyent.
- ii.
Flash flood hazard module (step 1): the ERICHA flash flood hazard system has been set up on the base of a topography grid in 200 m resolution (IGN, 2020a). The exceeded return period in each cell of the gridded drainage network is computed by comparing the observed basin-aggregated rainfall to thresholds derived from the historical raingauge analysis of Ministerio de Fomento (1999). To estimate the critical rainfall duration for the upstream drainage area of each cell, the Kirpich (1940) time of concentration formula has been used.
- iii.
Flood map module (step 2): the official flood maps in the domain are freely provided by the Spanish National Geographic Institute (IGN, 2020a). Flood extent maps are available for all areas in which “potential significant flood risks exist or might be considered likely to occur” (European Commission, 2007). For around 74 % of the area covered by the flood extent maps, flood depth data are also available in 1 m resolution. The flood depths have been upscaled to 25 m (the resolution used by ReAFFIRM). For the flood extents for which flood depth data were unavailable, a uniform flood depth of 0.5 m has been assumed (following Ritter et al., 2020a).
- iv.
Impact assessment module (step 3): to estimate the affected population in the flooded areas, the population density map of Freire et al. (2016) has been interpolated to 25 m resolution, and the Spanish national land use dataset SIOSE (reference year 2014; IGN, 2020b) has been applied as a filter to keep population density values restricted to populated land use types (residential, industrial, and commercial). The SIOSE land use dataset has also been used to estimate economic losses, combined with the depth–damage functions from Huizinga et al. (2017) adjusted for Spain. Locations of CI (education facilities, health facilities, and mass-gathering sites) were extracted from OpenStreetMaps in the framework of the project “Global Exposure Data for Risk Assessment” (Giovando et al., 2020).
As discussed in detail by Ritter et al. (2020a), the most pronounced sources of uncertainty affecting the ReAFFIRM impact estimates are the qualities of the employed rainfall inputs and flood maps. Additional important uncertainty sources include the purely rainfall-based hazard estimation and the vulnerability datasets used for translating flood hazard into socio-economic impacts. To account for some of the uncertainties, the default configuration of ReAFFIRM simulates the lower and upper bounds of flood extents and impacts. Throughout this paper, the illustrations of the simulated flood extents in the maps refer to the upper bound of flood extents. The impact estimates listed in the result tables represent the mean values of the lower and upper bounds.
3.3 Compound flood impact estimation
To generate the compound flood impact estimates, the proposed approach combines the impacts of fluvial floods with those of flash floods, estimated by EFAS RRA and ReAFFIRM respectively. Fluvial floods and flash floods mostly occur in different parts of the stream network (fluvial floods in large rivers and flash floods in smaller streams). Hence, for this particular combination of flood types, the compound flood impacts have been approximated as the sum of impacts of the individual flood types. However, to avoid biases, the following consideration has been made: EFAS RRA estimates the impacts in rivers with catchment areas larger than 500 km2, while ReAFFIRM focuses on smaller catchments of 5–2000 km2 size (Table 1). This means that in streams with catchment areas of 500–2000 km2, both fluvial and flash flood impacts can be detected at the same time. Moreover, at confluences of large rivers and small tributaries, the simulated impacts of the two methods can overlap. To avoid a systematic overestimation of impacts, we have decided to select in such situations the results from EFAS RRA, since past studies have shown that the impact estimates of ReAFFIRM are subject to increased uncertainties near large rivers (Ritter et al., 2020a, 2021b).
This decision has enabled a straightforward combination of the two impact assessments: wherever EFAS RRA detects (fluvial) flood extents, the (flash) flood extents and impacts simulated by ReAFFIRM are automatically removed. Then, the (unchanged) fluvial and the (cropped) flash flood extents and impact estimates are instantly merged, resulting in a continuous coverage for catchments larger than 5 km2.
Finally – as also done in the two individual methods (Table 1) – the resulting compound flood extents and impacts are aggregated at the level of municipalities.
This section presents the impacts of the DANA event simulated separately by the two methods (Sect. 4.1 and 4.2) and by the compound flood impact estimation (Sect. 4.3). Since the results of EFAS RRA have been generated based on measured peak flows (instead of using the default 6 h discharge simulations), they represent the simulated maximum impacts over the full event duration (i.e. one set of outputs for the entire event; Sect. 3.1). Although the results from ReAFFIRM have been generated at an hourly resolution (Sect. 3.2), we also present the aggregated impacts over the full event duration to enable comparison with EFAS RRA’s results and post-event impact observations.
The simulation results are compared with the impacts reported by the media (compiled in CRAHI, 2019) and the Spanish Directorate-General for Civil Protection and Emergencies (DGPCE, 2019). Furthermore, we compare the simulated economic losses to a database of flood insurance claims provided by the Spanish Insurance Compensation Consortium (CCS, 2020). This database contains the claimed losses for each municipality, and therefore provides valuable information on the spatial distribution of losses over the domain. However, it contains only the insured and claimed losses in the private, industrial, and commercial sectors – agriculture and public infrastructure is not included. For instance, during the DANA event, claimed losses of EUR 206.5 million were recorded in the insurance database in the 45 municipalities of Murcia Province (CCS, 2020), whereas the overall economic losses in the province (including all sectors) amounted to about EUR 590 million (Arbáizar-Barrios, 2019). Based on these numbers, a rough factor of 2.5–3 can be assumed for the case study area to convert the values in the insurance claim database into overall economic losses. This rough factor helps to put the insured losses into perspective when confronted with the values of overall economic losses estimated by EFAS RRA and ReAFFIRM.
4.1 Fluvial flood impacts estimated by EFAS RRA
This section presents the simulated fluvial flood impacts of the DANA event. Using the stream gauge data along the Segura River as input (Sect. 3.1), EFAS RRA estimated the fluvial flood extents shown in blue and purple in Fig. 4: in the upstream part of the Segura, several minor inundations near the river were identified. In contrast, in the lowlands downstream of the City of Murcia, the simulated fluvial flood extents cover vast areas, reaching up to about 8 km from the river channel (Fig. 4). This general image corresponds well to the situation described by the authorities after the DANA event: the Segura overwhelmed the flood protection structures in several locations downstream of Murcia and widely inundated the flat terrain (DGPCE, 2019).
Based on the simulated fluvial flood extents and depths (Fig. 4), EFAS RRA identified 28 381 people and 17 CI in flooded areas, and economic losses of EUR 422.8 million (Table 2). These simulated fluvial flood impacts correspond relatively well to the reported overall impacts (although the reported numbers also include impacts induced by other flood types, which EFAS RRA is not designed to detect). The simulated impacts are distributed over 36 municipalities along the Segura River, of which 10 are listed in Table 2.
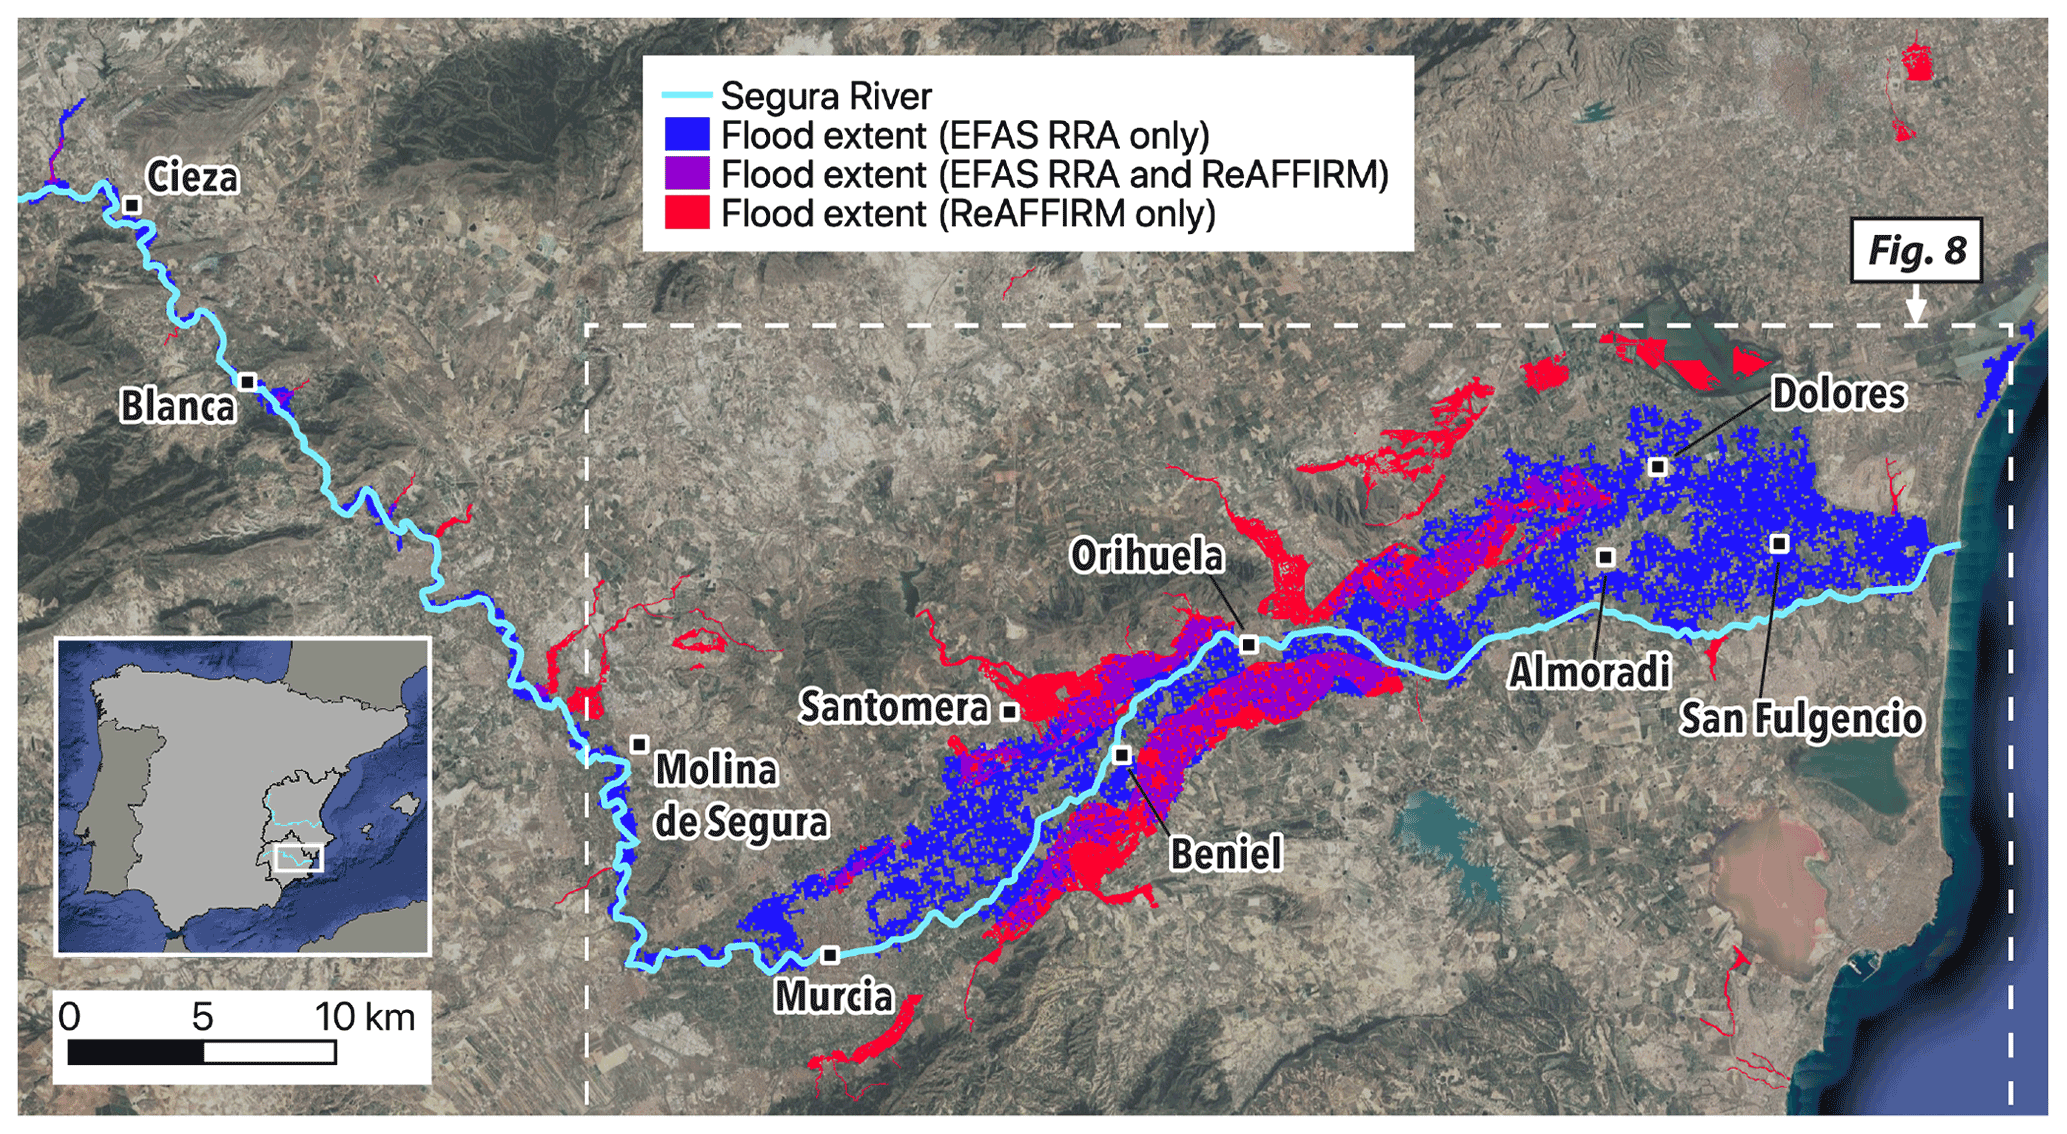
Figure 4Fluvial flood extents simulated by EFAS RRA (blue) and flash flood extents simulated by ReAFFIRM (red). At the locations where the flood extents simulated by the two methods overlap (purple), the flash flood extents and impacts simulated by ReAFFIRM are automatically removed to avoid a systematic overestimation of the compound impacts (see Sect. 3.3). The dashed rectangle indicates the area displayed in Fig. 8. Map data © Google Earth 2015.
Table 2Summary of simulated fluvial flood impacts (EFAS RRA) and reported flood impacts (CRAHI, 2019; CCS, 2020; DGPCE, 2019) in selected municipalities. Critical infrastructure (CI) categorised as health facilities (HF), education facilities (EF), and mass-gathering sites (MG).
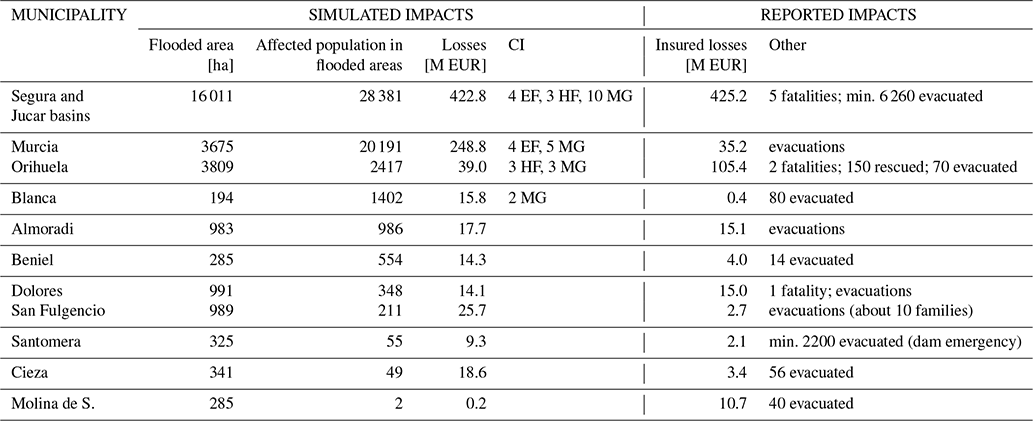
In many of the municipalities flooded by the Segura downstream of Murcia, the quantitative impact estimates are approximately in line with the reported impacts (e.g. in Almoradi, Dolores, Beniel, and Santomera; Table 2). However, the impacts were clearly underestimated in the most severely affected municipality of Orihuela, since a significant part of the impacts in this location were caused by flash floods in small tributaries of the Segura (e.g. the two fatalities listed in Table 2). Similarly as in Orihuela, flash floods in small tributaries were also responsible for a large share of the impacts in Molina de Segura, explaining the impact underestimation by EFAS RRA in this municipality (Table 2). In contrast, the impacts in the municipality of Murcia have been significantly overestimated (Table 2): fluvial flooding was reported in the rural areas upstream and downstream of the City of Murcia, but not in the city centre, where local flood protection infrastructure prevented the Segura from flooding urban areas (CRAHI, 2019). Since the pan-European flood maps used by EFAS RRA do not account for such local defence structures (Dottori et al., 2021), the flood extents in the City of Murcia and the corresponding impacts were significantly overestimated (Fig. 4 and Table 2). Similar effects leading to overestimated impacts were observed in Cieza and Blanca in the upstream part of the Segura, and in San Fulgencio close to the river mouth (Fig. 4 and Table 2).
4.2 Flash flood impacts estimated by ReAFFIRM
This section presents the flash flood impacts simulated by ReAFFIRM for the DANA event. In the Segura and Jucar basins, ReAFFIRM estimated 43 091 people in flooded areas, EUR 290.2 million in economic losses, and 16 affected CI (Table 3). The impacts are spread over a total of 100 municipalities, indicated in Fig. 5a in red (flood affecting population; 41 municipalities), orange (flood causing economic losses but not affecting population; 38 municipalities), and yellow (flood not affecting population or assets; 31 municipalities). A first visual inspection reveals that the locations of the simulated impacts (Fig. 5a) correspond very well to those of the reported impacts (Fig. 5b): simulated impacts appear in most of the municipalities where people were rescued or evacuated. Furthermore, ReAFFIRM identified impacts in the two municipalities with flash flood-related fatalities (Table 3), although the signal is small in Caudete, where two persons died in their vehicle on a flooded country road (CRAHI, 2019).
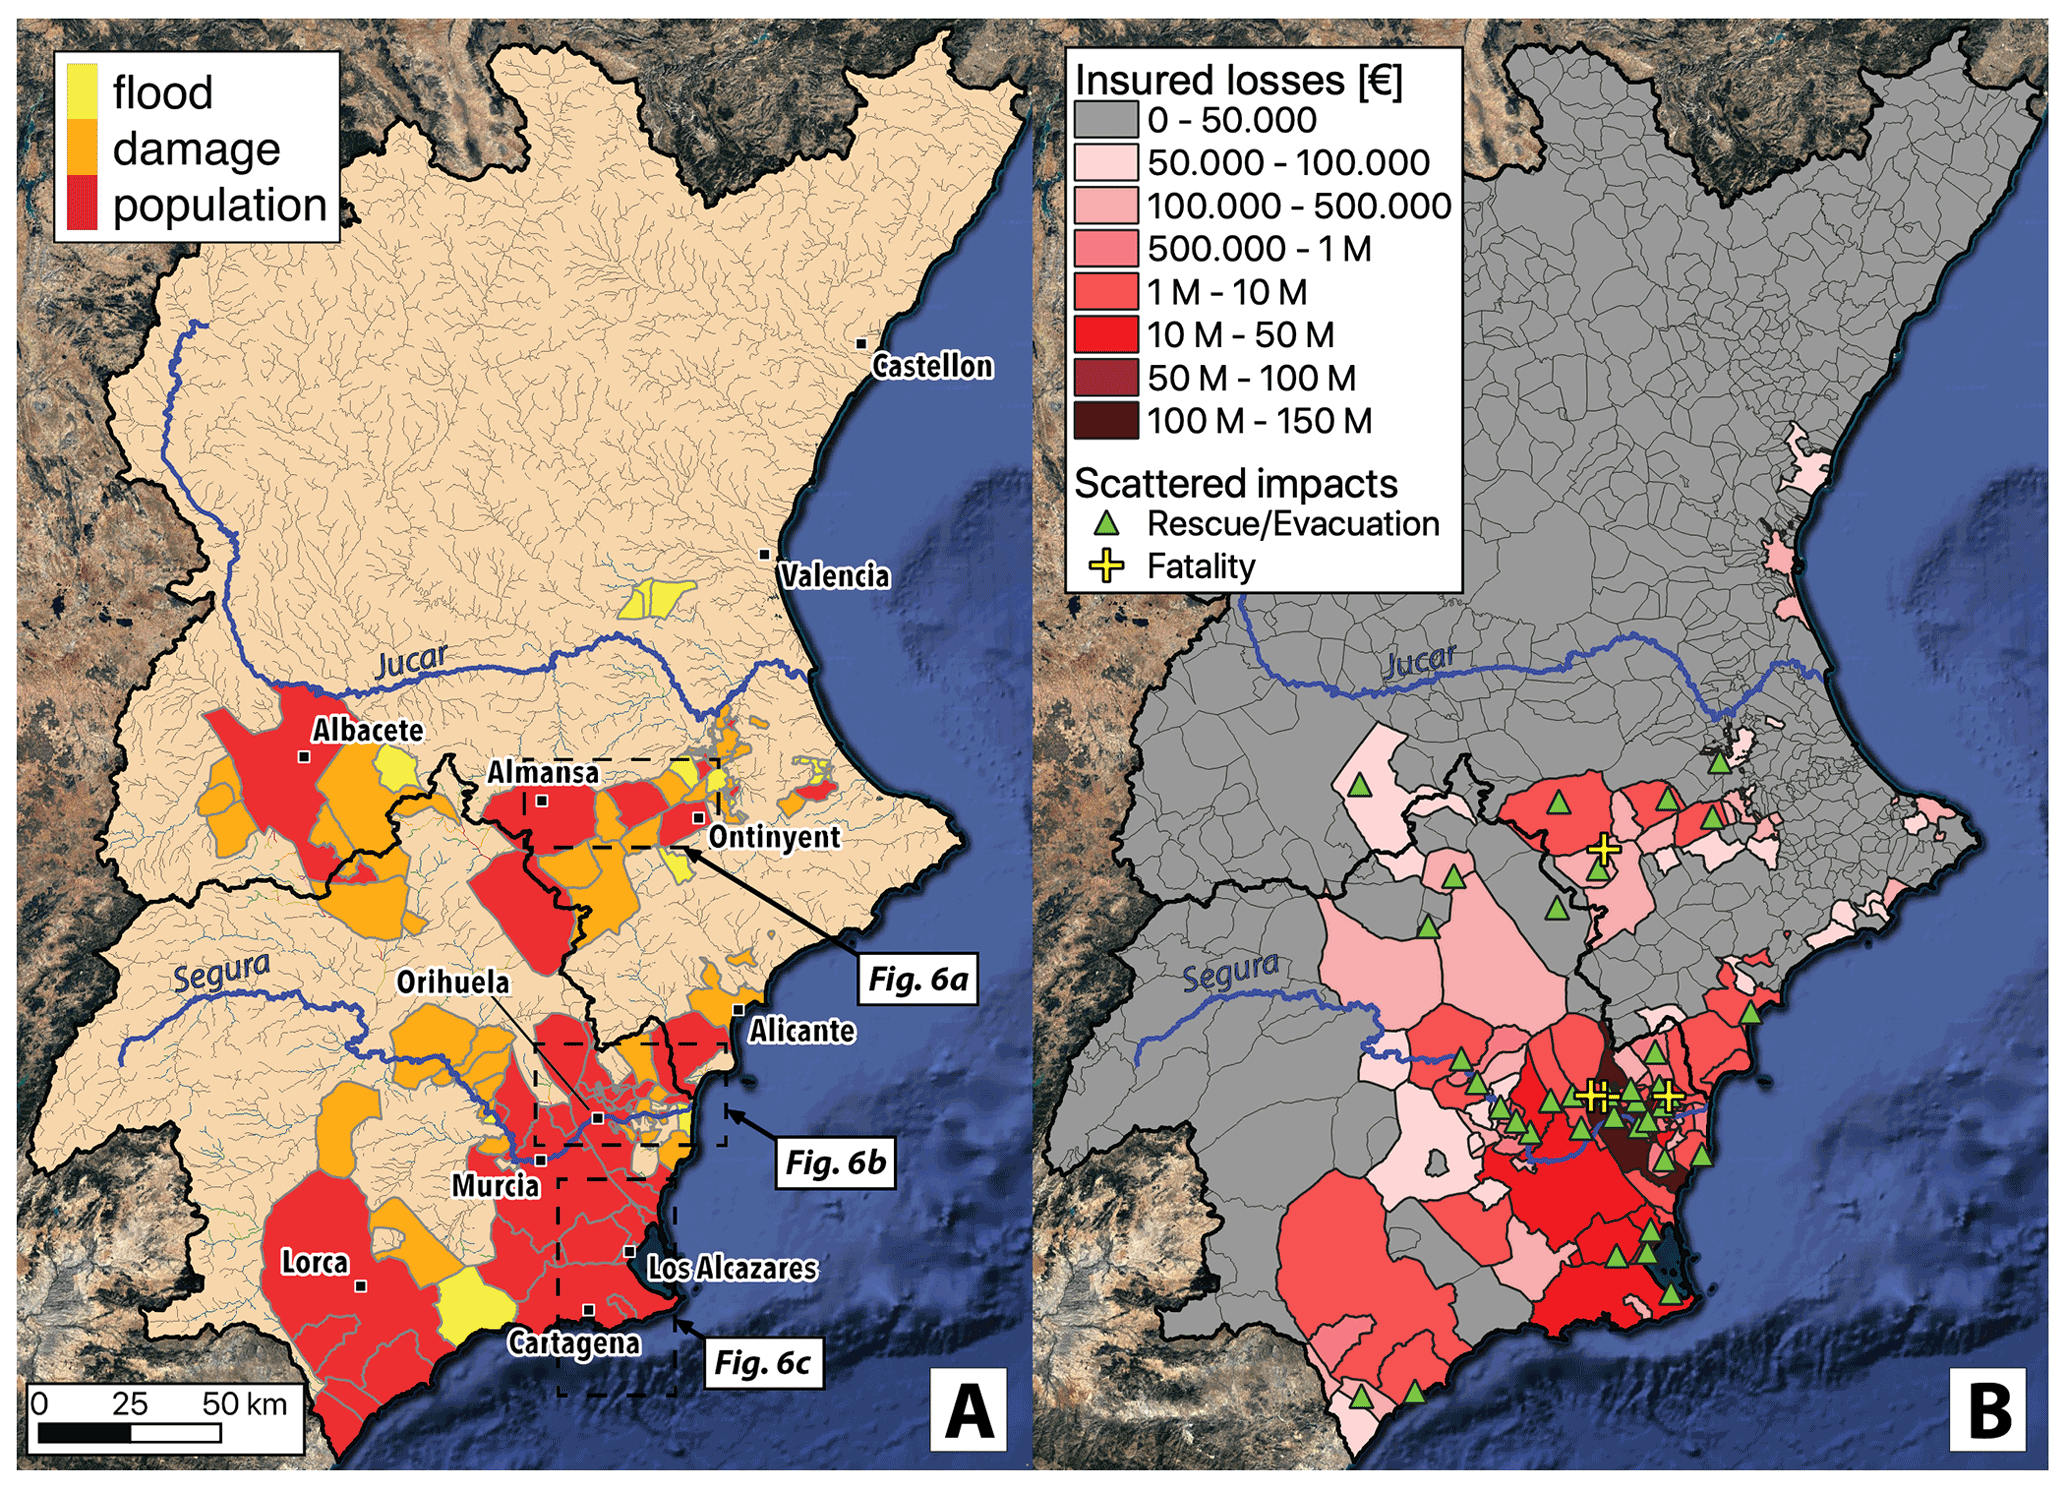
Figure 5(a) Flash flood impacts simulated by ReAFFIRM (11–14 September 2019). (b) Reported flood impacts: insured economic loss by municipality (CCS, 2020), and locations of fatalities, rescues, and evacuations gathered by the media and the civil protection authorities (CRAHI, 2019; DGPCE, 2019). Map data © Google Earth 2015.
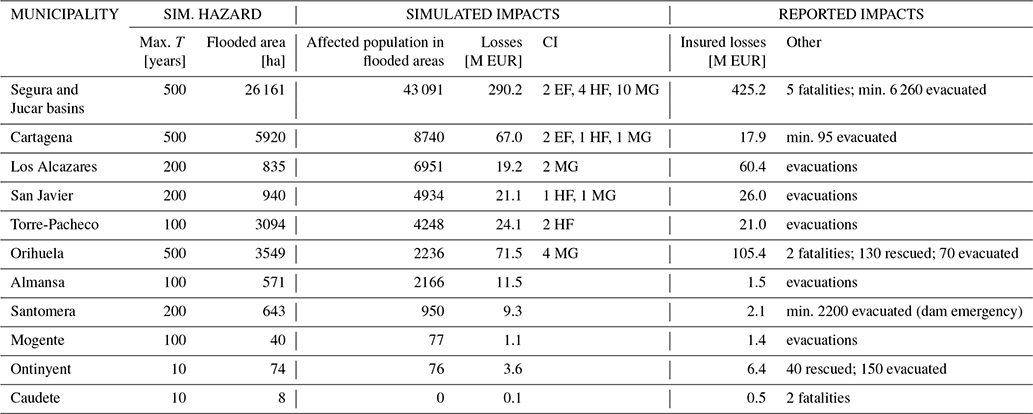
Table 3Summary of simulated flash flood impacts (ReAFFIRM) and reported flood impacts (CRAHI, 2019; CCS, 2020; DGPCE, 2019) in selected municipalities (11–14 September 2019; corresponding to Fig. 5). Critical infrastructure (CI) categorised as education facilities (EF), health facilities (HF), and mass-gathering sites (MG).
ReAFFIRM detected the most significant flash flood impacts in the three parts of the domain indicated by the dashed boxes in Fig. 5a and shown more closely in Fig. 6:
In the Jucar Basin, ReAFFIRM detected significant impacts along the Cañoles and Clariano rivers (Fig. 6a). For the Cañoles River in Almansa (365 km2), the ERICHA system estimated a return period of T = 100 years, resulting in somewhat overestimated impacts in this municipality (Table 3). The real flood peak in Almansa was probably lowered by an upstream dam not taken into account by the ERICHA system (see the dam’s location in Fig. 6a). Further downstream, in Mogente (862 km2), the return period of T = 100 years seems to be in line with the observed flood magnitude (CRAHI, 2019), and the relatively low simulated economic losses of EUR 1.1 million in this rural municipality correspond well to the insured losses (Table 3). Although the town of Ontinyent (Fig. 6a) experienced unprecedented flooding from the Clariano River (CRAHI, 2019), the estimated return period in this location is only 5–10 years. This low hazard estimate stems from a rainfall underestimation in the small catchment (160 km2): a few kilometres upstream of the town, three local raingauges recorded 333–344 mm on the day of the flood (12 September 2019; AVAMET, 2019), whereas for the same day the radar (blended with the national raingauges) estimated only 233–250 mm in the raingauge locations. This rainfall underestimation propagated down to the impact estimates in Ontinyent (Table 3).

Figure 6Maximum flash flood hazard level (11–14 September 2019) simulated by the ERICHA system in the most severely affected parts of the domain. The locations of panels (a)–(c) are indicated in Fig. 5a.
Around the town of Orihuela (Fig. 6b), the ERICHA system estimated return periods of up to T = 500 years in the small tributaries of the Segura River, resulting in significant flood extents simulated by ReAFFIRM (Fig. 4). These results seem to be in line with the reported fatalities and evacuations along these tributaries (Fig. 6b). The overall impacts, however, seem to be underestimated in Orihuela (Table 3). This is due to the fact that – in addition to the flash floods – exceptional fluvial flooding from the Segura River also affected the municipality (Sect. 4.1; DGPCE, 2019). For the Segura River itself, no flash flood hazard has been estimated, since the catchment area of around 15 000 km2 at Orihuela is far above the limit of the ERICHA system (2000 km2, see Sect. 3.2).
Severe flash floods also affected the south-eastern part of the domain (Fig. 6c). The ERICHA system identified return periods of T = 100–200 years in the municipalities of Torre-Pacheco, Los Alcazares, and S. Javier, in ephemeral streams with flat catchments areas in the order of 10–100 km2 (Fig. 7a). These high return periods correspond well to the exceptional reported impacts in these three municipalities (Table 3). In Los Alcazares and Torre-Pacheco (Fig. 6c), the flood extents during the event were recorded by the satellite-based Copernicus Rapid Mapping Service (ERCC, 2019, Fig. 7b). The satellite image in Torre-Pacheco dates from the morning of 13 September 2019 (i.e. only a few hours after the flood peak). It can be seen that the simulated flood extent in the south-eastern part of the municipality corresponds reasonably well to the recorded flood extent (Fig. 7b). In the rural lands west of the town, ReAFFIRM underestimated the flood extents since the employed flood maps did not include the small streams in this area (Fig. 7a). Overall, however, the simulated impacts in Torre-Pacheco correspond well to those reported (Table 3). Also in Los Alcazares, the simulated and observed flood extents are similar (Fig. 7b). However, the flood extent observed at this location was obtained from satellite observations taken 5 days after the peak of the event, suggesting that the real flood extent in Los Alcazares was significantly larger than recorded. Furthermore, civil protection authorities reported that in reality the municipality of Los Alcazares was inundated in its entirety (DGPCE, 2019). This means that ReAFFIRM underestimated the flood extent in Los Alcazares (and thus the impacts; Table 3). One reason for this underestimation is that – similarly as in Torre-Pacheco – the employed flood maps cover only part of the municipality (Fig. 7a). In flat areas such as this part of the domain, the flood maps are subject to high uncertainties due to the increased complexity of the underlying hydraulic simulations. Similar uncertainties in flat terrain also appeared further south in the municipality of Cartagena (Fig. 6c), where the flood maps of T = 50 years show widespread flooding along a few streams. This resulted in overestimated flood extents and impacts in the city centre of Cartagena and in a few smaller towns upstream that, in reality, suffered lower impact (Table 3).
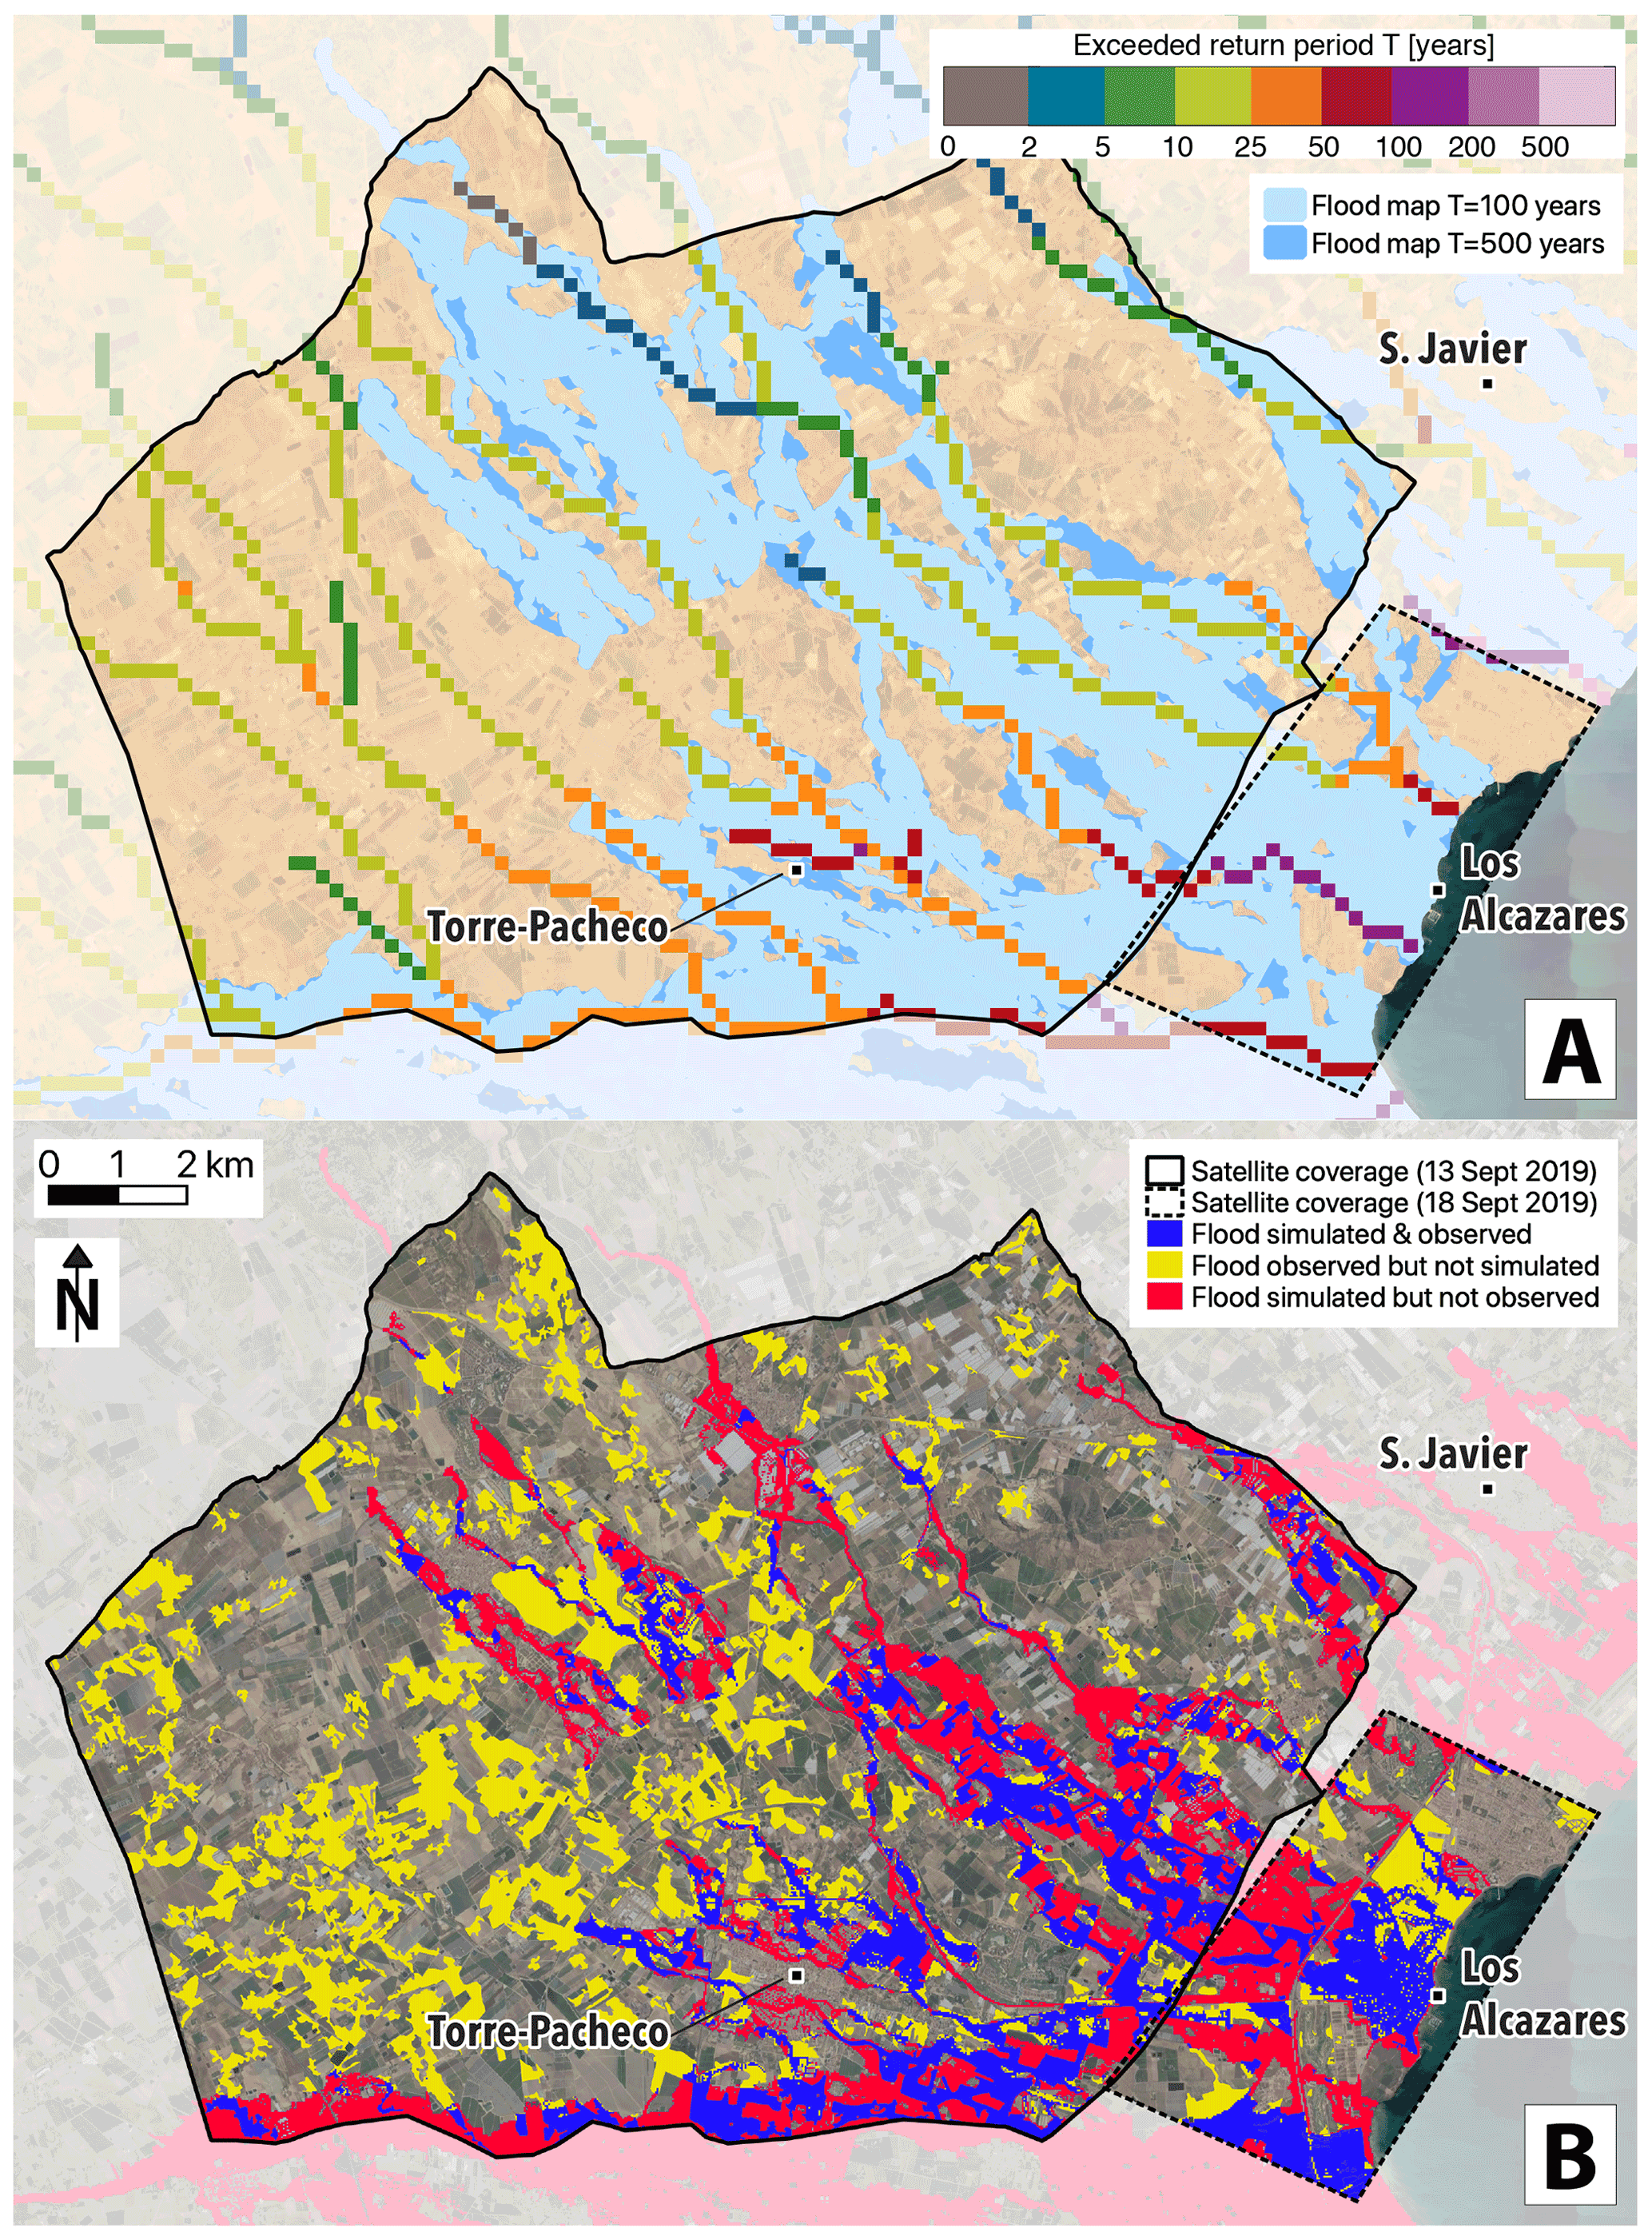
Figure 7(a) Maximum ERICHA flash flood hazard (11–14 September 2019) and official flood maps used for the simulation of the flood extents in Torre-Pacheco and Los Alcazares (for the location of the shown area, see Fig. 6c). (b) Comparison of the simulated flash flood extents with satellite observations in Torre-Pacheco (13 September 2019 10:50 UTC) and in Los Alcazares (18 September 2019 10:51 UTC). Map data © Google Earth 2015.
4.3 Estimated compound flood impacts
To estimate the compound flood extents and impacts, the simulation results of EFAS RRA (Sect. 4.1) and ReAFFIRM (Sect. 4.2) have been combined by following the simple procedure described in Sect. 3.3. The resulting compound flood extents in the areas along the Segura River are illustrated in Fig. 8 in red and blue. Also in this part of the domain, we have compared the simulated flood extents to satellite observations from the Copernicus Rapid Mapping Service (ERCC, 2019, Fig. 8). The satellite image in this location dates from 14 September 2019 17:52 UTC, i.e. about 30 h after the measured discharge peak in the Segura passed the most severely affected town of Orihuela (CHS, 2021). Even though the flood had already mostly receded at that time, many areas located several kilometres from the Segura still appear inundated in the satellite observations. The locations of these flooded patches indicate how far the water from the Segura must have reached during the peak of the event. From around Beniel to the river mouth, the flooded patches line up relatively well with the outlines of the simulated flood extents (Fig. 8), which indicates a good general correspondence between the simulated and the real flood extents in the downstream part of the Segura (although the flood extents were somewhat underestimated north-east of Dolores). The inundated areas north-west of Dolores (Fig. 8) originated not from the Segura but from a small tributary catchment and were correctly identified by ReAFFIRM (see the estimated return periods of T = 10–50 years in this location in Fig. 6b). Along the other tributaries of the Segura affected by flash floods, the inundations had already fully receded at the time of the satellite image acquisition. For instance, the flood peak in the stream north of Orihuela, where the two fatalities occurred (Fig. 6b), was observed on 13 September 2019 at 08:15 UTC (CRAHI, 2019), about 34 h before the satellite image was recorded (Fig. 8). At 08:00 UTC, ERICHA detected a return period of T = 500 years in this stream (Fig. 6b), indicating a good timing of the hazard signal in this location.
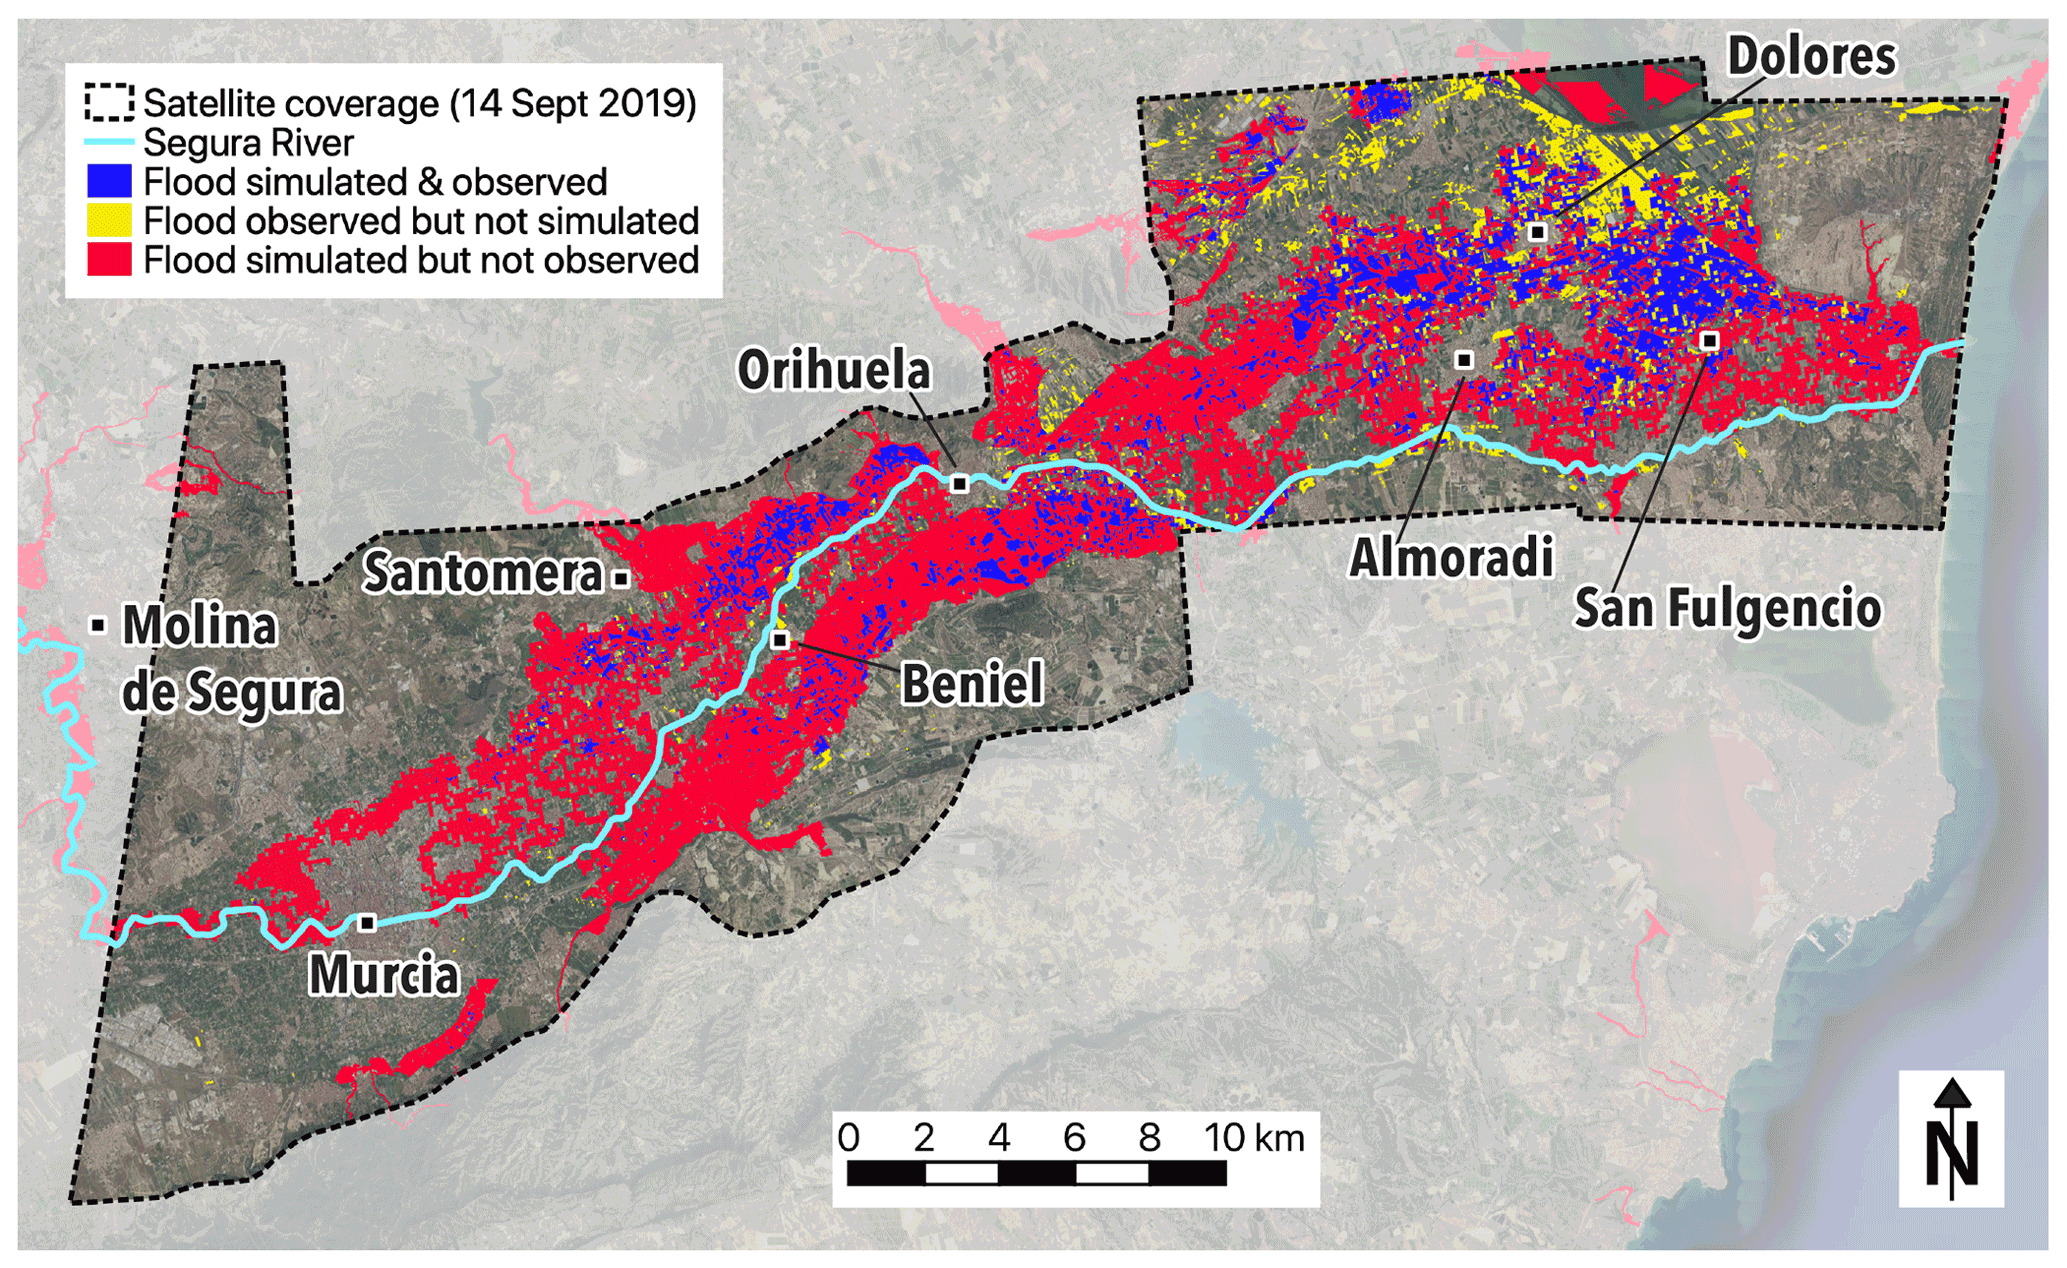
Figure 8Comparison of the simulated compound flood extents with the satellite observation of 14 September 2019 17:52 UTC. The location of this area is indicated by the dashed box in Fig. 4. Map data © Google Earth 2015.
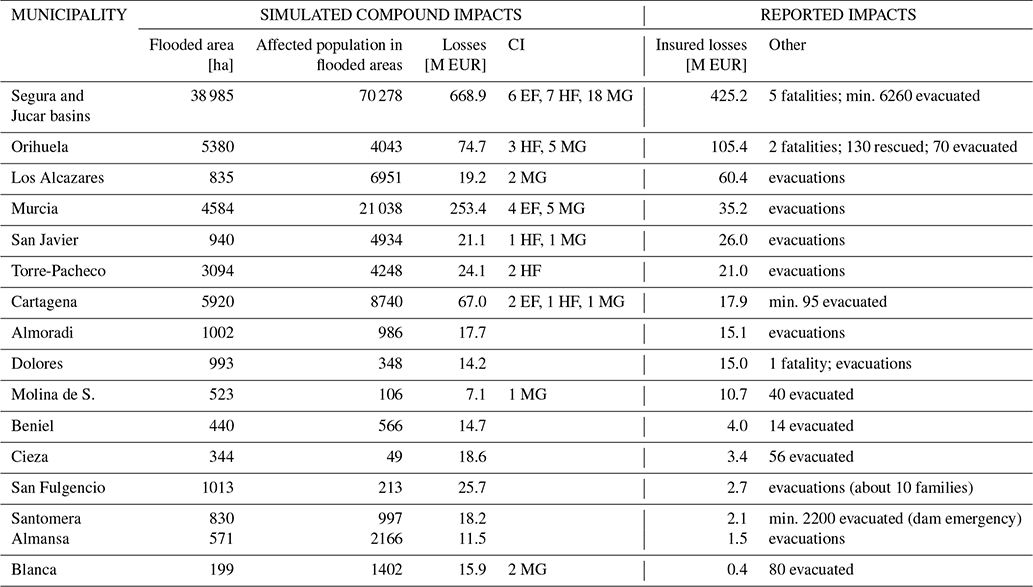
Over the two analysed river basins, the combination of EFAS RRA and ReAFFIRM identified 70 278 people and 31 CI located in flooded areas, and EUR 668.9 million in economic losses (Table 4). These numbers correspond relatively well to the reported impacts over the domain (Table 4). When analysing the results at the municipality level, the uncertainties affecting the compound impact estimates are more apparent (see, e.g. the large differences between simulated and insured economic losses in Los Alcazares or Murcia in Table 4).
Table 4Summary of simulated and reported compound flood impacts in the 15 municipalities with more than EUR 10 million in simulated or insured losses (corresponding to Fig. 9). Critical infrastructure (CI) categorised as education facilities (EF), health facilities (HF), and mass-gathering sites (MG).
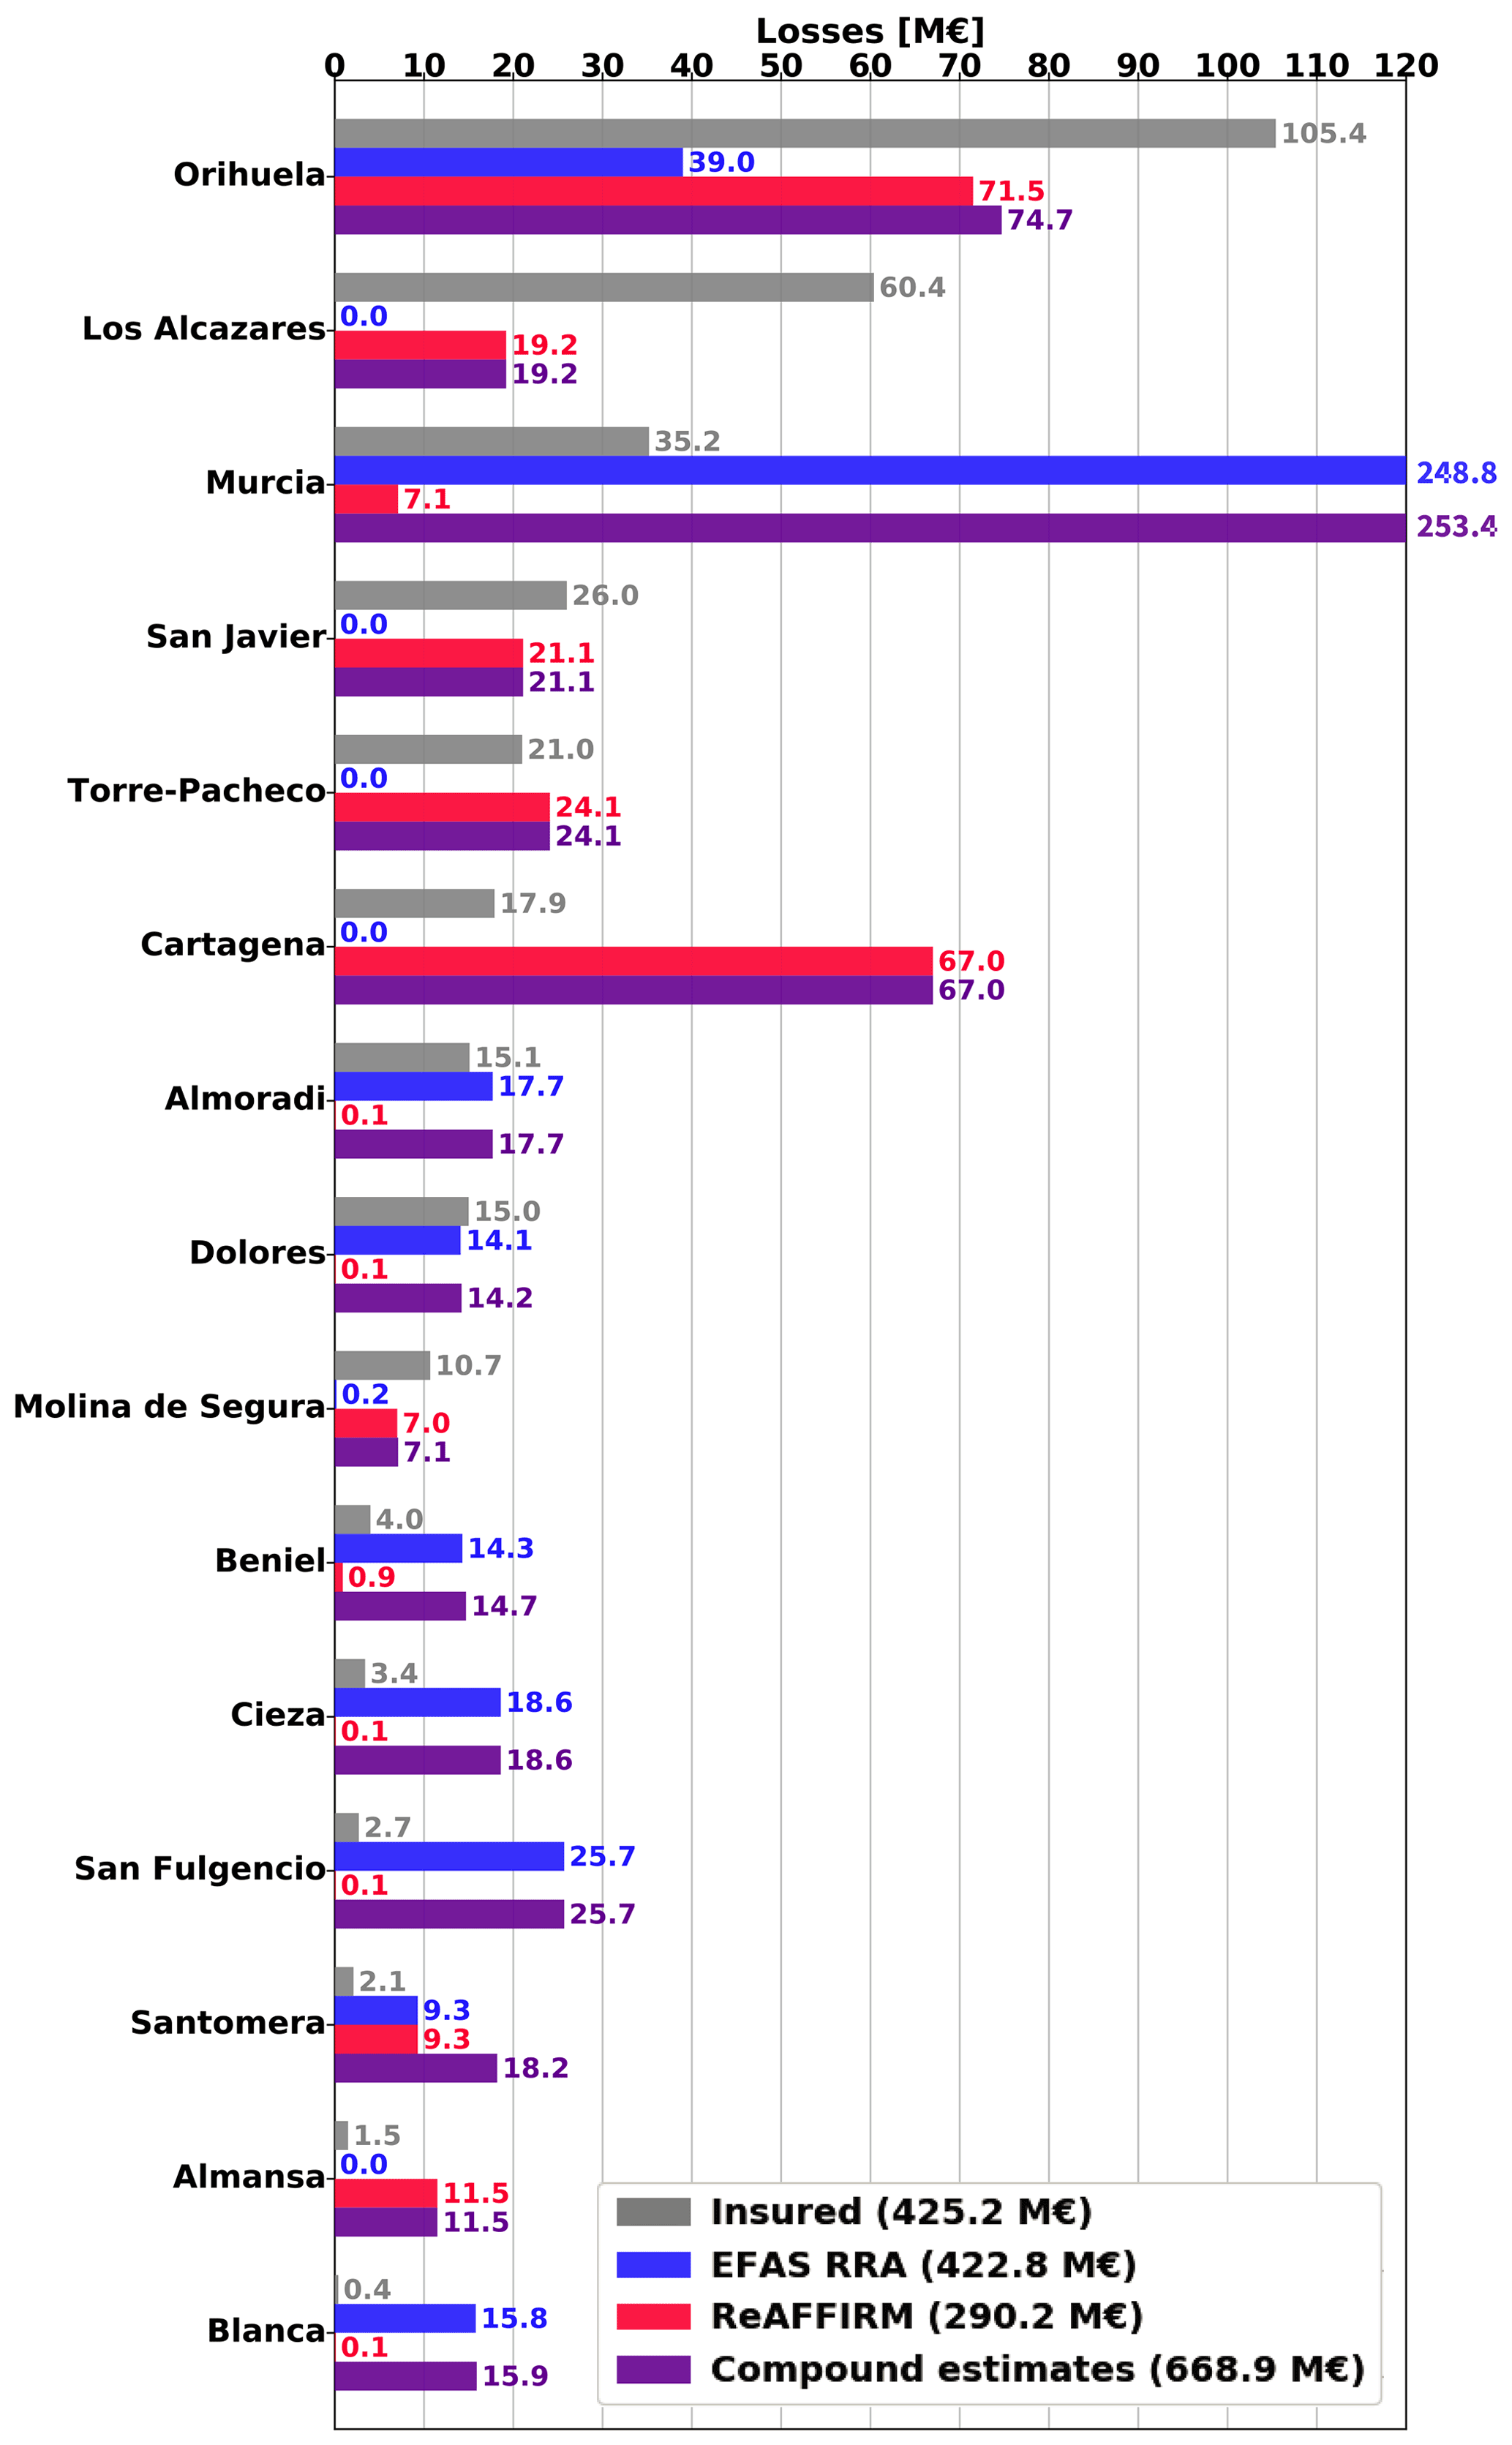
To clearly illustrate the complementarity of the two methods, we have analysed in detail the 15 municipalities with more than EUR 10 million in either simulated or insured losses (Fig. 9). As expected, EFAS RRA detected the losses induced by fluvial flooding along the Segura River (e.g. in Almoradi, Dolores, Beniel, or Cieza), whereas ReAFFIRM identified the losses in the municipalities that experienced flash floods (e.g. Los Alcazares, San Javier, Torre-Pacheco, Cartagena, or Almansa; Fig. 9). While the individual impact assessments of the two methods detected only the impacts induced by the specific flood type they are designed for, the compound impact estimation identified significant losses in all of the severely affected municipalities in the domain (Fig. 9). In other words, the false negatives (misses) in these 15 municipalities have been reduced to zero through the combination of the two methods. However, the false positives (false alarms) caused by the uncertainties in the individual methods cascaded down to the compound impact estimates. For instance, the significant overestimations of losses caused by EFAS RRA in Blanca (see Sect. 4.1) and by ReAFFIRM in Almansa (see Sect. 4.2) also appear in the simulated compound losses (Fig. 9).
Significant losses were simulated by both methods in only 3 of the 15 analysed municipalities (Orihuela, Murcia, and Santomera; Fig. 9). We have been able to confirm that these three municipalities were indeed affected by both fluvial and flash floods. In Orihuela, the estimated compound losses are lower than the real losses, since the combination of the methods identified only inundations of the agricultural lands and settlements surrounding the town but not in the severely affected town centre (CRAHI, 2019, Fig. 8). One reason for the flood extent underestimation in this location might by the high uncertainty of the EFAS flood maps in urban areas due to limitations of the underlying elevation data (see Dottori et al., 2021). In the municipality of Murcia, EFAS RRA significantly overestimated the fluvial flood impacts (see Sect. 4.1) and this overestimation propagated down to the compound impact estimates (Fig. 9). Also ReAFFIRM identified impacts in Murcia (Fig. 9) and it could be verified that flash floods occurred in some of the estimated impact locations (CRAHI, 2019). The impacts in Santomera were mostly induced by fluvial flooding from the Segura River, as correctly identified by EFAS RRA (Fig. 9). The flash flood impacts in this municipality were overestimated, since the real discharge peak in the affected tributary was significantly lowered by a dam not taken into account by the ERICHA system (see the location of the dam in Fig. 6b). The dam’s buffer capacity prevented a catastrophic flash flood in this tributary (Arbáizar-Barrios, 2019), but the critically high storage level required the evacuation of more than 2200 people in the town of Santomera, situated between the dam and the confluence with the Segura River (DGPCE, 2019, Fig. 6b).
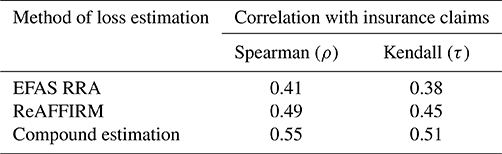
To also evaluate the simulated impacts from a quantitative perspective, we have conducted a correlation analysis of the loss estimates with the insurance claim database (CCS, 2020) over the 907 municipalities in the domain (Table 5). The Spearman (ρ) and Kendall (τ) rank correlation coefficients have been used to avoid an overly strong penalisation by large differences in single data points (as, e.g. in the Pearson correlation; see Croux and Dehon, 2010). These two coefficients measure to what degree the relationship between two datasets is monotonic, i.e. how well one variable can be expressed as a monotonic function of the other. Intuitively, values of ρ or τ = 1 correspond to a perfect correlation, whereas values of ρ or τ = 0 mean that the datasets are uncorrelated (Croux and Dehon, 2010). Values of ρ > 0.5 are commonly considered to show a strong correlation (see, e.g. Couasnon et al., 2020; Titley et al., 2021) and values of ρ are generally higher than those of τ (see, e.g. Camus et al., 2021; Wahl et al., 2015). The results of ρ and τ computed for our analysis show a moderate but significant correlation of the separate loss estimates from EFAS RRA and ReAFFIRM with the insurance claim database (Table 5). Furthermore, the correlation of the compound loss estimates with the insured losses is stronger than for those generated by the separate two methods (Table 5). This illustrates how the integration of EFAS RRA and ReAFFIRM into one compound flood impact estimation has improved the agreement between the simulated loss estimates and the reported insured losses.
This study proposes a more integrated perspective toward flood early warning systems. Flood forecasting approaches are commonly designed individually for the different physical processes that induce flooding (i.e. separate systems for fluvial, pluvial, coastal, and flash floods). Especially during compound flood events, the monitoring of these separate systems can be time-consuming and challenging for emergency managers, potentially leading to a delayed and suboptimal emergency response. We propose improving current practice by integrating existing flood type-specific impact forecasting methods into an overall compound flood impact forecast. This idea has been explored by combining real-time-adapted impact assessments for fluvial floods (using EFAS RRA; Dottori et al., 2017) and flash floods (using ReAFFIRM; Ritter et al., 2020a) for a recent catastrophic episode of compound flooding in south-east Spain.
The two separate impact assessments have been merged using simple predefined criteria. Despite the simplicity of the approach, the generated compound impact estimates corresponded significantly better to the observed impacts than those generated by the two individual methods. The number of false negatives in the most affected municipalities was reduced to zero through the combination of the methods, and the correlation of the simulated economic losses with insurance claims was higher for the compound impact estimation than for the individual two methods. Apart from increased accuracy, the proposed integrated impact estimation method improves usability for end-users: using separate outputs, it might not be fully clear to end-users why the flood type-specific assessments show fundamentally different results (although from a scientific perspective, it makes perfect sense). The presented integration of the two methods into one unified output may be easier to monitor and interpret, enabling a more immediate and effective emergency response.
The overall compound flood impacts simulated over the two analysed river basins corresponded very well to the impacts reported by various validation sources. When analysing the results at smaller scales (e.g. the municipality level), the underlying uncertainties are more apparent. The most important sources of uncertainty affecting the performance of the two methods and their combination appeared to be the accuracies of the employed hydrometeorological inputs and flood maps. A lack of satellite-based flood observations for the peak of the event hindered the quantitative evaluation of the simulated flood extents. Similarly to previous studies, the quantitative estimation of economic losses has been subject to high uncertainties in both of the methods (Dottori et al., 2017; Ritter et al., 2020a); however, the previously reported systematic overestimation of losses by ReAFFIRM has not been confirmed, likely due to the higher availability of flood depth data in the present case study area.
For the analysis carried out in this paper, the impacts simulated by EFAS RRA and ReAFFIRM have been aggregated over the full event duration and subsequently merged. Combining the two methods in an operational setting would require the merging of real-time outputs with different temporal resolutions and lead times (Table 1). One way to facilitate this task could be the application of blended rainfall products from radar and NWP (as, e.g. applied in the TAMIR project; Niemi et al., 2021), as a common input for the two methods. However, the uncertainty in flash flood forecasts is typically higher than for fluvial floods when considering longer forecasting horizons (e.g. days), and the sensitivity of the impact outputs towards the increased uncertainty in the inputs requires further investigation.
The combined impact estimation for fluvial and flash floods presented in this study can be applied at the regional scale. To extend the approach to the European scale, ReAFFIRM could be replaced by the newly developed pan-European approach for assessing flash flood impacts, named ReAFFINE (Real-time Assessment of Flash Flood Impacts at paN-European scale; Ritter et al., 2021a). This continental method has also been applied for the event analysed in this study, and the results show a high correspondence with the regional flash flood impact estimates generated by ReAFFIRM (Ritter et al., 2021b). Due to the coarser resolution of ReAFFINE, the combined product with EFAS RRA over Europe should be issued at the regional level, rather than the aggregation at municipality level done in this study.
An alternative procedure to the simple merging of the separate impact estimates proposed in this study could be to first simulate the compound flood hazards (e.g. in terms of compound water levels), and then translate the compound hazards into impacts. This would likely improve the quality of the impact estimation, especially for situations in which the spatial overlap of different flood types plays a crucial role (e.g. combined fluvial and coastal flooding during hurricanes). Several existing methods assess the compound water levels for different combinations of flood types (e.g. Apel et al., 2016; Chen et al., 2010; Santiago-Collazo et al., 2019), however, these have not yet been adapted to real-time conditions due to the high computational cost of the underlying coupled hydraulic models (especially when focusing on large spatial domains; Bates et al., 2021). These computational constraints make the creation of a full compound flood hazard forecast seem unfeasible for the near future. Meanwhile, simple combinations of flood type-specific impact simulations (as proposed in this study) represent a sound solution for forecasting compound flood impacts.
While this study investigated the combination of fluvial and flash floods experienced during one flood event, future efforts should aim at also integrating systems designed for pluvial floods and storm surges (in coastal areas) and testing them on a variety of past compound floods. For pluvial floods, a few impact forecasting systems were demonstrated at the scales of cities or small regions, e.g. expressing impacts in terms of affected population (Aldridge et al., 2016) or land uses (Hofmann and Schüttrumpf, 2019), economic losses (Rözer et al., 2021), and qualitative impact levels (Speight et al., 2018). For coastal floods, forecasts of impact indicators (e.g. the building–waterline distance; Harley et al., 2016) and economic losses (Bolle et al., 2018; Ferreira et al., 2018) were proposed at local or regional scales. As can be seen, these approaches estimate the impacts in partly different metrics than the two methods in this study (which assess the affected population, critical infrastructure, and economic losses). To estimate the impacts in terms of the same quantitative categories, some of the mentioned approaches could also employ the exposure and vulnerability datasets used in this study (available at the European scale; Sect. 3.1 and 3.2). This would enable a more straightforward integration into the presented compound flood impact estimation.
The results obtained in this study demonstrate the potential of integrating flood type-specific systems into a compound flood impact estimation for improving decision support services during floods. A long-term vision is to also integrate systems designed for other weather-induced hazards (e.g. snowfall or windstorms) into impact-based multi-hazard EWSs. This development would be a significant contribution towards a society that is more resilient to natural disasters (Merz et al., 2020; Rebora et al., 2019; UNISDR, 2015b; WMO, 2015, 2018a).
Hydrometeorological data were provided by OPERA, the Spanish State Meteorological Agency (AEMET), the Valencian Association of Meteorology (AVAMET, 2019, https://www.avamet.org/mx-meteoxarxa.php?id=2019-09-12), Ministerio de Fomento (1999), and the Hydrographic Confederation of the Segura River (CHS, 2021, http://saihweb.chsegura.es/apps/ivisor/inicial.php). The Spanish National Geographic Institute (IGN, 2020a, http://centrodedescargas.cnig.es/CentroDescargas/index.jsp; IGN, 2020b, https://www.siose.es/web/guest/inicio) kindly granted access to topography, flood maps, and land use datasets, and Freire et al. (2016) (http://data.europa.eu/89h/jrc-ghsl-ghs_pop_eurostat_europe_r2016a) and Giovando et al. (2020) provided socio-economic exposure data. The Spanish Insurance Compensation Consortium (CCS, 2020), the Spanish Directorate-General for Civil Protection and Emergencies (DGPCE, 2019), the Copernicus Rapid Mapping Service (ERCC, 2019, https://emergency.copernicus.eu/mapping/list-of-components/EMSR388), and various news media (compiled in CRAHI, 2019, http://www.crahi.upc.edu/ritter/dana2019/media_impacts.html) documented the impacts of the DANA event.
This work was initialised through ideas and discussions involving all of the authors. Following these discussions, JLR, MB, FS, and MK conceptualised the study. MK carried out the simulations of EFAS RRA, while JLR applied the ReAFFIRM method in the study area for the analysed flood event. JLR, MB, FS, and MK analysed the simulation results. Finally, JLR drafted the original manuscript, which was then reviewed by the co-authors. DST was responsible for funding acquisition and the provision of resources, and MB and DST supervised JLR throughout the development of this study and his doctoral dissertation.
The contact author has declared that neither they nor their co-authors have any competing interests.
Publisher’s note: Copernicus Publications remains neutral with regard to jurisdictional claims in published maps and institutional affiliations.
Special thanks are owed to Shinju Park and Calum Baugh for fruitful discussions.
This research has been supported by the Horizon 2020 project ANYWHERE (H2020-DRS-1-2015-700099), which financed the initial period of this study and the 4-month visiting stay of Josias Láng-Ritter at the European Commission Joint Research Centre in Ispra (Italy). The study has been finalised in the framework of the TAMIR project (UCPM-874435-TAMIR).
This paper was edited by Matjaz Mikos and reviewed by Mario Rohrer and two anonymous referees.
Aldridge, T., Gunawan, O., Moore, R. J., Cole, S. J., and Price, D.: A surface water flooding impact library for flood risk assessment, E3S Web Conf., 7, 18006, https://doi.org/10.1051/e3sconf/20160718006, 2016. a
Alfieri, L., Salamon, P., Pappenberger, F., Wetterhall, F., and Thielen, J.: Operational early warning systems for water-related hazards in Europe, Environ. Sci. Policy, 21, 35–49, https://doi.org/10.1016/j.envsci.2012.01.008, 2012. a
Alfieri, L., Berenguer, M., Knechtl, V., Liechti, K., Sempere-Torres, D., and Zappa, M.: Flash Flood Forecasting Based on Rainfall Thresholds, in: Handbook of Hydrometeorological Ensemble Forecasting, edited by: Duan, Q., Pappenberger, F., Wood, A., Cloke, H. L., and Schaake, J. C., Springer Berlin Heidelberg, Berlin, Heidelberg, 1223–1260, https://doi.org/10.1007/978-3-642-39925-1_49, 2019. a
AON: Global Catastrophe Recap – September 2019, Tech. rep., AON, available at: http://thoughtleadership.aon.com/Documents/20191009_analytics-if-september-global-recap.pdf (last access: 2 February 2022), 2019. a
Apel, H., Martínez Trepat, O., Hung, N. N., Chinh, D. T., Merz, B., and Dung, N. V.: Combined fluvial and pluvial urban flood hazard analysis: concept development and application to Can Tho city, Mekong Delta, Vietnam, Nat. Hazards Earth Syst. Sci., 16, 941–961, https://doi.org/10.5194/nhess-16-941-2016, 2016. a, b
Arbáizar-Barrios, F.: Episodio de Inundaciones en la Región de Murcia, 11–15 Septemer 2019, available at: https://www.miteco.gob.es/es/agua/formacion/presentacion-18-jornada-implantacion-pgris-lecciones-aprendidas-inundaciones2019_regmurcia_tcm30-503800.pdf (last access: 2 February 2022), 2019. a, b
AVAMET: MX MeteoXarxa – Dades històriques, AVAMET [data set], available at: https://www.avamet.org/mx-meteoxarxa.php?id=2019-09-12 (last access: 2 February 2022), 2019. a, b
Basher, R.: Global early warning systems for natural hazards: systematic and people-centred, Philos. T. R. Soc. A, 365, 2167–2182, https://doi.org/10.1098/rsta.2006.1819, 2006. a
Bates, P. D., Quinn, N., Sampson, C., Smith, A., Wing, O., Sosa, J., Savage, J., Olcese, G., Neal, J., Schumann, G., Giustarini, L., Coxon, G., Porter, J. R., Amodeo, M. F., Chu, Z., Lewis‐Gruss, S., Freeman, N. B., Houser, T., Delgado, M., Hamidi, A., Bolliger, I., McCusker, K., Emanuel, K., Ferreira, C. M., Khalid, A., Haigh, I. D., Couasnon, A., Kopp, R., Hsiang, S., and Krajewski, W. F.: Combined Modeling of US Fluvial, Pluvial, and Coastal Flood Hazard Under Current and Future Climates, Water Resour. Res., 57, e2020WR02867, https://doi.org/10.1029/2020wr028673, 2021. a
Bevington, J., Hankin, B., Berry, R., Gubbin, A., Lowis, A., Pinnell, M., Revilla-Romero, B., Shelton, K., and Wood, E.: Flood Foresight: Global Flood Impact Forecasting, EGU General Assembly 2019, Geophysical Research Abstracts, 21, Abstract number EGU2019-15430, available at: https://meetingorganizer.copernicus.org/EGU2019/EGU2019-15430.pdf (last access: 2 February 2022), 2019. a
Bolle, A., Das Neves, L., Smets, S., Mollaert, J., and Buitrago, S.: An impact-oriented Early Warning and Bayesian-based Decision Support System for flood risks in Zeebrugge harbour, Coast. Eng., 134, 191–202, https://doi.org/10.1016/j.coastaleng.2017.10.006, 2018. a
Brown, E., Bachmann, D., Cranston, M., De Leeuw, A., Boelee, L., Diermanse, F., Eilander, D., De Bruijn, K., Weerts, A., Hazlewood, C., and Beckers, J.: Methods and tools to support real time risk-based flood forecasting – A UK pilot application, E3S Web Conf., 7, 18019, https://doi.org/10.1051/e3sconf/20160718019, 2016. a
Camus, P., Haigh, I. D., Nasr, A. A., Wahl, T., Darby, S. E., and Nicholls, R. J.: Regional analysis of multivariate compound coastal flooding potential around Europe and environs: sensitivity analysis and spatial patterns, Nat. Hazards Earth Syst. Sci., 21, 2021–2040, https://doi.org/10.5194/nhess-21-2021-2021, 2021. a
Cassiraga, E., Gómez-Hernández, J. J., Berenguer, M., Sempere-Torres, D., and Rodrigo-Ilarri, J.: Spatiotemporal Precipitation Estimation from Rain Gauges and Meteorological Radar Using Geostatistics, Math. Geosci., 53, 499–516, https://doi.org/10.1007/s11004-020-09882-1, 2020. a
CCS: Base de datos, Daños asegurados por inundación en España (2000–2019), Tech. rep., Consorcio de Compensación de Seguros, Madrid, CCS [data set], 2020. a, b, c, d, e, f, g, h, i, j, k
Chen, A. S., Djordjevic, S., Leandro, J., and Savic, D. A.: An analysis of the combined consequences of pluvial and fluvial flooding, Water Sci. Technol., 62, 1491–1498, https://doi.org/10.2166/wst.2010.486, 2010. a, b
CHS: Marco físico, available at: https://www.chsegura.es/es/cuenca/caracterizacion/marco-fisico/ (last access: 2 February 2022), 2020a. a
CHS: Listado de embalses, available at: https://www.chsegura.es/es/cuenca/infraestructuras/embalses/listado-de-embalses/ (last access: 2 February 2022), 2020b. a
CHS: Confederación Hidrográfica del Segura – Sistema Automático de Información Hidrológica, CHS [data set], available at: http://saihweb.chsegura.es/apps/ivisor/inicial.php (last access: 2 February 2022), 2021. a, b, c
Cloke, H. L. and Pappenberger, F.: Ensemble flood forecasting: A review, J. Hydrol., 375, 613–626, https://doi.org/10.1016/j.jhydrol.2009.06.005, 2009. a
Cole, S. J., Moore, R. J., Wells, S. C., and Mattingley, P. S.: Real-time forecasts of flood hazard and impact: some UK experiences, E3S Web Conf., 7, 18015, https://doi.org/10.1051/e3sconf/20160718015, 2016. a
Corral, C., Velasco, D., Forcadell, D., Sempere-Torres, D., and Velasco, E.: Advances in radar-based flood warning systems. The EHIMI system and the experience in the Besòs flash-flood pilot basin, in: Flood risk management: research and practice, edited by: Samuels, P., Huntington, S., Allsop, W., and Harrop, J., Taylor and Francis Group, p. 309, ISBN 9780203883020, 2009. a, b
Corral, C., Berenguer, M., Sempere-Torres, D., Poletti, L., Silvestro, F., and Rebora, N.: Comparison of two early warning systems for regional flash flood hazard forecasting, J. Hydrol., 572, 603–619, https://doi.org/10.1016/j.jhydrol.2019.03.026, 2019. a, b, c, d
Couasnon, A., Eilander, D., Muis, S., Veldkamp, T. I. E., Haigh, I. D., Wahl, T., Winsemius, H. C., and Ward, P. J.: Measuring compound flood potential from river discharge and storm surge extremes at the global scale, Nat. Hazards Earth Syst. Sci., 20, 489–504, https://doi.org/10.5194/nhess-20-489-2020, 2020. a
CRAHI: Selection of impacts reported by the media during the DANA event of September 2019 in Spain, CRAHI [data set], available at: http://www.crahi.upc.edu/ritter/dana2019/media_impacts.html (last access: 2 February 2022), 2019. a, b, c, d, e, f, g, h, i, j, k, l, m
CRED: Natural Disasters 2018, Tech. rep., Centre for Research on the Epidemiology of Disasters, Brussels, Belgium, available at: https://www.cred.be/natural-disasters-2018 (last access: 2 February 2022), 2019. a
Croux, C. and Dehon, C.: Influence functions of the Spearman and Kendall correlation measures, Stat. Method. Appl., 19, 497–515, https://doi.org/10.1007/s10260-010-0142-z, 2010. a, b
Dale, M., Wicks, J., Mylne, K., Pappenberger, F., Laeger, S., and Taylor, S.: Probabilistic flood forecasting and decision-making: An innovative risk-based approach, Nat. Hazards, 70, 159–172, https://doi.org/10.1007/s11069-012-0483-z, 2014. a
DGPCE: Informe resumen de la emergencia producida por las graves inundaciones en el sureste, centro peninsular y Baleares (9–15 de septiembre de 2019), Tech. rep., Dirección General de Protección Civil y Emergencias, Madrid, 2019. a, b, c, d, e, f, g, h, i
Dottori, F., Kalas, M., Salamon, P., Bianchi, A., Alfieri, L., and Feyen, L.: An operational procedure for rapid flood risk assessment in Europe, Nat. Hazards Earth Syst. Sci., 17, 1111–1126, https://doi.org/10.5194/nhess-17-1111-2017, 2017. a, b, c, d, e, f, g
Dottori, F., Szewczyk, W., Ciscar, J. C., Zhao, F., Alfieri, L., Hirabayashi, Y., Bianchi, A., Mongelli, I., Frieler, K., Betts, R. A., and Feyen, L.: Increased human and economic losses from river flooding with anthropogenic warming, Nat. Clim. Change, 8, 781–786, https://doi.org/10.1038/s41558-018-0257-z, 2018. a
Dottori, F., Alfieri, L., Bianchi, A., Skoien, J., and Salamon, P.: A new dataset of river flood hazard maps for Europe and the Mediterranean Basin region, Earth Syst. Sci. Data Discuss. [preprint], https://doi.org/10.5194/essd-2020-313, in review, 2021. a, b, c
ERCC: EMSR388: Flood in the Southeast of Spain, ERCC [data set], available at: https://emergency.copernicus.eu/mapping/list-of-components/EMSR388 (last access: 2 February 2022), 2019. a, b, c
European Commission: Directive 2007/60/EC of the European Parliament and of the Council of 23 October 2007 on the Assessment and Management of Flood Risks, Tech. rep., The European Parliament and the Council of the European Union, available at: http://eur-lex.europa.eu/legal-content/EN/TXT/?uri=CELEX:32007L0060 (last access: 2 February 2022), 2007. a, b, c
Fernández-Montblanc, T., Vousdoukas, M. I., Ciavola, P., Voukouvalas, E., Mentaschi, L., Breyiannis, G., Feyen, L., and Salamon, P.: Towards robust pan-European storm surge forecasting, Ocean Model., 133, 129–144, https://doi.org/10.1016/j.ocemod.2018.12.001, 2019. a
Ferreira, O., Viavattene, C., Jiménez, J. A., Bolle, A., das Neves, L., Plomaritis, T. A., McCall, R., and van Dongeren, A. R.: Storm-induced risk assessment: Evaluation of two tools at the regional and hotspot scale, Coast. Eng., 134, 241–253, https://doi.org/10.1016/j.coastaleng.2017.10.005, 2018. a
Ferreira, R. N.: Cut-Off Lows and Extreme Precipitation in Eastern Spain: Current and Future Climate, Atmosphere, 12, 835, https://doi.org/10.3390/atmos12070835, 2021. a
Freire, S., Halkia, M., and Pesaresi, M.: GHS population grid, derived from EUROSTAT census data (2011) and ESM R2016, European Commission, Joint Research Centre (JRC) [data set], available at: http://data.europa.eu/89h/jrc-ghsl-ghs_pop_eurostat_europe_r2016a (last access: 2 February 2022), 2016. a, b, c
García, L., Bermejo, J., Sánchez, J., and Guerrero, J.: Dana 2019 y aspectos relativos a la estimación y tratamiento del riesgo asociado a inundaciones, in: Riesgo de inundación en España: análisis y soluciones para la generación de territorios resilientes, Universidad de Alicante, 143–166, available at: https://dialnet.unirioja.es/servlet/articulo?codigo=7578902 (last access: 2 February 2022), 2020. a
Georgakakos, K. P.: On the Design of National, Real-Time Warning Systems with Capability for Site-Specific, Flash-Flood Forecasts, B. Am. Meteorol. Soc., 67, 1233–1239, https://doi.org/10.1175/1520-0477(1986)067<1233:OTDONR>2.0.CO;2, 1986. a
Giovando, C., Zia, M., and Kalas, M.: Global Exposure Data for Risk Assessment (May 2019–March 2020) – Project report, Tech. rep., European Commission Joint Research Centre [data set], 2020. a, b, c
Goldscheider, N., Chen, Z., Auler, A. S., Bakalowicz, M., Broda, S., Drew, D., Hartmann, J., Jiang, G., Moosdorf, N., Stevanovic, Z., Veni, G., and De, C. Z.: Global distribution of carbonate rocks and karst water resources, Hydrogeol. J., 28, 1661–1677, https://doi.org/10.1007/s10040-020-02139-5, 2020. a
Guimarães Nobre, G., Moel, H., Giuliani, M., Bischiniotis, K., Aerts, J. C., and Ward, P. J.: What Will the Weather Do? Forecasting Flood Losses Based on Oscillation Indices, Earth's Future, 8, e2019EF001450, https://doi.org/10.1029/2019EF001450, 2020. a
Hapuarachchi, H. A. P., Wang, Q. J., and Pagano, T. C.: A review of advances in flash flood forecasting, Hydrol. Process., 25, 2771–2784, https://doi.org/10.1002/hyp.8040, 2011. a
Harley, M. D., Valentini, A., Armaroli, C., Perini, L., Calabrese, L., and Ciavola, P.: Can an early-warning system help minimize the impacts of coastal storms? A case study of the 2012 Halloween storm, northern Italy, Nat. Hazards Earth Syst. Sci., 16, 209–222, https://doi.org/10.5194/nhess-16-209-2016, 2016. a
Hartmann, A., Goldscheider, N., Wagener, T., Lange, J., and Weiler, M.: Karst water resources in a changing world: Review of hydrological modeling approaches, Rev. Geophys., 52, 218–242, https://doi.org/10.1002/2013RG000443, 2014. a
Henonin, J., Russo, B., Mark, O., and Gourbesville, P.: Real-time urban flood forecasting and modelling – a state of the art, J. Hydroinform., 15, 717–736, https://doi.org/10.2166/hydro.2013.132, 2013. a
Hofmann, J. and Schüttrumpf, H.: Risk-Based Early Warning System for Pluvial Flash Floods: Approaches and Foundations, Geosciences, 9, 127, https://doi.org/10.3390/geosciences9030127, 2019. a
Huizinga, J., de Moel, H., and Szewczyk, W.: Global flood depth-damage functions: Methodology and the Database with Guidelines, Tech. rep., Joint Research Centre (JRC), https://doi.org/10.2760/16510, 2017. a, b
IGN: Instituto Geográfico Nacional – Centro de Descargas, IGN [data set], available at: http://centrodedescargas.cnig.es/CentroDescargas/index.jsp (last access: 2 February 2022), 2020a. a, b, c, d
IGN: Instituto Geográfico Nacional – Geoportal SIOSE, IGN [data set], available at: https://www.siose.es/web/guest/inicio (last access: 2 February 2022), 2020b. a, b
IPCC: Managing the Risks of Extreme Events and Disasters to Advance Climate Change Adaptation. A Special Report of Working Groups I and II of the Intergovernmental Panel on Climate Change, edited by: Field, C. B., Barros, V., Stocker, T. F., Qin, D., Dokken, D. J., Ebi, K. L., Mastrandrea, M. D., Mach, K. J., Plattner, G.-K., Allen, S. K., Tignor, M., and Midgley, P. M., Cambridge University Press, Cambridge, UK, and New York, USA, ISBN 978-1-107-02506-6, 2018. a, b
Jain, S. K., Mani, P., Jain, S. K., Prakash, P., Singh, V. P., Tullos, D., Kumar, S., Agarwal, S. P., and Dimri, A. P.: A Brief review of flood forecasting techniques and their applications, International Journal of River Basin Management, 16, 329–344, https://doi.org/10.1080/15715124.2017.1411920, 2018. a
Javelle, P., Organde, D., Demargne, J., Saint-Martin, C., de Saint-Aubin, C., Garandeau, L., and Janet, B.: Setting up a French national flash flood warning system for ungauged catchments based on the AIGA method, E3S Web Conf., 7, 18010, https://doi.org/10.1051/e3sconf/20160718010, 2016. a
Kirpich, Z.: Time of concentration of small agricultural watersheds, Civil Eng. 10, 362, 1940. a
Kohno, N., Dube, S. K., Entel, M., Fakhruddin, S., Greenslade, D., Leroux, M.-D., Rhome, J., and Thuy, N. B.: Recent Progress in Storm Surge Forecasting, Tropical Cyclone Research and Review, 7, 128–139, https://doi.org/10.6057/2018TCRR02.04, 2018. a
Le Bihan, G., Payrastre, O., Gaume, E., Moncoulon, D., and Pons, F.: The challenge of forecasting impacts of flash floods: test of a simplified hydraulic approach and validation based on insurance claim data, Hydrol. Earth Syst. Sci., 21, 5911–5928, https://doi.org/10.5194/hess-21-5911-2017, 2017. a
Martín León, F.: Las gotas frías/DANAs: ideas y conceptos básicos, Tech. rep., INSTITUTO NACIONAL DE METEOROLOGÍA, Madrid, ISBN 84-8320-247-6, 2003. a
Mazzetti, C. and Harrigan, S.: What's new in EFAS 4.0?, available at: https://www.efas.eu/sites/default/files/AM/AM2020/EFAS_AM_2020_2_What is new in EFAS4.pdf (last access: 2 February 2022), 2020. a
Merz, B., Kuhlicke, C., Kunz, M., Pittore, M., Babeyko, A., Bresch, D. N., V Domeisen, D. I., Feser, F., Koszalka, I., Kreibich, H., Pantillon, F., Parolai, S., Pinto, J. G., Punge, H.-J., Rivalta, E., Schröter, K., Strehlow, K., Weisse, R., and Wurpts, A.: Impact Forecasting to Support Emergency Management of Natural Hazards, Rev. Geophys., 58, e2020RG000704, https://doi.org/10.1029/2020RG000704, 2020. a, b, c, d
Ministerio de Fomento: Máximas lluvias diarias en España Peninsular, Tech. rep., Ministerio de Fomento [data set], 1999. a, b
Munich Re: Flood risk: Underestimated natural hazards, available at: https://www.munichre.com/en/risks/natural-disasters-losses-are-trending-upwards/floods-and-flash-floods-underestimated-natural-hazards.html (last access: 2 February 2022), 2020. a
Nazemi, A. and Wheater, H. S.: On inclusion of water resource management in Earth system models – Part 2: Representation of water supply and allocation and opportunities for improved modeling, Hydrol. Earth Syst. Sci., 19, 63–90, https://doi.org/10.5194/hess-19-63-2015, 2015. a
Niemi, T., Baugh, C., Berenguer, M., Berruezo, A., Leinonen, M., von Lerber, A., Park, S., Prudhomme, C., Pulkkinen, S., and Ritvanen, J.: Advanced Tools for pro-Active Management of Impacts and Risks Induced by Convective Weather, Heavy Rain and Flash floods in Europe – TAMIR project, EGU General Assembly 2021, online, 19–30 Apr 2021, EGU21-8194, https://doi.org/10.5194/egusphere-egu21-8194, 2021. a
Pappenberger, F., Cloke, H. L., Parker, D. J., Wetterhall, F., Richardson, D. S., and Thielen, J.: The monetary benefit of early flood warnings in Europe, Environ. Sci. Policy, 51, 278–291, https://doi.org/10.1016/j.envsci.2015.04.016, 2015. a
Park, S., Berenguer, M., and Sempere-Torres, D.: Long-term analysis of gauge-adjusted radar rainfall accumulations at European scale, J. Hydrol., 573, 768–777, https://doi.org/10.1016/j.jhydrol.2019.03.093, 2019. a
Rebora, N., Vicente, C., De Ferrari, R., Cangros, A., Sutanto, S., van Lanen, H. A., Karvonen, M., Von Lerber, A., Bergman, T., Peter, A., Moy, J. S., Botey, P., Torres, R. M., and Santiago, A.: ANYWHERE Project Deliverable 6.5: Final report compiling the results of the A4EU in each pilot site, Tech. rep., available at: http://www.anywhere-h2020.eu/wp-content/uploads/docs/D6.5_submitted.pdf (last access: 2 February 2022), 2019. a
Ritter, J., Berenguer, M., Corral, C., Park, S., and Sempere-Torres, D.: ReAFFIRM: Real-time Assessment of Flash Flood Impacts – a Regional high-resolution Method, Environ. Int., 136, 105375, https://doi.org/10.1016/j.envint.2019.105375, 2020a. a, b, c, d, e, f, g, h, i, j
Ritter, J., Corzo, G., Solomatine, D., and Angarita, H.: Multiobjective Direct Policy Search Using Physically Based Operating Rules in Multireservoir Systems, J. Water Res. Pl., 146, 05020002, https://doi.org/10.1061/(ASCE)WR.1943-5452.0001159, 2020b. a
Ritter, J., Berenguer, M., Park, S., and Sempere-Torres, D.: Real-time Assessment of Flash Flood Impacts at pan-European scale: The ReAFFINE method, J. Hydrol., 603, 127022, https://doi.org/10.1016/j.jhydrol.2021.127022, 2021a. a, b
Ritter, J., Berenguer, M., Park, S., and Sempere-Torres, D.: Rapid flash flood impact assessments at different spatial scales, EGU General Assembly 2021, online, 19–30 Apr 2021, EGU21-14444, https://doi.org/10.5194/egusphere-egu21-14444, 2021b. a, b
Roo, A. P. J. D., Wesseling, C. G., and Deursen, W. P. A. V.: Physically based river basin modelling within a GIS: the LISFLOOD model, Hydrol. Process., 14, 1981–1992, https://doi.org/10.1002/1099-1085(20000815/30)14:11/12<1981::AID-HYP49>3.0.CO;2-F, 2000. a
Rözer, V., Peche, A., Berkhahn, S., Feng, Y., Fuchs, L., Graf, T., Haberlandt, U., Kreibich, H., Sämann, R., Sester, M., Shehu, B., Wahl, J., and Neuweiler, I.: Impact‐Based Forecasting for Pluvial Floods, Earth's Future, 9, 2020EF001851, https://doi.org/10.1029/2020EF001851, 2021. a
Saint-Martin, C., Fouchier, C., Javelle, P., Douvinet, J., and Vinet, F.: Assessing the exposure to floods to estimate the risk of flood-related damage in French Mediterranean basins, E3S Web Conf., 7, 04013, https://doi.org/10.1051/e3sconf/20160704013, 2016. a
Saltikoff, E., Haase, G., Delobbe, L., Gaussiat, N., Martet, M., Idziorek, D., Leijnse, H., Novák, P., Lukach, M., and Stephan, K.: OPERA the radar project, Atmosphere, 10, 320, https://doi.org/10.3390/atmos10060320, 2019. a
Santiago-Collazo, F. L., Bilskie, M. V., and Hagen, S. C.: A comprehensive review of compound inundation models in low-gradient coastal watersheds, Environ. Modell. Softw., 119, 166–181, https://doi.org/10.1016/j.envsoft.2019.06.002, 2019. a, b
Silvestro, F., Rossi, L., Campo, L., Parodi, A., Fiori, E., Rudari, R., and Ferraris, L.: Impact-based flash-flood forecasting system: Sensitivity to high resolution numerical weather prediction systems and soil moisture, J. Hydrol., 572, 388–402, https://doi.org/10.1016/j.jhydrol.2019.02.055, 2019. a
Speight, L., Cole, S. J., Moore, R. J., Pierce, C., Wright, B., Golding, B., Cranston, M., Tavendale, A., Dhondia, J., and Ghimire, S.: Developing surface water flood forecasting capabilities in Scotland: an operational pilot for the 2014 Commonwealth Games in Glasgow, J. Flood Risk Manag., 11, S884–S901, https://doi.org/10.1111/jfr3.12281, 2018. a
Titley, H. A., Cloke, H. L., Harrigan, S., Pappenberger, F., Prudhomme, C., Robbins, J. C., Stephens, E. M., and Zsoter, E.: Key factors influencing the severity of fluvial flood hazard from tropical cyclones, J. Hydrometeorol., 22, 1801–1817, https://doi.org/10.1175/jhm-d-20-0250.1, 2021. a
UNISDR: Developing Early Warning Systems: A checklist. The conclusions of the third international conference on early warning, Tech. rep., United Nations International Strategy for Disaster Reduction, Bonn, Germany, available at: https://www.unisdr.org/2006/ppew/info-resources/ewc3/checklist/English.pdf (last access: 2 February 2022), 2006. a
UNISDR: Global Assessment Report on Disaster Risk Reduction. Making Development Sustainable: The Future of Disaster Risk Management, Tech. rep., United Nations International Strategy for Disaster Risk Reduction, available at: https://www.preventionweb.net/english/hyogo/gar/2015/en/gar-pdf/GAR2015_EN.pdf (last access: 2 February 2022), 2015a. a
UNISDR: Sendai Framework for Disaster Risk Reduction 2015–2030, Tech. rep., United Nations Office for Disaster Risk Reduction, available at: https://www.undrr.org/publication/sendai-framework-disaster-risk-reduction-2015-2030 (last access: 2 February 2022), 2015b. a
Van Der Knijff, J. M., Younis, J., and De Roo, A. P. J.: LISFLOOD: a GIS‐based distributed model for river basin scale water balance and flood simulation, International Journal of Geographical Information Science, 24, 189–212, https://doi.org/10.1080/13658810802549154, 2010. a
Vaz, N.: Visualizing the Impacts of NWS Coastal Flood Forecasts using NWS Impacts Catalogs and NOAA Coastal Inundation Viewer, available at: https://www.weather.gov/media/okx/coastalflood/Understanding Coastal Impacts.pdf (last access: 2 February 2022), 2017. a
Velasco-Forero, C. A., Sempere-Torres, D., Cassiraga, E. F., and Gómez-Hernández, J. J.: A non-parametric automatic blending methodology to estimate rainfall fields from rain gauge and radar data, Adv. Water Resour., 32, 986–1002, https://doi.org/10.1016/j.advwatres.2008.10.004, 2009. a
Versini, P.-A., Gaume, E., and Andrieu, H.: Application of a distributed hydrological model to the design of a road inundation warning system for flash flood prone areas, Nat. Hazards Earth Syst. Sci., 10, 805–817, https://doi.org/10.5194/nhess-10-805-2010, 2010. a
Wahl, T., Jain, S., Bender, J., Meyers, S. D., and Luther, M. E.: Increasing risk of compound flooding from storm surge and rainfall for major US cities, Nat. Clim. Change, 5, 1093–1097, https://doi.org/10.1038/nclimate2736, 2015. a, b
WMO: WMO Guidelines on Multi-hazard Impact-based Forecast and Warning Services, Tech. Rep. 1150, World Meteorological Organization, available at: https://library.wmo.int/index.php?lvl=notice_display&id=17257#.YfqCjsaxUUE (last access: 2 February 2022), 2015. a, b
WMO: Guidelines on the Definition and Monitoring of Extreme Weather and Climate Events – Final draft, Tech. rep., World Meteorological Organiation, available at: https://ane4bf-datap1.s3-eu-west-1.amazonaws.com/wmocms/s3fs-public/event/related_docs/DraftversionoftheGuidelinesonthe DefinitionandMonitoringofExtremeWeatherandClimateEvents.pdf?h2Kr0f7dXp6CXZzoclQYveoEQ9FNoO5r (last access: 2 February 2022), 2018a. a
WMO: Multi-hazard Early Warning Systems: A Checklist. Outcome of the first Multi-hazard Early Warning Conference, Tech. rep., World Meteorological Organization, Cancún, Mexico, available at: https://library.wmo.int/doc_num.php?explnum_id=4463 (last access: 2 February 2022), 2018b. a
World Bank: Natural hazards, unnatural disasters: the economics of effective prevention, World Bank, available at: https://openknowledge.worldbank.org/handle/10986/2512 (last access: 2 February 2022), 2010. a
Zanchetta, A. D. and Coulibaly, P.: Recent advances in real-time pluvial flash flood forecasting, Water (Switzerland), 12, 570, https://doi.org/10.3390/w12020570, 2020. a
Zscheischler, J., Martius, O., Westra, S., Bevacqua, E., Raymond, C., Horton, R., van den Hurk, B., AghaKouchak, A., Jézéquel, A., Mahecha, M., Maraun, D., Ramos, A., Ridder, N., Thiery, W., and Vignotto, E.: A typology of compound weather and climate events, EGU General Assembly 2020, Online, 4–8 May 2020, EGU2020-8572, https://doi.org/10.5194/egusphere-egu2020-8572, 2020. a