the Creative Commons Attribution 4.0 License.
the Creative Commons Attribution 4.0 License.
 | 10 Feb 2022
A new large-scale suspended sediment model and its application over the United States
Hongbo Ma
Zhenduo Zhu
Guta Wakbulcho Abeshu
Senlin Zhu
Sagy Cohen
Tian Zhou
Donghui Xu
L. Ruby Leung
Suspended sediment plays a vital role in the regional and global cycling of carbon and nutrients by carrying carbon and nutrients from headwaters into lowland rivers and the oceans. Sediment transport through river systems is often fundamentally modified by human activities such as reservoir management. However, a physically based representation of sediment transport is still missing in most existing Earth system models (ESMs), which are essential tools for modeling and predicting Earth system changes. Here, we introduce a multi-process river sediment module for ESMs, which includes (1) hillslope soil erosion and sediment discharge into streams, (2) sediment transport processes through river networks, (3) reservoir operation based on the inflows from upstream areas and water demand from downstream areas, and (4) sediment trapping by reservoirs. All model parameters are estimated a priori without calibration. We apply this new sediment modeling framework to the contiguous United States and validate it against historical observations of monthly streamflow and sediment discharges at 35 river gauges. The model reasonably well captures the long-term balance and seasonal variations of suspended sediment in large river systems. Furthermore, our model results show that suspended sediment discharge in managed rivers is affected more by reservoirs' direct trapping of sediment particles than by their flow regulation. This new sediment module enables future modeling of the transportation and transformation of carbon and nutrients carried by the fine sediment along the river–ocean continuum to close the global carbon and nutrient cycles.
- Article
(23093 KB) - Full-text XML
- BibTeX
- EndNote


Fluvial suspended sediment (referred to as suspended sediment) is fine-grained particles that may be diffused throughout the vertical column of rivers via turbulence and transported along rivers (Garcia, 2008). It typically consists of fine sand, silt, and clay, which can absorb carbon and nutrients. Recently, increasing evidence showed that suspended sediment transport plays a vital role in regional and global carbon and nutrient cycling (Berhe et al., 2018; Lal, 2003, 2004; Ludwig and Probst, 1996; Van Oost et al., 2007; Maavara et al., 2020) by carrying carbon and nutrients from soil storage pools into rivers and eventually oceans or lakes. For instance, suspended sediment is a major source of carbon and nutrients sustaining coastal wetlands and deltas (Kirwan and Megonigal, 2013; Nienhuis et al., 2020). While understanding the global carbon and nutrient cycling has been one of the primary goals of Earth system models (ESMs), few ESMs have incorporated the representation of suspended sediment and the associated carbon and nutrient fluxes, e.g., particulate organic and inorganic carbon, nitrogen, and phosphorous.
In the field of Earth system modeling, there are two primary reasons for the lack of suspended sediment in current ESMs. First, most ESMs have been developed with a conventional assumption that the lateral carbon fluxes through the land–river–ocean continuum are not significant compared to the carbon dynamics within the larger carbon pool in the atmosphere, land, and ocean or to the vertical carbon fluxes between the atmosphere and the underlying land and ocean. This assumption has now been refuted by data-based empirical studies (Berhe et al., 2018; Lal, 2003, 2004; Ludwig and Probst, 1996; Van Oost et al., 2007; Maavara et al., 2020). Second, process-based representations of hydrological fluxes, such as overland flow generation and routing, channel routing, and reservoir operations that drive the suspended sediment fluxes, are not included in many ESMs. The recent development of a physically based large-scale surface flow routing model, the Model for Scale Adaptive River Transport (MOSART) (Li et al., 2013, 2015a, b; Voisin et al., 2013a, b), is one of the few attempts to overcome this obstacle. MOSART explicitly incorporates the processes of overland flow routing across hillslopes, channel routing through tributaries and main channel networks, and water management such as reservoir regulation and surface water withdrawal, thus providing a solid physical basis to represent suspended sediment dynamics in both natural and managed rivers. Therefore, building on the MOSART framework, our first objective is to advance Earth system modeling by introducing a new suspended sediment module in ESMs.
In the field of sediment modeling, there have been several large-scale models of suspended sediment accounting for the spatiotemporal heterogeneity in sediment supply and transport processes (Czuba et al., 2017; Ferguson et al., 2015; Patil et al., 2012; Pelletier, 2012; Schmitt et al., 2016, 2018; Tsuruta et al., 2018; White et al., 2014). However, few have been designed for regional or global applications with explicit accounting for the effects of reservoirs prevalent in most river systems (Nilsson et al., 2005). Among the exceptions are BQART (Syvitski et al., 2003, 2005) and WBMsed (Cohen et al., 2013, 2014; Moragoda and Cohen, 2020). In BQART, a multivariable regression relationship has been established for each basin between the long-term suspended sediment load (hereafter, “load” refers to sediment discharge/flux) at the basin outlet and several parameters accounting for the average climate, lithology, and anthropogenic conditions at the basin scale (Syvitski et al., 2003, 2005). WBMsed is a grid-based implementation of BQART running at the daily time step. In WBMsed, each grid is assumed to be the outlet of its upstream drainage area. A BQART-type regression relationship is used to simulate long-term suspended sediment load from the upstream drainage area to the downstream through the grid. A stochastic model is then used to resolve suspended sediment discharge at a daily timescale from the long-term suspended sediment discharge (Cohen et al., 2013, 2014).
Despite the pioneering work in developing BQART and WBMsed, these models are not ready to be incorporated into ESMs as their soil erosion and riverine sediment processes are lumped rather than separately represented. Moreover, the inherent empiricism of BQART/WBMsed limits its scalability (from large to small rivers) and, in its current formulation, the models do not explicitly account for erosion processes on the landscape and within the channel systems. This empiricism is thus a hurdle to studying the individual impacts of the first-order processes and their driving factors, such as the various human activities such as land and water management. Moreover, although WBMsed includes a temporally and spatially explicit sediment trapping algorithm, it does not explicitly simulate sediment movement from grid cell to grid cell. Compared to more physically based models, this limitation will likely constrain its capabilities in sediment prediction in a changing environment. Hence our second objective is to advance large-scale sediment modeling by designing a physically based, flexible modeling framework that allows for explicit and separate representation of the first-order processes and their driving factors.
To achieve the two objectives, we propose a new process-based suspended sediment module within MOSART, denoted as MOSART-sediment hereafter. MOSART-sediment consists of (1) hillslope soil erosion and sediment discharge into streams, (2) sediment transport processes through river networks, and (3) reservoir effects on riverine sediment fluxes. MOSART has been adopted as the riverine component of the Energy Exascale Earth System Model (E3SM) (formerly known as Accelerated Climate Modeling for Energy – ACME) (Caldwell et al., 2019; Golaz et al., 2019) and the Community Earth System Model (CESM) (Lawrence et al., 2019). MOSART-sediment is thus, by design, part of the Earth system modeling framework for applications at the regional or global scales. Importantly, MOSART-sediment is designed to only capture the first-order suspended sediment processes for two reasons. (1) To be consistent and compatible with the complexity, resolution, and computational requirement of regional or global ESMs, parsimonious parameterizations are more desirable. (2) Sediment-relevant data at the regional or larger scales have limited availability compared to those supporting reach-scale or watershed-scale modeling studies (Abeshu et al., 2021; Li et al., 2021), hence prohibiting extensive parameter calibration that is often needed in modeling complex processes and their interactions.
The MOSART-sediment development and testing reported in this study are conducted within E3SM. However, MOSART-sediment is designed in a modular fashion so it can be easily implemented in other ESMs. The rest of this paper is organized as follows. Section 2 provides the details of MOSART-sediment. Section 3 introduces the study area, data, and numerical experiment design. Section 4 describes the model application, validation, and additional analysis over the contiguous United States (CONUS). Section 5 summarizes the conclusions and discusses the limitations and future directions.
As shown in Fig. 1, MOSART-sediment is developed on top of the water module of MOSART (denoted as MOSART-water). Here we provide a detailed description of MOSART-sediment but only a summary description of MOSART-water for completeness since more details of the latter can be found in our previous publications (Li et al., 2013, 2015a, b; Voisin et al., 2013a, b).
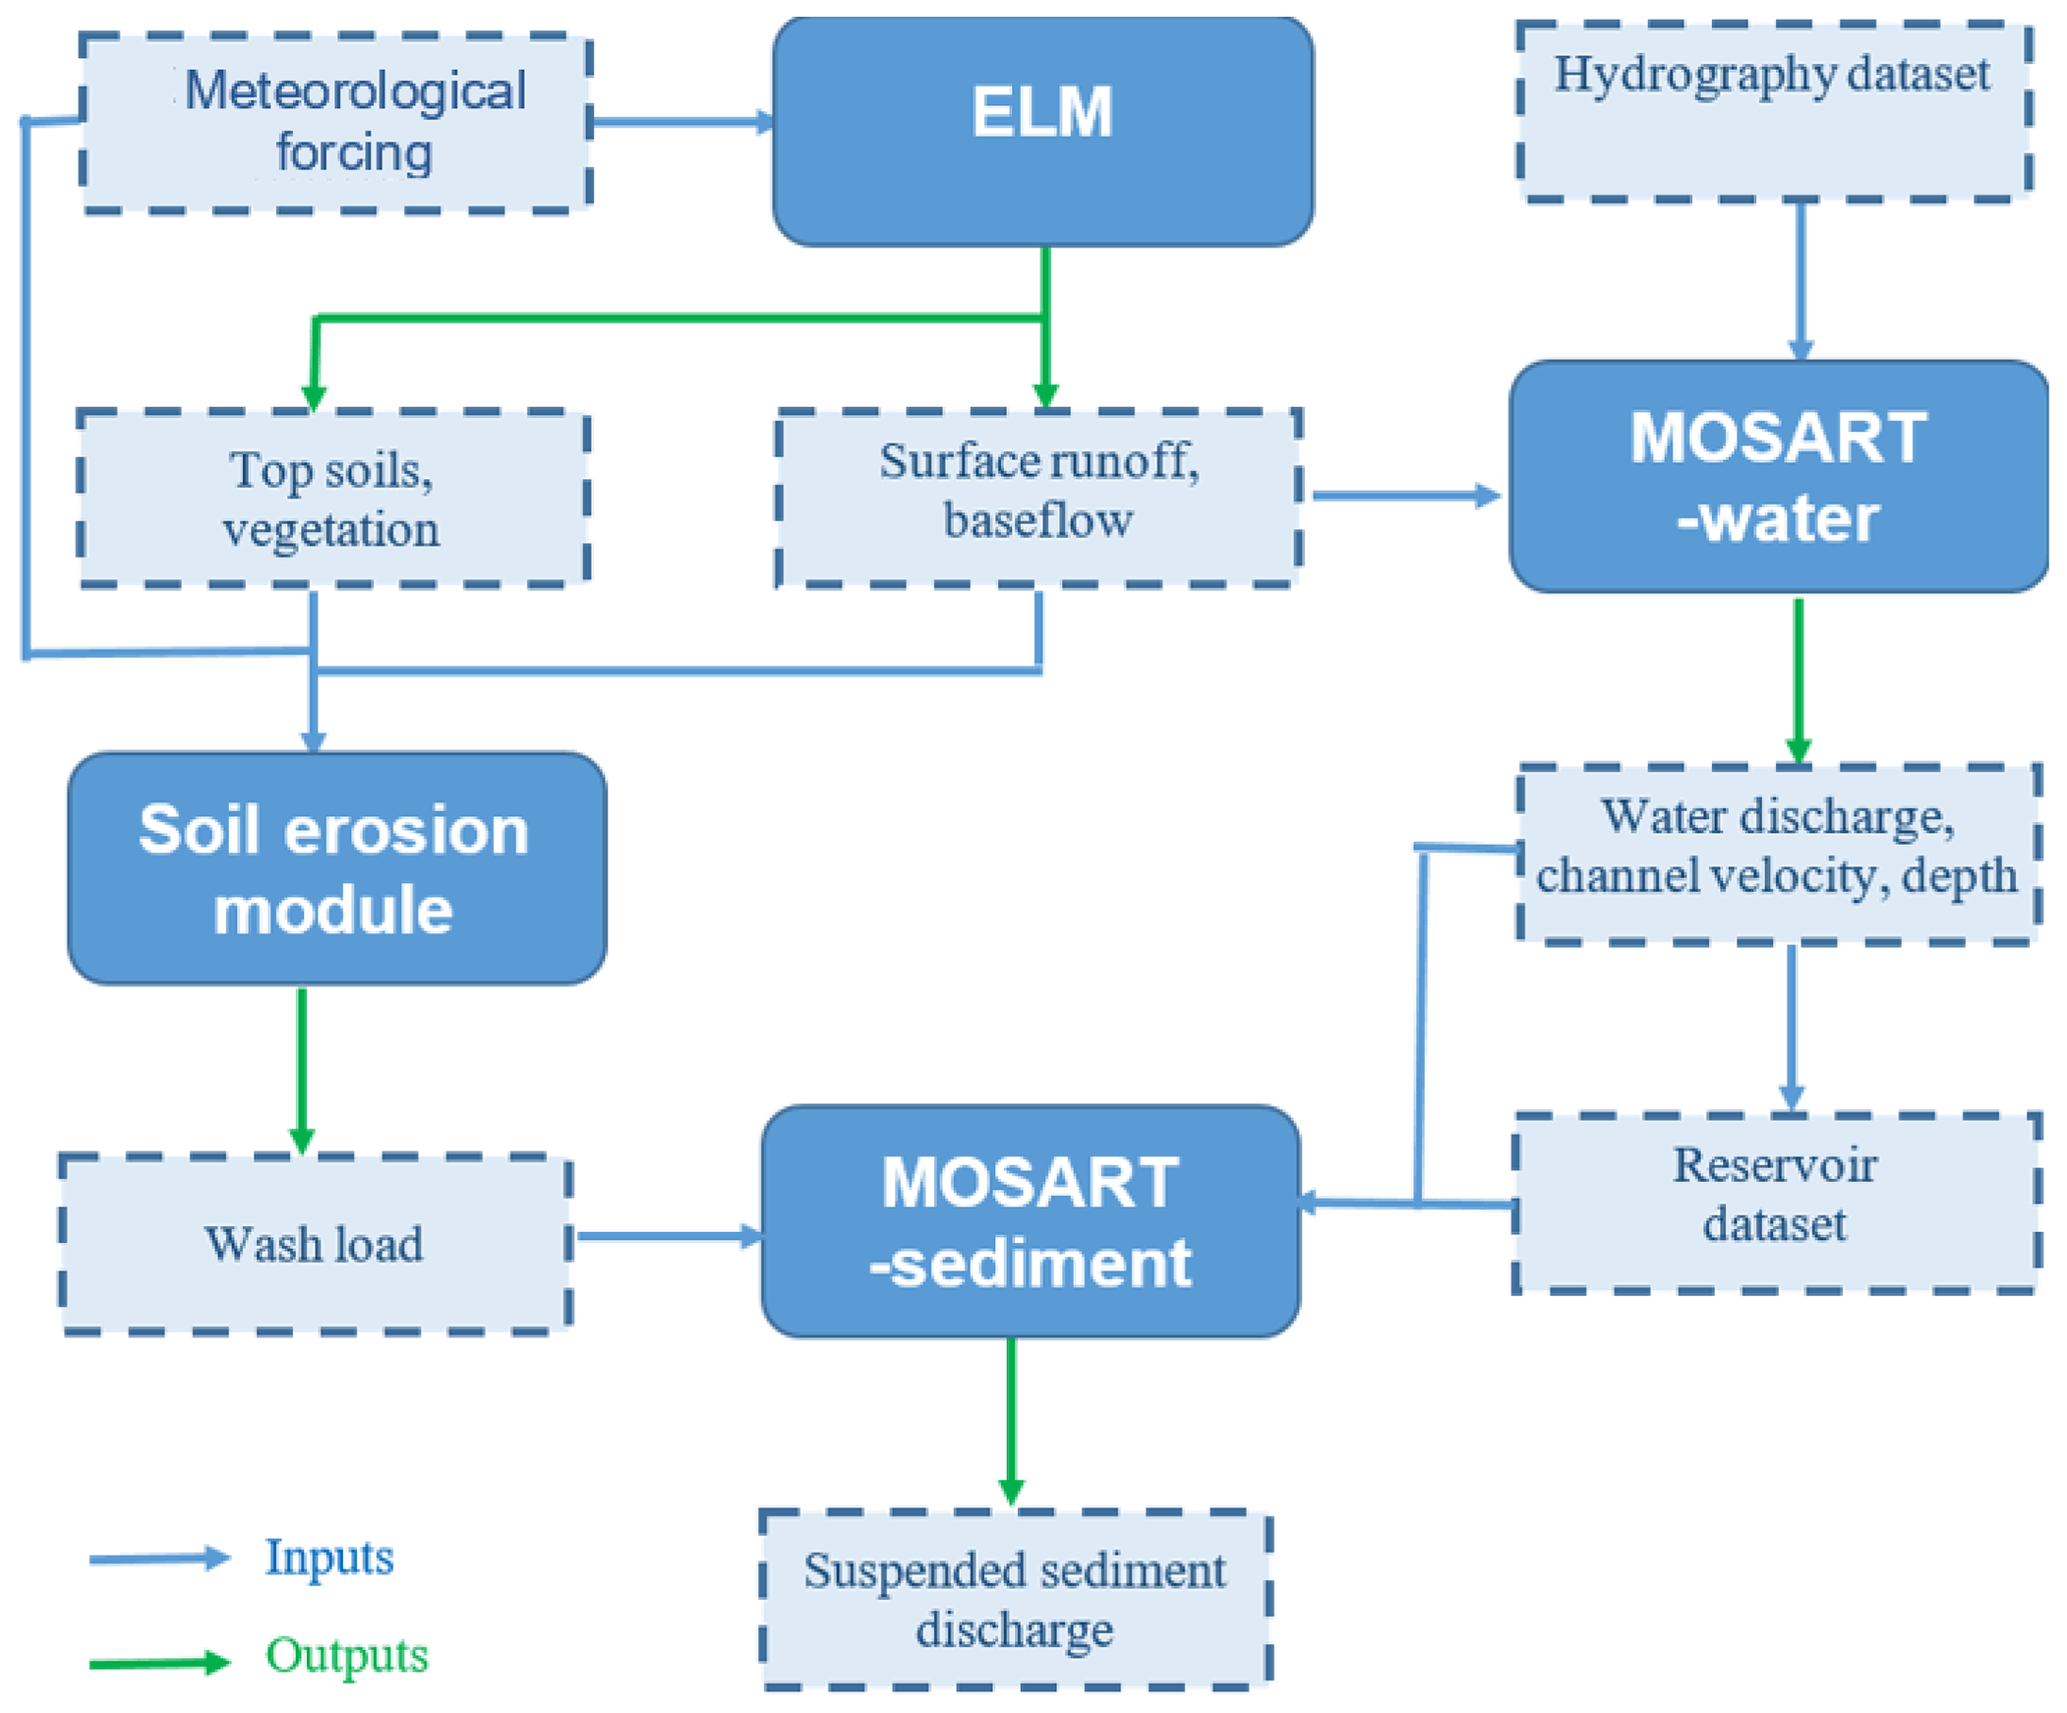
2.1 MOSART-water
MOSART-water is a spatially distributed model which takes surface and subsurface runoff time series generated from a land model as inputs and performs runoff routing across hillslopes (overland flow routing) and through channels (channel routing) (Li et al., 2013). The fundamental spatial units of MOSART-water can be regular latitude–longitude grid cells or watersheds, and the former is used in this study. Within each spatial unit, surface runoff is first routed across hillslopes and then discharged along with subsurface runoff into a “tributary sub-network” channel before entering the main channel. The spatial units are thus linked via routing through the main channel network, which is constructed in a scale-consistent way across different spatial resolutions based on the hierarchical river tracing method (Wu et al., 2011, 2012). The overland flow routing is modeled using the kinematic wave method, while the channel routing can be simulated using either the kinematic wave method or the diffusion wave method. All model parameters are physically based and available globally as described in our previous studies (Li et al., 2013, 2015a, b). In these applications of MOSART-water at the regional to global scales, no parameter calibration was conducted.
MOSART-water includes a water management module applied at regional and continental scales (Li et al., 2015b; Voisin et al., 2013b). The water management module represents two typical water management activities: reservoir regulation/operation and local water extraction/diversion. The focus of our reservoir regulation module is not on any individual reservoir but on hundreds to thousands of reservoirs and their impacts on regional to global processes for Earth system modeling. It is almost impossible to obtain the actual operation rules of all the reservoirs. Nevertheless, some critical information of large reservoirs (e.g., storage capacity no less than 0.1 km3), such as the storage capacity and primary operating purposes, is available in some global datasets (Lehner et al., 2011). These large reservoirs can be classified into different categories based on their purposes, such as irrigation, flood control, or navigation. For each reservoir category, we followed a generic algorithm to derive an operation rule for each reservoir based on the hydroclimate conditions in the upstream areas and the water demand in the downstream areas (Li et al., 2015b; Voisin et al., 2013b). For example, for flood control purposes, reservoir release should follow a flat curve; for irrigation purposes, reservoir release should follow the seasonal variation of irrigation water demand.
2.2 MOSART-sediment
Riverine sediment load can be divided into two components: bed-material load and wash load (Biedenharn et al., 2006). Wash load is the fraction of the moving sediment that cannot be found in the bed material with an appropriate fraction (Lane, 1947; Einstein et al., 1940), whereas bed-material load is the part that can be found substantially in the bed material. In other words, the bed-material load is from the bed material and controlled by the local hydrodynamics and the bed-material grain size. Wash load follows the fluid flow well without much exchange with the bed material and is thus controlled by the upstream supply. The bed-material load can be further divided into bed load and the suspended part of bed-material load (suspended bed-material load) (Garcia, 2008). Bed load refers to the coarse particles being transported in the vicinity of the riverbed. Suspended bed-material load refers to particles being transported in suspension within the vertical column of the river flow, and they interact with riverbeds usually after a relatively long suspended path in the fluid flow. Wash load often refers to the very fine particles, i.e., grain size less than 0.062 mm (Lane, 1947), which are usually in suspension, are well mixed with water, and rarely reside on the riverbed. Therefore, total suspended load consists of suspended bed-material load and wash load. This study focuses on total suspended load.
Because of the difference in their sources, bed-material load and wash load are modeled separately, and then the bed-material load is further divided into suspended bed-material load and bed load. In most rivers, particularly those large rivers, bed-material load consists of sand and gravel particles typically sourced from riverbeds. Wash load consists of silt and clay particles usually sourced from surface erosion at hillslopes. The transport processes of bed-material load and wash load are distinct and thus can be treated separately. Bed-material load is controlled by local hydraulic conditions and sediment particle size. Wash load is not constrained by local hydraulic conditions since channel flow usually has sufficient turbulent kinetic energy to suspend and transport wash load particles (silt and clay) (Moodie et al., 2020; Garcia, 2008).
Three primary components thus underpin MOSART-sediment: (1) a recently developed soil erosion module (Tan et al., 2018, 2020, 2021) for wash load supplied from hillslopes driven by overland flow, (2) a new riverine sediment module that treats wash load and bed-material load processes separately, and (3) a new reservoir module for reservoir effects on sediment transport. Next, we briefly describe the soil erosion module and provide details for the riverine and reservoir modules.
2.2.1 Hillslope sediment processes
The soil erosion module in the E3SM land model (ELM-Erosion) deals with two major processes: (1) detachment of soil particles (clay, silt, and sand) from topsoil (or soil erosion) by raindrops or overland flow and (2) delivery of the detached soil particles along with overland flow from its location of detachment to rivers, during which the sand particles may deposit back to the soil surface due to the limited transport capacity of overland flow. Here we only provide a brief description of these two processes and refer to more details in Tan et al. (2018).
The ELM-Erosion sediment yield model was developed based on the simple Morgan–Morgan–Finney (MMF) model (Morgan and Duzant, 2008; Morgan, 2001), which is better suited for capturing the heterogeneous sediment yield at spatial and temporal scales relevant to ESMs (several to hundreds of square kilometers in space and tens of minutes to hours in time) than other well-known models (Tan et al., 2018). This choice was made by applying and comparing the eight most extensively used sediment yield models, such as the Water Erosion Prediction Project (WEPP) model, at 454 small catchments in diverse environments across the United States, Canada, Puerto Rico, US Virgin Islands, and Guam. In our test that each sediment yield model was deployed under the same hydrological, vegetation, and soil conditions, the MMF model outperformed the other models in simulating the spatial variability of sediment yield over these catchments. Our test also showed that the MMF model reproduced the observed daily sediment yield at six cropland-dominated catchments, with a relative error as low as 10 % (Tan et al., 2018). By implementing the MMF model in ELM as ELM-Erosion and driving it by ELM-simulated throughfall, leaf drainage, overland flow, leaf and ground cover, canopy height, and soil cohesion, we further tested its performance at the continental scale. As shown in Tan et al. (2020), the model can well capture the spatial variability of soil erosion and sediment yield among the US states and large river basins. Following Tan et al. (2020), in this study, the ELM-Erosion model is run at the th-degree spatial resolution and the 30 min time step. For each grid cell, ELM-Erosion has three parameters for calibration: a scaling factor parameter for rainfall-driven erosion, a scaling factor parameter for runoff-driven erosion, and a scaling factor parameter for sediment transport capacity. The calibration is conducted in two steps: (1) the two erosion-related parameters are calibrated at the state level over the conterminous US using the National Resources Inventory (NRI) soil erosion benchmark data (the grid cells in the same state would have the same parameter values), and (2) with soil erosion constrained, the transport capability parameter is calibrated at the basin scale using the pre-dam sediment yield data of large river basins.
Following the original MMF model (Morgan, 2001), the ELM-Erosion model does not calculate sediment yield for different soil particle sizes, such as clay, silt, and sand particles, as done in the revised MMF model (Morgan and Duzant, 2008). This is because we found that this modification did not improve the model performance over the continental scale while introducing additional complexity and computational cost (Tan et al., 2018). In this study, we assume that sediment yield to rivers caused by soil erosion mainly consists of silt and clay particles, or in other words in the form of wash load (Garcia, 2008; Patil et al., 2012). This assumption is reasonable because even though detachment could happen to either clay, silt, or sand soil particles, the transport capacity of overland flow for the detached soil particles across hillslopes decreases exponentially with increasing soil particle size (Morgan and Duzant, 2008), and a majority of detached sand particles will thus deposit back to the topsoil instead of entering the rivers.
2.2.2 Riverine sediment processes
The riverine sediment module focuses on total suspended load and simulates suspended sediment process on top of the hydraulic conditions simulated by MOSART-water as aforementioned. The suspended load consists of the wash load and suspended bed-material load, which are treated separately.
Wash load is primarily carried by channel flow. For the sake of simplicity, we consider that the net sediment exchange between channel and floodplain is secondary as compared to the riverine sediment discharge and thus negligible. The effects of reservoir processes on wash load are however nontrivial since reservoirs fundamentally slow down river flow in their immediate upstream channels. We detail the reservoir effects in Sect. 2.2.3.
Existing sediment transport formulas derived in sedimentology are mainly applicable to bed-material load depending on the riverbed conditions and do not account for wash load (Garcia, 2008). Most rivers can be roughly classified as gravel-bedded or sand-bedded rivers (Garcia, 2008). Gravel-bedded rivers are usually located in mountainous headwater areas, where gravel and coarser material (e.g., cobbles and boulders) prevail in bed-material load and move mostly in bed-load mode. Sand-bedded rivers are mostly in the lowland regions where the bed-material load is dominated by sand and finer particles, i.e., suspended bed-material load (Lamb and Venditti, 2016).
Since this study focuses on suspended sediment, we mainly consider sand-bedded rivers and choose the sediment transport formula from those more suitable for sand-bedded rivers. The classic Engelund–Hansen equation (Engelund and Hansen, 1967; Ma et al., 2020) is typically applicable over sand-bedded rivers and can be further extended to finer-grained rivers (Ma et al., 2017, 2020). It is one of the simplest formulas of bed-material load (Brownlie, 1983), and it is relatively easy to estimate its parameters a priori, which is critically important for sediment simulation in an Earth system model setting at the regional or larger scales. Despite its simplicity, the Engelund–Hansen equation is one of the most accurate sediment transport formulas based on extensive validation against both laboratory and field observations (Brownlie, 1983; Ma et al., 2020; Wiele et al., 1996; Simon and Darby, 1997; Lee et al., 1997; Mosselman, 1998; Darby et al., 2002; Van Der Wegen and Roelvink, 2008; Kleinhans et al., 2008; Crosato and Mosselman, 2009; Geleynse et al., 2011; Crosato et al., 2011; Nicholas, 2013; Schuurman et al., 2013; Church and Ferguson, 2015). We therefore adopt the classic Engelund–Hansen equation as the governing equation for riverine bed-material sediment transport. Its implementation within MOSART-sediment is outlined below.
The total bed-material rate Qsand,total (kg s−1) is given as
where ρsed=2650 kg m−3 is the density of sediment, B is the channel width (m), R is submerged specific gravity for quartz in water (R=1.65), g is the gravity acceleration rate (m s−2), and D50 is the median grain size of bed-material sediment particles (m). is the dimensionless total sediment flux per unit width (denoted as the Einstein number) for bed-material load, expressed as
where Cf is the total resistance coefficient (–). The Engelund–Hansen relation considers Cf to be the sum of skin friction and form drag. One can use the hydraulic resistance relation of Engelund–Hansen to compute for water depth and then Cf, given water discharge, channel slope, and D50. However, the computational procedure will require an iterative technique such as Newton–Raphson. More details can be found in Garcia (2008). Here we use Manning's friction to compute Cf in order to avoid the extra computational expense and keep consistency with the routing computation in MOSART-water. As such, Cf can be calculated from the channel Manning roughness coefficient, nr (s m), and channel hydraulic radius (in this study approximated as channel water depth h),
where ρ is the density of water (103 kg m−3); τb is the bed shear stress (Pa) and τb=ρghSr in steady and uniform flows; Sr is the local channel bed slope (–).
τ* is the dimensionless shear stress (the Shields number), given as
where v is the channel velocity (m s−1) and is estimated using Manning's equation (Manning, 1891).
where Sh is the slope of the energy grade line or energy gradient (–). In the kinematic wave routing method, Sh is taken as the local channel slope Sr. In the diffusion wave routing method, Sh is estimated based on the difference in the simulated water surface elevations between the current and downstream channels.
Note that the Engelund–Hansen equation estimates the bed-material load that is the sum of bed load and suspended bed-material load. We adopt the transport-mode-parameter approach (Greimann et al., 2008) to separate the suspended bed-material load from the bed-material load computed by the Engelund–Hansen equation. The transport-mode-parameter approach specifies how much of a sediment size class is transported as bed load, suspended bed-material load, or mixed load following the “allocation coefficient” concept (Holly and Rahuel, 1990). Using this approach, the portion of suspended sediment in the bed-material load is given as
where f () is the transport-mode parameter, i.e., the portion of suspended sediment in the bed-material load. Z is the suspension parameter and can be calculated as
where ω is the sediment settling velocity (m s−1), is the frictional shear velocity (m s−1), and k is the von Kármán constant (0.41) (–).
Several formulas are available for sediment settling velocity, such as those named after Stokes (Zhang and Xie, 1993; van Rijn, 1989; Cheng, 1997). Cheng (1997) evaluated these formulas and suggested that Cheng's formula has the highest degree of prediction accuracy. It applies to a wide range of Reynolds numbers from the Stokes flow to the turbulent regime (Cheng, 1997). Wu and Wang (2006) proposed a new formula and suggested that this new formula has a highest accuracy among several formulas, followed by Cheng's formula. However, Cheng's formula is mathematically much simpler than that of Wu and Wang (2006) and more suitable for large-scale applications. Thus, Cheng's formula is adopted in this study.
where ν is the kinematic viscosity of water at 20 ∘C ( m2 s−1), and d* is a dimensionless particle diameter, which is defined as
The Engelund–Hansen equation assumes that sediment transport is always at capacity (equilibrium transport) (An et al., 2018, 2021; Engelund and Hansen, 1967; Naito et al., 2019). This simplification is not unreasonable for large-scale river modeling since the travel distance from one reservoir to another is typically more than 10 km. Such a spatial scale enables the sediment-laden flow to sufficiently interact with the channel bed to reach transport capacity (An et al., 2018).
For comparison with the Engelund–Hansen equation, we also use another widely used formula to directly estimate the suspended sediment discharge rate, named after Wu et al. (2000) and well verified in multiple studies (Wu et al., 2005; Sun et al., 2015; Su et al., 2013; Rousseau et al., 2016; Fang et al., 2017). Wu's equation is given as
where is the dimensionless sediment flux for suspended load, and is the dimensionless critical shear stress above which sediment is mobilized (the default value is 0.0386).
2.2.3 Reservoir sediment processes
The reservoir sediment module incorporates both direct and indirect reservoir effects on sediment. The direct effect is the trapping of sediment within the reservoirs, preventing it from moving downstream. It applies to both wash load and bed-material load. The indirect effect is mainly through the reservoir regulation function simulated by MOSART-water, which modifies the hydraulic conditions, i.e., flow velocity, depth, and surface hydraulic gradient, in the downstream rivers of reservoirs. Therefore, it affects only bed-material load. Note that in this study we do not explicitly account for routing of water or suspended sediment within reservoirs for simplicity.
Reservoir trapping of sediment is mainly through fundamental slowing down of the river flow upstream of dams. The slowing down of river flow in the reservoir essentially sets the transport capacity of sediment to near zero, leading to the settling of suspended sediment in the water column. Thus, the deposition rate (trapping rate) of suspended sediment is largely dependent on the settling time of suspended sediment in the reservoir. To this end, Brune (1953) developed an empirical formula for reservoir trapping efficiency and validated it for the US reservoirs. It was later adopted globally (Vörösmarty et al., 2003; Syvitski et al., 2003, 2005). Here we also adopt Brune's formula to estimate individual reservoir trapping efficiency, etrap:
where ΔTlocal is the increase in local water residence time due to the reservoir (years), estimated as the effective reservoir storage capacity divided by the mean annual inflow from the reservoir's upstream. Other empirical formulas for reservoir trapping efficiency, e.g., Lewis et al. (2013), were also proposed with more complexity but have not been tested at the regional or global scales. Note that the sediment trapping in the reservoir resulted from the settling of suspended sediment in a nearly still water body, and it is thus applied to all the suspended sediment regardless of particle size. Brune (1953) and Lewis et al. (2013) assumed that wash load (silt and clay particles) and the suspended bed-material load (fine sand particles) were trapped by reservoirs in a similar way and did not differentiate between them. Here we adopt the same assumption for simplicity. etrap gives the fraction of suspended load that is trapped in a reservoir, and the rest is released to downstream along with water.
The reservoir regulation effect on sediment is mainly by regulating river discharge, e.g., reducing high flow during a wet season and increasing low flow during a dry season. This flow regulation will modify riverine hydraulic conditions such as flow velocity and channel water depth, thus changing bed-material load transport capacity. Besides reservoir regulation, another water management activity represented in MOSART-water is surface water withdrawal which diverts channel water to somewhere else via artificial channels or pipes. For simplicity, we assume that surface water withdrawal reduces only water storage in channels but not sediment.

Figure 2Important parameters over the study domain.
3.1 Study area
MOSART-sediment is designed to be applicable at the regional to global scales. In this study, we apply it over CONUS for demonstration and validation, as shown in Fig. 2. This study area is smaller than our previous study (Li et al., 2015b), where we applied ELM-MOSART driven by the atmospheric forcing data from the North American Land Data Assimilation System Data Phase 2 (NLDAS2) over central North America (Mitchell et al., 2004).
3.2 Inputs and parameters
To support the MOSART-sediment application, we have derived several new parameters a priori over CONUS that are most critical to sediment transport, including sediment particle size, Manning's roughness coefficient, and channel geometry. These new parameters are meaningful mostly within CONUS since they have been derived based on various national databases. It is for this reason that our sediment modeling and analysis focus on CONUS. Note that, although the sediment modeling analysis focuses on CONUS, MOSART-water is still applied over the same larger domain as our previous study (Li et al., 2015b), which includes the Canadian portion of the Columbia River basin. Thus other MOSART-water parameters and inputs are adopted from this previous study.
The median bed-material sediment particle size, D50, is the most important parameter for the Engelund–Hansen formula. In an earlier study (Abeshu et al., 2021), we derived a national map of the median bed-material sediment particle size (D50) over CONUS based on (1) the observed sediment particle size data from the United States Geological Survey (USGS) and the US Army Corps of Engineers, (2) the comprehensive channel and catchment attributes from the National Hydrography Dataset Plus (NHDplus) (McKay et al., 2012; Wieczorek et al., 2018), and (3) a predictive model established using state-of-the-art machine learning techniques (Chen and Guestrin, 2016). The D50 map from Abeshu et al. (2021) and Li et al. (2021) is in a vector format; i.e., each flowline in NHDplus is assigned a value of the median bed-material sediment particle size. In this study, the vector-format map is converted to the grid-based format at the th-degree resolution to be consistent with the other parameters, as shown in Fig. 2a.
The channel geometry data, such as bankfull channel width and depth, are shown in Fig. 2b and c. They are derived following a data-driven hydraulic geometry study (Bieger et al., 2015), which provided the empirical formulas for the whole CONUS. Manning's roughness coefficient for the riverbed is derived based on an empirical formula estimating Manning's roughness coefficient as a linear function of channel water depth distribution within a river basin (Getirana et al., 2014; Luo et al., 2017), as shown in Fig. 2d. Channel bed slope (Fig. 2e) is essentially from the medium-resolution NHDplus. In NHDplus, each flowline represents one river segment and is provided with a channel slope value (along with many other channel attributes). We convert these NHDplus channel slope values from a vector format to a grid-based format here. First, the NHDplus flowlines are georeferenced to the MOSART lat–long grids at the th-degree resolution in two steps: (1) local matching and (2) neighborhood matching. For the local matching, we adjust the geographic locations of the downstream ends of the NHDplus flowlines to the MOSART grid center. The drainage areas associated with the NHDplus flowlines (in a vector-based river network) are then compared against those associated with the corresponding MOSART grids (in a grid-based river network). The neighborhood matching is performed only for those grids where the margin of error is significant (>20 % of the NHDplus drainage area). Neighborhood matching is to re-adjust the flowlines from the current MOSART grid cell to one of the eight neighboring cells where the NHDplus-MOSART drainage area difference is minimal. Then we associate each MOSART-water grid with a single NHDplus flowline. Hence, in the case of multiple flowlines per grid, which is very common, we choose the flowline that has a drainage area closest to the MOSART grid. After the above procedure, each MOSART grid is associated with a flowline. The channel slope of each MOSART grid is then taken as the channel slope value from the corresponding flowline. Reservoir storage capacity (Fig. 2f) is already available from our previous study (Li et al., 2015b) but is also critical for sediment modeling, so we display them here for completeness.
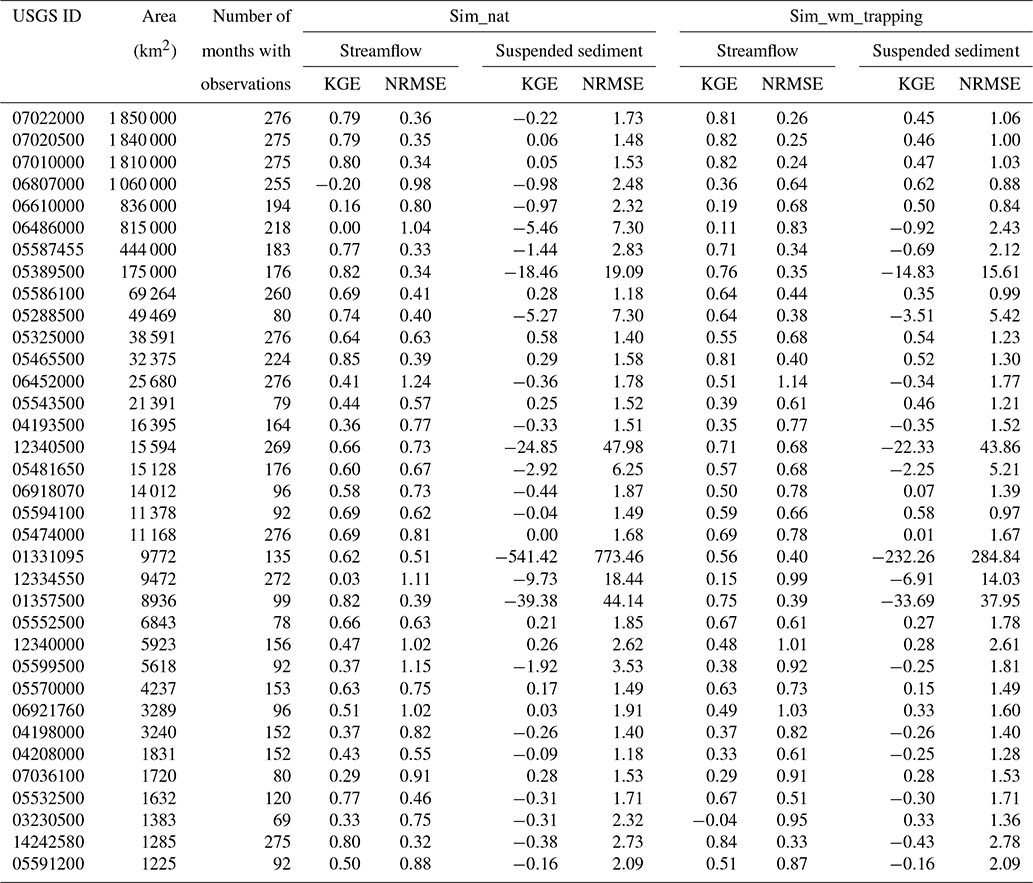
The observed monthly suspended sediment discharge and streamflow from the USGS river gauges are used to validate the model performance. We choose to validate the model at the monthly scale instead of finer scales due to two considerations. (1) The biases in the streamflow simulations by ESMs and even other land surface models are already noticeable at the monthly scale (Getirana et al., 2014, 2021; Li et al., 2015a; Mizukami et al., 2021). (2) The sampling of riverine sediment by USGS is not continuous like the streamflow measurement (taken automatically at an hourly or even shorter time step) but rather infrequent due to the required field visits and subsequent sample analysis (Groten and Johnson, 2018). There is thus considerable uncertainty in the daily suspended sediment data from USGS. Figure 3a shows the locations of 35 selected USGS river gauges along with the river networks (displayed in the form of accumulated upstream drainage area at th-degree resolution). Table 1 also provides more details on these selected gauges. These 35 USGS gauges are selected based on three criteria: (1) a no more than 20 % difference between the actual upstream drainage area (reported by USGS) and the area represented within a grid-based river network, (2) at least 5 years of both monthly streamflow and suspended sediment observations in our study period 1990–2012 (see Sect. 4.1 for the reasons in choosing this period), and (3) relative bias of MOSART-water streamflow simulation (using the full modeling capacity) of no more than 50 % in 1990–2012. The last criterion is to control the impacts of runoff and streamflow simulation uncertainty to a certain level. There are 63 gauges meeting the first two criteria. When considering the third criterion, the number drops from 63 to 35, suggesting that there is still large uncertainty in the runoff and streamflow simulation in E3SM. In fact, the uncertainty in runoff and streamflow simulation remains a challenge in Earth system modeling (Lawrence et al., 2019), and fully addressing it is beyond the scope of this study. Among the selected gauges, their upstream drainage areas vary between 1225 and 1 850 000 km2, covering a range of spatial scales.
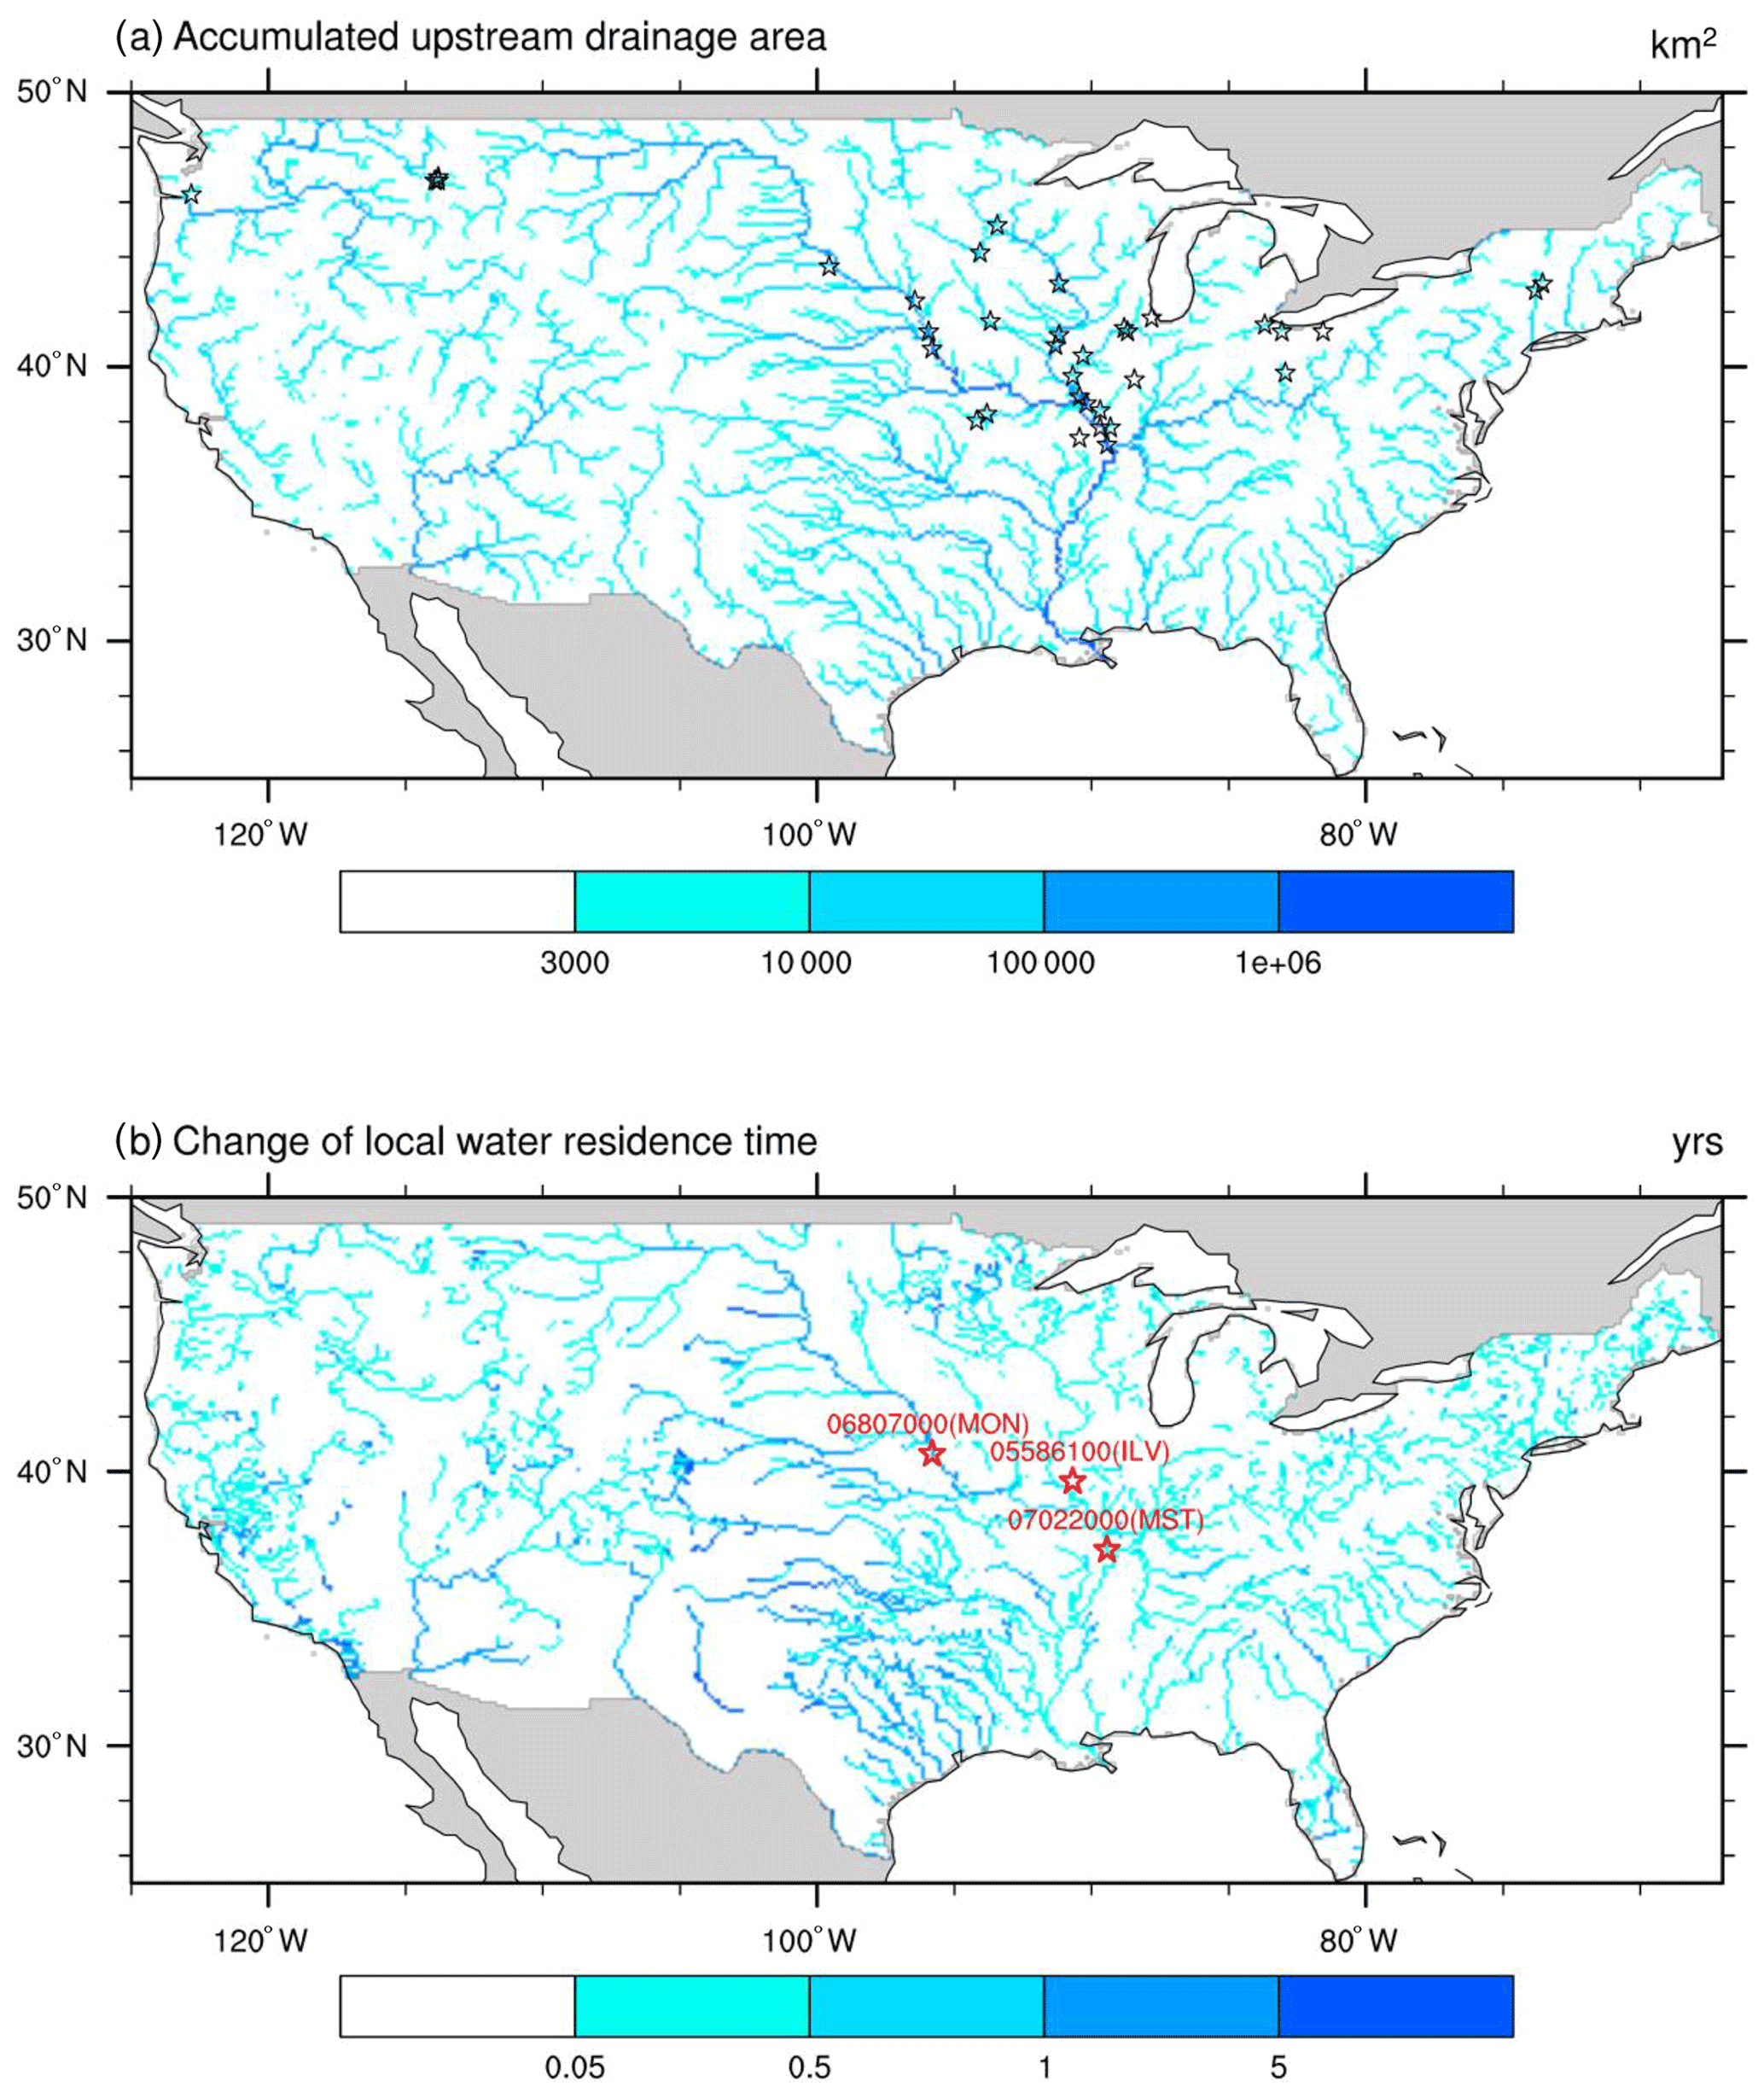
Figure 3(a) River network displayed using upstream drainage area and 35 selected USGS stations (black stars) along the river networks (approximated). (b) Change in channel water residence time due to upstream reservoirs and three representative stations (red stars).
Three representative USGS gauges (shown as the red stars in Fig. 3b) are chosen out of the 35 gauges for more detailed analysis, including USGS05586100 Illinois River at Valley City in Illinois (ILV), USGS06807000 Missouri River at Nebraska City in Nebraska (MON), and USGS07022000 Mississippi River at Thebes in Illinois (MST). The choice of these three gauges is based on two considerations. (1) These gauges are subject to different levels of reservoir effects, and (2) the drainage areas of these gauges are relatively larger than the others and hence more representative of large rivers. The upstream drainage areas for ILV, MON, and MST are 6.93×10⁵, 1.06×10⁶, and 1.85×10⁶ km2, respectively. In this study, we use ΔTbasin, the increase in average river water residence time due to all the reservoirs in the upstream areas of a lat–long grid, to approximate the total reservoir effects including flow regulation and trapping; i.e., the larger the ΔTbasin value, the stronger the reservoir effects. Note that ΔTbasin is different from ΔTlocal in Eq. (11). For any lat–long grid, ΔTbasin is calculated as the ratio of the sum of the storage capacity of all the reservoirs in its upstream areas over the long-term average inflow to this grid. ΔTbasin closely corresponds to the reservoir regulation index and the ratio of the total upstream reservoir storage capacity to the annual streamflow volume (annual mean flow multiplied by the time of a year), which has been used as an indicator of reservoir flow regulation effects (Wang et al., 2017). As shown in Fig. 3b, MON and ILV are subject to strong and weak reservoir effects, respectively. MST is downstream of MON and ILV and subject to moderate reservoir effects.
3.3 Numerical experiments
The simulation period is 1979–2012 due to the availability of model inputs, particularly the monthly water demand data that were derived in our previous study (Li et al., 2015b). ELM-Erosion is applied to 1979–2012 driven by the NLDAS2 atmospheric forcing at the th-degree resolution to generate both daily sediment yield and daily runoff time series at each th-degree grid as the inputs for MOSART-sediment. All the soil erosion parameters are adopted from Tan et al. (2021). Note that Tan et al. (2021) accounted for both climate and land-use change impacts on soil erosion. In this study, we do not consider land-use change, i.e., assuming static land use. Using the daily inputs from ELM-Erosion, we run MOSART-sediment in 1979–2012 at a daily time step and a th-degree spatial resolution. We consider 1979–1989 to be the model spin-up period and carry out the model validation and analysis in 1990–2012.
To isolate the relative contributions of reservoir regulation and trapping processes to suspended sediment transport, three major numerical simulations are designed. (1) sim_nat: MOSART-sediment is run under natural river conditions only, i.e., no reservoir regulation or trapping. (2) sim_wm_only: MOSART-sediment is run with the water management option but turning off reservoir trapping. (3) sim_wm_trapping: MOSART-sediment is run with the water management option to include both flow regulation and reservoir trapping effects. The individual effects of reservoir regulation and trapping can be estimated by comparing sim_nat with sim_wm_only and comparing sim_wm_only and sim_wm_trapping, respectively. Each simulation is driven by the same sediment yield time series for the period of 1979–2012. Note that the suspended bed-material load in these three major experiments is estimated using the Engelund–Hansen equation, and main channel routing is simulated using the diffusion wave routing method.
We also perform additional numerical experiments to understand the sensitivity of modeling results to the key model parameters, compare the Engelund–Hansen equation with the Wu formula, and compare the diffusion wave routing method with the kinematic wave routing method. More details of these additional numerical experiments will be provided later. Note that in all these numerical experiments, no parameter calibration is conducted for the riverine component. All related parameters have been estimated a priori.
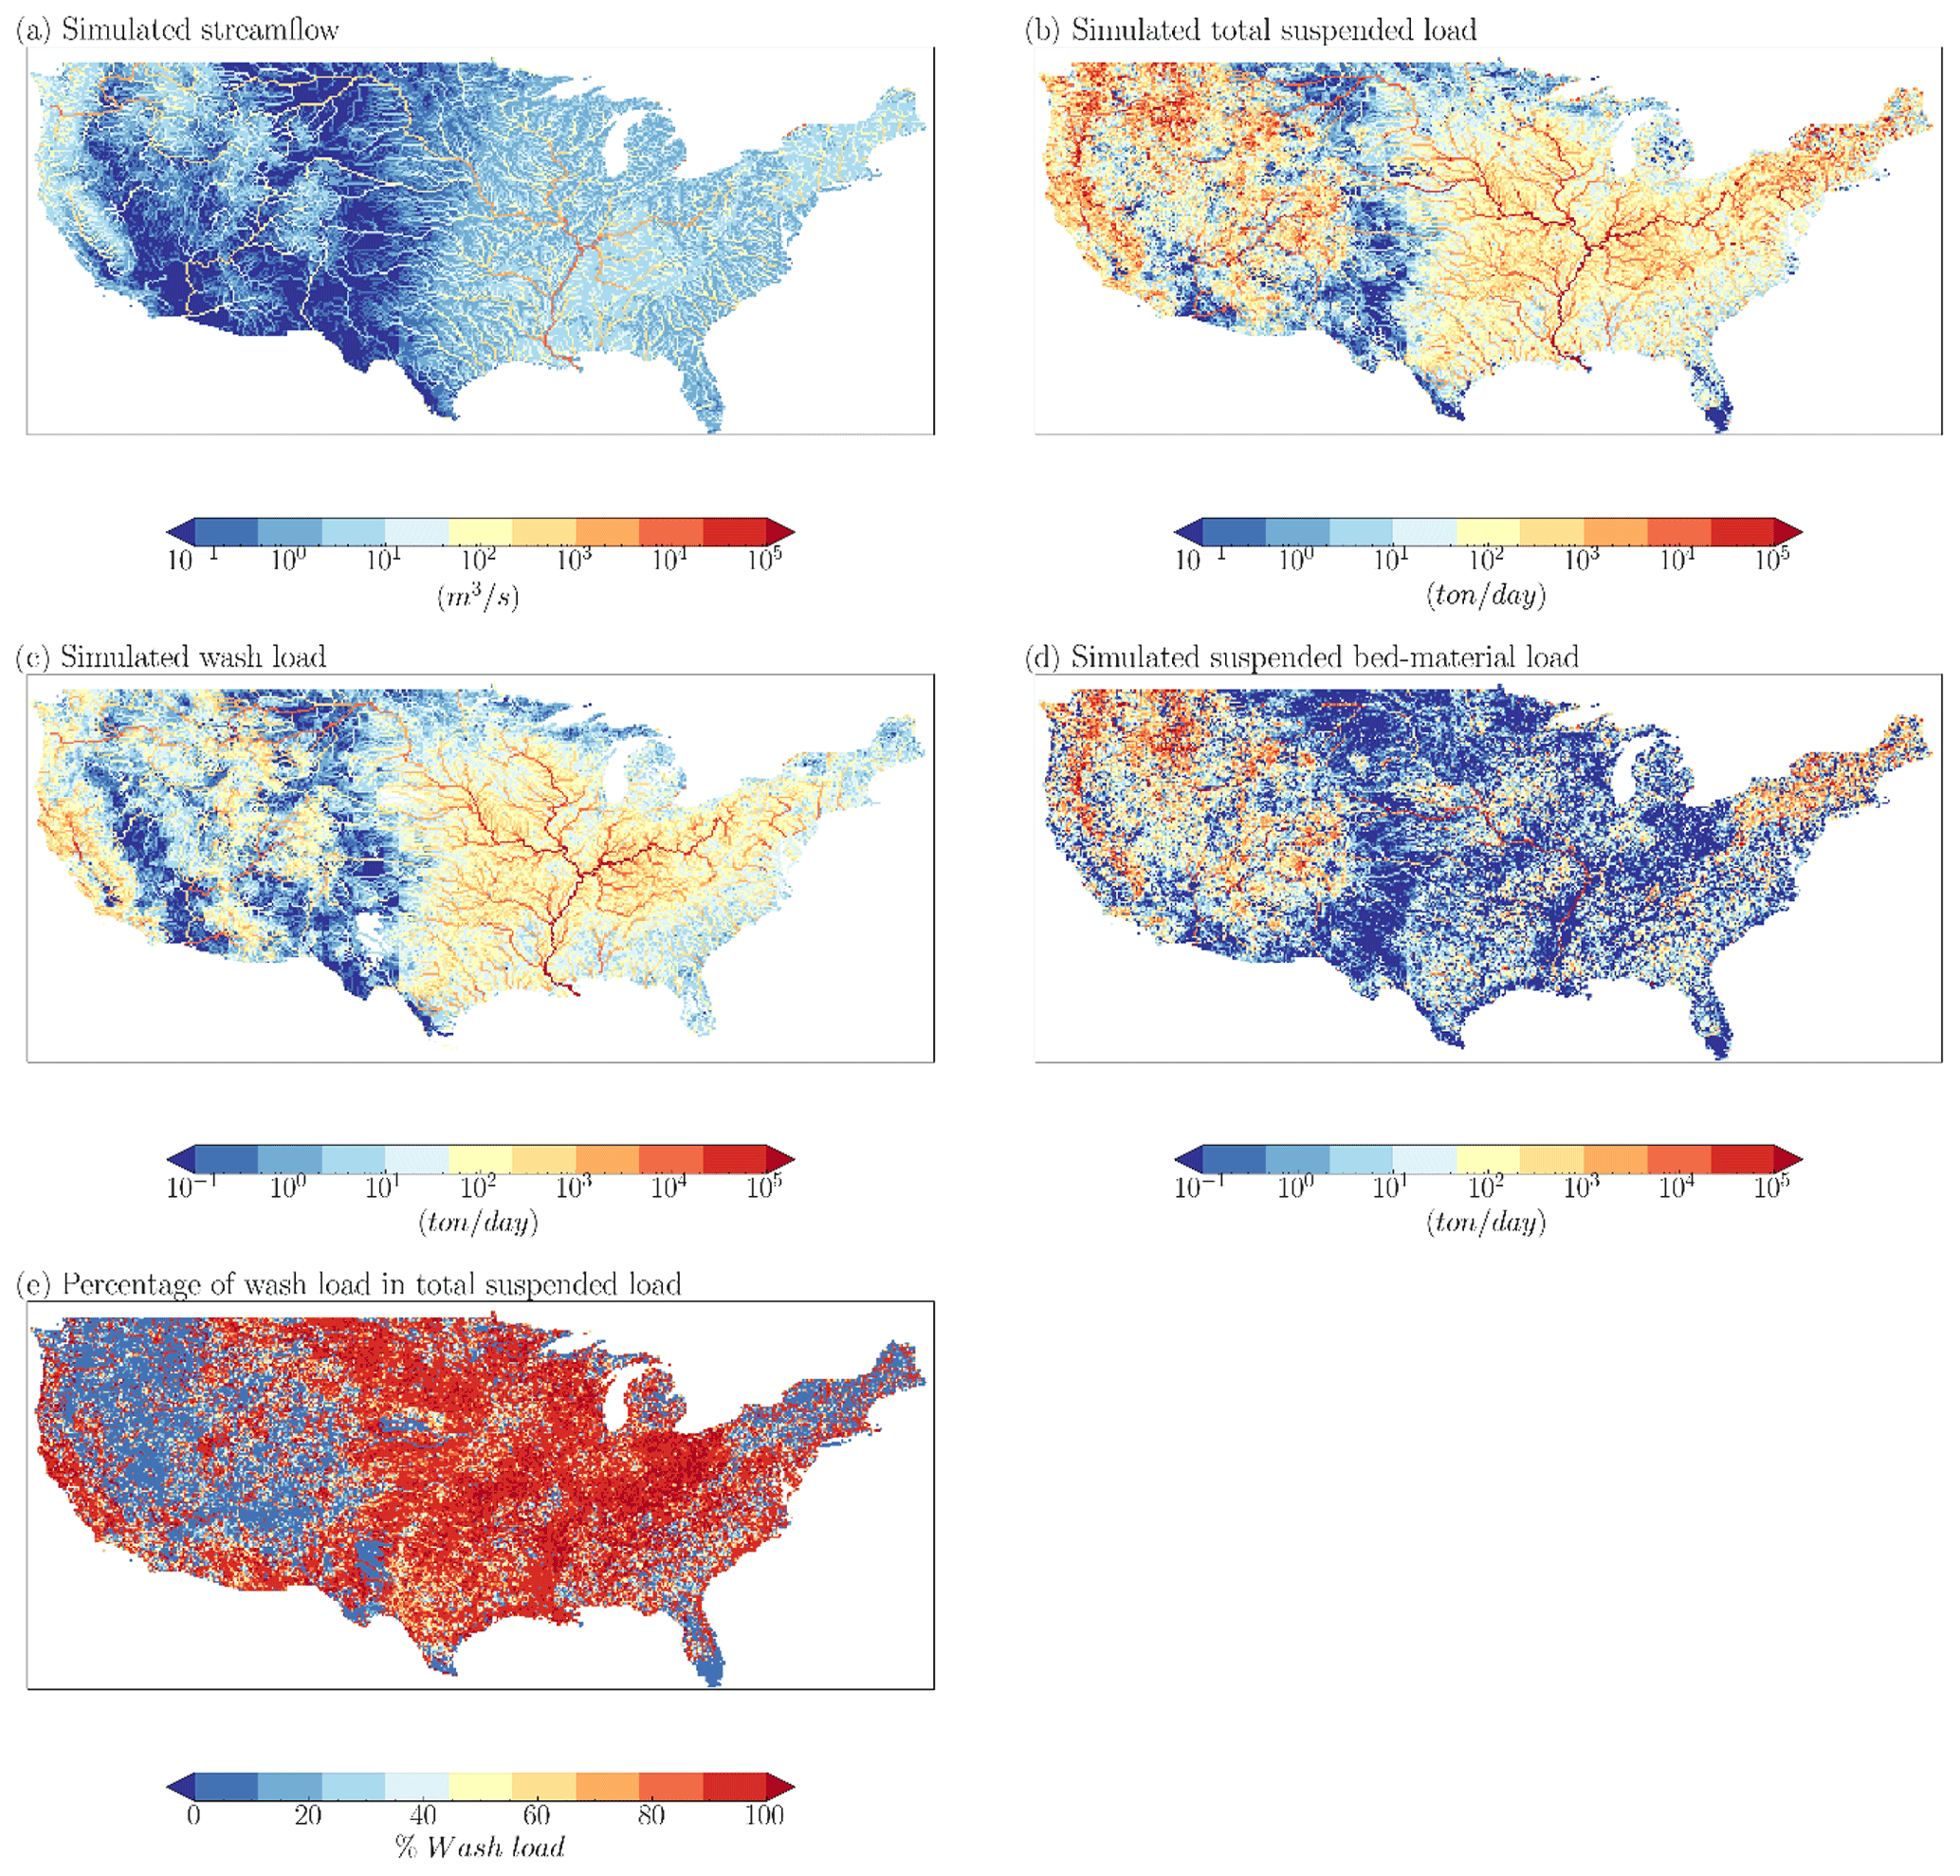
Figure 4Spatial maps of simulated streamflow, total suspended load, wash load, and suspended bed-material load averaged in 1990–2012.
4.1 Model validation
MOSART-sediment captures the significant spatial heterogeneity in total suspended load, wash load, and suspended bed-material load, respectively, as shown in Fig. 4, where the maps are generated from the sim_wm_trapping simulation results. The spatial patterns of total suspended load are determined by the patterns of wash load, suspended bed-material load, and their relative dominance at different locations. It appears that suspended bed-material load dominates in the western US, e.g., the Columbia River and Colorado River basins. Wash load dominates in the east of the Rocky Mountains, e.g., the Mississippi River basin, and coastal areas of the northeastern US. We use the percentage of wash load in the total suspended load to illustrate the relative dominance of wash load at each lat–long grid, as shown in Fig. 4e. In this study, the model-simulated spatial average of the wash load percentage is 62.2 %, with higher values in the central and eastern US and coastal western US. The dominance of wash load in the simulated suspended load is consistent with previous data-driven studies. For example, Sadeghi and Singh (2017) analyzed the observed suspended load at 24 USGS gauges distributed throughout CONUS and suggested that wash load dominates in the majority of these gauges; i.e., the percentage of wash load in the total suspended load is 79.085±11.343 % over these gauges.
The spatial heterogeneity of simulated wash load is controlled mainly by that of sediment yield and the spatial distribution of reservoirs. More sediment yield can be from more humid or mountainous areas since it is triggered primarily by surface runoff and raindrops. Reservoir trapping significantly reduces the amount of wash load carried to the rivers downstream of reservoirs. The supply of sand sediment is mostly from the in-channel process as a function of grain size, channel geometry, and hydraulic conditions such as the shear stress and channel velocity. Roughly, the sand discharge is large when the channel water depth is deep, the channel bed slope is steep, or Manning's roughness coefficient is small. Reservoir regulation reduces the high flow during the wet season and then reduces suspended bed-material load by reducing channel water depth and velocity in the rivers downstream of reservoirs. However, it enhances the low flow during the dry season and increases suspended bed-material load in the rivers downstream of reservoirs, which is consistent with the findings reported from the literature (Nittrouer and Viparelli, 2014; Naito et al., 2019). Reservoir trapping appears to have little effect on the simulated suspended bed-material load. Reservoirs prevent the upstream suspended bed-material load from going downstream, but the reduced suspended bed-material load is supplemented by the local channel erosion in downstream rivers. Recall the assumption underpinning the Engelund–Hansen equation that the local supply of suspended bed-material load is unlimited.
MOSART-sediment captures the long-term average suspended sediment discharge values across CONUS reasonably well, as shown in Fig. 5 for comparison between the model-simulated and observed annual mean values in 1990–2012 at multiple USGS gauges. Here the comparison is also shown between the sim_nat and sim_wm_trapping simulations. The model performs very well in simulating the long-term streamflow over the selected 35 gauges. The difference in streamflow between sim_nat and sim_wm_trapping is negligible, which is reasonable because (1) reservoir trapping does not affect streamflow at all and (2) reservoir regulation changes mostly intra-annual variability of streamflow and sometimes inter-annual variability, but the long-term mean streamflow is largely unaffected. For suspended sediment, the simulated annual mean values are overall close to those observed, as indicated by the close alignment of the dots with the 1:1 line, particularly for sim_wm_trapping. Fitted lines are included in Fig. 5 to help visualize the overall patterns. The R2 values between the simulations and observations are 1.0 for the streamflow from both sim_nat and sim_wm_trapping and 0.6 for the suspended sediment from both sim_nat and sim_wm_trapping, respectively. WBMsed was validated over CONUS at 11 USGS gauges in 1997–2007 with an overall satisfactory performance (see Fig. 7 in Cohen et al., 2013). WBMsed nevertheless overestimated the long-term average suspended load over the four largest gauges on the Mississippi River (here “largest” means the gauges with the largest suspended load observations), whilst our model seems to have less overestimation over the largest gauges, e.g., Mississippi River at Thebes (USGS ID 07022000). Comparing Fig. 7 in Cohen et al. (2013) with Fig. 5 in this study, one can infer that our model performance is comparable to WBMsed.
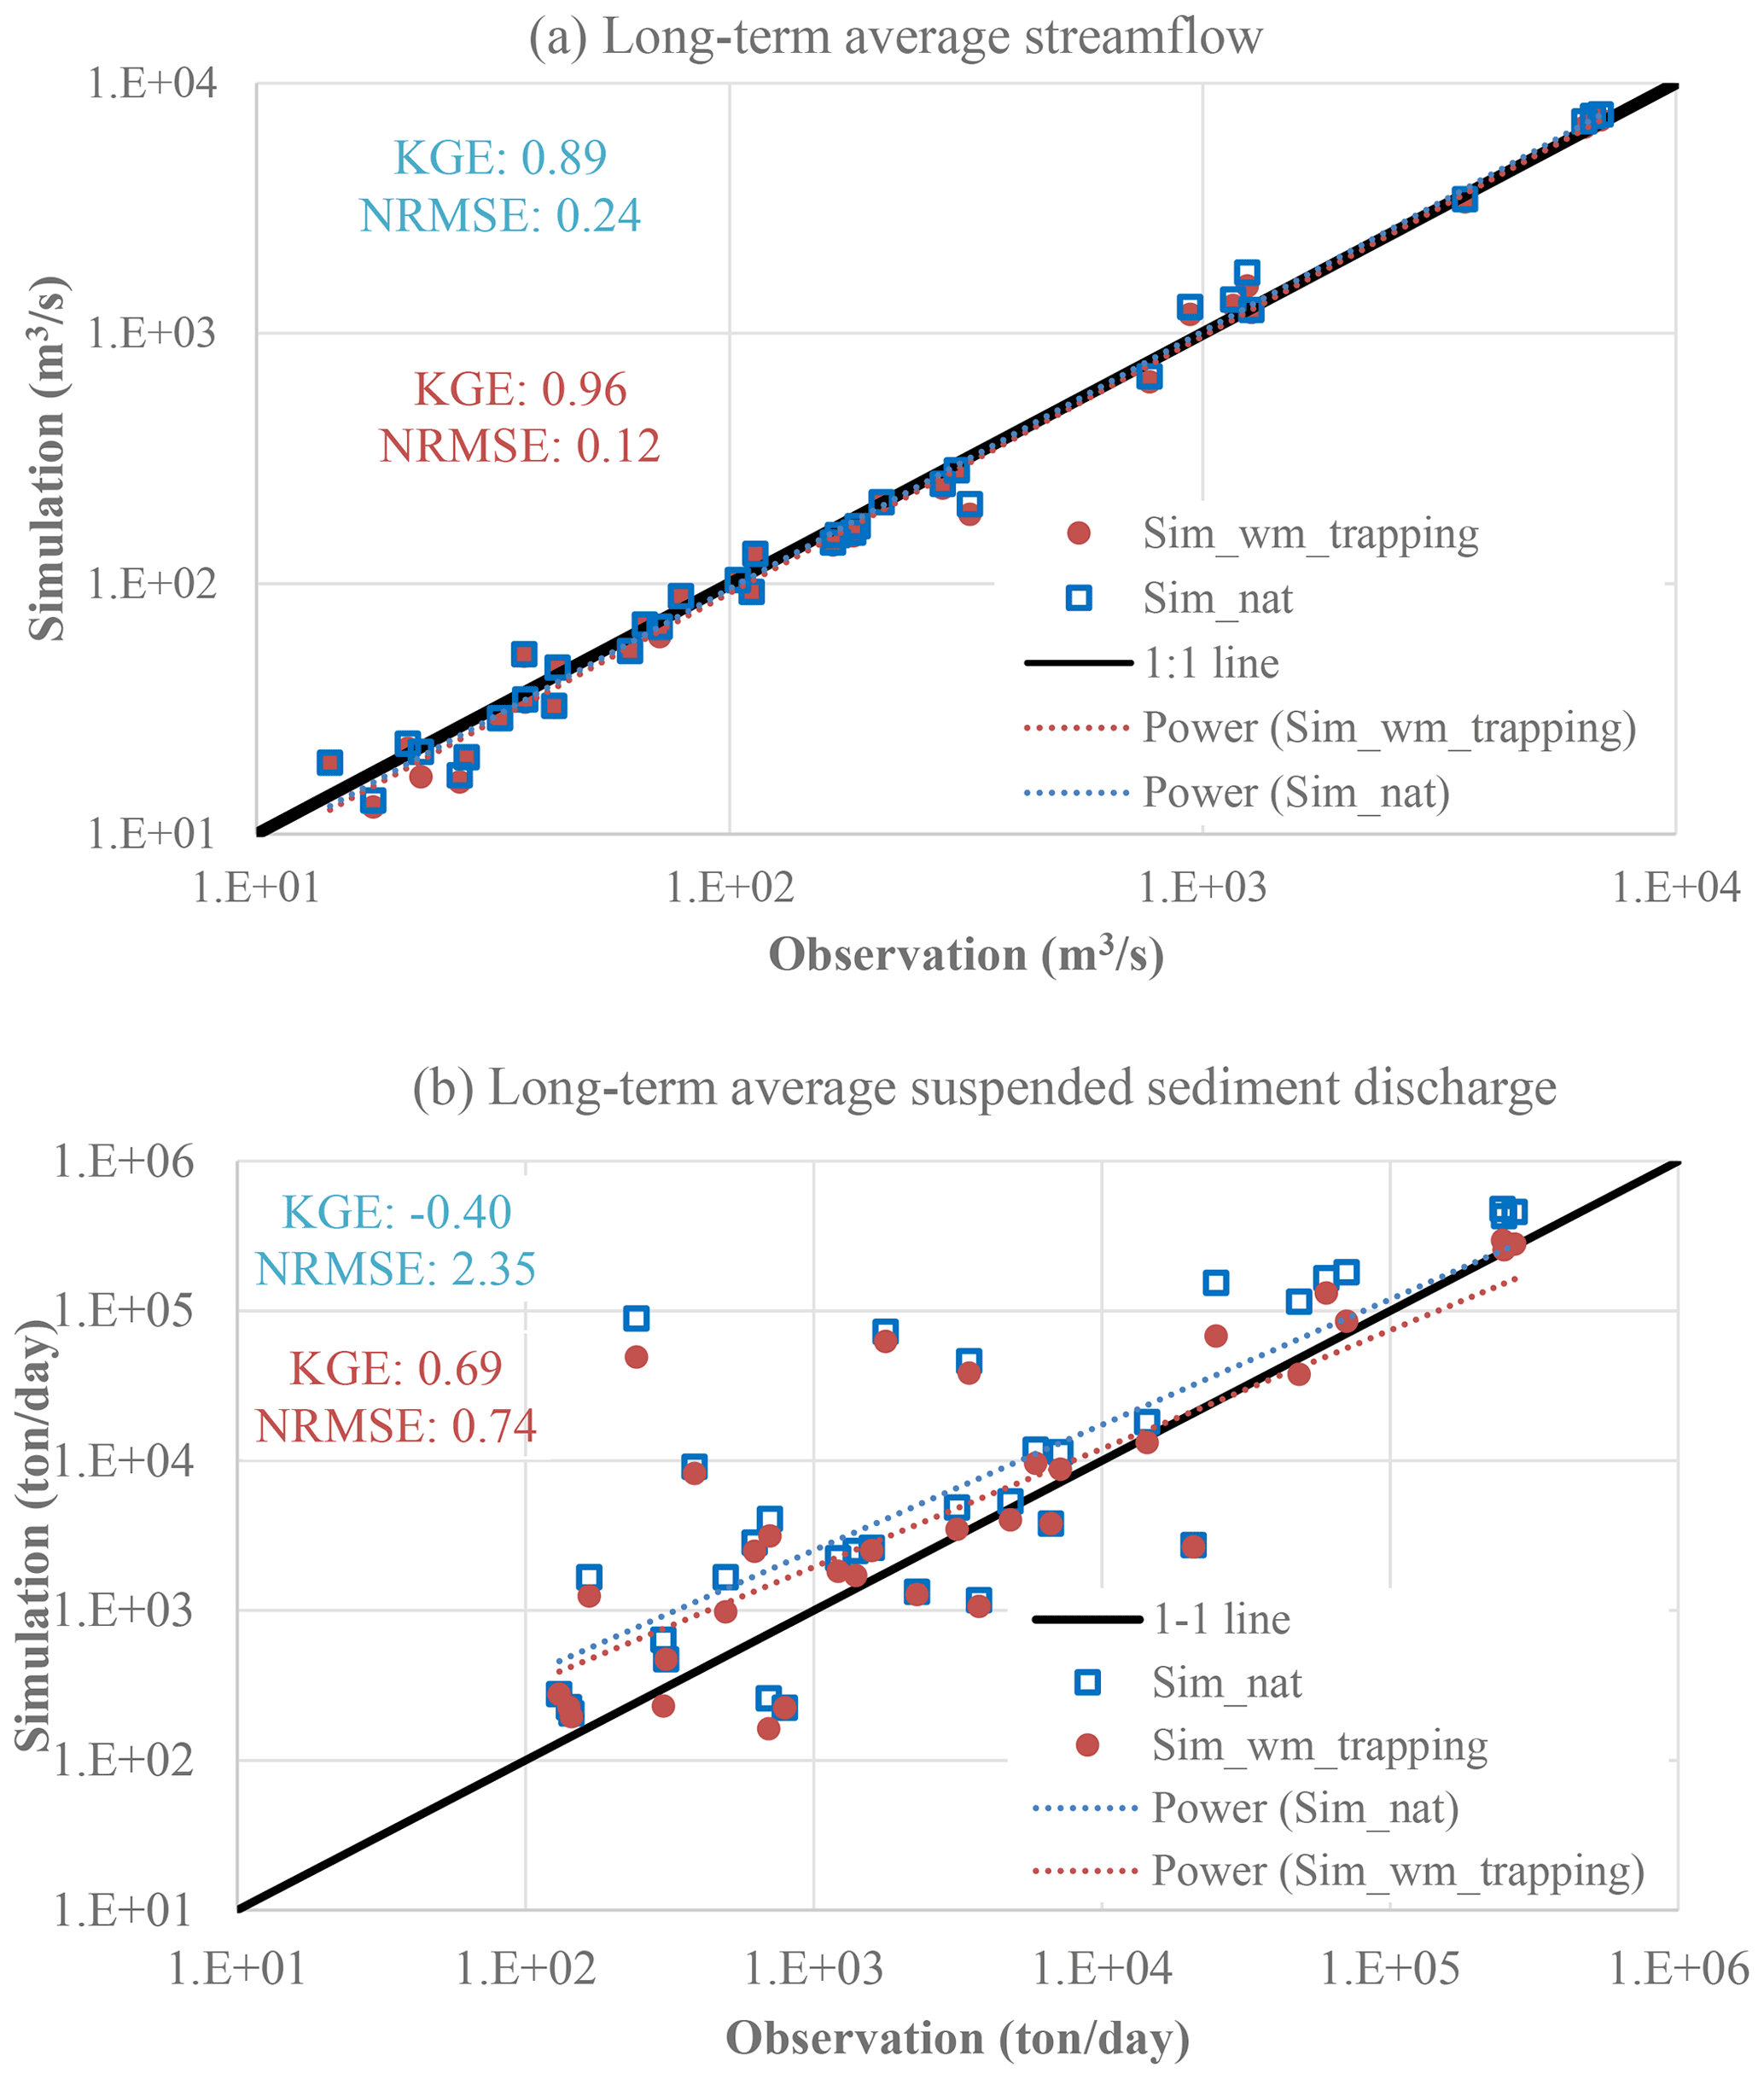
Figure 5Simulated vs. observed annual mean discharge of water and total suspended load in 1990–2012. Each dot represents one USGS station.
We further use the Kling–Gupta coefficient (KGE) (Gupta et al., 2009) and the normalized root-mean-square error (NRMSE) to evaluate the model-simulated long-term average across multiple gauges. KGE is a comprehensive metric that integrates the effectiveness of previous extensively used metrics such as root-mean-square error and the Nash–Sutcliffe coefficient (NSE). It thus captures both the magnitude and timing (or phase) difference between two temporal or spatial series. KGE ranges from negative infinity to 1.0, with 1.0 indicating perfect model performance (Gupta et al., 2009). It has been suggested that a KGE value higher than −0.41 implies that a model performs better than the long-term mean benchmark, i.e., equivalent to NSE=0 (Knoben et al., 2019). NRMSE is calculated as the ratio of RMSE over the long-term mean of a temporal or spatial series. For streamflow, KGE increases from 0.89 to 0.96 and NRMSE decreases from 0.24 to 0.12 by including the reservoir effects, i.e., from sim_nat to sim_wm_trapping. For suspended sediment, KGE increases from −0.40 to 0.69 and NRMSE decreases from 2.35 to 0.74 by including the reservoir effects. Overall, Fig. 5 suggests a very good model performance in capturing the long-term suspended sediment balance across different spatial scales. It also suggests that adding the reservoir effects improves the simulated long-term suspended sediment loads more significantly than the simulated long-term streamflow over the selected gauges.
We further evaluate the model performance at the monthly scale using the KGE values between the simulated and observed monthly time series. We roughly classify the KGE values at the 35 gauges into three categories: Category I, , poor model performance; Category II, , decent model performance; Category III, KGE>0, good model performance. Figure 6 displays the spatial distribution of the KGE values based on the sim_wm_trapping simulation. For streamflow, 0, 1, and 34 of the 35 USGS gauges have KGE values in Categories I, II, and III, respectively. For suspended sediment, 10, 7, and 18 gauges have KGE values in Categories I, II, and III, respectively. Table 1 lists the specific KGE and NRMSE values between the monthly simulated and observed streamflow and suspended sediment time series at each gauge based on the sim_wm_trapping simulation. Note that the availability of monthly observations varies between different gauges. Overall, MOSART-sediment has a decent or good performance at over 25 of the 35 gauges, indicating that the model is able to capture reasonably well the intra-annual variability of suspended sediment in large river systems.
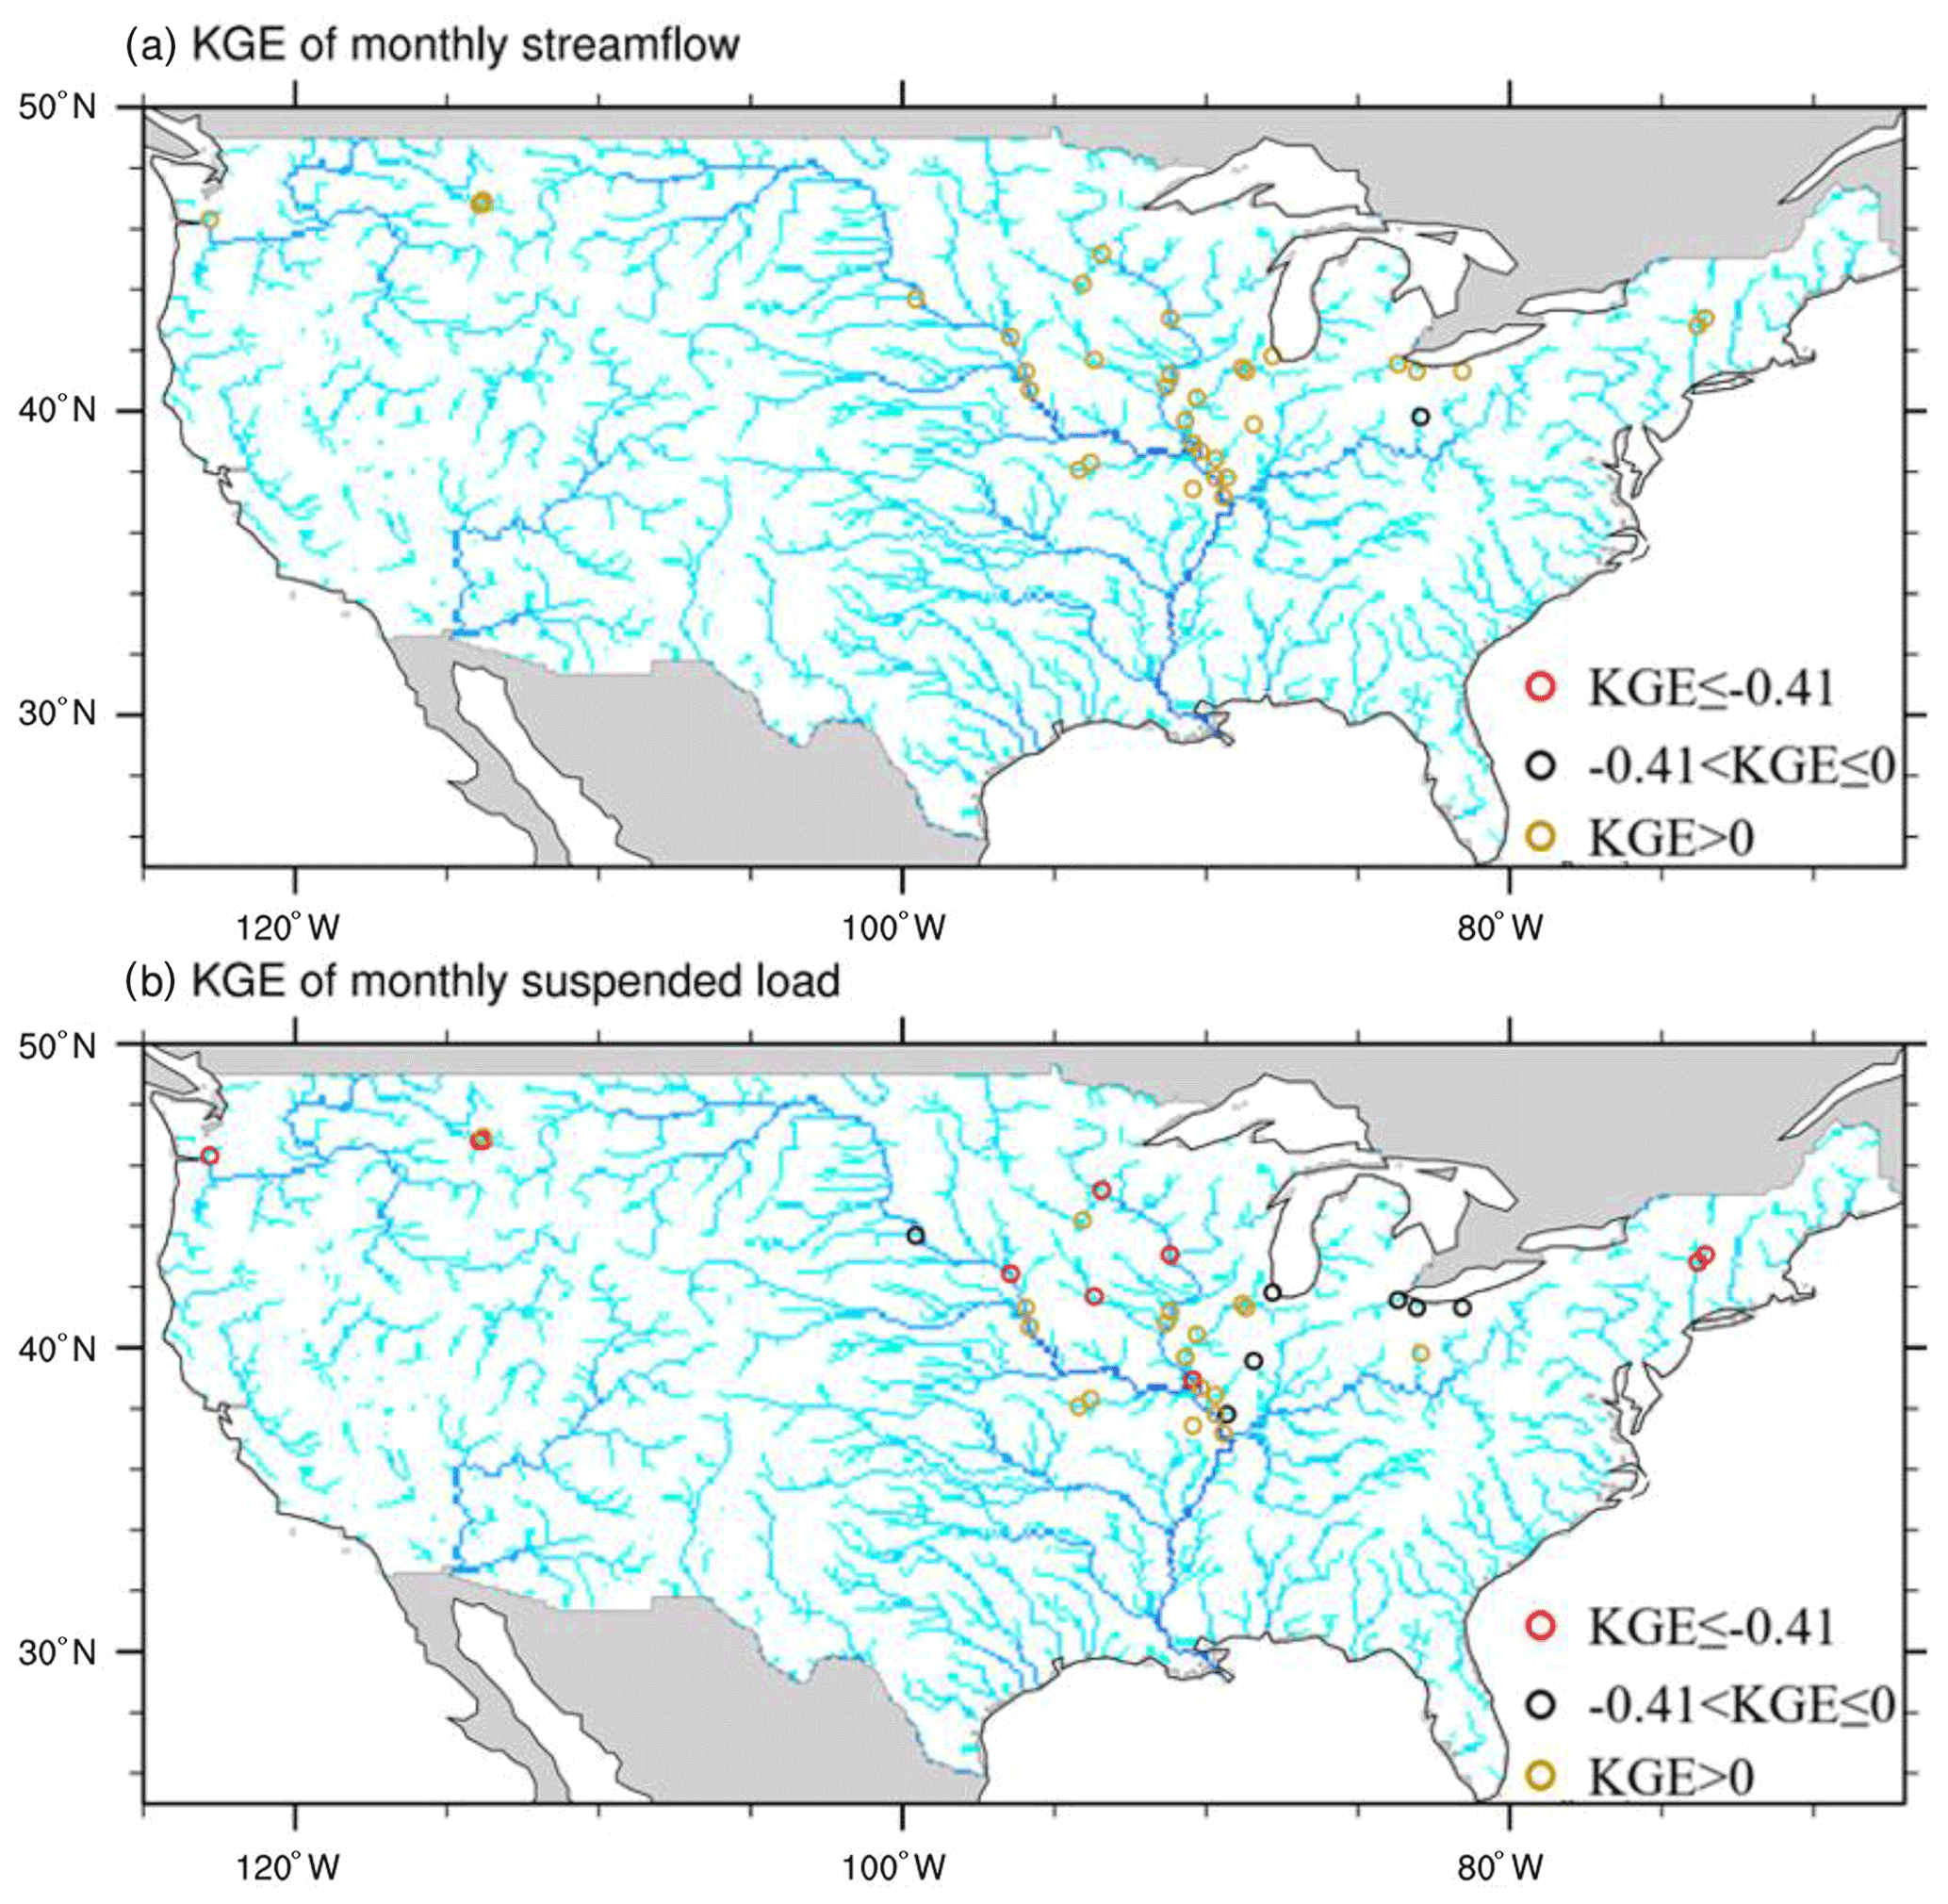
Figure 6Evaluation of simulated monthly streamflow and suspended sediment at the selected USGS stations in 1990–2012. The river network is displayed as a background in terms of the accumulated upstream drainage areas at each grid (in different tones of blue).
Compared to streamflow, model biases in the suspended sediment are noticeably larger. Figure 5 suggests that MOSART-sediment overall overestimates annual mean suspended sediment load in many gauges. Figure 6 also suggests poor model performance at some gauges. There are several possible reasons for these biases: (1) we have only included ∼1800 large reservoirs (storage capacity no less than 0.1k̇m3) with critical information (storage capacity, location, major purposes, etc.) publicly available from the Global Reservoir and Dam Database (GRanD) (Lehner et al., 2011). Relatively small reservoirs in CONUS are not included in the model inputs due to a lack of necessary information, which will be addressed in future work. (2) There are noticeable biases already in the runoff and streamflow simulation at the monthly or shorter timescales, as shown in Fig. 7, which propagate to the suspended sediment simulations. (3) There are uncertainties in the model structure and model parameters such as sediment particle size or channel slope, which we will discuss next.

Figure 7Comparison of model structure in terms of KGE and NRMSE between the simulated and observed monthly time series at different USGS gauges. EH and Wu stand for Engelund–Hansen and Wu's formulas, respectively. DW and KW stand for the diffusion and kinematic wave routing methods, respectively.
4.2 Uncertainty analysis
4.2.1 Model structure uncertainty
MOSART-sediment simulates hillslope, riverine, and reservoir processes. Here we focus on the riverine and reservoir processes. Uncertainties in the hillslope process (e.g., soil erosion) were discussed in previous studies (Tan et al., 2018, 2021).
For the simulated riverine processes, we mainly analyze the uncertainties in the sediment governing equations and routing methods. The accuracy of suspended sediment simulation could be affected by the choice of sediment transport equations and simulation of riverine hydraulic conditions. Many sediment transport equations, such as Engelund–Hansen and Wu's equations, are well established at the laboratory or single-reach scale. The implementations of such sediment transport equations at a regional scale for morphology simulation purposes are also well established (Nittrouer et al., 2012; Naito et al., 2019). Their applications in simulating suspended sediment at the continental scale are nevertheless rarely reported. Note that our previous major experiment, sim_wm_trapping, uses the diffusion wave routing method and the Engelund–Hansen equation. To compare the performance of Engelund–Hansen and Wu's equations in combination with different routing methods, we have conducted three additional numerical experiments. These three additional experiments all include the reservoir regulation and trapping effects. One of them uses the diffusion wave routing method and Wu's formula. The other two use the kinematic wave routing method but Engelund–Hansen and Wu's formulas, respectively.
Figure 7 shows the KGE and NRMSE values of the simulated monthly suspended sediment load over the selected gauges. Note that Fig. 7a only displays the gauges with their KGE values within −1.0 to 1.0 for clarity. For other gauges, uncertainties in the governing equations and routing methods are secondary to other sources of uncertainties, i.e., in the runoff scheme, channel geometry, and other parameters. Figure 7b includes all of the 35 gauges. Over some gauges, the Engelund–Hansen equation (plus the transport-mode-parameter approach) performs better than Wu's formula, particularly as indicated by the significantly decreased KGE and increased NRMSE values over some gauges. The long-term KGE and NRMSE values between the simulated and observed suspended load over the selected gauges are 0.29 and 1.76, respectively, when using Wu's formula and the diffusion wave method, both of which are worse than those using the Engelund–Hansen equation and diffusion wave method. Therefore, the Engelund–Hansen equation (plus the transport-mode-parameter approach) overall outperforms Wu's formula.
As for the routing methods, it appears that the difference between the sediment simulations using the diffusion wave routing method and those using the kinematic wave routing method is overall less than the difference between the Engelund–Hansen and Wu formulas. The difference between the monthly streamflow simulations using different routing methods is even more negligible (figure not shown). At the 35 selected stations located mostly upstream of river outlets, the backwater effects are likely not dominant. In flat locations such as those close to the river mouths, however, the backwater effects are expected to be significant, and as such using the diffusion wave routing method should lead to better performance in not only the streamflow, but also the sediment simulations.
For the reservoir process, we analyze the uncertainties in the reservoir regulation and trapping processes. Figure 8 illustrates the total impacts of the two reservoir processes by contrasting the sim_nat and sim_wm_trapping simulation results at the three representative gauges subject to different levels of reservoir effects. At ILV, whose upstream drainage area is subject to relatively small reservoir effects, there is a negligible difference between the simulated streamflow from sim_nat and sim_wm_trapping, indicating relatively minor water management activities in the upstream areas due to a relatively smaller number of reservoirs and low water demand. At MON, its upstream drainage area is subject to strong reservoir effects. The simulated streamflow is significantly reduced from sim_nat to sim_wm_trapping, particularly over the high-flow periods in the summer, mainly due to the intensive surface water extraction in the upstream drainage area and the strong reservoir regulation effect. At MST, whose upstream drainage area is subject to moderate reservoir effects, the simulated streamflow is also noticeably reduced from sim_nat to sim_wm_trapping during the high-flow periods. At all these gauges, the simulated suspended load is significantly reduced from sim_nat to sim_wm_trapping by reservoir trapping. In the upstream area of ILV, there are only a few reservoirs simulated. These reservoirs, however, can still trap a large portion of suspended sediment, suggesting that the effects of reservoirs on suspended sediment discharge are likely more significant than those on streamflow.

Figure 8Simulated and observed monthly streamflow and suspended sediment discharge at three USGS gauges representative of different levels of flow regulation. For clarity, only the sim_nat and sim_wm_trapping results are displayed here.
Figure 9 displays the change in KGE for the monthly streamflow and suspended load at all selected USGS gauges from sim_nat to sim_wm_trapping. After adding the reservoir effects (sim_wm_trapping), the model performance is significantly improved (KGE increases by more than 0.05) at 5 and 23 of the 35 USGS gauges for streamflow and suspended load simulations, respectively, and worsened at 12 and 2 USGS gauges, respectively. For the remaining gauges, the change in model performance is negligible. For streamflow, the model performance is already quite good even for sim_nat in terms of the monthly streamflow simulation (see Fig. 5 and Table 1). The uncertainties in the runoff generation, routing structures, and parameters appear to overshadow the benefits of adding water management, hence leading to worsened model performance at 12 gauges. The improvement of sediment simulation by adding both reservoir regulation (as part of water management) and trapping is obviously more dominant. Figures 8 and 9 only show the combined effects of reservoir regulation and trapping, as interpreting their individual effects is not straightforward.
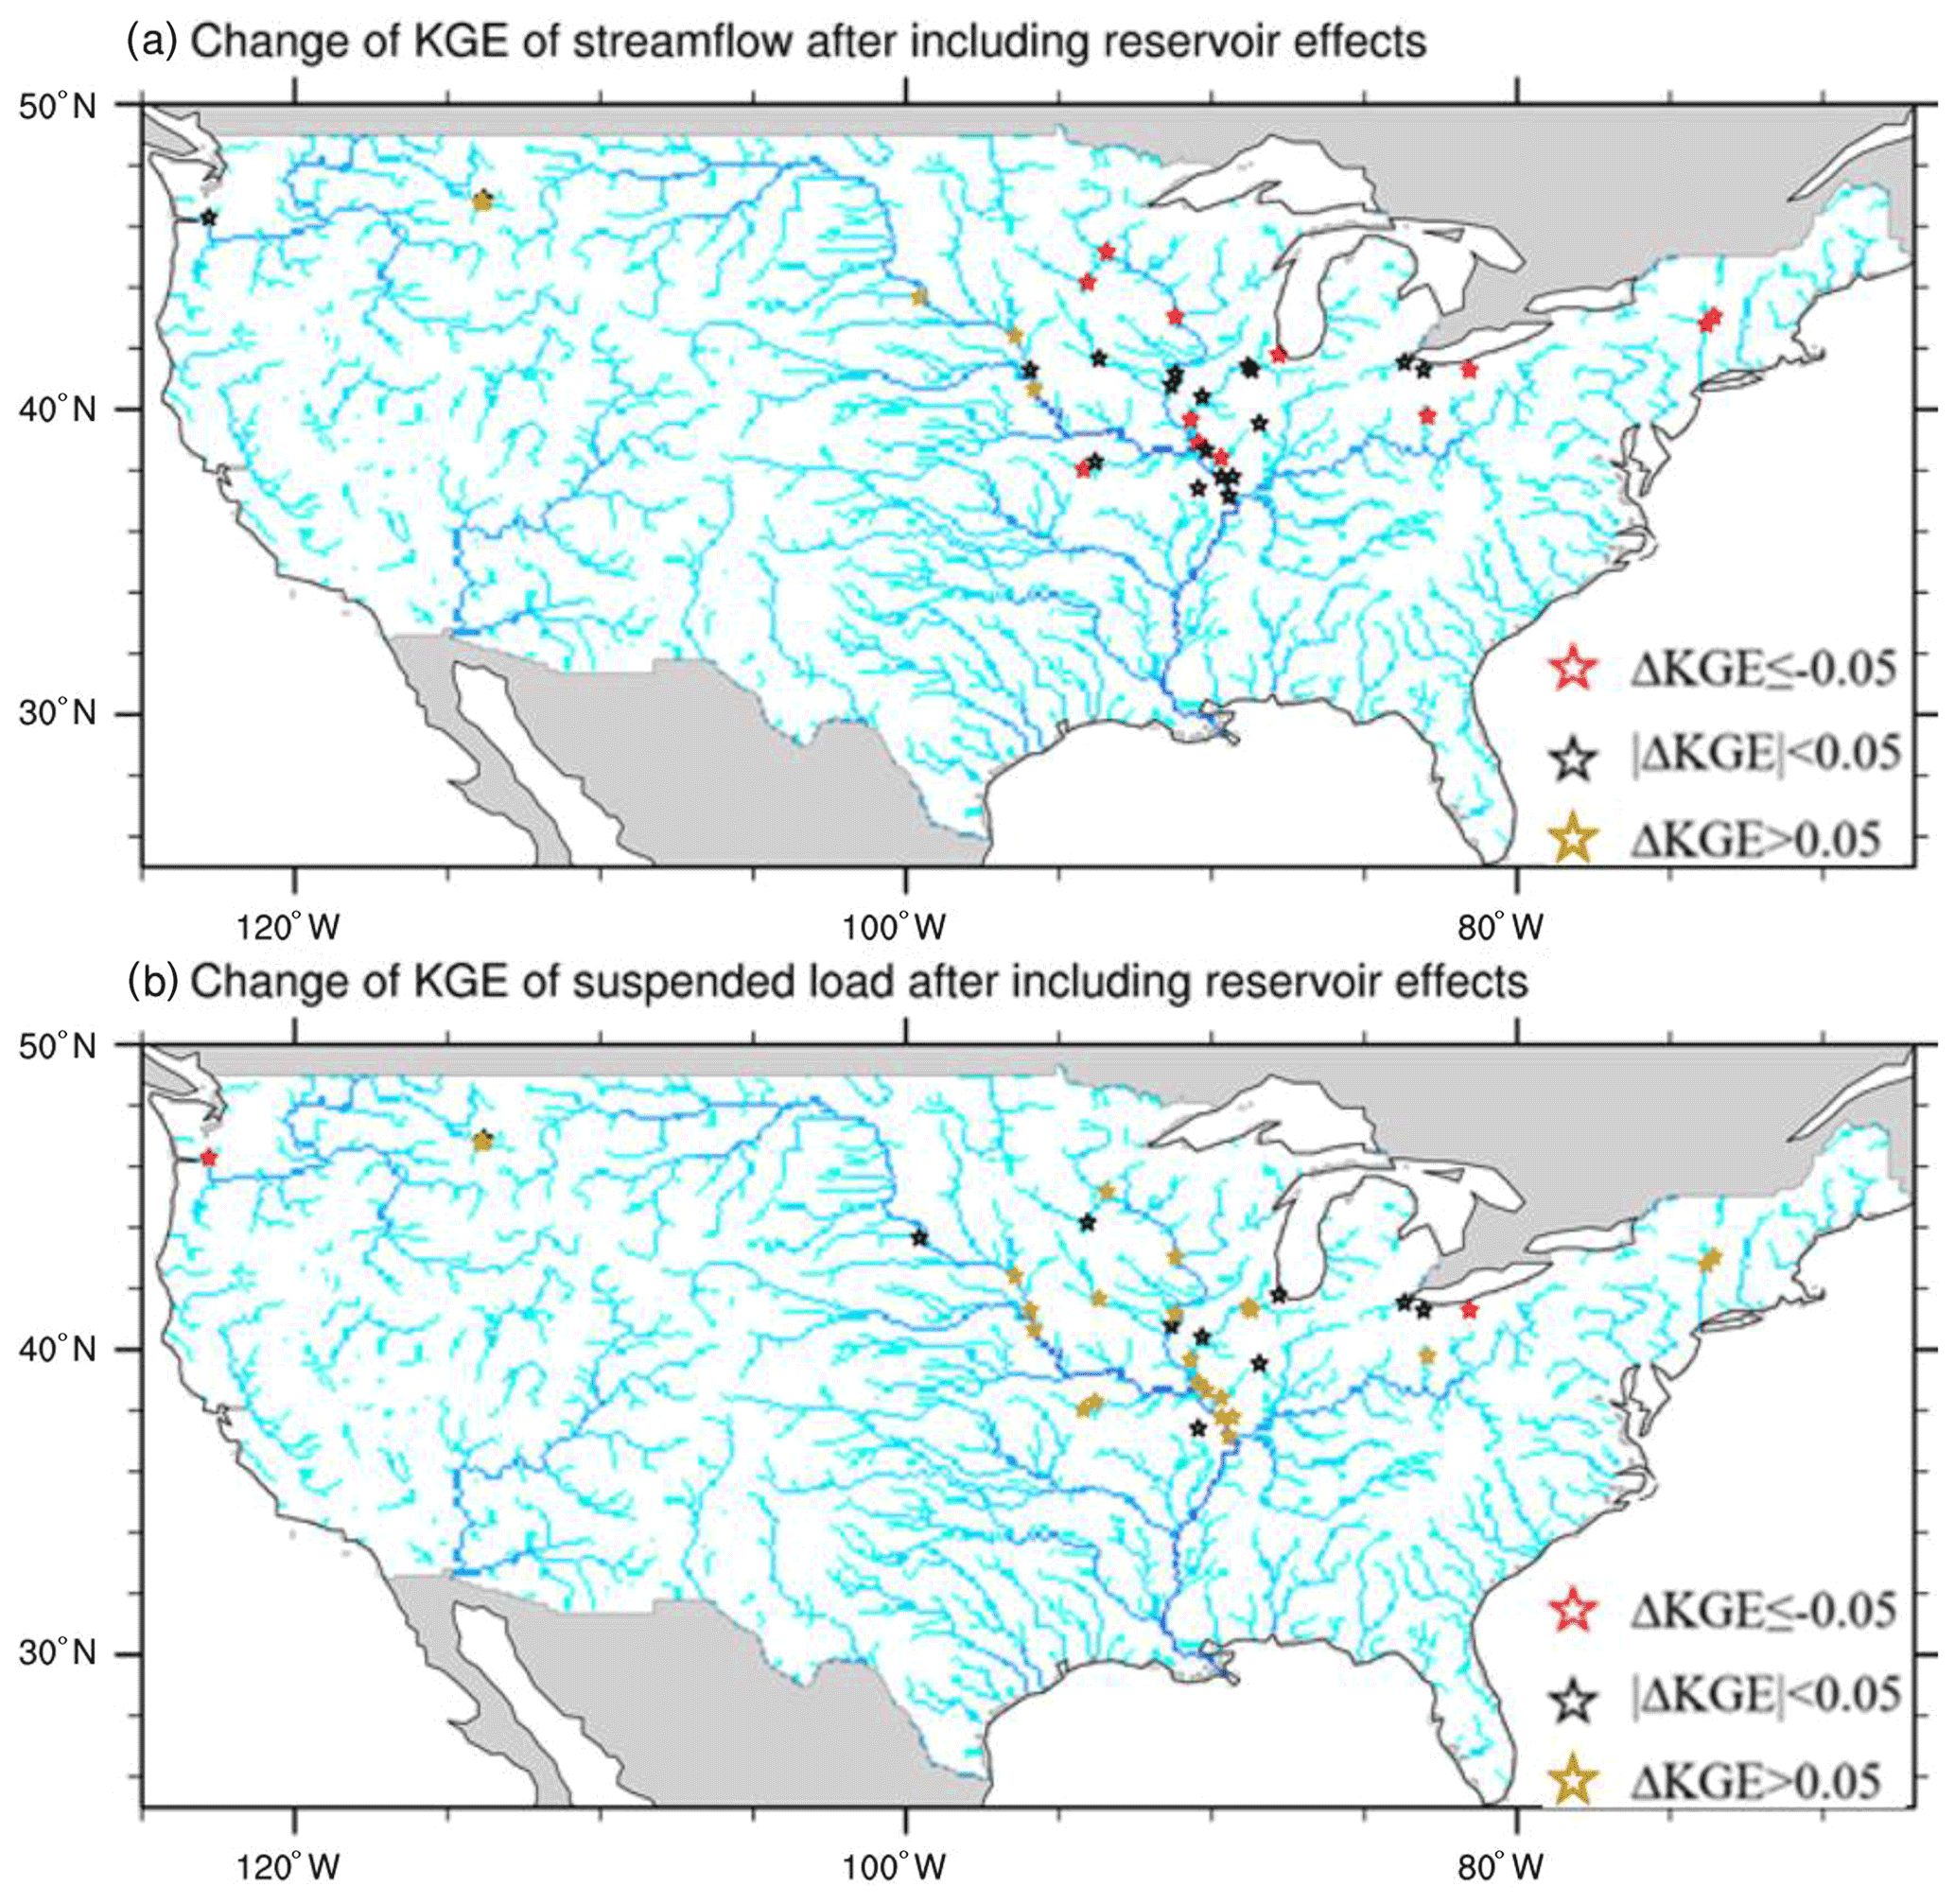
Figure 9Change in KGE from sim_nat to sim_wm_trapping for monthly streamflow and suspended sediment at the selected USGS stations in 1990–2012. The river network is displayed as a background in terms of the accumulated upstream drainage areas at each grid (in different tones of blue).
The net effects of reservoir regulation and trapping are further examined in Fig. 10 by comparing the mean monthly streamflow and suspended sediment discharges among the sim_nat (blue lines), sim_wm_only (green lines), and sim_wm_trapping (black lines) simulations. By comparing the blue and green lines, one can see the effects of flow regulation caused by water management. Overall, the net effects of reservoir operations on streamflow are to reduce the high flow in the wet season (May to August) and increase the low flow in the dry season, and these effects are relatively minor on the flow discharge at ILV, significant at MON, and moderate at MST. Reservoir regulation also reduces the suspended sediment discharge, but the effects are only noticeable during the high-flow period and negligible over the low-flow period when the sediment load is already low. By comparing the green and black lines in Fig. 10, one can see the net effects of reservoir trapping. Reservoir trapping largely reduces the magnitude of suspended sediment discharge across all three gauges, including ILV, where the reservoir regulation effect seems minor. After adding reservoir trapping, the simulated sediment discharge is much closer to the observations at all three gauges.
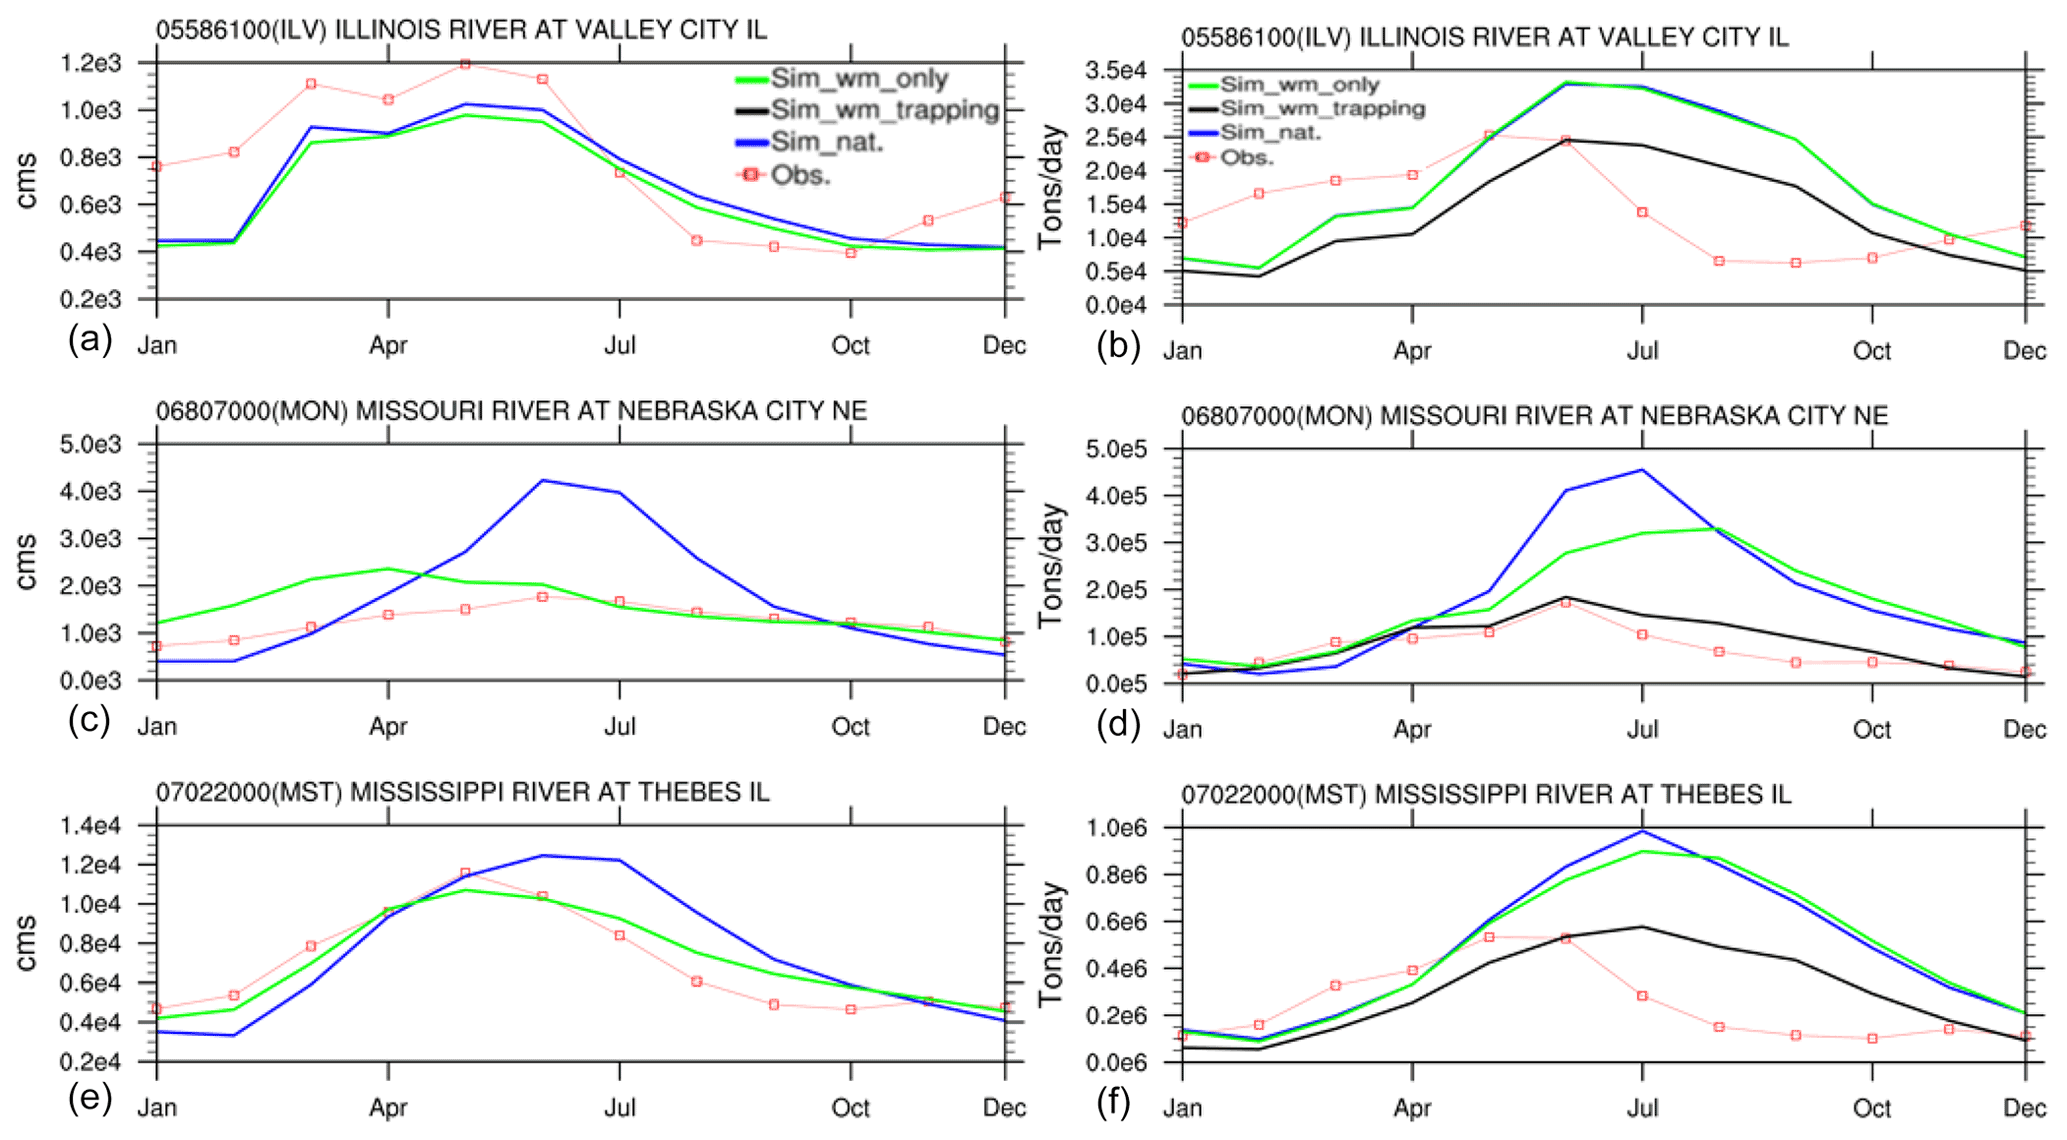
Figure 10Simulated and observed mean monthly streamflow (a, c, e) and suspended sediment discharge (b, d, f) at three USGS gauges representative of different levels of flow regulation.
The effect of reservoir regulation on streamflow can be propagated from one reservoir to another downstream in a cascading manner. This is because reservoirs do not store water in the long term but only hold it for a short period (i.e., a few months) and then release it downstream. The effects of reservoir trapping may propagate from upstream to downstream for wash load but not for suspended bed-material load. For wash load, reservoirs intercept and keep most of it without releasing it to the downstream reservoirs. Hence, the trapping effect propagates downstream. For suspended bed-material load, even if reservoirs trap most of it from upstream inflow, the downstream river channel beds and in-channel bars will be eroded to supply suspended bed-material load to maintain a dynamic equilibrium state between the in-channel erosion and deposition. This way, the transport rate of bed-material load in the river downstream of a reservoir is only limited by the local hydraulic conditions, i.e., according to the Engelund–Hansen equation.
Although including reservoir trapping improves the simulation of suspended sediment discharge, there are still some discrepancies between the simulations and observations, such as the underestimation of sediment discharge in January–April (at ILV and MST) and overestimation in July–October (at all three gauges). These discrepancies between the simulated and observed seasonal variations in the suspended sediment discharge are likely not due to the streamflow biases. Besides possible uncertainties in the sediment model parameters, another probable cause of the model biases in sediment discharge is that the Brune formula adopted in this study estimates the long-term average reservoir trapping coefficient without explicitly accounting for the seasonal variation in the trapping efficiency (Brune, 1953).
4.2.2 Model parameter uncertainty
Here we present model parameter uncertainty analysis focusing on three important and representative parameters: median bed-material sediment particle size, D50, channel slope, Sr, and Manning's roughness coefficient for channels, nr. D is involved in multiple riverine sediment processes (e.g., Eqs. 1, 4, 8, and 9). Sr and nr affect the sediment processes both directly and indirectly (e.g., Eqs. 3–5). Other parameters are not included here for simplicity.
Figure 11 shows the changes in the simulated long-term average suspended load in 1990–2012 (based on sim_wm_trapping) after increasing or decreasing D, Sr, and nr by 10 %, respectively. The spatial patterns of these changes are largely controlled by the spatial patterns of the simulated wash load and suspended bed-material load (see Fig. 4). D, Sr, and nr are mostly affecting the riverine hydraulic conditions and not much wash load transport. The changes in the total suspended load are thus only significant over places dominated by the suspended bed-material load. For places dominated by wash load, the changes in the total suspended load are overall small or even negligible. In fact, the median percentage changes in the suspended load are mainly in the range of −2 % to 2 % for all three parameters (Fig. 12). Comparing among the three parameters, the simulation of the suspended bed-material load is most sensitive to the changes in Sr, followed by D, and least sensitive to the changes in nr.
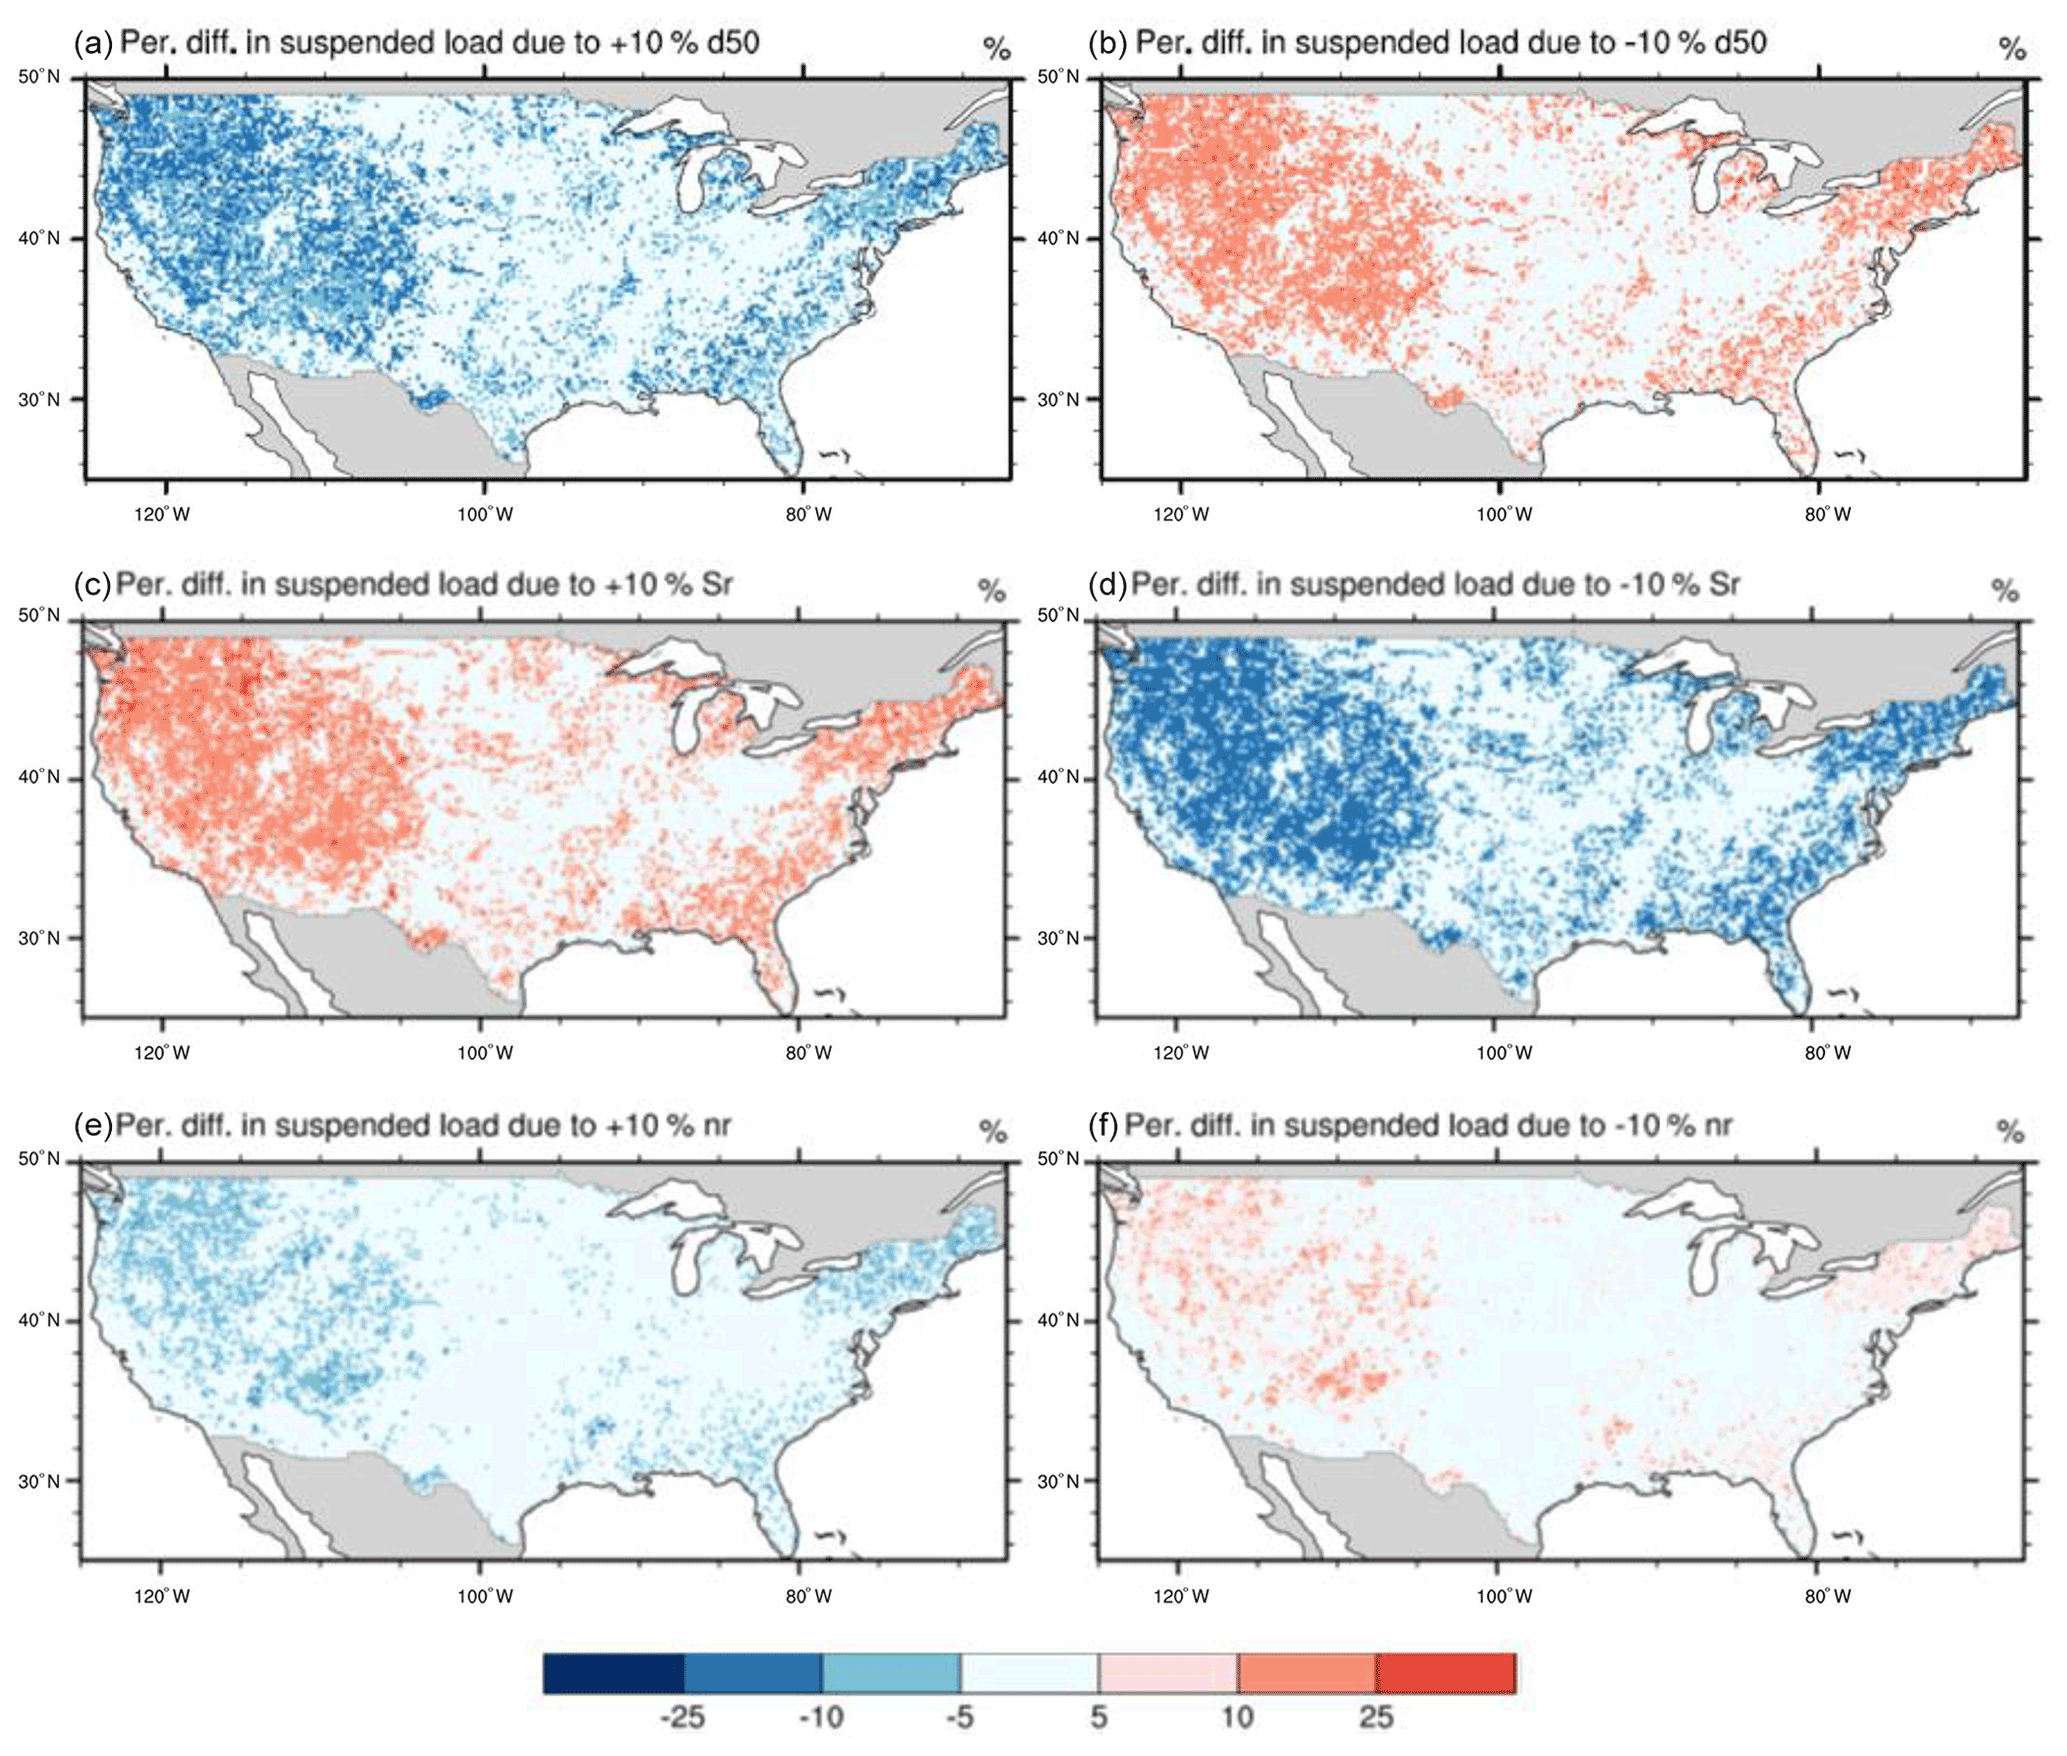
Figure 11Spatial patterns of sensitivity of median bed-material size (d50) (a, b), channel slope (rslp) (c, d), and Manning's roughness for channels (nr) (e, f). At each grid, the percentage change in suspended load is calculated as , where S1 and S0 are the average suspended load for 1990–2012 simulated with the parameter changing by 10 % and the average suspended load simulated with the original parameters, respectively.
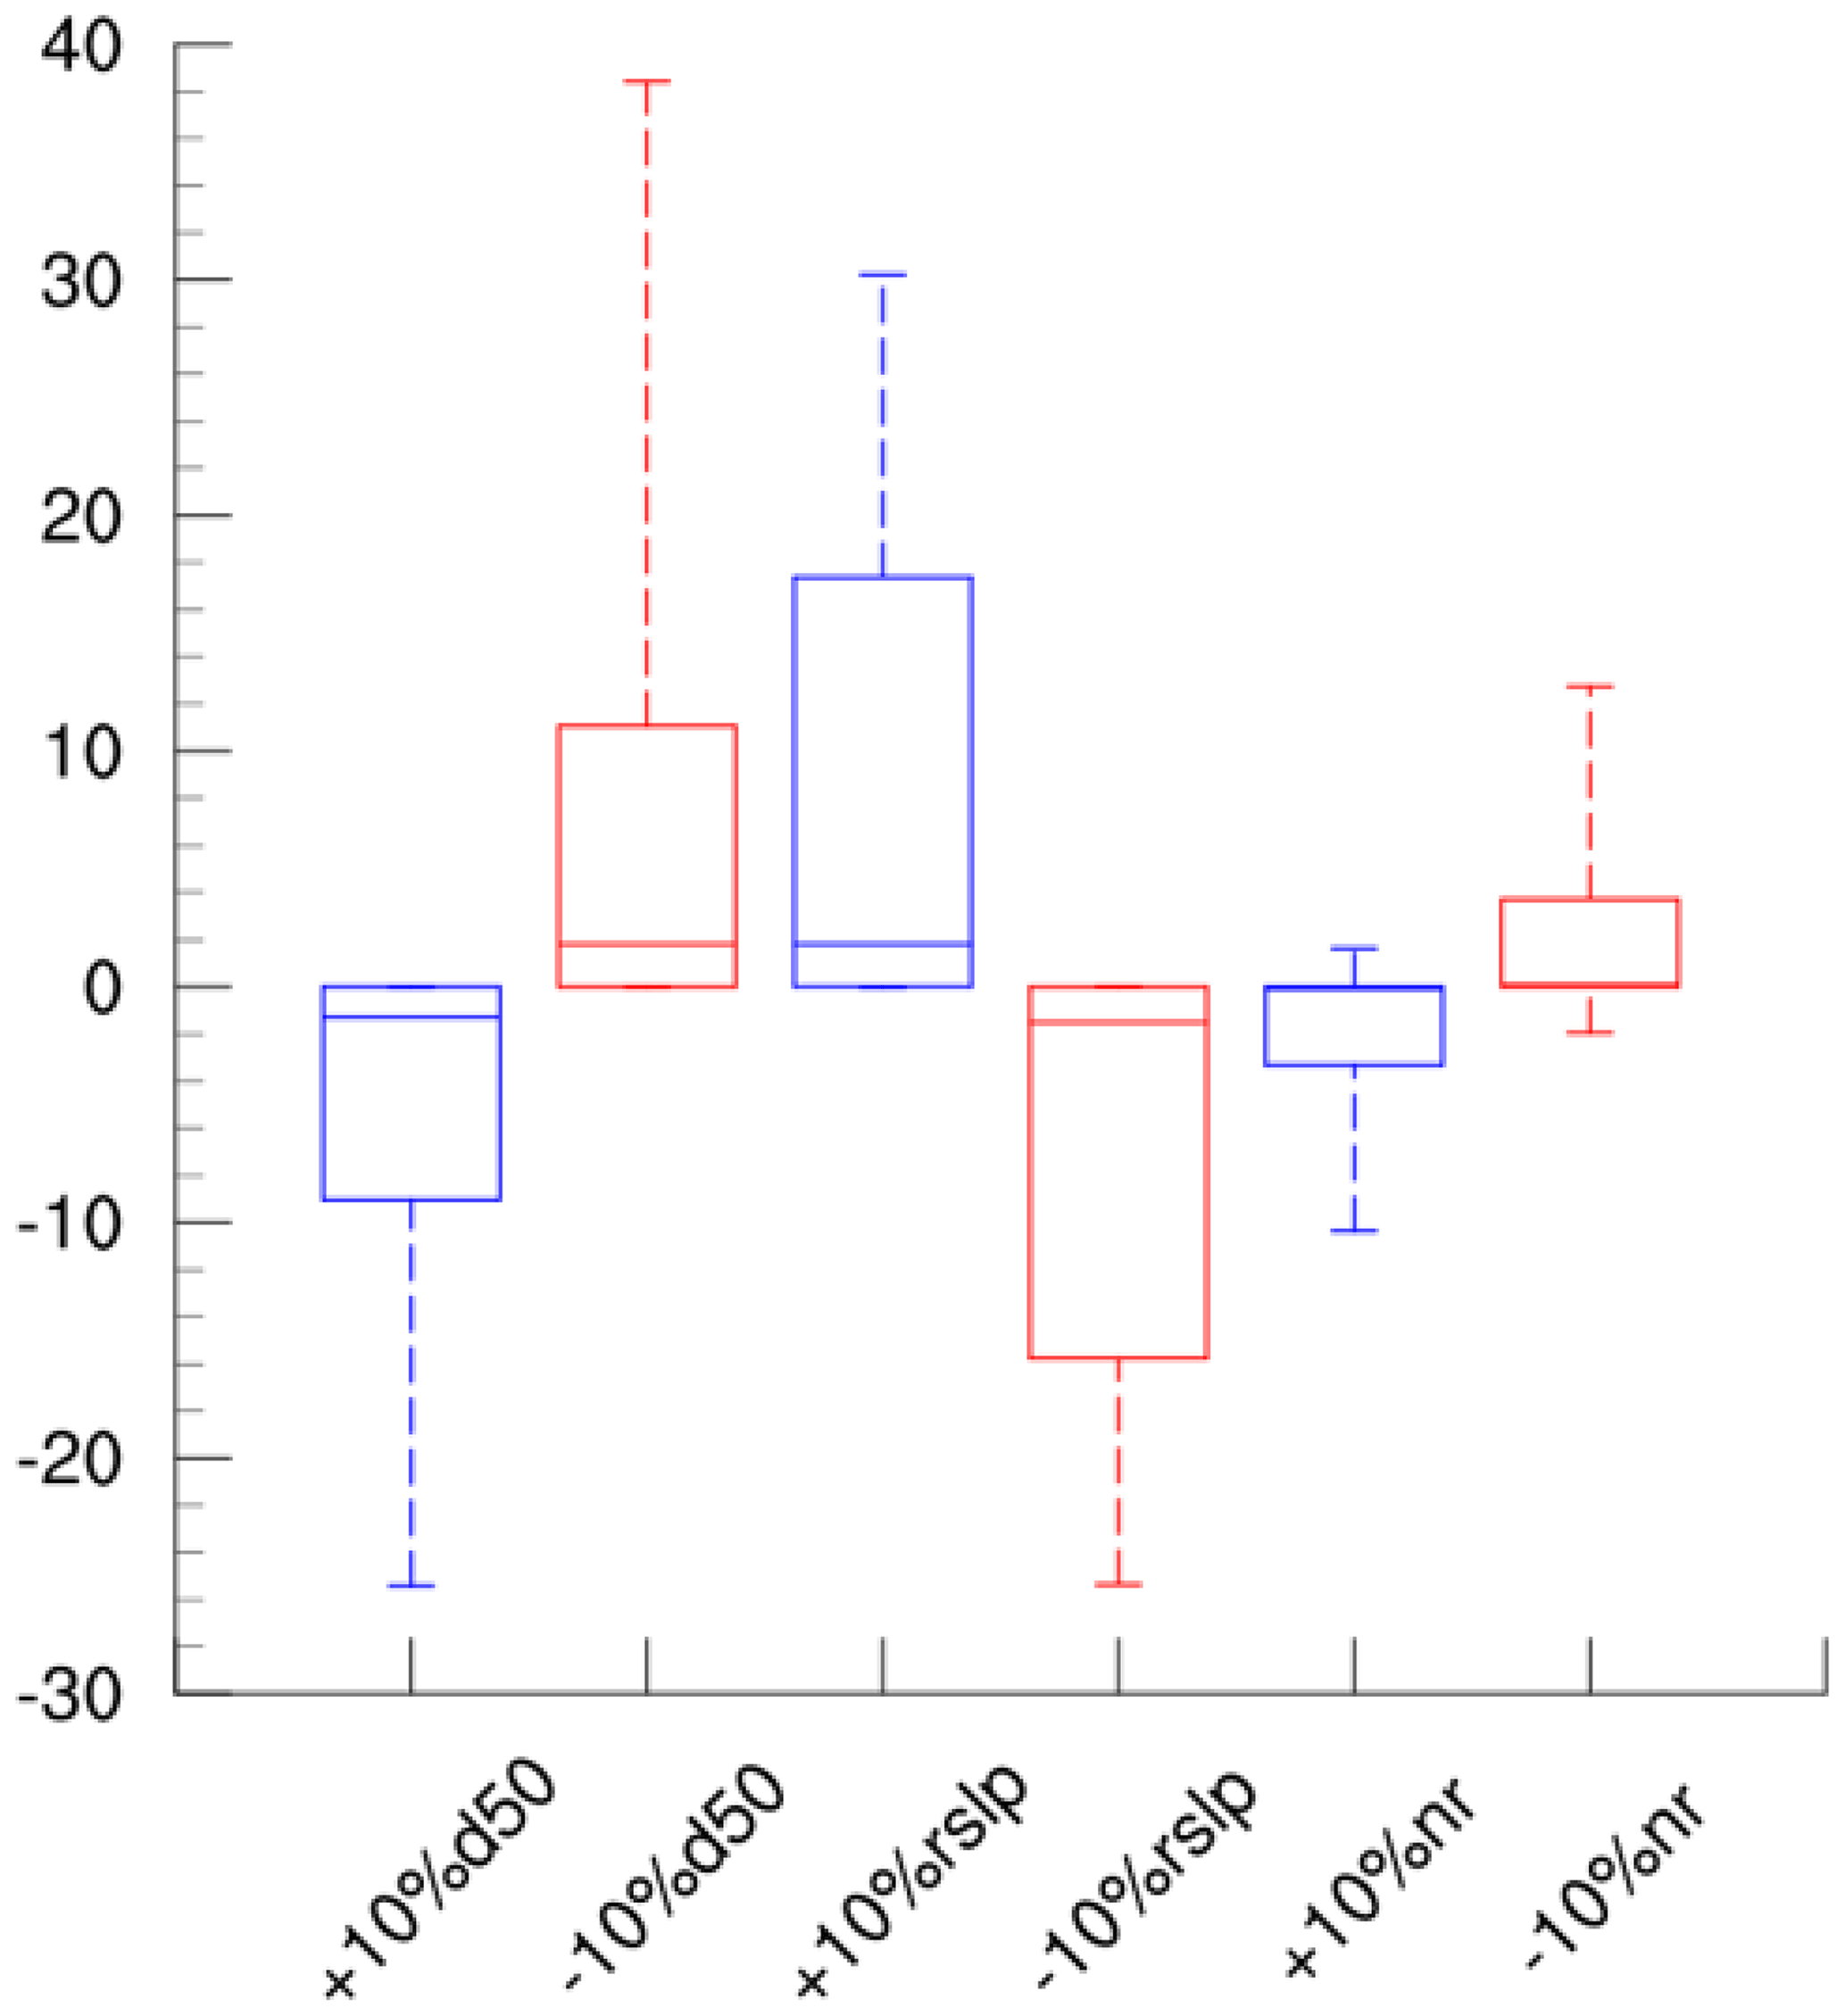
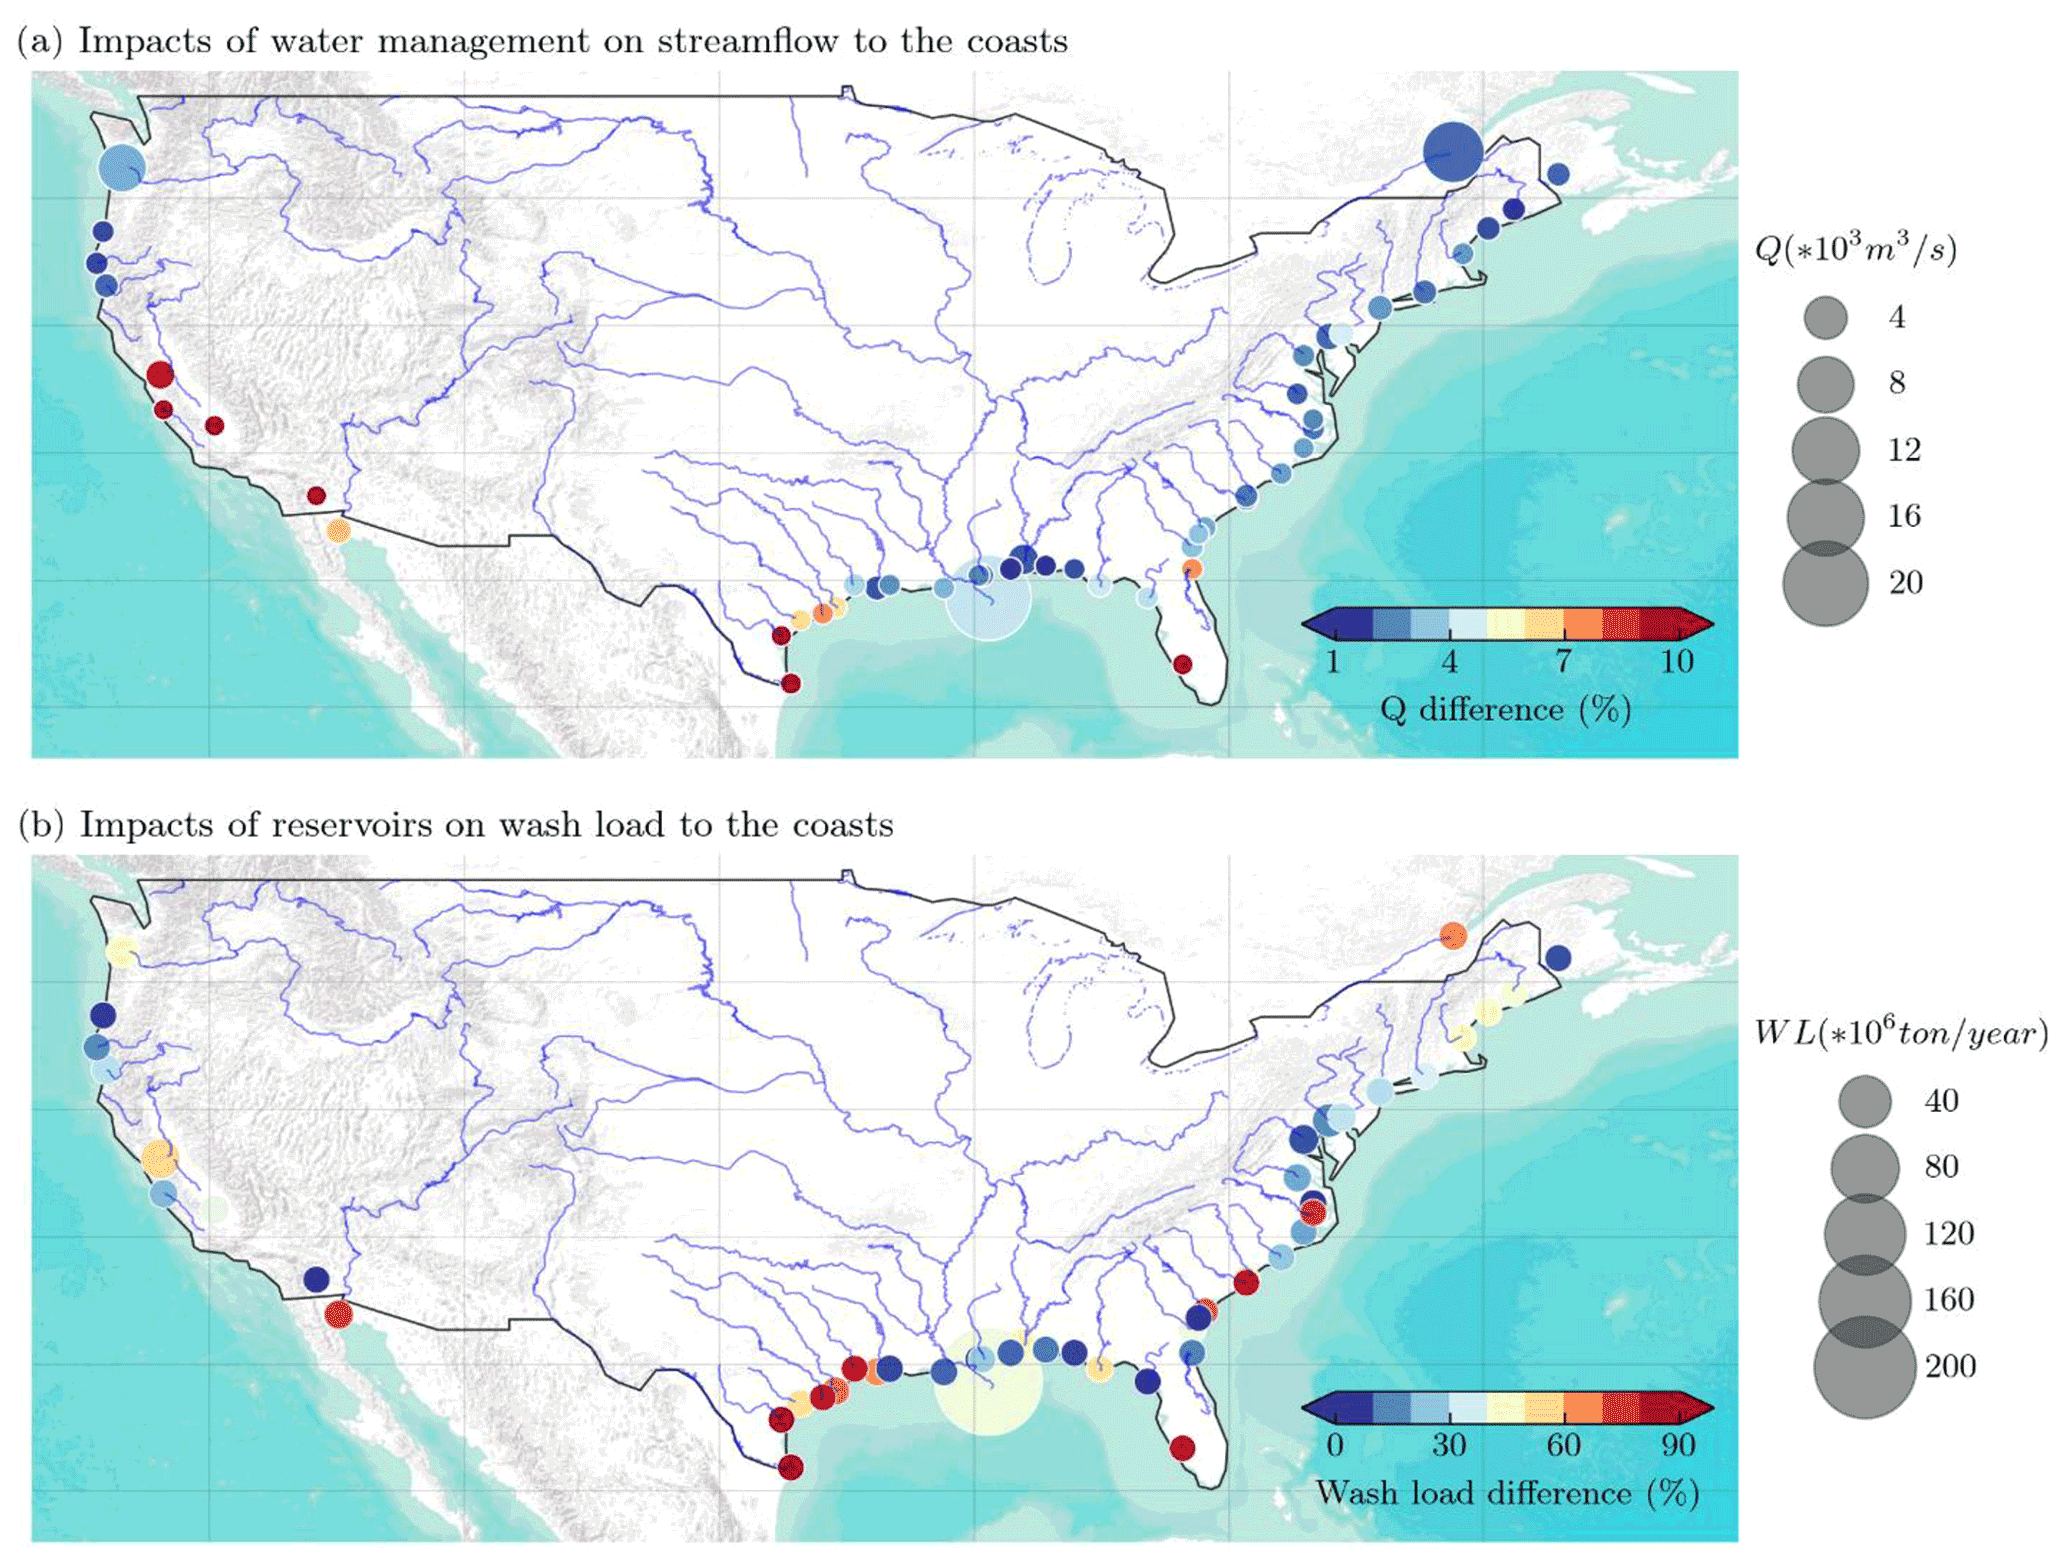
Figure 13Impacts of reservoirs on (a) streamflow and (b) wash load to the coasts. Each dot represents the lat–long grid at the river mouth of a river system. The larger the dot size, the larger the freshwater or suspended sediment discharge simulated with Sim_wm_trapping. The color of each dot represents the percentage of freshwater or suspended sediment discharge that is reduced by water management or reservoirs, i.e., (sim_nat − Sim_wm_trapping) sim_nat.
4.3 Impacts of reservoirs on suspended sediment discharge to the coasts
Despite the uncertainties, MOSART-sediment is a useful tool to shed light on some interesting questions. For example, how will reservoirs affect freshwater and suspended sediment discharges to the coasts? Figure 13 shows the model-simulated impacts of water management on freshwater discharge (Fig. 13a) and the effects of reservoirs on suspended sediment discharge (Fig. 13b) to the coasts. Note that, in Fig. 13b, we focus on wash load only instead of total suspended load, i.e., excluding the suspended bed-material load. There are three reasons: (1) wash load consists of very fine particles and is a major carrier of carbon and nutrients from land into rivers and then to the coasts. (2) Wash load is dominant in most rivers. (3) Wash load is subject to the impacts of both upstream drainage areas (e.g., land-use change, water management, precipitation) and local channel conditions (e.g., channel slope and D50), whilst suspended bed-material load is mostly dominated by the local channel conditions.
According to our simulations, water management moderately reduces the freshwater discharge to the coasts, particularly for the smaller rivers on the southwestern coasts (Fig. 13a). The major cause of reduction in freshwater discharge is surface water extraction (which is mainly controlled by water demand intensity) since reservoir regulation normally does not reduce streamflow on a decadal scale (e.g., in the period of 1990–2012). The reduction of freshwater discharge to the southwestern coasts is thus consistent with the high irrigation water demand over the western US, e.g., in the Colorado River basin.
The delivery of suspended sediment from the continental US to the coasts is reduced more significantly than streamflow (Fig. 13b). According to our simulation results, the reduction of suspended load by reservoirs is high (e.g., over 95 %) in some river basins such as the Colorado River and Brazos River but medium or low in other rivers such as the Mississippi River and Columbia River. The former rivers have a large proportion of wash load relative to the total suspended load (indicated by the colors of the circles). As such, the reservoir trapping effect plays a vital role. In many small rivers close to the coasts but not subject to reservoir effects, most of their suspended sediment discharge is delivered to the coasts without being trapped during the transport. We do not find any notable relationship between the percentage reductions in streamflow vs. those in suspended sediment discharge at the river mouths. For the former, surface water extraction is the major cause, whilst for the latter, reservoir trapping is the major cause. These two major causes do not directly interact with each other, suggesting that the reduction of suspended sediment discharge may not be closely linked to the reduction of streamflow. These inferences, however, are made based on the simulation results, and further investigations using more comprehensive observational datasets and modeling approaches are needed in the future. Moreover, we caution that the wash load estimates (with sim_wm_trapping) do not account for the effects of small reservoirs and are likely higher than the real conditions.
Nevertheless, our estimates of wash load from large rivers to the coasts are comparable to previously reported numbers. Within the conterminous United States, the greatest amount of sediment is transported by rivers within the Gulf of Mexico drainage system. Meade and Moody (2010) reported that in 1987–2003, the Mississippi River system on average discharged 172 million t yr−1 total suspended load to the coast, which is moderately less than our wash load estimation of 228.23 million t yr−1 from sim_wm_trapping (used in all the comparisons below unless stated otherwise). Holeman (1968) estimated that the Columbia River discharged about 9 million t of total suspended load per year to the Pacific Ocean, and 15 years later, this magnitude was reported to be reduced to 8 million t yr−1 (Meade and Milliman, 1983). Wise et al. (2007) also estimated 5.1 million t of suspended sediment delivery during an average water year. Our wash load estimate for the period 1990–2012 is 6.34 million t yr−1 from the Columbia River to the Pacific coast. For other river systems, our estimates for the period of 1990–2012 are less than the reported suspended load estimates, which were made decades ago. For the Brazos River, one of the largest rivers after the Mississippi River in terms of sediment load delivered to the Gulf of Mexico, Holeman (1968) estimated 32 million t yr−1 of the total suspended load. A decade later, Milliman and Meade (1983) estimated it to be 16 million t yr−1, a much reduced value. Our wash load estimate is 1.55 million t yr−1, even further reduced, which is possible given that there has been a decreasing trend of suspended sediment discharge in the US river systems over the past few decades due to improved soil erosion controls (Meade and Moody, 2010).
In this study, a new large-scale suspended sediment module has been developed on top of MOSART within E3SM. Both reservoir trapping and regulation mechanisms have been incorporated. Validation of the model simulations against the observations from 35 USGS gauges located across the contiguous United States shows reasonable skill in simulating the long-term average suspended sediment discharge (KGE=0.69, NRMSE=0.74) and monthly suspended load (KGE>0 in 18 of the 35 gauges). We show that adding the reservoir effects improves the model simulations, particularly at the annual and monthly scales. As such, our model performance is comparable to WBMsed without any calibration. We carry out the model uncertainty analysis in terms of the model structure and parameter uncertainties. We further show that reservoir trapping exerts dominant effects (over reservoir regulation) on suspended sediment discharge through large river systems to the coasts.
The analyses help identify several opportunities to further advance large-scale suspended sediment modeling, including but not limited to (1) improving the runoff and streamflow simulation within the Earth system modeling framework, (2) effectively accounting for the intra- or inter-annual variations in the reservoir trapping efficiency over multiple reservoirs at the regional or global scales, (3) accounting for more realistic reservoir stage–volume relationships and their impacts on reservoir trapping, (4) including the effects of small or navigational reservoirs on streamflow and sediment simulations, (5) improving the accuracy of channel bed slope estimation, and (6) accounting for sediment exchanges between channel and floodplain more realistically. Moreover, our separate treatment of wash load and bed-material load will make it easier to isolate various climate and human impacts on riverine sediment. For instance, water management such as local channel water withdrawal and reservoir operation will primarily affect bed-material load by modifying hydraulic conditions. Land management such as land-use change and farming activities will affect wash load by changing topsoil erosional conditions. Lastly, for the sediment particle size, we have developed and adopted a spatial map of median bed-material sediment particle size to support the parameterization of the sediment governing equations, but there is still room to enhance the accuracy and availability of the sediment particle data through improved understanding and more data collection. Each of these opportunities above requires a chain of efforts to achieve and is thus beyond the scope of this work.
While future opportunities exist to further improve MOSART-sediment, this study presents a new process-based sediment modeling framework from a coupled Earth–human system perspective. It has the potential to enable investigations that were not possible on the suspended sediment delivery to the coasts under various disturbances induced by variability and changes in climate and human activities. For example, the models can be used to explore how extreme events such as floods and droughts and their long-term changes may influence sediment delivery to the coast and hence the biogeochemistry of the coastal ecosystem and the role of soil erosion and sediment transport in atmospheric CO2 through changes in the terrestrial, riverine, and ocean biogeochemistry. Finally, and importantly, the new sediment module lays the foundation for modeling transportation and transformation of particulate C, N, and P through the river–ocean continuum to help close the global C, N, and P cycles within Earth system models.
The source code developed in this study is available through the E3SM GitHub repository (https://doi.org/10.11578/E3SM/dc.20210924.5; E3SM, 2019).
The data used in this study will be available upon request to the corresponding author.
HYL developed the code, carried out the simulations, and wrote the manuscript draft. HYL, ZT, HM, ZZ, SZ, and SC all contributed to the methodology. HYL, ZZ, and LRL performed the analysis. GWA, TZ, and DX helped with the model inputs and observational data processing. HYL and GA prepared the figures. All the authors contributed to the writing and discussion.
The contact author has declared that neither they nor their co-authors have any competing interests.
Publisher's note: Copernicus Publications remains neutral with regard to jurisdictional claims in published maps and institutional affiliations.
This research was supported as part of the Energy Exascale Earth System Model (E3SM) project, funded by the US Department of Energy, Office of Science, Office of Biological and Environmental Research. This research was performed using BER Earth System Modeling program's Compy computing cluster located at Pacific Northwest National Laboratory. The Pacific Northwest National Laboratory is operated by Battelle for the US Department of Energy under contract DE-AC05-76RLO1830.
This research has been supported by the US Department of Energy, Office of Science via Lawrence Livermore National Laboratory (grant no. B633822).
This paper was edited by Fuqiang Tian and reviewed by David Waterman and Zhendong Cao.
Abeshu, G. W., Li, H.-Y., Zhu, Z., Tan, Z., and Leung, L. R.: Median bed-material sediment particle size across rivers in the contiguous U.S., Earth Syst. Sci. Data Discuss. [preprint], https://doi.org/10.5194/essd-2021-201, in review, 2021.
An, C., Moodie, A. J., Ma, H., Fu, X., Zhang, Y., Naito, K., and Parker, G.: Morphodynamic model of the lower Yellow River: Flux or entrainment form for sediment mass conservation?, Earth Surf. Dynam., 6, 989–1010, https://doi.org/10.5194/esurf-6-989-2018, 2018.
An, C., Gong, Z., Naito, K., Parker, G., Hassan, M. A., Ma, H., and Fu, X.: Grain Size-Specific Engelund-Hansen Type Relation for Bed Material Load in Sand-Bed Rivers, With Application to the Mississippi River, Water Resour. Res., 57, e2020WR027517, https://doi.org/10.1029/2020WR027517, 2021.
Berhe, A. A., Barnes, R. T., Six, J., and Marín-Spiotta, E.: Role of Soil Erosion in Biogeochemical Cycling of Essential Elements: Carbon, Nitrogen, and Phosphorus, Annu. Rev. Earth Planet. Sci., 46, 521–548, https://doi.org/10.1146/annurev-earth-082517-010018, 2018.
Biedenharn, D. S., Hubbard, L. C., Thorne, C. R., and Watson, C. C.: Understanding sediment sources, pathways and sinks in regional sediment management: Wash load and bed-material load concept, SWWRP Technical Notes Collection, ERDC TN-SWWRP-06-3, US Army Engineer Research and Development Center, Vicksburg, MS, 2006.
Bieger, K., Rathjens, H., Allen, P. M., and Arnold, J. G.: Development and Evaluation of Bankfull Hydraulic Geometry Relationships for the Physiographic Regions of the United States, J. Am. Water Resour. Assoc., 51, JAWRA-13-0228-P, https://doi.org/10.1111/jawr.12282, 2015.
Brownlie, W. R.: Flow Depth in Sand-Bed Channels, J. Hydraul. Eng., 109, 959–990, https://doi.org/10.1061/(asce)0733-9429(1983)109:7(959), 1983.
Brune, G. M.: Trap efficiency of reservoirs, Eos Trans. Am. Geophys. Union, 34, 407–418, https://doi.org/10.1029/TR034i003p00407, 1953.
Caldwell, P. M., Mametjanov, A., Tang, Q., Van Roekel, L. P., Golaz, J.-C., Lin, W., Bader, D. C., Keen, N. D., Feng, Y., Jacob, R., Maltrud, M. E., Roberts, A. F., Taylor, M. A., Veneziani, M., Wang, H., Wolfe, J. D., Balaguru, K., Cameron-Smith, P., Dong, L., Klein, S. A., Leung, L. R., Li, H.-Y., Li, Q., Liu, X., Neale, R. B., Pinheiro, M., Qian, Y., Ullrich, P. A., Xie, S., Yang, Y., Zhang, Y., Zhang, K., and Zhou, T.: The DOE E3SM Coupled Model Version 1: Description and Results at High Resolution, J. Adv. Model. Earth Syst., 11, 4095–4146, https://doi.org/10.1029/2019MS001870, 2019.
Chen, T. and Guestrin, C.: XGBoost: A Scalable Tree Boosting System, in: Proceedings of the 22nd ACM SIGKDD International Conference on Knowledge Discovery and Data Mining, August 2016, San Francisco, California, 785–794, 2016.
Cheng, N.-S.: Simplified Settling Velocity Formula for Sediment Particle, J. Hydraul. Eng., 123, 149–152, https://doi.org/10.1061/(asce)0733-9429(1997)123:2(149), 1997.
Church, M. and Ferguson, R. I.: Morphodynamics: Rivers beyond steady state, Water Resour. Res., 51, 1883–1897, https://doi.org/10.1002/2014WR016862, 2015.
Cohen, S., Kettner, A. J., Syvitski, J. P. M., and Fekete, B. M.: WBMsed, a distributed global-scale riverine sediment flux model: Model description and validation, Comput. Geosci., 53, 80–93, https://doi.org/10.1016/j.cageo.2011.08.011, 2013.
Cohen, S., Kettner, A. J., and Syvitski, J. P. M.: Global suspended sediment and water discharge dynamics between 1960 and 2010: Continental trends and intra-basin sensitivity, Global Planet. Change, 115, 44–58, https://doi.org/10.1016/j.gloplacha.2014.01.011, 2014.
Crosato, A. and Mosselman, E.: Simple physics-based predictor for the number of river bars and the transition between meandering and braiding, Water Resour. Res., 45, W03424, https://doi.org/10.1029/2008WR007242, 2009.
Crosato, A., Mosselman, E., Beidmariam Desta, F., and Uijttewaal, W. S. J.: Experimental and numerical evidence for intrinsic nonmigrating bars in alluvial channels, Water Resour. Res., 47, W03511, https://doi.org/10.1029/2010WR009714, 2011.
Czuba, J. A., Foufoula-Georgiou, E., Gran, K. B., Belmont, P., and Wilcock, P. R.: Interplay between spatially explicit sediment sourcing, hierarchical river-network structure, and in-channel bed material sediment transport and storage dynamics, J. Geophys. Res.-Earth, 122, 1090–1120, https://doi.org/10.1002/2016JF003965, 2017.
Darby, S. E., Alabyan, A. M., and Van de Wiel, M. J.: Numerical simulation of bank erosion and channel migration in meandering rivers, Water Resour. Res., 38, 2-1–2-21, https://doi.org/10.1029/2001wr000602, 2002.
Einstein, H. A., Anderson, A. G., and Johnson, J. W.: A distinction between bed-load and suspended load in natural streams, Eos Trans. Am. Geophys. Union, 21, 628–633, https://doi.org/10.1029/TR021i002p00628, 1940.
Engelund, F. and Hansen, E.: A monograph on sediment transport in alluvial streams, Technisk Vorlag, Copenhagen, Denmark, 1967.
E3SM Project, DOE: Energy Exascale Earth System Model v1.3, Computer Software, E3SM [code], https://doi.org/10.11578/E3SM/dc.20210924.5, 2019.
Fang, H. W., Lai, H. J., Cheng, W., Huang, L., and He, G. J.: Modeling sediment transport with an integrated view of the biofilm effects, Water Resour. Res., 53, 7536–7557, https://doi.org/10.1002/2017WR020628, 2017.
Ferguson, R. I., Church, M., Rennie, C. D., and Venditti, J. G.: Reconstructing a sediment pulse: Modeling the effect of placer mining on Fraser River, Canada, J. Geophys. Res.-Earth, 120, 1436–1454, https://doi.org/10.1002/2015JF003491, 2015.
Garcia, M. H. (Ed.): Sedimentation Engineering: Processes, Measurements, Modeling, and Practice, ASCE Manual 110, American Society of Civil Engineers, Reston, VA, USA, 1150 pp., 2008.
Geleynse, N., Storms, J. E. A., Walstra, D. J. R., Jagers, H. R. A., Wang, Z. B., and Stive, M. J. F.: Controls on river delta formation; insights from numerical modelling, Earth Planet. Sc. Lett., 302, 217–226, https://doi.org/10.1016/j.epsl.2010.12.013, 2011.
Getirana, A., Dutra, E., Guimberteau, M., Kam, J., Li, H. Y., Decharme, B., Zhang, Z., Ducharne, A., Boone, A., Balsamo, G., Rodell, M., Toure, A. M., Xue, Y., Peters-Lidard, C. D., Kumar, S. V., Arsenault, K., Drapeau, G., Leung, L. R., Ronchail, J., and Sheffield, J.: Water balance in the amazon basin from a land surface model ensemble, J. Hydrometeorol., 15, 2586–2614, https://doi.org/10.1175/JHM-D-14-0068.1, 2014.
Getirana, A., Kumar, S. V., Konapala, G., and Ndehedehe, C. E.: Impacts of Fully Coupling Land Surface and Flood Models on the Simulation of Large Wetlands' Water Dynamics: The Case of the Inner Niger Delta, J. Adv. Model. Earth Syst., 13, e2021MS002463, https://doi.org/10.1029/2021MS002463, 2021.
Golaz, J. C., Caldwell, P. M., Van Roekel, L. P., Petersen, M. R., Tang, Q., Wolfe, J. D., Abeshu, G., Anantharaj, V., Asay-Davis, X. S., Bader, D. C., Baldwin, S. A., Bisht, G., Bogenschutz, P. A., Branstetter, M., Brunke, M. A., Brus, S. R., Burrows, S. M., Cameron-Smith, P. J., Donahue, A. S., Deakin, M., Easter, R. C., Evans, K. J., Feng, Y., Flanner, M., Foucar, J. G., Fyke, J. G., Griffin, B. M., Hannay, C., Harrop, B. E., Hoffman, M. J., Hunke, E. C., Jacob, R. L., Jacobsen, D. W., Jeffery, N., Jones, P. W., Keen, N. D., Klein, S. A., Larson, V. E., Leung, L. R., Li, H. Y., Lin, W., Lipscomb, W. H., Ma, P. L., Mahajan, S., Maltrud, M. E., Mametjanov, A., McClean, J. L., McCoy, R. B., Neale, R. B., Price, S. F., Qian, Y., Rasch, P. J., Reeves Eyre, J. E. J., Riley, W. J., Ringler, T. D., Roberts, A. F., Roesler, E. L., Salinger, A. G., Shaheen, Z., Shi, X., Singh, B., Tang, J., Taylor, M. A., Thornton, P. E., Turner, A. K., Veneziani, M., Wan, H., Wang, H., Wang, S., Williams, D. N., Wolfram, P. J., Worley, P. H., Xie, S., Yang, Y., Yoon, J. H., Zelinka, M. D., Zender, C. S., Zeng, X., Zhang, C., Zhang, K., Zhang, Y., Zheng, X., Zhou, T., and Zhu, Q.: The DOE E3SM Coupled Model Version 1: Overview and Evaluation at Standard Resolution, J. Adv. Model. Earth Syst., 11, 2089–2129, https://doi.org/10.1029/2018MS001603, 2019.
Greimann, B., Lai, Y., and Huang, J.: Two-Dimensional Total Sediment Load Model Equations, J. Hydraul. Eng., 134, 1142–1146, https://doi.org/10.1061/(asce)0733-9429(2008)134:8(1142), 2008.
Groten, J. T. and Johnson, G. D.: Comparability of River SuspendedSediment Sampling and Laboratory Analysis Methods, Scientific Investigations Report 2018-5023, US Geological Survey. https://pubs.usgs.gov/sir/2018/5023/sir20185023.pdf (last access: 2 February 2022), 2018.
Gupta, H. V., Kling, H., Yilmaz, K. K., and Martinez, G. F.: Decomposition of the mean squared error and NSE performance criteria: Implications for improving hydrological modelling, J. Hydrol., 377, 80–91, https://doi.org/10.1016/j.jhydrol.2009.08.003, 2009.
Holeman, J. N.: The Sediment Yield of Major Rivers of the World, Water Resour. Res., 4, 737–747, https://doi.org/10.1029/WR004i004p00737, 1968.
Holly, F. M. and Rahuel, J.-L.: New numerical/physical framework for mobile-bed modelling, J. Hydraul. Res., 28, 401–416, https://doi.org/10.1080/00221689009499057, 1990.
Kirwan, M. L. and Megonigal, J. P.: Tidal wetland stability in the face of human impacts and sea-level rise, Nature 504, 53–60, https://doi.org/10.1038/nature12856, 2013.
Kleinhans, M. G., Jagers, H. R. A., Mosselman, E., and Sloff, C. J.: Bifurcation dynamics and avulsion duration in meandering rivers by one-dimensional and three-dimensional models, Water Resour. Res., 44, W08454, https://doi.org/10.1029/2007WR005912, 2008.
Knoben, W. J. M., Freer, J. E., and Woods, R. A.: Technical note: Inherent benchmark or not? Comparing Nash–Sutcliffe and Kling–Gupta efficiency scores, Hydrol. Earth Syst. Sci., 23, 4323–4331, https://doi.org/10.5194/hess-23-4323-2019, 2019.
Lal, R.: Soil erosion and the global carbon budget, Environ. Int., 29, 437–450, https://doi.org/10.1016/S0160-4120(02)00192-7, 2003.
Lal, R.: Soil carbon sequestration impacts on global climate change and food security, Science, 304, 1623–1627, https://doi.org/10.1126/science.1097396, 2004.
Lamb, M. P. and Venditti, J. G.: The grain size gap and abrupt gravel-sand transitions in rivers due to suspension fallout, Geophys. Res. Lett., 43, 3777–3785, https://doi.org/10.1002/2016GL068713, 2016.
Lane, E. W.: Report of the Subcommittee on Sediment Terminology, Eos Trans. Am. Geophys. Union, 28, 936–938, https://doi.org/10.1029/TR028i006p00936, 1947.
Lawrence, D. M., Fisher, R. A., Koven, C. D., Oleson, K. W., Swenson, S. C., Bonan, G., Collier, N., Ghimire, B., Kampenhout, L., Kennedy, D., Kluzek, E., Lawrence, P. J., Li, F., Li, H., Lombardozzi, D., Riley, W. J., Sacks, W. J., Shi, M., Vertenstein, M., Wieder, W. R., Xu, C., Ali, A. A., Badger, A. M., Bisht, G., Broeke, M., Brunke, M. A., Burns, S. P., Buzan, J., Clark, M., Craig, A., Dahlin, K., Drewniak, B., Fisher, J. B., Flanner, M., Fox, A. M., Gentine, P., Hoffman, F., Keppel-Aleks, G., Knox, R., Kumar, S., Lenaerts, J., Leung, L. R., Lipscomb, W. H., Lu, Y., Pandey, A., Pelletier, J. D., Perket, J., Randerson, J. T., Ricciuto, D. M., Sanderson, B. M., Slater, A., Subin, Z. M., Tang, J., Thomas, R. Q., Val Martin, M., and Zeng, X.: The Community Land Model version 5: Description of new features, benchmarking, and impact of forcing uncertainty, J. Adv. Model. Earth Syst., 2, 1–43, https://doi.org/10.1029/2018ms001583, 2019.
Lee, H.-Y., Hsieh, H.-M., Yang, J.-C., and Yang, C. T.: Quasi–Two-Dimensional Simulation of Scour and Deposition in Alluvial Channels, J. Hydraul. Eng., 123, 600–609, https://doi.org/10.1061/(asce)0733-9429(1997)123:7(600), 1997.
Lehner, B., Liermann, C. R., Revenga, C., Vörömsmarty, C., Fekete, B., Crouzet, P., Döll, P., Endejan, M., Frenken, K., Magome, J., Nilsson, C., Robertson, J. C., Rödel, R., Sindorf, N., and Wisser, D.: High-resolution mapping of the world's reservoirs and dams for sustainable river-flow management, Front. Ecol. Environ., 9, 494–502, https://doi.org/10.1890/100125, 2011.
Lewis, S. E., Bainbridge, Z. T., Kuhnert, P. M., Sherman, B. S., Henderson, B., Dougall, C., Cooper, M., and Brodie, J. E.: Calculating sediment trapping efficiencies for reservoirs in tropical settings: A case study from the Burdekin Falls Dam, NE Australia, Water Resour. Res., 49, 1017–1029, https://doi.org/10.1002/wrcr.20117, 2013.
Li, H.-Y., Wigmosta, M. S., Wu, H., Huang, M., Ke, Y., Coleman, A. M., and Leung, L. R.: A physically based runoff routing model for land surface and earth system models, J. Hydrometeorol., 14, 808–828, 2013.
Li, H.-Y., Leung, L. R., Getirana, A., Huang, M., Wu, H., Xu, Y., Guo, J., and Voisin, N.: Evaluating global streamflow simulations by a physically based routing model coupled with the community land model, J. Hydrometeorol., 16, 948–971, https://doi.org/10.1175/JHM-D-14-0079.1, 2015a.
Li, H.-Y., Leung, R. L., Tesfa, T., Voisin, N., Hejazi, M., Liu, L., Liu, Y., Rice, J., Wu, H., and Yang, X.: Modeling stream temperature in the Anthropocene: An earth system modeling approach, J. Adv. Model. Earth Syst., 7, 1661–1679, https://doi.org/10.1002/2015MS000471, 2015b.
Li, H.-Y., Abeshu, G., Zhu, Z., Tan, Z., and Leung, L. R.: A national map of riverine median bed-material particle size over CONUS (Version 1.1), Zenodo [data set], https://doi.org/10.5281/zenodo.4921987, 2021.
Ludwig, W. and Probst, J. L.: A global modelling of the climatic, morphological, and lithological control of river sediment discharges to the oceans, IAHS-AISH Publ., 236, 21–28, 1996.
Luo, X., Li, H.-Y., Leung, L. R., Tesfa, T. K., Getirana, A., Papa, F., and Hess, L. L.: Modeling surface water dynamics in the Amazon Basin using MOSART-Inundation v1.0: impacts of geomorphological parameters and river flow representation, Geosci. Model Dev., 10, 1233–1259, https://doi.org/10.5194/gmd-10-1233-2017, 2017.
Ma, H., Nittrouer, J. A., Naito, K., Fu, X., Zhang, Y., Moodie, A. J., Wang, Y., Wu, B., and Parker, G.: The exceptional sediment load of fine-grained dispersal systems: Example of the Yellow River, China, Sci. Adv., 3, e1603114, https://doi.org/10.1126/sciadv.1603114, 2017.
Ma, H., Nittrouer, J. A., Wu, B., Lamb, M. P., Zhang, Y., Mohrig, D., Fu, X., Naito, K., Wang, Y., Moodie, A. J., Wang, G., Hu, C., and Parker, G.: Universal relation with regime transition for sediment transport in fine-grained rivers, P. Natl. Acad. Sci. USA, 117, 171–176, https://doi.org/10.1073/pnas.1911225116, 2020.
Maavara, T., Chen, Q., Van Meter, K., Brown, L. E., Zhang, J., Ni, J., and Zarfl, C.: River dam impacts on biogeochemical cycling, Nat. Rev. Earth Environ., 1, 103–116, https://doi.org/10.1038/s43017-019-0019-0, 2020.
Manning, R.: On the flow of water in open channels and pipes, Trans. Inst. Civ. Eng. Irel., 20, 161–207, 1891.
McKay, L., Bondelid, T., Dewald, T., Johnston, J., Moore, R., and Rea, A.: NHDPlus Version 2: User Guide, https://nctc.fws.gov/courses/references/tutorials/geospatial/CSP7306/Readings/NHDPlusV2_User_Guide.pdf (last access: 3 February 2022), 2012.
Meade, R. H. and Milliman, J. D.: World-Wide Delivery of River Sediment to the Oceans, J. Geol., 91, 1–21, https://doi.org/10.1086/628741, 1983.
Meade, R. H. and Moody, J. A.: Causes for the decline of suspended-sediment discharge in the Mississippi River system, 1940–2007, Hydrol. Process., 24, 35–49, https://doi.org/10.1002/hyp.7477, 2010.
Mitchell, K. E., Lohmann, D., Houser, P. R., Wood, E. F., Schaake, J. C., Robock, A., Cosgrove, B. A., Sheffield, J., Duan, Q., Luo, L., Higgins, R. W., Pinker, R. T., Tarpley, J. D., Lettenmaier, D. P., Marshall, C. H., Entin, J. K., Pan, M., Shi, W., Koren, V., Meng, J., Ramsay, B. H., and Bailey, A. A.: The multi-institution North American Land Data Assimilation System (NLDAS): Utilizing multiple GCIP products and partners in a continental distributed hydrological modeling system, J. Geophys. Res.-Atmos., 109, D07S90, https://doi.org/10.1029/2003jd003823, 2004.
Mizukami, N., Clark, M. P., Gharari, S., Kluzek, E., Pan, M., Lin, P., Beck, H. E., and Yamazaki, D.: A Vector-Based River Routing Model for Earth System Models: Parallelization and Global Applications, J. Adv. Model. Earth Syst., 13, e2020MS002434, https://doi.org/10.1029/2020MS002434, 2021.
Moodie, A. J., Nittrouer, J. A., Ma, H., Carlson, B. N., Wang, Y., Lamb, M. P., and Parker, G.: Suspended-sediment induced stratification inferred from concentration and velocity profile measurements in the lower Yellow River, China, Water Resour. Res., e2020WR027192, https://doi.org/10.1029/2020wr027192, 2020.
Moragoda, N. and Cohen, S.: Climate-induced trends in global riverine water discharge and suspended sediment dynamics in the 21st century, Global Planet. Change, 191, 103–199, https://doi.org/10.1016/j.gloplacha.2020.103199, 2020.
Morgan, R. P. C.: A simple approach to soil loss prediction: A revised Morgan-Morgan-Finney model, Catena, 44, 305–322, https://doi.org/10.1016/S0341-8162(00)00171-5, 2001.
Morgan, R. P. C. and Duzant, J. H.: Modified MMF (Morgan-Morgan-Finney) model for evaluating effects of crops and vegetation cover on soil erosion, Earth Surf. Proc. Land., 33, 770–785, https://doi.org/10.1002/esp.1530, 2008.
Mosselman, E.: Morphological modelling of rivers with erodible banks, Hydrol. Process., 12, 1357–1370, https://doi.org/10.1002/(SICI)1099-1085(19980630)12:8<1357::AID-HYP619>3.0.CO;2-7, 1998.
Naito, K., Ma, H., Nittrouer, J. A., Zhang, Y., Wu, B., Wang, Y., Fu, X., and Parker, G.: Extended Engelund–Hansen type sediment transport relation for mixtures based on the sand-silt-bed Lower Yellow River, China, J. Hydraul. Res., 57, 770–785, https://doi.org/10.1080/00221686.2018.1555554, 2019.
Nicholas, A. P.: Modelling the continuum of river channel patterns, Earth Surf. Proc. Land., 38, 1187–1196, https://doi.org/10.1002/esp.3431, 2013.
Nienhuis, J. H., Ashton, A. D., Edmonds, D. A., Hoitink, A. J. F., Kettner, A. J., Rowland, J. C., and Törnqvist, T. E.: Global-scale human impact on delta morphology has led to net land area gain, Nature, 577, 514–518, https://doi.org/10.1038/s41586-019-1905-9, 2020.
Nilsson, C., Reidy, C. A., Dynesius, M., and Revenga, C.: Fragmentation and flow regulation of the world's large river systems, Science, 308, 405–408, https://doi.org/10.1126/science.1107887, 2005.
Nittrouer, J. A. and Viparelli, E.: Sand as a stable and sustainable resource for nourishing the Mississippi River delta, Nat. Geosci., 7, 350–354, https://doi.org/10.1038/ngeo2142, 2014.
Nittrouer, J. A., Shaw, J., Lamb, M. P., and Mohrig, D.: Spatial and temporal trends for water-flow velocity and bed-material sediment transport in the lower Mississippi River, Bull. Geol. Soc. Am., 124, 400–414, https://doi.org/10.1130/B30497.1, 2012.
Patil, S., Sivapalan, M., Hassan, M. A., Ye, S., Harman, C. J., and Xu, X.: A network model for prediction and diagnosis of sediment dynamics at the watershed scale, J. Geophys. Res.-Earth, 117, 1–17, https://doi.org/10.1029/2012JF002400, 2012.
Pelletier, J. D.: A spatially distributed model for the long-term suspended sediment discharge and delivery ratio of drainage basins, J. Geophys. Res.-Earth, 117, F02028, https://doi.org/10.1029/2011JF002129, 2012.
Rousseau, Y. Y., Biron, P. M., and Van de Wiel, M. J.: Sensitivity of simulated flow fields and bathymetries in meandering channels to the choice of a morphodynamic model, Earth Surf. Proc. Land., 41, 1169–1184, https://doi.org/10.1002/esp.3885, 2016.
Sadeghi, S. H. and Singh, V. P.: Dynamics of suspended sediment concentration, flow discharge and sediment particle size interdependency to identify sediment source, J. Hydrol., 554, 100–110, https://doi.org/10.1016/j.jhydrol.2017.09.006, 2017.
Schmitt, R. J. P., Bizzi, S., and Castelletti, A.: Tracking multiple sediment cascades at the river network scale identifies controls and emerging patterns of sediment connectivity, Water Resour. Res., 52, 3941–3965, https://doi.org/10.1002/2015WR018097, 2016.
Schmitt, R. J. P., Bizzi, S., Castelletti, A., and Kondolf, G. M.: Improved trade-offs of hydropower and sand connectivity by strategic dam planning in the Mekong, Nat. Sustain., 1, 96–104, https://doi.org/10.1038/s41893-018-0022-3, 2018.
Schuurman, F., Marra, W. A., and Kleinhans, M. G.: Physics-based modeling of large braided sand-bed rivers: Bar pattern formation, dynamics, and sensitivity, J. Geophys. Res.-Earth, 118, 2509–2527, https://doi.org/10.1002/2013JF002896, 2013.
Simon, A. and Darby, S. E.: Process-form interactions in unstable sand-bed river channels: A numerical modeling approach, Geomorphology, 21, 85–106, https://doi.org/10.1016/S0169-555X(97)00043-3, 1997.
Su, C. C., Lu, J. Y., and Hong, J. H.: A field investigation of the sediment transport characteristics of a high sediment load intermittent river in Taiwan, Hydrol. Process., 27, 4043–4056, https://doi.org/10.1002/hyp.9517, 2013.
Sun, J., Lin, B., and Yang, H.: Development and application of a braided river model with non-uniform sediment transport, Adv. Water Resour., 81, 62–74, https://doi.org/10.1016/j.advwatres.2014.12.012, 2015.
Syvitski, J. P. M., Peckham, S. D., Hilberman, R., and Mulder, T.: Predicting the terrestrial flux of sediment to the global ocean: A planetary perspective, Sediment. Geol., 162, 5–24, https://doi.org/10.1016/S0037-0738(03)00232-X, 2003.
Syvitski, J. P. M., Vörösmarty, C. J., Kettner, A. J., and Green, P.: Impact of humans on the flux of terrestrial sediment to the global coastal ocean, Science, 308, 376–380, https://doi.org/10.1126/science.1109454, 2005.
Tan, Z., Leung, L. R., Li, H.-Y., and Tesfa, T.: Modeling sediment yield in land surface and Earth system models: Model comparison, development, and evaluation, J. Adv. Model. Earth Syst., 10, 2192–2213, 2018.
Tan, Z., Leung, R. L., Li, H.-Y., Tesfa, T., Zhu, Q., and Huang, M.: A substantial role of soil erosion in the land carbon sink and its future changes, Global Change Biol., 26, 2642–2655, https://doi.org/10.1111/gcb.14982, 2020.
Tan, Z., Leung, L. R., Li, H. Y., Tesfa, T., Zhu, Q., Yang, X., Liu, Y., and Huang, M.: Increased extreme rains intensify erosional nitrogen and phosphorus fluxes to the northern Gulf of Mexico in recent decades, Environ. Res. Lett., 16, 054080, https://doi.org/10.1088/1748-9326/abf006, 2021.
Tsuruta, K., Hassan, M. A., Donner, S. D., and Alila, Y.: Development and Application of a Large-Scale, Physically Based, Distributed Suspended Sediment Transport Model on the Fraser River Basin, British Columbia, Canada, J. Geophys. Res.-Earth, 123, 2481–2508, https://doi.org/10.1029/2017JF004578, 2018.
Van Der Wegen, M. and Roelvink, J. A.: Long-term morphodynamic evolution of a tidal embayment using a two-dimensional, process-based model, J. Geophys. Res.-Oceans, 113, C03016, https://doi.org/10.1029/2006JC003983, 2008.
Van Oost, K., Quine, T. A., Govers, G., De Gryze, S., Six, J., Harden, J. W., Ritchie, J. C., McCarty, G. W., Heckrath, G., Kosmas, C., Giraldez, J. V., Marques Da Silva, J. R., and Merckx, R.: The impact of agricultural soil erosion on the global carbon cycle, Science, 318, 626–629, https://doi.org/10.1126/science.1145724, 2007.
van Rijn, L.C., 1989. Sediment Transport by Currents and Waves, Report H461, Technical Report, Delft Hydraulics, Delft, 1989.
Voisin, N., Li, H., Ward, D., Huang, M., Wigmosta, M., and Leung, L. R.: On an improved sub-regional water resources management representation for integration into earth system models, Hydrol. Earth Syst. Sci., 17, 3605–3622, https://doi.org/10.5194/hess-17-3605-2013, 2013a.
Voisin, N., Liu, L., Hejazi, M., Tesfa, T., Li, H., Huang, M., Liu, Y., and Leung, L. R.: One-way coupling of an integrated assessment model and a water resources model: evaluation and implications of future changes over the US Midwest, Hydrol. Earth Syst. Sci., 17, 4555–4575, https://doi.org/10.5194/hess-17-4555-2013, 2013b.
Vörösmarty, C. J., Meybeck, M., Fekete, B., Sharma, K., Green, P., and Syvitski, J. P. M.: Anthropogenic sediment retention: Major global impact from registered river impoundments, Global Planet. Change, 39, 169–190, https://doi.org/10.1016/S0921-8181(03)00023-7, 2003.
Wang, W., Li, H.-Y., Leung, L. R., Yigzaw, W., Zhao, J., Lu, H., Deng, Z., Demisie, Y., and Blöschl, G.: Nonlinear Filtering Effects of Reservoirs on Flood Frequency Curves at the Regional Scale, Water Resour. Res., 53, 8277–8292, https://doi.org/10.1002/2017WR020871, 2017.
White, M. J., Santhi, C., Kannan, N., Arnold, J. G., Harmel, D., Norfleet, L., Allen, P., DiLuzio, M., Wang, X., Atwood, J., Haney, E., and Johnson, M. V.: Nutrient delivery from the Mississippi River to the Gulf of Mexico and effects of cropland conservation, J. Soil Water Conserv., 69, 26–40, https://doi.org/10.2489/jswc.69.1.26, 2014.
Wieczorek, M. E., Jackson, S. E., and Schwarz, G. E.: Select Attributes for NHDPlus Version 2.1 Reach Catchments and Modified Network Routed Upstream Watersheds for the Conterminous United States (ver. 3.0, January 2021): US Geological Survey data release, https://doi.org/10.5066/F7765D7V, 2018.
Wiele, S. M., Graf, J. B., and Smith, J. D.: Sand deposition in the Colorado River in the Grand Canyon from flooding of the Little Colorado River, Water Resour. Res., 32, 3579–3596, https://doi.org/10.1029/96WR02842, 1996.
Wise, D. R., Rinella III, F. A., Rinella, J. F., Fuhrer, G. J., Embrey, S. S., Clark, G. E., Schwarz, G. E., and Sobieszczyk, S.: Nutrient and Suspended-Sediment Transport and Trends in the Columbia River and Puget Sound Basins, 1993–2003, US Geological Survey Scientific Investigations Report 2007-5186, US Geological Survey, 117 pp., 2007.
Wu, H., Kimball, J. S., Mantua, N., and Stanford, J.: Automated upscaling of river networks for macroscale hydrological modeling, Water Resour. Res., 47, W03517, https://doi.org/10.1029/2009WR008871, 2011.
Wu, H., Kimball, J. S., Li, H.-Y., Huang, M., Leung, L. R., and Adler, R. F.: A new global river network database for macroscale hydrologic modeling, Water Resour. Res., 48, W03517, https://doi.org/10.1029/2012WR012313, 2012.
Wu, W. and Wang, S. S. Y.: Formulas for Sediment Porosity and Settling Velocity, J. Hydraul. Eng., 132, 858–862, https://doi.org/10.1061/(asce)0733-9429(2006)132:8(858), 2006.
Wu, W., Wang, S. S. Y., and Jia, Y.: Nonuniform sediment transport in alluvial rivers, J. Hydraul. Res., 38, 427–434, https://doi.org/10.1080/00221680009498296, 2000.
Wu, W., Shields, F. D., Bennett, S. J., and Wang, S. S. Y.: A depth-averaged two-dimensional model for flow, sediment transport, and bed topography in curved channels with riparian vegetation, Water Resour. Res., 41, W03015, https://doi.org/10.1029/2004WR003730, 2005.
Zhang, R. and Xie, J.: Sedimentation Research in China: Systematic Selections, China Water and Power Press, 260 pp., ISBN 7120019430, 9787120019433, 1993.