the Creative Commons Attribution 4.0 License.
the Creative Commons Attribution 4.0 License.
 | 20 Dec 2022
Significant regime shifts in historical water yield in the Upper Brahmaputra River basin
Baoying Shan
Akash Koppa
Feng Zhong
Dongfeng Li
Xuanxuan Wang
Wenfeng Liu
Xiuping Li
Zongxue Xu
Although evidence of the hydrological response of watersheds to climate change is abundant, reliable assessments of water yield (WY) over mountainous regions, such as the Upper Brahmaputra River (UBR) basin, remain unclear. Here, we examine long-term WY changes during 1982–2013 in the UBR basin, based on multi-station runoff observations. We find that there are significant shifts in hydrological regimes in the late 1990s; WY increases in the range of ∼10 % to ∼80 %, while the directions reverse from increasing to decreasing. Additionally, the double mass curve (DMC) technique is used to assess the effects of climate, vegetation, and cryosphere on WY changes. Results show that cryosphere and climate together contribute to over 80 % of the increase in WY across the entire UBR basin, while the role of vegetation is negligible. The combined effects, however, are either offsetting or additive, thus leading to slight or substantial magnitude increases, respectively. The downward WY trend has primarily been regulated by decreased precipitation in recent years. However, we find that meltwater may alleviate the resulting water shortage in some basins. Therefore, the combined effects of climate and cryosphere on WY should be considered in future water resources management over mountainous basins, particularly involving co-benefits between upstream and downstream regions.
- Article
(4070 KB) - Full-text XML
-
Supplement
(4687 KB) - BibTeX
- EndNote


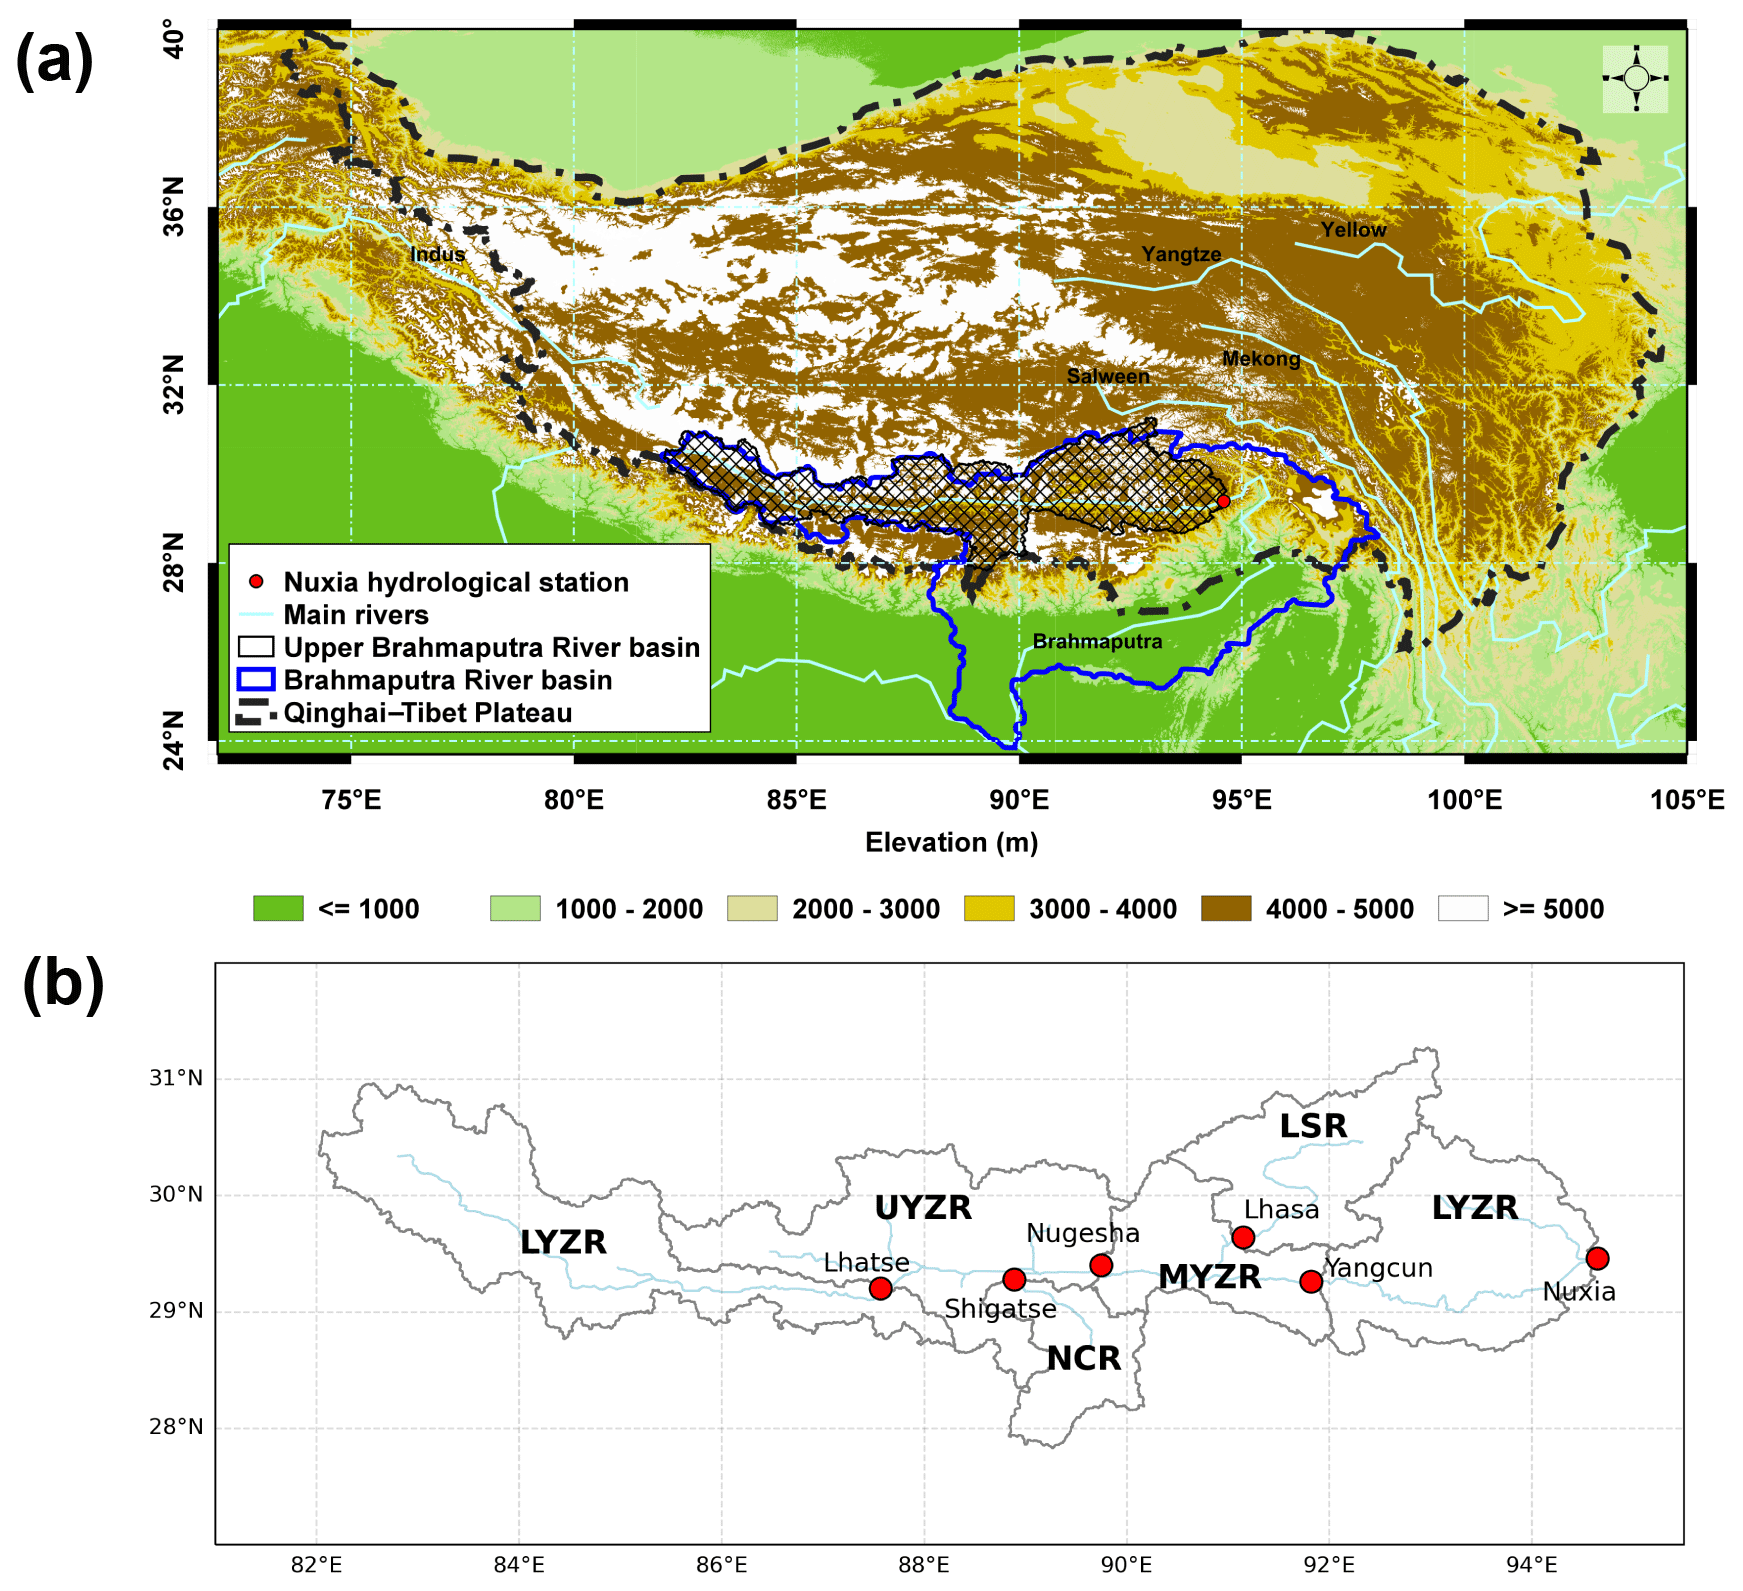
Water yield (or runoff depth; WY) in mountainous watersheds is crucial for sustaining fragile ecosystems in headwaters, supplying valuable freshwater resources to downstream lowlands, and balancing co-benefits between upstream and downstream areas, especially in large transboundary river systems (Viviroli et al., 2011). In mountainous watersheds, WY changes have been attributed to climate variability (Dierauer et al., 2018; Song et al., 2021), vegetation greening or browning (Goulden and Bales, 2014; Zhou et al., 2021), and glaciers and snow melting (Huss and Hock, 2018; Biemans et al., 2019). These changes are expected to alter the spatial and temporal distribution of water resources (Tang et al., 2019) and further threaten the water supply and food security downstream (Biemans et al., 2019). The Qinghai–Tibet Plateau (QTP; see Fig, 1a), also known as the Asian water tower, supplies water to major rivers in Asia, such as the Brahmaputra, Salween, Mekong, Yangtze, Yellow, and Indus rivers (Kang et al., 2010; Yao et al., 2010, 2019). Therefore, WY changes over this region significantly affect water availability and terrestrial and aquatic ecosystems, which are vital for sustaining the livelihoods of approximately 2 billion people (Immerzeel et al., 2010). Despite some in situ observations and estimates from state-of-the-art remote sensing (Wang et al., 2021), total river runoff has never been reliably assessed in this region, and its response to global warming remains unclear. Therefore, comprehensively assessing long-term changes in WY, particularly magnitude and direction, is of great importance for the sustainable development of water resources in the QTP (Yao et al., 2019).
In recent years, WY has been significantly affected by multiple factors in the QTP. For example, Fan and He (2015) highlighted the important role of precipitation in WY increases in the Salween River basin and Mekong River basin. Li et al. (2020) found that elevated precipitation and meltwater both contributed to substantial WY increases in the Tuotuo River basin. Similarly, Lutz et al. (2014) projected that the increased precipitation near the Salween and Mekong rivers and the accelerated meltwater near the Indus River caused significant WY changes. Vegetation changes have also proven to be vital for mountainous water resources. Li et al. (2017) showed that evaporation, mostly due to grassland restoration, decreased WY in the Yangtze River basin. Furthermore, Li et al. (2021) suggested that vegetation greening may change the seasonality of water resources and increase WY during the dry season in the Upper Brahmaputra River (UBR) basin.
Although a growing body of evidence has shown that WY is significantly changing in the QTP, most previous studies focus on individual basins, which may not fully reveal the spatial variability in WY. Of specific interest is the Upper Brahmaputra River (UBR; see Fig. 1b) basin, which covers an area of over 198 636 km2 and has large gradients in elevation, which has influenced climate and vegetation patterns (Li et al., 2019b; Gao et al., 2018). Hence, it is imperative to provide a comprehensive, spatially differentiated study on long-term WY changes in this region. Such studies in the UBR basin, however, are significantly hindered by the sparse network of hydrological observation stations (Li et al., 2019b; Wang et al., 2021; Yao et al., 2019), which leads to large uncertainties in river flow predictions and, thus, water resources assessments. Also, current precipitation estimates are highly uncertain, owing to the complex topography of this region, which limits the ability to accurately model the relationships between precipitation and runoff (Sun and Su, 2020). Last, the current inadequate understanding of hydrological responses to complex interactions among multi-spheres limits the application of hydrological models in these mountainous watersheds (Pellicciotti et al., 2012). In this regard, long-term observed runoff records and recent high-resolution precipitation data in the UBR basin provide a valuable opportunity to estimate runoff responses to warming using statistical methods.
This study uses the double mass curve (DMC) technique to jointly assess historical WY responses to climate warming and the associated environmental changes in the UBR basin. To do this, we collect multi-station runoff observations and detect long-term WY changes during 1982–2013. Then, we use the DMC method to estimate the effects of climate (represented by effective precipitation, P−E, or eP), vegetation (represented by leaf area index – LAI), and cryosphere (e.g., meltwater from glaciers and snow) on the magnitude and direction changes in WY (see Sect. 2). This study is expected to provide essential information for water resources management in the UBR basin and other mountainous watersheds.
2.1 Study area
The Brahmaputra River (known as the Yarlung Zangbo River, or YZR, in China), a transboundary river in the southern QTP, originates in the Gyama Langdzom Glacier and flows across China, India, and Bangladesh before emptying into the Indian Ocean. The UBR basin is located above the Nuxia hydrological station (Fig. 1), and its river flow has significant implications for the freshwater resources of South Asia. Here, we divide the UBR basin into the headstream (HYZR), upstream (UYZR), midstream (MYZR), downstream (LYZR), Nianchu River (NCR) basin, and Lhasa River (LSR) basin by the locations of hydrological stations (Table 1 and Fig. 1b).
Table 1Information of six basins divided according to the locations of hydrological stations. The column Tp indicates the turning point, calculated using the Pettitt method, in which a significant turning point is labeled with an asterisk*. Glaciers and snow coverage are derived from the land use and cover data in 2000 (see Sect. 2.2). The unit of area is kilometers squared (km2), and the unit of elevation is meters (m).
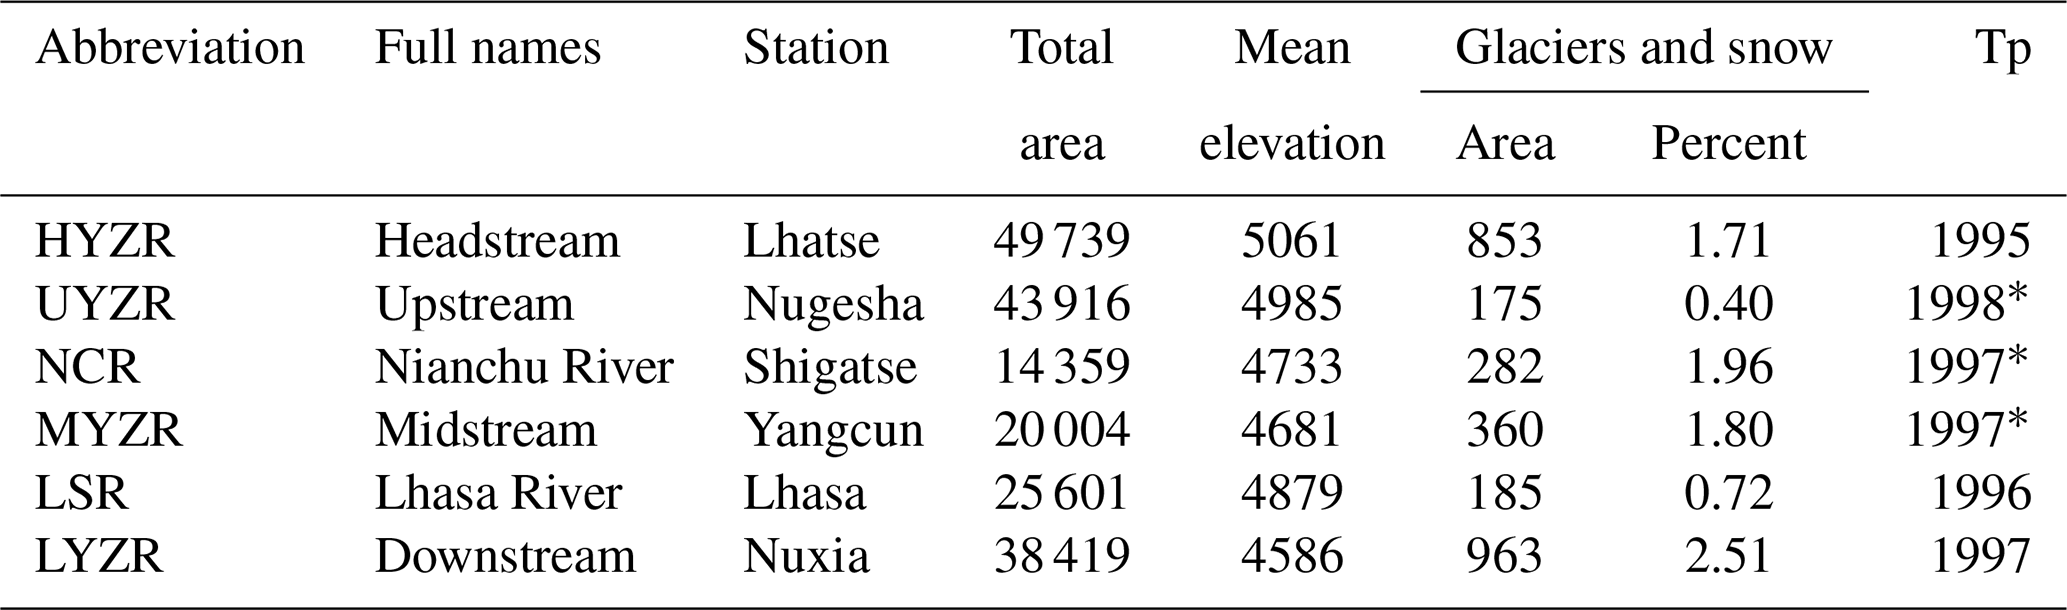
The elevation gradient and the distance to the ocean in the UBR basin together contribute to a large spatial variability in climate (Sang et al., 2016). The annual precipitation in the HYZR basin is less than 400 mm, while that in the LYZR basin is nearly 1000 mm. Similarly, the annual evaporation increases gradually from upstream to downstream areas (Fig. S1a and b). Meanwhile, water and energy availability modulate vegetation conditions (Li et al., 2019a). Vegetation cover increases dramatically from the HYZR to the LYZR basin (Fig. S1c). Additionally, cryospheric meltwater due to atmospheric warming has substantially altered hydrological conditions in this region (Cuo et al., 2019; Yao et al., 2010; Wang et al., 2021).
2.2 Data
Here, we collect multi-station annual runoff observations from 1982 to 2013 and convert the river flow (m3 s−1) into runoff depth (mm). In addition, we acquire high-resolution climate and vegetation data over the same time period and further aggregate these gridded datasets into annual values regionally by considering area-weighted effects (their temporal changes are shown in Fig. S2).
2.2.1 Runoff data
Annual runoff observations between 1982 and 2013 used here come from six hydrological stations along the mainstream and major branches in the UBR basin. WY in the HYZR is equal to the runoff depth at Lhatse station, while WY in other basins is calculated by the difference between runoff depth from the downstream station and that from the upstream and branch stations. For example, WY in the MYZR basin is equal to the difference between runoff depth in Yangcun station and that in Lhasa and Nugesha stations (Fig. 1b).
2.2.2 Climate data
The most recent 10 km gridded daily precipitation data, combining topographic and linear correction approaches based on 262 rain gauge observations, is developed for the UBR basin by Sun and Su (2020) and here used to estimate regional annual precipitation (P). The maximum 2 m air temperature is obtained from China Meteorological Forcing Dataset (He et al., 2020). The evaporation (E) with a 0.25∘ spatial resolution is acquired from Global Land Evaporation Amsterdam Model (GLEAM) version 3.5a (Martens et al., 2017). GLEAM evaporation has been validated in different biome types in China and has shown high correlations with in situ eddy covariance E (Yang et al., 2017).
2.2.3 Vegetation data
Leaf area index (LAI) used in this study is obtained from Global Inventory Modeling and Mapping Studies (GIMMS) LAI3g, with a spatial resolution of 8 km (Zhu et al., 2013). The product is generated using an artificial neural network trained on the collection Terra Moderate Resolution Imaging Spectroradiometer (MODIS) LAI product and the latest version of GIMMS NDVI3g data for the same period, which has been proven to have an improved multi-sensor record harmonization scheme compared to other global LAI products (Forzieri et al., 2020; Gonsamo et al., 2021; Zhu et al., 2016).
2.2.4 Land use and cover
The land use and cover in 2000, with a spatial resolution of 1 km, is used to represent the land cover types in the UBR basin. The data are acquired from the Resource and Environmental Science Data Center and are here divided into seven primary land use types, including cultivated land, forestland, grassland, waterbody, urban land, unused land, and glaciers and snow (Fig. S3).
2.3 Methodology
2.3.1 Trend and turning point analysis
In this study, we use the non-parametric Mann–Kendall test (Kendall, 1938; Mann, 1945), to identify the trend in WY, and Pettitt change detection (Pettitt, 1979), to identify the turning point (Tp) in WY, where the level of significance is set at 0.05. The Pettitt method has the advantages of being non-parametric, rank-based, and distribution-free for finding the turning point in a time series. We then compare the averages of WY before and after Tp to reflect the changes in magnitude and compare the trends in the two periods to represent the direction changes.
2.3.2 Double mass curve technique
The DMC used here is a plot of the cumulative data of one variable versus the cumulative data of another related variable in a concurrent period. It has previously been used to assess the individual effect of climate (Gao et al., 2011), forest disturbance (Wei and Zhang, 2010), wildfire (Hallema et al., 2018), and cryosphere (Brahney et al., 2017) on water resources. For the large and pristine UBR and other mountainous basins, climate, vegetation, and cryosphere (meltwater from glaciers and snow under warming; see Biemans et al., 2019; Huss and Hock, 2018) play important roles in the water cycle, and these three components must be considered together to accurately estimate the hydrological response to warming. It is difficult to directly calculate the supply of meltwater to WY due to the lack of long-term glacier monitoring. On the other hand, runoff observations and high-resolution climate and vegetation data make it possible to use the DMC technique, a data-driven statistical method, to estimate cryospheric contributions to WY.
Appropriate selection of climate and vegetation indices used in the DMC technique is of great importance. Previous studies have shown that effective precipitation (P−E; eP) can adequately represent the impact of climate on WY compared to individual estimates of P or E (Wei and Zhang, 2010; Zhang et al., 2019). LAI quantifies the amount of leaf area in an ecosystem and is an important variable reflecting vegetation structures and biophysical processes (Forzieri et al., 2020), and Li et al. (2021) have used LAI to investigate vegetation effects on seasonal hydrology in the UBR basin. Hence, we consider eP and LAI as being the indices of climate and vegetation, respectively, and use their time series as the inputs in the DMC model.
To obtain cryospheric contributions to WY, we firstly build two types of DMC plots (see Fig. S4) to assess the contributions of climate and vegetation and then subtract the sum of estimated contributions from total WY deviations as cryospheric effects (results are shown in Fig. S5). The mathematical formulas, relevant descriptions, and an example (Fig. 2) are as follows.
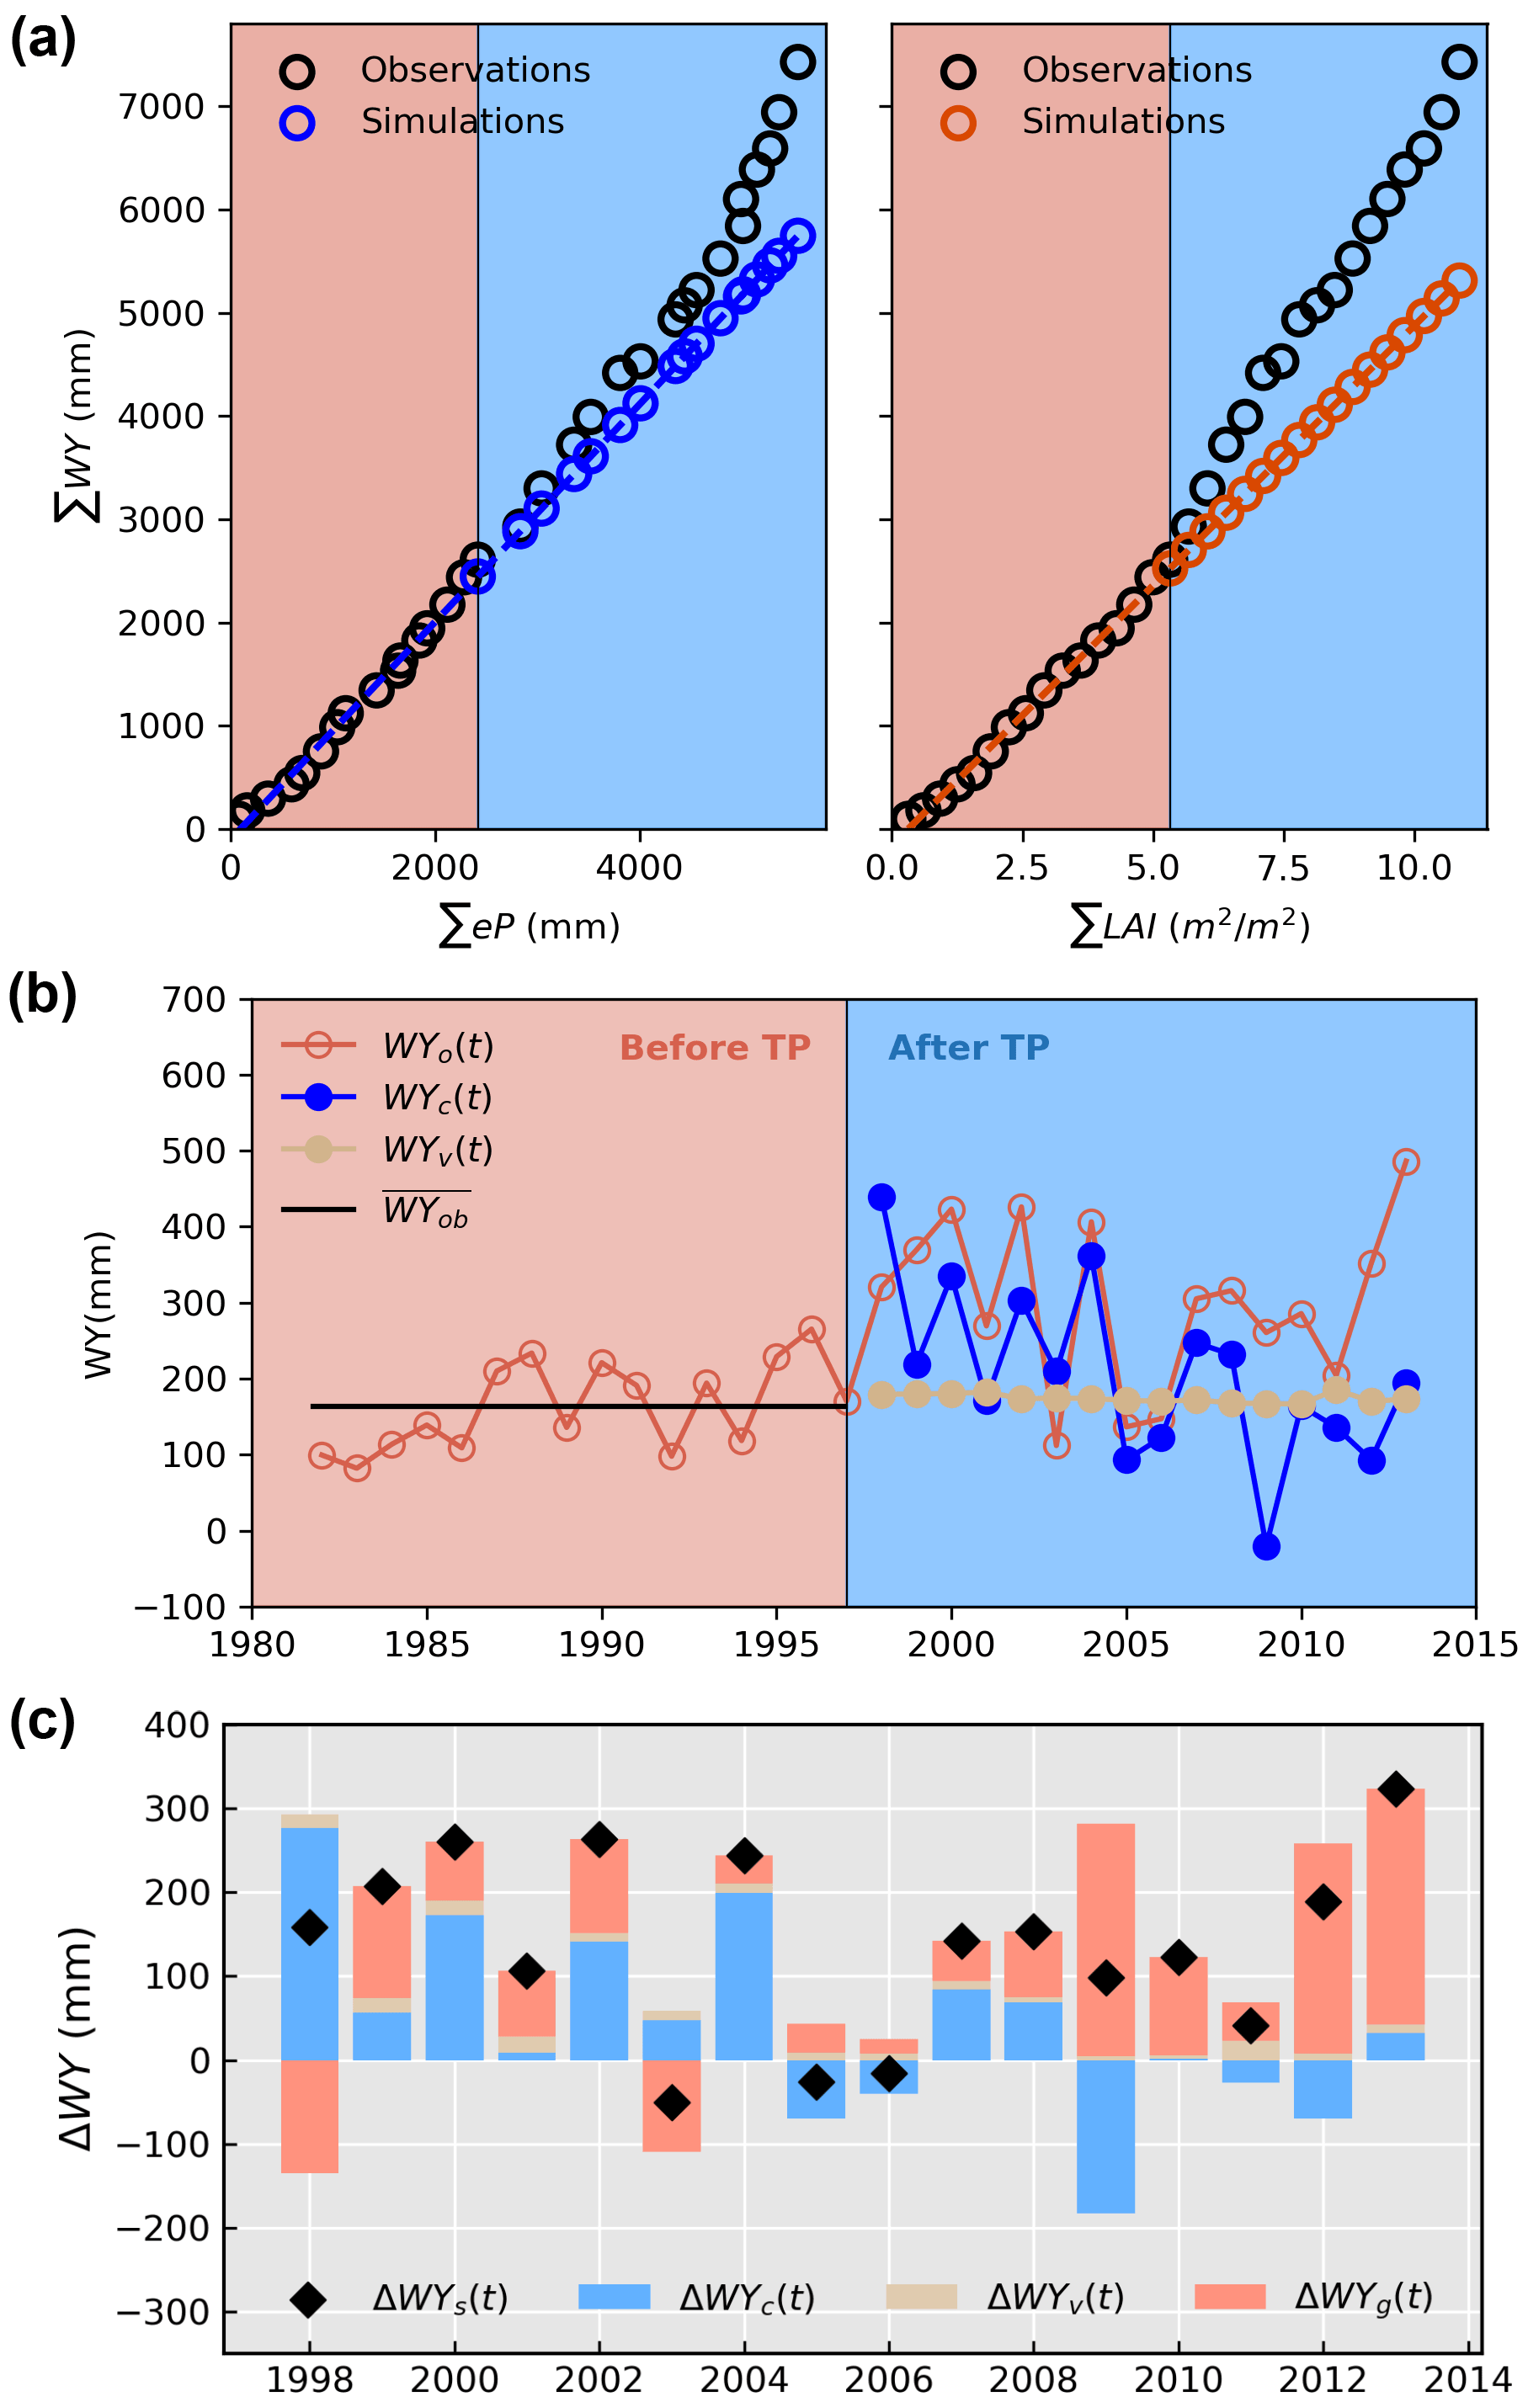
Figure 2The example showing how to estimate the effects of climate, vegetation, and cryosphere on water yield in the MYZR basin (see details in Sect. 2.3), where Tp is 1997.
First, the average WY before Tp (; horizontal black line in Fig. 2b) is defined as follows:
Next, the total WY deviation (ΔWYs(t); black diamond in Fig. 2c) can be calculated as the difference between WY observations after Tp (WYo(t); red point in Fig. 2b) and the average WY before Tp (), as follows:
Second, the regression equation (left panel in Fig. 2a) between the cumulative eP (∑eP) and cumulative WY (∑WY) before Tp can be constructed as follows:
Similarly, the regression equation (right panel in Fig. 2a) between cumulative LAI (∑LAI) and cumulative water yield (∑WY) before Tp can be constructed as follows:
Third, WY driven by climate (WYc(t); blue line in Fig. 2b) can be calculated by using the cumulative eP after Tp as input into Eq. (3), which is built using the cumulative data of WY and eP before Tp. Therefore, WY deviations caused by climate change (ΔWYc(t); blue bar in Fig. 2c) can be calculated as follows:
Similarly, WY driven by vegetation (WYv(t); tan line in Fig. 2b) can be calculated via Eq. (4), and WY deviation caused by vegetation (ΔWYv; tan bar in Fig. 2c) can be calculated as follows:
Finally, WY deviation caused by cryosphere (ΔWYg; red bar in Fig. 2c) can be calculated as follows:
2.3.3 Attribution analysis on changes in water yield
The average contributions of climate, vegetation, and cryosphere to WY magnitude changes are calculated as follows:
The relative contribution (RC), ranging from 0 to 1, of climate, vegetation, and cryosphere can be calculated as follows:
Additionally, we use the Pearson correlation coefficient (r) to quantify the relationships between total WY deviation (ΔWYs(t)) and its components, where the WY deviation is caused by climate (ΔWYc(t)), vegetation (ΔWYv(t)), and cryosphere (ΔWYg(t)). The Student's t test with the Bonferroni correction (Bonferroni, 1935) is used to detect the statistical significance of the correlation coefficient at the level of 0.05.
3.1 Long-term changes in historical water yield
The detection of long-term WY changes in the UBR basin from 1982 to 2013 is illustrated in Fig. 3. There is a high degree of spatial variability in WY (Fig. 3a) across the entire basin. The average WY is the highest in the LYZR basin (over 600 mm), followed by that in the LSR basin (nearly 400 mm). However, the average WY in the HYZR and NCR basins is less than 100 mm. This spatial variability is consistent with that of precipitation (Fig. S6), which is mainly determined by elevation and distance to the ocean (Sang et al., 2016). In addition, WY generally increases during the period, as shown by the positive slope in Fig. 3b, even though the significant trend is only detected in the UYZR and MYZR basins (hatched areas in Fig. 3b). Tp mainly occurs during the late 1990s (Fig. 3c), but the abrupt change detected in some basins is not statistically significant (Table 1). Similarly, the cumulative anomaly curve (Fig. 3d) shows that WY decreases prior to the late 1990s and then increases in the entire UBR basin, which further supports the results obtained from the Pettitt method.
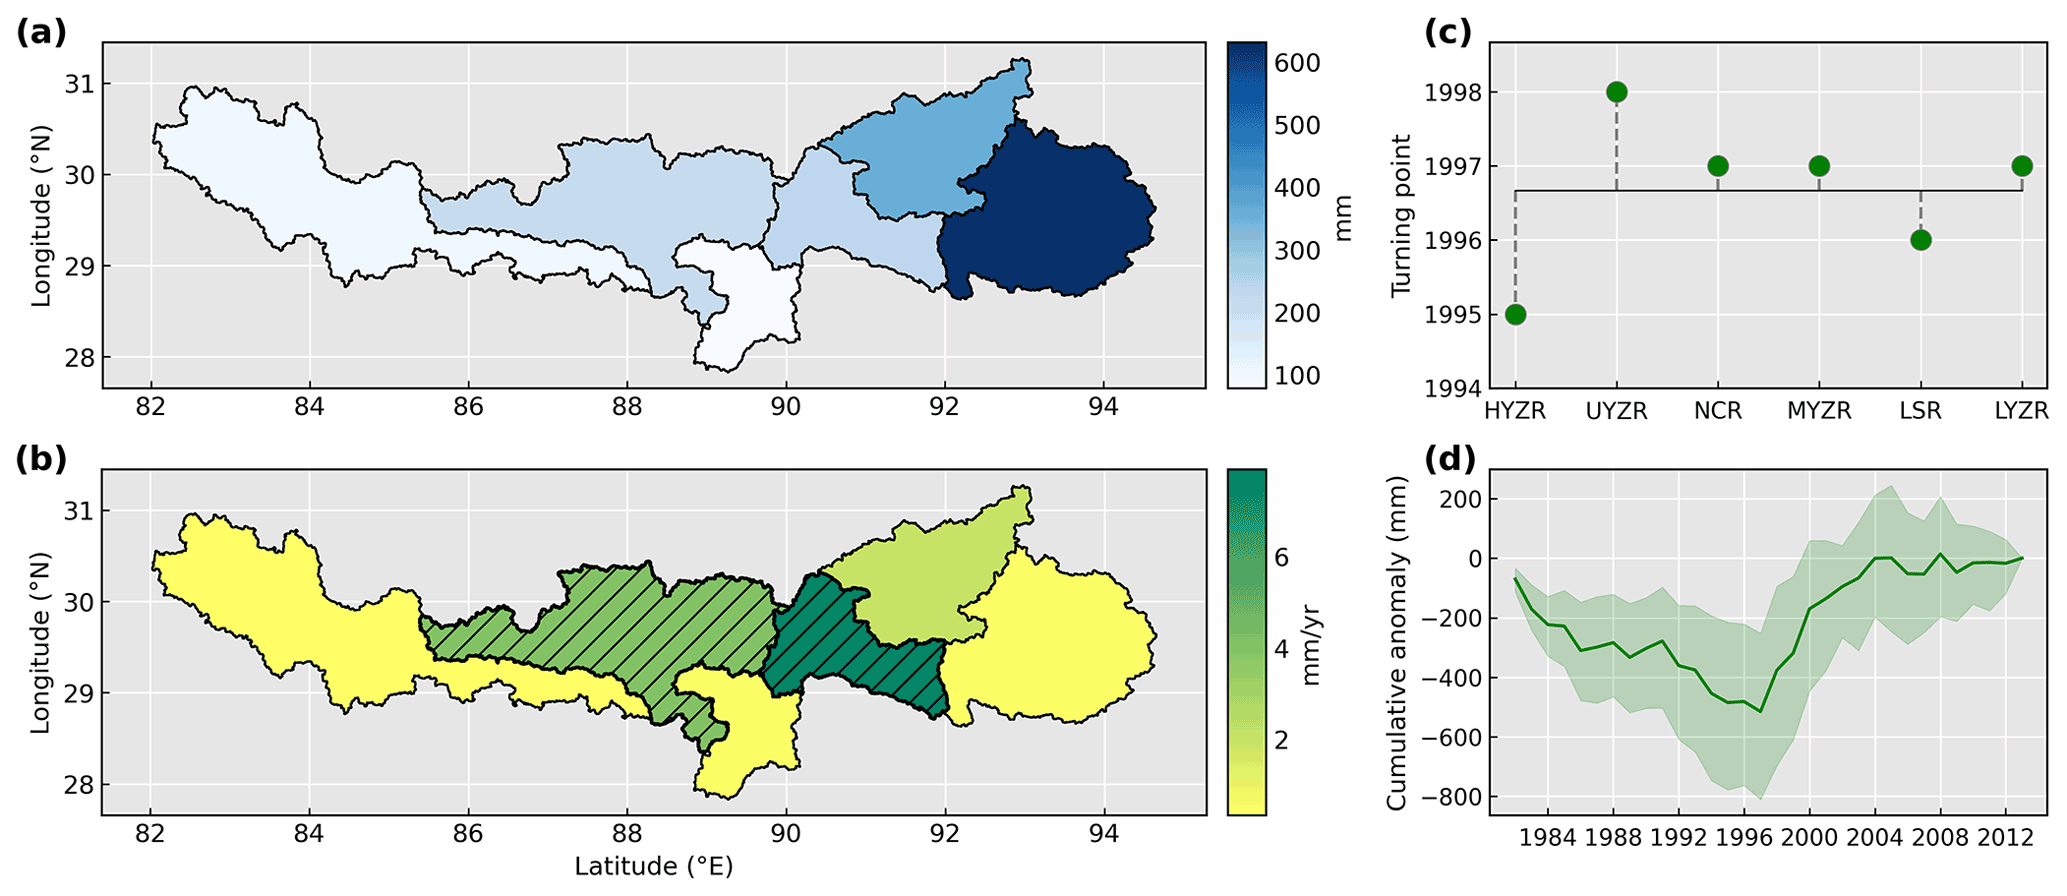
Figure 3Long-term water yield changes in the entire UBR basin. (a) The annual values calculated by averaging water yield from 1982 to 2013. (b) The temporal trends detected by the Mann–Kendall Sen's slope method. The black hatching represents statistically significant (p<0.05) trends. (c) The turning points detected by the Pettitt method. (d) The cumulative anomaly curve of water yield. The solid green line represents the ensemble expectation of cumulative anomaly curves of water yield in the entire UBR basin (green shading).
3.2 Regime shifts in historical water yield
Based on the results of the abrupt detection, we divide the period from 1982 to 2013 into the before and after Tp period and analyze the magnitude and direction of WY changes in the entire UBR basin. Figure 4a shows that WY increases from 9.5 to 130.9 mm, with a high spatial variability. The slight increase observed in the HYZR and LYZR basins accounts for less than 10 % of the mean WY before Tp, while a substantial WY increase of 61.6 % and 80.5 % is found in the UYZR and MYZR basins, respectively. In addition, higher variability is detected after Tp, suggesting a more dramatic variation in recent years. With respect to the direction of change in WY, we find that the trend is positive before Tp but becomes negative afterward in most basins (Figs. 4b and S2). The significantly decreasing trend is detected in the UYZR, NCR, and LSR basins. In contrast, although the WY in the MYZR basin increases during two periods, the rate has slowed; the positive trend after Tp (3.64 mm yr−1; p>0.05) is less than that before Tp (8.95 mm yr−1; p<0.05). Overall, WY regime shifts occur in the late 1990s in the entire UBR basin because the magnitude generally increases, but the direction of WY has reversed or slowed.
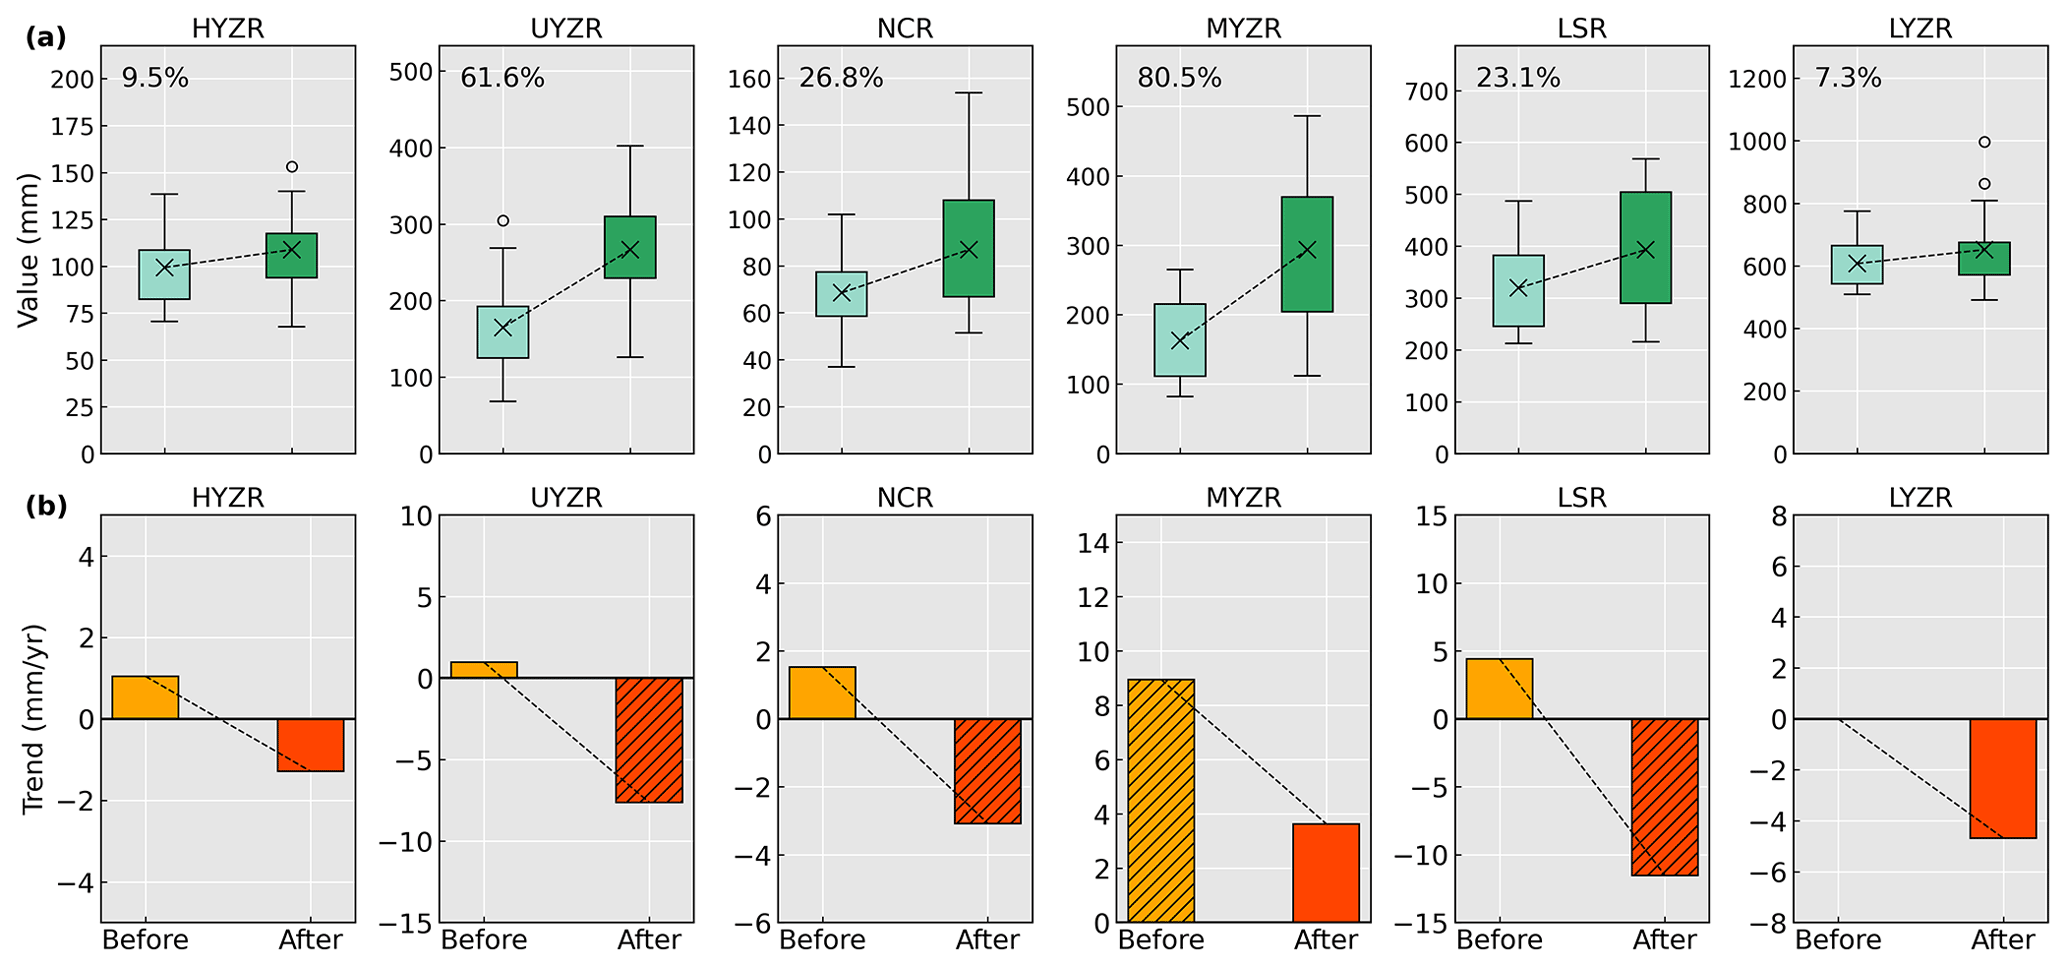
Figure 4Water yield regime shifts in the entire UBR basin. (a) Magnitude of water yield changes. The black cross (x) shows the mean of the water yield, and the relative change is labeled in number (%) in each box plot. (b) Direction of water yield changes. The black hatching represents the statistically significant trend (p<0.05). The color of the boxes represents the period before (light color) and after (dark color) the Tp period.
3.3 Attribution analysis of magnitude increases in water yield
In Fig. 5, we quantify the contributions from climate (eP), vegetation (LAI), and cryosphere on WY magnitude increases in the entire UBR basin. We find that cryosphere changes, on average, contribute to over half of the WY increases in the HYZR, UYZR, NCR, and MYZR basins. However, climate plays a more important role in WY magnitude increases in the LSR and LYZR basins, with average relative contributions of 55.4 % and 46.0 %, respectively. In contrast to the dominant roles of climate and cryosphere, vegetation has a consistently positive contribution to the WY increases, although its relative contribution is much less than those from climate and cryosphere.
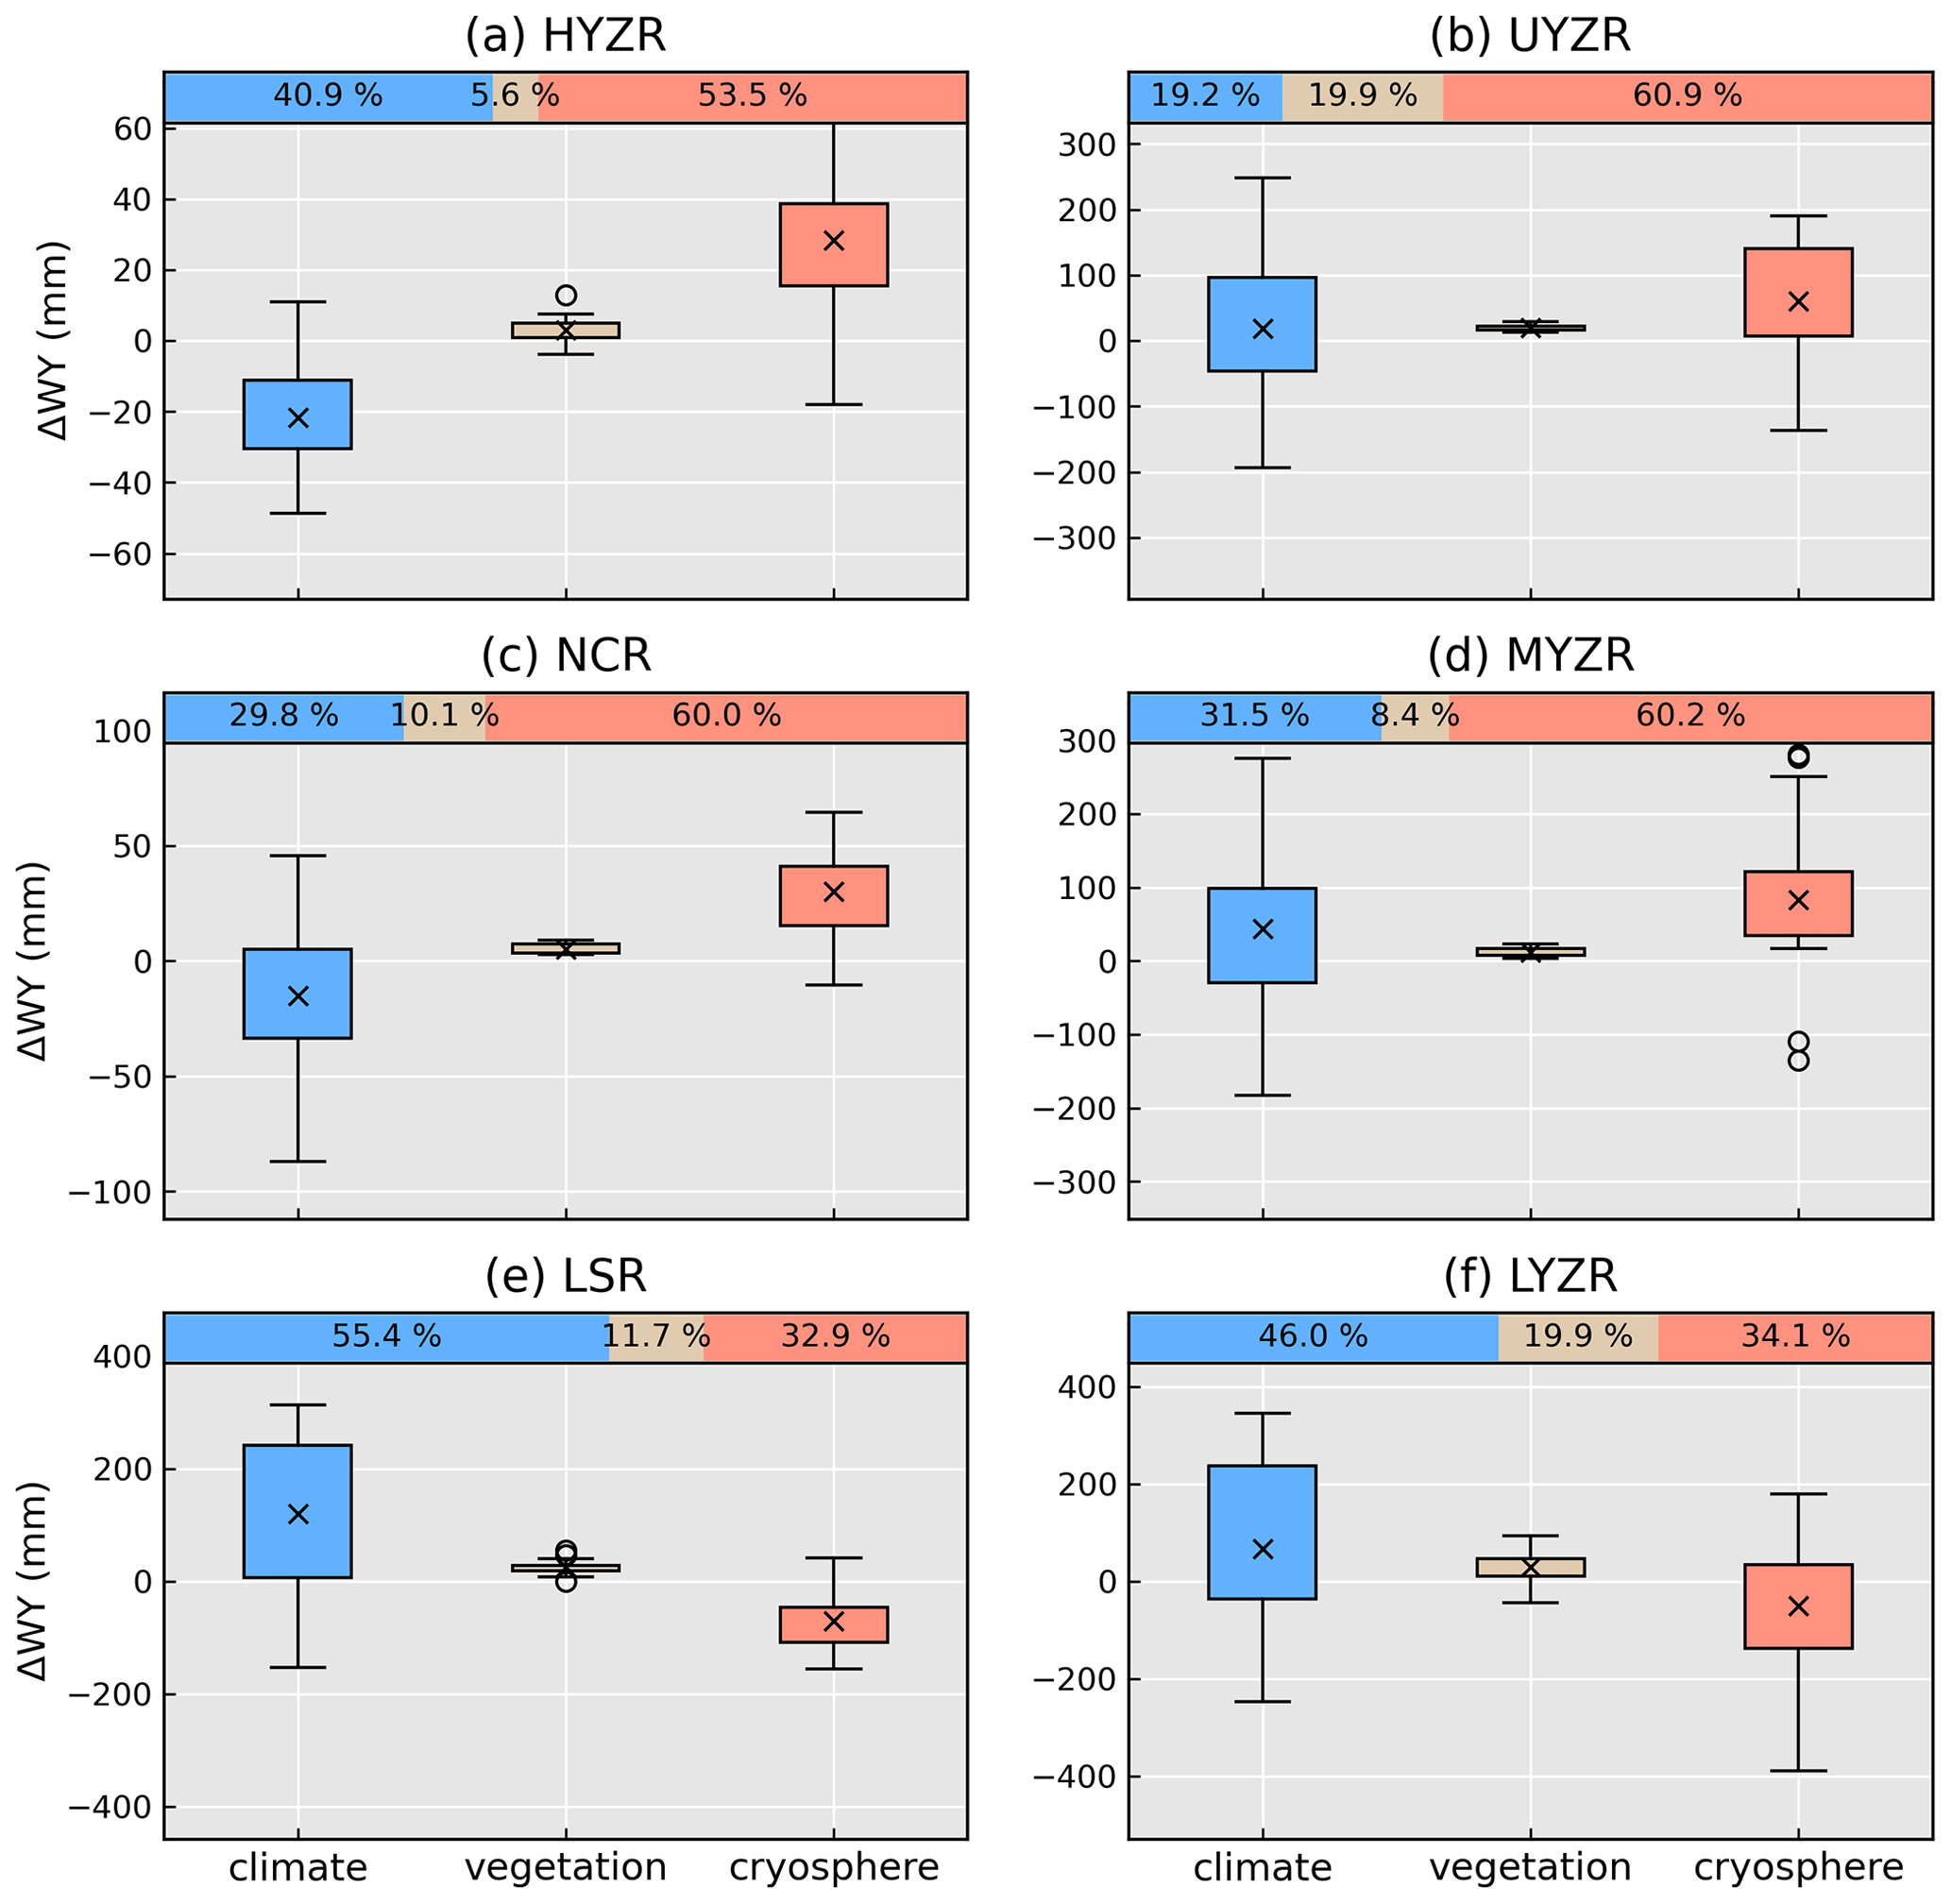
Figure 5Attribution analysis of magnitude increases in water yield due to climate (ΔWYc; blue box), vegetation (ΔWYv; tan box), and cryosphere (ΔWYg; red box) and their relative contributions (the bar with colors on the top) in each basin. The black cross (x) shows the average of water yield deviations (see Fig. S5) in each box plot.
Climate and cryosphere – two important factors affecting WY – together contribute to over 80 % of the average increases in WY magnitudes over the entire UBR basin. However, they play either additive or offsetting roles in different basins (Fig. 5) and thus result in slight or substantial WY increases (Fig. 4a). For example, although cryospheric changes contribute to an increase in WY in the HYZR (28.3 mm) and NCR basins (30.3 mm; black cross (x) in Fig. 5a and c), the negative contributions from climate offset a considerable part of these increases, leading to only slight increase in WY after Tp in these regions. Similarly, the positive contribution from climate offsets the negative contribution from cryosphere in the LSR and LYZR basins, which also results in a slight WY increase. In addition, the additive effects from climate and cryosphere lead to substantial increases in WY, from 162.6 to 293.5 mm in the MYZR basin and from 164.9 to 266.5 mm in the UYZR basin (Fig. 4a).
3.4 Attribution analysis of direction shifts in water yield
The Pearson correlation coefficient is applied to determine the role of climate, vegetation, and cryosphere in the reversal or slowing of WY trends after Tp, as shown in Fig. 4b. Results in Fig. 6 show that, although the correlation varies greatly across basins ranging from 0.11 to 0.93 after Tp, the climate typically is positively associated with total WY, for which the correlation is significant in half of the basins (p<0.05), again revealing the major role of climate in influencing the hydrological trends across the entire UBR basin. Further analysis shows that precipitation is much more important because it exhibits a stronger reversal in trend compared with the trend in evaporation (Fig. S7), which is also similar to the directional changes in WY (Fig. 4b). Additionally, despite the weak contribution of vegetation (Fig. 5), its positive role in WY changes is more apparent in the drier basins (such as the HYZR, UYZR, and NCR basins), while the correlation is negative in the relatively humid LYZR basin.
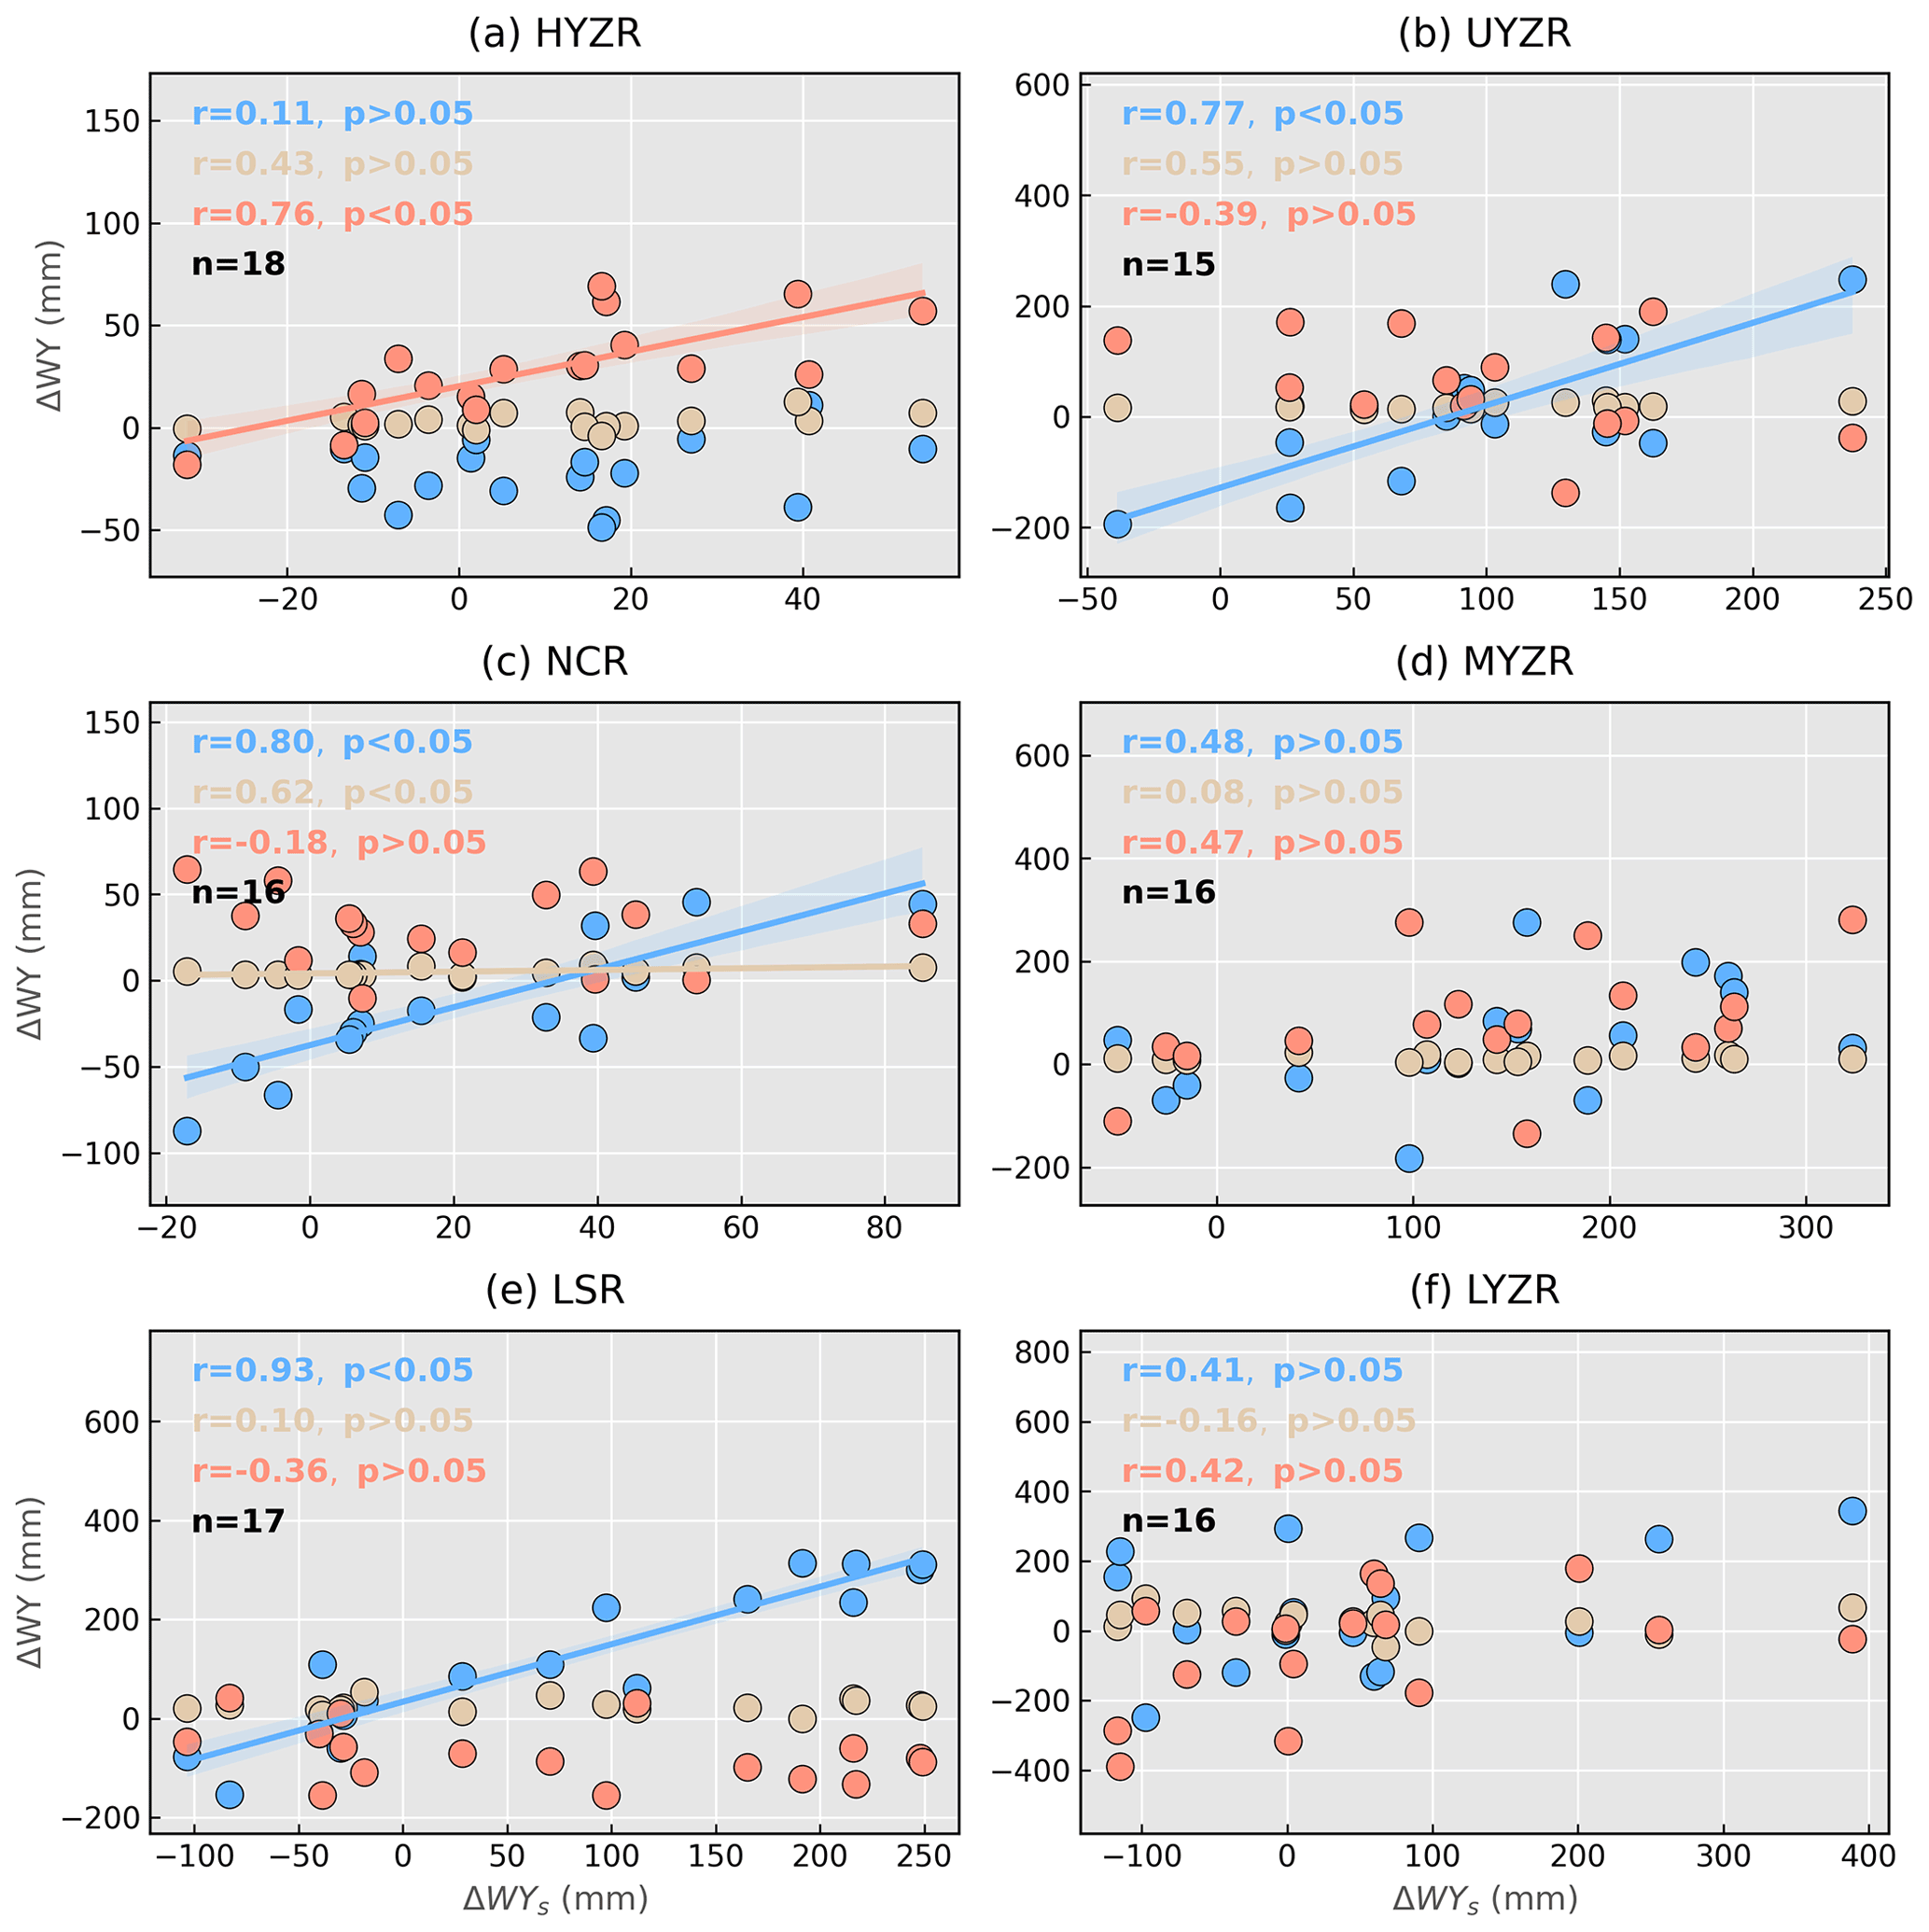
Figure 6The correlation between the time series of total water yield deviation (ΔWYs(t); x axis) and its components (y axis) caused by climate (ΔWYc(t); blue point), vegetation (ΔWYv(t); tan point), and cryosphere (ΔWYg(t); red point), respectively. The fitting line and its 95 % confidence interval are shown only when the p value < 0.05. n indicates the number of years after Tp, which is determined by the Pettitt method (see Table 1 and Fig. 3c).
In contrast to the positive contributions of climate, we find that WY caused by cryosphere exhibits a negative association with reduced total WY deviations in recent years in the UYZR (; p>0.05) and LSR (; p>0.05) basins. The negative but weak relationship indicates that meltwater from cryospheric loss may compensate for low flow and even mitigate water shortage risks. Also, the compensating effect from cryosphere is stronger in the MYZR (r=0.47; p>0.05) and, together with climate contributions, contributes to the increasing WY trend (Fig. 4). In contrast to other regions, however, the HYZR basin shows a significantly positive relationship between cryospheric contributions and total WY deviations (r=0.76; p<0.05), indicating that the cryosphere instead of climate leads to the downward trend in headwaters. This signifies that in this region, cryospheric contributions may have already passed its potential for supplying to river flow, due to decreased glaciers and snow under continuous warming. This is further verified by the relationship of cryospheric contributions to total WY (RCg) with temperature (Fig. S8a). The cryospheric contribution to WY increases with temperature in the beginning, until a maximum is reached, and then begins to decrease. In addition, the compensating effect of meltwater can be seen in the UYZR, MYZR, and LSR basins, i.e., WY caused by cryospheric changes keeps a positive relationship with the increase in temperature, further supporting the observed higher correlation in these basins (Fig. 6).
4.1 Climate and cryosphere cause water yield regime shifts
Previous studies have reported the increasing WY trend in the LSR (Lin et al., 2020), LYZR (Zhang et al., 2011), and UBR basins (Li et al., 2021). Here, we not only provide further evidence on the long-term trend of WY changes in the above regions but also conduct trend analyses in other regions that have received less attention. As such, the study comprehensively indicates a general increase in WY (Fig. 3a) in the entire UBR basin. Furthermore, we find that regime shifts in WY occur during the late 1990s in the entire UBR basin, where the magnitude in WY increases (Fig. 4a), but the direction has reversed or slowed after Tp (Fig. 4b). The result agrees with climate shifts (Fig. S9), drought changes (Li et al., 2019b), and lake area changes (Zhang et al., 2017) in this region.
Attribution analysis of WY magnitude shifts highlights the dependency of spatial gradients of climate and cryosphere accounting for WY changes. Climate explains a greater increase in WY in downstream regions, while meltwater is more important in upstream regions (Fig. 5). This may be attributed to divergent water supply sources. Biemans et al. (2019) indicate that meltwater supplies over 40 % of river flow in the upper regions, but the contribution is less than 30 % in the downstream regions of the UBR basin (Fig. S9). Vegetation does not significantly affect the total river flow in the UBR (Fig. 5), despite its remarkable role in seasonal runoff detected by Li et al. (2021).
Climate, especially precipitation, still controls the declining WY trend after Tp in most regions (Figs. 6 and S7) and may become an important factor in occurrence of turning points (Fig. 3c and d). This suggests the importance of precipitation and its projections on future hydrological process in mountainous watersheds (Lutz et al., 2014). The cryospheric contribution is also important for water yield regime shifts, as meltwater from glaciers and snow can alleviate water resources shortages, which have mainly been caused by decreased precipitation in recent years (Figs. 6 and S7). This finding is also supported by observed glacier runoff data (Yao et al., 2010) and several modeling studies (Lutz et al., 2014; Zhang et al., 2020; Wang et al., 2021). However, after glacier runoff reaches a maximum (defined as peak water; Gleick and Palaniappan, 2010), cryospheric mass loss cannot sustain the rising meltwater with atmospheric warming (e.g., the HYZR basin in Fig. S8), which is in agreement with Huss and Hock (2018).
4.2 Uncertainties and limitations
This study has some limitations pertaining to the DMC model used for partitioning the effects of climatic and cryospheric changes on the hydrological regime shifts in the UBR basin. The DMC method is a useful statistical alternative to physical modeling approaches, especially in alpine river basins (e.g., UBR basin) where there is inadequate knowledge of the complex hydrological mechanisms. However, the method is still dependent on our prior understanding of hydrological responses to warming and related environmental changes, such as glaciers melting and vegetation changes. For the UBR basin, besides climate change, cryosphere (Biemans et al., 2019; Yao et al., 2019) and vegetation (Li et al., 2021, 2019a) are two major factors which drive hydrological changes. Here, the cryospheric contribution is estimated as being the deviation between total water yield and the climate and vegetation contribution estimated by the DMC method. However, in some mountainous basins, human activities such as urbanization, dam regulation, and irrigation may consume a significant portion of water resources or induce changes in seasonal runoff patterns. Therefore, it is necessary to account for anthropogenic impacts when assessing river flow changes via the statistical models in these regions, in addition to the factors considered in this study. In addition, the DMC method assumes a linear relationship between two variables, and thus it may fail to capture nonlinear interactions among water, vegetation, and cryospheric melting. For example, the role of vegetation in influencing hydrological responses is expected to be complex due to biophysical (e.g., via transpiration and albedo changes) and biochemical (e.g., via CO2 uptake and release) feedbacks (Bonan, 2008; Krich et al., 2022; Li et al., 2021). Thus, with the availability of long-term in situ observations and high-resolution remote sensing datasets in the UBR basin (Wang et al., 2022), other powerful statistical models which account for nonlinear and casual relationships should be applied to identify the causes of water yield changes (Runge et al., 2019).
The data used in the study are another source of uncertainty in our results. The precipitation dataset used here is generated by topographical and linear corrections based on observations. As Sun and Su (2020) have pointed out, the results of the linear correction approach vary significantly with station density. For example, increasing the number of stations from 4 to 10 in the basin results in a decrease in the mean annual precipitation estimate by about 20 mm. Hence, the reconstruction of the precipitation dataset will rely on the density of the observed stations. Besides the topographic correction, the effects of basin size and climate seasonality should be considered in the work of precipitation reconstruction in the UBR basin due to its complex climate and environment (Sun et al., 2019). Compared with precipitation, the estimation of evaporation may be much more challenging in high mountains. Although GLEAM evaporation shows good agreement with in situ eddy covariance records (Yang et al., 2017), its model structure does not include wind speed and solar radiation, which may affect the estimation of sublimation and, thus, total evaporation (X. Li et al., 2019). In addition, the coarse spatial resolution (0.25∘) of GLEAM may be insufficient to estimate regional evaporation in the UBR basin. GIMMS LAI has the advantage of capturing the ecosystem structure and thus is widely used to assess vegetation conditions and their effects on hydrological changes (Zhu et al., 2016; Forzieri et al., 2020; Gonsamo et al., 2021). However, LAI ignores the vegetation's physiological process (Fang et al., 2019). Hu et al. (2022) have indicated that LAI can cope with hydroclimatic fluctuations in arid environments, but the tradeoff between ecosystem structure (LAI) and physiology (photosynthesis per unit leaf area) is stronger in humid climates. Thus, using LAI products in energy-limited regions may result in some biased assessments of the vegetation effects on water yield. In spite of the uncertainties in the methods and data used here, this study provides essential information for water resource management in the UBR basin based on multi-station runoff observations. With the help of the Second Tibetan Plateau Scientific Expedition and Research, the observation networks in meteorology, cryosphere, and hydrology will be expanded, which can potentially lead to a better understanding of the hydrological processes in this region and make developing physically based cryosphere–hydrological modeling possible (Wang et al., 2022).
4.3 Broad implications for mountainous water management
Understanding the hydrological regime shifts and their causes in high mountain regions is especially important in managing water resources. Of specific importance is balancing the co-benefits between mountains and downstream lowlands (Viviroli et al., 2011). In this study, the combined (both offsetting and additive) effects of climate and cryosphere are detected (Fig. 5). They further lead to either slight or substantial increases in WY across the entire UBR basin (Fig. 4a). The combined effects often hinder the role of each driver in influencing hydrological changes (Wei et al., 2018; Zhang and Wei, 2021) and thus should be considered when designing water management strategies in large transboundary river systems. For example, the additive effect may be beneficial for mitigating droughts and water shortage during droughts, but it may exacerbate flood risks due to increased precipitation and accelerated melting of the cryosphere in the future (Immerzeel et al., 2013). In addition, in the headwaters, WY resulting from cryosphere melting continues to increase with temperature until a maximum is reached, beyond which cryospheric contribution to total WY begins to decrease (Fig. S8a). This shows that the meltwater from glaciers may have already surpassed the peak water time. Such hydrological changes will substantially affect future water resources management, and thus accurate projections of the occurrence time of peak water will be important in managing mountainous water resources.
In this study, regime shifts in historical WY are detected during the late 1990s in the UBR basin. The WY magnitude generally increases, but its direction has reversed or slowed in recent years. Attribution analysis based on the DMC method shows that the combined effects of climate and cryosphere are either offsetting or additive, leading to slight or substantial WY increases, while the role of vegetation is much weaker. The declining or slowing WY trend after Tp is mainly driven by precipitation in most regions, while meltwater may alleviate drought and water shortage. In headwaters, however, cryospheric contributions to WY have declined due to reduced glaciers under warming. These findings suggest that the combined effects of climate and cryosphere should be considered in the sustainable development of water resources, especially involving co-benefits in upstream and downstream regions.
Python scripts used to extract data, analyze data, and create figures are available at https://doi.org/10.5281/zenodo.7315564 (Li, 2022).
Annual runoff data during 1982 and 2013 from six hydrological stations are provided by the Hydrology and Water Resources Survey Bureau of the Tibet Autonomous Region. The 10 km gridded daily precipitation dataset is accessible through https://doi.org/10.11888/Hydro.tpdc.270917 (Sun and Su, 2020). The GLEAM evaporation is accessible from https://doi.org/10.5194/gmd-10-1903-2017 (Martens et al., 2017). The maximum 2 m air temperature is acquired via https://doi.org/10.11888/AtmosphericPhysics.tpe.249369.file (He et al., 2020). The map of land use types in 2000 is accessible from the Landuse dataset in China (1980–2015) at Chinese Academy of Sciences Resource and Environmental Science Data Center (2019) (http://www.resdc.cn/).
The supplement related to this article is available online at: https://doi.org/10.5194/hess-26-6399-2022-supplement.
HL and LL conceived the study, designed the experiments, and wrote the paper. BYS, LW, AK, FZ, DFL, XXW, WFL, XPL, and ZXX participated in the discussion and contributed to writing.
The contact author has declared that none of the authors has any competing interests.
Publisher's note: Copernicus Publications remains neutral with regard to jurisdictional claims in published maps and institutional affiliations.
This article is part of the special issue “Hydrological response to climatic and cryospheric changes in high-mountain regions”. It is not associated with a conference.
Hao Li thanks the China Scholarship Council, for providing financial support to pursue his doctorate in Belgium. We thank Florian Ulrich Jehn and two anonymous reviewers, for their contribution to the peer review of this work.
This research has been supported by the China Scholarship Council (grant no. 202006350051), National Natural Science Foundation of China (grant nos. 51961145104, 52079138, and 91647202), and the 2115 Talent Development Program of China Agricultural University (grant no. 00109019).
This paper was edited by Giulia Zuecco and reviewed by Florian Ulrich Jehn and two anonymous referees.
Biemans, H., Siderius, C., Lutz, A. F., Nepal, S., Ahmad, B., Hassan, T., von Bloh, W., Wijngaard, R. R., Wester, P., Shrestha, A. B., and Immerzeel, W. W.: Importance of snow and glacier meltwater for agriculture on the Indo-Gangetic Plain, Nat. Sustain., 2, 594–601, https://doi.org/10.1038/s41893-019-0305-3, 2019. a, b, c, d, e
Bonan, G. B.: Forests and climate change: forcings, feedbacks, and the climate benefits of forests, Science, 320, 1444–1449, https://doi.org/10.1126/science.1155121, 2008. a
Bonferroni, C. E.: Il calcolo delle assicurazioni su gruppi di teste, in: Studi in onore del professore salvatore ortu carboni, Rome, Italy, 13–60, 1935. a
Brahney, J., Menounos, B., Wei, X., and Curtis, P. J.: Determining annual cryosphere storage contributions to streamflow using historical hydrometric records, Hydrol. Process., 31, 1590–1601, https://doi.org/10.1002/hyp.11128, 2017. a
Chinese Academy of Sciences Resource and Environmental Science Data Center: Landuse dataset in China (1980–2015), http://www.resdc.cn/ (last access: 19 December 2022), 2019. a
Cuo, L., Li, N., Liu, Z., Ding, J., Liang, L., Zhang, Y., and Gong, T.: Warming and human activities induced changes in the Yarlung Tsangpo basin of the Tibetan plateau and their influences on streamflow, J. Hydrol.: Reg. Stud., 25, 100625, https://doi.org/10.1016/j.ejrh.2019.100625, 2019. a
Dierauer, J. R., Whitfield, P. H., and Allen, D. M.: Climate controls on runoff and low flows in mountain catchments of Western North America, Water Resour. Res., 54, 7495–7510, https://doi.org/10.1029/2018WR023087, 2018. a
Fan, H. and He, D.: Temperature and precipitation variability and its effects on streamflow in the upstream regions of the Lancang–Mekong and Nu–Salween Rivers, J. Hydrometeorol., 16, 2248–2263, https://doi.org/10.1175/JHM-D-14-0238.1, 2015. a
Fang, H., Baret, F., Plummer, S., and Schaepman-Strub, G.: An overview of global leaf area index (LAI): Methods, products, validation, and applications, Rev. Geophys., 57, 739–799, https://doi.org/10.1029/2018RG000608, 2019. a
Forzieri, G., Miralles, D. G., Ciais, P., Alkama, R., Ryu, Y., Duveiller, G., Zhang, K., Robertson, E., Kautz, M., Martens, B., Jiang, C., Arneth, A., Georgievski, G., Li, W., Ceccherini, G., Anthoni, P., Lawrence, P., Wiltshire, A., Pongratz, J., Piao, S., Sitch, S., Goll, D. S., Arora, V. K., Lienert, S., Lombardozzi, D., Kato, E., Nabel, J. E. M. S., Tian, H., Friedlingstein, P., and Cescatti, A.: Increased control of vegetation on global terrestrial energy fluxes, Nat. Clim. Change, 10, 356–362, https://doi.org/10.1038/s41558-020-0717-0, 2020. a, b, c
Gao, P., Mu, X.-M., Wang, F., and Li, R.: Changes in streamflow and sediment discharge and the response to human activities in the middle reaches of the Yellow River, Hydrol. Earth Syst. Sci., 15, 1–10, https://doi.org/10.5194/hess-15-1-2011, 2011. a
Gao, Y., Chen, F., Lettenmaier, D. P., Xu, J., Xiao, L., and Li, X.: Does elevation-dependent warming hold true above 5000 m elevation? Lessons from the Tibetan Plateau, npj Clim. Atmos. Sci., 1, 1–7, https://doi.org/10.1038/s41612-018-0030-z, 2018. a
Gleick, P. H. and Palaniappan, M.: Peak water limits to freshwater withdrawal and use, P. Natl. Acad. Sci. USA, 107, 11155–11162, https://doi.org/10.1073/pnas.1004812107, 2010. a
Gonsamo, A., Ciais, P., Miralles, D. G., Sitch, S., Dorigo, W., Lombardozzi, D., Friedlingstein, P., Nabel, J. E. M. S., Goll, D. S., O'Sullivan, M., Arneth, A., Anthoni, P., Jain, A. K., Wiltshire, A., Peylin, P., and Cescatti, A.: Greening drylands despite warming consistent with carbon dioxide fertilization effect, Global Change Biol., 27, 3336–3349, https://doi.org/10.1111/gcb.15658, 2021.. a, b
Goulden, M. L. and Bales, R. C.: Mountain runoff vulnerability to increased evapotranspiration with vegetation expansion, P. Natl. Acad. Sci. USA, 111, 14071–14075, https://doi.org/10.1073/pnas.1319316111, 2014. a
Hallema, D. W., Sun, G., Caldwell, P. V., Norman, S. P., Cohen, E. C., Liu, Y., Bladon, K. D., and McNulty, S. G.: Burned forests impact water supplies, Nat. Commun., 9, 1307, https://doi.org/10.1038/s41467-018-03735-6, 2018. a
He, J., Yang, K., Tang, W., Lu, H., Qin, J., Chen, Y., and Li, X.: The first high-resolution meteorological forcing dataset for land process studies over China, Scient. Data, 7, 1–11, https://doi.org/10.11888/AtmosphericPhysics.tpe.249369.file, 2020. a, b
Hu, Z., Piao, S., Knapp, A. K., Wang, X., Peng, S., Yuan, W., Running, S., Mao, J., Shi, X., Ciais, P., Huntzinger, D. N., Yang, J., and Yu, G.: Decoupling of greenness and gross primary productivity as aridity decreases, Remote Sens. Environ., 279, 113120, https://doi.org/10.1016/j.rse.2022.113120, 2022. a
Huss, M. and Hock, R.: Global-scale hydrological response to future glacier mass loss, Nat. Clim. Change, 8, 135–140, https://doi.org/10.1038/s41558-017-0049-x, 2018. a, b, c
Immerzeel, W. W., Van Beek, L. P., and Bierkens, M. F.: Climate change will affect the Asian water towers, Science, 328, 1382–1385, https://doi.org/10.1126/science.1183188, 2010. a
Immerzeel, W. W., Pellicciotti, F., and Bierkens, M. F. P.: Rising river flows throughout the twenty-first century in two Himalayan glacierized watersheds, Nature Geosci., 6, 742–745, https://doi.org/10.1038/ngeo1896, 2013. a
Kang, S., Xu, Y., You, Q., Flügel, W.-A., Pepin, N., and Yao, T.: Review of climate and cryospheric change in the Tibetan Plateau, Environ. Res. Lett., 5, 015101, https://doi.org/10.1088/1748-9326/5/1/015101, 2010. a
Kendall, M. G.: A new measure of rank correlation, Biometrika, 30, 81–93, https://doi.org/10.1093/biomet/30.1-2.81, 1938. a
Krich, C., Mahecha, M. D., Migliavacca, M., De Kauwe, M. G., Griebel, A., Runge, J., and Miralles, D. G.: Decoupling between ecosystem photosynthesis and transpiration: a last resort against overheating, Environ. Res. Lett., 17, 044013, https://doi.org/10.1088/1748-9326/ac583e, 2022. a
Li, D., Li, Z., Zhou, Y., and Lu, X.: Substantial Increases in the Water and Sediment Fluxes in the Headwater Region of the Tibetan Plateau in Response to Global Warming, Geophys. Res. Lett., 47, e2020G–e87745G, https://doi.org/10.1029/2020GL087745, 2020. a
Li, H.: HaoLi2030/HESS-2022-Water-Yield: version 1.0, Zenodo [code], https://doi.org/10.5281/zenodo.7315564, 2022. a
Li, H., Liu, L., Liu, X., Li, X., and Xu, Z.: Greening Implication Inferred from Vegetation Dynamics Interacted with Climate Change and Human Activities over the Southeast QinghaiTibet Plateau, Remote Sens., 11, 2421, https://doi.org/10.3390/rs11202421, 2019a. a, b
Li, H., Liu, L., Shan, B., Xu, Z., Niu, Q., Cheng, L., Liu, X., and Xu, Z.: Spatiotemporal variation of drought and associated multi-scale response to climate change over the Yarlung Zangbo River Basin of Qinghai–Tibet Plateau, China, Remote Sens., 11, 1596, https://doi.org/10.3390/rs11131596, 2019b. a, b, c
Li, H., Liu, L., Koppa, A., Shan, B., Liu, X., Li, X., Niu, Q., Cheng, L., and Miralles, D.: Vegetation greening concurs with increases in dry season water yield over the Upper Brahmaputra River basin, J. Hydrol., 603, 126–981, https://doi.org/10.1016/j.jhydrol.2021.126981, 2021. a, b, c, d, e, f, g
Li, J., Liu, D., Wang, T., Li, Y., Wang, S., Yang, Y., Wang, X., Guo, H., Peng, S., Ding, J., Shen, M., and Wang, L.: Grassland restoration reduces water yield in the headstream region of Yangtze River, Sci. Rep., 7, 2162, https://doi.org/10.1038/s41598-017-02413-9, 2017. a
Li, X., Long, D., Han, Z., Scanlon, B. R., Sun, Z., Han, P., and Hou, A.: Evapotranspiration estimation for Tibetan Plateau headwaters using conjoint terrestrial and atmospheric water balances and multisource remote sensing, Water Resour. Res., 55, 8608–8630, https://doi.org/10.1029/2019WR025196, 2019. a
Lin, L., Gao, M., Liu, J., Wang, J., Wang, S., Chen, X., and Liu, H.: Understanding the effects of climate warming on streamflow and active groundwater storage in an alpine catchment: the upper Lhasa River, Hydrol. Earth Syst. Sci., 24, 1145–1157, https://doi.org/10.5194/hess-24-1145-2020, 2020. a
Lutz, A., Immerzeel, W., Shrestha, A., and Bierkens, M.: Consistent increase in High Asia's runoff due to increasing glacier melt and precipitation, Nat. Clim. Change, 4, 587–592, https://doi.org/10.1038/nclimate2237, 2014. a, b, c
Mann, H. B.: Nonparametric Tests Against Trend, Econometrica, 13, 245, https://doi.org/10.2307/1907187, 1945. a
Martens, B., Miralles, D. G., Lievens, H., van der Schalie, R., de Jeu, R. A. M., Fernández-Prieto, D., Beck, H. E., Dorigo, W. A., and Verhoest, N. E. C.: GLEAM v3: satellite-based land evaporation and root-zone soil moisture, Geosci. Model Dev., 10, 1903–1925, https://doi.org/10.5194/gmd-10-1903-2017, 2017. a, b
Pellicciotti, F., Buergi, C., Immerzeel, W. W., Konz, M., and Shrestha, A. B.: Challenges and uncertainties in hydrological modeling of remote Hindu Kush–Karakoram–Himalayan (HKH) basins: suggestions for calibration strategies, Mount. Res. Dev., 32, 39–50, https://doi.org/10.1659/MRD-JOURNAL-D-11-00092.1, 2012. a
Pettitt, A. N.: A non-parametric approach to the change-point problem, J. Roy. Stat. Soc. Ser. C, 28, 126–135, https://doi.org/10.2307/2346729, 1979. a
Runge, J., Bathiany, S., Bollt, E., Camps-Valls, G., Coumou, D., Deyle, E., Glymour, C., Kretschmer, M., Mahecha, M. D., Muñoz-Marí, J., van Nes, E. H., Peters, J., Quax, R., Reichstein, M., Scheffer, M., Schölkopf, B., Spirtes, P., Sugihara, G., Sun, J., Zhang, K., and Zscheischler, J.: Inferring causation from time series in Earth system sciences, Nat. Commun., 10, 2553, https://doi.org/10.1038/s41467-019-10105-3, 2019. a
Sang, Y., Singh, V. P., Gong, T., Xu, K., Sun, F., Liu, C., Liu, W., and Chen, R.: Precipitation variability and response to changing climatic condition in the Yarlung Tsangpo River basin, China, J. Geophys. Res.-Atmos., 121, 8820–8831, https://doi.org/10.1002/2016JD025370, 2016. a, b
Song, C., Wang, G., Sun, X., and Hu, Z.: River runoff components change variably and respond differently to climate change in the Eurasian Arctic and Qinghai-Tibet Plateau permafrost regions, J. Hydrol., 601, 126653, https://doi.org/10.1016/j.jhydrol.2021.126653, 2021. a
Sun, H. and Su, F.: Precipitation correction and reconstruction for streamflow simulation based on 262 rain gauges in the upper Brahmaputra of southern Tibetan Plateau, J. Hydrol., 590, 125484, https://doi.org/10.1016/j.jhydrol.2020.125484, 2020. a, b, c, d
Sun, H., Su, F., Huang, J., Yao, T., Luo, Y., and Chen, D.: Contrasting precipitation gradient characteristics between westerlies and monsoon dominated upstream river basins in the Third Pole, Chinese Sci. Bull., 65, 91–104, https://doi.org/10.1360/TB-2019-0491, 2019. a
Tang, Q., Su, F., Zhang, Y., Ding, J., He, L., Tang, Y., Liu, X., Liu, X., Xu, X., Sang, Y., Han, D., Sun, H., Leng, G., Wang, L., Fang, H., Chen, D., Zhang, S., and Lan, C.: Streamflow change on the Qinghai-Tibet Plateau and its impacts, Chin. Sci. Bull., 64, 2807–2821, https://doi.org/10.1360/TB-2019-0141, 2019. a
Viviroli, D., Archer, D. R., Buytaert, W., Fowler, H. J., Greenwood, G. B., Hamlet, A. F., Huang, Y., Koboltschnig, G., Litaor, M. I., López-Moreno, J. I., Lorentz, S., Schädler, B., Schreier, H., Schwaiger, K., Vuille, M., and Woods, R.: Climate change and mountain water resources: overview and recommendations for research, management and policy, Hydrol. Earth Syst. Sci., 15, 471–504, https://doi.org/10.5194/hess-15-471-2011, 2011. a, b
Wang, L., Yao, T., Chai, C., Cuo, L., Su, F., Zhang, F., Yao, Z., Zhang, Y., Li, X., Qi, J., Hu, Z., Liu, J., and Wang, Y.: TP-River: Monitoring and Quantifying Total River Runoff from the Third Pole, B. Am. Meteorol. Soc., 102, E948–E965, https://doi.org/10.1175/BAMS-D-20-0207.1, 2021. a, b, c, d
Wang, L., Cuo, L., Luo, D., Su, F., Ye, Q., Yao, T., Zhou, J., Li, X., Li, N., Sun, H., Liu, L., Wang, Y., Zeng, T., Hu, Z., Liu, R., Chai, C., Wang, G., Zhong, X., Guo, X., Zhao, H., Zhao, H., and Yang, W.: Observing Multisphere Hydrological Changes in the Largest River Basin of the Tibetan Plateau, B. Am. Meteorol. Soc., 103, E1595–E1620, https://doi.org/10.1175/BAMS-D-21-0217.1, 2022. a, b
Wei, X. and Zhang, M.: Quantifying streamflow change caused by forest disturbance at a large spatial scale: A single watershed study: Large-Scale Forest Disturbance, Water Resour. Res., 46, W12525, https://doi.org/10.1029/2010WR009250, 2010. a, b
Wei, X., Li, Q., Zhang, M., Giles-Hansen, K., Liu, W., Fan, H., Wang, Y., Zhou, G., Piao, S., and Liu, S.: Vegetation cover – another dominant factor in determining global water resources in forested regions, Global Change Biol., 24, 786–795, https://doi.org/10.1111/gcb.13983, 2018. a
Yang, X., Yong, B., Ren, L., Zhang, Y., and Long, D.: Multi-scale validation of GLEAM evapotranspiration products over China via ChinaFLUX ET measurements, Int. J. Remote Sens., 38, 5688–5709, https://doi.org/10.1080/01431161.2017.1346400, 2017. a, b
Yao, T., Li, Z., Yang, W., Guo, X., Zhu, L., Kang, S., Wu, Y., and Yu, W.: Glacial distribution and mass balance in the Yarlung Zangbo River and its influence on lakes, Chinese Sci. Bull., 55, 2072–2078, https://doi.org/10.1007/s11434-010-3213-5, 2010. a, b, c
Yao, T., Xue, Y., Chen, D., Chen, F., Thompson, L., Cui, P., Koike, T., Lau, W. K.-M., Lettenmaier, D., Mosbrugger, V., Zhang, R., Xu, B., Dozier, J., Gillespie, T., Gu, Y., Kang, S., Piao, S., Sugimoto, S., Ueno, K., Wang, L., Wang, W., Zhang, F., Sheng, Y., Guo, W., Ailikun, Yang, X., Ma, Y., Shen, S. S. P., Su, Z., Chen, F., Liang, S., Liu, Y., Singh, V. P., Yang, K., Yang, D., Zhao, X., Qian, Y., Zhang, Y., and Li, Q.: Recent Third Pole's Rapid Warming Accompanies Cryospheric Melt and Water Cycle Intensification and Interactions between Monsoon and Environment: Multidisciplinary Approach with Observations, Modeling, and Analysis, B. Am. Meteorol. Soc., 100, 423–444, https://doi.org/10.1175/BAMS-D-17-0057.1, 2019. a, b, c, d
Zhang, G., Yao, T., Piao, S., Bolch, T., Xie, H., Chen, D., Gao, Y., O'Reilly, C. M., Shum, C. K., Yang, K., Yi, S., Lei, Y., Wang, W., He, Y., Shang, K., Yang, X., and Zhang, H.: Extensive and drastically different alpine lake changes on Asia's high plateaus during the past four decades, Geophys. Res. Lett., 44, 252–260, https://doi.org/10.1002/2016GL072033, 2017. a
Zhang, L., Nan, Z., Wang, W., Ren, D., Zhao, Y., and Wu, X.: Separating climate change and human contributions to variations in streamflow and its components using eight time-trend methods, Hydrol. Process., 33, 383–394, https://doi.org/10.1002/hyp.13331, 2019. a
Zhang, M. and Wei, X.: Deforestation, forestation, and water supply, Science, 371, 990–991, https://doi.org/10.1126/science.abe7821, 2021. a
Zhang, M., Ren, Q., Wei, X., Wang, J., Yang, X., and Jiang, Z.: Climate change, glacier melting and streamflow in the Niyang River Basin, Southeast Tibet, China, Ecohydrology, 4, 288–298, https://doi.org/10.1002/eco.206, 2011. a
Zhang, Y., Xu, C.-Y., Hao, Z., Zhang, L., Ju, Q., and Lai, X.: Variation of Melt Water and Rainfall Runoff and Their Impacts on Streamflow Changes during Recent Decades in Two Tibetan Plateau Basins, Water, 12, 3112, https://doi.org/10.3390/w12113112, 2020. a
Zhou, X., Zhang, Y., Beck, H. E., and Yang, Y.: Divergent negative spring vegetation and summer runoff patterns and their driving mechanisms in natural ecosystems of northern latitudes, J. Hydrol., 592, 125848, https://doi.org/10.1016/j.jhydrol.2020.125848, 2021. a
Zhu, Z., Bi, J., Pan, Y., Ganguly, S., Anav, A., Xu, L., Samanta, A., Piao, S., Nemani, R. R., and Myneni, R. B.: Global data sets of vegetation leaf area index (LAI) 3g and fraction of photosynthetically active radiation (FPAR) 3g derived from global inventory modeling and mapping studies (GIMMS) normalized difference vegetation index (NDVI3g) for the period 1981 to 2011, Remote Sens., 5, 927–948, https://doi.org/10.3390/rs5020927, 2013. a
Zhu, Z., Piao, S., Myneni, R. B., Huang, M., Zeng, Z., Canadell, J. G., Ciais, P., Sitch, S., Friedlingstein, P., Arneth, A., Cao, C., Cheng, L., Kato, E., Koven, C., Li, Y., Lian, X., Liu, Y., Liu, R., Mao, J., Pan, Y., Peng, S., Peñuelas, J., Poulter, B., Pugh, T. A. M., Stocker, B. D., Viovy, N., Wang, X., Wang, Y., Xiao, Z., Yang, H., Zaehle, S., and Zeng, N.: Greening of the Earth and its drivers, Nat. Clim. Change, 6, 791–795, https://doi.org/10.1038/nclimate3004, 2016. a, b