the Creative Commons Attribution 4.0 License.
the Creative Commons Attribution 4.0 License.
 | 09 Dec 2022
Atmospheric conditions favouring extreme precipitation and flash floods in temperate regions of Europe
Malte Neuper
Luca Mathias
Erwin Zehe
Laurent Pfister
In recent years, flash floods have repeatedly occurred in temperate regions of central western Europe. Unlike in Mediterranean catchments, this flooding behaviour is unusual. In the past (especially in the 1990s), floods have been characterized by predictable, slowly rising water levels during winter and driven by westerly atmospheric fluxes. Here, we explore potential links and causes between the recent occurrence of flash floods in central western Europe to extreme precipitation and specific atmospheric conditions. We hypothesize that a change in atmospheric conditions has led to more frequent extreme precipitation events that have subsequently triggered flash flood events in central western Europe. To test this hypothesis, we compiled data on flash floods in central western Europe and selected precipitation events above 40 mm h−1 from radar data (the RADOLAN “Radar-Online-Adjustment” dataset from the German Weather Service). Moreover, we identified proxy parameters representative of extreme precipitation favouring atmospheric conditions from the ERA5 reanalysis dataset. High specific humidity (q) in the lower troposphere (q≥0.004 kg kg−1), sufficient latent instability (convective available potential energy (CAPE) ≥ 327 J kg−1), and weak wind speeds between 10 m a.g.l. and 500 hPa (WS m s−1) proved to be characteristic of intense rainfall that can potentially trigger flash floods. We relied on linear models to analyse 40 years worth (1981–2020) of atmospheric parameters as well as related precipitation events. We found significant increases in the atmospheric moisture content and increases in atmospheric instability. Parameters representing the motion and organization of convective systems remained largely unchanged in the considered period (1981–2020); however, the number of precipitation events, their maximum 5 min intensities, and their hourly sums were characterized by large interannual variations, and no trends could be identified between 2002 and 2020. Our study shows that there is no single mechanistic path leading from atmospheric conditions to extreme precipitation and subsequently to flash floods. The interactions between the processes involved are so intricate that more analyses which consider other potentially relevant factors, such as intra-annual precipitation patterns or catchment-specific parameters, are required.
- Article
(896 KB) - Full-text XML
-
Supplement
(821 KB) - BibTeX
- EndNote


Flash floods mostly originate from deep moist convection and rank among the most destructive hazards, leading to economic losses, damage to infrastructure, and high mortality rates (Gaume et al., 2009; Hall, 1981; Llasat et al., 2014; WMO, 2017). They are often accompanied by massive erosion and other geomorphologic processes, such as landslides (Bucała-Hrabia et al., 2020; Vogel et al., 2017). While flash floods remain rather exceptional, their occurrence has more than doubled in Europe since the beginning of the 21st century in comparison to the late 1980s (Marchi et al., 2010; Owen et al., 2018). Flash floods in central western Europe typically affect relatively small areas (a few kilometres to 100 km2) and generally last less than 7 h (Marchi et al., 2010). Caused by conditionally unstable atmospheric conditions, mainly between May and July, they do not substantially affect the annual water balance. High pre-event soil moisture – caused by rainy weather in the preceding days – may lead to the rapid saturation of soils and the swift onset of an extreme runoff response (Marchi et al., 2010). Examples of flash floods in recent years occurred in Luxembourg in June 2018 (Pfister et al., 2020) and July 2016 (Pfister et al., 2018), in Braunsbach (Germany) in May 2016 (Bronstert et al., 2017, 2018), and in the Starzel River, which flooded in June 2008 (Ruiz-Villanueva et al., 2012). While large-scale winter inundations were the most common flood type in western Europe until the 1990s (Pfister et al., 2004), flash flood events have increasingly occurred over the last 15 years (Göppert, 2018; Marchi et al., 2010). This raises questions about the origin of this change in flood type (Bertola et al., 2020, 2021). In this study, we conjecture that changes in the average atmospheric conditions may more often lead to flash-flood-prone meteorological conditions.
The definitions of flash floods are manifold and sometimes even equivocal in the literature. In this study, we focus on pluvial floods triggered by intense (convective) rainfall during summer – typically lasting for a few hours. The response times to peak discharge lie within a similar range. The flood characteristics refer to a comprehensive set of extreme and small-scale floods with rapidly rising and falling limbs of the hydrograph and a high impact in terms of damage to infrastructure and/or casualties in the worst case. The largest floods in our database involved catchments (of the White Ernz and Starzel rivers) with a size of just over 100 km2, and the smallest events had affected hillslopes of a few hundred metres, where major surface runoff had been reported. We prefer to keep the definition simple and not precisely quantify or limit it to specific processes, as little is understood about the underlying processes. The US National Weather Service defines a flash flood in a similarly broad fashion: “a rapid and extreme flow of high water into a normally dry area, or rapid rise in a stream or creek above a predetermined flood level, beginning within six hours of the causative event” (NWS, 2021).
Precipitation events potentially causing flash floods are characterized by high rainfall amounts over a sufficient period. This condition is met by high rainfall intensities that typically last between 30 min and a few hours (Doswell et al., 1996; Markowski and Richardson, 2010). This is mostly the case during rainfall events of convective origin. In particular, slow-moving or quasi-stationary multicellular storms can combine both high rainfall intensities and a sufficiently long duration. Combined effects of several physical processes can cause the most severe rainfall, eventually initiating flash floods. One of these effects consists of storm training, where the storm cells move consecutively in a line-parallel direction over the same area, which may then cause high precipitation totals. Another comparable effect leading to abundant precipitation or a prolonged event duration is the so-called “back-building” effect, where the forward movement is cancelled out by the continuous backward development of new cells, thereby leading to a slow ground-relative movement of the whole precipitation area. During the flash flood events in Luxembourg in 2016 and 2018, upscale growth also had a distinctive impact on the precipitation processes (Mathias, 2019, 2021). As a result of this merging of two or more individual convective cells to form a multicell storm, the initial raindrop sizes and dynamics of merging cells are often varied, which can, in turn, cause downdraughts, producing extremely high precipitation intensities (Doswell et al., 1996; Markowski and Richardson, 2010).
Atmospheric conditions associated with excessive convective rainfall have three major characteristics: (1) sufficient latent instability, (2) high moisture content, and (3) a slow storm motion and organization (Van Delden, 2001; Doswell et al., 1996; Markowski and Richardson, 2010; Taszarek et al., 2021a). First, for deep moist convection to occur, the tropospheric lapse rates need to be sufficiently steep, and a lifting mechanism is required (Van Delden, 2001). Second, the moisture content in the boundary layer needs to be abundant in order to supply water vapour for condensation during the lifting process. High to moderate values of relative humidity in the lower to middle troposphere can further nurture convective cells by limiting water vapour losses due to evaporation and entraining dry air around convective cell boundaries (Doswell et al., 1996; Markowski and Richardson, 2010; Púčik et al., 2015). The same effect – limiting the diminishment of specific humidity by entrainment – is realized by a wide updraught. Additionally, high freezing levels and low cloud-base heights enhance the warm-cloud depth and, thus, allow the warm-rain process of collision and coalescence to be more dominant. This leads to a higher precipitation efficiency and is associated with higher rainfall rates (Doswell et al., 1996; Markowski and Richardson, 2010; Schroeder et al., 2016). In continental Europe, high values of total column water vapour are often related to the advection of warm Mediterranean air masses (Van Delden, 2001) or air masses from the subtropical region of the northern Atlantic (Mathias, 2021; Mohr et al., 2020). Lastly, to ensure a sufficient duration of the rainfall event, a large rainfall system or slow storm motion is needed (Van Delden, 2001). This generally occurs in the case of very weak pressure or geopotential gradients when the mean wind speed and the bulk shear between the surface and the lower to middle troposphere are weak. This process is often enhanced by orography, which influences the near-surface wind field channelling convergence zones (Whiteman, 2000). Moreover, a decoupled flow (a rapid vertical shift in the prevailing wind directions by at least 90∘) between the lower and middle troposphere can significantly reduce storm motion in some cases, as analysed by Mathias (2019).
Proxy parameters from climate reanalysis data are regularly used to identify the atmospheric conditions described above during convective events (Brooks, 2009; Groenemeijer and van Delden, 2007; Púčik et al., 2015; Taszarek et al., 2017; Westermayer et al., 2017). The main parameters used in these studies are the bulk wind shear, to estimate the thunderstorm cell organization and precipitation efficiency, and convective available potential energy (CAPE), to identify atmospheric instability. Púčik et al. (2015) and Westermayer et al. (2017) found that heavy precipitation occurred across a wide range of deep-layer wind shear (DLS; bulk shear between the surface and 6 km height). CAPE, as a proxy for latent instability, needs to be reasonably high for thunderstorms to develop (Púčik et al., 2015; Westermayer et al., 2017). When focussing on heavy-precipitation events within the range of thunderstorms, high specific or relative humidity are parameters to identify moisture content at different atmospheric levels (Púčik et al., 2015; Westermayer et al., 2017). To date, studies have only included the wind speed in the form of wind shear as a proxy parameter for the potential organization of convective systems, which is important for hail, severe gusts, and tornadoes. However, the development of flash floods relies on longer-lasting, extreme precipitation. Therefore, the storm motion must be slow, which is dependent on a weak flow in the lower to middle troposphere. Hence, we consider the wind speed as a relevant parameter when assessing the flash flood hazard via a slow storm motion.
The identified atmospheric parameters can be analysed over a longer period for trends or oscillations. Therein, especially trends in atmospheric instability are debated. While several studies have found increasing CAPE in reanalysis data, recent studies by Rasmussen et al. (2020), Chen et al. (2020), and Taszarek et al. (2021) have pointed out that CAPE is opposed by increasing convective inhibition (CIN). However, higher CIN levels may lead to higher CAPE values because CIN prevents the premature initiation of convection potentially inhibiting the development of stronger CAPE and, thus, possibly increasing the potential of more intense storms. In contrast, decreasing relative humidity levels at low levels of the atmosphere, connected to rising temperatures, could potentially reduce the number of thunderstorms (Taszarek et al., 2021a). Absolute humidity is, however, expected to increase under warmer conditions and can potentially release higher precipitation totals (Lenderink and Van Meijgaard, 2008; Martinkova and Kysely, 2020; Mishra et al., 2012). Changes in wind shear were found to be minor (Rädler et al., 2018). Rädler et al. (2018) concluded, that the frequency of thunderstorms had not increased significantly over the past 40 years in central western Europe but that they are more likely to produce severe weather.
To date, most studies have focussed on thunderstorm conditions in general or on convective hazards related to lightning, hail, tornadoes, or wind gusts. Here, we focus on thunderstorm events that cause extreme precipitation and, especially, flash flood events. Forecasting potential heavy precipitation based on atmospheric conditions remains a major challenge, as different atmospheric constellations (e.g. back-building multicells, chaotic cell clustering, and atmospheric rivers) can cause heavy-precipitation events, while large hail, for example, is mostly associated with supercells and is, therefore, less challenging to identify (Púčik et al., 2015).
In view of these recent findings, we hypothesize that a change in atmospheric conditions has led to more frequent extreme precipitation events that have subsequently triggered flash flood events in central western Europe. Prior to hypothesis testing, we first compiled a comprehensive set of 20 to 40 years worth of hydro-climatological observation series – including extreme precipitation events, related atmospheric conditions, and documented flash flood occurrences. We then leveraged this dataset to investigate a potential increase in extreme precipitation events in central western Europe. Second, we relied on proxy parameters, such as CAPE, specific humidity, and wind speed, to identify the atmospheric conditions that had prevailed during extreme precipitation and related flash flood events. Third, we applied a trend analysis to the identified set of atmospheric parameters using the ERA5 reanalysis data (Hersbach et al., 2020) for the past (1981–2020). The overarching goal of our study is to contribute to a better understanding of climate change effects, as expressed through modifications in the frequency and severity of extreme precipitation events in a temperate climate – more specifically in an area where flash floods used to be an extremely rare phenomenon until recently.
2.1 Study area and period
Our study area comprises central western Europe (50.5∘ N–47.5∘ S and 10∘ E–5∘ W) including Luxembourg, south-western Germany, and north-eastern France (Fig. 1a, b, c, d). The study period spans the summer months from May to August, which exhibit the most favourable conditions for thunderstorms and the onset of flash floods (Van Delden, 2001; Rauber et al., 2008), between 1981 and 2020.
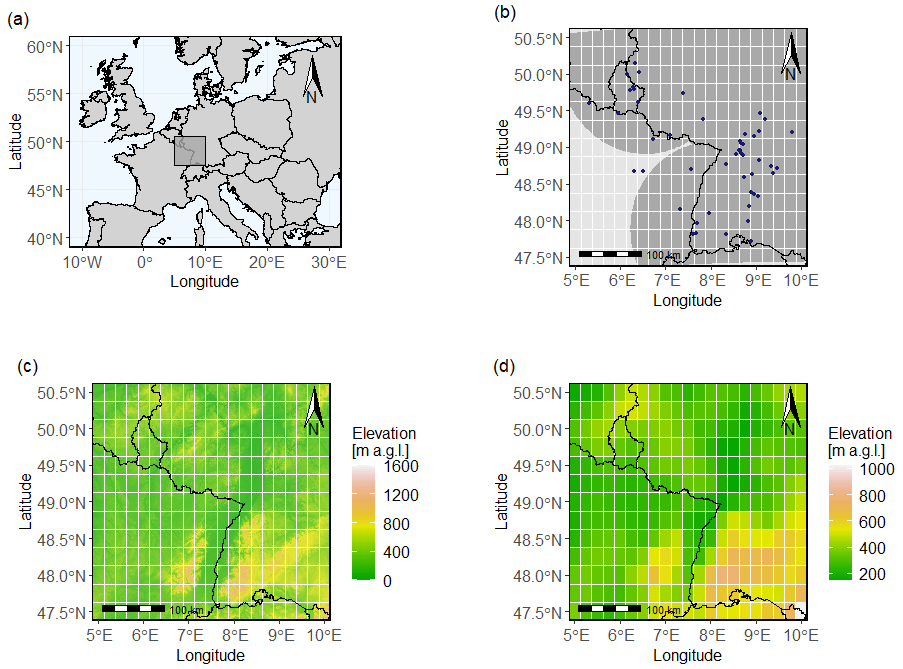
Figure 1(a) Location of the study area (dark-grey square) within Europe. (b) Map of the study area including data points of flash floods that have occurred and the range of the German Weather Service (DWD) RADOLAN precipitation radar data in dark grey. The white grids show the grid width of the ERA5 reanalysis dataset. Panel (c) shows a digital elevation model of the area at a 1 km × 1 km resolution, and panel (d) presents the model topography within the study area based on the ERA5 surface geopotential.
2.2 Database
We downloaded the ERA5 atmospheric reanalysis data from the Copernicus Climate Data Store (CDS) at single levels (Hersbach et al., 2018b) and at different pressure levels (Hersbach et al., 2018a). In addition, we downloaded land data from ERA5 (Muñoz Sabater, 2019) to analyse the pre-event wetness state of soils in catchments. Within the summer months from May to August for the period from 1981 to 2020, selected parameters (see Sect. 2.3) were retrieved at a 1 h time step. The horizontal grid spacing of the atmospheric data is , whereas the horizontal grid spacing of the land data is .
The extreme precipitation event database was created based on the “Radar-based Precipitation Climatology” (RADKLIM) dataset from the German Weather Service (DWD, version 2017.002 – Winterrath et al., 2018). This is a processed version of the operational RADOLAN “Radar-Online-Adjustment” radar dataset from the DWD (Weigl et al., 2004; Weigl and Winterrath, 2009; Winterrath et al., 2017). Data are available from 2001 to 2020 and were considered from May to August. The dataset has a 1 km × 1 km grid size and a temporal resolution of 5 min. Unfortunately, the south-western part of the study area is not covered by the RADOLAN data (Fig. 1b). Although the original RADOLAN product has already been quality checked and corrected and is, consequently, of high quality, we applied some additional quality control and correction when needed; this included – next to a thorough visual check of the data – the detection and correction of possible anomalous propagation (anaprop) echoes, further ground clutter detection and removal, and an extended rain gauge adjustment with supplementary local rain gauges. The last operation was done to achieve a further densification of the measuring network (in comparison to the original product), which is especially important when dealing with flash floods that often exhibit large spatial precipitation sum gradients. To ensure a comparable standard, we used the same methodology for the rain gauge adjustment as used for the generation of the original RADOLAN/RADKLIM dataset: the best combination of the multiplicative and the additive adjustments (Weigl et al., 2004; Wilson and Brandes, 1979; Wood et al., 2000). The adjustment interval was 1 h. In Luxembourg, the extra stations used were mainly the stations of the ASTA (Administration des Services Techniques de l'Agriculture) network (ranging from 7 to 40 extra stations); in Germany, the stations of the agricultural–meteorological network of the state of Rhineland-Palatinate (ranging from 10 to 50 extra stations) were used. The additional rain gauge data were quality controlled based on Sevruk (1985) and Michaelides (2008). We extracted the precipitation events (P events) for the database from the radar database by identifying 1 km × 1 km grid cells with precipitation amounts ≥40 mm h−1. Connected grid cells with a maximum of one cell (1 km distance) in between two or more cells exceeding the threshold and a maximum of a 30 min time gap were clustered to account for one P event (Fig. 2). The threshold of 40 mm h−1 was used according to the definition of extreme precipitation events by the DWD (DWD, 2021). This approach led to a total of 3835 P events between 2001 and 2020 (Table 1). For every P event, we extracted the maximum hourly precipitation intensity as well as the maximum 5 min precipitation intensity at one location within the P event. Moreover, the temporal (time of the first threshold exceedance in one of the grid cells of the P event to the time of the last exceedance) and spatial (area of the number of grid cells that are part of a P event) distribution of the events were identified. Atmospheric conditions during P events were identified at the beginning of an event, as atmospheric conditions should be the most characteristic at the onset the event. To receive a spatially representative value, the mean of each atmospheric ERA5 grid cell of the P event itself was calculated as well as a buffer zone around the event, according to the schematic representation in Fig. 2. For a small standard P event that lies within one ERA5 grid cell, atmospheric data were averaged over that particular ERA5 grid cell and the eight surrounding cells. Precipitation events at the boundary of the study area do not include the full buffer zone, and larger P events covering multiple grid cells include a buffer zone around the ERA5 grid cells of the actual P event. A more detailed description of this procedure and its special cases are documented in the Supplement (Sect. S3).
The flash flood database was compiled via a search through case studies in the scientific literature (Brauer et al., 2011; Bronstert et al., 2018; Van Campenhout et al., 2015; Eden et al., 2018; Göppert, 2018; Ruiz-Villanueva et al., 2012), water agency reports (Johst et al., 2018; Pfister et al., 2018, 2020), reinsurance data (Caisse Centrale de Réassurance; CCR, 2021), personal communication (engineering consultants WALD + CORBE – Catharin Schäfer and Hans Göppert), and news archives (Franceinfo, 2021; Luxemburger Wort, 2021). We included floods in streams, fields, or on streets that are spatially (maximum of 30 km) and temporally (same day) linked to an extreme P event exceeding the threshold of 40 mm h−1. If a flood was triggered by a rainfall event not identified as extreme in the radar data, the flood was not considered. Despite a careful and comprehensive query, the database is likely non-exhaustive. Nevertheless, we think that this approach of site inspections is the most inclusive. Sufficient discharge time series are mainly available for larger rivers and bigger stream gauges than those in which flash floods occur. Moreover, data availability in the past has often been limited to a daily resolution, which can easily miss capturing peak flows during flash floods. Relying on high-flow water levels in the past also makes it difficult to distinguish flash floods from slowly developing floods, which have occurred regularly in the past, especially in the mountainous parts of the study area. A particular example of the limits of a discharge time-series-based approach are the flash floods in Luxembourg (Pfister et al., 2018, 2020), which were detected by stream gauges only to a limited extent within an overall time series that is too short for any long-term analyses. A list of the 40 events that were eventually included in this study spanning the period from 2002 to 2020 can be found in Sect. S1 in the Supplement of this paper. To extract atmospheric parameters during flash flood events, we identified the triggering P event within a 30 km range and proceeded according to the approach for P events (as shown in Fig. 2). By using this approach, we found 37 of the total of 3835 P events to be associated with flash floods (Table 1). This is less than the number of flash floods themselves, as two flash floods were triggered by the same P event in 2008 (Rangendingen and Jungingen; Ruiz-Villanueva et al., 2012), and three floods were triggered by the same P event in 2018 (Rhineland-Palatine; Johst et al., 2018).
Table 1The total number of P events and the number of P events that were associated with flash floods (FFs).
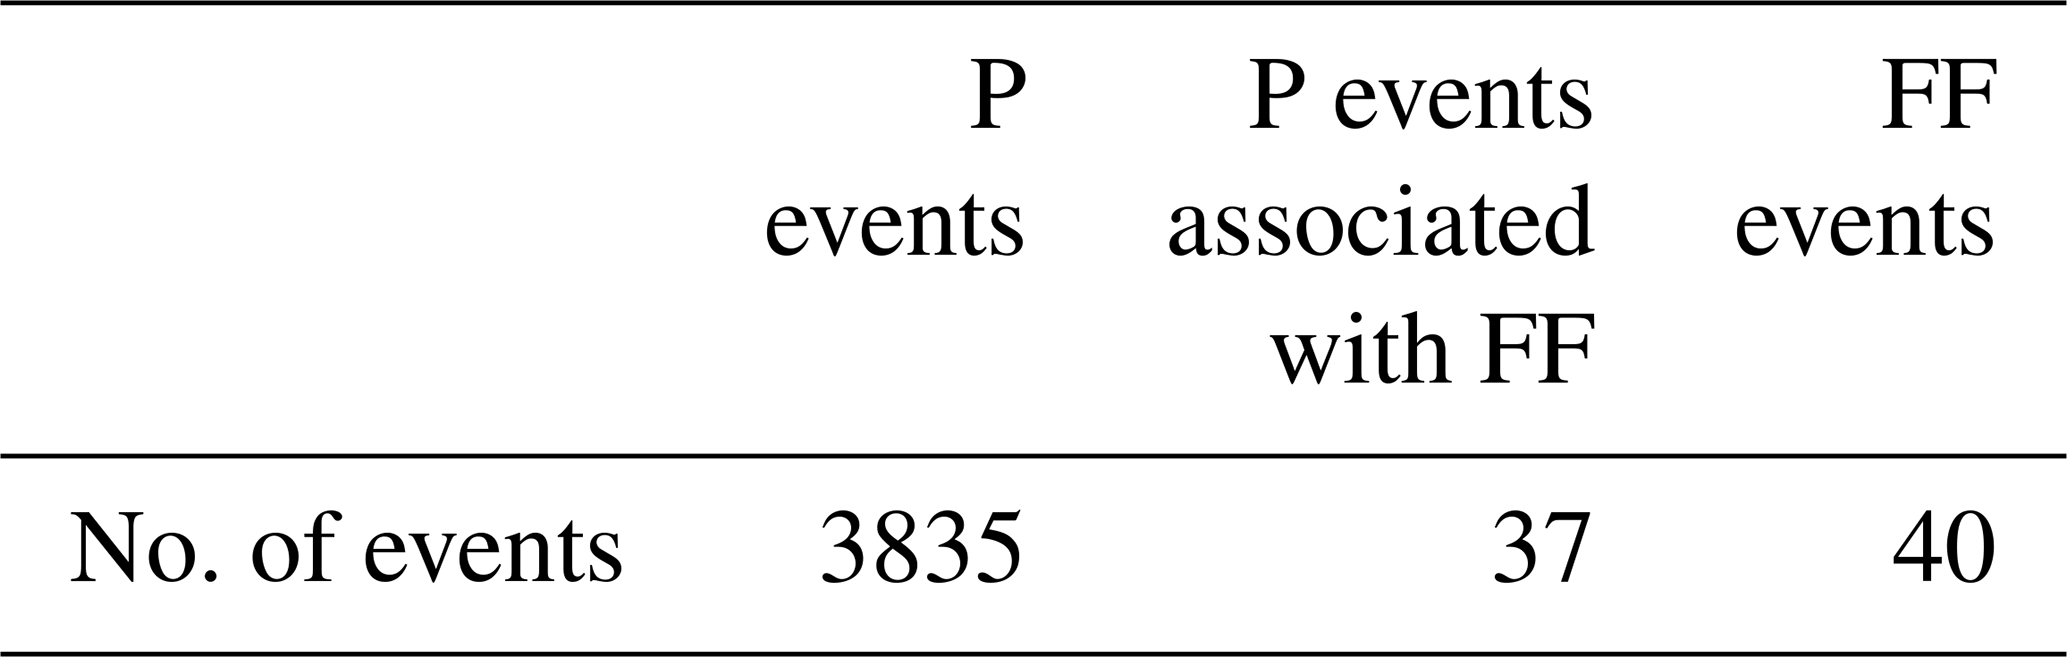

Figure 2Schematic representation of the ERA5 grid cells (, ∼25 km × 25 km) that were averaged to calculate representative atmospheric conditions during P events (grid width 1 km × 1 km). The grid of the ERA5 cells (black) and the radar cells (grey) is marked with dashed lines. The radar grid cells marked in blue are those exceeding the precipitation threshold during a P event. The surrounding ERA5 grid cells marked in light blue are those that were used to average the atmospheric conditions. Panel (b) shows the standard case of a buffer zone of a one-ERA5-grid-cell P event, panel (a) shows some possible exceptions at the boundary of the study area, and panel (c) shows the procedure for larger P events covering multiple ERA5 grid cells.
2.3 Identification of atmospheric parameters favouring extreme precipitation and flash floods
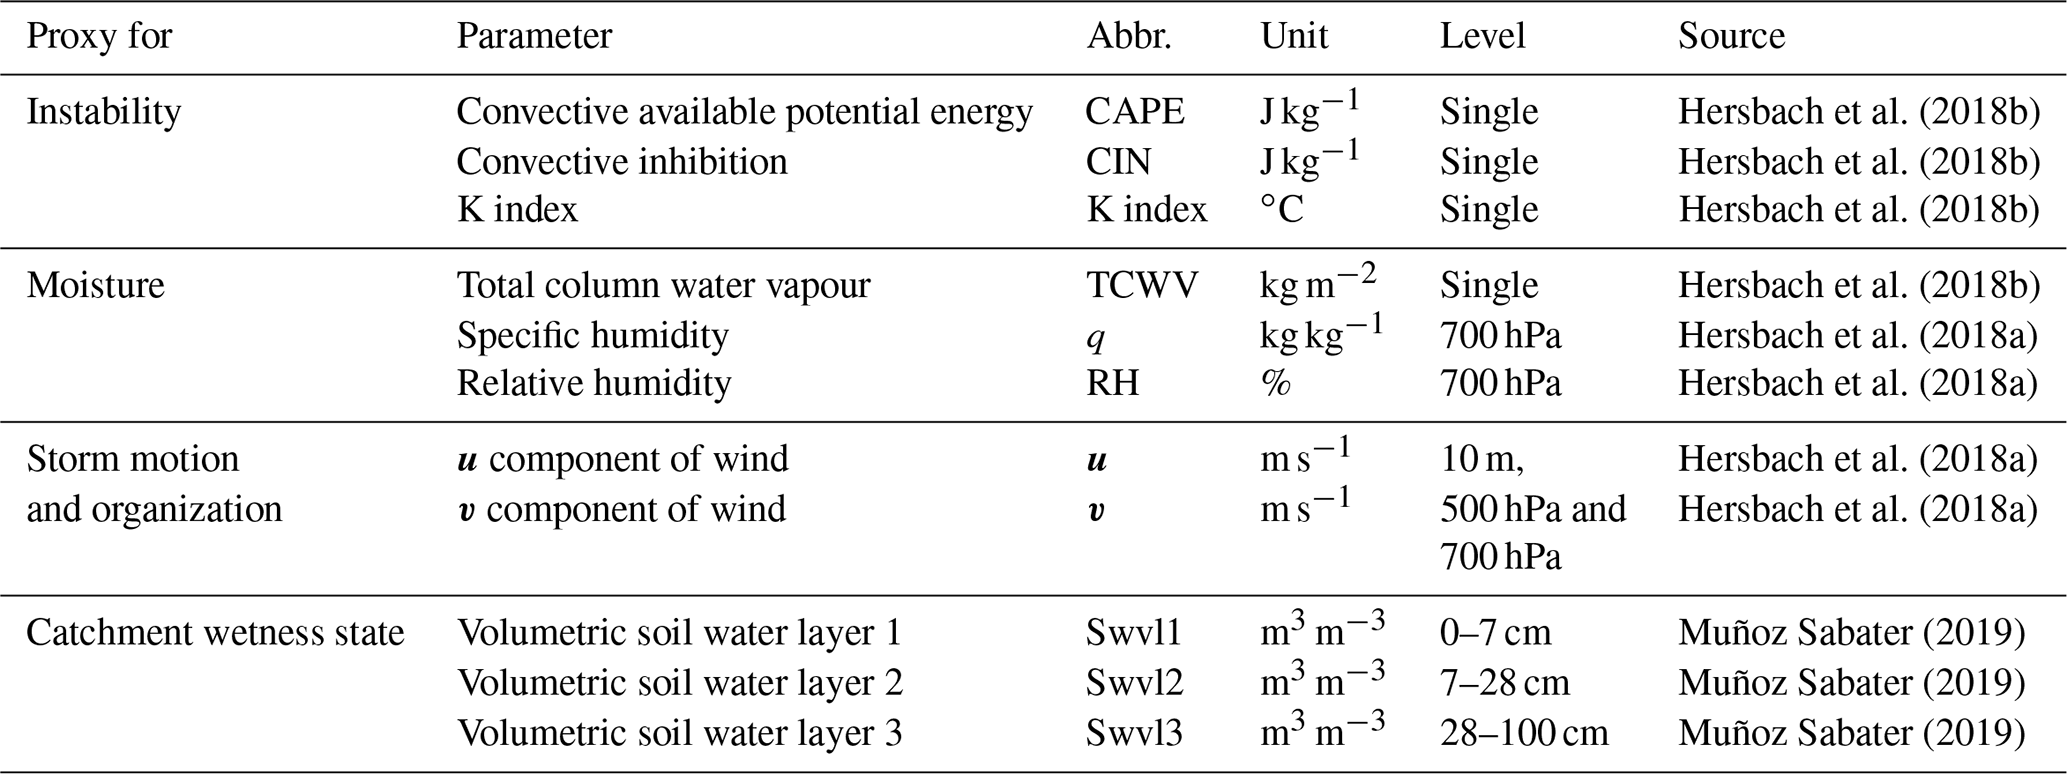
Referring to work done by Van Delden (2001), Westermayer et al. (2017), Taszarek et al. (2017), and Púčik et al. (2015), we selected relevant atmospheric parameters to represent (1) instability, (2) the moisture content, and (3) storm motion and organization; additionally, we extracted (4) soil moisture content from the ERA5 dataset to get an indication of the wetness state of the catchment before the onset of an extreme precipitation event (Table 2).
As proxy parameters for atmospheric instability, we used the convective available potential energy (CAPE, in J kg−1), which is provided within the ERA5 single-level datasets. In addition, we also considered convective inhibition (CIN, in J kg−1). Given its recognized potential as a flash flood proxy, we used the K index (in ∘C) that is provided within the ERA5 dataset. The K index (George, 1960) is defined as follows:
where T is the air temperature at differing pressure levels, and Td the dew point temperature (in ∘C).
The K index is a stability index that is based on the vertical extent of low-level moisture and the vertical temperature lapse rate of the lower and middle troposphere. While the operational use of stability indices alone is limited (Doswell and Schultz, 2006), indices can provide additional value when assessing severe-weather potential. The K index was originally developed to assess potential air mass thunderstorms, or thunderstorms without a dynamic triggering mechanism (George, 1960). Most importantly, it shows some special skill in forecasting the potential of thunderstorms related to heavy precipitation (Funk, 1991; Junker et al., 1999). Regarding the potential for heavy precipitation, it can be generally stated that the higher the K-index value, the greater the potential for heavy rain. Generally, K-index values above 20 ∘C indicate thunderstorms, while there is no thunderstorm potential for values below 20 ∘C. K-index values are further subcategorized into isolated thunderstorms (20–25 ∘C), widely scattered thunderstorms (25–30 ∘C), scattered thunderstorms (31–35 ∘C), and numerous thunderstorms (>35 ∘C). Note that the highest category with K-index values above 35 ∘C is, however, extremely rare in central western Europe (<0.5 % within the study area and period, as calculated based on the ERA5 data used).
To reach a sufficiently high rainfall rate causing heavy precipitation and consequent flash floods, the atmosphere's moisture content is pivotal. We opted for the total column water vapour (TCWV, in kg m−2) as well as specific humidity (q, in kg kg−1) and relative humidity (RH, in %) at the pressure level of 700 hPa as atmospheric moisture content proxies. The pressure level of 700 hPa was chosen because it is approximately the middle of the lower, weather-relevant part of the atmosphere between the surface and 500 hPa.
To assess the storm motion, we computed the wind speed (WS) from the square root of the squared northward direction wind vector u (in m s−1) and the squared eastward direction wind vector v (in m s−1) at the pressure level of 700 hPa. In addition, the mean of the wind speed between 10 m a.g.l. and the pressure level of 500 hPa was calculated. Low-level wind shear (LLS, in m s−1) was likewise computed based on the square root of the differences in the vectors u and v near the ground and at about 1.5 km height (850 hPa). Accordingly, we calculated the deep-layer wind shear (DLS, in m s−1) as the difference in the wind vectors near the ground and at about 6 km height (500 hPa). The wind shear allows an assessment of the organizational mode of deep moist convection.
We considered soil moisture parameters for assessing the pre-event wetness state of a catchment. Therefore, we extracted soil moisture (Swvl, in m3 m−3) at depths of 0–7, 7–28, and 28–100 cm from ERA5 a total of 24 h before the onset of identified P events and the onset of flash-flood-triggering P events respectively.
Table 2Selected proxy parameters for the assessment of convection-relevant atmospheric conditions from the ERA5 dataset.
To identify extreme precipitation and flash-flood-relevant proxy parameters, we extracted their respective values from the ERA5 atmospheric dataset at the time step and grid cell of initially identified events. Next, we created thresholds for every proxy parameter that makes the occurrence of precipitation events possible. Therefore, we chose the 75th or 25th percentile as the respective upper or the lower boundaries, including either the lower or the upper three quartiles of all values of extreme events respectively. These percentiles were chosen as the statistical standard, as also used in Schroeder et al. (2016). This analysis leads to the determination of the thresholds (in Table 3 and Sect. 3.3) used to classify atmospheric conditions as extreme precipitation and potentially “flash flood favouring”. We used these thresholds as well as the three parameters identified as the most suitable from the groups of moisture, instability, and storm motion and organization to eventually conduct trend analyses.
2.4 Trend analyses
We carried out linear trend analyses to test the different parts of our working hypothesis – linking a potential increase in atmospheric conditions triggering extreme precipitation events to a rise in the occurrence of extreme precipitation events in central western Europe. We applied the linear models to our precipitation event database as well as to the occurrence frequency, precipitation amount, and intensity of identified extreme precipitation events. Likewise, we applied linear models to the flash-flood-relevant parameter ranges of the identified set of ERA5 atmospheric parameters as well as to the simultaneous occurrences of the three most relevant parameters.
3.1 Flash flood occurrences
Figure 3 shows flash flood occurrences in central western Europe. While barely any events were reported before 2006, two remarkable summers are 2016 and 2018, when flash floods occurred particularly often in the study area (8 and 11 occurrences respectively). As the temporal inconsistencies in the dataset do not allow one to draw conclusions on any robust trends, this flash flood data compilation cannot support the conjectured increase in frequency of flash floods. Note that several events often occurred within a few days (Fig. 3b) under the same mesoscale atmospheric constellation, in the same area, or even in neighbouring catchments, and are, therefore, not completely independent of one another. For example, two flash floods in 2008 (Rangendingen and Jungingen; Ruiz-Villanueva et al., 2012) and three floods in 2018 (Rhineland-Palatine; Johst et al., 2018) occurred during the same large-scale P event.
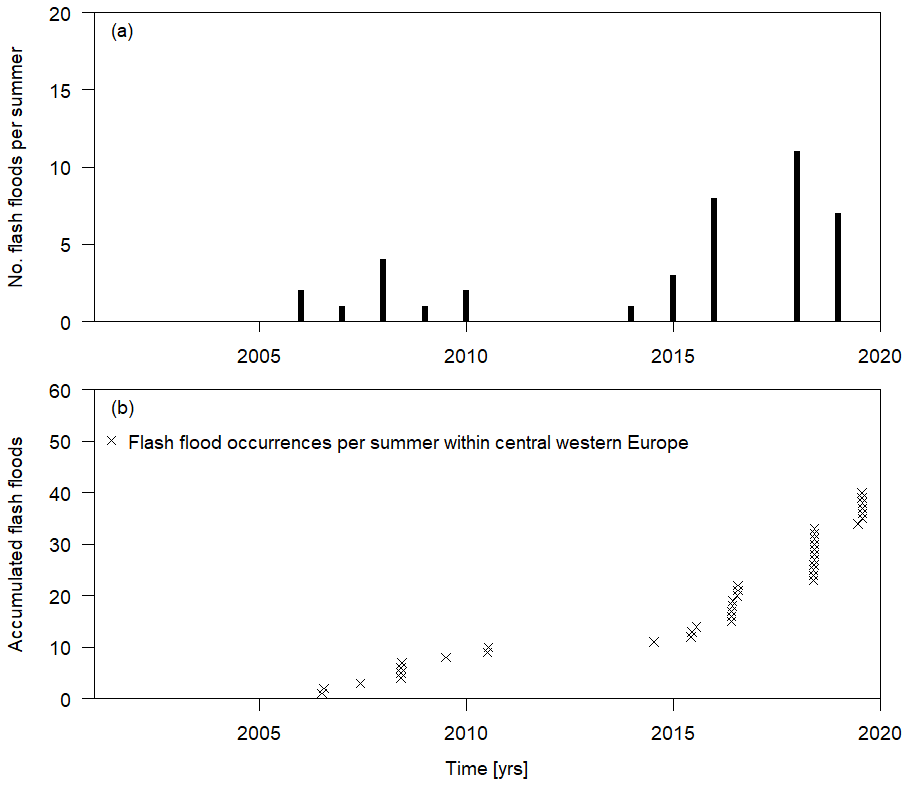
Figure 3Occurrence of flash flood events within central western Europe between 2001 and 2020. Panel (a) shows the number of flash flood occurrences per summer, and panel (b) maintains the exact occurrence date of the flash flood event.
3.2 Extreme precipitation event characteristics
Within our study area, we extracted extreme P events with precipitation intensities ≥40 mm h−1 from the DWD radar dataset. Between 2001 and 2020, we observed a slight but insignificant increase in the number of events per summer (Fig. 4a). Note that the interannual variance is very high and that this increase includes 2 extreme years, 2006 and 2018, when precipitation events ≥40 mm h−1 occurred particularly often. Similar to the flash flood occurrences, many of the extreme precipitation events happened on the same days over a wider region. This is particularly the case for 2008 and 2018: the multiple rainfall events from 2018 overlap with a high number of flash floods. For the precipitation amounts, we could not identify significant trends in the maximum 5 min precipitation intensities (Fig. 4b) nor in the maximum hourly intensities per event (Fig. 4d) for the 2001–2020 period. P events that eventually led to flash floods (Fig. 4c, e) did not differ in the range of precipitation intensities from P events that did not cause flash floods, but their median was around 3 mm h−1 higher. The event duration of P events that caused flash floods was, however, slightly longer compared with the other extreme P events (Fig. 4f, g). The largest difference between P events causing flash floods and other P events was, however, the temporal and spatial extent: P events that caused flash floods were often longer-lasting and larger in comparison with extreme P events that did not lead to flooding (Fig. 4h, i). Neither the temporal nor the spatial extent of the P events shows trends over the study period of 20 years (Fig. 4f, h).
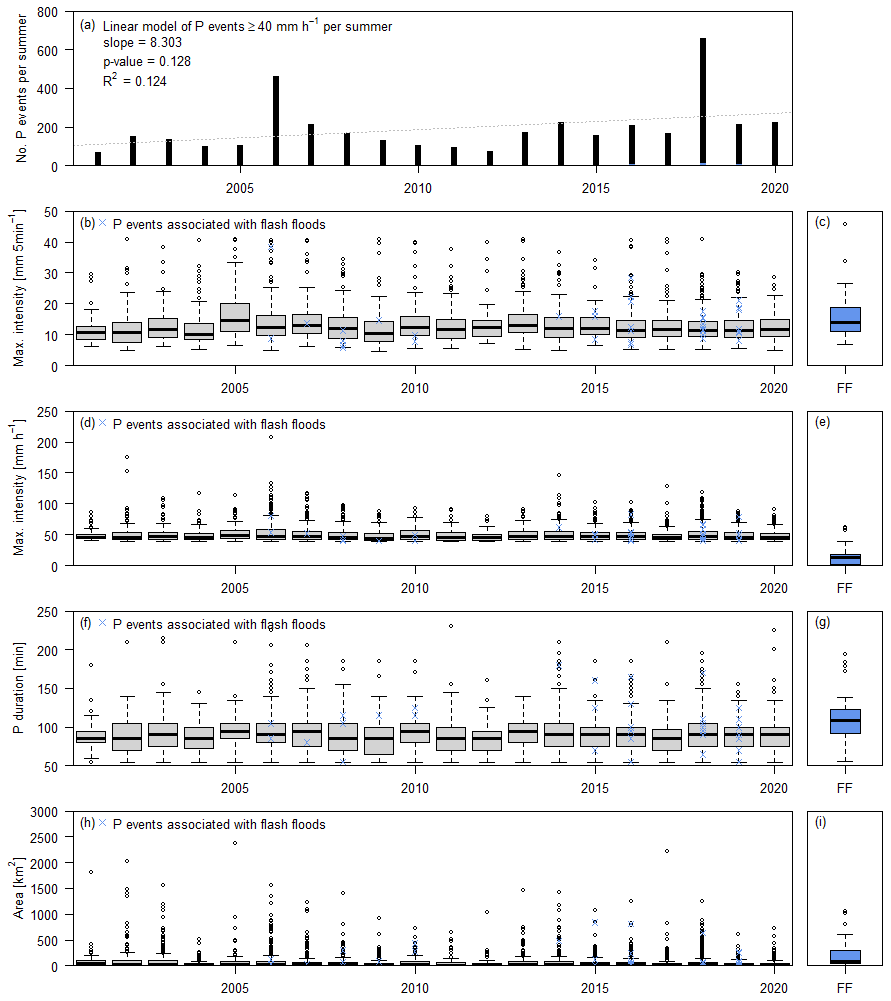
Figure 4Occurrence of extreme precipitation events (≥40 mm h−1) within central western Europe. The panels in the left column (a, b, d, f, h) show the precipitation event characteristics per summer between 2001 and 2020. The blue crosses and the right column (c, e, g, i) show the precipitation characteristics of the events that are associated with a flash flood. Panel (a) shows the number of precipitation events per summer. Panels (b) and (c) show the P events' maximum precipitation intensity per 5 min, and panels (d) and (e) show the P events' maximum precipitation intensity per hour. Panels (f) and (g) show the temporal extent of the identified events, whereas panels (h) and (i) show the spatial extent of the identified events.
3.3 Identification of atmospheric parameters favouring extreme precipitation and flash flood events
To identify parameter ranges that favour flash floods, we considered all hourly values of the parameters between May and August irrespective of any identified events, as events could only be identified within the last 20 years of the study period. Moreover, we extracted the parameters present during the time of extreme P events and the selection of P events that led to flash flood occurrences (Fig. 5). The data emphasize the occurrence of extreme events under conditionally unstable atmospheric conditions. Most extreme precipitation and flash flood events occurred within the upper quartile of CAPE values (Fig. 5a). Sufficient values of CAPE are often accompanied by moderate values of CIN. Both extreme precipitation and flash flood events occurred over a wide range of CIN, with a slightly higher median value at the onset of an event compared with the general values (Fig. 5b). However, both CAPE and CIN appear to be widely scattered within the spectrum of their possible ranges. The K index, in contrast, proves to be a reliable index, and more than 80 % of all extreme precipitation and flash flood events occur within the thunderstorm-relevant categories of the index above 28 ∘C (Fig. 5c). Moisture conditions during extreme precipitation and flash flood events were found to be mostly within the upper percentiles of the overall simulated values. Especially the specific humidity (q) and total column water vapour (TCWV) range clearly within the upper quartile of all values during events (Fig. 5d, e). Relative humidity (RH) also proves to always be high during extreme events (Fig. 5f). All moisture parameters, especially RH, tend to be even higher during flash flood events compared with general extreme precipitation events (Fig. 5d, e, f). The wind-related parameters considered to analyse storm motion and organization are generally low during extreme precipitation and flash flood events; specifically, the WS10 m−500 hPa (Fig. 5h) stands out, with most of the values observed during extreme events being in the lower quartile of the full range of occurrences. Tendencies regarding WS700 hPa, DLS, and LLS (Fig. 5g, i, j) are less clear but show the same pattern. In addition to atmospheric parameters, soil moisture conditions were evaluated 24 h before identified events. Often, soil moisture within the upper and lower soil layer (Swvl10−7 cm and Swvl37−100 cm respectively) is higher during flash flood events compared with general extreme P events (Fig. 5k, m). Especially the higher top-level soil moisture might hint to preceding rainfall events that could help explaining some of the quick runoff formation present during flash floods. The mid-level soil layer (Swvl27−28 cm) shows lower soil moisture before flash flood events (Fig. 5l).
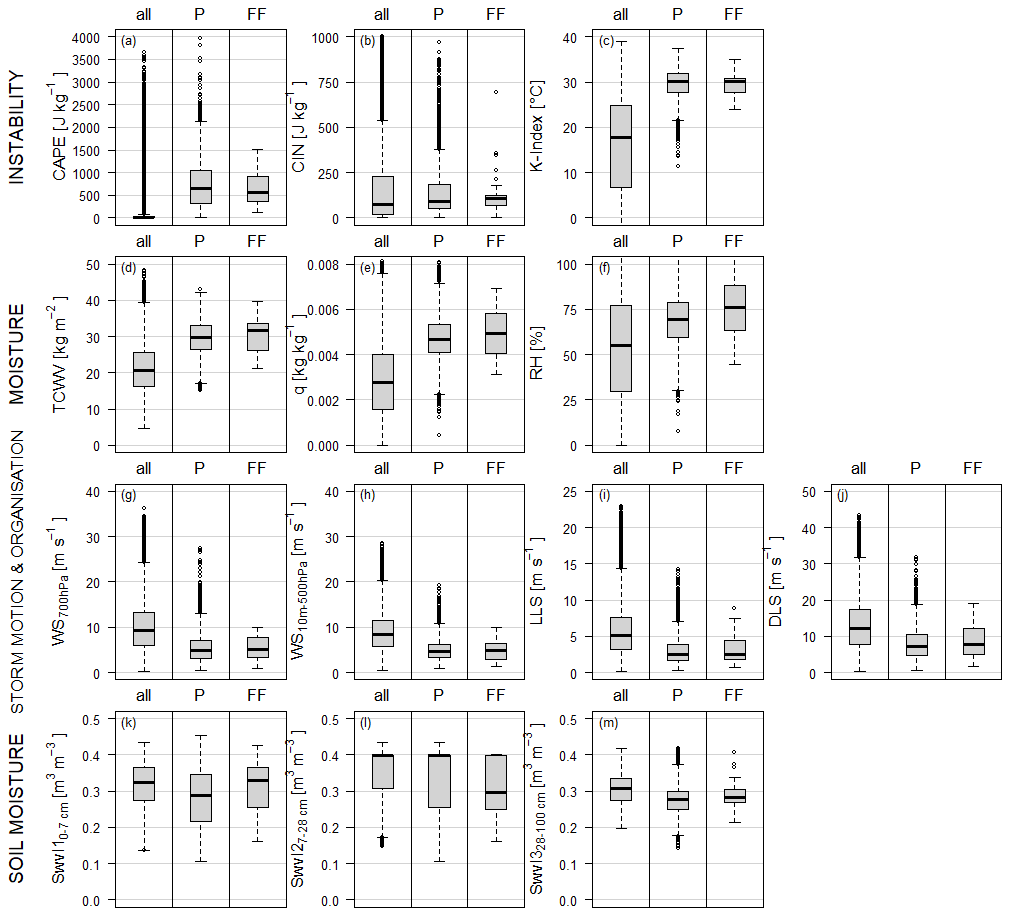
Figure 5All hourly values of the proxy parameters (a–j) during the entire period (all), before extreme precipitation events (P), and before flash flood events (FF). Soil moisture (k–m) was extracted 24 h before the onset of identified P events or 24 h before the onset of FF-triggering P events.
This analysis leads to the determination of the thresholds in Table 3 to classify atmospheric conditions as extreme precipitation and potentially flash flood favouring. Sufficient CAPE, high q, and weak WS10 m−500 hPa were identified as the most clearly distinguishing parameters per category to characterize extreme precipitation events, including 75 % of all extreme precipitation events and excluding around 75 % of all generally occurring parameters' values.
3.4 Changes in atmospheric parameters between 1981 and 2020
Instability, as shown representatively by CAPE above 326.9 J kg−1, has increased between 1981 and 2020. The number of hours with high enough instabilities to support the occurrence of thunderstorms increased by up to 5 h per summer (Fig. 6a). These findings were particularly significant in the northern part of the study area (Fig. 6b). Moreover, there are significant increasing trends regarding the actual values of CAPE above 326.9 J kg−1 in the north-western and mid-southern part of the study area (Fig. 6c, d). Another measure of the atmosphere's instability and capability to produce rain-intense thunderstorms is the K index, shown in Fig. A1. The occurrence of the K-index values above 27.8 ∘C is strongly increasing between 1981 and 2020 throughout the study area and is significant in the northern part of the study region. Furthermore, the values of the K index above the threshold have increased, which indicates an increased intensity of rain-intense thunderstorm events. This trend is significant over the Belgian part of the study area.
The observed increase in high atmospheric moisture content, represented by q above 0.004 kg kg−1 (Fig. 6e, g), is highly significant over the entire study area (Fig. 6f, h). High-moisture-content conditions became up to 8 h per summer more frequent, especially over south-western Germany; however, the absolute increase in conditions with a very high moisture content is small (Fig. 6g).
The storm motion potentially decreases with weak WS10 m−500 hPa that tends to occur more often in the study area (Fig. 6i). The values below the threshold of 6.2 m s−1 appear to become higher in the western part of the study area and lower within the eastern part. However, these trends are insignificant over the entire study area (Fig. 6j, l), and WS10 m−500 hPa is considered to remain largely unchanged.
Table 3Threshold values determined as extreme precipitation and flash flood favouring based on the lower/upper quartile of their range of occurrence during extreme precipitation events, including all P events, whether they are associated with a flood or not.

The complete set of analysed atmospheric parameters is shown in Appendix A.

Figure 6Trend analysis of the most suitable variables for instability (convective available potential energy, CAPE), moisture (specific humidity, q), and storm motion and organization (wind speed, WS10 m−500 hPa). The first column (a, e, i) shows the trends in the numbers of hourly occurrences of values above or below their respective threshold, and their significance levels are given in the second column (b, f, j). The third column (c, g, k) shows the trends in the mean values of all hourly occurrences above or below the threshold, and the last column (d, h, l) displays their respective significance levels. White areas denote insignificance.
3.5 Spatial distribution of atmospheric conditions favouring extreme precipitation and flash flood events
The simultaneous occurrence of the three most characteristic identified atmospheric parameters from each component (CAPE, q, and WS10 m−500 hPa) within extreme-event-favouring parameter ranges is correlated with topography (Fig. 1c). Favourable atmospheric conditions occur most frequently over the Vosges Mountains in France and in south-western Germany, compared with the rest of the study area. Over eastern Belgium, favourable atmospheric conditions have occurred less than half as often between 1981 and 2020 (Fig. 7a). Within this period, the occurrence of favourable atmospheric conditions changed very little. Over south-western Germany, the simultaneous occurrence of these three parameters occurred only 1–2 h per summer more often, while over north-eastern France these conditions occur slightly less often (Fig. 7b). There is, however, no significance in trends with respect to these combinations (Fig. 7c). Splitting the 40-year period in two, 1981–2000 (Fig. 7d, e, f) and 2001–2020 (Fig. 7g, h, i), shows a decreasing trend within the first 20 years and a positive trend within the last 20 years. As these seem to be clear tendencies, they more or less level out over the entire time period. In line with the large variation in the number of occurrences of favourable atmospheric conditions per summer, none of the calculated trends are significant (Fig. 7f, i).
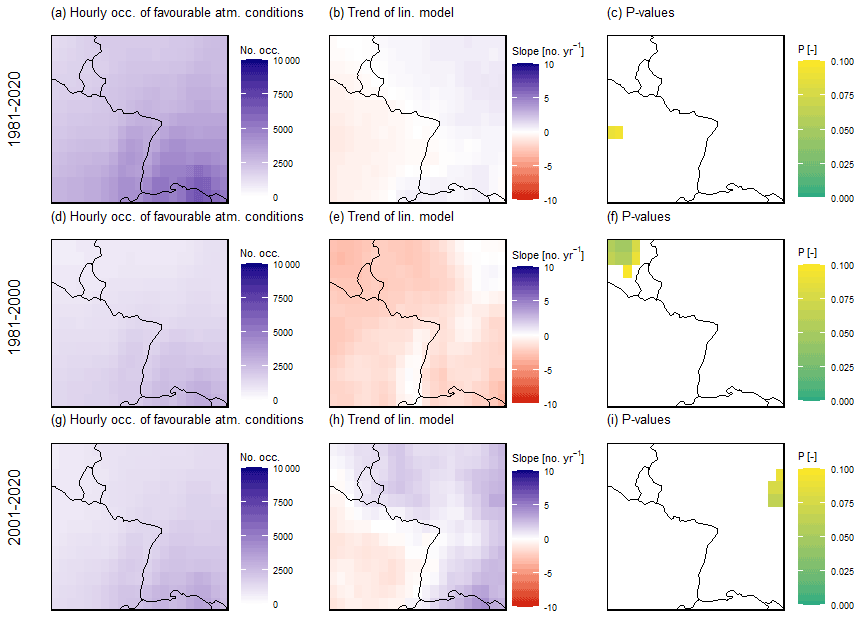
Figure 7Panel (a) shows the overall number of hourly occurrences of atmospheric conditions favouring extreme precipitation and flash flood events during the summer months between 1981 and 2020, panel (b) illustrates the positive trends in atmospheric conditions favouring extreme precipitation and flash flood events per year, and panel (c) presents the significance of the linear model. White areas denote insignificance. Panels (d) to (f) show the same as panels (a) to (c) respectively, although for the time period from 1981 and 2000; panels (g) to (i) present the same information for the period from 2001 to 2020.
We numbered P events as one event when the temporal distance between two events exceeded 30 min and the spatial distance exceeded 2 km. This method does not always account for connected events, such as the back-building effects of thunderstorm cells, and may lead to an artefact of counting too many P events. In the case of several P events per day on which a flash flood was identified, only the spatially closest or first P event was determined as flash flood triggering, which may sometimes underestimate the P characteristics leading to a flash flood. However, these phenomena are considered neglectable in central western Europe, where slow-moving single-cell thunderstorms are the main cause of flash floods, as indicated by the low DLS values identified. This characteristic is in contrast with larger events in the Mediterranean (Gaume et al., 2009) or the US (Gochis et al., 2015).
In the Mediterranean area (Llasat et al., 2016) and lowland catchments of Alpine regions, increases in flash floods have been observed (Sikorska-Senoner and Seibert, 2020). In central western Europe, there is also an increase in the number of reports and scientific publications on flash floods (e.g. Bronstert et al., 2018; Van Campenhout et al., 2015; Marchi et al., 2010; Ruiz-Villanueva et al., 2012). However, as per their nature, flash floods are rare phenomena. Therefore, we are not able to detect any trends based on the data that we have collected. The method of data collection is influenced by the progress of digitalization, which might make recent years appear more often in search engines. Additionally, we browsed through historical archives but did not find further entries. Moreover, any identified trend would be strongly influenced by 2 years in which especially many events occurred: 2016 and 2018 (and possibly the July 2021 floods, which were not considered in this paper but may further strengthen a possible increasing trend). During these event series, atmospheric conditions were characterized by exceptionally long-lasting weather patterns associated with very moist and unstable air masses. These conditions led to the extraordinarily high number and severity of thunderstorms with substantial flooding in central western Europe (Mohr et al., 2020; Piper et al., 2016).
Based on the DWD's RADOLAN dataset, we were not able to detect any linear trends in the number of precipitation events per year nor their maximum hourly or 5 min intensities between 2002 and 2020. These findings are in line with similar analyses done by the German Weather Service (DWD) and Gesamtverband der Deutschen Versicherungswirtschaft e.V (GDV) (2019). As the detection of extreme precipitation events remained challenging due to their localized occurrence, large-scale data were only available through the deployment of a dense radar station network as of 2002. Note that this observation period remains rather short and does not allow one to infer solid conclusions on potential trends. Also, while weather radars provide precipitation data of high spatial resolution, various sources of uncertainty may prevail, such as those related to precipitation type and intensity, topography, and distance to the radar source (Meischner, 2014; Strangeways, 2007; Winterrath et al., 2017). We accounted for some of these potential effects (e.g. rain gauge adjustments, detection, and correction of possible anomalous propagation echoes). However, perhaps trends in extreme precipitation events could also be detected when considering preceding decades. Müller and Pfister (2011) analysed longer time series starting in 1980 and indeed found an increase in intense rainstorms during the summer months in western Germany (Emscher–Lippe catchment). However, precipitation generally varies considerably on an interannual basis and makes trend analyses challenging. In previous work (Meyer et al., 2020), we analysed 98 daily precipitation station data in the Moselle catchment, which is situated in the west of the study area, over a 65-year period and could not find trends in the daily precipitation maxima nor the number of days with precipitation amounts above 50 mm d−1. While the daily precipitation sum should be a reliable indicator of extreme precipitation amounts, the coarse station network probably missed high rainfall amounts that fell in between stations. As both the long-term coarsely resolved dataset and the highly resolved short-term dataset did not show clear trends, we could not confirm the hypothesis of an increase in extreme precipitation events within the study area.
We found that atmospheric conditions favouring extreme precipitation and subsequent flash flood events became slightly more frequent, and the intensities of relevant atmospheric parameters increased. The most significant increases were found for the moisture parameters, in line with the assumption of the Clausius–Clapeyron relationships (Lenderink and Van Meijgaard, 2008; Martinkova and Kysely, 2020; Mishra et al., 2012). Both TCWV and q increased significantly over central western Europe, indicating potentially higher precipitation amounts. However, rising air temperatures inhibit an increase in higher RH (Rädler et al., 2018). The increase in q also causes instability parameters, such as CAPE and the K index, to increase at a significant level in some areas. This matches well with the findings of Taszarek et al. (2021b), who documented an increase in CAPE over central Europe. Trends in CIN are, however, ambiguous within the same period. While favourable conditions do occur more often in some areas, there are indications that CIN increases as well. This increase in CIN might offset some of the instability increases due to CAPE (Taszarek et al., 2021a). In this study, we did not analyse the simultaneous occurrences of CAPE and CIN in detail, but Chen et al. (2020) found highly complex interactions, suggesting that future moist convection and rainstorms may become less frequent but more intense. Regarding low wind speeds and weak DLS, we found sightly increasing but barely significant trends. Increasing trends in weak LLS are significant in the south-eastern part of the study area. Overall, the proxy parameters used for the assessment of organization and motion of storm systems remained largely unchanged, with tendencies favouring the occurrence of extreme precipitation. Studies looking at substantial DLS for other convective hazards, such as hail or tornadoes, also did not identify significant trends in the past over Europe (Púčik et al., 2017; Rädler et al., 2018). Studies investigating future conditions across the US, however, even suggest decreases in DLS (Brooks, 2013; Diffenbaugh et al., 2013). Wind speed and shear are not directly relevant for triggering precipitation, but they can slightly increase the duration of an event; thus, they can potentially contribute to the development of flash floods. The coarse resolution of the ERA5 atmospheric data might miss smaller-scale wind features related to orography. Even though extreme precipitation and flash floods tend to occur locally, they happen during conditions favouring mesoscale to large-scale circulation, which should be well captured by the reanalysis data.
The values of the considered atmospheric parameters cover the expected ranges of occurrence. However, to include 75 % of all precipitation and flash flood events, we had to include an even wider parameter range. This holds especially true for the respective lower and upper thresholds of CAPE and CIN, which appear low and high compared with common values present during thunderstorms respectively (Púčik et al., 2015; Taszarek et al., 2017). In the ERA5 data, both parameters showed an extremely high variability in space and time. This variability in CAPE also leads to a relatively low number of hours with all parameters within their ranges, as shown in Sect. 3.5 (Fig. 7). However, the consistently low values of DLS are striking. While we stated in the beginning, that DLS can be either low or high, this does not seem the case in this region. Extreme rainfall and flash flood events seem to be consistently caused by slow-moving single-cell thunderstorms. In the US, in contrast, many flood-producing storms are larger and more organized mesoscale convective systems (Ashley and Ashley, 2008; Dougherty and Rasmussen, 2019; Schumacher and Johnson, 2006). The floods considered in US studies are, however, related to rather large and deadly flash floods, whereas flash floods in central Europe generally do not reach comparable dimensions.
The focus of our work was the attempt to link atmospheric conditions, extreme precipitation, and flash floods: we hypothesized that the conjectured increase in flash floods is a consequence of more intense or more frequent precipitation events that are initiated by thunderstorm-favouring atmospheric conditions. However, the reality seems to be a lot more complex. While atmospheric conditions tend to become more unstable and overall warmer air masses potentially possess a higher amount of water vapour, the expected increase in (convective) precipitation events was not obvious from the 20 years of analysed data.
Factors other than those that we have considered in this study may influence the development of flash floods. One such factor could be the duration of thunderstorm-favouring atmospheric conditions. Both remarkable flash flood series from 2016 and 2018 occurred during atmospheric blocking situations (Mohr et al., 2020; Piper et al., 2016) that stymied the movement of the atmosphere, ultimately causing weather constellations to last longer and, thus, creating extreme situations. In recent years, such situations have been increasingly observed, especially in summer (Detring et al., 2021; Kreienkamp et al., 2021; Lupo, 2020). This could hint at a change in the intra-annual distribution of precipitation, while the number of precipitation events as well as their maximum 5 min and hourly intensity stayed – apart from their large intra-annual variations – at a similar level between 2001 and 2020. Sequences with abundant rainfall may eventually cause a catchment's soil moisture to rise and may accelerate the development of a flood event. While low top-level soil moisture before the precipitation events might show the typical pattern of central Europe, where thunderstorms mostly occur after a few warm and dry days, this does not seem to not be the case when flash flooding is caused. The soil moisture is then already elevated at the top layers of the soil to the “average” level by previous rainfall and causes a faster runoff response, including infiltration excess overland flow. Flash floods in continental regions mostly occur when soil moisture is high at the onset of an event (Marchi et al., 2010; Pfister et al., 2020). Moreover, catchment-specific parameters such as topography, land use, soil properties, geology, or other factors may equally impact the development of flash floods (Marchi et al., 2010).
The goal of our study was to identify and analyse the atmospheric conditions prevailing during extreme precipitation and flash flood events in temperate regions of central western Europe. For this purpose, we compiled a flash flood database based on scientific literature, water agency data, and information from local consultants, and we analysed it using linear regression models. For the identification of extreme precipitation events that could potentially trigger flash floods, we relied on a 5 min radar dataset (RADOLAN, DWD) and analysed all precipitation events exceeding the threshold of 40 mm h−1 statistically considering maximum hourly and 5 min precipitation intensities as well as the temporal and spatial coverage of events. The identified flash flood and precipitation events were then connected to convection-relevant atmospheric parameters of the ERA5 reanalysis dataset representing instability, moisture content, and storm motion and organization. We leveraged these data for testing our hypothesis that a change in atmospheric conditions has led to more frequent extreme precipitation events that have subsequently triggered flash flood events in central western Europe. It should be noted that the conjectured increase in the occurrence of flash floods could not be tested due to inconsistencies in the database. We tested our hypothesis in two steps:
- 1.
An increase in the frequency and intensity of extreme precipitation events could not be supported with the available database and analysis, due to a large interannual variation in events and a relatively short period of 20 years. Future analyses could incorporate the intra-annual temporal distribution of extreme precipitation events. Perhaps, rainfall events that were formerly evenly distributed now tend to occur in a more condensed fashion (within a few days).
- 2.
Via proxy parameters, we did find changes in the occurrence of atmospheric conditions favouring extreme precipitation and flash flood events. High absolute moisture content (specific humidity, q, and total column water vapour, TCWV) increased significantly between 1981 and 2020, while relative humidity (RH) decreased slightly. Proxy parameters representing sufficient instability sufficient instability (convective available potential energy, CAPE, and the K index) also increased also increased; moreover the convective inhibition (CIN) increased, which might oppose some of the instability gains of CAPE (Taszarek et al., 2021a). Parameters determining weak storm motion and organization (wind speed, WS10 m−500 hPa, and deep layer shear, DLS) did not show significant changes, but the occurrence of weak low-level shear increased slightly. Overall, the most important components favouring flash-flood-relevant atmospheric conditions, abundant moisture, and sufficient latent instability have become more frequent, and higher values indicate possibly more severe events.
Consequently, only sub-hypothesis 1 is supported, and sub-hypothesis 2 is rejected. Hence, the simple causal chain between atmospheric conditions, extreme precipitation, and flash floods assumed in the overarching hypothesis does not do justice to the entire complexity of problems. Interconnections seem far more complex than hypothesized. In addition to the hypothesis, we mostly found higher upper-layer (0–7 cm) and lower-layer (28–100 cm) soil moisture during flash flood events compared with general extreme precipitation events. These results might point us in other directions, possibly to changes in intra-annual temporal patterns of rainfall and, consequently, different pre-event soil moisture conditions. Another explanation might be non-atmospheric, catchment-specific parameters that were not considered in this study.
To the best of our knowledge, this work is nonetheless among the first studies focussing on the convective hazard of extreme precipitation that has often been neglected, giving priority to hail or tornadoes. As extreme precipitation is extremely variable in space and time and can derive from many different weather constellations, it remains a challenge to pinpoint atmospheric conditions that trigger these events. This makes possible assumptions about the future extremely challenging.
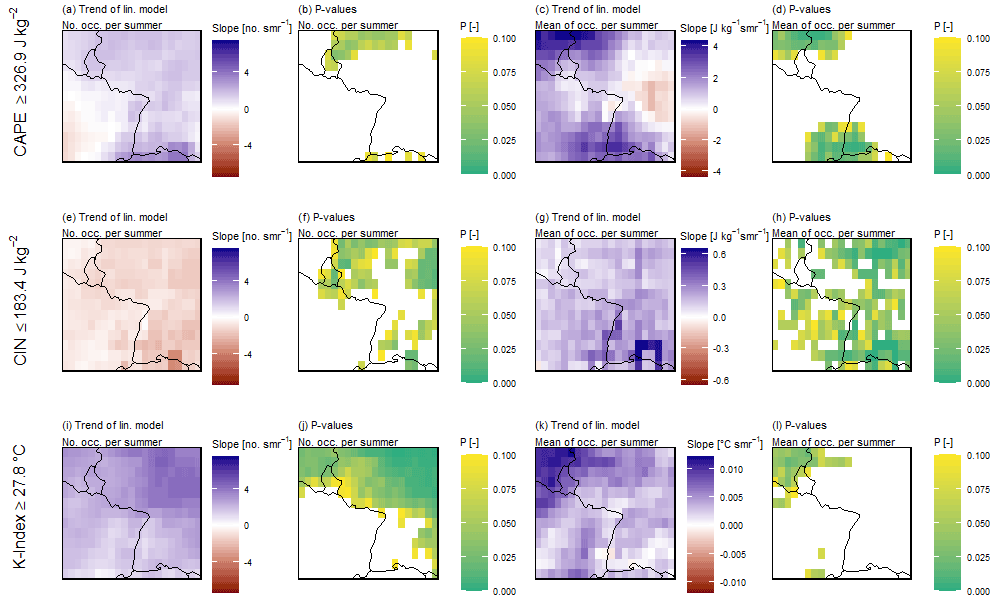
Figure A1Trend analysis of the three variables for instability (CAPE, CIN, and the K index) per summer (smr). The first column (a, e, i) shows the trends in the numbers of hourly occurrences of values above their respective threshold, and their significance levels are given in the second column (b, f, j). The third column (c, g, k) shows the trends in the mean values of all hourly occurrences above the threshold, and the last column (d, h, l) presents their respective significance levels. White areas denote insignificance.
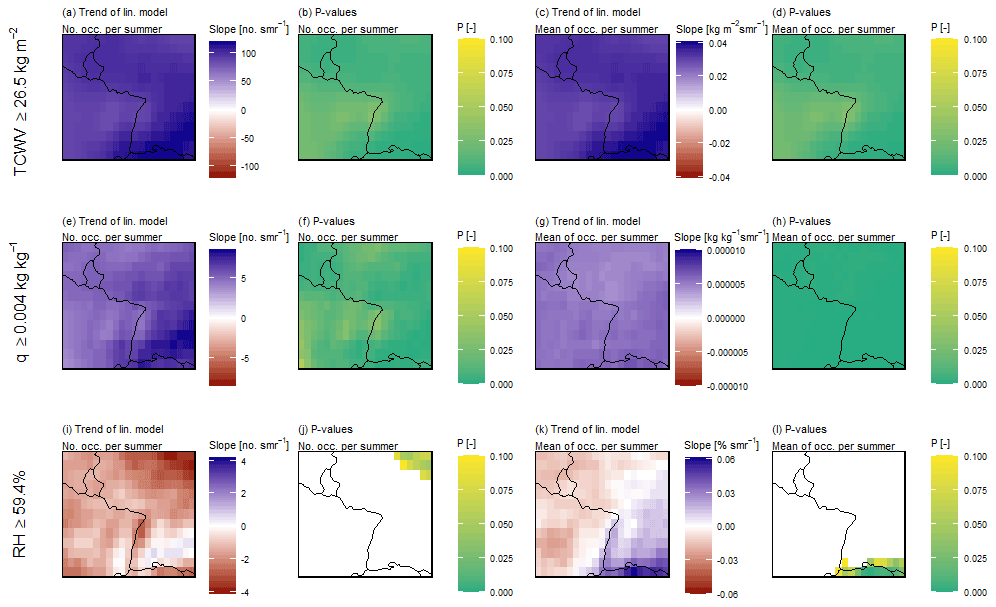
Figure A2Trend analysis of the three variables for moisture (TCWV, q, and RH) per summer (smr). The first column (a, e, i) shows the trends in the numbers of hourly occurrences of values above their respective threshold, and their significance levels are given in the second column (b, f, j). The third column (c, g, k) shows the trends in the mean values of all hourly occurrences above the threshold, and the last column (d, h, l) provides their respective significance levels. White areas denote insignificance.
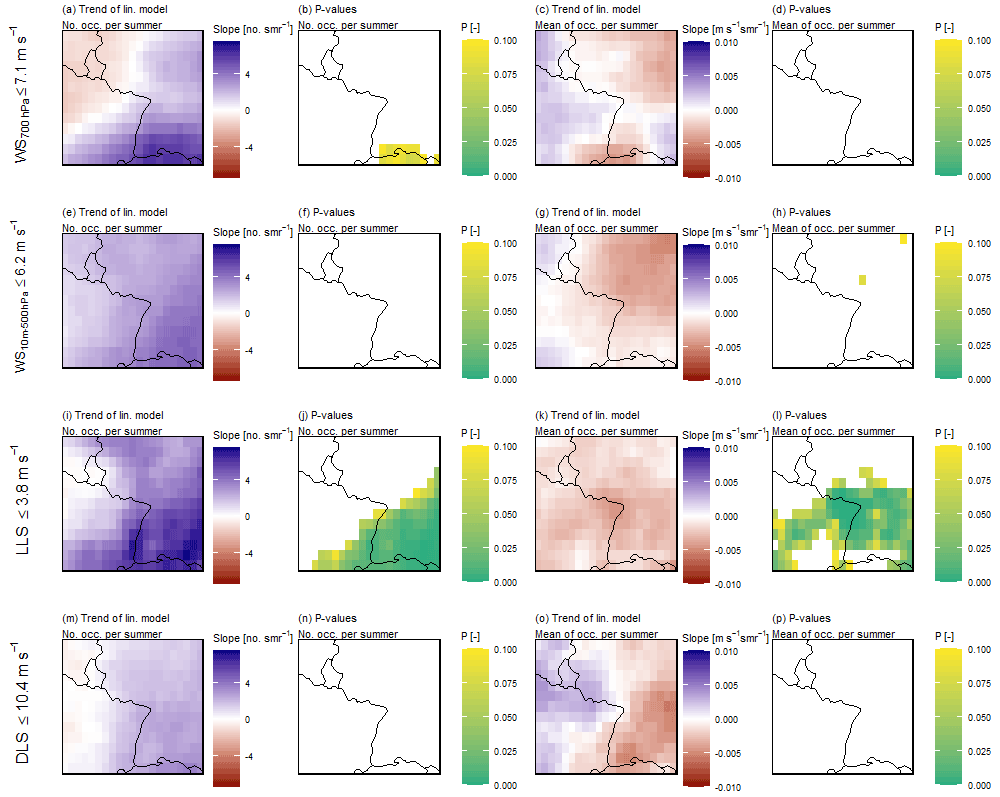
Figure A3Trend analysis of the four variables for storm motion and organization (WS700 hPa, WS10 m−500 hPa, LLS, and DLS) per summer (smr). The first column (a, e, i, m) shows the trends in the numbers of hourly occurrences of values above their respective threshold, and their significance levels are given in the second column (b, f, j, n). The third column (c, g, k, o) shows the trends in the mean values of all hourly occurrences above the threshold, and the last column (d, h, l, p) presents their respective significance levels. White areas denote insignificance.
The flash flood database used in this paper is given in the Supplement. The RADOLAN radar dataset from the German Weather Service (DWD) is free for download from their open data server: https://opendata.dwd.de/climate_environment/CDC/grids_germany/5_minutes/radolan/reproc/2017_002/ (last access: 10 June 2021, Winterrath et al., 2018). The ERA5 atmospheric parameters are also free for download from the Climate Data Store (CDS) of the Copernicus Climate Change Service (C3S): https://cds.climate.copernicus.eu (last access: 11 May 2022, Hersbach et al., 2018a, b, 2020; Muñoz Sabater, 2019).
The supplement related to this article is available online at: https://doi.org/10.5194/hess-26-6163-2022-supplement.
JM, MN, LP, and LM conceptualized the study. JM collected the flash flood and ERA5 data, carried out the analysis, and wrote the first draft of the paper. MN provided the processed precipitation radar data. All the co-authors (JM, MN, LP, LM, and EZ) contributed to and edited the manuscript.
The contact author has declared that neither of the authors has any competing interests.
Publisher's note: Copernicus Publications remains neutral with regard to jurisdictional claims in published maps and institutional affiliations.
We acknowledge all of the providers of data used in this work: the German Weather Service (DWD) for the RADOLAN radar data, the Copernicus Climate Change Service for the ERA5 dataset, and Catharin Schäfer and Hans Göppert from the engineering consultancy WALD + CORBE for providing their collection of flash flood events.
This research has been supported by the Fonds National de la Recherche Luxembourg (grant no. PRIDE15/10623093/HYDRO-CSI).
This paper was edited by Manuela Irene Brunner and reviewed by Ruben Imhoff and two anonymous referees.
Ashley, S. T. and Ashley, W. S.: The storm morphology of deadly flooding events in the United States, Int. J. Climatol., 28, 493–503, https://doi.org/10.1002/joc.1554, 2008.
Bertola, M., Viglione, A., Lun, D., Hall, J., and Blöschl, G.: Flood trends in Europe: are changes in small and big floods different?, Hydrol. Earth Syst. Sci., 24, 1805–1822, https://doi.org/10.5194/hess-24-1805-2020, 2020.
Bertola, M., Viglione, A., Vorogushyn, S., Lun, D., Merz, B., and Blöschl, G.: Do small and large floods have the same drivers of change?, A regional attribution analysis in Europe, Hydrol. Earth Syst. Sci., 25, 1347–1364, https://doi.org/10.5194/hess-25-1347-2021, 2021.
Brauer, C. C., Teuling, A. J., Overeem, A., van der Velde, Y., Hazenberg, P., Warmerdam, P. M. M., and Uijlenhoet, R.: Anatomy of extraordinary rainfall and flash flood in a Dutch lowland catchment, Hydrol. Earth Syst. Sci., 15, 1991–2005, https://doi.org/10.5194/hess-15-1991-2011, 2011.
Bronstert, A., Agarwal, A., Boessenkool, B., Fischer, M., Heistermann, M., and Köhn-Reich, L.: Die Sturzflut von Braunsbach am 29. Mai 2016 – Entstehung, Ablauf und Schäden eines “Jahrhundertereignisses”, Teil 1: Meteorologische und hydrologische Analyse, Hydrol. und Wasserbewirtschaftung, 61, 150–162, https://doi.org/10.5675/HyWa, 2017.
Bronstert, A., Agarwal, A., Boessenkool, B., Crisologo, I., Fischer, M., Heistermann, M., Köhn-Reich, L., López-Tarazón, J. A., Moran, T., Ozturk, U., Reinhardt-Imjela, C., and Wendi, D.: Forensic hydro-meteorological analysis of an extreme flash flood: The 2016-05-29 event in Braunsbach, SW Germany, Sci. Total Environ., 630, 977–991, https://doi.org/10.1016/j.scitotenv.2018.02.241, 2018.
Brooks, H. E.: Severe thunderstorms and climate change, Atmos. Res., 123, 129–138, https://doi.org/10.1016/j.atmosres.2012.04.002, 2013.
Brooks, H. E.: Proximity soundings for severe convection for Europe and the United States from reanalysis data, Atmos. Res., 93, 546–553, https://doi.org/10.1016/j.atmosres.2008.10.005, 2009.
Bucała-Hrabia, A., Kijowska-Strugała, M., Bryndal, T., Cebulski, J., Kiszka, K., and Kroczak, R.: An integrated approach for investigating geomorphic changes due to flash flooding in two small stream channels (Western Polish Carpathians), J. Hydrol. Reg. Stud., 31, 100731, https://doi.org/10.1016/j.ejrh.2020.100731, 2020.
Caisse Centrale de Réassurance (CCR): Événements – inondations, Paris, https://catastrophes-naturelles.ccr.fr/les-evenements, last access: 24 September 2021.
Chen, J., Dai, A., Zhang, Y., and Rasmussen, K. L.: Changes in convective available potential energy and convective inhibition under global warming, J. Climate, 33, 2025–2050, https://doi.org/10.1175/JCLI-D-19-0461.1, 2020.
Detring, C., Müller, A., Schielicke, L., Névir, P., and Rust, H. W.: Occurrence and transition probabilities of omega and high-over-low blocking in the Euro-Atlantic region, Weather Clim. Dyn., 2, 927–952, https://doi.org/10.5194/wcd-2-927-2021, 2021.
Diffenbaugh, N. S., Scherer, M., and Trapp, R. J.: Robust increases in severe thunderstorm environments in response to greenhouse forcing, P. Natl. Acad. Sci. USA, 110, 16361–16366, https://doi.org/10.1073/pnas.1307758110, 2013.
Doswell, C. A. and Schultz, D. M.: On the use of indices and parameters in forecasting severe storms, E-Journal Sev. Storms Meteorol., 1, 1–22, 2006.
Doswell, C. A., Brooks, H. E., and Maddox, R. A.: Flash flood forecasting: An ingredients-based methodology, Weather Forecast., 11, 560–581, https://doi.org/10.1175/1520-0434(1996)011< 0560:FFFAIB>2.0.CO;2, 1996.
Dougherty, E. and Rasmussen, K. L.: Climatology of flood-producing storms and their associated rainfall characteristics in the United States, Mon. Weather Rev., 147, 3861–3877, https://doi.org/10.1175/MWR-D-19-0020.1, 2019.
Eden, J. M., Kew, S. F., Bellprat, O., Lenderink, G., Manola, I., Omrani, H., and van Oldenborgh, G. J.: Extreme precipitation in the Netherlands: An event attribution case study, Weather Clim. Extrem., 21, 90–101, https://doi.org/10.1016/j.wace.2018.07.003, 2018.
Franceinfo: 3 grand est, https://france3-regions.francetvinfo.fr/meteo/inondations?r=grand-est (last access: 18 November 2022), 2021.
Funk, T. W.: Forecasting Techniques Utilized by the Forecast Branch of the National Meteorological Center During a Major Convective Rainfall Event, Weather Forecast., 6, 548–564, 1991.
Gaume, E., Bain, V., Bernardara, P., Newinger, O., Barbuc, M., Bateman, A., Blöschl, G., Borga, M., Dumitrescu, A., Daliakopoulos, I., Garcia, J., Irimescu, A., Kohnova, S., Koutroulis, A., Marchi, L., Matreata, S., Medina, V., Preciso, E., Sempere-torres, D., Stancalie, G., Szolgay, J., Tsanis, I., Velasco, D., and Viglione, A.: A compilation of data on European flash floods, J. Hydrol., 367, 70–78, https://doi.org/10.1016/j.jhydrol.2008.12.028, 2009.
George, J. J.: Weather forecasting for aeronautics, Academic Press, New York City, ISBN 9781483233208, 1960.
German Weather Service (DWD): Starkregen, Wetter- und Klimalexikon, https://www.dwd.de/DE/service/lexikon/begriffe/S/Starkregen.html, last access: 20 May 2021.
German Weather Service (DWD) and Gesamtverband der Deutschen Versicherungswirtschaft e.V (GDV): Forschungsprojekt “Starkregen” – Fachbericht: Eine Zusammenfassung der wichtigsten Ergebnisse des Projekts zum Zusammenhang zwischen Starkregen und versicherten Schäden untersucht von GDV und DWD, https://www.gdv.de/resource/blob/63746/ac53789625df198043ea0779329b42d9/fachbericht-data.pdf (last access: 18 November 2022), 2019.
Gochis, D., Schumacher, R., Friedrich, K., Doesken, N., Kelsch, M., Sun, J., Ikeda, K., Lindsey, D., Wood, A., Dolan, B., Matrosov, S., Newman, A., Mahoney, K., Rutledge, S., Johnson, R., Kucera, P., Kennedy, P., Sempere-Torres, D., Steiner, M., Roberts, R., Wilson, J., Yu, W., Chandrasekar, V., Rasmussen, R., Anderson, A., and Brown, B.: The great Colorado flood of September 2013, B. Am. Meteorol. Soc., 96, 1461–1487, https://doi.org/10.1175/BAMS-D-13-00241.1, 2015.
Göppert, H.: Auswertung von abgelaufenen Starkregenereignissen über Radarmessungen, Wasserwirtschaft, 108, 44–50, https://doi.org/10.1007/s35147-018-0223-8, 2018.
Groenemeijer, P. H. and van Delden, A.: Sounding-derived parameters associated with large hail and tornadoes in the Netherlands, Atmos. Res., 83, 473–487, https://doi.org/10.1016/j.atmosres.2005.08.006, 2007.
Hall, A. J.: Flash Flood Forecasting, World Meteorological Organization, 577, 18, 1–38, ISBN 92-63-10577-4, 1981.
Hersbach, H., Bell, B., Berrisford, P., Biavati, G., Horányi, A., Muñoz Sabater, J., Nicolas, J., Peubey, C., Radu, R., Rozum, I., Schepers, D., Simmons, A., Soci, C., Dee, D., and Thépaut, J.-N.: ERA5 hourly data on pressure levels from 1979 to present, Copernicus Clim. Chang. Serv. Clim. Data Store, [data set], https://doi.org/10.24381/cds.bd0915c6, 2018a.
Hersbach, H., Bell, B., Berrisford, P., Biavati, G., Horányi, A., Muñoz Sabater, J., Nicolas, J., Peubey, C., Radu, R., Rozum, I., Schepers, D., Simmons, A., Soci, C., Dee, D., and Thépaut, J.-N.: ERA5 hourly data on single levels from 1979 to present, Copernicus Clim. Chang. Serv. Clim. Data Store, [data set], https://doi.org/10.24381/cds.adbb2d47, 2018b.
Hersbach, H., Bell, B., Berrisford, P., Hirahara, S., Horányi, A., Muñoz-Sabater, J., Nicolas, J., Peubey, C., Radu, R., Schepers, D., Simmons, A., Soci, C., Abdalla, S., Abellan, X., Balsamo, G., Bechtold, P., Biavati, G., Bidlot, J., Bonavita, M., De Chiara, G., Dahlgren, P., Dee, D., Diamantakis, M., Dragani, R., Flemming, J., Forbes, R., Fuentes, M., Geer, A., Haimberger, L., Healy, S., Hogan, R. J., Hólm, E., Janisková, M., Keeley, S., Laloyaux, P., Lopez, P., Lupu, C., Radnoti, G., de Rosnay, P., Rozum, I., Vamborg, F., Villaume, S., and Thépaut, J. N.: The ERA5 global reanalysis, [data set], Q. J. R. Meteorol. Soc., 146, 1999–2049, https://doi.org/10.1002/qj.3803, 2020.
Johst, M., Gerlach, N., and Demuth, N.: Starkregen und Hochwasser im Mai/Juni 2018, Mainz, Germany, http://www.hochwasser-rlp.de/publikationen/bericht_juni_2018.pdf (last access: 18 November 2022), 2018.
Junker, N. W., Schneider, R. S., and Fauver, S. L.: A study of heavy rainfall events during the great midwest flood of 1993, Weather Forecast., 14, 701–712, https://doi.org/10.1175/1520-0434(1999)014< 0701:ASOHRE>2.0.CO;2, 1999.
Kreienkamp, F., Philip, S. Y., Tradowsky, J. S., Kew, S. F., Lorenz, P., Arrighi, J., Belleflamme, A., Bettmann, T., Caluwaerts, S., Chan, S. C., Ciavarella, A., De Cruz, L., de Vries, H., Demuth, N., Ferrone, A., Fischer, E. M., Fowler, H. J., Goergen, K., Heinrich, D., Henrichs, Y., Lenderink, G., Kaspar, F., Nilson, E., Otto, F. E. L., Ragone, F., Seneviratne, S. I., Singh, R. K., Skålevåg, A., Termonia, P., Thalheimer, L., van Aalst, M., Van den Bergh, J., Van de Vyver, H., Vannitsem, S., van Oldenborgh, G. J., Van Schaeybroeck, B., Vautard, R., Vonk, D., and Wanders, N.: Rapid attribution of heavy rainfall events leading to the severe flooding in Western Europe during July 2021, R. Netherlands Meteorol. Inst., 13 (July), 18, https://www.worldweatherattribution.org/wp-content/uploads/Scientific-report-Western-Europe-floods-2021-attribution.pdf (last access: 18 November 2022), 2021.
Lenderink, G. and Van Meijgaard, E.: Increase in hourly precipitation extremes beyond expectations from temperature changes, Nat. Geosci., 1, 511–514, https://doi.org/10.1038/ngeo262, 2008.
Llasat, M. C., Marcos, R., Llasat-Botija, M., Gilabert, J., Turco, M., and Quintana-Seguí, P.: Flash flood evolution in North-Western Mediterranean, Atmos. Res., 149, 230–243, https://doi.org/10.1016/j.atmosres.2014.05.024, 2014.
Llasat, M. C., Marcos, R., Turco, M., Gilabert, J., and Llasat-Botija, M.: Trends in flash flood events versus convective precipitation in the Mediterranean region: The case of Catalonia, J. Hydrol., 541, 24–37, https://doi.org/10.1016/j.jhydrol.2016.05.040, 2016.
Lupo, A. R.: Atmospheric blocking events: a review, Ann. N. Y. Acad. Sci., https://doi.org/10.1111/nyas.14557, 2020.
Luxemburger Wort: Luxemburger Wort – Archiv, https://www.wort.lu/de/archive (last access: 18 November 2022), 2021.
Marchi, L., Borga, M., Preciso, E., and Gaume, E.: Characterisation of selected extreme flash floods in Europe and implications for flood risk management, J. Hydrol., 394, 118–133, https://doi.org/10.1016/j.jhydrol.2010.07.017, 2010.
Markowski, P. M., and Richardson, Y. P.: Hazards associated with deep moist convection. Mesoscale Meteorology in Midlatitudes, John Wiley & Sons, Ltd, 273–312, ISBN 978-0-470-74213-6, 2010.
Martinkova, M. and Kysely, J.: Overview of observed clausius-clapeyron scaling of extreme precipitation in midlatitudes, Atmosphere, 11, 1–16, https://doi.org/10.3390/ATMOS11080786, 2020.
Mathias, L.: Major flood event in the Mullerthal region on 1 June 2018: event analysis and predictability, MeteoLux, (June 2018), 1–17, 2019.
Mathias, L.: Synoptic-mesoscale analysis of the flash-flood-producing thunderstorm over the Vallée de l'Ernz on 22 July 2016, MeteoLux, (July 2016), 1–18, 2021.
Meischner, P.: Weather Radar: Principles and Advanced Applications, Springer Berlin Heidelberg, Berlin, ISBN 3-540-00328-2, 2014.
Meyer, J., Douinot, A., Zehe, E., Tamez-Meléndez, C., Francis, O., and Pfister, L.: Impact of Atmospheric Circulation on Flooding Occurrence and Type in Luxembourg (Central Western Europe), EGU General Assembly 2020, Online, 4–8 May 2020, EGU2020-13953, https://doi.org/10.5194/egusphere-egu2020-13953, 2020.
Michaelides, S. C.: Precipitation: Advances in measurement, estimation, and prediction, 1st ed., edited by: Michaelides, S. C., Springer, ISBN 978-3-540-77654-3, 2008.
Mishra, V., Wallace, J. M., and Lettenmaier, D. P.: Relationship between hourly extreme precipitation and local air temperature in the United States, Geophys. Res. Lett., 39, L16403, https://doi.org/10.1029/2012GL052790, 2012.
Mohr, S., Wilhelm, J., Wandel, J., Kunz, M., Portmann, R., Punge, H. J., Schmidberger, M., Quinting, J. F., and Grams, C. M.: The role of large-scale dynamics in an exceptional sequence of severe thunderstorms in Europe May–June 2018, Weather Clim. Dynam., 1, 325–348, https://doi.org/10.5194/wcd-1-325-2020, 2020.
Müller, E. N. and Pfister, A.: Increasing occurrence of high-intensity rainstorm events relevant for the generation of soil erosion in a temperate lowland region in Central Europe, J. Hydrol., 411, 266–278, https://doi.org/10.1016/j.jhydrol.2011.10.005, 2011.
Muñoz Sabater, J.: ERA5-Land hourly data from 1981 to present, Copernicus Clim. Chang. Serv. Clim. Data Store, [data set], https://doi.org/10.24381/cds.e2161bac, 2019.
NWS: National Weather Service Glossary, https://forecast.weather.gov/glossary.php (last access: 22 August 2022), 2021.
Owen, P. W., Roberts, G., Prigent, O., Markus, R., Tanguy, B., Bridgford, M., Katharina, B., Ciabatti, I., Gatter, L., Gilson, V., Kubat, J., Laanes, L., Simeonova, R., Critoph, H., and Annette, Z.: Flood Directive: progress in assessing risks, while planning and implementation need to improve, Special Report No. 25, Luxembourg, https://doi.org/10.2865/12240, 2018.
Pfister, L., Kwadijk, J., Musy, A., Bronstert, A., and Hoffmann, L.: Climate change, land use change and runoff prediction in the Rhine-Meuse basins, River Res. Appl., 20, 229–241, https://doi.org/10.1002/rra.775, 2004.
Pfister, L., Faber, O., Hostache, R., Iffly, J. F., Matgen, P., Minette, F., Trebs, I., Bastian, C., Göhlhausen, D., Meisch, C., and Patz, N.: Crue éclair du 22 juillet 2016 dans la region de Larochette – Étude méchanistique et fréquentielle réalisée en 2018 pour le compte de l'Administration de la gestion de l'eau, Esch-sur-Alzette, https://eau.gouvernement.lu/dam-assets/publications/crue-éclair-du-22-juillet-2016/1812-LIST-BrochureCrueEclair.pdf (last access: 18 November 2022), 2018.
Pfister, L., Douinot, A., Hostache, R., François, I. J., Matgen, P., Minette, F., Bastian, C., Gilbertz, C., Göhlhausen, D., Meisch, C., and Patz, N.: Crues subites 2018 – Étude méchanistique et fréquentielle des crues subites de 2018 au Luxembourg, Esch-sur-Alzette, https://eau.gouvernement.lu/fr/services-aux-citoyens/publications/2021/brochures/Crues-subites-2018.html (last access: 18 November 2022), 2020.
Piper, D., Kunz, M., Ehmele, F., Mohr, S., Mühr, B., Kron, A., and Daniell, J.: Exceptional sequence of severe thunderstorms and related flash floods in May and June 2016 in Germany – Part 1: Meteorological background, Nat. Hazards Earth Syst. Sci., 16, 2835–2850, https://doi.org/10.5194/nhess-16-2835-2016, 2016.
Púčik, T., Groenemeijer, P., Riva, D., and Kolář, M.: Proximity soundings of severe and nonsevere thunderstorms in central Europe, Mon. Weather Rev., 143, 4805–4821, https://doi.org/10.1175/MWR-D-15-0104.1, 2015.
Púčik, T., Groenemeijer, P., Rädler, A. T., Tijssen, L., Nikulin, G., Prein, A. F., van Meijgaard, E., Fealy, R., Jacob, D., and Teichmann, C.: Future changes in European severe convection environments in a regional climate model ensemble, J. Climate, 30, 6771–6794, https://doi.org/10.1175/JCLI-D-16-0777.1, 2017.
Rädler, A. T., Groenemeijer, P., Faust, E., and Sausen, R.: Detecting severe weather trends using an additive regressive convective hazard model (AR-CHaMo), J. Appl. Meteorol. Clim., 57, 569–587, https://doi.org/10.1175/JAMC-D-17-0132.1, 2018.
Rasmussen, K. L., Rasmussen, A. F. P. R. M., and Liu, K. I. C.: Changes in the convective population and thermodynamic environments in convection-permitting regional climate simulations over the United States, Clim. Dynam., 55, 383–408, https://doi.org/10.1007/s00382-017-4000-7, 2017.
Rauber, R. M., Charlevoix, D. J., and Walsh, J. E.: Severe and hazardous weather: an introduction to high impact meteorology, 3rd ed., Kendall/Hunt Publishing Company, Dubuque, Iowa, ISBN 0757550436, 2008.
Ruiz-Villanueva, V., Borga, M., Zoccatelli, D., Marchi, L., Gaume, E., and Ehret, U.: Extreme flood response to short-duration convective rainfall in South-West Germany, Hydrol. Earth Syst. Sci., 16, 1543–1559, https://doi.org/10.5194/hess-16-1543-2012, 2012.
Schroeder, A., Basara, J., and Shepherd, J. Marshall, Nelson, S.: Insights into Atmospheric Contributors to Urban Flash Flooding across the United States Using an Analysis of Rawinsonde Data and Associated Calculated Parameters, J. Appl. Meteorol. Clim., 55, 313–323, https://doi.org/10.1175/JAMC-D-14-0232.1, 2016.
Schumacher, R. S. and Johnson, R. H.: Characteristics of U. S. Extreme Rain Events during 1999 – 2003, Weather Forecast., 21, 69–85, https://doi.org/10.1175/WAF900.1, 2006.
Sevruk, B.: Correction of precipitation measurements, summary report. In: Sevruk, B. (Eds.): Correction Of Precipitation Measurements. ETH/IASH/WMO Workshop on the Correction of Precipitation Measurements, Zürich, April 1–3, 1985, Züricher Geographische Schriften 23, ETH, Geographisches Institut, Zürich, 13–23, 1986.
Sikorska-Senoner, A. E. and Seibert, J.: Flood-type trend analysis for alpine catchments, Hydrol. Sci. J., 65, 1281–1299, https://doi.org/10.1080/02626667.2020.1749761, 2020.
Strangeways, I.: Precipitation: theory, measurement and distribution, Cambridge University Press, Cambridge, ISBN 13978-0-521-85117-6, 2007.
Taszarek, M., Brooks, H. E., and Czernecki, B.: Sounding-derived parameters associated with convective hazards in Europe, Mon. Weather Rev., 145, 1511–1528, https://doi.org/10.1175/MWR-D-16-0384.1, 2017.
Taszarek, M., Allen, J. T., Brooks, H. E., Pilguj, N., and Czernecki, B.: Differing trends in United States and European Severe Thunderstorm Environments in a Warming Climate, B. Am. Meteorol. Soc., 102, 296–322, https://doi.org/10.1175/BAMS-D-20-0004.1, 2021a.
Taszarek, M., Allen, J. T., Marchio, M., and Brooks, H. E.: Global climatology and trends in convective environments from ERA5 and rawinsonde data, Clim. Atmos. Sci., 4, 1–11, https://doi.org/10.1038/s41612-021-00190-x, 2021b.
Van Campenhout, J., Hallot, E., Houbrechts, G., Peeters, A., Levecq, Y., Gérard, P., and Petit, F.: Flash floods and muddy floods in Wallonia: Recent temporal trends, spatial distribution and reconstruction of the hydrosedimentological fluxes using flood marks and sediment deposits, Belgeo, 1, 1–26, https://doi.org/10.4000/belgeo.16409, 2015.
Van Delden, A.: The synoptic setting of thunderstorms in Western Europe, Atmos. Res., 56, 89–110, https://doi.org/10.1016/S0169-8095(00)00092-2, 2001.
Vogel, K., Ozturk, U., Riemer, A., Laudan, J., Sieg, T., Wendi, D., and Agarwal, A.: Die Sturzflut von Braunsbach am 29. Mai 2016 – Entstehung, Ablauf und Schäden eines “Jahrhundertereignisses”, Teil 2: Geomorphologische Prozesse und Schadensanalyse, Hydrol. und Wasserbewirtschaftung, 61, 163–175, https://doi.org/10.5675/HyWa, 2017.
Weigl, E. and Winterrath, T.: Radargestütze Niederschlagsanalyse und vorhersage (RADOLAN, RADVOR-OP), Promet, 35, 76–86, 2009.
Weigl, E., Reich, T., Lang, P., Wagner, A., Kohler, O., Gerlach, N., and Bartels, H.: Routineverfahren zur Online-Aneichung der Radarniederschlagsdaten mithilfe von automatischen Bodenniederschlagsstationen (Ombrometer), German Weather Service: Hydrometeorology department, Offenbach am Main, https://www.dwd.de/DE/leistungen/radolan/radolan_info/abschlussbericht_pdf.pdf?_blob=publicationFile&v=2 (last access: 18 November 2022), 2004.
Westermayer, A. T., Groenemeijer, P., Pistotnik, G., Sausen, R., and Faust, E.: Identification of favorable environments for thunderstorms in reanalysis data, Meteorol. Z., 26, 59–70, https://doi.org/10.1127/metz/2016/0754, 2017.
Whiteman, C. D.: Mountain Meteorology – Fundamentals and Applications, Oxford University Press, ISBN 9780195132717, 2000.
Wilson, J. W. and Brandes, E. A.: Radar Measurement of Rainfall – A Summary, Am. Meteorol. Soc., 60, 1048–1058, 1979.
Winterrath, T., Brendel, C., Hafer, M., Junghänel, T., Klameth, A., Walawender, E., Weigl, E., and Becker, A.: Erstellung einer radargestützten Niederschlagsklimatologie, Reports of the German Weather Service, No. 251, Offenbach am Main, ISBN 978-3-88148-499-2, 2017.
Winterrath, T., Brendel, C., Hafer, M., Junghänel, T., Klameth, A., Lengfeld, K., Walawender, E., Weigl, E., and Becker, A.: RADKLIM Version 2017.002: Reprocessed quasi gauge-adjusted radar data, 5-minute precipitation sums (YW), https://doi.org/10.5676/DWD/RADKLIM_YW_V2017.002, [data set], 2018.
WMO: Flash Flood Guidance System (FFGS) with Global Coverage, World Meteorol. Organ., https://public.wmo.int/en/projects/ffgs (last access: 16 December 2021), 2017.
Wood, S. J., Jones, D. A., and Moore, R. J.: Static and dynamic calibration of radar data for hydrological use, Hydrol. Earth Syst. Sci., 4, 545–554, https://doi.org/10.5194/hess-4-545-2000, 2000.